1. Introduction
The dynamics of impacts between indenters and strata have to be modelled based on classical mechanics, supported by empirical relationships measured from experimental material properties. The dynamics of fracture have a direct influence on nonlinear resistive forces, which subsequently influence a system’s qualitative responses.
Transient impacts can also be modelled in different ways, as shown by Gad [
1]. They can also excite the natural frequencies of the systems, as demonstrated by Mokhtar et al. [
2]. Migliniene et al. [
3] designed a microcantilever that operates in a vibro-impacting mode so that energy can be harvested. A shorter transient response was found to be favourable for energy generation. Depending on the nature of the system, the transient dynamics may need to be solved by the imposition of boundary conditions, which Dzyubak and Bhaskar [
4] implemented on two impacting beams. Since there is a possibility that transient impacts are a viable alternative in drilling, the variety of system dynamic responses need to be identified, examples of which were reported by George et al. [
5]. Wang and Huang [
6] analysed transient impact dynamics when there was a sudden loss of a rotor blade. When a tyre impacts a road obstacle, a finite element analysis performed by Wei and Olatunbosun [
7] identified transient responses, which were experimentally correlated. Wilcox et al. [
8] focussed on the onset of low-velocity impact before the steady state, because it is known that many systems experience large jumps in response amplitude during the transient growth of deviations.
Percussive drilling features vibro-impacts, and the modelling of rock fragmentation mechanisms of a typical rotary–percussive drilling system was attempted by many authors, including Afebu et al. [
9], for optimisation to increase the penetration rate, improve the bit life-span and save costs. Li et al. [
10] proposed a simplified model of the hammer impact drill process to study the impact stress transfer characteristics of a lunar rock coring drill. A three-dimensional model was constructed by Saksala [
11,
12] to investigate percussive drilling assisted by thermal shock. Zhabin et al. [
13] used a set of variational equations and finite difference equations to model the interaction of pistons and tools in the percussive drilling of rocks. Kim et al. [
14] used a prediction model for estimating the impact efficiency of a percussive rock drilling tool. Song et al. [
15] considered the energy transmitted from the bit to the rock in percussive drilling, and this was compared to a drop test. In particular, Song et al. [
16] conducted a finite element analysis to study energy transfer efficiency. Tian et al. [
17] focussed on high-frequency torsional vibration percussive drilling.
From an experimental point of view, Scaccabarozzi and Saggin [
18] measured and characterised the propagation of stress waves on a drill bit during percussive rock drilling. Estimation criteria for ensuring efficient rotary percussive drilling with down-the-hole hammers were proposed by Karpov and Petreev [
19]. Ding et al. [
20] investigated the effect of rotational speed and impact speed on a rotation–percussion drilling process of rock using a diamond bit by monitoring the stress wave during drilling. Liao [
21] studied the interaction of indenters and rocks based on a vibro-impact system for rotary–percussive drilling. Li et al. [
22] mentioned that percussive drilling facilitated the action of an abrasive water jet. Li et al. [
23] observed that a large number of impact fractures can be achieved. In addition, Li et al. [
24] pointed out that hammer-induced fractures were stimulated by hydraulic fracturing.
Resonance-Enhanced Drilling (RED) is a novel technology aimed at improving the penetration rate in hard rock formations for different drilling applications without compromising the wellbore stability, quality and well control management [
25]. Drilling with RED is similar in principle to conventional rotary drilling, but an additional axial oscillatory force with a controllable amplitude and frequency is also applied to the drill bit to improve rock fragmentation. An alternative configuration of a resonance-enhanced drilling apparatus was designed and built at the Centre for Applied Dynamics Research of the University of Aberdeen to investigate the system parameters that contribute to the performance improvements of RED. Liao et al. [
26] constructed a mathematical model to make a comparison with experimental results obtained from the apparatus. The parameter identification of a stiffness characteristic was related to impact duration [
27]. To model the physics of the system accurately, the mathematical model is updated and modified to reflect specific system qualitative responses, especially those observed in experiments, and this is the motivation for this work.
This paper is organised in the following manner: The experimental setup is first described in the Experimental Setup Section. A mathematical model of the experimental setup for two different impacted materials is detailed in the Experimentally Calibrated Mathematical Modelling Section. Some results on the correlation between the experiment rig and the developed mathematical model when operating the experimental setup at different excitation frequencies are presented in the Results and Discussion Section. Lastly, in the Conclusions Section, some conclusions and closing remarks are drawn.
2. Experimental Setup
This section describes, in detail, the main features of an experimental rig, which had previously been designed and manufactured. This includes its geometrical arrangements, dimensions and instrumentation, which facilitate data acquisition.
The experimental rig had been designed to induce vibro-impact loading through an indenter on either metal or sandstone samples. This is made possible by means of a pneumatic actuator, as well as an electrodynamic shaker, so as to effect a static compressive force and sinusoidal variation in electromagnetic force.
Figure 1a shows the experimental rig of the present work. The experimental rig was built to function in a way similar to a previous apparatus [
28], which was developed based on [
25] but with improved features for studying the behaviour of the indenter during its interaction with impacted material. The experimental rig was designed, manufactured and calibrated at the Centre for Applied Dynamics Research of the University of Aberdeen. The experimental rig mainly consists of two parts, namely, a piston–shaker–indenter part, which generates oscillatory motions of the indenter, and a restraint part, which holds the impacted material. Both parts are secured on the top of a metal plate and are configured to be co-axial and horizontally levelled on the plate. The experimental rig is capable of supplying a controlled axial vibration on the indenter for a wide range of pre-defined static forces, and it is described below.
In the piston–shaker–indenter part of the experimental rig, an LDS electrodynamic shaker (Model: V530) is used to actuate the indenter mounted at one end and to generate the vibratory motions of the indenter for experiments. The electrodynamic shaker is attached to a rigid external frame, which is in turn mounted on the metal plate by means of four carriages and two linear guides. This arrangement constrains the electrodynamic shaker to move in one direction, as the shaker–frame assembly is actuated by a rod connected to a piston at the other end. The piston is a part of the pneumatic cylinder, and it provides the required static force to push and pull the electrodynamic shaker towards and from the restraint part of the experimental rig, respectively, in the horizontal direction. A control valve is used to control the flow and pressure of compressed air entering the pneumatic cylinder through the air hoses, and this permits the control of the actuation direction and the forcing magnitude of the piston, respectively. To ensure linear and smooth movements of the electrodynamic shaker, the pneumatic cylinder is used with a pressure regulator and bleeding valves. A load cell is attached between the back of the indenter and the shaker armature. An accelerometer, which is not shown in the figure, is mounted to the armature assembly during experiments. A linear variable differential transformer (LVDT), which is also not shown in
Figure 1a, is mounted on the rigid frame of the electrodynamic shaker, and its core is attached to the restraint part of the experimental rig during experiments. The restraint part is mainly a fixture that firmly holds the metal or sandstone samples in place for experiments, and the restraint part is mounted on the same platform as the piston–shaker–indenter part.
A schematic of the experimental rig is illustrated in
Figure 1b. The axial vibration of the indenter is measured using a KISTLER accelerometer. The impact forces are measured using a KISTLER dynamic-type strain gauge load cell (Model: 4576A5). The load cell is able to measure dynamical forces of up to 5 kN. As for the measurement of the displacement of the indentation, the LVDT is used. The LVDT provides an output voltage signal ranging between 0 and 10 V, which corresponds to a displacement variation of between 0 and 50 mm. The electric signals generated by the above 3 transducers are amplified through their respective charge amplifiers, which is depicted in
Figure 1b as a cluster of charge amplifiers, before being fed to a computer system via a connection panel. The computer system, which is equipped with a National Instrument (NI) USB-625X data acquisition device, is employed to perform the simultaneous tasks of signal acquisition from the accelerometer, load cell and LVDT, as well as signal generation for the actuation of the indenter in the present work. LabVIEW is used to design a graphical user interface that has the basic functions of generating and controlling the driving signal whilst logging the responses from all the measurement devices and visualising the signals in real time. The computer system is capable of generating sinusoidal signals for various excitation frequencies used in this work, and the generated signal is fed to and amplified through an LDS power amplifier (Model: PA500) that supplies power to the electrodynamic shaker for the periodic actuation of the armature and, hence, the indenter. A pressure gauge, which is not connected to the computer system, is used to measure the pressure of the supplied compressed air.
The indenter used in this work is a cylindrical shaped metal body with a tipped head, as illustrated in
Figure 1c. It consists of two parts. The bottom part, which has a conical head with a 22° base angle, is made of heat-treated carbon steel and has a diameter of 10 mm and a length of 25 mm excluding the conical head. The top part, which has thread connections at both sides, is made of aluminium with dimensions of 25 mm in length and 15 mm in diameter, and it serves as the adapter to connect the bottom part of the indenter to the load cell via a thread connection. However, the approximate dimensions of the sandstone and metal samples are 100 mm × 100 mm × 50 mm and 100 mm × 100 mm × 5 mm, respectively. The typical time histories of the indenter acceleration when impacting the samples using the indenter at different frequencies while maintaining the pressure of the compressed air entering the pneumatic cylinder are to be illustrated and described in the
Section 5.
3. Experimentally Calibrated Mathematical Modelling
This section presents the physical system of the present work so as to relate it to system governing equations. These are derived from both the physics of the system and the empirical system parameters obtained from experimental measurements.
To understand the influence of the forcing frequency on impactor velocities and a resulting phase shift, a refinement of and update to mathematical models is necessary to achieve numerical predictions of the rate of penetration. The mechanics of vibro-impact interactions for sandstone and metal need to be accurately modelled so as to seek experimental validation. Its effectiveness may be discussed from the point of view of energy, especially the energy used to achieve damage per cycle. In this way, the optimal and practical ranges of forcing frequency are identified so as to optimise the force patterns transmitted to impacted media.
Figure 2 presents the physical model used in the present work, which is based on the work presented in [
28]. There are two separate systems for two different sample types, namely, a metal sample, as shown in
Figure 2a, and a sandstone sample, as shown in
Figure 2b. The difference is in the physical sub-system describing the mechanical characteristics of the sample. In the case of a metal sample, when the indenter comes into contact with it, the linear stiffness and damping characteristics of the metal contribute to piecewise linear resistive forces, which only act when there is contact. This assumption of linear mechanical characteristics is valid for the ranges of force values affected by the indenter on the sample. In the case of a sandstone sample, discontinuous phases during progression into the sample are defined by three corresponding discontinuous functions. These are related to the cases of no contact, contact when the sample is loaded and contact when the sample is unloaded. In the latter two cases, the resistive forces are modelled by linear stiffnesses and damping, which also form the main assumption of sample mechanical characteristics. In addition, the progression of the indenter into the sandstone is also tracked and updated.
A mathematical model is constructed to describe the discontinuous nature of the impacting force. The mathematical functions for this are different for sandstone and metal. Moreover, in the case of sandstone, the initial position of the indenter in the loading phase and that in the ending position in the unloading phase need to be modelled separately. In addition, the depth of penetration in the sandstone sample itself needs to be mathematically expressed as a separate function. The mathematical model is below.
Equation (1) describes the dynamics of the armature mass and is given as follows:
where
is the mass of the armature;
is its displacement;
is the displacement of the armature mass with respect to the displacement of the electrodynamic shaker body;
and
are the stiffness and damping between the armature and electrodynamic shaker body, respectively; and
is the excitation force, which is modelled by the sinusoidal function of Equation (2):
where
and
are the amplitude and frequency of the excitation force, respectively.
Equation (3) describes the motion of the electrodynamic shaker body, which is affected by the electromagnetic force
:
where
is its mass,
is its displacement, and
is the displacement of the electrodynamic shaker body with respect to the displacement of the pneumatic cylinder piston-head.
and
are the equivalent stiffness and damping of air inside the pneumatic cylinder, respectively.
Equation (4) is an expression of the translational motion pertaining to the mass of the pneumatic cylinder piston-head. The force arising from pneumatic pressure is denoted by
, and a frictional force dependent on the direction of the velocity of the electrodynamic shaker body has an amplitude of
.
where
is its mass, and
is its displacement. The pneumatic force,
, can be related to the pressure of the supplied air in the pneumatic cylinder in bar,
, using the following equation:
where
is the diameter of the piston-head. In addition, the equivalent damping of air inside the pneumatic cylinder is a function of both the excitation force and frequency, and it can be expressed as
For the specific case of a metal sample, the resistive force,
, from the penetrated medium, which is equal in magnitude but opposite in direction to the force transmitted to the medium, is expressed as a discontinuous function in Equation (7):
where
is the gap between the indenter and the restraint, and
and
are the equivalent stiffness and damping between the armature and the metal sample upon penetration. The two conditions in Equation (7) dictate
when the indenter is not in contact and is in contact with the metal sample. However, for the specific case of a sandstone sample, the resistive force from the penetrated medium is discontinuous for three sets of conditions:
where
is the sandstone stiffness when it undergoes loading,
,
, and
is a different value of stiffness during unloading, and it was experimentally determined via quasi-static indentation tests in [
26] that the stiffness value is greater during unloading than loading for sandstone samples. When the indenter is not in contact with the sandstone sample (i.e., the first condition),
is 0 N. When the indenter is in contact with the sandstone sample and it is in the loading phase, it meets the second condition, and the corresponding expression is used to calculate
. Similarly, the expression corresponding to the third condition is used for the calculation when the indenter is in contact with the sandstone sample and it is in the unloading phase. The difference in the stiffness value between the loading and unloading phases contributes mathematically to the progression of the indenter in the sandstone sample, and the initial position of the indenter in the loading phase and the ending position of the indenter in the unloading phase, being
and
, respectively, change with the progression as a result. To calculate
and
, Equations (9) and (10) are considered.
where
and
are the loading and unloading exponents, respectively. Equation (9) is used to calculate during the loading phase when
remains unchanged until the indenter reaches a maximum depth in the sandstone sample. However, the next
is calculated using Equation (10) during the unloading phase when
remains unchanged until the indenter is fully unloaded from the sandstone sample.
Particular to a sandstone sample, the mathematical relationship between the depth of penetration,
, and the armature mass displacement is shown in Equation (11):
4. Methods and Programme
In this work, we apply a combination of experimental studies and numerical simulations to probe the nonlinear dynamic interactions occurring in this vibro-impact system. Specifically, we analyse the dynamic responses by considering the time histories and their frequency spectra for two contrasting scenarios by using metal and sandstone samples to confront elastic with non-elastic impact.
Experimental studies are carried out with the experimental rig to investigate the impact behaviour of the indenter in the metal and sandstone samples at various excitation frequencies and to establish a correlation between the experimental rig and the mathematical model detailed in the previous section. The computer system described in the Experimental Setup Section is used to facilitate the parametric study, where the information from the accelerometer mounted to the armature assembly is acquired and used for the analysis of the dynamic behaviour of the indenter. For the frequency of the sinusoidal signals, a set of frequencies ranging from 30 Hz to 100 Hz at intervals of 10 Hz are chosen for the study. As for the magnitude of the force exerted on the armature assembly, this can be varied by manipulating the magnitude of the input voltage fed to the power amplifier. For the purpose of this study, the input voltage is carefully selected in such a way that the indenter would oscillate with a displacement amplitude of approximately 0.5 mm prior to the impact test for all the selected frequencies. The input excitation frequencies and their corresponding input voltages are tabulated in
Table 1. The resulting forcing magnitude experienced by the armature assembly at different excitation frequencies is calibrated using a simplified model of the electrodynamic shaker by eliminating the terms related to the motion of the electrodynamic shaker and piston-head, and they are also tabulated in
Table 1. As for the pressure of the compressed air entering the pneumatic cylinder, it is maintained at 1 bar throughout the studies.
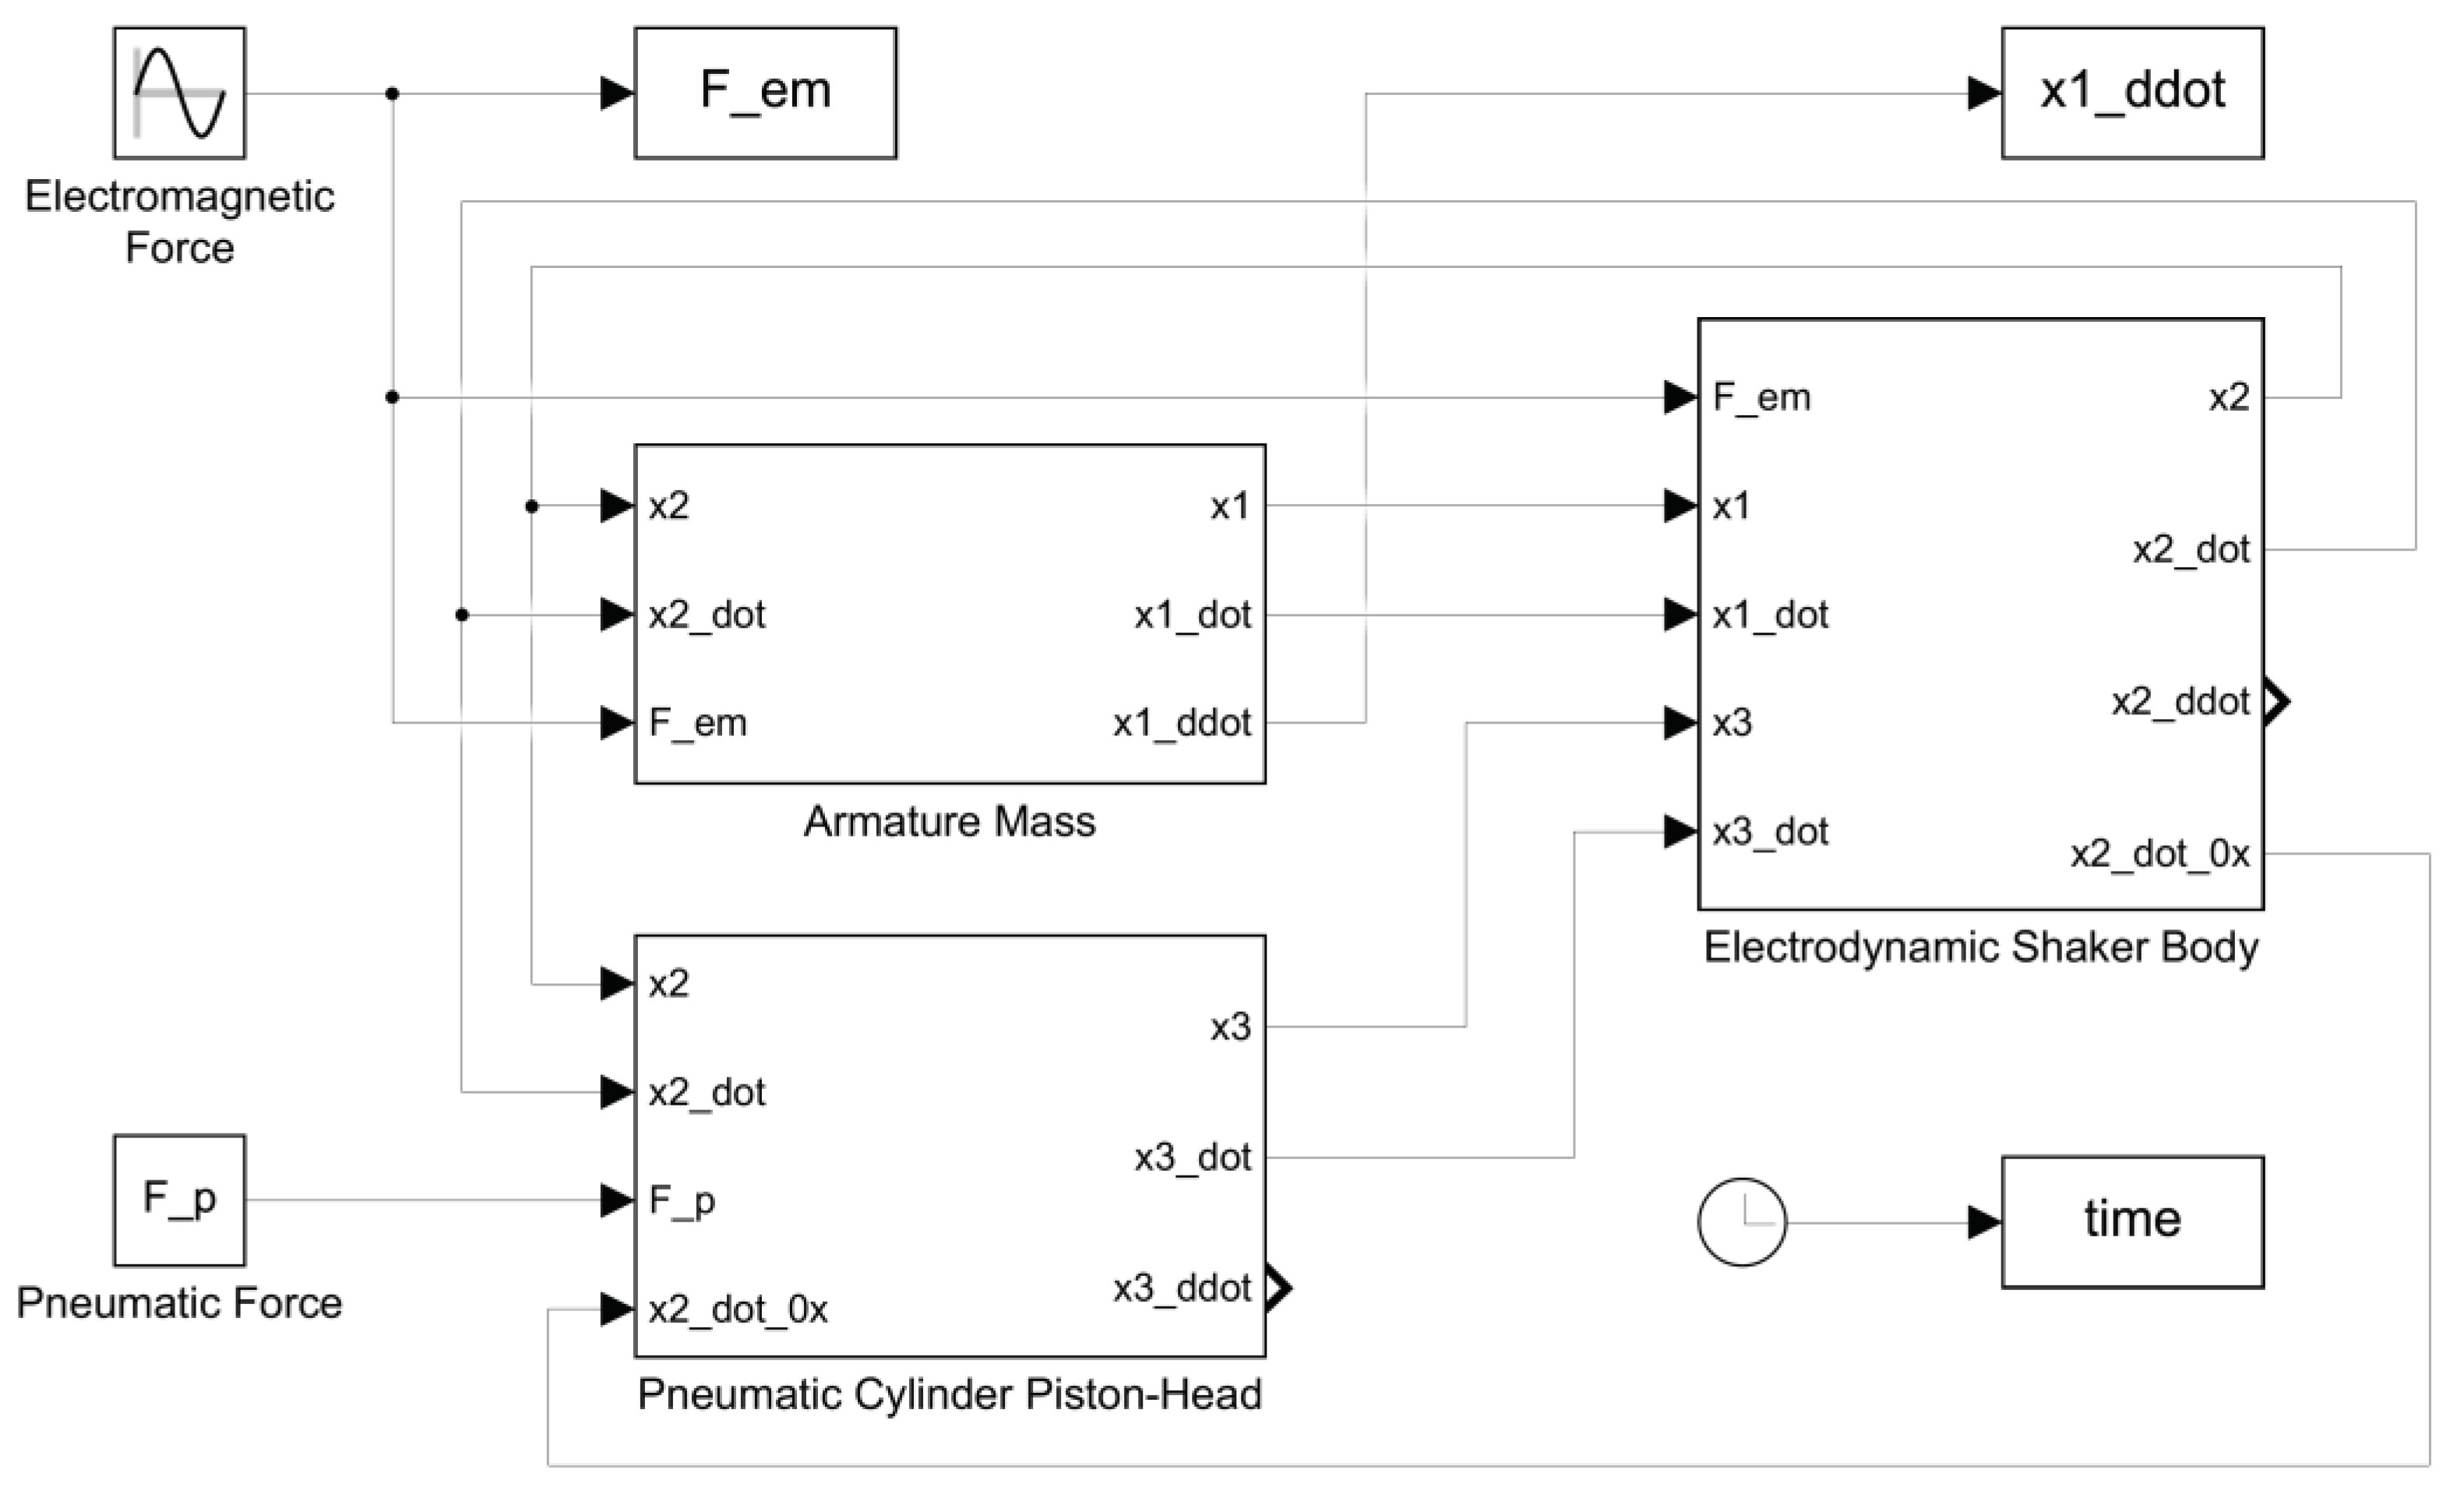
A numerical study is carried out based on the mathematical model developed in the previous session. A Simulink model, as shown in
Appendix A, is constructed to numerically integrate the equations for both cases of the metal sample and the sandstone sample to scrutinise the time histories of the experimental setup. The 8 pairs of forcing magnitude and frequency tabulated in
Table 1 are used for simulating the response of the experimental setup at different excitation frequencies. Moreover, a gap of 1 mm is set to be the buffering distance between the indenter and the sample. The system parameters are identified by referring to the handbook and technical data sheet of the equipment and by carrying out experimental measurements.
5. Results and Discussion
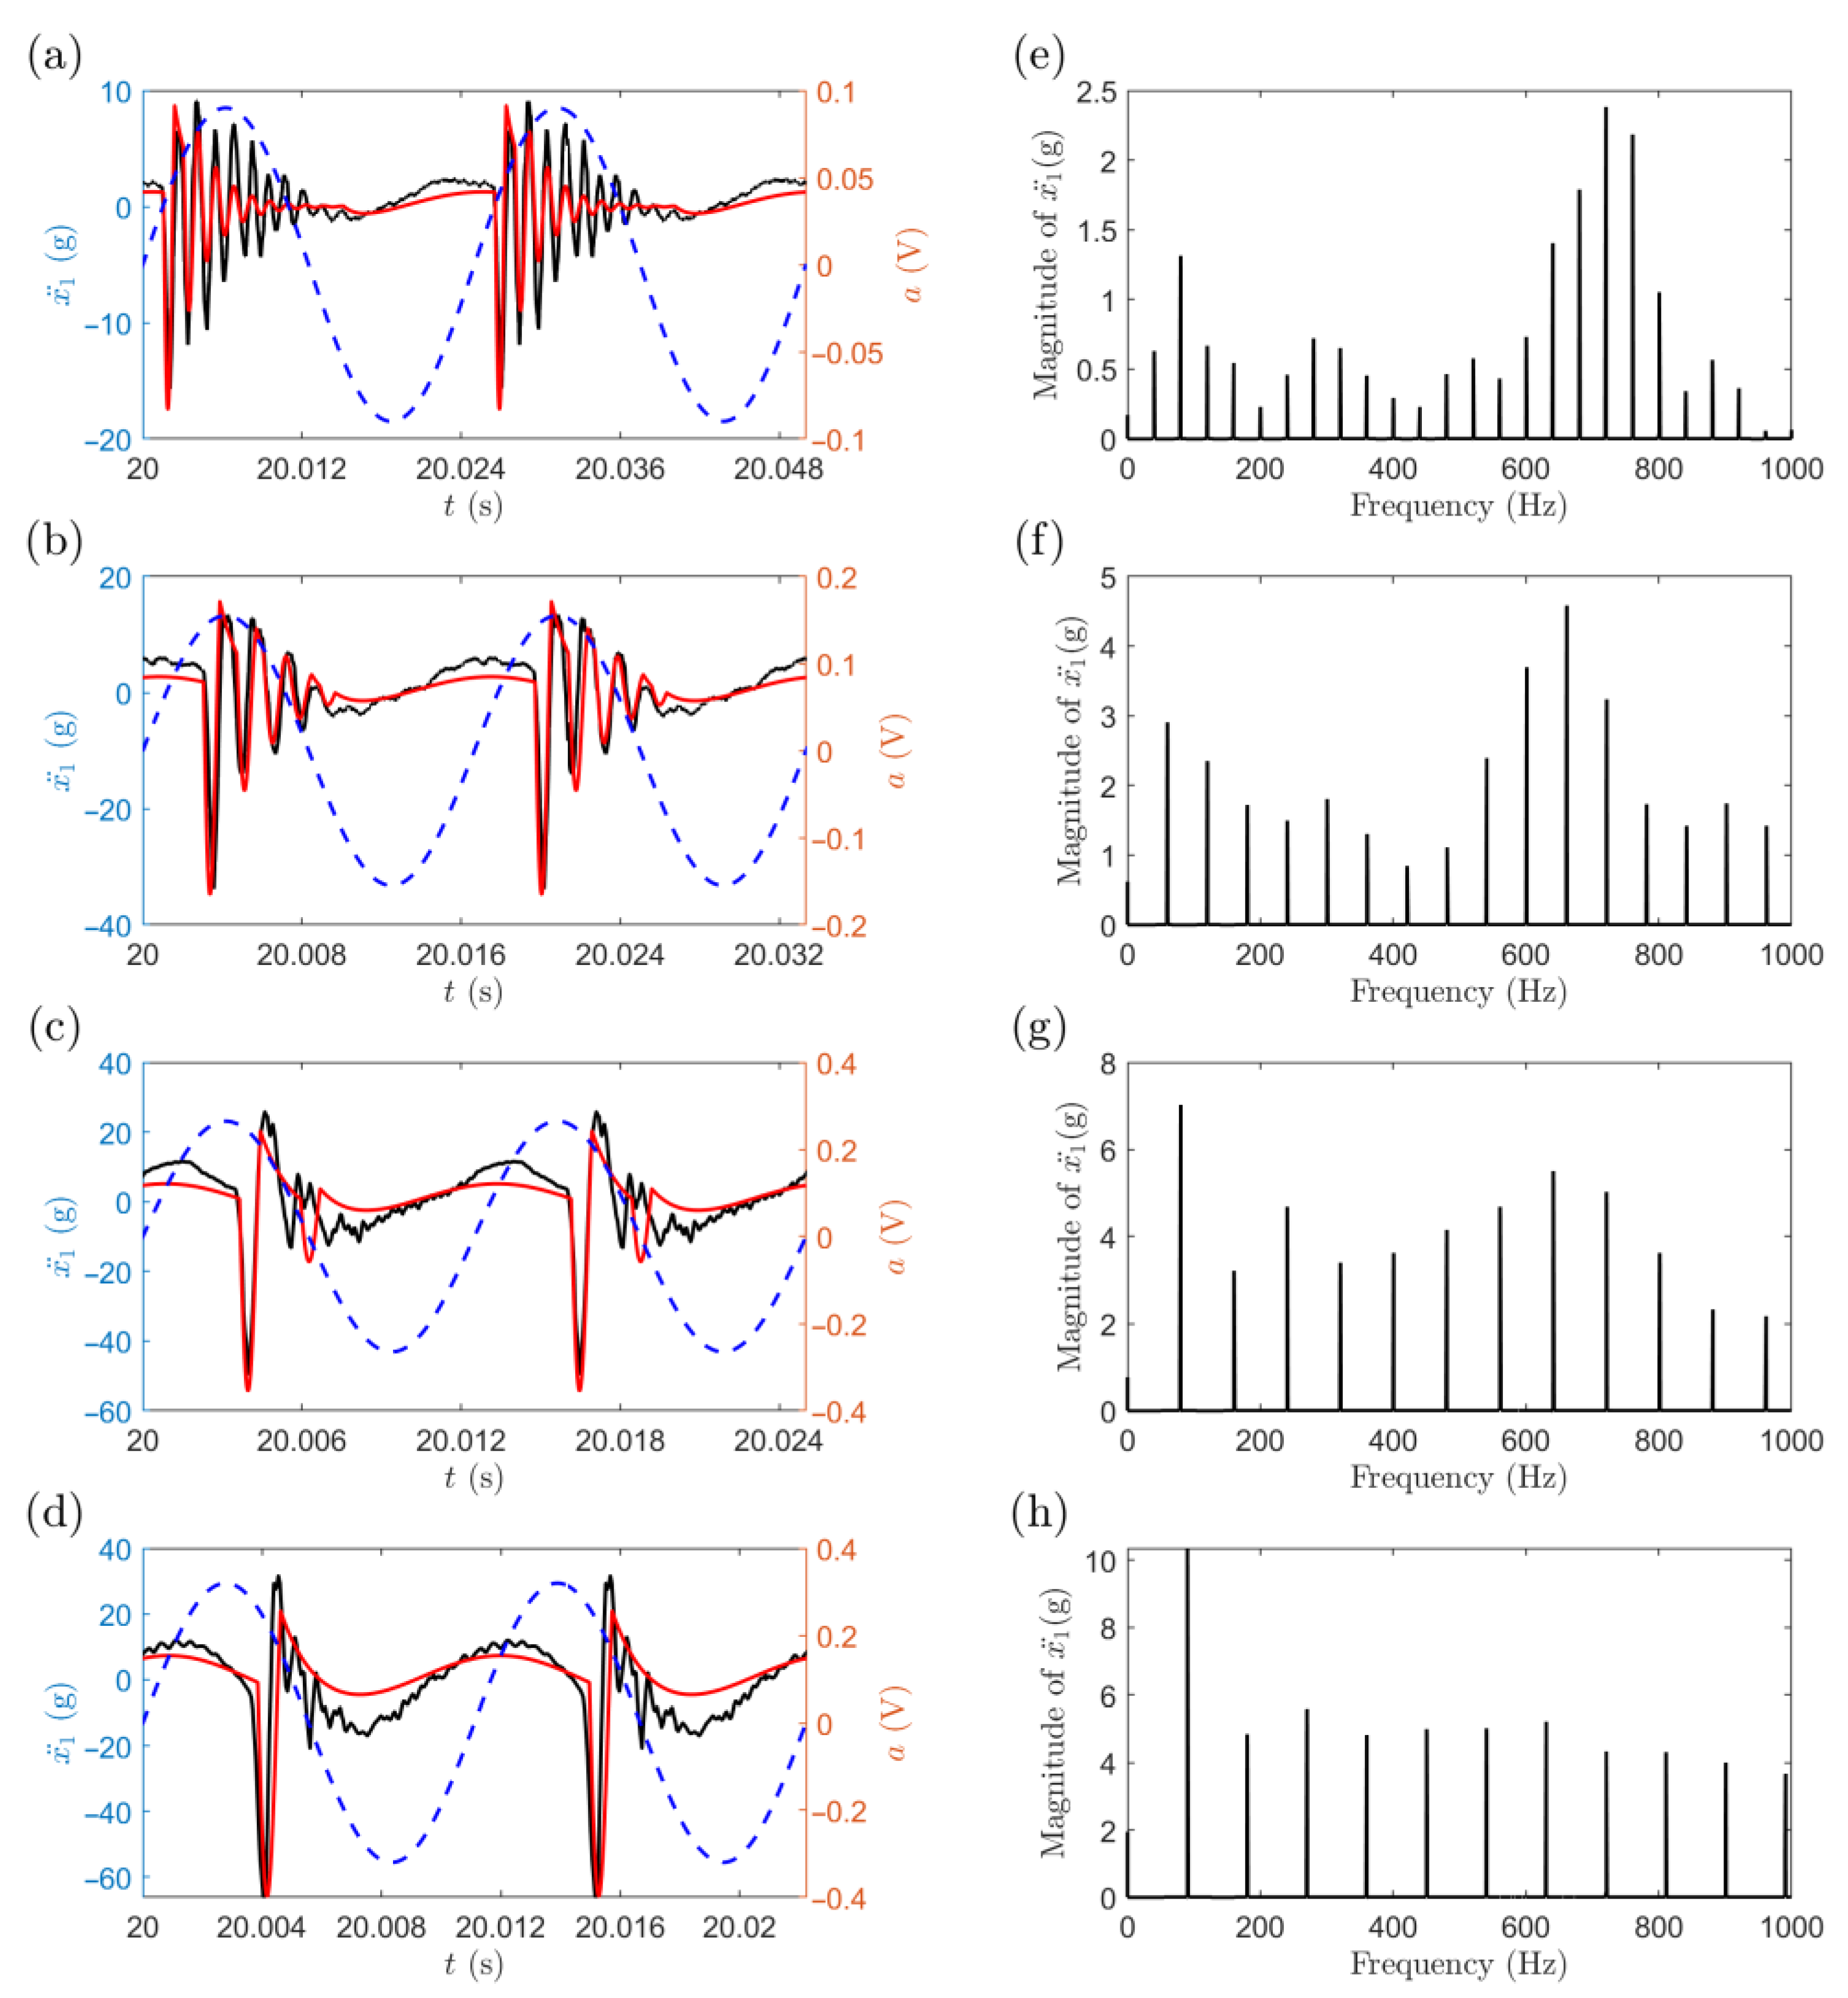
For the case of the metal sample, the experimental and numerical time histories of the acceleration of the indenter for the excitation frequencies of 40 Hz, 60 Hz, 80 Hz and 90 Hz are presented as black and red solid lines in the left column in
Figure 3, respectively. A total duration of two consecutive cycles is displayed in the time histories for all the four excitation frequencies. The moments at which impacts occur between the indenter and the sample are observed by noting the sharp decelerations in the time histories. It can be seen in
Figure 3 that, when the excitation frequency is 40 Hz, the oscillations are of period-1, and the rig appears to indent the metal sample multiple times, as it is forced towards the metal sample with more than five impacts per forcing cycle and a maximum deceleration of approximately 15.7 g at the first impact followed by a decreasing deceleration in subsequent impacts. As the excitation frequency increases, the oscillations of the indenter are still of period-1. The magnitude of the deceleration increases to 33.8 g at 60 Hz, 49.3 g at 80 Hz and 65.8 g at 90 Hz. Moreover, the first impact tends to occur at a later phase of the increasing input excitation voltage in each forcing cycle as the excitation frequency increases. This is accompanied by a lower number of impacts per forcing cycle, where the numbers are 5, 2 and 1 at 60 Hz, 80 Hz and 90 Hz, respectively. Furthermore, by comparing the acceleration time histories and their corresponding numerical results, it can be noted that there is a qualitative match between them, especially in the cases where a higher excitation amplitude and frequency are applied. The maximum deceleration at the first impact and the number of impacts per forcing cycle are both qualitatively and quantitatively similar in general. The overall dynamical behaviour of the indenter observed experimentally is still predicted numerically, although the deceleration magnitudes of the subsequent impacts are slightly different from those of the predicted responses. The difference between the experimental and numerical acceleration time histories may be attributed to some of the characteristics of the experimental dynamical behaviour that are not yet accounted for in the numerical model and the influence of the electrical circuit inside the electrodynamic shaker that is assumed to be negligible.
The Fast Fourier Transform (FFT) spectra of the acceleration time histories are presented as black solid lines in the right column in
Figure 3 for the range from 0 to 1000 Hz. It can be observed in the frequency spectra that, due to the impact nature of the motion, the fundamental frequency, which is also the excitation frequency, appears along with its harmonics at higher frequencies in the spectra. However, the distribution of the magnitudes in the frequency spectrum is different for all four excitation frequencies. For example, it can be seen in
Figure 3e that, when the excitation frequency is 40 Hz, the peak value does not occur at the fundamental frequency, while the harmonics of the acceleration response have four major peaks in the vicinity of 80 Hz, 280 Hz, 520 Hz and 720 Hz, with the highest harmonic peak being at 720 Hz followed by the first peak at 80 Hz, with their ratio being 1.81 to 1. This ratio decreases with the increasing excitation frequency, and when the excitation frequency is 90 Hz, the highest peak value occurs at the fundamental frequency. The harmonic peaks, though less apparent, occur at 270 Hz and 630 Hz, and the ratio of the highest harmonic peak to the first peak is 0.51 to 1 in this case. The differences in the distribution of the magnitudes among the frequency spectra can be related to the oscillation of the indenter in the metal sample, and this indicates the reducing influence of the metal sample on the dynamic behaviour of the indenter as the excitation frequency increases.
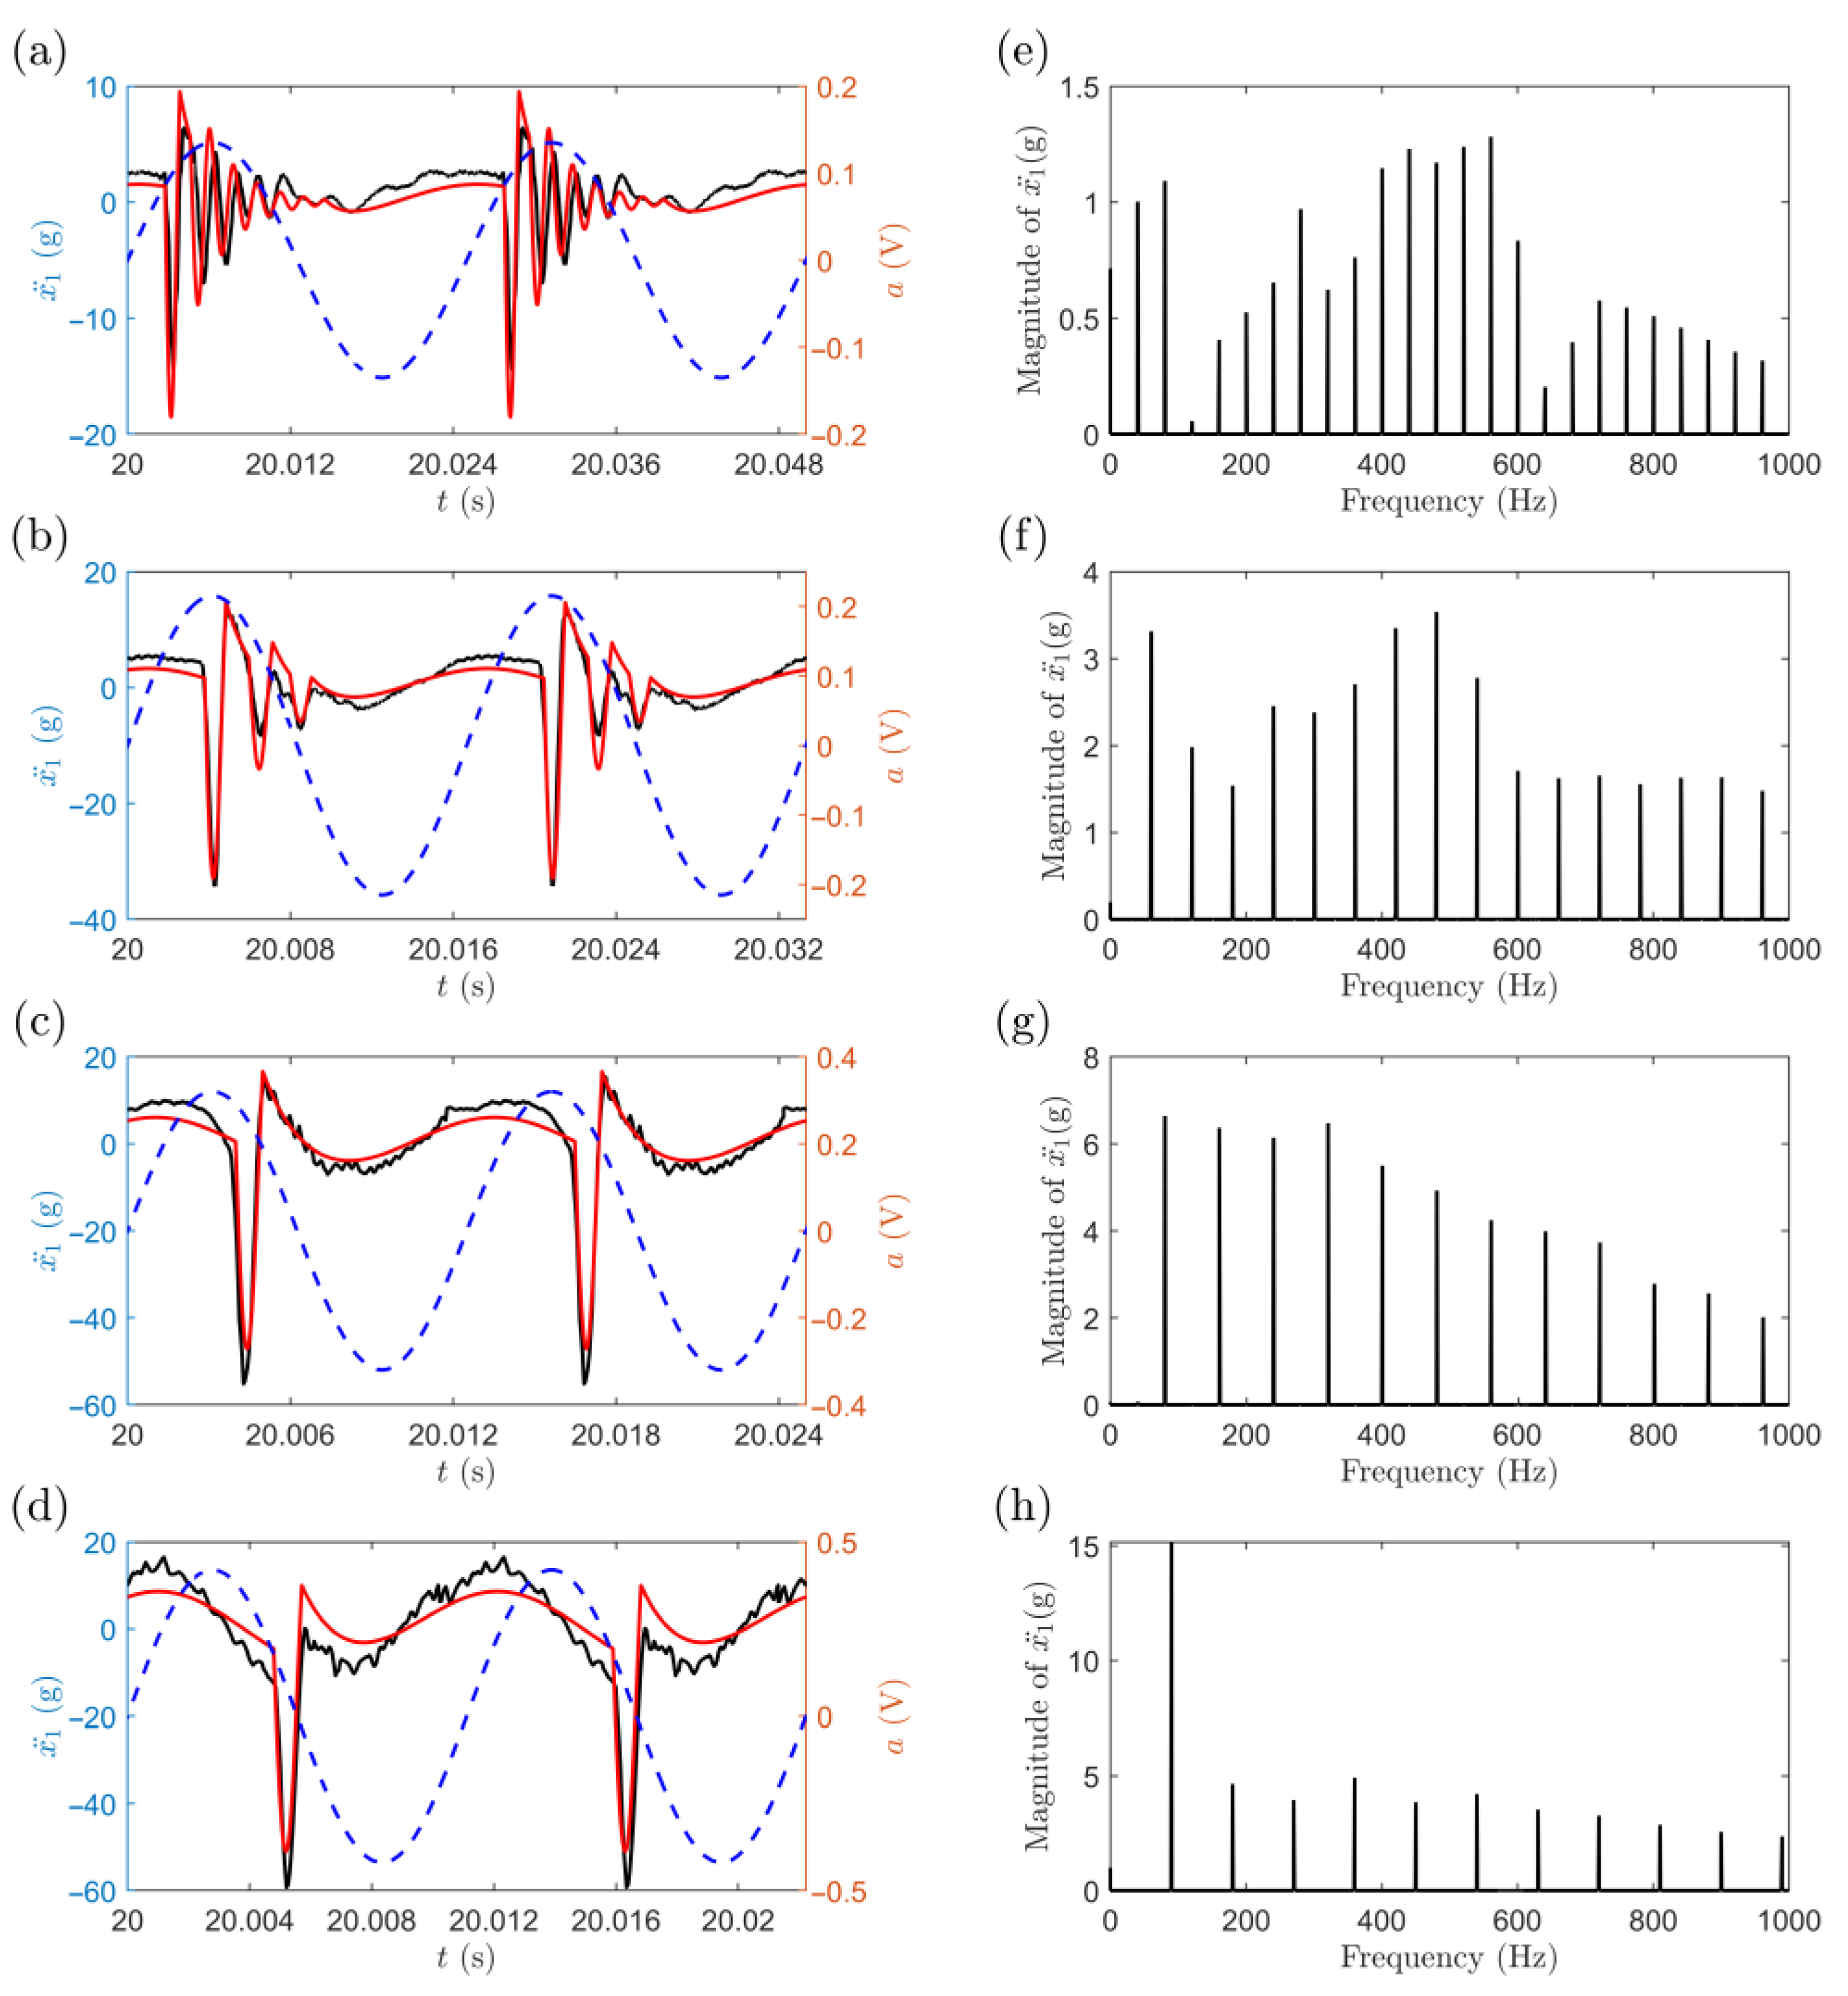
As for the case of the sandstone sample, the experimental and numerical time histories of the acceleration of the indenter for excitation frequencies of 40 Hz, 60 Hz, 80 Hz and 90 Hz are illustrated as black and red solid lines, respectively, in the left column in
Figure 4. Similar to the case of a metal sample, a total duration of two consecutive cycles is displayed in the time histories for all four excitation frequencies. Period-1 oscillations of the indenter are observed in the illustrated acceleration time histories. When the excitation frequency is 40 Hz, the indenter penetrates the sandstone sample during positive input excitation amplitude, with more than five impacts per forcing cycle and a maximum deceleration magnitude of about 14.5 g. The first impact occurs when the amplitude of the input voltage is at its increasing stage. As the excitation frequency increases, the magnitude of the deceleration increases to 34.3 g at 60 Hz, 55.2 g at 80 Hz and 59.2 g at 90 Hz. Additionally, the first impact occurs at a later stage of the increasing input excitation voltage with a lesser number of impacts per forcing cycle; the number of impacts reduces to 3, 1 and 1 impact per forcing cycle at 60 Hz, 80 Hz and 90 Hz, respectively.
However, it can be seen by comparing the experimental indenter acceleration time histories to its numerical counterpart that there is a qualitative agreement between them. Quantitatively, the number of impacts per forcing cycle for both the experimental and numerical results are comparable. However, there is an apparent discrepancy in terms of the maximum deceleration at the first impact, where the predicted magnitude tends to be higher than its experimental counterpart at lower excitation frequencies and lower than its experimental counterpart at higher excitation frequencies. Nonetheless, the qualitative behaviour of the indenter observed experimentally is still preserved in the numerical predictions overall. The difference between the experimental and numerical acceleration time histories may be attributed to the stiffness parameters of the sandstone sample, where the measurements are performed in a quasi-static manner, not to mention the contribution from the attributions listed previously for its metal counterpart.
By comparing the acceleration time histories of the indenter for both the metal and sandstone cases, it can be noted that, as the experimental setup is operated at the same pneumatic pressure, the oscillations of the indenter are of period-1 for all the tested excitation parameters. The magnitude of the maximum deceleration increases with the increasing excitation frequency, and the magnitudes of the maximum deceleration for both the metal and sandstone cases are comparable. In addition, the first impact between the indenter and the impacted material occurs at a later stage of the increasing excitation amplitude as the excitation frequency increases. The number of impacts per forcing cycle decreases with the increasing excitation frequency for both cases, although the number of impacts in the metal sample case is observed to be greater than that in the sandstone sample case at lower excitation frequencies. The observed differences are caused by the difference in the properties of the impacted materials, where the indenter progresses further into the sandstone sample as impact occurs.
Figure 4e–h depict the FFT spectra of the acceleration time histories in
Figure 4a–d, respectively. It can be observed that, like its metal sample counterpart, the indenter responds with the fundamental frequency along with its harmonics at higher frequencies in the spectra as a result of the sinusoidal excitations, and the distribution of the magnitudes in the frequency spectrum is not the same for all four excitation frequencies. For example, when the excitation frequency is 40 Hz, the peak value occurs at one of its high-frequency harmonics, and the harmonics of the acceleration response have five major peaks in the vicinity of 80 Hz, 280 Hz, 440 Hz, 560 Hz and 720 Hz, with the highest harmonic peak being at 560 Hz followed by the first peak at 80 Hz, with their ratio being 1.17 to 1. As the indentation of the sandstone sample happens at 90 Hz, the magnitude of the fundamental frequency is the highest, and it is at least 3 times higher than its harmonics. The highest harmonic peak is observed to be at 360 Hz, and the ratio of the magnitude of that peak to the first peak decreases to 0.32 to 1.
Overall, the observed transitions in the distribution of the magnitudes across the frequency spectra are similar to those of the metal sample, where the interaction between the indenter and the impacted sandstone sample may have also contributed to the higher frequency components of the indenter response shown in the right column in
Figure 4. However, the highest harmonic where a major peak is observed tends to occur at lower frequencies for the case of the sandstone sample. This is related to the difference in the properties of the impacted materials, as the indenter progresses further into the sandstone sample as impact occurs.
The above results provide an insight into the dynamic behaviour of the apparatus, especially its armature assembly, describing the percussive drilling of a metal sample and a sandstone sample at different excitation frequencies. It can be concluded that, for both the metal and sandstone samples, the magnitudes of deceleration when the first impact occurs are similar, and that magnitudes increase with the increasing excitation frequency. Additionally, the first impact occurs at a later stage of the increasing input excitation with the increasing excitation frequency, and multiple impacts per forcing cycle tend to occur less frequently at higher excitation frequencies for both sample types. Furthermore, the comparison between the measured and predicted results illustrates a good correlation between the experimental setup and its numerical model. This allows for further numerical analyses on the dynamic behaviour of the apparatus, for example, for the scrutinisation of phase relationships and phase portraits. The analysis contributes to the development of a control strategy that optimises the rate of penetration.
6. Conclusions
In this work, we investigated the dynamics of a vibro-impact system, where an indenter interacted with metal or rock samples, experimentally and via mathematical modelling. Details of the experimental rig and the development of the mathematical models are given. However, the main contribution of this work is a systematic analysis of the dynamic responses for elastic and inelastic contacts with metal and rocks samples, respectively.
Specifically, in the tests involving the metal samples, a good degree of correlation between the experiments and modelling was achieved for the excitation frequencies of 40 Hz, 60 Hz, 80 Hz and 90 Hz. In the experiments with the sandstone samples for the same excitation frequencies, an even better correlation was observed. For both cases, it was noted that the first impact tended to occur at a later phase of the increasing input excitation voltage in each forcing cycle as the excitation frequency increased.


