Abstract
Nowadays, a wide range of non-traditional gluten-free products can be purchased. Although consumers identify all these as being similar, their nutritional composition can differ depending on the raw materials used and the production process itself. The aim of the current study was to evaluate the nutritional quality of ten commercially available flours made from rice, pea, chickpea, soybean and hemp. The proximate composition (moisture, fat, fiber, protein, starch and carbohydrates), the mineral composition (Na, Mg, P, K, Ca, Cr, Ni, Se, Cu, Zn, Mn, Fe, Cd, Pb), the phenolic composition (total phenols, total flavonoids, flavanones and dihydrofavonols, and total antioxidant capacity) and the fatty acid profile were analyzed. Results showed an important influence of the vegetable species but also of the brand on the flour composition. Soybean flours, followed by hemp, showed the highest phenolic content and antioxidant capacity. Hemp flour showed a low n6/n3 ratio, while pea flour contained a small amount of fat with a large amount of oleic acid and a satisfactory n6/n3 ratio.
1. Introduction
Modern consumer requirements are reflecting more and more their concern about improving their diet, health and well-being [1]. In recent years, there has been a growing interest in the potential use of different sources of protein in human nutrition. Dairy and meat products are no longer the main sources of protein in diets, with an increase in the number of plant-based protein products [2]. In this context, non-traditional flours obtained from various raw products are attracting the interest of researchers and the food industry [3]. These kinds of products are suitable for use in vegan or vegetarian diets and for consumers who are aware of the need to reduce the consumption of animal products due to their relation to climate change. In addition, these flours can be used to meet the demand for gluten-free (GF) formulations [4] owing to the requirements of the growing population suffering from celiac disease [5]. Gluten-elimination studies performed on non-celiac individuals showed that a GF diet has beneficial effects in preventing not only gluten-related disorders (GRDs) but also other disorders such as irritable bowel syndrome (IBS) and diabetes [6].
On the other hand, these flours can be used to improve the textural properties of foods and/or improve their nutritional composition. Their ability to improve the rheological behavior of doughs has led to their incorporation into wheat for baking products [7,8]. They are also being used in fortification as a tool to balance the overall nutritional profile of diets, to restore nutrients lost in food processing, and to make products more attractive to consumers [9].
As mentioned above, growing interest has been observed in the use of gluten-free cereals and pseudocereals. These grains are mainly consumed in the form of flours and seeds, which can be easily added to different preparations. Among these cereals, rice is an important source of protein for humans. Like other cereals, rice seed proteins are deficient in some essential amino acids [10], which has led to intensive work on modifying the amino acid profile of rice grain to develop varieties of high nutritional value [11]. The components such as protein, available starch, and dietary fiber may be present in varying amounts in different rice cultivars [12]. Rice flour has been incorporated into gluten-free products such as cakes [13], yellow alkaline noodles [14], bread [15], and pasta [16], among other products.
Pulses have also attracted the interest of both the food industry and consumers. Pulse flours provide high levels of good-quality protein and dietary fiber [17]. Owing to the low level of sulfur amino acids, they are considered to be proteins of less biological value than animal proteins [18]. However, they are a rich source of other amino acids, such as lysine, leucine, isoleucine and phenylalanine and therefore provide a well-balanced essential amino acid profile when combined with other grains such as wheat or rice [19]. In addition, the high starch content of pulses makes their flour highly suitable for use in bakery products [20]. Legume flours have also been used to enhance the nutritional value of gluten-free foods such as pasta, breads and snacks [21,22]. Other minor components of pulse flour include proteins, such as lectins and enzyme inhibitors, and phytic acid. Although these have previously been considered anti-nutritional due to their ability to bind micronutrients and reduce the digestibility of macronutrients, some studies also show the potential health benefits of including low levels of these compounds in one’s diet [23]. The correct ratio of anti-nutrients to nutrients can reduce the negative impact on digestibility and play a beneficial role in cellular processes, including antioxidant and anti-inflammatory activities [24]. Among the pulses, different flours have been studied, such as soy flour [25,26,27], chickpea and lentil flour [21], fava bean flour [28], carob flour [29], green and yellow pea flour [2] and flour of the Prosopis species [30], among others.
Other non-traditional seeds have been processed into flour, and their viability for incorporation into different products has been studied. Hemp is the non-pharmacological variety of Cannabis sativa subsp. sativa, the cultivation of which is legal in several countries [31]. Hemp seeds contain a high proportion of protein (20–25%) and a high fat content (25–35%), comprising mainly polyunsaturated fatty acids (PUFAs), and also interesting amounts of fiber and minerals [32]. Their flour has been used for the production of gluten-free bread [33] and bakery by-products [34]. Amaranth flour for the production of gluten-free breads and biscuits [35], quinoa flour for the production of dairy yogurt [36] or muffins [37] and sorghum flour for the preparation of pasta [38] and flatbread [39] have also been studied.
Plant-based foods are a growing trend among consumers, which has led to these flours quickly becoming popular [40]. At present, a wide range of these products can be purchased in supermarkets or online. Although consumers identify all these flours as similar products, their nutritional composition can be very different depending on the raw materials used and the production process itself. The aim of the current study was to evaluate the nutritional quality of ten commercially available flours made from rice, pea, chickpea, soybean and hemp in relation to current nutritional guidelines and dietary requirements.
2. Materials and Methods
2.1. Materials
Commercial flours from chickpea (Cicer arietinum), soybean (Glycina maxima), pea (Pisum sativum), hemp (Cannabis sativa) and rice (Oryza sativa) were purchased in local markets (Zamora, Spain) and by electronic commerce, each being of one type from two different food companies.
2.2. Proximate Composition of Flour
The samples were analyzed for nutritional composition (protein, fat, carbohydrates and starch) by using the AOAC procedures [41]. The crude protein content of the samples (N × 6.25) was estimated by the macro-Kjeldahl method; crude fat was determined using a Soxhlet apparatus by extracting a known weight of the sample with petroleum ether.
The moisture content of the flours was determined by using the AACC method 14–15 A [42]. Ash content was determined by incineration at 550 ± 10 °C using the AACC method 08-01.01 [43]. The total fiber was determined according to the AOAC Method 991.43 [44] by using the ANKOM dietary fiber analyzer (ANKOM technology, New York, NY, USA). Total carbohydrates were calculated by their difference, and the % energy provided was calculated considering that protein and carbohydrate provide 4 kcal/g and that fat provides of 9 kcal/g. All the determinations were performed in triplicate.
2.3. Mineral Analysis
Element concentrations were determined by ICP-MS (Na, Mg, P, K, Ca, Mn, Fe, Ni, Cu, Zn, Se, Cr, Cd and Pb). Amounts of approximately 0.2 g samples were placed in Teflon vessels with HNO3 and a Milestone digestion microwave system was used. Concentrations were determined using an Agilent 7800 ICP mass spectrometer (Agilent, Santa Clara, CA, USA) with the following operating conditions: Rf. Power 1550 W, Plasma Ar flow 15 L/min, Auxiliary Air flow 0.9 L/min, Nebulizer Air flow 0.99 L/min.
Quantification was carried out by using certified standard solutions (1 g/L) (Panreac, Castellar del Vallès, Spain) grouping the elements into two multi-elemental standards. The results were expressed as mg kg−¹ of sample.
2.4. Fatty Acid Analysis
The extraction of lipids from 10 g of the flours was performed using a soxhlet extractor (Soxtherm Gerhardt Variostat; Soxtherm V7.5, Wiesbaden, Germany) using petroleum ether. The fatty acids were analyzed after methylation with methanolic KOH by gas chromatography using the method described by Lurueña et al. [45]. Two to five microliters of the sample were injected into the equipment (GC 6890 N, Agilent Technologies, Santa Clara, CA, USA) using a 100 m × 0.25 mm × 0.20 μm capillary column (SP-2560, Supelco, Inc., Bellefonte, PA, USA) equipped with a split/splitless injector and an FID detector. The fatty acids were identified according to their retention times by comparison with a mixture of commercial standards (47885-U Supelco, Sigma–Aldrich, Darmstadt, Germany). The quantification was expressed as g per 100 g of total fatty acid methyl esters. The determinations were performed in triplicate.
2.5. Determination of the Phenolic Composition and Antioxidant Capacity
2.5.1. Extraction of Flour Samples
The extracts of different flour samples were prepared as described by Betances Salcedo et al. [46]. The different flours (1 g each accurately weighed) were added to 20 mL of 70% ethanol aqueous solution. After keeping the mixture in an ultrasonic water bath for 8 min, it was centrifuged at 3000× g for 20 min at 20 °C. The supernatant was separated and then completed in a 25 mL volumetric flask with 70% ethanol. The extractions were performed in duplicate, and all the subsequent determinations were performed in triplicate.
2.5.2. Determination of the Total Phenolic Content
The total phenolic content of the extracts was measured using the Folin–Ciocalteu (FC) reagent using the method described by Millar et al. [2]. Approximately 0.5 mL of FC was added to 0.5 mL of the sample. Then, 10 mL of Na2CO3 10 H2O (7.5%) was added, and the solution was mixed thoroughly. The volume of the mixture was made up to 25 mL with distilled water. The total phenolic content of the sample extract was determined at a 750 nm wavelength in a spectrophotometer (Shimadzu UV 1280, Shimadzu, Kyoto, Japan). The results are expressed as mg gallic acid equivalent (GAE)/100g of fresh weight. The calibration equation used was y = 0.232x − 0.019; r2 = 0.996.
2.5.3. Determination of the Total Flavonoid Content
The total flavonoid content (flavones and flavonols) of the sample extracts was determined using the colorimetric method based on the formation of the aluminum chloride complex as described by Valencia et al. [47], with slight modifications. Five hundred microliters (0.5 mL) of 5% AlCl3 was added to 2 mL of sample extracts and brought up to 25 mL with 96% ethanol. The mixture was kept for 30 min in the dark at room temperature. The absorbance was measured at 425 nm using a spectrophotometer (Shimadzu UV 1280, Shimadzu, Kyoto, Japan. The results are expressed as milligrams of rutin per 100 gram of sample. The calibration equation used was y = 2.839x − 0.004; r2 = 0.997
2.5.4. Total Flavanone and Dihydroflavonol Content Determination
The content of flavanones and dihydroflavonols was determined spectrophotometrically, according to the method described by Popova et al. [48], with slight modifications. An aliquot (1 mL) of the flour extract and 2 mL of the DNP (2.4 dinitrophenylhydrazine) solution was heated to 50 °C for 50 min. After cooling to room temperature, 10% potassium hydroxide (KOH) in methanol (w/v) was added to the solution up to 10 mL. The absorbance at 486 nm of 1 mL of the resulting solution was measured using a spectrophotometer ((Shimadzu UV 1280, Shimadzu, Kyoto, Japan). The presence of pinocembrin has been described in the literature in rice and chickpea, so the authors decided to use it as a standard and to express the results as mg of pinocembrin/100 g of the flour sample extract The calibration equation used was y = 1.340x − 0.015; r2 = 0.993.
2.5.5. Determination of the Total Antioxidant Capacity
The total equivalent antioxidant capacity (TEAC) was determined by the ABTS (2,2-azinobis (3-ethylenebenzothiazoline-6-sulfonic acid)) method according to the method described by Chen et al. [49] using the vitamin E analogue Trolox (6-hydroxy-2,5,7,8-tetramethylchorman-2-carboxylic acid) as a standard. An appropriate amount of the sample (20 μL) was added to the ABTS reagent, and the mixture was incubated at 25 °C. Absorbance was recorded every minute for 10 min using a Shimadzu spectrophotometer (Shimadzu UV 1280, Shimadzu, Kyoto, Japan). Appropriate solvent blanks were run in each assay. The percentage of inhibition of absorbance at 734 nm was calculated and plotted as a function of the concentration of Trolox to give the total equivalent antioxidant capacity (TEAC). The determinations were performed in triplicate and calculated from the calibration curve determined by linear regression (r2: 0.9852): Trolox eq = (% decrease in Abs + 2.107)/1.1815.
2.6. Statistical Analysis
ANOVA and LSD Fisher Tests were used to identify significant differences between groups using the SPSS Package 25 (IBM, Chicago, IL, USA).
Unsupervised pattern recognition analysis through principal component analysis (PCA) was applied to group the samples. The data for PCA modeling were the analyzed physicochemical parameters, which showed values >0 in all the samples. These data were normalized, scaled, and mean-centered. Subsequently, the original variables were linearly transformed into a new set of variables (principal components PCs) which retain the information of the original set. The number of PCs for classifying purposes was determined by selecting those with an eigenvalue of >1. The calculations were performed using the SPSS Package 25 (IBM, Chicago, IL, USA).
3. Results and Discussion
3.1. Proximate Composition
The nutritional composition of the different flours analyzed can be seen in Table 1. The moisture content varied between 6.0% and 9.9%, with chickpea and pea flours having the highest moisture contents. There is a large variability in the moisture contents of these types of flours described in the bibliography, ranging from 0.2% described for hemp flour [50] to 10.11% described for pea flour [51]. The lowest protein content was found in rice flours (7.2%), while the highest was found in soybean flours (41.5%). In relation to fat content, soybean flours (23.0%) and hemp flours (11.5%) showed the highest concentrations, while the lowest concentrations were obtained in rice flours (0.6%). All the flours analyzed showed high amounts of carbohydrates (CHO) (>31.8%), with starch being the most important carbohydrate in the rice flour samples (76.6%), followed by pea flours (48.0%) and chickpea flours (41.1%). The highest fiber contents were found in hemp (50.2%) and soybean (28.6%) flours.

Table 1.
The proximate composition (g/100 g fresh weight) of different flours. Data presented as means ± standard deviation from triplicate analysis.
Chickpea and pea flours showed high carbohydrate contents and significant starch, fiber and protein contents. Similar values for chickpea flour (24.61%) and pea flour (22.96%) have been reported for protein content [52]. Similarly, the carbohydrate content reported for chickpea flour (57.78%) and pea flour (57.94%) agrees with the results obtained in this study [52]. Rice flours were characterized by a high carbohydrate content, with a high starch content and very low fat, fiber and ash contents, matching those described by Bolarinwa et al. [53]. Soybean and hemp flours showed high protein and fiber contents with higher amounts of fat and ash than the other flours tested, while their carbohydrate and starch contents were much lower. These results agree with those obtained by Uwem et al. [54] and Alphonce et al. [55] for soybean flours and [50] for hemp flours. As far as energy is concerned, the values are similar, and non-significant differences were observed between the products analyzed except for soybean, which showed significantly higher values owing to its higher fat content.
If we compare the different commercial brands analyzed, it can be observed that in all cases there are statistically significant differences in several of the parameters analyzed, with these being particularly striking in the fat, fiber and starch contents of soybean and hemp flours.
From the nutritional composition point of view, the content of fiber and fat in these flours is of particular interest. The current recommendation as outlined by the European Food Safety Authority (EFSA) is for consumption of >25 g fiber a day to maintain normal bowel function, prevent gastrointestinal disorders, aid in weight management and reduce the risks of coronary heart diseases and type 2 diabetes [56]. The role of fiber in weight management is due to its role in adding bulk to the diet to induce satiety and its lower energy density [57]. On the other hand, the high fat content can be a disadvantage for the use of these flours, owing to the lipoxygenase-catalyzed oxidation of unsaturated fatty acids to volatile compounds, which can affect both the taste and the shelf life of foods [58]. Among the tested flours, soybean and hemp flours differ from other flours in terms of their high fat and fiber, and pea and chickpea flours have a high concentration of fiber with a very low fat content; in contrast, rice flour has a low fiber and fat content.
The starch and protein content is another important aspect to take into account in the composition of these flours. The starch content affects human health through its contribution to the glycemic index and levels of resistant starch. Incomplete digestion–absorption of resistant starch in the small intestine results in non-digestible starch fractions with physiological functions similar to those of dietary fiber and therefore with important health benefits [59]. Starch contributes 50–70% of the energy in the human diet, as it provides a direct source of glucose, which is an essential substrate in brain and red blood cells for generating metabolic energy [60]. Considering the indications of the Food Safety Authority of Ireland, a product is considered to be high in protein when at least 20% of the total energy comes from protein. According to this approach, all the flours analyzed in this study are high-protein foods except rice flour. Soybean and hemp differ from other flours in terms of their low starch content and also in their high protein content. In contrast, rice flour is mainly composed of starch with a low protein content. Pea and chickpea flours have a high concentration of protein and starch, with a very low fat content, which makes them particularly interesting from a nutritional point of view.
3.2. Mineral Content
The concentrations of the 14 minerals analyzed (Na, Mg, P, K, Ca, Mn, Fe, Ni, Cu, Zn, Se, Cr, Cd and Pb) for each of the flours studied can be seen in Table 2. The minerals calcium, phosphorus, sodium, potassium and magnesium are called macroelements as their nutritional requirements are higher than 100 mg/dL day [61]. In all the flours analyzed, potassium is the major macroelement, followed by phosphorus. Sodium is the least abundant macroelement in chickpea, soybean and hemp flours, while in rice and pea flours, calcium is the minority macroelement. Soybean flours have the highest potassium content (18,223.35 mg/kg), while hemp flours have the highest concentrations of phosphorus (9908.3 mg/kg) and magnesium (4978.6 mg/kg). On the other hand, rice flours have the lowest macroelement content, with particularly low concentrations of calcium, potassium and magnesium compared to the other types of flour analyzed.
Table 2.
The mineral composition (mg/kg fresh weight) of different flours. Data presented as means ± standard deviation from triplicate analysis.
Those elements of which trace amounts are necessary are called microelements and include copper, iron, manganese, selenium, zinc, chromium and nickel. In all the flours analyzed, the microelement with the highest concentration is iron, followed by zinc and manganese. The highest concentrations of all of these elements were found in the hemp flour, whereas selenium was only detected in one sample of pea flour. The results obtained for macro- and microelements are similar to those described by other authors in chickpea flour [62], rice [63], soybean [64] and pea flour [2] but lower than those described for hemp flour [65]. In all the minerals analyzed, a large variability in their concentrations was found depending on the commercial brand analyzed. This is due to the fact that the mineral composition varies according to parameters such as phenotypic variation, climatic conditions, the fertilizers used, soil quality, processing and storage [66].
Minerals are essential elements in our diet for long and healthy life; some macro- and microelements are found in the structure of teeth (Ca, P and F) and bones (Ca, Mg, Mn, P, B and F) and in the control of blood pressure (Ca and K), and some act as catalysts for metabolic reactions (Zn, Cu, Se, Mg, Mn). They play a vital role as a structural part of many enzymes (Cu, Fe, Mn, Mg, Se and Zn) and are involved in the immune (Ca, Mg, Cu, Se and Zn) and brain (Cr and Mn) systems [67]. Plant foods are in themselves an important source of essential minerals, but they can also be used in the fortification of other foods as a strategy to reduce micronutrient malnutrition. Mineral deficiency is therefore more prevalent in developing countries, where access to fresh food is scarce, whereas in industrialized countries, Ca deficiency is a major problem [68]. However, it should be noted that the total amount of a mineral in a food does not reflect the amount available in the body through absorption, as only a certain amount of the mineral is bioavailable [67]. Dietary deficiency of some of these minerals may be due to low mineral intake, but in some cases, the cause is poor mineral absorption. Phytic acid present in cereals and some legumes has been described as one of the main inhibitors of Fe and Zn absorption and, to a lesser extent, of calcium, with oxalic acid being the main inhibitor of Ca absorption [69].
In addition to these elements, some minerals such as Cd and Pb have no known biological activity but accumulate in living organisms and can be highly toxic. Cadmium has not been detected in any of the chickpea flours analyzed, and the concentrations found in the other flours are low except in one of the pea flour samples. Although there is no specific legislation regarding Cd and Pb content in plant-based flours, there is European legislation regulating the Cd and Pb content in cereals and legumes. As far as cadmium content is concerned, REGULATION (EU) 2021/1323 sets a limit of 0.04 mg/kg in dry legumes and 0.15 mg/kg in rice. The results obtained from the samples analyzed show that all of them are below the established limits, except for one sample of pea flour, which shows very high Cd contents (0.289 mg/kg). Ingestion of Cd-contaminated food has been linked to renal tubular damage, osteoporosis and cancer [70].
However, all the flours analyzed showed the presence of lead. In one of the samples of soybean flour and pea flour and in the two samples of hemp flour, high concentrations of this mineral were found, which were particularly high in one hemp flour (2.94 mg/kg). The levels found in the samples analyzed are higher than those recommended by REGULATION (EU) 2021/1317, which sets a maximum limit for cereals and pulses of 0.2 mg/kg of Pb. Only the two samples of chickpea flour and one sample of soybean flour were below this value. Prolonged exposure to Pb has been linked to kidney problems or high blood pressure in adults and delayed physical and mental development in children [71].
3.3. Phenolic Composition and Antioxidant Activity
All the studied parameters, the total phenolic content (TPC), the total flavonoid content (TFC), the flavanone and dihydroflavonol content, varied significantly in the different samples studied (Table 3), depending both on the plant species and on the commercial brand. Therefore, the total phenolic content (TPC) varied from 6.33 mg GAE/100 g in rice (B) flour to 139.31 mg GAE/100 g in soybean (B) flour; the total flavonoid content ranged from 1.47 for rice to 66.65 mg of rutin/100 g for hemp, and flavanones and dihydroflavonols showed values between 328.31 for rice and 638.45 mg of pinocembrin/100 g for pea. These results showed that soybean flour had the highest values of TPC, followed by hemp, which showed the highest values of TFC and flavanones and dihydroflavonols, while pea showed similar values to hemp for this group of phenolic compounds. On the other hand, rice showed the lowest values of all the bioactive compounds. Variations between brands were observed in the TPC for chickpea, pea and especially for soybean and in flavanones and dihydroflavonols for pea and soybean, but this variation was particularly noticeable in TFC also for chickpea, pea and soybean.
Table 3.
The phenolic composition and antioxidant capacity (per 100 g of fresh weight) of different flours. Data presented as means ± standard deviation from triplicate analysis.
As can be observed in Table 3, all pulse flours showed significantly higher values than cereal flour (rice) for all the parameters determined. These results are in agreement with those previously reported by Millar et al. [2], which showed that pulses (fava, green pea and yellow pea) had higher phenolic contents than wheat flour, and with those of the Rocchetti et al. [72], which found lower TPC in white rice than in the chickpea. Regarding pulses, chickpeas showed a higher content of TPC than peas agreeing with the results of Xu et al. [73], although Magalhães et al. [74] showed the opposite for field peas. However, for TFC, the values found in this work for peas were similar to or higher than those found for chickpea, which was in agreement with the results found by Magalhães et al. [74] but not with those reported by other authors [73,75]. On the other hand, hemp showed higher contents of TPC than green pea [76], although this work pointed out that wheat (cereal) showed higher TPC content than green peas, differing from the results of Millar et al. [2] and those obtained in this study. Moreover, the research by Multari et al. [76] found similar contents of TFC for green pea and hemp, which were significantly higher than that observed for wheat, in agreement with the present study. Xu et al. [73] reported significantly higher values for TPC and TFC values in soybean than in pea and chickpea, as observed in this study, although the differences were lower.
The TPC of chickpea was lower than that previously reported [73,77,78] but close to the value (54 mg/100 g) found by Fernandez-Orozco et al. [79] and higher than the values found by Magalhães et al. [74]. Previous studies also showed that the most important phenolic compounds in chickpeas are phenolic acids [74,80], with p-hidroxybenzoic acid being the most relevant in relation to the antioxidant properties [81]. Some studies also showed the presence of flavonoids, as was found in the present study, but this depended on the variety [80,81].
The TPC of peas was also lower than previously reported for both yellow and green pea [2,73]. Previous studies also showed that it is possible to find both phenolic acids (protocatechuic and p-hydroxybenzoic acids) and flavonoid compounds such as luteolin and apigenin [74,82]. Regarding soybean flour, the TPC was in the lower half of the range reported by Slavin et al. [83] and Kumar et al. [84] and slightly lower than that previously reported by Xu et al. [73] but slightly higher than the value found for soybean flour by Villalobos et al. [85]. The most relevant phenolic compounds in soybean are isoflavones daidzein and genistein, although it also contains phenolic acids, such as gallic and protocatechuic acids, and flavonoids such as rutin and quercetin [86]. As mentioned above, the rice flour showed the lowest content of TPC; indeed, the values observed were slightly lower than those found in white rice flour [87] and significantly lower than the values described for wild, black or violet rice flours [72] because pigmented varieties have higher TPCs related to reducing disease risk [88]. The main individual phenolic compounds present in rice flour are phenolic acids such as vanillic, chlorogenic and ferulic acids and flavonoids such as epicatequin [87,89]. Finally, hemp flour showed TPC values similar to or slightly lower than those previously reported, ranging from 74.4 to 98.7 [3], but lower than the values reported by Irakli et al. [90]. The most important phenols found in hemp flour are phenolic acids such as protocatechuic, p-hydroxybenzoic, cinnamic acid and p-coumaric [76,90].
The total equivalent antioxidant capacity (TEAC) also showed a significant variation among flours depending more on the plant species rather than the commercial brand, as no significant differences were detected regarding this factor. The TEAC values ranged from 8.69 nmols for soybean to 1.08 nmols for Trolox per 100 g of pea. Soybean showed the highest statistically significant values of TEAC, followed by hemp and chickpea which did not show significant differences between them, while rice and pea showed the lowest values without statistically significant differences between them. As antioxidant activity can be measured by different methods, the results of the ABTS methods in the bibliography are scarce, although in general, higher values were reported [85,90]. This can be related to the fact that the bioactivity depends on the extraction and assay conditions, and the lack of standardization in these methods can make comparisons difficult [91]. However, previous studies have pointed out that soybean and hemp have a higher antioxidant capacity than peas, as observed in these commercial flours [73,75]. Indeed, hemp showed higher DPPH values than wheat, which means that this species has a higher antioxidant capacity than cereals, as has been observed in this study in rice [3]. Other studies also found that chickpea has a higher antioxidant activity, measured by FRAP and ORAC methods, than rice [87], which is in agreement with the results obtained in this study for the ABTS method.
As previously mentioned, the highest antioxidant activity and the highest phenolic content (Table 3) were observed in soybean flour. Then, the Pearson correlations between phenolic groups and ABTS were subsequently calculated. A positive correlation between the ABTS and TPC was observed (r2 = 0.935, p < 0.01), agreeing with previous reports by Millar et al. [2], and also between the TFC and ABTS (r2 = 0.652, p < 0.05).
Phenolic compounds are known to interact with proteins to form complexes that, in turn, decrease the solubility of proteins and make protein complexes less susceptible to proteolytic attack than the same proteins in isolation [92]. Furthermore, they impair starch and disaccharide assimilation and interact with proteolytic enzymes to inhibit their activity. Then, the lower TPC content of some flours may result in greater protein bioavailability, because the total phenols include tannins and phenolic acids, which can affect the overall digestibility of pulse flour [93]. However, plant phenolics are attracting increased interest owing to their potential role as protective factors against free-radical-mediated pathologies, such as cancer and atherosclerosis in humans [94]. Indeed, phenolic compounds have a multitude of physiological functions such as anti-inflammatory and cardioprotective activity [95]. Owing to their intrinsic antioxidant activity, they are commonly used as food additives for the protection of food products against oxidation [96]. Knowledge of the biological activities of these plant chemicals is continually growing; they have the potential to play a preventative role in inflammatory conditions and the metabolic syndrome, as has been highlighted in several reviews [23,97,98].
The results presented in this study demonstrate the potential of incorporating such flours into cereal-based foods to increase the level of these beneficial plant chemicals in the diet. This was shown by Turco et al. [28], who used a wheat–pulse flour composite to increase the nutritive value of semolina pasta; a significant increase of 18% in antioxidant activity (ORAC) was observed. Similarly, [2] used wheat–pulse flour composites in the formulation of unleavened crackers. The authors reported an increase of up to 182% in antioxidant activity (DPPH).
3.4. Fatty Acid Profile
The results corresponding to the fatty acid composition of the various flours analyzed are shown in Table 4. Significant differences due to the vegetal species were observed for all the fatty acids but also between brands for pea, soybean and hemp, where these differences are very important for the first two.
Table 4.
The fatty acid composition of different flours (g per 100 g of total fatty acid methyl esters). Data presented as means ± standard deviation from triplicate analysis.
The most abundant fatty acid in pulses and hemp was C18:2 n6, ranging from 40.7 to 56.5%, except for the B brand of soybean (28.1%), whereas rice flour showed a very low value of this fatty acid (4.8% on average). For these flours, the most abundant fatty acid was C16:0, with average values of 51.5% on average. The chickpea and hemp flours showed the highest values for C18:2 n6 acid without significant differences between them, followed by pea and soybean, with similar values. In fact, the significant differences observed for pea and soybean were between brands, with the difference being very important for this soybean flour.
The second most abundant fatty acid in pulses and rice flour was C18:1 (24.8–33.6%), except for the B brand of soybean (33.6%) for which C18:1 was the most abundant. Then, the highest values of this fatty acid were found for soybean and pea flours, followed by chickpea and rice, while hemp flours showed the lowest values.
However, for hemp flour and the B brand of pea, the second most abundant fatty acid was C18:3 n3, with C18:1 being the third most abundant fatty acid. In fact, marked differences among samples were observed for C18:3 n3, with hemp flours and the A brand of pea showing the highest levels, followed by soybean (A brand) and chickpea, while rice flour showed very low values.
On the other hand, chickpea, the A brand of pea and soybean flours showed higher values of the C16:0 (9.9–11.1%) than those observed for C18:3 n3, with the content in the B brand of soybean sample (21.7%) being especially high. As mentioned above, rice flour showed the highest values of this fatty acid, and it was the most abundant and different from all other flours. The pulses showed intermediate values, while hemp flours had the lowest contents of this fatty acid.
As far as C18:0 is concerned, significant differences were observed between vegetable species but also between brands. Therefore, the highest content of this fatty acid was therefore observed for the B brand of soybean, followed by the A brand of soybean, rice and pea without significant differences being found between the samples.
Some fatty acids were found in certain vegetable species but not in others such as C15:0, C17:0 or C18:1n9t. Other fatty acids were determined only in some samples such as linolenic-γ, which was found in hemp; the amount of the two brands analyzed was different, as that of the B brand was 6 times higher than that of the A bran (6.75 vs. 0.68%). Eicosatrienoic was found only in rice, and DHA was determined only in soybean flours; in both cases, the levels were very low (<1%) and there were no significant differences between brands. It is noteworthy that hemp had the lowest variety of fatty acids, while chickpeas showed the highest number of fatty acids.
According to these values, pulses showed very high contents of polyunsaturated fatty acids (PUFA) (50–65%), especially n6 PUFA (48–54%), followed by monounsaturated fatty acids (MUFA) (18–31%) and with low values of saturated fatty acids (SFA) (13–17%), except for the B brand of soybean, which showed a different behavior, and the levels of the three FA groups were similar. Moreover, pea, followed by soybean, was characterized by the high contents of n3 PUFA, while chickpea had the lowest values. These results are in agreement with those previously reported by Jahreis et al. [99].
The findings of this study regarding the fatty acid profile of chickpeas are similar to those reported by other authors who found the SFA to be between 12.6 and 16.5% (13.4%), the MUFA between 19 and 39% (28.2%) and the PUFA between 44 and 63% (58%) [99,100,101,102,103]. Among the PUFAs, the percentage of n3 and the n6/n3 ratio were within the range previously reported (15–21%) [99,102]. These studies also found that the most dominant fatty acid in chickpea is linoleic acid (42.1–61.4%), followed by oleic acid (20.1–38.5%), palmitic acid (9.1–12.1%), linolenic acid (2.1–6.6%) and stearic acid (1.3–2.4%). The variations reported can be attributed to environmental factors and the cultivar [103].
The results from pea indicate that the values found for the A brand for SFA, MUFA and PUFA are within the range described by previous studies, i.e., 11–23%, 26–34% and 41–56%, respectively [99,104,105]; however the B brand showed slightly higher values for PUFA and lower values for MUFA. The n6/n3 ratios in the analyzed A and B flours were slightly lower than the values previously found [99,105], and the values were significantly lower than those found for chickpeas. For chickpeas and other pulses, the main fatty acid was linoleic acid, followed by oleic acid, and the values were similar to those reported in other studies (34.7–47.7% and 25.0–33.3%, respectively) [99,103,105,106]. In general, the amount of linoleic acid and oleic acid was similar to that of other pulses, such as beans and lentils, which have 46.7 and 44.4% linoleic acid and 28.1 and 20.9% oleic acid, respectively [103]. These fatty acids were followed by linolenic acid, in contrast to chickpeas, and showed slightly higher values than those previously reported (6.5–8.3%), while palmitic acid showed lower values (15.5–12.6%) [99,105].
Soybean flour A showed a similar percentage of SFA, MUFA and PUFA to pea and chickpea. This result and the percentages observed are in agreement with the data reported by Jahreis et al. [99] and Dahmer et al. [107], who also found that the n6/n3 ratio varied between 5.8 and 8.2, as was observed for the A flour. Then, the main fatty acids of the A brand flour were linoleic, oleic, palmitic and α-linolenic acid, as previously observed [99,108,109,110,111], with the percentages observed for these four fatty acids within the range described by these authors being 40.4–54.8%, 17.5–21.4%, 10.8–13.1% and 5.3–9.9%, respectively. However, the B flour showed a lower amount of PUFA and a higher amount of the two other fatty acid groups and a very low amount of n3. The differences in the technological process, which led to a variation in the fat content (18 vs. 23%), may be the origin of the difference in the level of fatty acids, together with differences in environmental factors and the cultivar [112].
Hemp flour showed the highest PUFA contents among the flours analyzed, with a value of 74–75%, while the MUFA and SFA were about 11–14%. These results are in agreement with the values described in both flours and hemp seeds [90,113,114,115]. The high proportion of n3 fatty acids, which makes the ratio of n6/n3 one of the lowest among the flours analyzed, is noteworthy. These studies also highlight the high percentage of linoleic acid (51.6–56.4%) followed by α-linolenic (10.5–17.3%) and oleic acid (10.7–17.9%), with significant levels of γ-linolenic acid (3–18%), which is in accordance with the findings of this study.
Finally, rice flour showed a very different fatty acid profile, with high amounts of SFA, low amounts of PUFA compared with the remainder of the flours and with the data reported in the literature pointing to levels of SFA between 25 and 39.3%, and low amounts of MUFA between 34.9 and 50.9% and of PUFA between 9.9 and 37.2% for milled rice flour [116,117,118]. The closest values were found for parboiled milled rice, with an SFA content of 55.5% [116]. These results highlight the strong influence of the rice variety and the technological process on the fatty acid profile of rice flour [116]. The main fatty acids in the flours analyzed were palmitic acid, followed by oleic, linoleic and stearic acids, in contrast to the findings of previous studies, which reported that the main fatty acids were oleic, palmitic and linoleic acid for white rice flours and oleic, linoleic and palmitic acids for brown rice flours [118,119].
Fatty acids of specific chain length and saturation are required by humans for their structural and metabolic needs. Linoleic acid is responsible for the production of prostaglandins, which prevent the concentration of heavy cholesterol on the blood vessel walls [120], but is also correlated with an improved blood lipid profile, lower incidence of type 2 diabetes, improved insulin sensitivity and anti-arrhythmic effects. Oleic acid is known to have beneficial effects on autoimmune and inflammatory diseases, as well as cancer and the healing of wounds [121]. α-Linolenic acid is an essential fatty acid correlated to inflammatory and immunosuppressive activities by means of the formation of several intermediates such as leukotrienes, thromboxane and prostaglandins [122]. However, unsaturated fatty acids are susceptible to lipid oxidation, which results in undesirable changes in organoleptic properties owing to the presence of off flavors [123]. In this sense, oleic and linoleic acids show less propensity towards oxidation compared to linolenic acid during processing [124]. Pulses and hemp flours were characterized by high levels of all these fatty acids, which are correlated with the above-mentioned health benefits, with pea and hemp flours showing the highest levels of linolenic acid.
However, not only PUFA levels but also the n-6/n-3 PUFA ratio should be taken into account. According to the World Health Organization, this ratio should be below 4:1, as is shown by both brands of both pea and hemp flours. In this context, if any flour with a high n6/n3 ratio is to be partially replaced, it would be desirable to use hemp flour, owing to its low n6/n3 ratio or pea flour, as this contains only a small amount of fat with a large amount of oleic acid and an adequate n6/n3 ratio.
3.5. PCA Method
Principal component analysis yielded six PCs with an eigenvalue >1, which explained 96.43% of the variance. Figure 1 shows the projection plot of the samples and the original variables in the space defined by the first two PCs, which explain 70.36% of the variance.
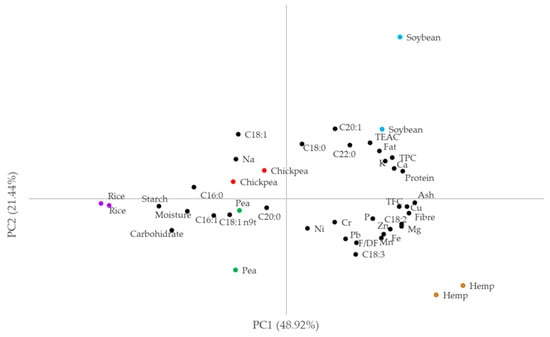
Figure 1.
Projection plot of the flour samples in the space defined by the two firsts PCs. TPC: total phenolic content, TFC: total flavonoid content, F/DF: flavanones and dihydroflavonols, TEAC: total equivalent antioxidant activity (nmol Trolox/100 g).
Soybean samples were found in the upper-right quadrant, with positive values of both PCs, due to the strong contribution of protein, ash, TPC, Ca and K to PC1, together with the correlation of C22:0 and C18:1 to the PC2. The hemp flour samples presented positive PC1 values due to the correlation of this PC1 with ash and fiber, as previously mentioned, but also with TFC and Cu contents. These samples also showed negative PC2 values, which were correlated with C18:2, Mg and Fe variables, but mainly with C18:3 levels. In the opposite quadrant were chickpea samples showing positive PC2 values, which correlated with the observed levels of C18:1 and C18:0 (as for soybean and one pea sample, which have positive PC1 values). In fact, chickpea samples had negative PC1 values due to the strong correlation with Na.
Pea and rice samples were in the lower-left quadrant and showed negative PC1 and PC2 values. Thus, rice samples had the highest levels of C16:0 and C18:1n9t but also of carbohydrates and starch, together with the lowest values of TFC, TPC, C18:2 and most minerals. The pea samples had a high moisture content but also low values of Mg, P and Ca. However, they showed the highest values of Pb, which was associated with the negative values of PC2. As in the case of rice, the pea samples showed relatively low TPC and TEAC values. One sample showed very low amounts of C18:1, which justifies the low PC2 value observed.
The figure also shows that the samples of the two brands of rice, hemp and chickpea were close, while the two samples of pea and especially soybean were separated due to the observed compositional differences. Indeed, the soybean, rice and hemp flours were very different from each other, while the chickpea flour and one of the pea samples were quite close.
4. Conclusions
Although plant-based flours are referred to as a generic term, not all products under this name have a similar composition and therefore do not make a similar contribution from a nutritional point of view. All the flours analyzed in this study (chickpea, pea, soybean and hemp) have carbohydrates as their main component and provide a similar amount of energy (Kcal/100 g). However, pea and chickpea flours contain large amounts of protein and fiber, while soybean and hemp flours provide significant amounts of fat. Regarding the mineral composition, potassium and phosphorus as macro-elements and iron as a microelement are the major components in all flours. The phenolic composition, antioxidant activity and fatty acid profile of these meals vary greatly depending on the plant species. In addition to these differences, plant-based flours have been shown to have highly variable compositions between different commercial brands, which makes it necessary to educate consumers to check the nutritional labels of this type of food in order to ensure healthy diets. Surprisingly, the presence of high amounts of lead has also been detected in some of these flours, so health authorities should be aware of this fact in order to implement control mechanisms for plant-based flours.
Author Contributions
Conceptualization and methodology, A.M.V.-Q. and I.R.; formal analysis, Y.A.; data curation, M.H.-J.; writing—original draft preparation, M.H.-J. and Y.A.; writing—review and editing, A.M.V.-Q. and I.R. All authors have read and agreed to the published version of the manuscript.
Funding
This research received no external funding.
Data Availability Statement
The data presented in this study are available on request from the corresponding author.
Acknowledgments
Y. Absi acknowledges the Algerian government for the grant long-term residential doctoral program abroad and M. Hernández-Jimenez acknowledges the Own Program III: Grants for Pre-doctoral Contracts of the University of Salamanca co-funded by Banco Santander.
Conflicts of Interest
The authors declare no conflict of interest.
References
- Bigliardi, B.; Galati, F. Innovation trends in the food industry: The case of functional foods. Trends Food Sci. Technol. 2013, 31, 118–129. [Google Scholar] [CrossRef]
- Millar, K.A.; Gallagher, E.; Burke, R.; McCarthy, S.; Barry-Ryan, C. Proximate composition and anti-nutritional factors of fava-bean (Vicia faba), green-pea and yellow-pea (Pisum sativum) flour. J. Food Compos. Anal. 2019, 82, 103233. [Google Scholar] [CrossRef]
- Mikulec, A.; Kowalski, S.; Sabat, R.; Skoczylas, L.; Tabaszewska, M.; Wywrocka-Gurgul, A. Hemp flour as a valuable component for enriching physicochemical and antioxidant properties of wheat bread. LWT 2019, 102, 164–172. [Google Scholar] [CrossRef]
- Gambus, H.; Gambus, F.; Pastuszka, D.; Wrona, P.; Ziobro, R.; Sabat, R.; Mickowska, B.; Nowotna, A.; Sikora, M. Quality of glutenfree supplemented cakes and biscuits. International. J. Food Sci. Nutr. 2009, 60, 31–50. [Google Scholar] [CrossRef]
- Niro, S.; D’Agostino, A.; Fratianni, A.; Cinquanta, L.; Panfili, G. Gluten-Free Alternative Grains: Nutritional Evaluation and Bioactive Compounds. Foods 2009, 8, 208. [Google Scholar] [CrossRef]
- Di Liberto, D.; Carlisi, D.; D’Anneo, A.; Emanuele, S.; Giuliano, M.; De Blasio, A.; Calvaruso, G.; Lauricella, M. Gluten Free Diet for the Management of Non Celiac Diseases: The Two Sides of the Coin. Healthcare 2020, 8, 400. [Google Scholar] [CrossRef]
- Doxastakis, G.; Zafiriadis, I.; Irakli, M.; Marlani, H.; Tananaki, C. Lupin, soya and triticale addition to wheat flour doughs and their effect on rheological properties. Food Chem. 2002, 77, 219–227. [Google Scholar] [CrossRef]
- Hefnawy, T.M.H.; El-Shourbagy, G.A.; Ramadan, M.F. Impact of adding chickpea (Cicer arietinum, L.) flout to wheat flour on the rheological properties of toast bread. Int. Food Res. J. 2012, 19, 521–525. [Google Scholar]
- Dwyer, J.T.; Wiemer, K.L.; Dary, O.; Keen, C.L.; King, J.C.; Miller, K.B.; Philbert, M.A.; Tarasuk, V.; Taylor, C.L.; Gaine, P.C.; et al. Fortification and Health: Challenges and Opportunities. Adv. Nutr. 2015, 6, 124–131. [Google Scholar] [CrossRef]
- Xu, Q.C. Studies of the differences of amino acid contents in rice varieties and the relationship between the amino acid content and genetic code numbers. J. Hunan Agric. Coll. 1990, 16, 221–225. [Google Scholar]
- Wu, J.G.; Shi, C.; Zhang, X. Estimating the amino acid composition in milled rice by near-infrared reflectance spectroscopy. Field Crops Res. 1990, 75, 1–7. [Google Scholar] [CrossRef]
- Storck, C.R.; Picolli da Silva, L.; Alves Fagundes, C.A. Categorizing rice cultivars based on differences in chemical composition. J. Food Compos. Anal. 2005, 18, 333–341. [Google Scholar] [CrossRef]
- Das, A.B.; Bhattacharya, S. Characterization of the batter and gluten-free cake from extruded red rice flour. LWT 2019, 102, 197–204. [Google Scholar] [CrossRef]
- Seetapan, S.; Limparyoon, N.; Yooberg, R.; Leelawat, B.; Charunuch, C. Influence of addition of extruded rice flour on preparation and quality of fresh gluten-free yellow alkaline noodles. J. Cereal Sci. 2019, 90, 102828. [Google Scholar] [CrossRef]
- Charoenthaikij, P.; Jangchud, K.; Jangchud, A.; Prinyawiwatkul, W.; Tungtrakul, P. Germination conditions affect selected quality of composite wheat-germinated brown rice flour and bread formulations. J. Food Sci. 2010, 75, S312–S318. [Google Scholar] [CrossRef] [PubMed]
- Marti, A.; Caramanico, R.; Bottega, G.; Pagani, M.A. Cooking behavior of rice pasta: Effect of thermal treatments and extrusion conditions. LWT 2013, 54, 229–235. [Google Scholar] [CrossRef]
- Messina, V. Nutritional and health benefits of dried beans. Am. J. Clin. Nutr. 2014, 100, 437S–442S. [Google Scholar] [CrossRef] [PubMed]
- Hoffman, J.R.; Falvo, M.J. Protein—Which is Best? J. Sport. Sci. Med. 2004, 3, 118–130. [Google Scholar]
- Boye, J.; Zare, F.; Pletch, A. Pulse proteins: Processing, characterization, functional properties and applications in food and feed. Food Res. Int. 2010, 43, 414–431. [Google Scholar] [CrossRef]
- Herranz, B.; Canet, W.; Jiménez, M.J.; Fuentes, R.; Alvarez, M.D. Characterisation of chickpea flour-based gluten-free batters and muffins with added biopolymers: Rheological, physical and sensory properties. Int. J. Food Sci. Technol. 2016, 51, 1087–1098. [Google Scholar] [CrossRef]
- Han, J.; Janz, J.A.M.; Gerlat, M. Development of gluten-free cracker snacks using pulse flours and fractions. Food Res. Int. 2010, 43, 627–633. [Google Scholar] [CrossRef]
- Laleg, K.; Barron, C.; Santé-Lhoutellier, V.; Walrand, S.; Micard, V. Protein enriched pasta: Structure and digestibility of its protein network. Food Funct. 2016, 7, 1196–1207. [Google Scholar] [CrossRef] [PubMed]
- Campos-Vega, G.; Loarca-Piña, B.; Oomah, D. Minor components of pulses and their potential impact on human health. Food Res. Int. 2010, 43, 461–482. [Google Scholar] [CrossRef]
- Amarakoon, A.; Thavarajah, D.; McPhee, K.; Thavarajah, P. Iron-, zinc-, and magnesium-rich field peas (Pisum sativum L.) with naturally low phytic acid: A potential food-based solution to global micronutrient malnutrition. J. Food Compos. Anal. 2012, 27, 8–13. [Google Scholar] [CrossRef]
- Sanchez, H.D.; Osella, C.A.; de la Torre, M.A. Use of Response Surface Methodology to Optimize Gluten-Free Bread Fortified with Soy Flour and Dry Milk. Food Sci. Technol. Int. 2004, 10, 5–9. [Google Scholar] [CrossRef]
- Shogren, R.L.; Hareland, G.A.; Wu, Y.V. Sensory evaluation and composition of Spaghetti fortified with soy flour. J. Food Sci. 2006, 71, 428–432. [Google Scholar] [CrossRef]
- Shin, D.J.; Kim, W.; Kim, Y. Physicochemical and sensory properties of soy bread made with germinated, steamed and roasted soy flour. Food Chem. 2013, 141, 517–523. [Google Scholar] [CrossRef] [PubMed]
- Turco, I.; Ferretti, G.; Bacchetti, T. Review of the health benefits of Faba bean (Vicia faba L.) polyphenols. J. Food Nutr. Res. 2016, 55, 283–293. [Google Scholar] [CrossRef]
- Durazzo, A.; Turfani, V.; Narducci, V.; Azzini, E.; Maiani, G.; Carcea, M. Nutritional characterisation and bioactive components of commercial carobs flours. Food Chem. 2014, 153, 109–113. [Google Scholar] [CrossRef]
- González-Montemayor, A.M.; Flores-Gallegos, A.C.; Contreras-Esquivel, J.C.; Solanilla-Duque, J.F.; Rodríguez-Herrera, R. Prosopis spp. functional activities and its applications in bakery products. Trends Food Sci. Technol. 2019, 94, 12–19. [Google Scholar] [CrossRef]
- Petrović, M.; Debeljak, Ž.; Kezić, N.; Džidara, P. Relationship between cannabinoids content and composition of fatty acids in hempseed oils. Food Chem. 2015, 170, 218–225. [Google Scholar] [CrossRef] [PubMed]
- Hofmanová, T.; Švec, I.; Hrušková, M. Nutritional properties of non-traditional seeds. J. Life Med. 2014, 2, 10–14. [Google Scholar]
- Korus, J.; Witczak, M.; Ziobro, R.; Juszczak, L. Hemp (Cannabis sativa subsp. sativa) flour and protein preparation as natural nutrients and structure forming agents in starch based gluten-free bread. LWT 2017, 84, 43–150. [Google Scholar] [CrossRef]
- Pojić, M.; Dapčević Hadnađev, T.; Hadnađev, M.; Rakita, S.; Brlek, T. Bread supplementation with hemp seed cake: A by-product of hemp oil processing. J. Food Qual. 2015, 38, 431–440. [Google Scholar] [CrossRef]
- de la Barca, A.M.C.; Rojas-Martínez, M.E.; Islas-Rubio, A.R.; Cabrera-Chávez, F. Gluten-free breads and cookies of raw and popped amaranth flours with attractive technological and nutritional qualities. Plant Foods Hum. Nutr. 2010, 65, 241–246. [Google Scholar] [CrossRef]
- Codină, G.G.; Franciuc, S.G.; Mironeasa, S. Rheological Characteristics and Microstructure of Milk Yogurt as Influenced by Quinoa Flour Addition. J. Food Qual. 2016, 39, 559–566. [Google Scholar] [CrossRef]
- Miranda-Villa, P.P.; Mufari, J.R.; Bergesse, A.E.; Calandri, E.L. Effects of whole and malted quinoa flour addition on gluten-free muffins quality. J. Food Sci. 2018, 84, 147–153. [Google Scholar] [CrossRef] [PubMed]
- Khan, I.; Yousif, A.; Johnson, S.K.; Gamlath, S. Effect of sorghum flour addition on resistant starch content, phenolic profile and antioxidant capacity of durum wheat pasta. Food Res. Int. 2013, 54, 578–586. [Google Scholar] [CrossRef]
- Yousif, A.; Nhepera, D.; Johnson, S. Influence of sorghum flour addition on flat bread in vitro starch digestibility, antioxidant capacity and consumer acceptability. Food Chem. 2012, 134, 880–887. [Google Scholar] [CrossRef]
- Aschemann-Witzel, J.; Futtrup-Gantriis, R.; Fraga, P.; Perz-cueto, F.J.A. Plant-based food and protein trend from a businness perpective: Markets, consumers and the challenges and opportunities in the future. Crit. Rev. Food Sci. Nutr. 2020, 61, 3119–3128. [Google Scholar] [CrossRef]
- AOAC International. Official Methods of Analysis, 20th ed.; Association of Official Analytical Chemists: Gaithersbg, MD, USA, 2016. [Google Scholar]
- AACC. American Association of Cereal Chemists Method 44-15.02., Moisture: Air Oven Methods. In Approved Methods of Analysis, 11th ed.; AACC International: St. Paul, MN, USA, 2001. [Google Scholar]
- AACC. American Association of Cereal Chemists Method 08-01.01. Ash—Basic method. In Approved Methods of Analysis, 11th ed.; AACC International: St. Paul, MN, USA, 1999. [Google Scholar]
- AOAC International. Official Methods of Analysis, 16th ed.; Association of Official Analytical Chemists: Washington, DC, USA, 1995. [Google Scholar]
- Lurueña-Martínez, M.A.; Palacios, C.; Vivar-Quintana, A.M.; Revilla, I. Effect of the addition of calcium soap to ewes’ diet on fatty acid composition of ewe milk and subcutaneous fat of suckling lambs reared on ewe milk. Meat Sci. 2010, 84, 677–683. [Google Scholar] [CrossRef] [PubMed]
- Betances-Salcedo, E.; Revilla, I.; Vivar-Quintana, A.M.; González-Martín, M.I. Flavonoid and antioxidant capacity of propolis prediction using near infrared spectroscopy. Sensors 2017, 17, 1647. [Google Scholar] [CrossRef] [PubMed]
- Valencia, D.; Alday, E.; Robles-Zepeda, R.; Garibay-Escobar, A.; Galvez-Ruiz, J.C.; Salas-Reyes, M.; Jiménez-Estrada, M.; Velazquez-Contreras, E.; Hernandez, J.; Velazquez, C. Seasonal effect on chemical composition and biological activities of Sonoran propolis. Food Chem. 2012, 131, 645–651. [Google Scholar] [CrossRef]
- Popova, M.; Bankova, V.; Butovska, D.; Petkov, V.; Nikolova-Damyanova, B.; Sabatini, A.G.; Marcazzan, G.L.; Bogdanov, S. Validated methods for the quantification of biologically active constituents of poplar-type propolis. Phytochem. Anal. Int. J. Plant Chem. Biochem. Tech. 2004, 15, 235–240. [Google Scholar] [CrossRef]
- Chen, J.; Lindmark-Månsson, H.; Gorton, L.; Åkesson, B. Antioxidant capacity of bovine milk as assayed by spectrophotometric and amperometric methods. Int. Dairy J. 2003, 13, 927–935. [Google Scholar] [CrossRef]
- Lan, Y.; Zha, F.; Peckrul, A.; Hanson, B.; Johnson, B.; Rao, J.; Chen, B. Genotype x environmental effects on yielding ability and seed chemical composition of industrial hemp (Cannabis sativa L.) varieties grown in North Dakota, USA. J. Am. Oil Chem. Soc. 2019, 96, 1417–1425. [Google Scholar] [CrossRef]
- Vatansever, S.; Rao, J.; Hall, C. Effects of ethanol modified supercritical carbon dioxide extraction and particle size on the physical, chemical, and functional properties of yellow pea flour. Cereal Chem. 2020, 97, 1133–1147. [Google Scholar] [CrossRef]
- Wani, S.A.; Kumar, P. Comparative study of chickpea and green pea flour based on chemical composition, functional and pasting properties. J. Food Res. Technol. 2014, 2, 124–129. [Google Scholar]
- Bolarinwa, I.F.; Lim, P.T.; Muhammad, K. Quality of gluten-free cookies from germinated brown rice flour. Food Res. 2019, 3, 199–207. [Google Scholar] [CrossRef]
- Uwem, U.M.; Babafemi, A.A.; Sunday, D.M. Proximate composition, phytoconstituents and mineral contents of soybean (Glycine max) flour grown and processed in Northern Nigeria. Adv. Appl. Sci. 2017, 2, 48. [Google Scholar] [CrossRef]
- Alphonce, S.; Kaale, L.D.; Rweyemamu, L.M.P. Proximate composition of fermented cassava meal “mchuchume” fortified with soya bean flour and Moringa oleifera leaves powder. J. Food Sci. Technol. 2019, 56, 3660–3667. [Google Scholar] [CrossRef]
- EFSA Panel on Dietetic Products, Nutrition, and Allergies (NDA). Scientific opinion on dietary reference values for fats, including saturated fatty acids, polyunsaturated fatty acids, monounsaturated fatty acids, trans fatty acids, and cholesterol. EFSA J. 2010, 8, 1461. [Google Scholar] [CrossRef]
- Lattimer, J.M.; Haub, M.D. Effects of dietary fiber and its components on metabolic health. Nutrients 2010, 2, 1266–1289. [Google Scholar] [CrossRef] [PubMed]
- Guichard, E. Interactions between flavor compounds and food ingredients and their influence on flavor perception. Food Rev. Int. 2002, 18, 49–70. [Google Scholar] [CrossRef]
- Kharabian-Masouleh, A.; Waters, D.; Reinke, R.F.; Reinke, R.; Rachelle Ward, R.J.; Henry, R. SNP in starch biosynthesis genes associated with nutritional and functional properties of rice. Sci. Rep. 2012, 2, 557. [Google Scholar] [CrossRef] [PubMed]
- Copeland, L.; Blazek, J.; Salman, H.; Tang, M.C. Form and functionality of starch. Food Hydrocoll. 2009, 23, 1527–1534. [Google Scholar] [CrossRef]
- Soetan, K.O.; Olaiya, C.O.; Oyewole, O.E. The importance of mineral elements for humans, domestic animals and plants-A review. Afr. J. Food Sci. 2010, 4, 200–222. [Google Scholar] [CrossRef]
- Mittal, R.; Nagi, H.P.S.; Sharma, P.; Sharma, S. Effect of processing on chemical composition and antinutritional factors in chickpea flour. J. Food Sci. Eng. 2012, 2, 180. [Google Scholar]
- Pérez-Rodríguez, M.; Dirchwolf, P.M.; Rodríguez-Negrín, Z.; Pellerano, R.G. Assessing mineral profiles for rice flour fraud detection by principal component analysis-based data fusion. Food Chem. 2021, 339, 128125. [Google Scholar] [CrossRef]
- Anjum, F.M.; Hussain, S.; Tariq, M.T. Effect of soy flour supplementation on mineral and phytate contents of unleavened flat bread (chapatis). Nutr. Food Sci. 2005, 35, 163–168. [Google Scholar] [CrossRef]
- Rusu, I.-E.; Marc, R.A.; Mureşan, C.C.; Mureşan, A.E.; Filip, M.R.; Onica, B.-M.; Csaba, K.B.; Alexa, E.; Szanto, L.; Muste, S. Advanced Characterization of Hemp Flour (Cannabis sativa L.) from Dacia Secuieni and Zenit Varieties, Compared to Wheat Flour. Plants 2021, 10, 1237. [Google Scholar] [CrossRef] [PubMed]
- Sujatha, S.J.; Ahmad, R.; Bhat, P.R. Physicochemical properties and cooking qualities of two varieties of raw and parboiled rice cultivated in the costal region of Dakshina Kannada, India. Food Chem. 2004, 86, 211–216. [Google Scholar] [CrossRef]
- Gharibzahedi, S.M.T.; Jafari, S.M. The importance of minerals in human nutrition: Bioavailability, food fortification, processing effects and nanoencapsulation. Trends Food Sci. Technol. 2017, 62, 119–132. [Google Scholar] [CrossRef]
- Gomez-Galera, S.; Rojas, E.; Sudhakar, D.; Zhu, C.M.; Pelacho, A.; Capell, T.; Christou, P. Critical evaluation of strategies for mineral fortification of staple food crops. Transgenic Res. 2010, 19, 165–180. [Google Scholar] [CrossRef] [PubMed]
- Frossard, E.; Bucher, M.; Mächler, F.; Mozafar, A.; Hurrell, R. Potential for increasing the content and bioavailability of Fe, Zn and Ca in plants for human nutrition. J. Sci. Food Agric. 2000, 80, 861–879. [Google Scholar] [CrossRef]
- Liu, X.; Song, Q.; Tang, Y.; Li, W.; Xu, J.; Wu, J.; Wang, F.; Brookes, P.C. Human health risk assessment of heavy metals in soil-vegetable system: A multi-medium analysis. Sci. Total Environ. 2013, 463–464, 530–540. [Google Scholar] [CrossRef]
- Rahman, M.M.; Asaduzzaman, M.; Naidu, R. Consumption of arsenic and other elements from vegetables and drinking water from an arsenic-contaminated area of Bangladesh. J. Hazard. Mater. 2013, 262, 1056–1063. [Google Scholar] [CrossRef]
- Rocchetti, G.; Lucini, L.; Rodriguez, J.M.L.; Barba, F.J.; Giuberti, G. Gluten-free flours from cereals, pseudocereals and legumes: Phenolic fingerprints and in vitro antioxidant properties. Food Chem. 2019, 271, 157–164. [Google Scholar] [CrossRef] [PubMed]
- Xu, B.J.; Yuan, S.H.; Chang, S.K.C. Comparative Analyses of Phenolic Composition, Antioxidant Capacity, and Color of Cool Season Legumes and Other Selected Food Legumes. J. Food Sci. 2007, 72, S167–S177. [Google Scholar] [CrossRef]
- Magalhães, S.C.Q.; Taveira, M.; Cabrita, A.R.J.; Fonseca, A.J.M.; Valentão, P.; Andrade, P.B. European marketable grain legume seeds: Further insight into phenolic compounds profiles. Food Chem. 2017, 215, 177–184. [Google Scholar] [CrossRef]
- Nithiyanantham, S.; Selvakumar, S.; Siddhuraju, P. Total phenolic content and antioxidant activity of two different solvent extracts from raw and processed legumes, Cicer arietinum L. and Pisum sativum L. J. Food Compos. Anal. 2012, 27, 52–60. [Google Scholar] [CrossRef]
- Multari, S.; Neacsu, M.; Scobbie, L.; Cantlay, L.; Duncan, G.; Vaughan, N.; Derek Stewart, D.R.; Russell, W. Nutritional and Phytochemical Content of High-Protein Crops. J. Agricultural. Food Chem. 2016, 64, 7800–7811. [Google Scholar] [CrossRef] [PubMed]
- Sreerama, Y.N.; Sashikala, V.B.; Pratape, V.M. Variability in the Distribution of Phenolic Compounds in Milled Fractions of Chickpea and Horse Gram: Evaluation of Their Antioxidant Properties. J. Agric. Food Chem. 2010, 58, 8322–8330. [Google Scholar] [CrossRef] [PubMed]
- Sreerama, Y.N.; Sashikala, V.B.; Pratape, V.M. Phenolic compounds in cowpea and horse gram flours in comparison to chickpea flour: Evaluation of their antioxidant and enzyme inhibitory properties associated with hyperglycemia and hypertension. Food Chem. 2012, 133, 156–162. [Google Scholar] [CrossRef]
- Fernandez-Orozco, R.; Frias, J.; Zielinski, H.; Muñoz, R.; Piskula, M.K.; Kozlowska, H.; Vidal-Valverde, C. Evaluation of bioprocesses to improve the antioxidant properties of chickpeas. LWT 2009, 42, 885–892. [Google Scholar] [CrossRef]
- Kalogeropoulos, N.; Chiou, A.; Ioannou, M.T.; Karathanos, V.; Hassapidou, M.; Andrikopoulos, N. Nutritional evaluation and bioactive microconstituents (phytosterols, tocopherols, polyphenols, triterpenic acids) in cooked dry legumes usually consumed in the Mediterranean countries. Food Chem. 2010, 121, 682–690. [Google Scholar] [CrossRef]
- Aguilera, O.; Estrella, I.; Benitez, V.; Esteban, R.M.; Martín-Cabrejas, M. Bioactive phenolic compounds and functional properties of dehydrated bean flours. Food Res. Int. 2011, 44, 774–780. [Google Scholar] [CrossRef]
- Dueñas, M.; Estrella, I.; Hernández, T. Occurrence of phenolic compounds in the seed coat and the cotyledon of peas (Pisum sativum L. Eur. Food Res. Technol. 2004, 219, 116–123. [Google Scholar] [CrossRef]
- Slavin, M.; Kenworthy, W.; Yu, L.L. Antioxidant Properties, Phytochemical Composition, and Antiproliferative Activity of Maryland-Grown Soybeans with Colored Seed Coats. J. Agric. Food Chem. 2009, 57, 11174–11185. [Google Scholar] [CrossRef]
- Kumar, V.; Rani, A.; Dixit, A.K.; Pratap, D.; Bhatnagar, D. A comparative assessment of total phenolic content, ferric reducing-anti-oxidative power, free radical-scavenging activity, vitamin C and isoflavones content in soybean with varying seed coat colour. Food Res. Int. 2010, 43, 323–328. [Google Scholar] [CrossRef]
- Villalobos, M.D.C.; Serradilla, M.J.; Martín, A.; Ordiales, E.; Ruiz-Moyano, S.; Córdoba, M.D.G. Antioxidant and antimicrobial activity of natural phenolic extract from defatted soybean flour by-product for stone fruit postharvest application. J. Sci. Food Agric. 2016, 96, 2116–2124. [Google Scholar] [CrossRef] [PubMed]
- Tangkhawanit, E.; Siriamornpun, S. Bioactive compounds, biological activity, and starch digestibility of dried soy residues from the soybean oil industry and the effects of hot-air drying. J. Sci. Food Agric. 2021, 102, 1719–1728. [Google Scholar] [CrossRef]
- Rocchetti, G.; Chiodelli, G.; Giuberti, G.; Masoero, F.; Trevisan, M.; Lucini, L. Evaluation of phenolic profile and antioxidant capacity in gluten-free flours. Food Chem. 2017, 228, 367–373. [Google Scholar] [CrossRef]
- Deng, G.-F.; Xu, X.-R.; Zhang, Y.; Li, D.; Gan, R.-Y.; Li, H.-B. Phenolic compounds and bioactivities of pigmented rice. Crit. Rev. Food Sci. Nutr. 2013, 53, 296–306. [Google Scholar] [CrossRef] [PubMed]
- Aalim, H.; Luo, Z. Insight into rice (Oryza sativa L.) cooking: Phenolic composition, inhibition of α-amylase and α-glucosidase, and starch physicochemical and functional properties. Food Biosci. 2021, 40, 100917. [Google Scholar] [CrossRef]
- Irakli, M.; Tsaliki, E.; Kalivas, A.; Kleisiaris, F.; Sarrou, E.; Cook, M.C. Effect of Genotype and Growing Year on the Nutritional, Phytochemical, and Antioxidant Properties of Industrial Hemp (Cannabis sativa L.) Seeds. Antioxidants 2019, 8, 491. [Google Scholar] [CrossRef]
- Šibul, F.S.; Orčić, D.Z.; Svirčev, E.; Mimica-Dukić, N.M. Optimization of extraction conditions for secondary biomolecules from various plant species. Hem. Ind. 2016, 70, 473–483. [Google Scholar] [CrossRef]
- Reddy, N.R.; Pierson, M.D. Dry Bean Tannins: A Review of Nutritional Implications. J. Am. Oil Chem. Soc. 1985, 62, 541–549. [Google Scholar] [CrossRef]
- Gilani, G.S.; Xiao, C.W.A.; Cockell, K. Impact of Antinutritional Factors in Food Proteins on the Digestibility of Protein and the Bioavailability of Amino Acids and on Protein Quality. Br. J. Nutr. 2012, 108, S315–S332. [Google Scholar] [CrossRef] [PubMed]
- Kehrere, J. Free Radicals as Mediators of Tissue Injury and Disease. Crit. Rev. Toxicol. 1993, 23, 21–48. [Google Scholar] [CrossRef]
- Balasundram, N.; Sundram, K.; Samman, S. Phenolic compounds in plants and agri-industrial by-products: Antioxidant activity, occurrence, and potential uses. Food Chem. 2006, 99, 191–203. [Google Scholar] [CrossRef]
- Vonapartis, E.; Aubin, M.P.; Seguin, P.; Mustafa, A.F.; Charron, J.B. Seed composition of ten industrial hemp cultivars approved for production in Canada. J. Food Compos. Anal. 2015, 39, 8–12. [Google Scholar] [CrossRef]
- Babu, P.V.A.; Liu, D.R.; Gilbert, E. Recent advances in understanding the anti-diabetic actions of dietary flavonoids. J. Nutr. Biochem. 2013, 24, 1777–1789. [Google Scholar] [CrossRef] [PubMed]
- Wang, T.; He, F.; Chen, G. Improving bioaccessibility and bioavailability of phenolic compounds in cereal grains through processing technologies: A concise review. J. Funct. Foods 2014, 7, 101–111. [Google Scholar] [CrossRef]
- Jahreis, G.; Brese, M.; Leiterer, M.; Schaefer, U.; Boehm, V. Legume flours: Nutritionally important sources of protein and dietary fiber. Ernahr. Umsch. 2016, 63, 36–42. [Google Scholar] [CrossRef]
- Nikolić, N.C.; Todorović, Z.B.; Stojanović, J.S.; Veličković, D.T.; Lazić, M.L. The Fatty Acids and Acylglycerols in Chickpea and Lentil Flour; Agro FOOD Industry Hi Tech: Milano, Italy, 2013; p. 20. [Google Scholar]
- Shariati-Ievari, S.; Ryland, D.; Edel, A.; Nicholson, T.; Suh, M.; Aliani, M. Sensory and physicochemical studies of thermally micronized chickpea (Cicer arietinum) and green lentil (Lens culinaris) flours as binders in low-fat beef burgers. J. Food Sci. 2016, 81, S1230–S1242. [Google Scholar] [CrossRef]
- Summo, C.; De Angelis, D.; Rochette, I.; Mouquet-Rivier, C.; Pasqualone, A. Influence of the preparation process on the chemical composition and nutritional value of canned purée of kabuli and Apulian black chickpeas. Heliyon 2019, 5, e01361. [Google Scholar] [CrossRef] [PubMed]
- Kaur, R.; Prasad, K. Technological, processing and nutritional aspects of chickpea (Cicer arietinum)—A review. Trends Food Sci. Technol. 2021, 109, 448–463. [Google Scholar] [CrossRef]
- Kosson, R.; Czuchajowska, Z.; Pomeranz, Y. Smooth and wrinkled peas. 2. Distribution of protein, lipid, and fatty acids in seed and milling fractions. J. Agric. Food Chem. 1994, 42, 96–99. [Google Scholar]
- Fahmi, R.; Ryland, D.; Sopiwnyk, E.; Malcolmson, L.; Shariati-Ievari, S.; McElrea, A.; Barthet, V.; Blewett, H.; Aliani, M. Effect of Revtech thermal processing on volatile organic compounds and chemical characteristics of split yellow pea (Pisum sativum L.) flour. J. Food Sci. 2021, 86, 4330–4353. [Google Scholar] [CrossRef]
- Dandachy, S.; Mawlawi, H.; Obeid, O. Effect of processed chickpea flour incorporation on sensory properties of mankoushe zaatar. Foods 2019, 8, 151. [Google Scholar] [CrossRef]
- Dahmer, A.M.; Rigo, A.A.; Steffens, J.; Steffens, C.; Carrão-Panizzi, M.C. Thermal treatment for soybean flour processing with high-quality color and reduced Kunitz trypsin inhibitor. J. Food Process Eng. 2018, 41, e12925. [Google Scholar] [CrossRef]
- Osuna, M.B.; Judis, M.A.; Romero, A.M.; Avallone, C.M.; Bertola, N.C. Improvement of fatty acid profile and studio of rheological and technological characteristics in breads supplemented with flaxseed, soybean, and wheat bran flours. Sci. World J. 2014, 2014, 401981. [Google Scholar] [CrossRef] [PubMed]
- Prabakaran, M.; Lee, K.-J.; An, Y.; Kwon, C.; Kim, S.; Yang, Y.; Ahmad, A.; Kim, S.-H.; Chung, I.-M. Changes in soybean (Glycine max L.) flour fatty-acid content based on storage temperature and duration. Molecules 2018, 23, 2713. [Google Scholar] [CrossRef] [PubMed]
- Dahmer, A.M.; Rigo, A.A.; Valduga, E.; Steffens, J.; Steffens, C.; Carrão-Panizzi, M.C. Quality characteristics of rotative-type biscuits free of gluten prepared with soya flour and cassava starch. Curr. Nutr. Food Sci. 2020, 16, 176–184. [Google Scholar] [CrossRef]
- Li, S.; Jin, Z.; Hu, D.; Yang, W.; Yan, Y.; Nie, X.; Lin, J.; Zhang, Q.; Gai, D.; Ji, Y.; et al. Effect of solid-state fermentation with Lactobacillus casei on the nutritional value, isoflavones, phenolic acids and antioxidant activity of whole soybean flour. LWT 2020, 125, 109264. [Google Scholar] [CrossRef]
- Gül, M.K.; Egesel, C.Ö.; Turhan, H. The effects of planting time on fatty acids and tocopherols in chickpea. Eur. Food Res. Technol. 2008, 226, 517–522. [Google Scholar] [CrossRef]
- Werz, O.; Seegers, J.; Schaible, A.M.; Weinigel, C.; Barz, D.; Koeberle, A.; Allegrone, G.; Pollastro, F.; Zampieri, L.; Grassi, G.; et al. Cannflavins from hemp sprouts, a novel cannabinoid-free hemp food product, target microsomal prostaglandin E2 synthase-1 and 5-lipoxygenase. PharmaNutrition 2014, 2, 53–60. [Google Scholar] [CrossRef]
- Siano, F.; Moccia, S.; Picariello, G.; Russo, G.L.; Sorrentino, G.; Di Stasio, M.; La Cara, F.; Volpe, M.G. Comparative Study of Chemical, Biochemical Characteristic and ATR-FTIR Analysis of Seeds, Oil and Flour of the Edible Fedora Cultivar Hemp (Cannabis sativa L.). Molecules 2019, 24, 83. [Google Scholar] [CrossRef]
- Lančaričová, A.; Kuzmiaková, B.; Porvaz, P.; Havrlentová, M.; Nemeček, P.; Kraic, J. Nutritional quality of hemp seeds (Cannabis sativa L.) in different environments. J. Cent. Eur. Agric. 2021, 22, 748–761. [Google Scholar] [CrossRef]
- Khatoon, S.; Gopalakrishna, A.G. Fat-soluble nutraceuticals and fatty acid composition of selected Indian rice varieties. J. Am. Oil Chem. Soc. 2004, 81, 939–943. [Google Scholar] [CrossRef]
- Monks, J.L.F.; Vanier, N.L.; Casaril, J.; Berto, R.M.; de Oliveira, M.; Gomes, C.B.; de Carvalho, M.P.; Dias, A.R.G.; Elias, M.C. Effects of milling on proximate composition, folic acid, fatty acids and technological properties of rice. J. Food Compos. Anal. 2013, 30, 73–79. [Google Scholar] [CrossRef]
- Aleman, R.S.; Morris, A.; Prinyawiwatkul, W.; Moncada, M.; King, J.M. Physicochemical properties of Frontière rice flour and its application in a gluten-free cupcake. Cereal Chem. 2022, 99, 303–315. [Google Scholar] [CrossRef]
- Zubair, M.; Anwar, F.; Ashraf, M.; Uddin, M.K. Characterization of high-value bioactives in some selected varieties of Pakistani rice (Oryza sativa L.). Int. J. Mol. Sci. 2012, 13, 4608–4622. [Google Scholar] [CrossRef] [PubMed]
- Sadigova, M.K.; Buhovets, V.A.; Belova, M.V.; Rysmuhambetova, G.E. Technology solutions in case of using chickpea flour in industrial bakery. Sci. Study Res. Chem. Chem. Eng. Biotechnol. Food Ind. 2018, 19, 169–180. [Google Scholar]
- Kris-Etherton, P.M.; Hecker, K.D.; Binkoski, A.E. Polyunsaturated fatty acids and cardiovascular health. Nutr. Rev. 2004, 62, 414–426. [Google Scholar] [CrossRef] [PubMed]
- Gogus, U.; Smith, C. n-3 Omega fatty acids: A review of current knowledge. Int. J. Food Sci. Technol. 2010, 45, 417–436. [Google Scholar] [CrossRef]
- Feng, D.; Xia, A.; Liao, Q.; Nizami, A.-S.; Sun, C.; Huang, Y.; Zhu, X.; Zhu, X. Carbon cloth facilitates semi-continuous anaerobic digestion of organic wastewater rich in volatile fatty acids from dark fermentation. Environ. Pollut. 2021, 272, 116030. [Google Scholar] [CrossRef] [PubMed]
- Yu, L.; Li, G.; Li, M.; Xu, F.; Beta, T.; Bao, J. Genotypic variation in phenolic acids, vitamin E and fatty acids in wholegrain rice. Food Chem. 2016, 197, 776–782. [Google Scholar] [CrossRef]
Disclaimer/Publisher’s Note: The statements, opinions and data contained in all publications are solely those of the individual author(s) and contributor(s) and not of MDPI and/or the editor(s). MDPI and/or the editor(s) disclaim responsibility for any injury to people or property resulting from any ideas, methods, instructions or products referred to in the content. |
© 2023 by the authors. Licensee MDPI, Basel, Switzerland. This article is an open access article distributed under the terms and conditions of the Creative Commons Attribution (CC BY) license (https://creativecommons.org/licenses/by/4.0/).