Article

Wind Loads on Overhead Sign Structures: A Comparative Study

1
Windstorm Impact, Science and Engineering (WISE) Research Lab, Louisiana State University, 3230 H Patrick F. Taylor Hall, Baton Rouge, LA 70803, USA
2
O.H. Hinsdale Wave Research Laboratory, School of Civil and Construction Engineering, Oregon State University, 3550 SW Jefferson Way, Corvallis, OR 97331, USA
*
Author to whom correspondence should be addressed.
Appl. Sci. 2023, 13(3), 1682; https://doi.org/10.3390/app13031682
Submission received: 12 December 2022 / Revised: 19 January 2023 / Accepted: 25 January 2023 / Published: 28 January 2023
(This article belongs to the Special Issue Design of Special Structures for Lateral Loads)

Abstract

:
Road signs are prone to extreme winds that cause significant damage. Overhead sign structures can disrupt traffic and cause harm to the traveling public if a failure occurs under extreme wind conditions. In this paper, we employ Computational Fluid Dynamics (CFD) in a comparative study to understand the aerodynamics of standard, porous, and curved signs. The study shows the viability of porous and curved overhead boards for lessening aerodynamic loads, which can mini-mize damage and enhance safety on roadways. Porous overhead signs can decrease the drag forces; however, the size of the openings is a vital parameter in reducing wind loads. Small and uniform perforations lead to higher drag forces, compared to larger ones, under the same porosity ratio. Introducing porosity to a solid panel moves the vorticity region further downstream, reducing the magnitude of pressures on the leeward side and decreasing the drag force. However, curved panels further enhanced the force reduction.

1. Introduction

The increased sea surface temperature equates to a rise in the probability of wind-related damages [1]. Over the past few decades, the United States has witnessed several catastrophic hurricanes, such as Katrina (2005), Rita (2005), Gustav (2008), Isaac (2012), Nate (2017), Michael (2018), and Laura (2020) [2]. Increased high climatic events may be due to the warming trends experienced globally [3]. Climate change impacts ecosystems and coastal communities [4,5]. Hurricanes lead to significant damage to the infrastructure due to the strong winds. The ten most destructive tropical cyclones in U.S. history occurred in the past thirty years [6]. The increased hurricane activity could be related to climate change [7,8]. Increased hurricane activity brings significant damage to the infrastructure. Post-disaster investigations have reported substantial damage and failures of road signs, large-size billboards, and overhead sign structures due to windstorms. Damage to billboards can be local at the connecting bolts between the cladding plate and the supporting structure, damage to the plate skin due to intense local end pressures on the plate, damage to the supporting frame, local buckling of the supporting column, or failure of its foundation bolt connection [9]. Failures in most road signs and billboards do not pose an imminent danger to human life, whereas overhead sign structures do.
Various combinations of panels and supports can form an overhead sign structure. The sign panels consist of either standard aluminum flat signs that vary in height to base ratios or variable message signs (VMS) that have a thickness to them and display a digital message. Sign supports vary from monotube cantilever poles that span across two lanes to a bridge truss that can span across several lanes of traffic.
A cantilevered sign support consists of a single vertical column and a horizontal beam commonly referred to as the mast arm, that displays and supports sign panels. For most roadways, cantilevered support structures are a good option and are the most popular type of overhead sign structure throughout the United States for several reasons. One reason is that the cost of a cantilevered support structure is less than 40 percent of the cost of a larger overpass supports. Another reason is that it has only one singular vertical upright, increasing motorist safety by reducing the probability of collision [10]. However, as roadways continue to add more lanes, the horizontal beam of the support structure continues to extend further over traffic, testing the limits of the cantilevered sign structure. Another issue due to the extension of the horizontal beam is the increased setback distance of the upright from the roadway (for safety reasons). This increase in length results in a higher moment at the critical connections, increased flexibility, and wind-induced oscillations that cause severe fatigue, making cantilever structures vulnerable to vibrations and fatigue cracking by wind forces [11].
Highway sign structures are susceptible to wind-induced fatigue loads induced by flutter, buffeting, vortex-shedding, and vibrations [12]. During the past decades, these structures have shown problems associated with fatigue performance. The problems amplify by defective welds, aging material, and harsh environmental conditions [13]. There have been numerous studies to reduce fatigue loads under normal wind conditions; however, there is less research on minimizing the amount of force on the panel.
The literature contains extensive research on bluff body aerodynamics, but few studies have explored the effects of wind loads acting on sign panels on overhead sign supports. A fundamental aspect of analyzing sign panels subject to wind loads is understanding the flow interaction with the structure and its impact on the induced forces and pressures. Accurate prediction of these wind forces and characteristics is critical to minimizing wind loads on the sign panels. For this reason, there is a need to analyze the effects of adding porous qualities and curvature to overhead panels under turbulent wind conditions using Computational Fluid Dynamics (CFD).
The proposed research employs Computational Fluid Dynamics (CFD) to analyze and compare the forces and interactions of airflow acting on and around a standard, solid sign panel, three different cases of porous panels, and a curved panel to compare drag forces. The results are a stepping stone in utilizing porous or curved panels along roadways to minimize the wind forces and reduce the chances of failure of overhead sign structures under extreme winds while demonstrating that CFD is viable for engineering applications.

2. Literature Review

Most current studies dealing with fluid/air flow experiments can complement their findings using CFD through various software. These flows follow partial differential equations representing conservation laws for mass, momentum, and energy [14]. CFD uses algebraic equations to replace these partial differential equation systems to be solved by a computer. Visual representations such as pressure distributions, velocity vectors, and path lines of airflow are obtained through CFD, giving an insight into flow patterns that are challenging to study using conventional techniques such as wind tunnel testing [15]. The accuracy of the CFD analysis depends on the efficiency of finite element and finite volume methods; in other words, the accuracy and quality of the results depend on the mesh [16].
Beneberu (2008) studied a sign support structure to calculate the pressure, stress, and bending moments using CFD. The investigations involved simulations under different flow conditions that consisted of steady laminar, transient laminar, and steady turbulent flows at a velocity of 5 m/s. Beneberu (2008) obtained the bending moment by applying the resulting forces at the center of the horizontal beam of the sign support structure. A comparison of the different flow cases shows that the steady laminar flow drag is higher than its turbulent counterpart. The reason is that, in turbulent flow, all parts of the structure are not under simultaneously uniform pressures (lack of correlation). Additionally, the drag under transient-laminar flow is less than that of steady-laminar flow; the transient flow had a limited time. However, the drag force under the transient-laminar flow would be equal to that of the steady laminar flow if analyzed for an infinite amount of time [11].
An in-depth study considered 16 simulations of single panels of varying sizes: side-by-side signs and back-to-back [17]. Through the simulations, they obtained non-dimensional and dimensional mean pressure differences and the total wind force for each panel. CFD simulations revealed that the characteristics of the flow around the sign panel were relatively the same for all the simulations studied. High pressures on the windward face are due to the decelerating approaching flow. The leeward face shows that the pressure distribution was not uniform, but the pressure levels inside the vorticity region were lower than the ones observed upstream. Pressure values slowly recovered in the vortex region while the streamwise velocity gradually reduced as it continued downstream. The separation of the boundary layer around the panel resulted in amplified turbulent kinetic energy [17].
Constantinescu et al. (2007b) conducted an additional experimental study that put air holes in the sign panel with an aspect ratio of 1:2. The holes’ area represented only 2.5% of the total surface area. They generated a high-quality mesh with millions of elements and prism layers and compared the simulation results to those for a solid panel under the same conditions. The results revealed the flow field remained symmetrical, vertically and horizontally, with two large vortices forming on both sides of the symmetry plane. The presence of holes created the formation of two small vortices on the leeward face. The pressure contours show the larger values on the windward face. Behind the panel, the presence of holes increased the mean pressure levels in the vortex region. The lowest pressure levels are observed just behind the openings due to the increased velocity of the airflow coming through these holes. This flow resulted in a smaller force on the panel [17].
When it comes to wind engineering and discussing the airflow around objects, streamlined bodies and bluff bodies are two of the most common examples. These two bodies are classified based on the features of the field they produce when introduced to airflow. A streamlined body, such as an airfoil, is characterized by a thin boundary layer attached to the entire surface, with a narrow and generally steady wake. Conversely, bluff bodies such as buildings and sign panels are characterized by substantial boundary layer separation, with larger and unsteady wakes [18,19]. The outer region of the separated flow features a thin layer of high shear and vorticity. This region is known as the free shear layer, similar to the boundary layer on an airfoil but not attached to a surface [20]. Shape optimization of bluff bodies can significantly change the aerodynamic forces [21].

3. Methodology

CFD is the primary tool used in this study to gather information and drive conclusions based on airflow analysis around different sign panels. This study examines sign panels with a 1:2 height-to-width ratio.

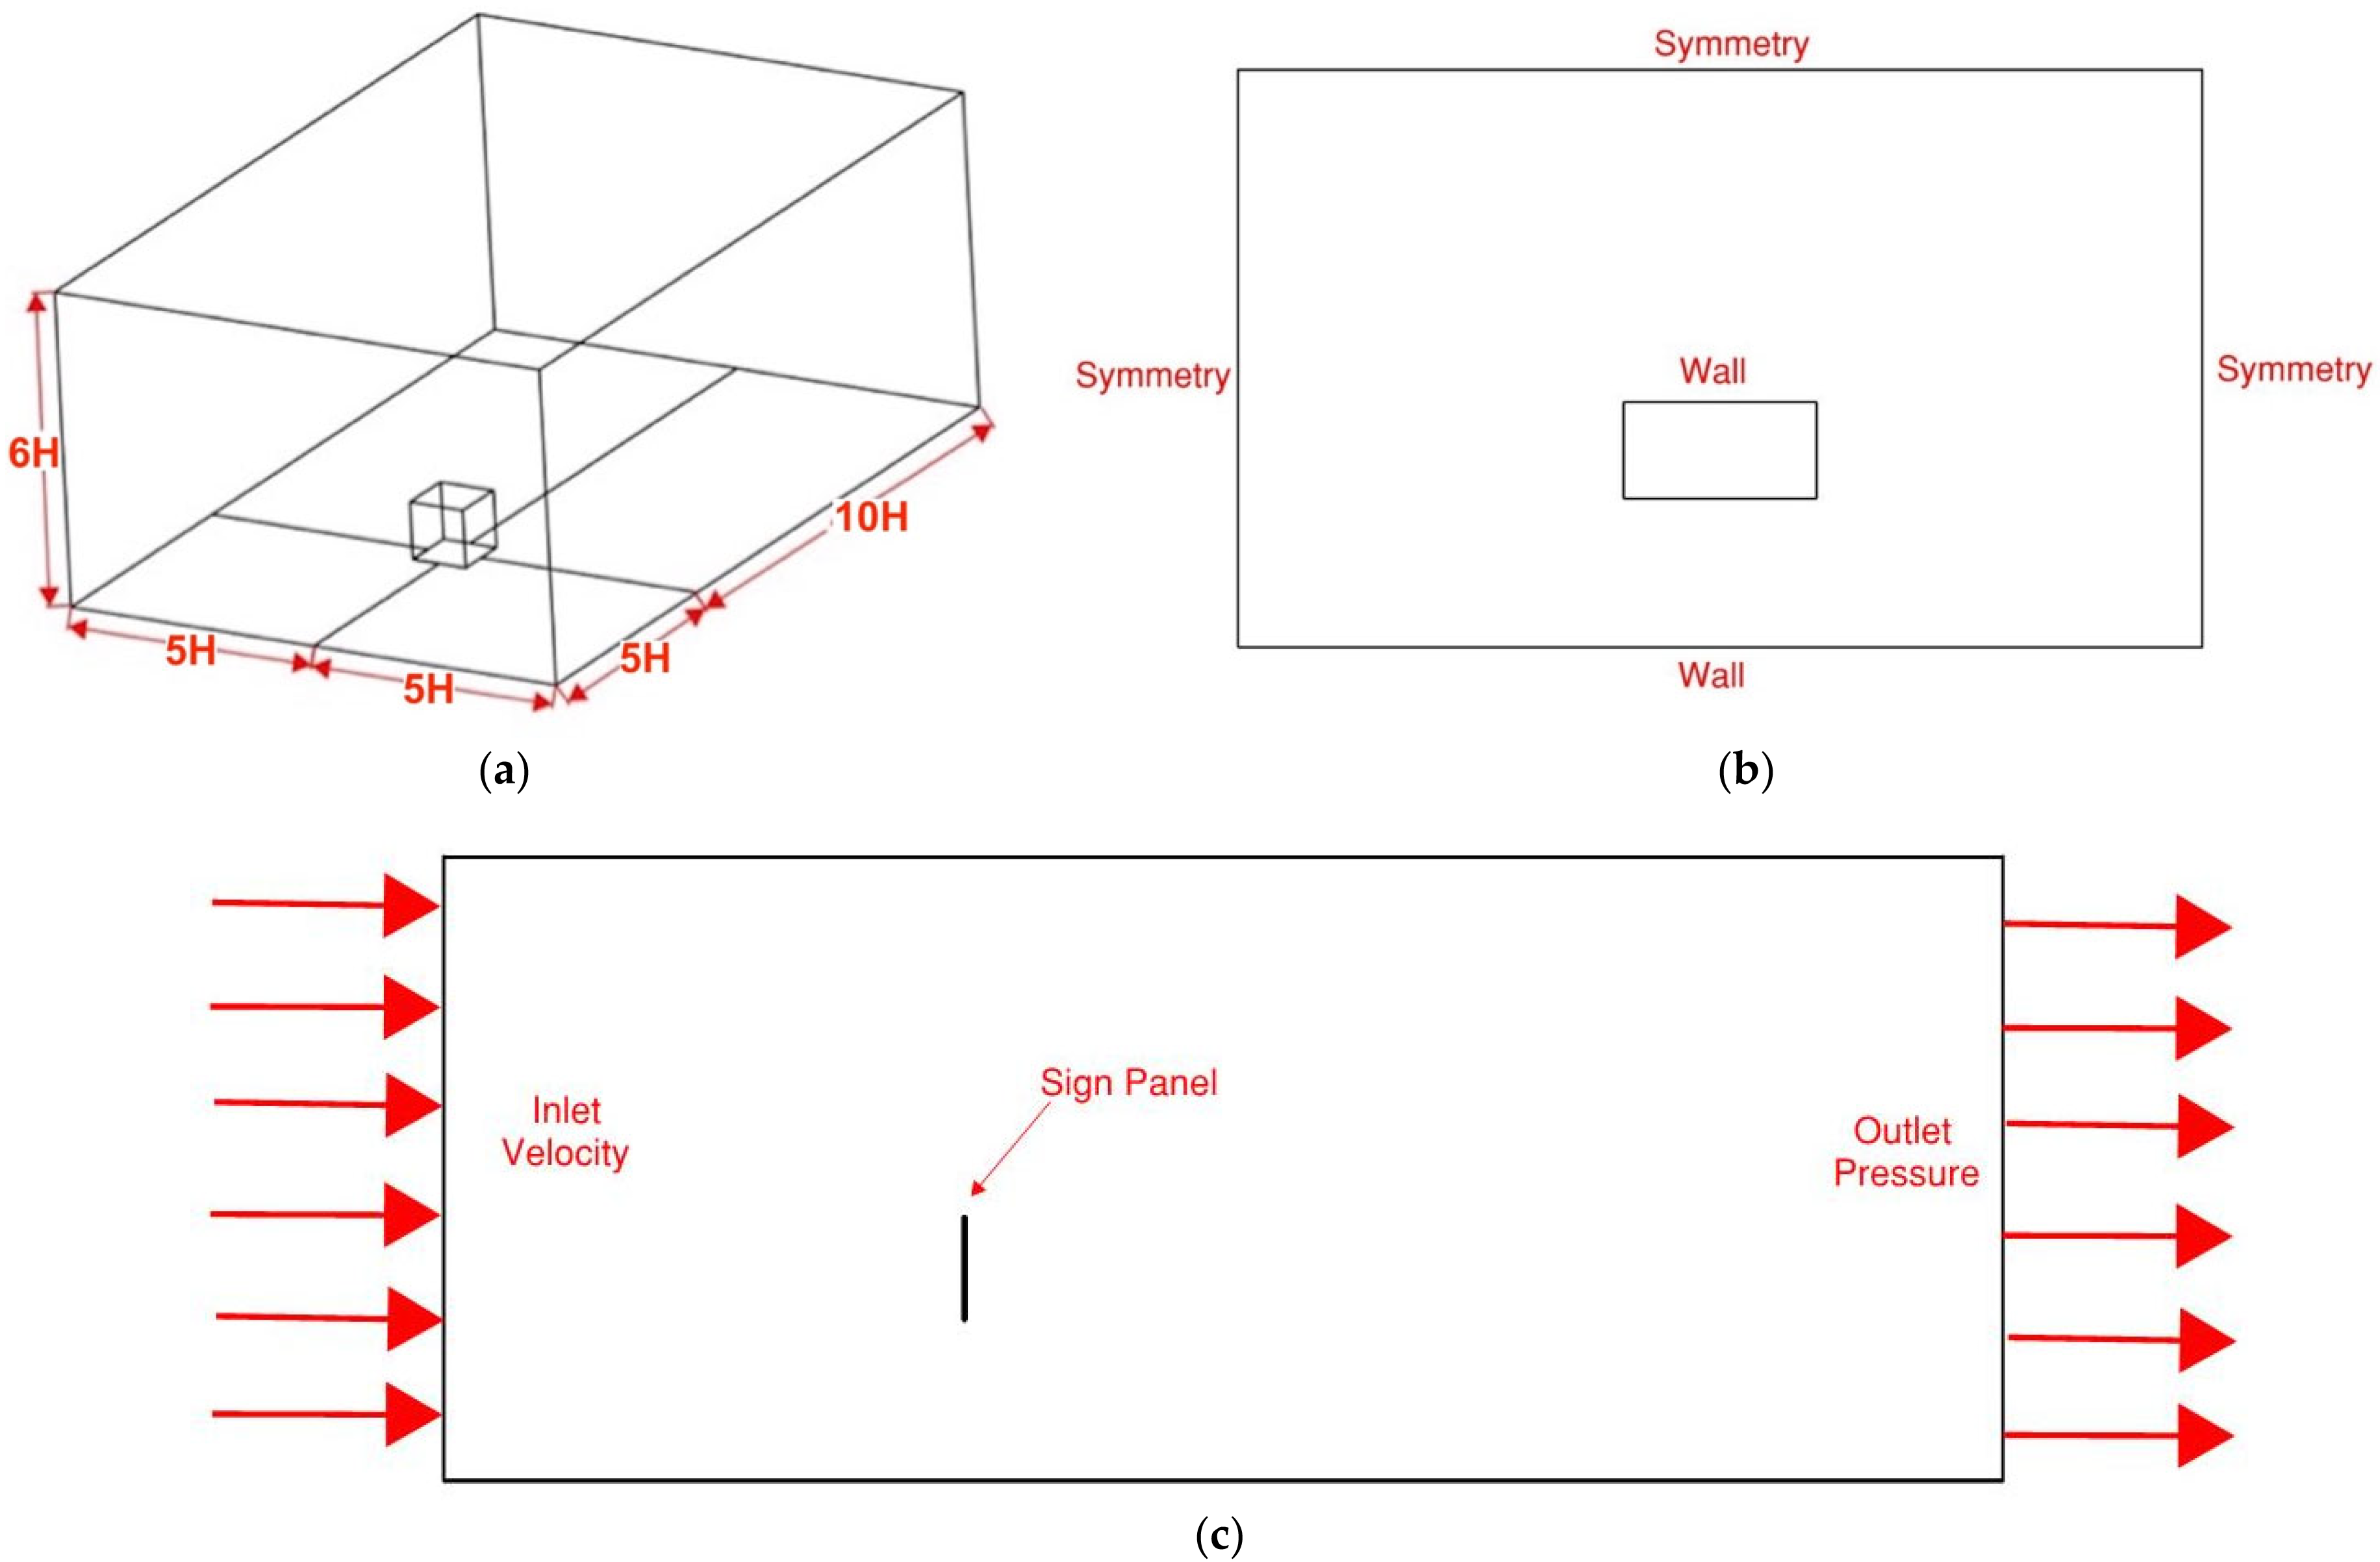
3.1. Computational Domain
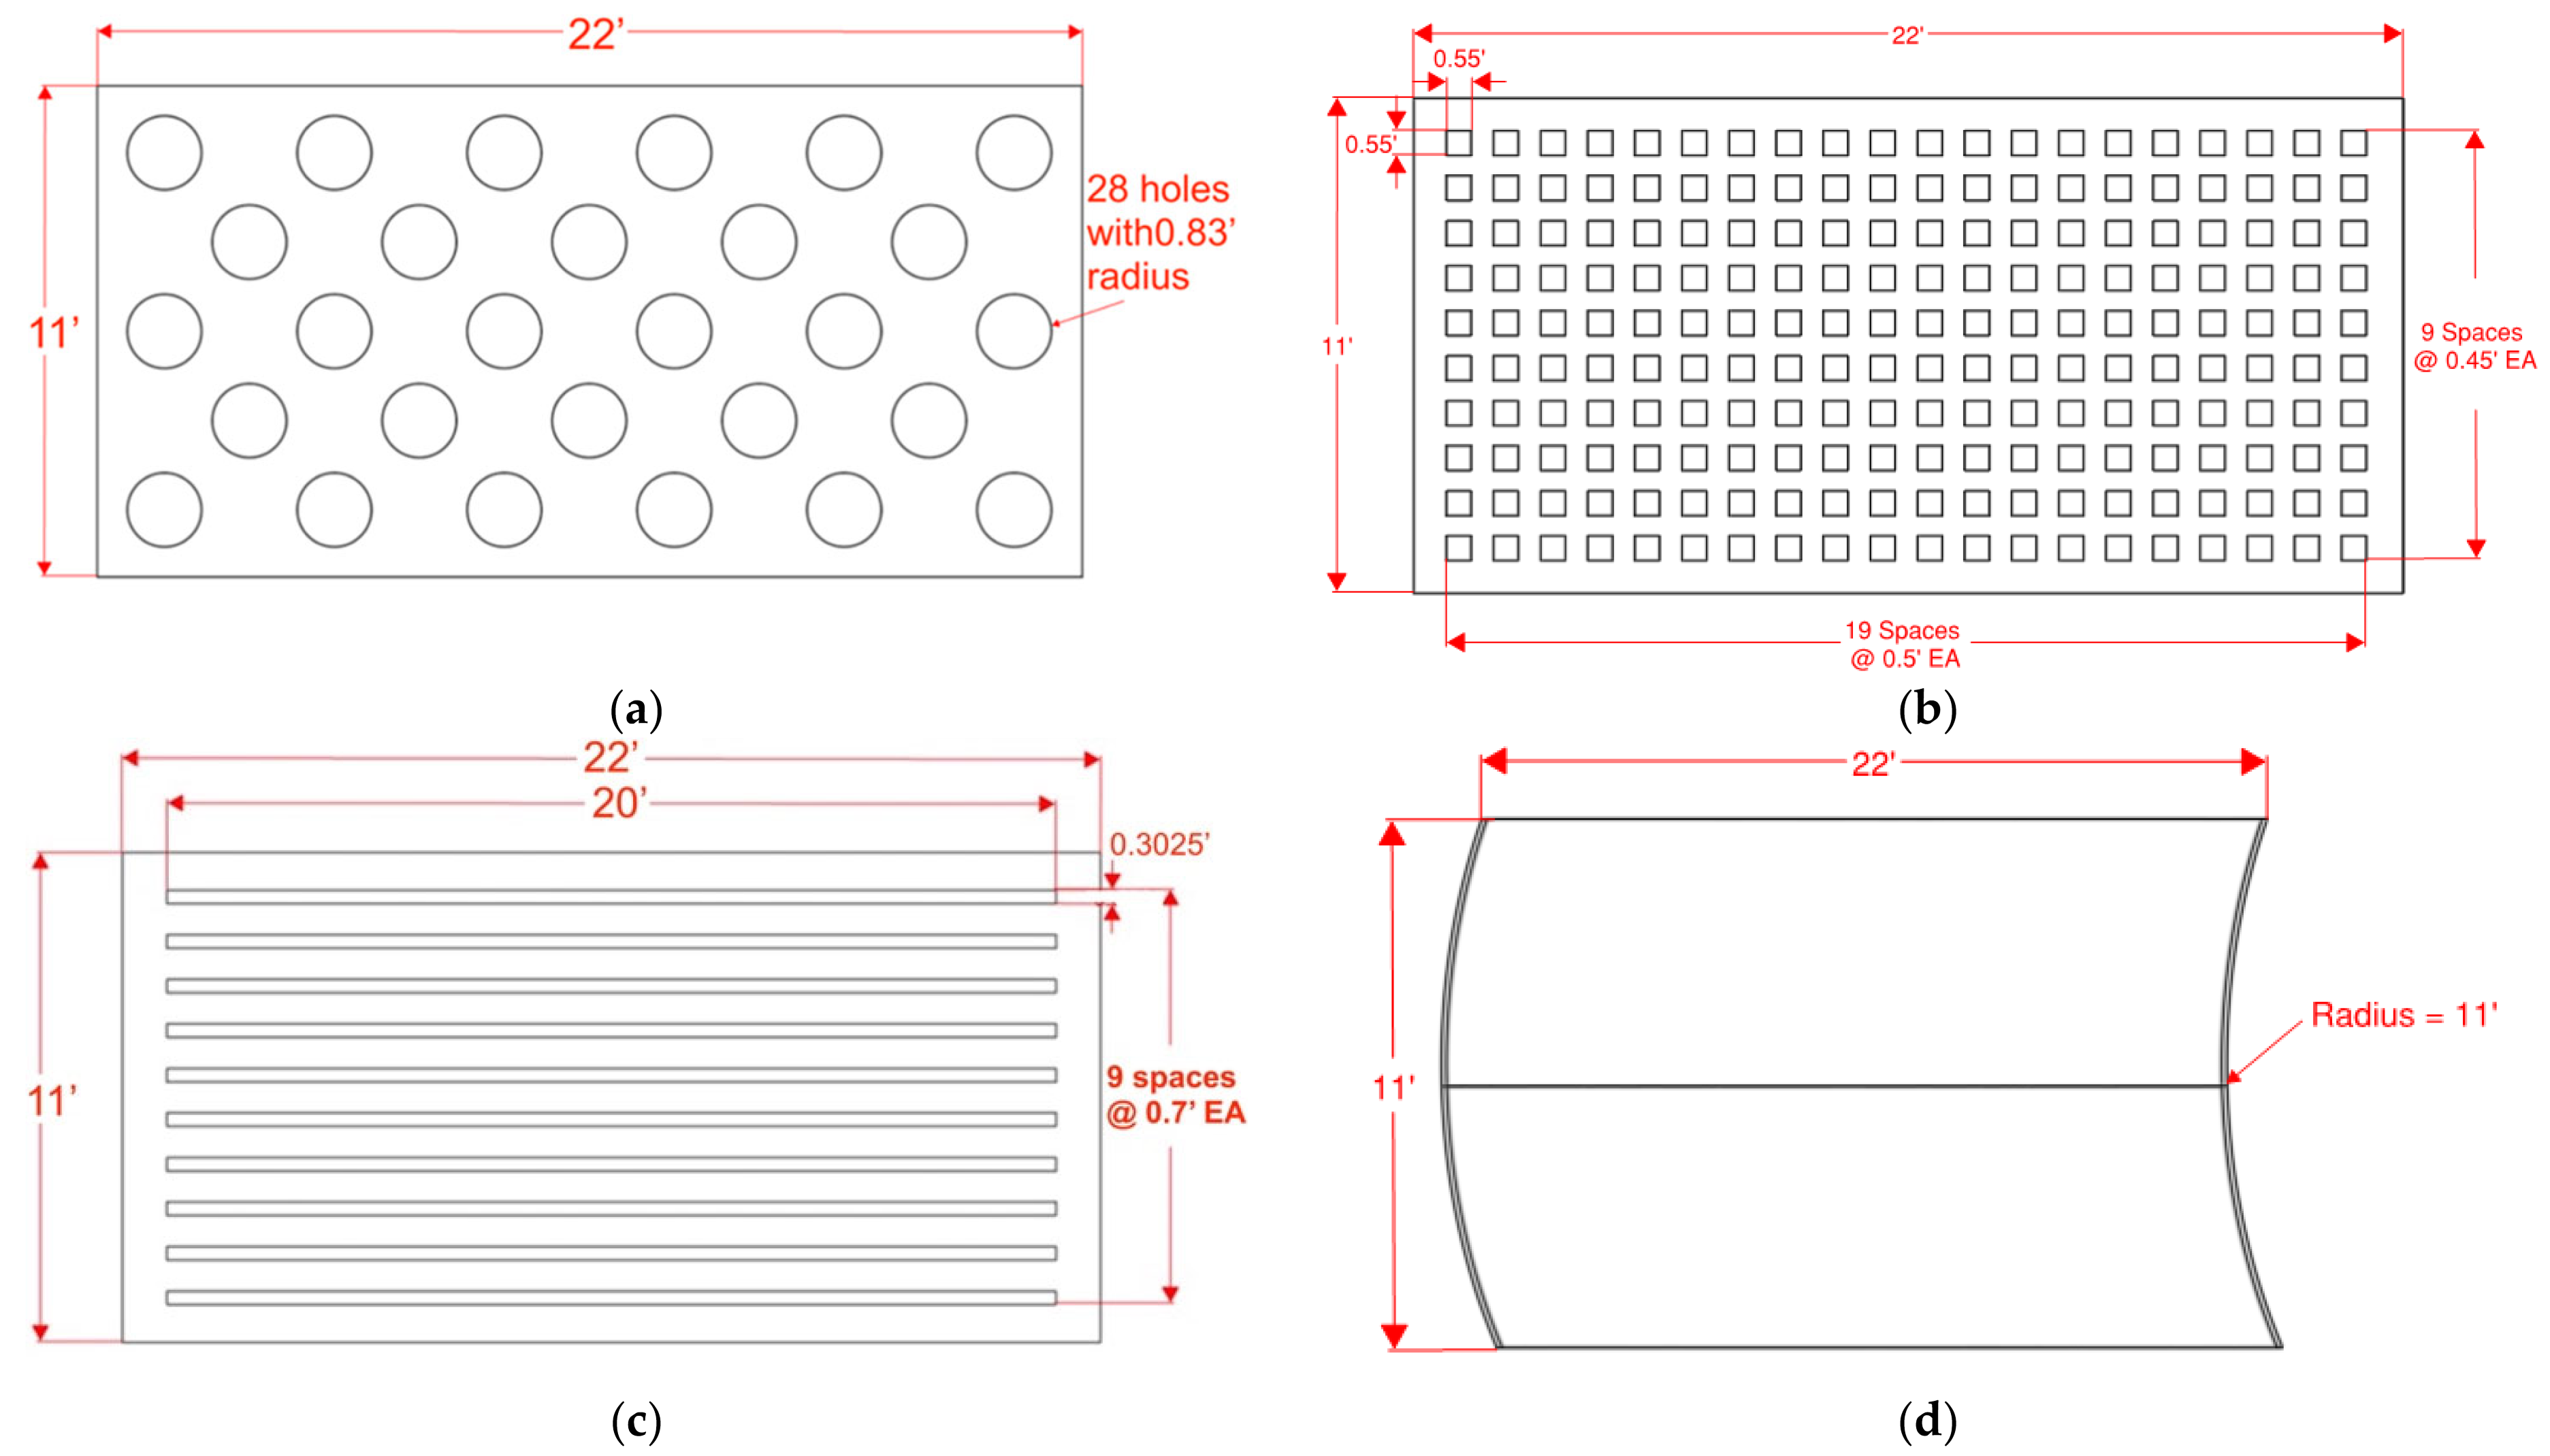
Figure 1 shows the computational domain that serves as a virtual wind tunnel with the boundary conditions for the airflow. We followed the approach employed in CFD analysis of low-rise buildings to determine the appropriate dimensions of the computational domain. The optimal domain size for CFD analysis is proportional to the dimensions of an object with height H, as shown in Figure 1a. The computational domain has three main parts: the inlet that represents the beginning of the wind tunnel and will simulate the source of airflow, the interior walls, and the outlet. The domain has a height of 6H, a width of 5H, and a length of 15H. The sign panel is placed 17 feet above the ground.
A CFD analyst should define the boundary conditions after the geometric model becomes available. Boundary conditions represent a set of constraints to boundary value problems in computational fluid dynamics. They should be defined correctly. The inlet boundary condition will model the air entering the domain and describe its mean velocity and turbulence intensity profile. A user-defined function specifies the velocity and turbulence profiles over height. The mean wind velocity used in this study at a 10m is 10m/s or around 22 mph with a turbulence intensity of 20%, to be consistent with the provisions in the American Society of Civil Engineers (ASCE 7-22: Minimum Design Loads and Associated Criteria for Buildings and Other Structures) [22]. It is worth mentioning that the ASCE 7-22 provisions utilize wind tunnel testing under a mean wind speed of 10 m/s. The inflow profile represents an open terrain with a parameter alpha of 0.178 [23]. An outlet boundary condition defines the outflow condition for the airflow pressure at the end of the enclosure. When the flow velocity and pressure information are unknown, outflow boundary conditions may model the flow at the exit [24]. The outlet assumes zero streamwise gradients for all airflow variables except the exit pressure.
A wall boundary condition bounds regions within the enclosure to describe the flow velocity. The wall boundaries are the ground and the sign panel. There are several wall boundary conditions: no-slip, slip, moving, and rotating. We assigned the ground and sign panel to a no-slip wall boundary condition. The no-slip wall boundary condition sets all velocity components to zero at the wall.
The symmetric boundary condition models a zero-shear slip wall and is used to reduce the extent of the computational model to an asymmetric subsection of the enclosure [24]. For this study, the sidewalls and the top of the enclosure geometry have symmetric boundary conditions.

3.2. Panels

Panels with porosity will affect the vortex region on the leeward side. Incorporating porosity does not eliminate the vortex region in the wake; however, porosity can reduce the overall vortex size while moving it farther downstream, away from the leeward face of the panel. With an introduction of a porosity factor, Kp, which is dependent on the solidity of the plate,   δ , being the ratio of the solid area, the drag coefficient for that of a panel with porous qualities can be represented as follows [20].
C D , δ = C D   K p
when the panel has a porous quality that is not linearly related to the solidity of the plate, δ, an approximate expression for the porosity factor, Kp, can be obtained by the following equation [20].
K p = 1 1 δ 2
The above equation is best for bluff bodies with a height-to-width ratio between 0.2 to 5 [20]. The first set of geometry to be made is the standard, solid sign panel. The sign panel is the first because the height and width of the object influence the geometry of the domain that surrounds it. The geometry of the standard sign panel in this study represents a commonly used overhead sign structure. The sign panel in this study is 11 feet in height and 22 feet in width, giving it a height-to-width ratio of 1:2. The thickness has an arbitrary value of 2 inches (50 mm).
There are five cases to be examined: a single case of a standard sign panel, three panels with porous characteristics, and a single case of a curved panel (Figure 2). All sign panels have similar outer dimensions. Panels with porous characteristics were given a porosity value of 25% but with different geometric variations of how the porosity is applied. Given that the size of the standard panel is 11 ft × 22 ft, with a surface area of 242 ft2, each porous panel will have a solid area of 181.5 ft2 and a porous area of 60.5 ft2. The variations of the porous cases are as follows: the first case has 28 large staggered holes with a radius of 0.83 feet or 10 inches; the second case has 200 uniform square holes with a height and width of 0.55 feet; the last case has 10 rectangular slots at 0.3025 feet or 3 2 3 inches in height and spans across the panel at 20 feet in width with equal spacing of 0.7 feet or 8   2 5 inches.
The last panel geometry to discuss is one with a curvature applied to it. Since sign panels need to be read and easily seen by motorists, introducing curvature to the sign panel should not affect the legibility of the information displayed. Like the other sign panels, this panel has a width and height of 11 feet by 22 feet like the other panels in this study, but with a radius of 11 feet applied to the entire panel. A radius of 11 feet is a realistic and applicable curvature based on the panel’s height.

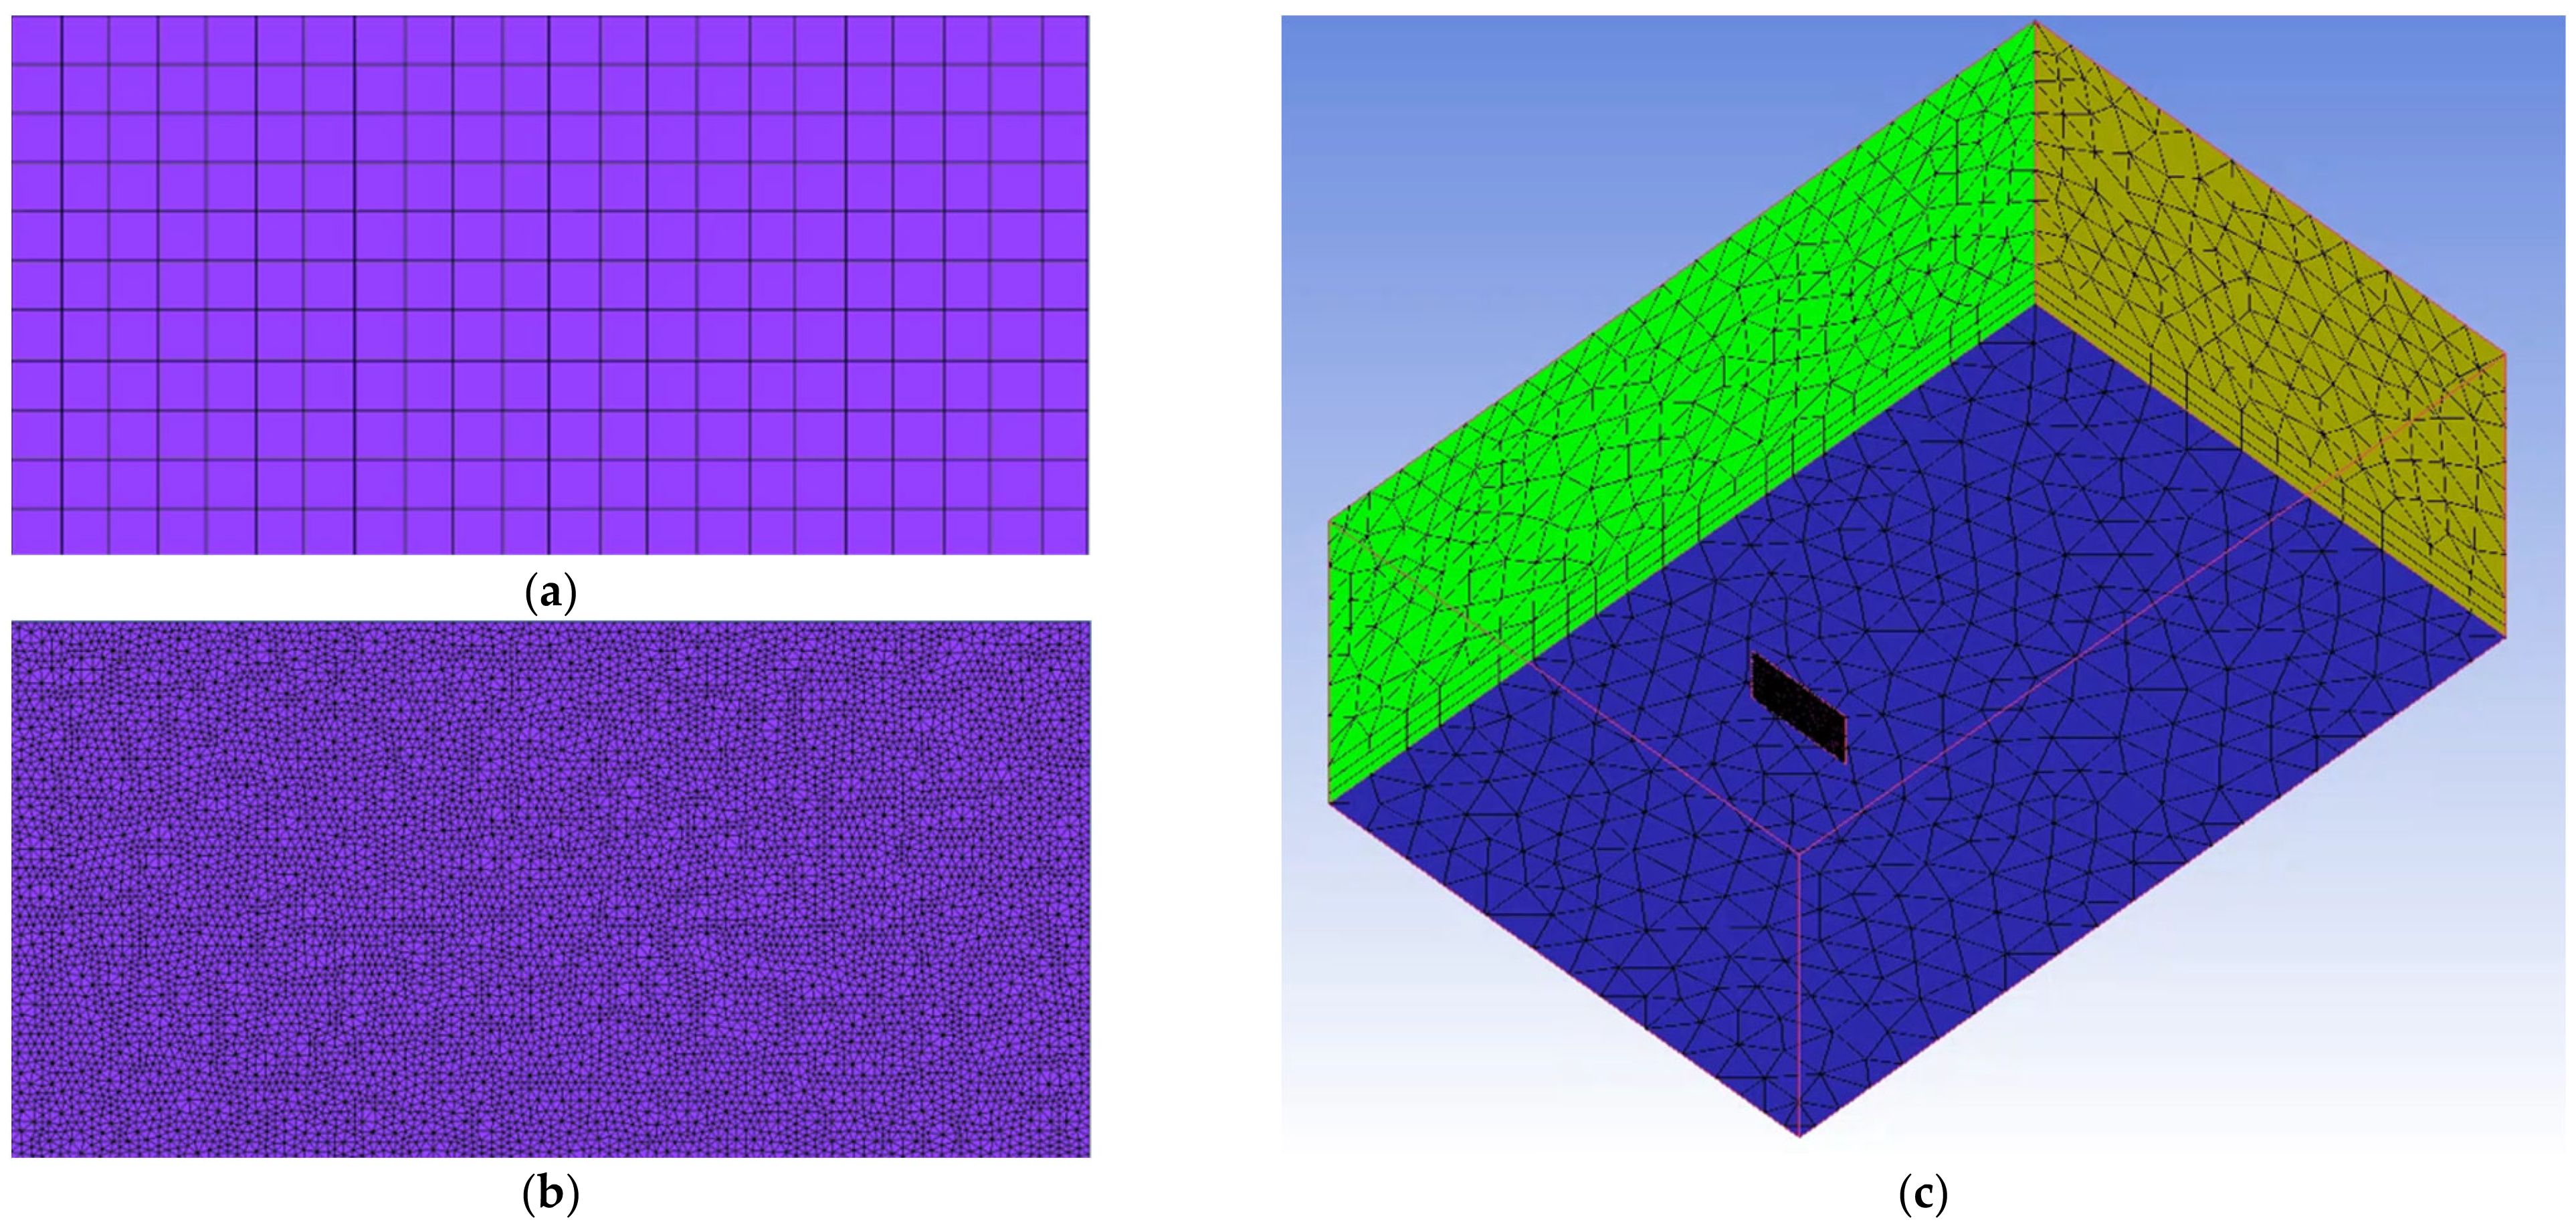
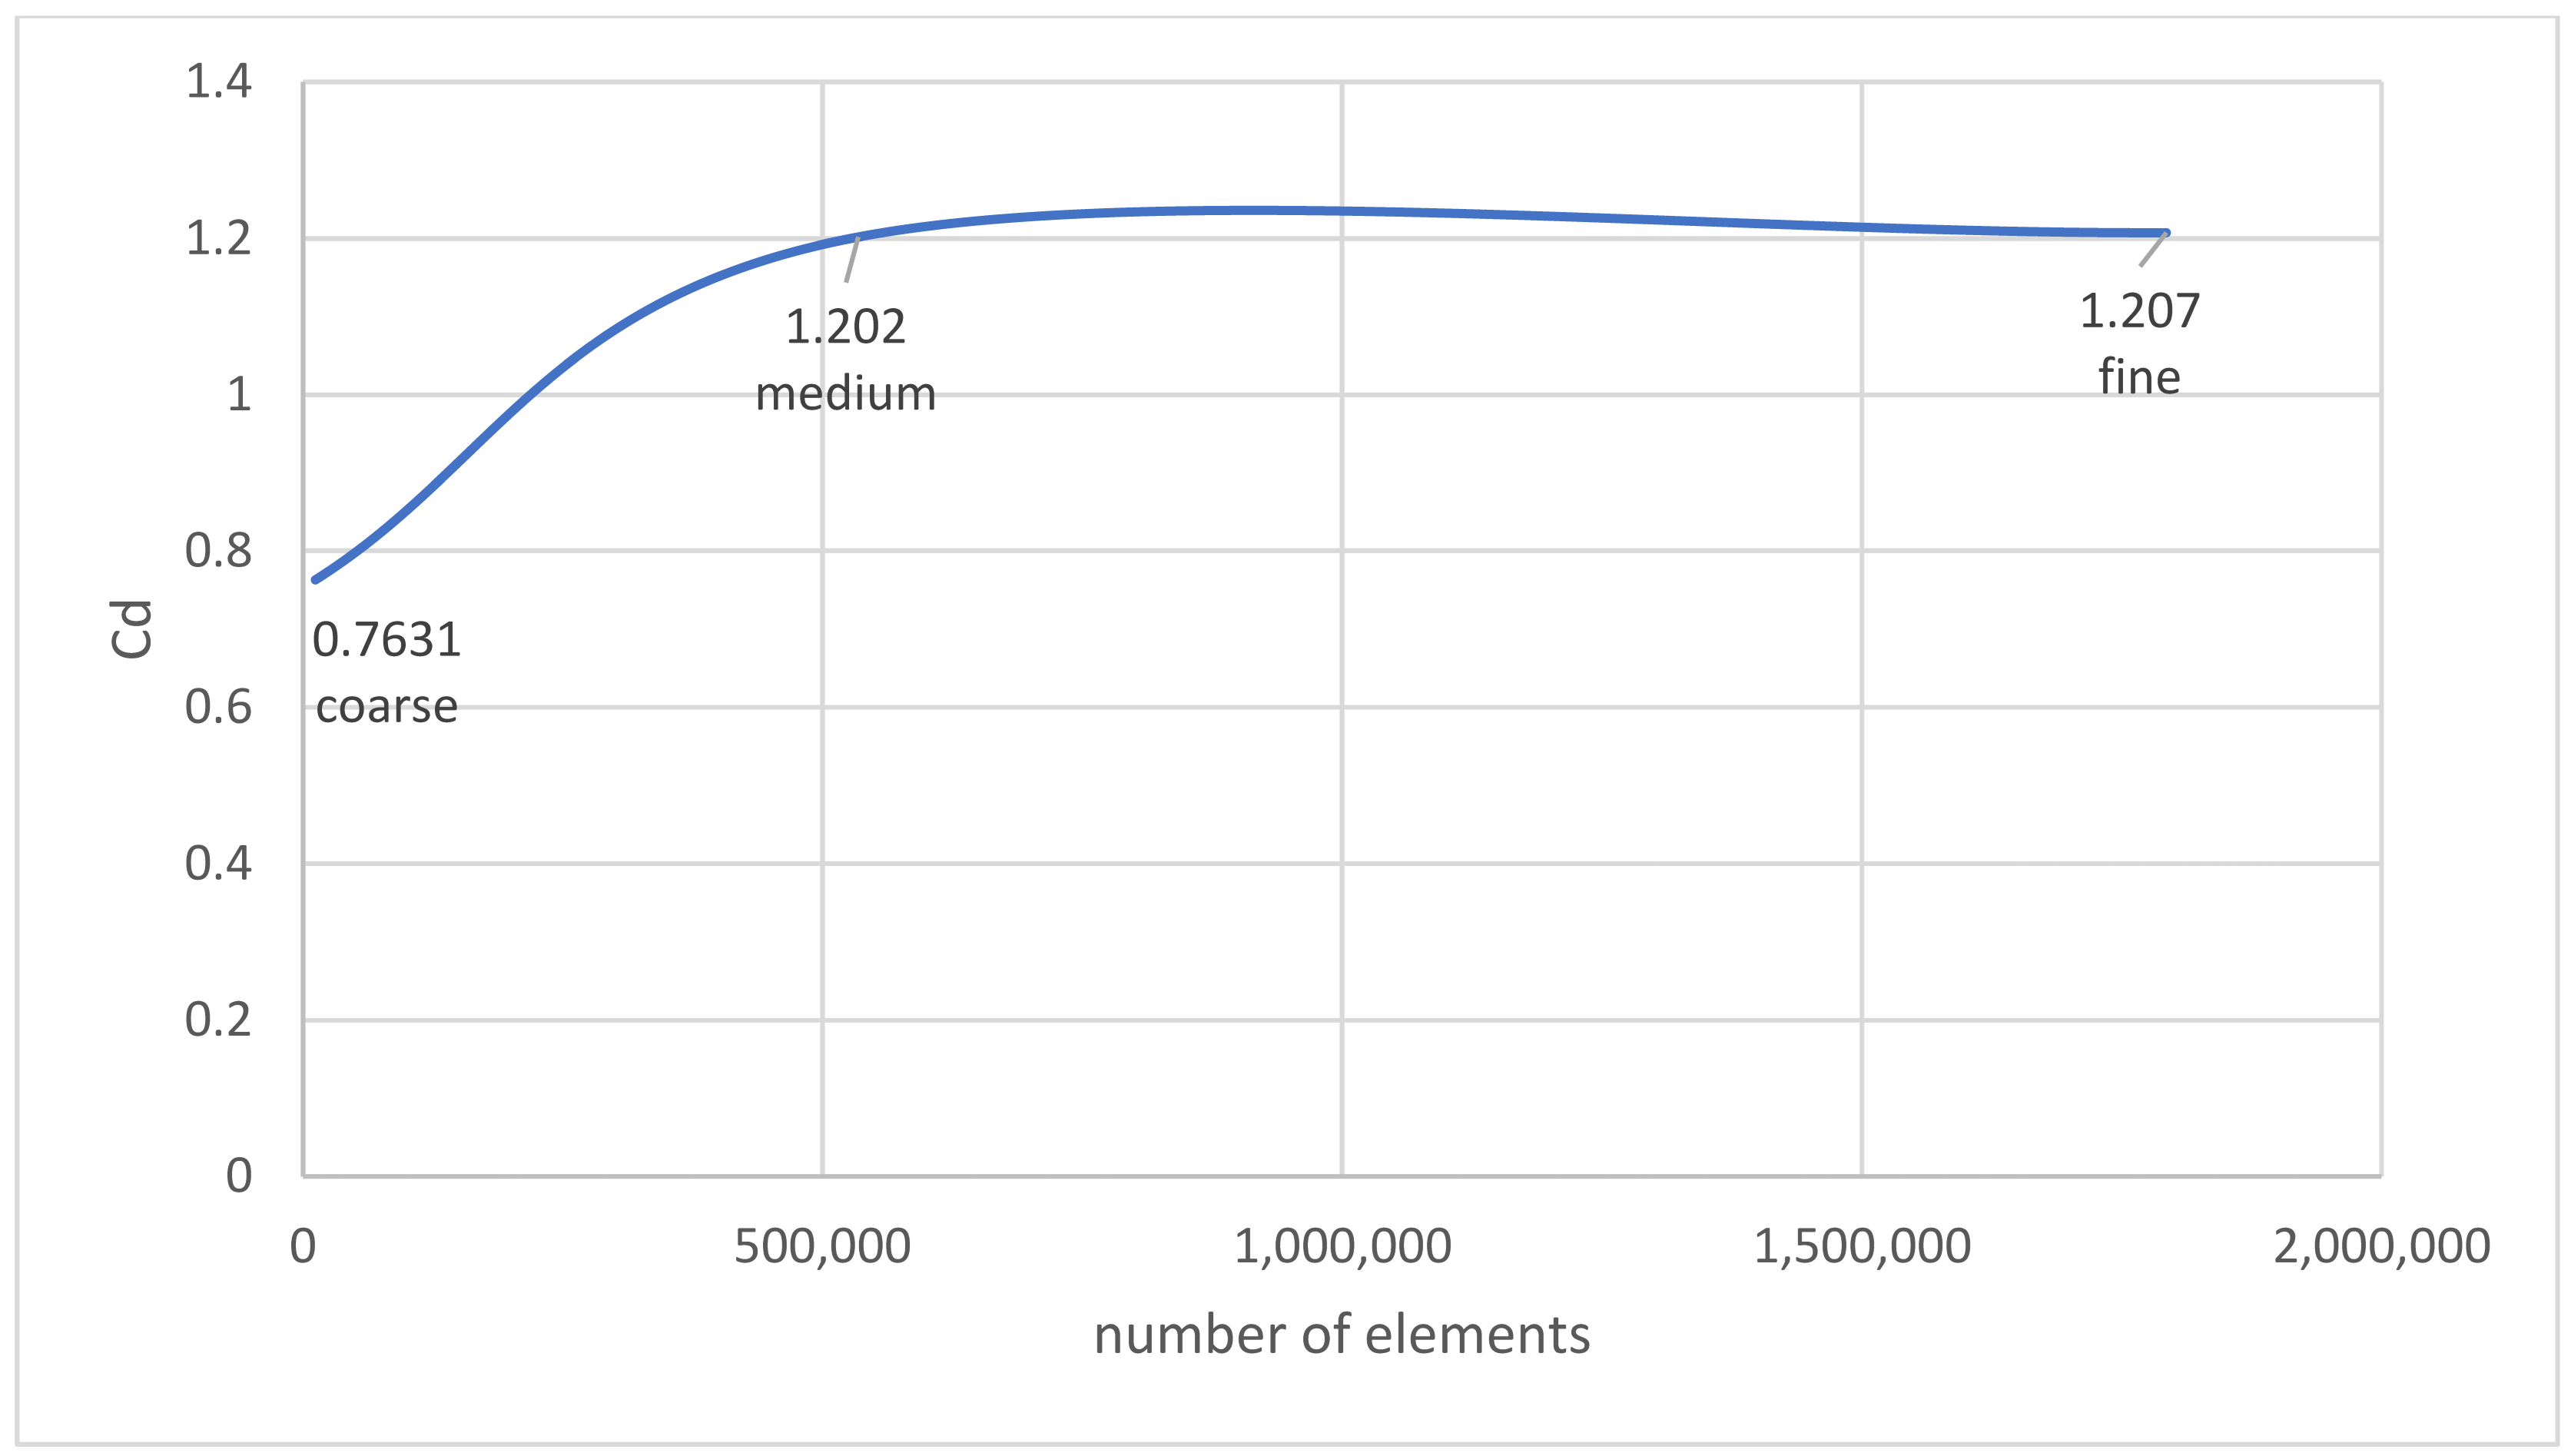
Grid-Independence Study

Because the mesh quality impacts the accuracy of the simulation results, creating the mesh for the CFD simulation is often the most time-consuming step. There are several approaches to creating a mesh, depending on the type of CFD simulation. A mesh breaks down the surfaces of a 2-D model or the faces and the volume of a 3-D model into a large grid where each small part of the grid combines to make the physical model. These small parts of the model are known as elements.
For this study, the surfaces of the enclosure and the sign panel will be meshed, as well as the volume within the domain surrounding the sign panel. Surface elements and volume elements use the same element type, but the surface elements are in 2-D, and the volume elements n example of a graph plotting the points of the q (Figure 3).
Delaunay refinement is a good practice, following a quality check of the mesh. Delaunay refinement operates by using algorithms based on maintaining Delaunay triangulation. The technique maximizes the minimum angles within poor elements to meet constraints on triangle quality and size [25]. Additional larger-angle meshing elements can be created by adding a vertex to poor-quality ones. This process improves the quality of the initial mesh.
Along with the convergence of residual values, the solution needs to be independent of mesh resolution. A grid-independence study should establish the appropriate mesh element size and validate the accuracy of the solution. A grid-independence study, also commonly referred to as mesh convergence, is a CFD method related to how small the elements need to be to ensure that the results of the CFD solution are not affected by the changing of the mesh element size.
Performing a grid-independence study is a straightforward process and should be done for every CFD simulation. The initial coarse mesh is put through the CFD simulation, ensuring the monitor points reach a steady state. The results from the simulation are then analyzed, and a physical quantity of interest is investigated.
After the initial mesh satisfies defined convergence conditions, the elements should be refined, and the exact simulation should be conducted on the refined mesh to ensure that the residual error converges. The quantity of interest is gathered from the refined mesh and compared to the initial mesh. However, the grid independence study aims at identifying a coarse mesh that gives a solution invariant with the finer meshes.
The best way to check for mesh convergence is to plot a graph of a certain quantity versus the total number of elements. After the quantity of interest converges, the mesh with the minimum number of elements, but with converged and acceptable results can be used to reduce the simulation time. A minimum of three mesh cases should be examined to prove the convergence of a quantity of interest.
Figure 4 shows an example of a graph plotting the points of the quantity of interest and the number of mesh elements for different meshes of a grid-independence study (three meshes: coarse, medium, and fine). Once the quantity of interest value converges at a singular value, mesh convergence is satisfied, and an efficient element size can be selected for the simulation. For this study, the grid independence study was performed by developing three different meshes that vary in coarse, medium, and fine mesh element sizes. For each mesh, the varying element sizes were created by defining maximum element sizes for the surface, volume, and global elements. When creating the initial mesh, the maximum global element size is defined first with octree meshing. Octree meshing is a method that considers how tetrahedral elements are created to help the computer organize the points of an object efficiently. The octree process starts by picking the element of an entity that is smaller than the specified maximum element size and subdividing. The internal subdivision process looks at the defined element sizes at each entity and compares them to the maximum element size set. If the element size on each entity is smaller than the maximum element size, the maximum element size is divided by two and compared back to the defined element size of the entity. This is repeated until the maximum element size is less than or equal to the size of the entity elements. Therefore, it is common practice to designate the element sizes as powers of two to simplify the mesh generation process and create an efficient mesh. For this study, the quantity of interest we will use is the drag coefficient and drag forces acting on the panel. From previous research and methodology, these values can be compared to determine the accuracy of the mesh. As previously mentioned in this study, a bluff body under turbulent conditions is expected to have a drag coefficient of around 1.2. This is the value to look for to determine the accuracy of the meshes throughout the grid-independence study. As the elements throughout the mesh get refined through the grid-independence study, the results will become more independent of the number of elements.
Figure 4 shows that as the mesh is refined, the drag force and drag coefficient values between meshes have a converging value. These converging values prove to mesh independence and provide the most efficient size elements for the rest of the meshes to be created in this study.

4. Results

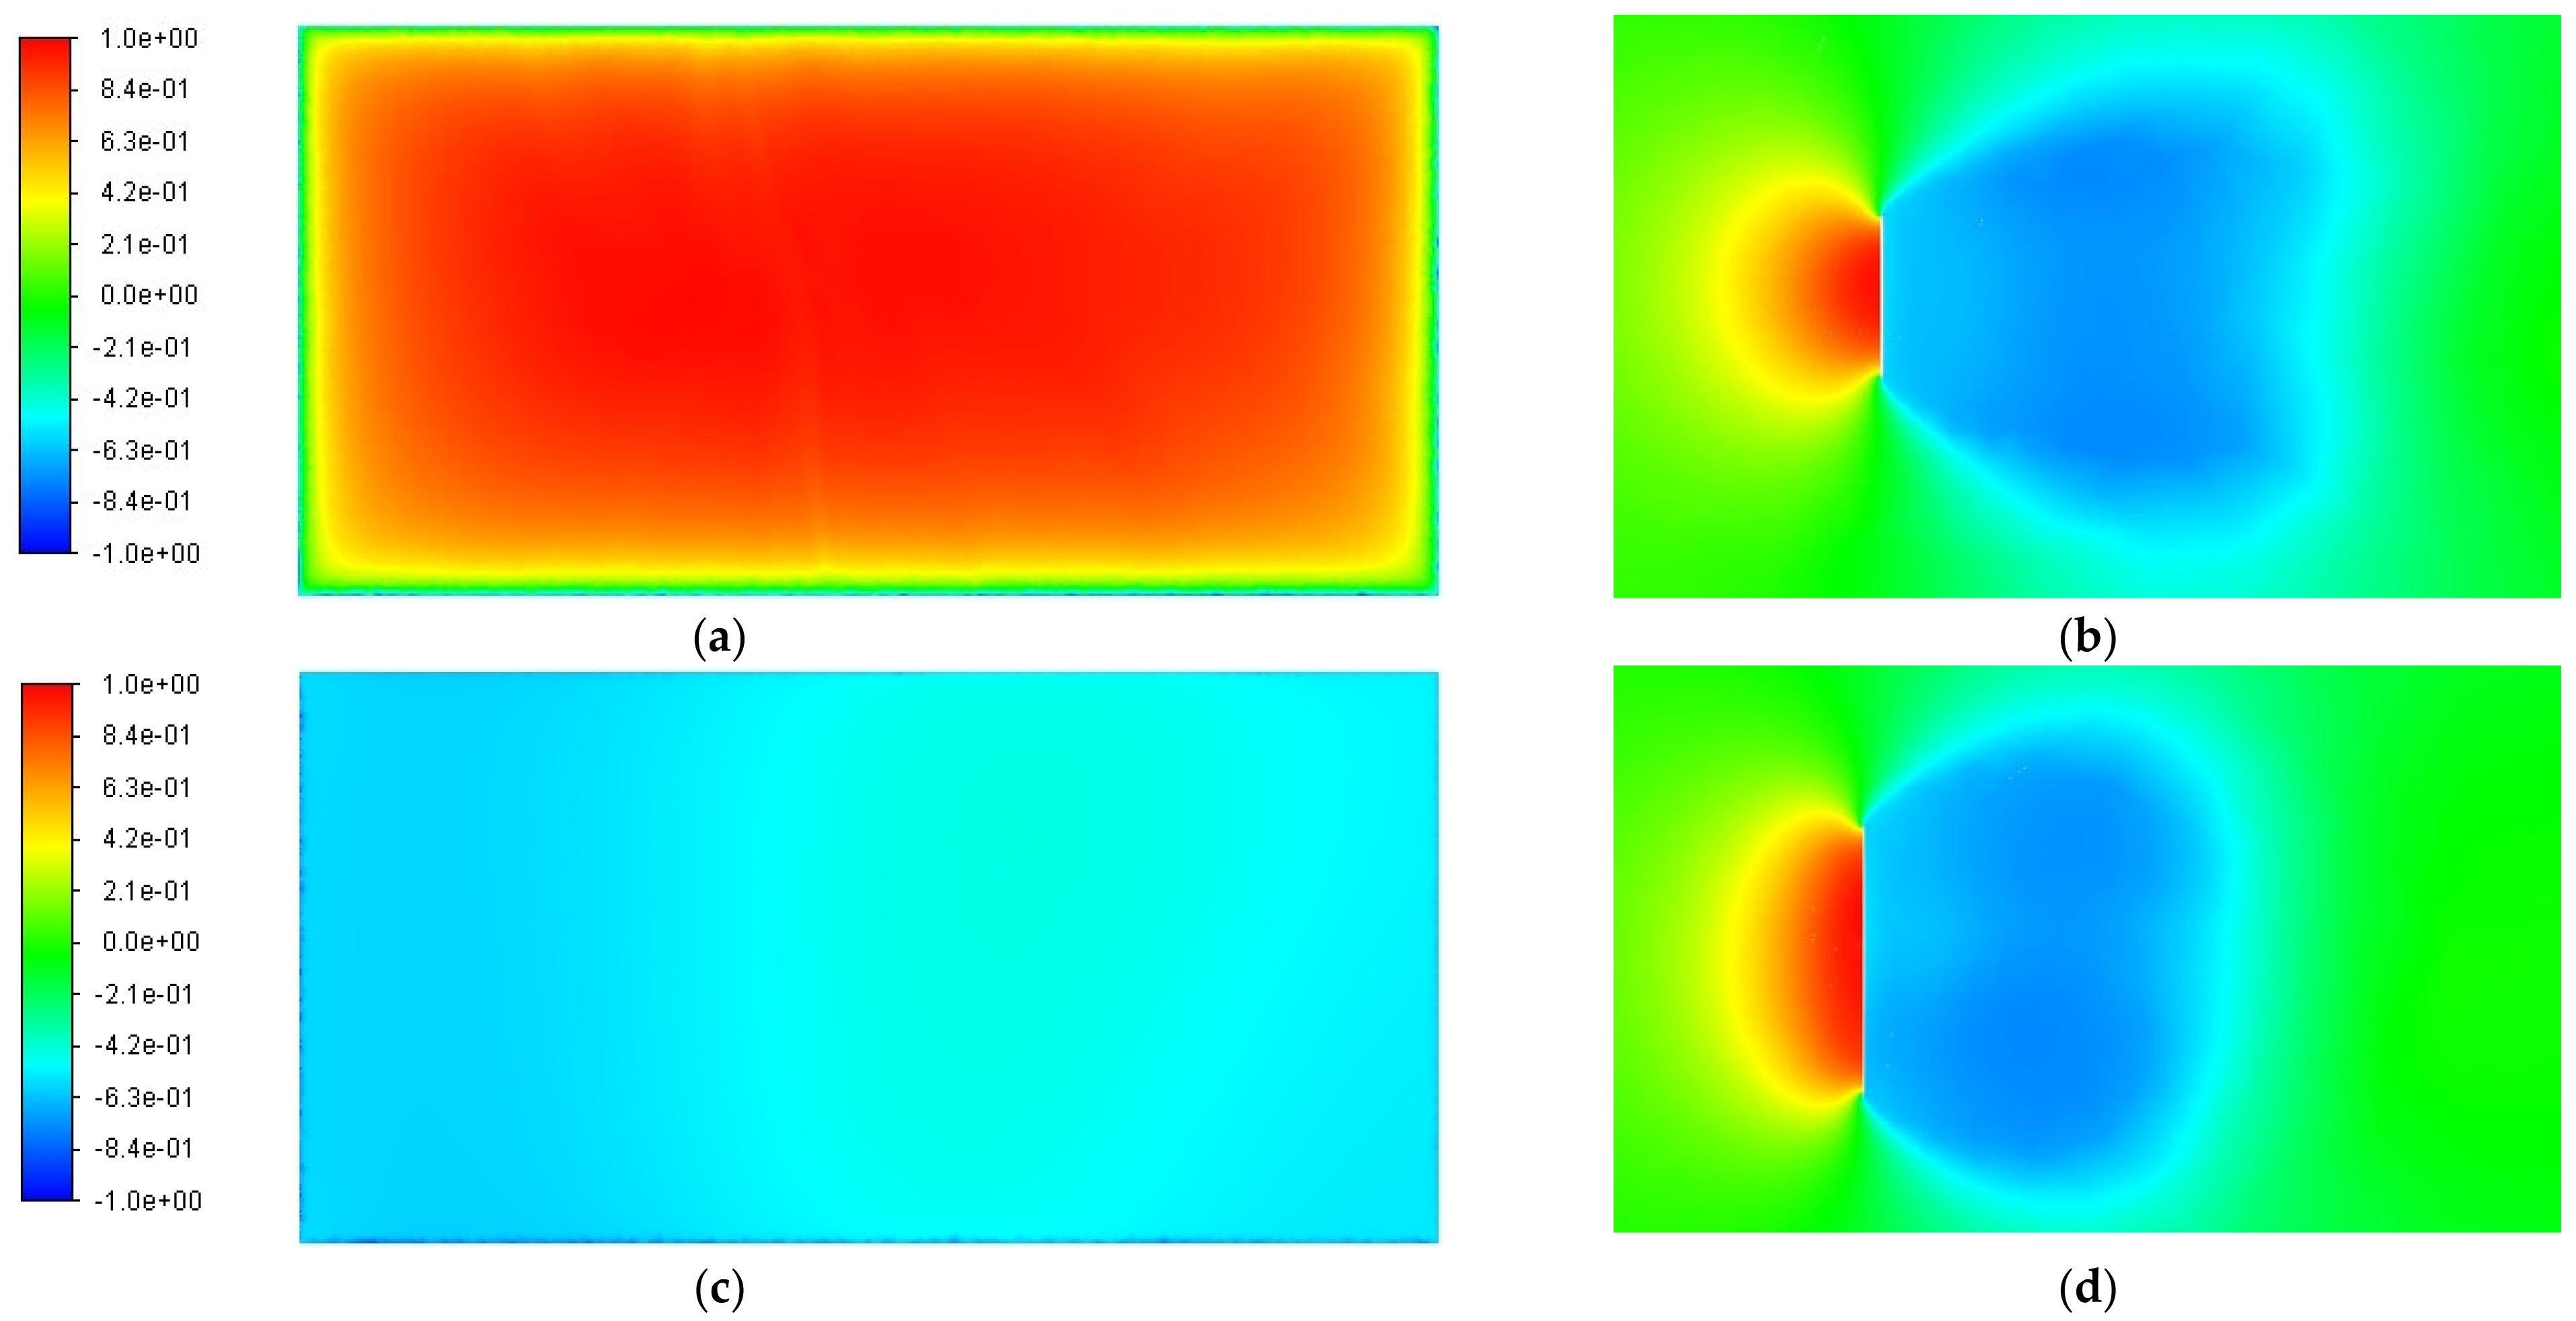
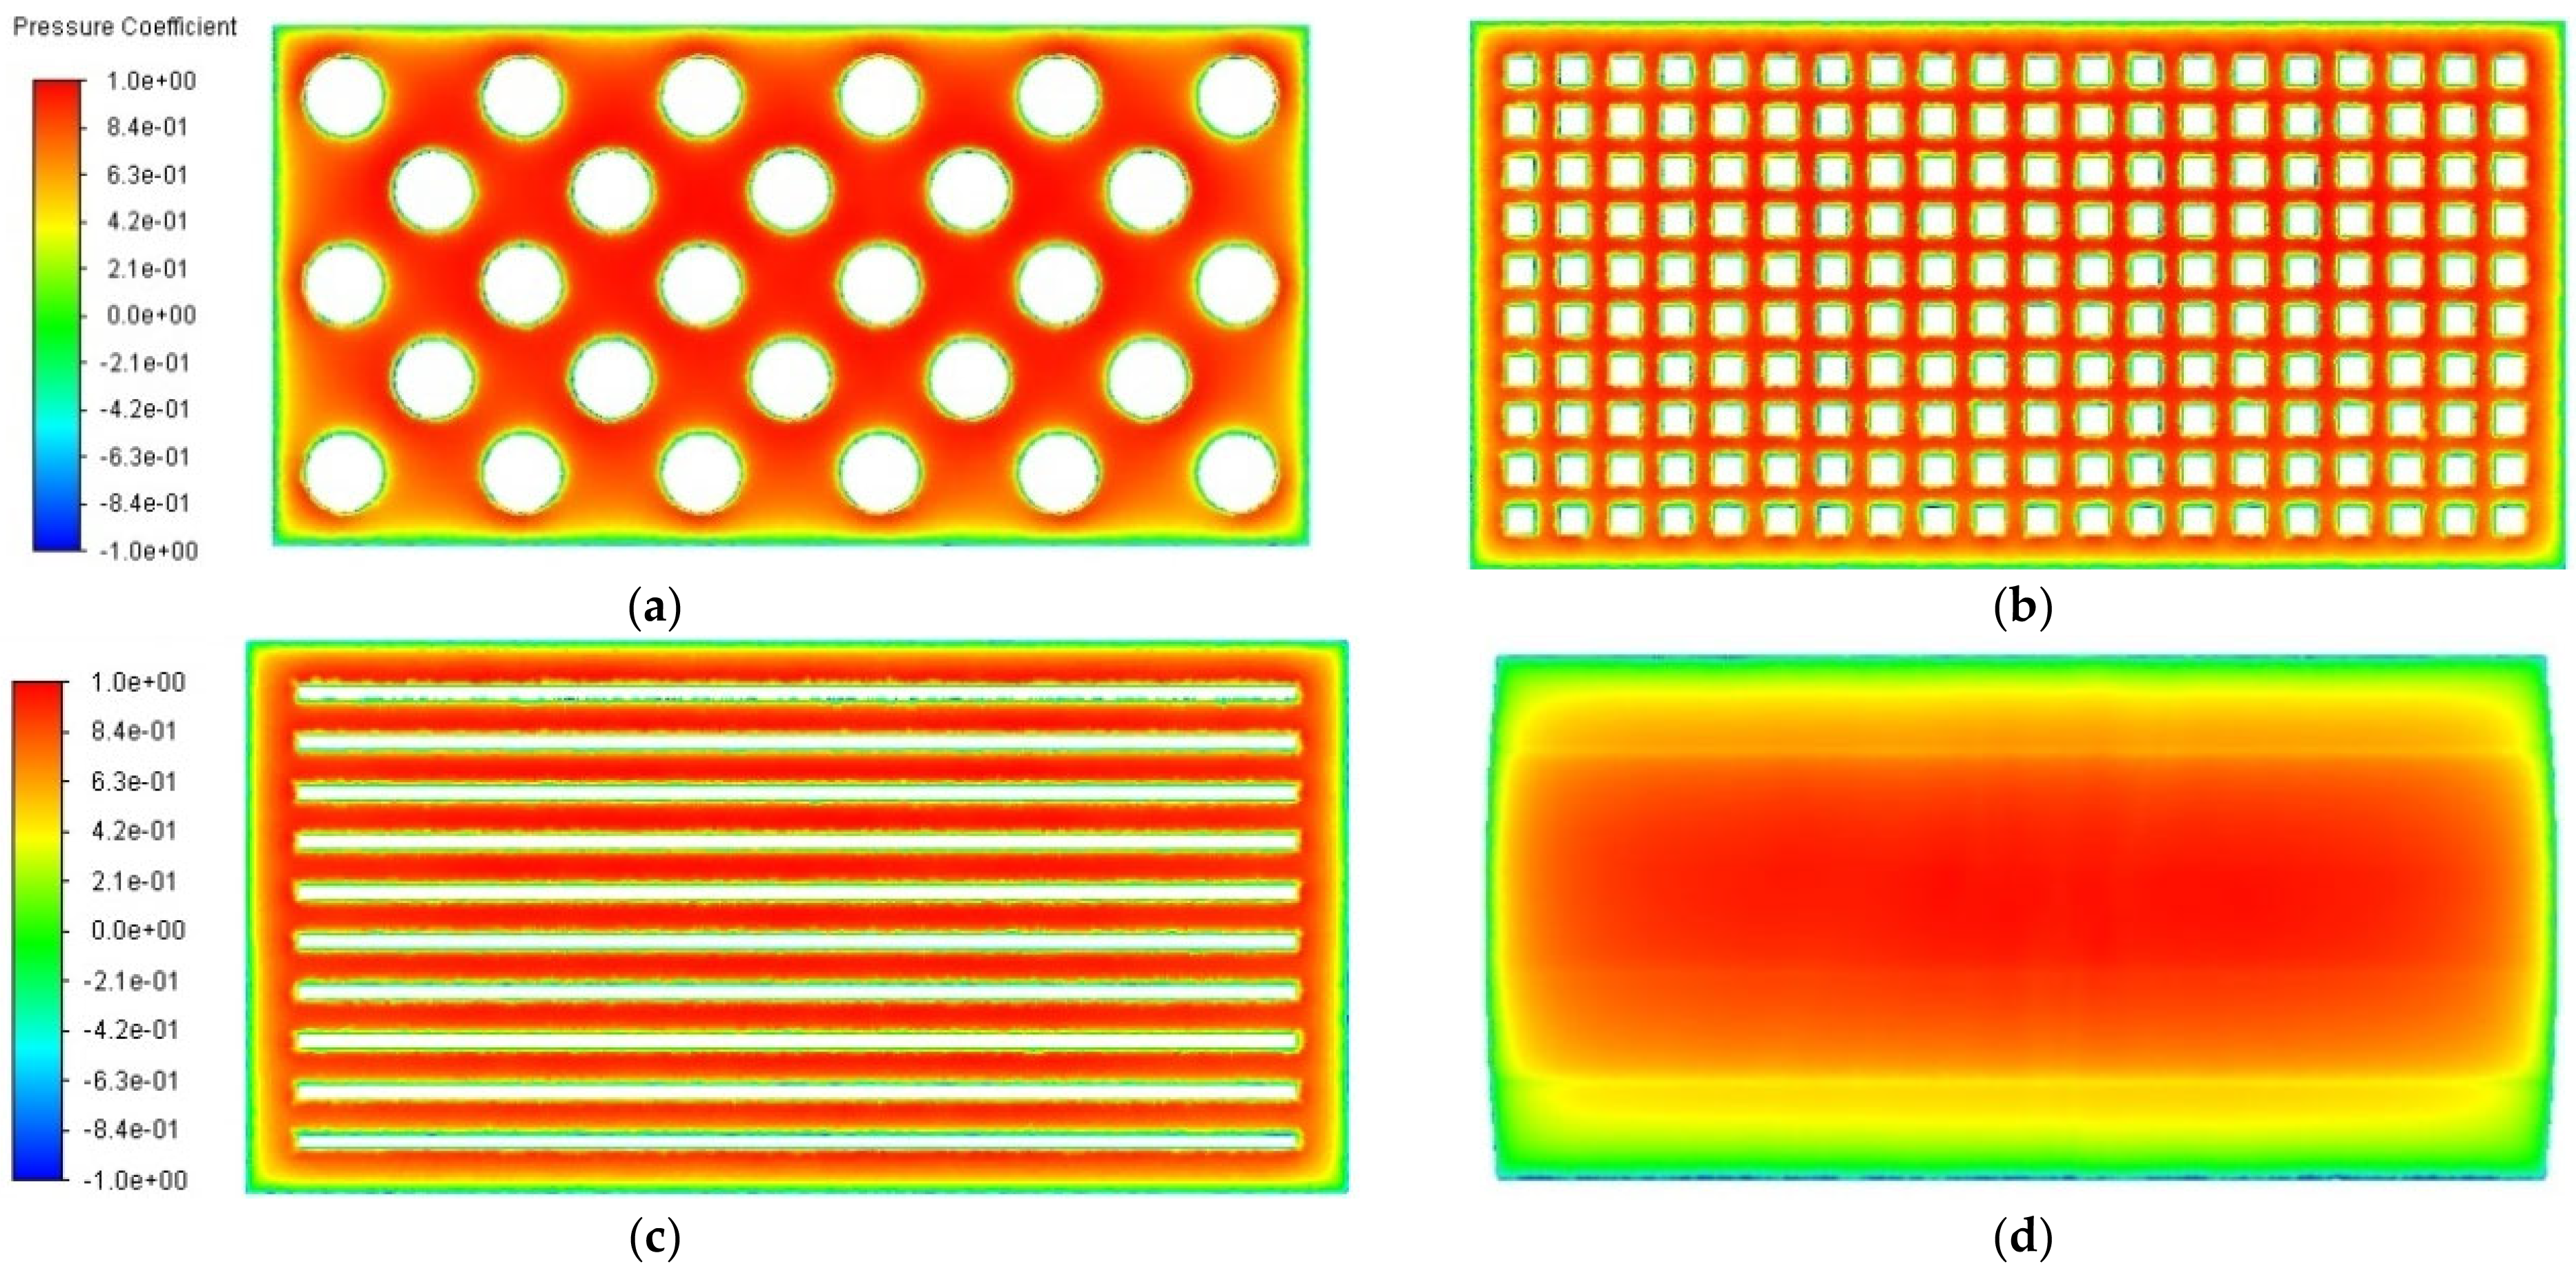
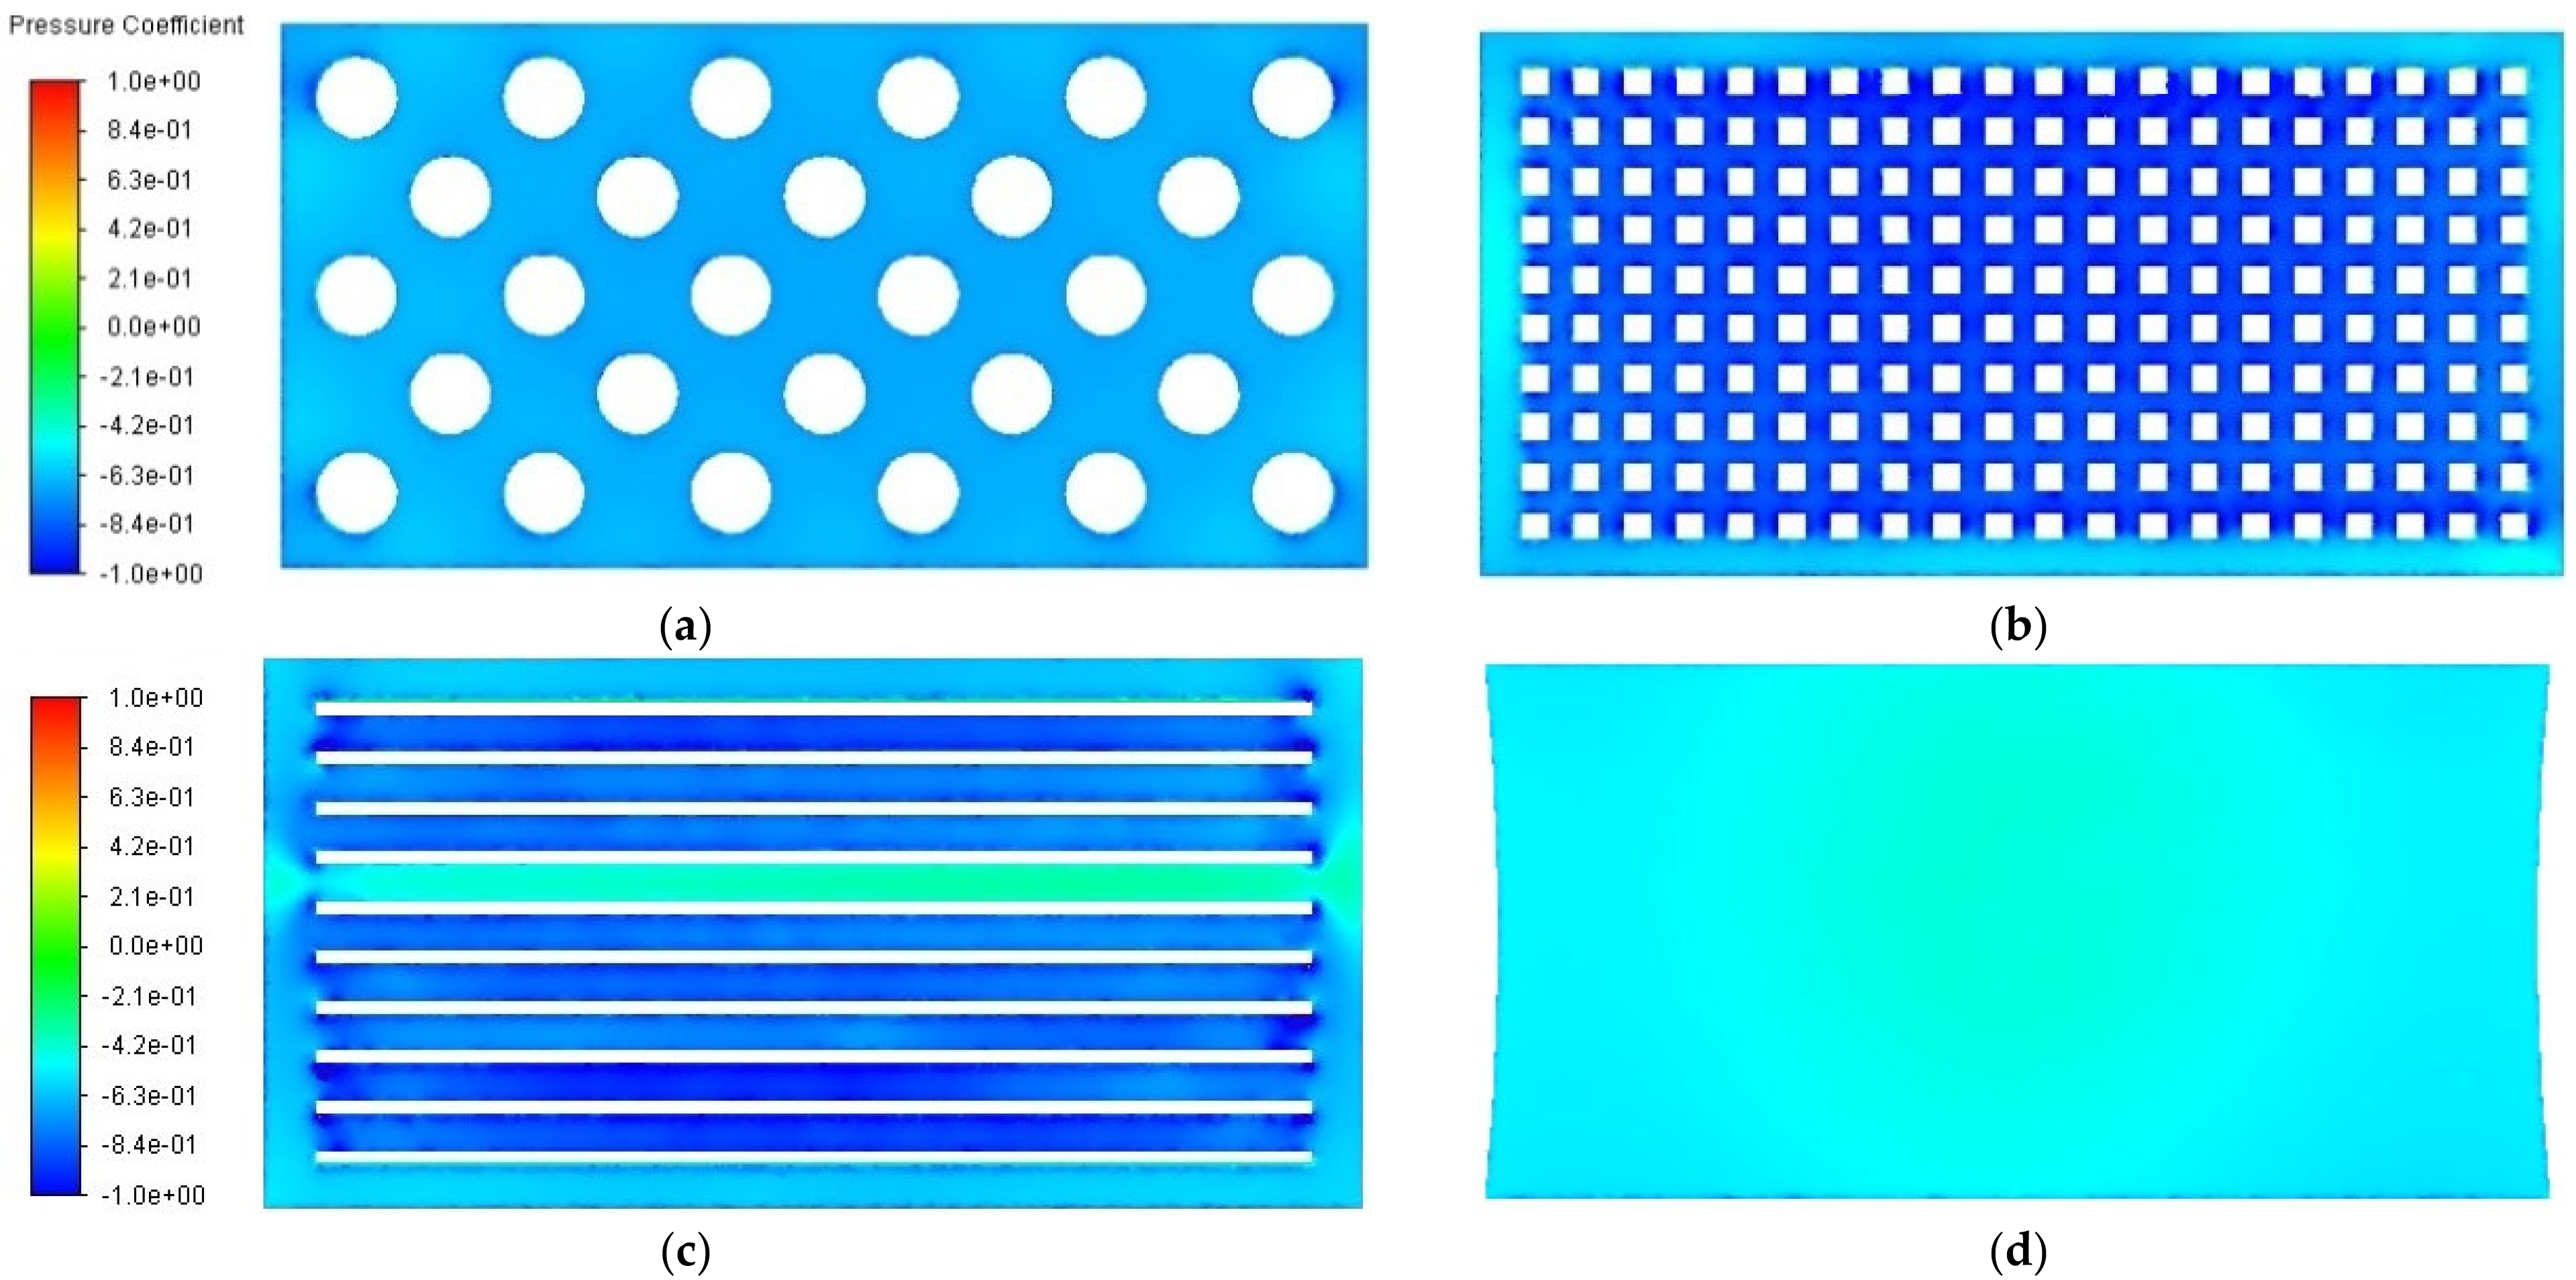
4.1. Pressure Contours

Figure 5 shows the contours of pressure coefficients on the standard panel. The positive pressure on the windward face decreases as it nears the edges. The negative pressure on the leeward is more homogenous.
Figure 6 shows the contour of pressure coefficients on the windward side of panels with porosity and curvature. The windward face of the panels exhibits the maximum positive pressure coefficient, which decreases towards the edges. Given that the airflow is normal to the panels in all cases, the stagnation points are present with a maximum pressure coefficient value of one, resulting in a relatively high average pressure on the windward face. All cases show common pressure contour characteristics. A dark red region is at the center of every surface, indicating high pressure in this region and a reducing pressure as it nears the edges. The curved panel has a smaller high-pressure region as the airflow has less resistance and gradually decreases in pressure as it nears the edges. The side edges of the curved panel display similar characteristics to the other cases; however, the top and bottom edges have a larger low-pressure region, as these have an active curvature.
The leeward face has the minimum negative pressure coefficients (Figure 7). The panel with 28 large holes and the curved one ultimately have a uniform pressure region, indicating a recirculating airflow far away from the leeward face for the sign panel with large holes and very little for the curved panel. Dark blue regions indicate the areas with the highest negative pressure. The dark regions occur in the sign panel with 200 uniform holes and the slotted one. These configurations have the smallest area, allowing airflow to pass through and result in an increased velocity through these holes or slots, thus further reducing the pressure on the leeward surface. The panel with 200 uniform holes has the lowest pressure region centrally located in the area surrounding the holes, and the pressure begins to rise near the exterior edges. For the panel with 10 slots, higher pressure can be seen at a section between the slots near the midpoint, indicating a split in airflow where it attaches to either the top and bottom airflow streams produced from the nearest slot and continue downwind. Table 1 lists the corresponding values of the pressure coefficients for each panel on the windward and leeward faces, respectively.
Table 1 shows that, for each case, the windward pressure coefficient regions are relatively the same but with a decreasing value for the curved panel. However, the leeward side has sharp spikes and varies for each case. In porous panels, the increased velocity of the air flowing through these holes and slots does reduce the size of the pressure coefficient region but raises the negative pressure just behind the panel. The smaller the hole diameter, the larger the magnitude of the pressure coefficient.

4.2. Drag and Force Coefficients for Porous Panels

Introducing uniform porosity decreases the drag on a flat plate or wall as part of the flow passes through the surface, which reduces the pressure difference between the windward and leeward faces. The drag coefficient for a porous panel is usually calculated using a porosity factor, K p , which is dependent on the solidity of the plate. Equation (1) provides a linear expression for porosity. If the panel is not linearly related to the plate solidity, Equation (2) can be applied. Applying a porosity value of 0.75 to Equation (2) yields the following:
K p = 1 1 0.75 2 = 0.9375 . Using the drag coefficient value for the standard panel produces the expected drag coefficient for the porous cases: C D , Kp = 1.2 × 0.9375 = 1.125 . This number is not the exact value of the drag coefficient, and given that the panels have different geometry of porous air slots and holes, the drag coefficient may vary among the models; however, it should return a meaningful value. Similarly, using the pressure coefficients in Table 1 and applying them to Equation (1), one can obtain the drag coefficient for the porous panels. Table 1 lists the calculated non-linear and linear drag coefficients and the CFD drag coefficient of the standard solid and porous panels. Since the curved panel has no porous qualities, the drag coefficient is directly compared to the results from the standard sign panel. The reductions in the drag force for the 28 holes, 200 holes, 10 slots, and curved panels are 15.6%, 5.8%, 11.3%, and 21.8%, respectively. Based on these results, the curved panel experiences the minimum drag, followed by the 28 holes panel.

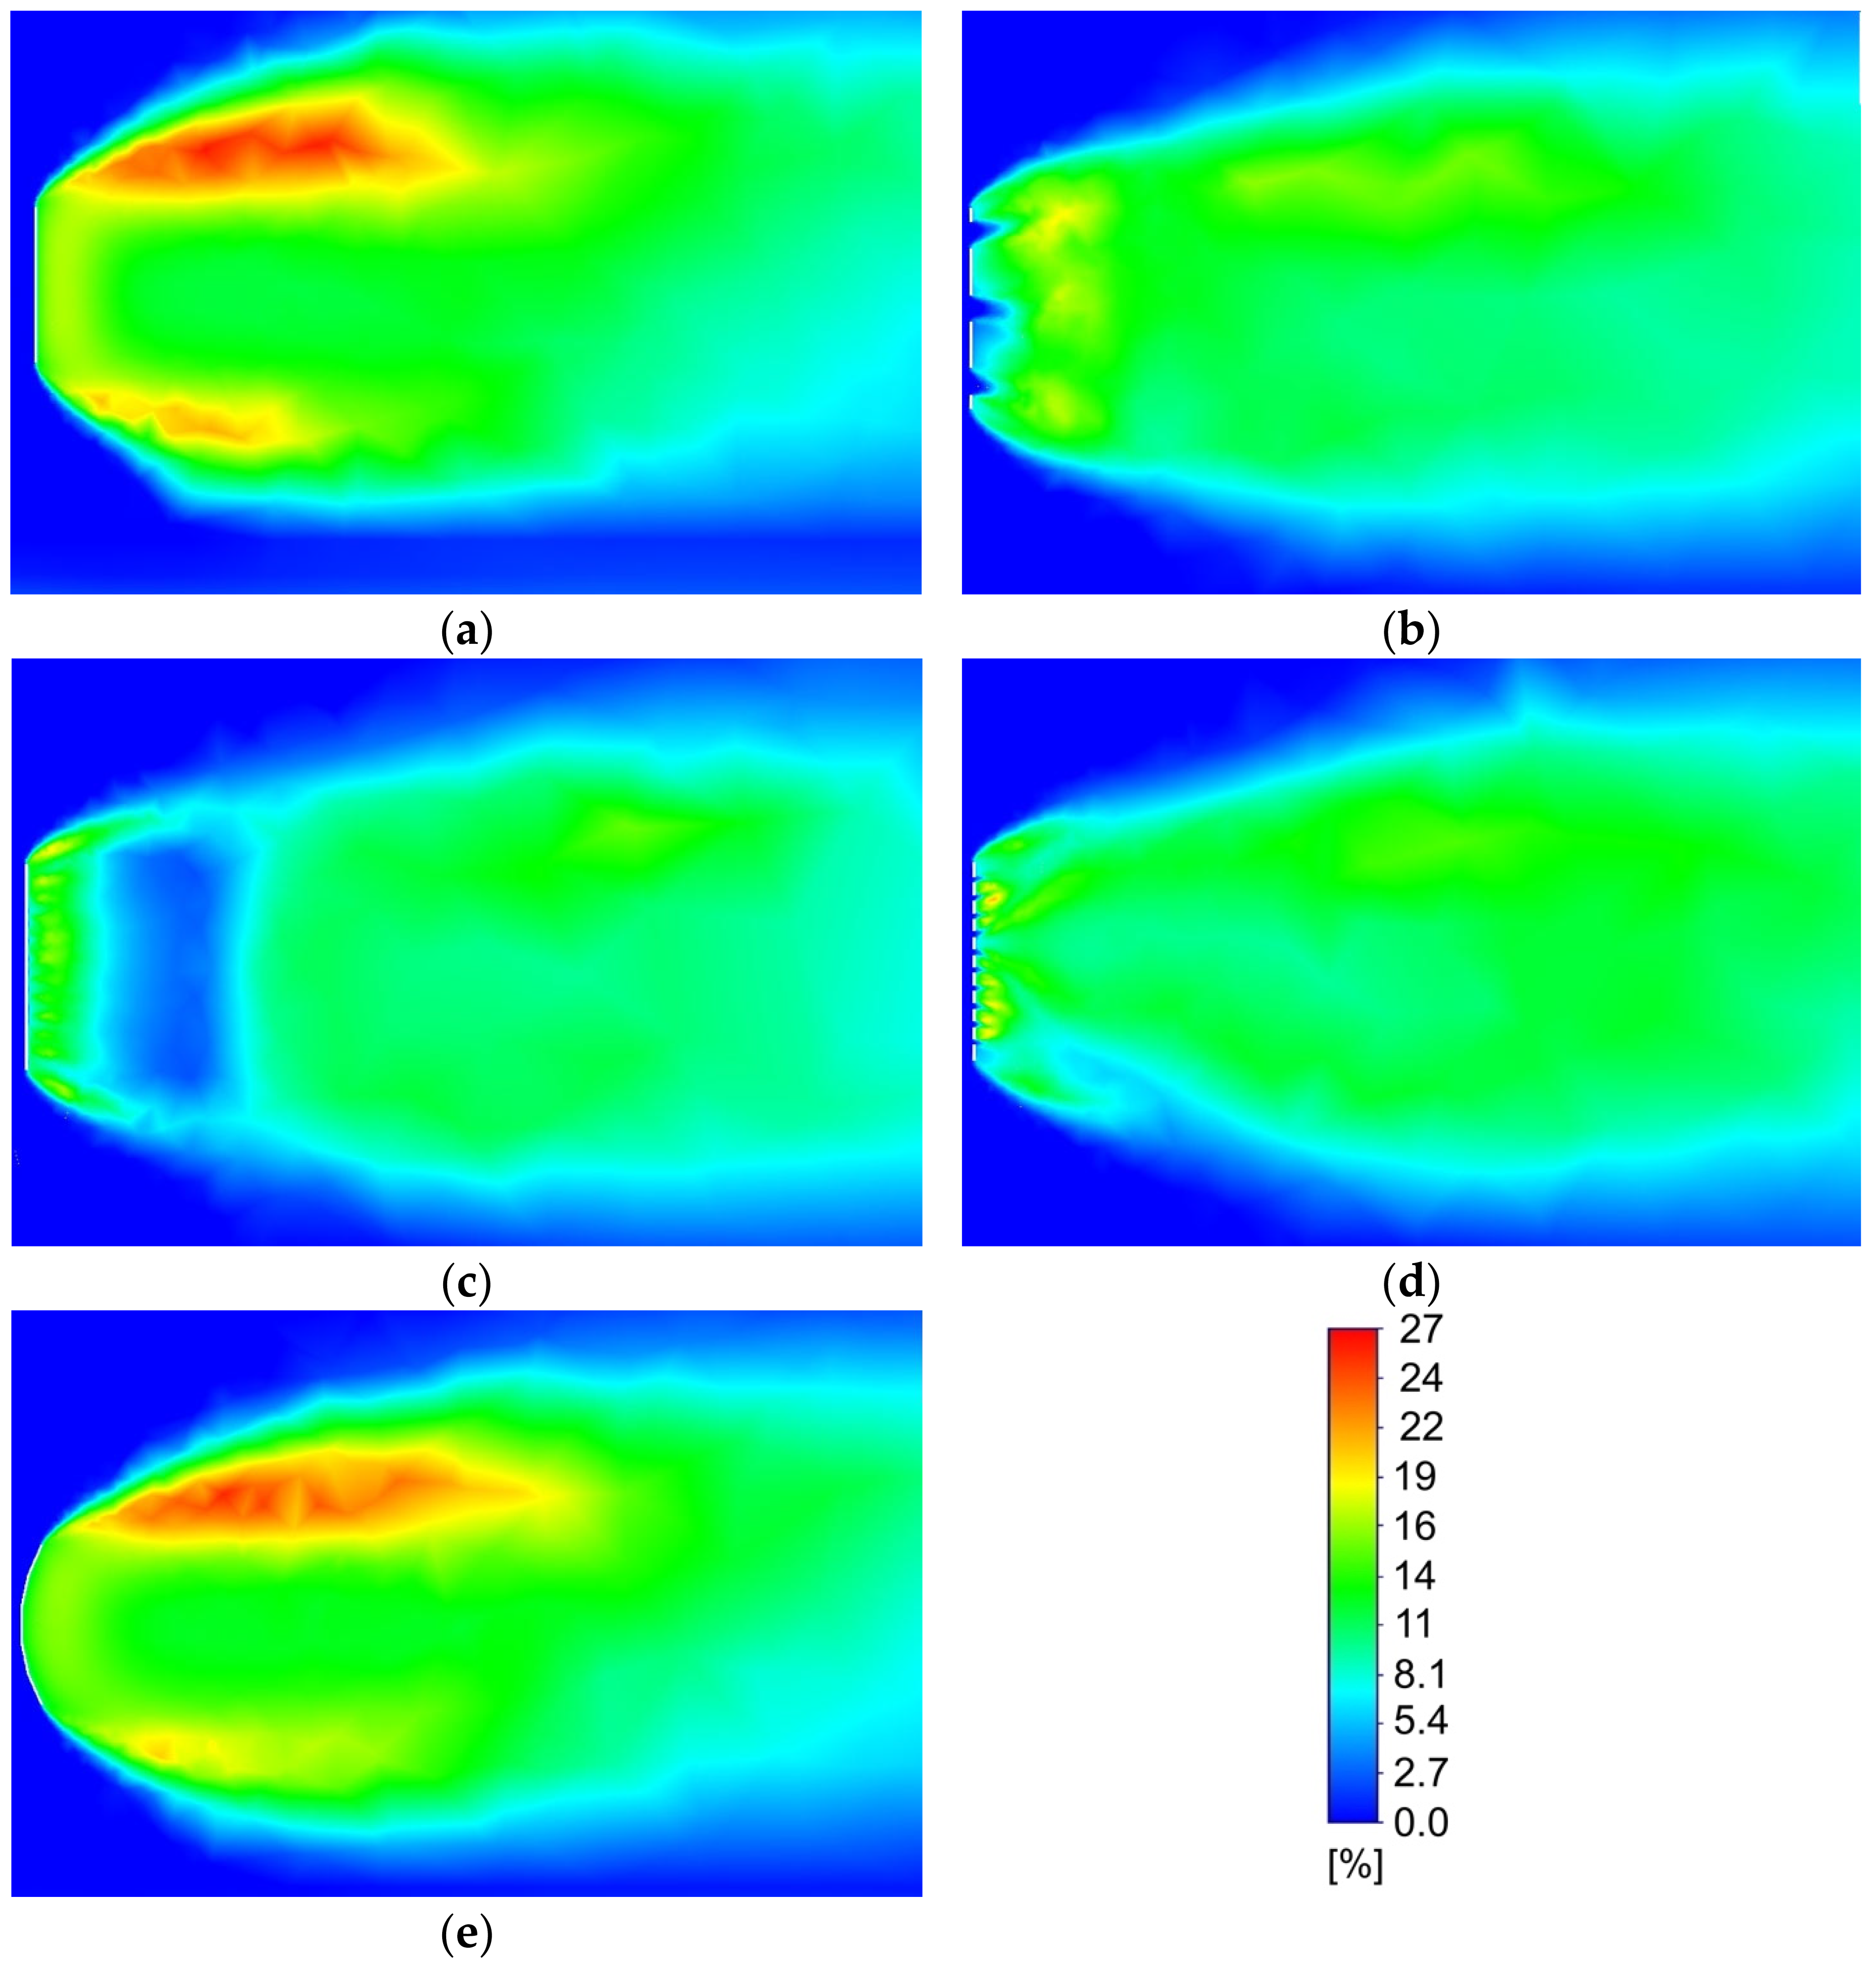
4.3. Turbulence Intensity in the Wake

Figure 8 shows the porous cases having a significant reduction in turbulence intensity, reducing the turbulence in the zones near the top and bottom wake of the standard panel. The curved panel has results similar to the standard sign panel with a slight reduction in turbulence intensity. The wake of the 200 holes panel exhibits a region of low turbulence intensity. This fact is because of the nature of the opening that the flow tends to be more uniform behind the body, but later these horizontal jets of air tend to meet, mix, and increase turbulence.
Figure 9 shows that the airflow passing through the porous holes is deviated and sheds downwind in the wake. However, the panels with porous holes develop a buffer region of low velocity and low turbulence and move the vorticity region downstream. The buffer region would end where it meets the moved vorticity, and the airflow is either allowed to flow through the center or forced to above or below and shed downwind with a minor contribution. This buffer region can be easily seen in the turbulence intensity around the panel with 200 holes (Figure 8c). The curved panel exhibits less resistance and permits air to flow over the top and bottom edges with less effort, lowering the amount of airflow over the sides. This curved sign panel, even with such a large radius, has very similar characteristics to that of a streamlined body.
The current study examined panels with a 1:2 height-to-width ratio. The extended width of the sign panel provides a flow path with immense resistance, resulting in an increased flow traveling over the top and bottom edges. This faster flow around the edges of the panel results in more entrainment from the wake into the shear layers, thus lowering the pressure on the leeward face and a higher drag [20].

5. Discussion of Results

In CFD simulations, data from laboratory testing or full-scale measurements can ascertain reliable simulations. For this study, no previous experimental data were readily available to compare with the CFD results. However, a bluff body under turbulent flow has an expected drag of 1.2, as indicated in previous work by others [26]. The results obtained from the grid-independence study gave a converged drag coefficient value of around 1.206, having almost the exact predicted value.
It is worth mentioning that the wind force on a bluff body depends on the wind direction angle, among other factors. However, for a thin plate, like the overhead board considered in the current study, the maximum drag may be obtained when the wind is perpendicular to the board surface. Previous work by others shows that over a range of wind direction angles varying between 0° and 90°, the drag force on a flat plate is maximum when the wind is perpendicular to the surface of the panel (90°) [26].
The current study showed that the effects of porosity on the drag force are positive. Introducing porosity to solid objects can reduce wind forces. Not only does the porosity reduce aerodynamic forces on bluff bodies, but also it decreases the wind velocity on neighbor structures due to the sheltering effects. Experimental and computational studies suggest Sierpinski Tetrahedrons are effective in windbreak applications [27]. Higher-order Sierpinski Tetrahedrons offer higher porosity, which leads to the lowest turbulence intensity and highest speed reduction. The wind speed reduction, the higher the pressure differences on the windbreak, leading to higher drag, which is consistent with the finding of this study when the small holes lead to higher drag forces.
A previous study investigated perforated road signs with a porosity of 30% [28]. The drag coefficient of perforated boards did not show a clear dependence on the wind speed. The porosity and the size of the perforation should be determined so that the information displayed on the road sign has sufficient visibility and readability. Overall, the results show that a perforation with 25% porosity can enhance the resilience of sign boards by reducing wind loads. The study provides valuable information for decision-makers involved with the installation of road signs in wind-vulnerable areas to improve their resiliency and enhance safety on the roads.

6. Conclusions

Damage to overhead sign structures from wind loads continues and remains a prominent issue. This study investigated the airflow around porous and curved panels using CFD to understand the porosity and curvature effects on reducing the drag force. The results show that adding a porous characteristic and a curvature to the panels decreases the wind force on overhead sign structures. A perforation with 25% porosity can enhance the resilience of sign boards by reducing wind loads. Compared to a standard solid sign panel, the one with 28 large holes produced a force reduction of 15.62%. The sign with 200 uniform square holes returned a force reduction of 5.83%. The sign panel with ten slots showed a force reduction of 11.28%. However, the curved panel showed a force reduction of 21.8%. This finding reveals that stream bodies can minimize the drag force significantly compared to bluff bodies. While maintaining complete solidity, curved panels experience significantly reduced wind forces. Besides, smaller holes produce more drag resistance than larger ones for the same porosity factor. Compared to the sign with 200 uniform holes, the panel with 28 larger staggered holes and the ten slots panel produced a lower drag coefficient. The study provides valuable information for decision-makers to improve resilience and enhance safety.

Author Contributions

Conceptualization, A.M.A.; methodology, A.M.A. and J.B.; investigation, A.M.A. and J.B.; writing—original draft preparation, A.M.A. and J.B.; writing—review and editing, A.M.A.; supervision, A.M.A. All authors have read and agreed to the published version of the manuscript.

Funding

The first author (A.M.A.) received funds from the Louisiana Board of Regents (ITRS program: LEQSF(2022-25)-RD-B-02), as well as financial support from the LSU NSF I-Corps, and LSU Faculty Grant. The findings are those of the authors and do not necessarily represent the views of the sponsors.

Institutional Review Board Statement

Not applicable.

Informed Consent Statement

Not applicable.

Data Availability Statement

Not applicable.

Conflicts of Interest

The authors declare no conflict of interest.

References

  1. Meehl, G.A.; Zwiers, F.; Evans, J.; Knutson, T.; Mearns, L.; Whetton, P. Trends in Extreme Weather and Climate Events: Issues Related to Modeling Extremes in Projections of Future Climate Change. Bull. Am. Meteorol. Soc. 2000, 81, 427–436. [Google Scholar] [CrossRef]
  2. Cauffman, S.A.; Phan, L.T.; Sadek, F.; Fritz, W.P.; Duthinh, D.; Rossiter, W.J., Jr. Performance of Physical Structures in Hurricane Katrina and Hurricane Rita: A Reconnaissance Report; NIST TN 1476; National Institute of Standards and Technology: Gaithersburg, MD, USA, 2006. [Google Scholar] [CrossRef]
  3. Magnus, J.R.; Melenberg, B.; Muris, C. Global Warming and Local Dimming: The Statistical Evidence. J. Am. Stat. Assoc. 2011, 106, 452–464. [Google Scholar] [CrossRef] [Green Version]
  4. Lim, Y.-K.; Schubert, S.D.; Kovach, R.; Molod, A.M.; Pawson, S. The Roles of Climate Change and Climate Variability in the 2017 Atlantic Hurricane Season. Sci. Rep. 2018, 8, 16172. [Google Scholar] [CrossRef] [PubMed] [Green Version]
  5. National Oceanic and Atmospheric Administration Climate Change Impacts. Available online: https://www.noaa.gov/education/resource-collections/climate/climate-change-impacts (accessed on 7 July 2021).
  6. Broach, D. These Are the 10 Most Expensive Hurricanes in U.S. History; See Video, Storm Tracks. Available online: https://www.nola.com/news/hurricane/article_cff6f988-9499-11eb-9f35-9387b108dc7f.html (accessed on 7 July 2021).
  7. Strauss, B.H.; Orton, P.M.; Bittermann, K.; Buchanan, M.K.; Gilford, D.M.; Kopp, R.E.; Kulp, S.; Massey, C.; de Moel, H.; Vinogradov, S. Economic Damages from Hurricane Sandy Attributable to Sea Level Rise Caused by Anthropogenic Climate Change. Nat. Commun. 2021, 12, 2720. [Google Scholar] [CrossRef] [PubMed]
  8. Aly, A.M.; Thomas, M.; Gol-Zaroudi, H. Experimental Investigation of the Aerodynamics of a Large Industrial Building with Parapet. Adv. Aerodyn. 2021, 3, 26. [Google Scholar] [CrossRef]
  9. Wang, D.; Chen, X.; Li, J.; Cheng, H. Wind Load Characteristics of Large Billboard Structures with Two-Plate and Three-Plate Configurations. Wind Struct. 2016, 22, 703–721. [Google Scholar] [CrossRef]
  10. Dexter, R.; Ricker, M. Fatigue-Resistant Design of Cantilevered Signal, Sign, and Light Supports; National Academy Press: Washington, DC, USA, 2002; ISBN 0-309-06724-3. [Google Scholar]
  11. Beneberu, E. Computational Fluid Dynamics for Civil Engineering Infrastructure; Oklahoma State University: Stillwater, OK, USA, 2008. [Google Scholar]
  12. Kacin, J.; Rizzo, P.; Tajari, M. Fatigue Analysis of Overhead Sign Support Structures. Eng. Struct. 2010, 32, 1659–1670. [Google Scholar] [CrossRef]
  13. McDonald, J.R.; Mehta, K.C.; Oler, W.; Pulipaka, N. Wind Load Effects on Signs, Luminaires and Traffic Signal Structures; Report No. REPT-1303-F; Federal Highway Administration: Austin, TX, USA, 1995.
  14. Toja-Silva, F.; Kono, T.; Peralta, C.; Lopez-Garcia, O.; Chen, J. A Review of Computational Fluid Dynamics (CFD) Simulations of the Wind Flow around Buildings for Urban Wind Energy Exploitation. J. Wind Eng. Ind. Aerodyn. 2018, 180, 66–87. [Google Scholar] [CrossRef]
  15. Li, R.; Wang, Y.; Lin, H.; Du, H.; Wang, C.; Chen, X.; Huang, M. A Mesoscale CFD Simulation Study of Basic Wind Pressure in Complex Terrain—A Case Study of Taizhou City. Appl. Sci. 2022, 12, 10481. [Google Scholar] [CrossRef]
  16. Katz, A.; Sankaran, V. Mesh quality effects on the accuracy of CFD solutions on unstructured meshes. J. Comput. Phys. 2011, 230, 7670–7686. [Google Scholar] [CrossRef]
  17. Constantinescu, G.; Bhatti, A.; Tokyay, T. Improved Method for Determining Wind Loads on Highway Sign and Traffic-Signal Structures; TR-559; University of Iowa: Iowa City, IA, USA, 2007. [Google Scholar]
  18. Buresti, G.; Iungo, G.V.; Lombardi, G. Methods for the Drag Reduction of Bluff Bodies and Their Application to Heavy Road-Vehicles. Allergy 2007, 62, v–vii. [Google Scholar] [CrossRef]
  19. Li, K.; Li, H.; Li, S.; Chen, Z. Fully Convolutional Neural Network Prediction Method for Aerostatic Performance of Bluff Bodies Based on Consistent Shape Description. Appl. Sci. 2022, 12, 3147. [Google Scholar] [CrossRef]
  20. Holmes, J.D. Wind Loading of Structures, 3rd ed; CRC Press: London, UK, 2015. [Google Scholar]
  21. Shi, T.; Hu, G.; Zou, L. Aerodynamic Shape Optimization of an Arc-Plate-Shaped Bluff Body via Surrogate Modeling for Wind Energy Harvesting. Appl. Sci. 2022, 12, 3965. [Google Scholar] [CrossRef]
  22. ASCE/SEI 7-22 Minimum Design Loads and Associated Criteria for Buildings and Other Structures; ASCE/SEI 7; American Society of Civil Engineers: Reston, VA, USA, 2021; ISBN 9780784415788.
  23. Peterson, E.W.; Hennessey, J.P., Jr. On the Use of Power Laws for Estimates of Wind Power Potential. J. Appl. Meteorol. Climatol. 1978, 17, 390–394. [Google Scholar] [CrossRef]
  24. ANSYS Inc. ANSYS Fluent User’s Guide; ANSYS: Canonsburg, PA, USA, 2013; ISBN 9781467348669. [Google Scholar]
  25. Shewchuk, J.R. Tetrahedral Mesh Generation by Delaunay Refinement. Proc. Annu. Symp. Comput. Geom. 1998, 86–95. [Google Scholar] [CrossRef]
  26. Ortiz, X.; Rival, D.; Wood, D. Forces and Moments on Flat Plates of Small Aspect Ratio with Application to PV Wind Loads and Small Wind Turbine Blades. Energies 2015, 8, 2438–2453. [Google Scholar] [CrossRef] [Green Version]
  27. Lim, Y.S.; Wang, P.C.; Yeo, J.J.; Yu, S.C.M. Experimental and Numerical Studies for Flow over a Sierpinski Tetrahedron for Potential Windbreak Application. J. Wind Eng. Ind. Aerodyn. 2021, 216, 104712. [Google Scholar] [CrossRef]
  28. Sung, H.; Chong, K.; Chung, W. Influence of Porosity on Drag Coefficient of Perforated Road Signs. Appl. Sci. 2023, 13, 502. [Google Scholar] [CrossRef]
Figure 1. Computational domain: (a) domain dimensions for an object with height H, (b) wall and symmetric boundary conditions, and (c) inlet and outlet boundary conditions.
Applsci 13 01682 g001
Figure 2. Panel with different geometric configurations in a porosity value of 25%: (a) 28 staggered holes, (b) 200 uniform square holes, (c) 10 rectangular slots, and (d) curved (solid).
Applsci 13 01682 g002
Figure 3. Different mesh types are employed: (a) hexahedral surface meshing of the standard sign panel, (b) tetrahedral meshing of the standard sign panel, and (c) tetrahedral surface meshing of the whole domain (coarse).
Applsci 13 01682 g003
Figure 4. Drag coefficient (Cd) plot for coarse, medium, and fine meshes (three meshes).
Applsci 13 01682 g004
Figure 5. Pressure coefficients contour on the standard panel: (a) windward face, (b) side view, (c) leeward face, and (d) top view.
Applsci 13 01682 g005
Figure 6. Contours of pressure coefficients on the windward face for (a) 28 staggered holes, (b) 200 uniform square holes, (c) 10 rectangular slots, and (d) curved.
Applsci 13 01682 g006
Figure 7. Contours of pressure coefficients on the leeward face for (a) 28 staggered holes, (b) 200 uniform square holes, (c) 10 rectangular slots, and (d) curved.
Applsci 13 01682 g007
Figure 8. Contours of turbulence intensity around: (a) standard panel, (b) 28 staggered holes, (c) 200 uniform square holes, (d) 10 rectangular slots, and (e) curved.
Applsci 13 01682 g008
Figure 9. Path lines of airflow around: (a) standard panel, (b) 28 staggered holes, (c) 200 uniform square holes, (d) 10 rectangular slots, and (e) curved.
Applsci 13 01682 g009
Table 1. Drag coefficient comparison between the standard and porous panels.
PanelCpPorosityCDDrag Force
TypeWindwardLeewardFactorNon-LinearLinearCFDReduction
standard0.766−0.4401.00-1.2061.2060%
28 holes0.765−0.5910.751.0181.0171.01815.62%
200 holes0.761−0.7230.751.1361.1131.1365.83%
10 slots0.758−0.6490.751.0711.0551.07111.28%
curved0.643−0.4161.00-1.0590.92421.81%
Disclaimer/Publisher’s Note: The statements, opinions and data contained in all publications are solely those of the individual author(s) and contributor(s) and not of MDPI and/or the editor(s). MDPI and/or the editor(s) disclaim responsibility for any injury to people or property resulting from any ideas, methods, instructions or products referred to in the content.

