Article

The Influence Assessment of Artifact Subspace Reconstruction on the EEG Signal Characteristics

by
Małgorzata Plechawska-Wójcik
1,*,
Paweł Augustynowicz
2,
Monika Kaczorowska
1,
Emilia Zabielska-Mendyk
2 and
Dariusz Zapała
2
1
Department of Computer Science, Lublin University of Technology, 20-618 Lublin, Poland
2
Department of Experimental Psychology, The John Paul II Catholic University of Lublin, 20-950 Lublin, Poland
*
Author to whom correspondence should be addressed.
Appl. Sci. 2023, 13(3), 1605; https://doi.org/10.3390/app13031605
Submission received: 22 December 2022 / Revised: 16 January 2023 / Accepted: 25 January 2023 / Published: 27 January 2023
(This article belongs to the Special Issue Research on Biomedical Signal Processing)

Abstract

:
EEG signals may be affected by physiological and non-physiological artifacts hindering the analysis of brain activity. Blind source separation methods such as independent component analysis (ICA) are effective ways of improving signal quality by removing components representing non-brain activity. However, most ICA-based artifact removal strategies have limitations, such as individual differences in visual assessment of components. These limitations might be reduced by introducing automatic selection methods for ICA components. On the other hand, new fully automatic artifact removal methods are developed. One of such method is artifact subspace reconstruction (ASR). ASR is a component-based approach, which can be used automatically and with small calculation requirements. The ASR was originally designed to be run not instead of, but in addition to ICA. We compared two automatic signal quality correction approaches: the approach based only on ICA method and the approach where ASR was applied additionally to ICA and run before the ICA. The case study was based on the analysis of data collected from 10 subjects performing four popular experimental paradigms, including resting-state, visual stimulation and oddball task. Statistical analysis of the signal-to-noise ratio showed a significant difference, but not between ICA and ASR followed by ICA. The results show that both methods provided a signal of similar quality, but they were characterised by different usabilities.

1. Introduction

Electroencephalography (EEG) belongs to non-invasive techniques of neuroimaging, offering high temporal resolution, although its spatial resolution is poor. Despite the fact that the EEG technique is relatively inexpensive and widely applied, artifacts present in the signal are still a subject of research. Artifacts are noisy, non-cerebral origin fragments of the signal. The presence of artifacts limits the usefulness of the signal and might influence the analysis process.
Among the most common type of artifacts, one can find ocular movements, eye blinks, or cardiac activity. As different types of artifacts have specific characteristics, in the literature, authors often concentrate on analysing a particular type of artifact [1,2].
Artifacts can be divided into two groups: physiological and non-physiological origins [3]. Physiologically-originated artifacts are caused by behaviour, movement and physiology of the person examined. This group covers ocular artifacts, including eye movement and blinks, which cause strong, high-frequency interference with large amplitude visible especially in the frontal electrodes [4]. Other common artifacts in this group are muscle artifacts which represent myogenic activity visible when a patient is moving, talking, moving the jaw or walking [3]. The shape and amplitude of the muscular artifacts differs depending on type of muscles involved and the degree of their contraction [2]. The most common artifacts originate from the head, face and neck and are detectable by electrodes located over the entire head [5]. Among other popular physiological artifacts, cardiac activity is often considered. Electrical activity of the heart is represented by characteristic, slow periodic waves and might be observed if electrodes are placed over pulsating vessel [6]. To the physiological artifacts group belong also artifacts related to sweat gland and skin potentials including sweating [6].
Non-physiological or technical originated artifacts might be caused by improper skin-to-electrode contact which might be related to badly applied gel or electrode displacement or damage [7]. Other problems might occur in case of inadequately prepared research environments. A well-known factor is the electric field of external electronic devices, which is usually filtered out with notch filter.
The problem of artifacts detecting and removing has been well known for years. Performing this task with a minimal loss of data and keeping the signal quality is difficult. The traditional approach covers manual or automatic data cleaning consisting of removing noisy parts of the signal [4,8]. Existing baseline in EEG signal also makes it more difficult for feature extraction. Thus, baseline removal from EEG records is also important [9]. Automatic detection of artifacts was based on rigid measures such as kurtosis, standard deviation or voltage changes [10]. Such procedures are often applied in case of typical artifacts such as eye-, muscle- or electrode-related contaminations. Unfortunately, they might lead to the loss of a significant part of the recorded signal including informative data.
Development of brain–computer interfaces, including online signal registration and analysis, forced the development of methods of signal correction instead of cutting out its fragments. In our opinion, it is also possible to use the measures developed this way in traditional offline experiments to avoid the influence of the subjective factor (in the process of manual signal rejection) and high loss of the signal (in case of automatic signal cleaning).
Currently, popular methods of EEG artifacts elimination often employ spatial filtering techniques [1]. Among them, well known are independent component analysis (ICA) [11], principal component analysis (PCA) [12] or canonical correlation analysis [13]. Out of these methods, especially ICA has been developed with different implementation versions and extensions [14,15,16,17].
Recent research on the artifact-correction problem resulted in the development of a new method, artifact subspace reconstruction (ASR) [18]. ASR is a non-stationary method based on a PCA window, dedicated to automatically detecting and removing artifacts. It is especially suited for removing occasional large-amplitude artifacts from EEG recordings. The method presents a different approach to the problem of a artifactual signal. Instead of traditional data cutting or filtering, it reconstructs the noisy part of the signal based on its other fragments. The construction of ASR algorithm demonstrates a similarity to principal component analysis (PCA) methods, where the components with large variances are rejected and the signal is reconstructed based on remaining components [19,20,21]. The ASR uses the clean portion of data (called reference data) to define the thresholds for rejecting components. This clean portion of data might be selected automatically. The ASR uses a PCA method and indicates the components with large variances, which are rejected. The signal is reconstructed based on remaining components. Meaningful brain signals detectable across channels, usually clustered in a particular scalp region, are usually of low variation compared with artifacts, so artifacts should be detected against regions with minimised variance sets. A detailed description of the ASR procedure is explained in [22].
In this paper, ASR was applied to a classical event-related potential (ERP) study, where it was proved to be an effective and safe technique which does not distort the ERP results. This method is relatively new and poorly studied. It has been successfully applied to movement-related artifacts correction and other types of high amplitude noise [23]. In [24] ASR was applied to the EEG data of treadmill walking subjects whereas in [25] ASR was successfully adopted in a low-density wearable EEG case study.
The authors in [26] described that the optimal selection of ASR parameter allows removing the artifacts without disturbing the signals related to the brain. The experiment was based on calculating ICA components before and after applying ASR, and then the obtained results were compared quantitatively in terms of efficiency and effectiveness. The measures used to compare the obtained results were the percentage of data modification, variance reduced, coefficient correlation, power of source activities and the percentage of retained power. The authors define that the optimal ASR that the optimal ASR cutoff parameter (k) may be between 10 to 100. The authors pay special attention at inverse proportion of k and the degree of data modification, for example, for k = 100, approximately 3% of data were modified while k = 10, above 60% of the data were modified. The ASR with a threshold k = 100 allows removing the artifacts with high amplitude while k = 10 may cause both artifacts and brain signal to be removed. The authors, in their research, focused on the eye-blink and eye-movement artifacts. The results show that the artifacts related to ocular activity were not removed completely, but ASR significantly reduced the eye activity for the k, which is less than 100. It is recommended to choose the cutoff parameter from the interval between 10 and 100 as a compromise between removing the artifacts and preserving brain waves. In [27] it was shown that the k parameter determines how aggressive the procedure of the faulty data removing is. The smaller is the k, the higher aggressiveness is obtained, as the rejection criterion ( Γ i ) is based on k parameter multiplied by the standard deviation given by:
Γ i = μ i + k × σ i
In [22], authors discussed the effectiveness of ASR and the optimal choice of its parameter. The authors presented an ASR evaluation study performed on twenty EEG recordings gathered during simulated driving trials. Artifact elimination results achieved with ASR were also verified with independent component analysis (ICA) and an independent component classifier. The study results show that ASR might be a powerful automatic artifact elimination method suitable for offline and online studies. Well-chosen parameters enable significantly reducing eye and muscle component activities while leaving most of the brain components. The mentioned researchers, based on empirical results presented in the paper, suggested that the optimal ASR parameter is between 20 and 30. This value is a good compromise between removing non-brain signals and retaining brain activities. The paper also proves that ASR cleaning positively impacts the quality of a subsequent ICA decomposition. The influence analysis of the ASR cut-off parameter was also conducted in other papers. In [28], the authors performed an influence analysis of the ASR cut-off parameter on EEG recordings in motor tasks. In the study, the EEG signal obtained during a cognitive task, single-leg stance, and fast walking was removed and reconstructed using ASR method. The ratios of EEG obtained using ASR with 10 cut-off parameters were compared with results of visual inspection. What is more, the repeatability and dipolarity of independent components were also analysed with an automatic classification tool to assess the number of brain-related independent components. The paper showed that ASR performed better in motor tasks compared with non-movement tasks and the quality index of independent components reached a maximum for cut-off parameter of 10 and higher, whereas the cut-off parameter did not affect the number of independent components. According to the researchers, cut-off parameters less than 10 are not advisable as there is no benefit to using them. What is more, the literature review shows that majority of researchers using ASR in their studies use the standard, default version of parameters [19,29]. Furthermore, the process of tuning the ASR parameters such as k (Equation (1)) and sliding window length on real data is usually not performed as the original pure signal is not available [27].
In literature, there are also presented modifications of the ASR method. In [30], the authors presented Riemann ASR (rASR), a modified version of the ASR algorithm. The applied changes covered using Riemannian geometry instead of traditional Euclidean geometry in the task of computing the covariance matrix make calculations faster and more efficient, as this modification enables performing the calculation of covariance matrix estimation instead of decomposing many covariance matrices for small chunks of data. What is more, the presented method uses the geometry-aware PCA method instead of classical PCA to perform eigen decomposition. According to the results, the proposed version of ASR method is efficient and works faster than the original solution. The tests were performed on the eye-blinks reduction task in visual-evoked potentials (VEP). The analysis was based on EEG recordings gathered from 27 subjects during performing VEP tasks under two conditions: indoors and outdoors. Although the results are promising, more extended research should be performed to check the effectiveness of proposed method on other type of artifacts under different conditions. Another version of ASR was proposed by [31], where Blum et al. developed an adaptive online ASR technique using the Hebbian/anti-Hebbian neural networks integrated into the main algorithm. This improvement consists of applying the Hebbian and anti-Hebbian learning rules in order to segment and self-organise the artifact subspace by updating the synaptic weights. This modification addresses the issue related to the fact that fixed threshold in original ASR may reduce the artifact correction effectiveness, especially in cases of poor quality of the reference data. The method was tested on EEG data gathered during such experimental paradigms as steady-state visual evoked potential (SSVEP), rapid serial visual presentation (RSVP) and motor imagery (MI). In [32], the authors proposed a Hardware-Oriented Memory-Limited Online ASR (HMO-ASR) algorithm which uses PCA-based and z-score-based preprocessing to clean the data in each window as well as iterative mean, standard deviation, and covariance updated in a parallel. These modifications enabled obtaining up to a 98.64% reduction in memory size, which makes the HMO-ASR algorithm useful in mobile devices or other hardware with limited memory. In [27] an ASR optimising method was presented. In the paper, the researchers showed that customisation of ASR parameters might have a positive influence on ASR performance in application to the low-density EEG.
The aim of our work was to present and compare the effectiveness of two approaches of artifact correction which might be applied automatically. The first approach is a well known, widely applied artifact correction based on the ICA method. The second approach is ASR followed by ICA (ASR + ICA). The ASR is a method less frequently used but which is gaining the trust of researchers, including in EEG-processing pipelines. The main question of the paper is whether there are any differences between pure ICA and ASR with the ICA approach in the context of effects in widely applied, common EEG experimental procedures such as resting-state with eyes open and closed, stroboscopic stimulation with eyes closed and oddball procedure. The results were compared for the signal-to-noise ratio calculated separately for each paradigm. The choice of the procedures was dictated by the purpose of comparing the way ICA and ASR + ICA correct artifacts in various experimental conditions. Each and every procedure tested in the current study allows for the investigation of different mental processes and is frequently used in cognitive neuroscience research and in biomedical applications in general. This type of research is usually characterised by a smaller study group size [33] than in the case of testing machine learning algorithms, for example. They are also conducted by researchers with different backgrounds and competencies in advanced signal analysis. Therefore, they may rely more on the default settings of automatic signal preprocessing algorithms or suggestions from the developers of specific implementations. Hence, our comparisons are based on the default parameters of popular implementations of ICA and ASR and classical experimental procedures in cognitive neuroscience. In addition, we limited the range of the analysed signal to frequencies from 1 Hz to 40 Hz. We decided to do this because of the recommendations of some authors, who suggest using a high-pass filter at 1 or 2 Hz to optimise the results of ICA decomposition [34]. We also wanted to minimise line noise’s impact on the algorithms’ performance. For each of the selected experimental procedures, the commonly analysed signal changes were also within the chosen frequency range.
An experimental procedure commonly used in connectivity analyses and simultaneous recording of EEG-fMRI is the resting-state paradigm. Research results regarding resting-state suggest that the brain should not be considered as being in an idle state and activated by external stimuli only. The brain is likely to be intrinsically active in an organised way which supports stimulus processing [35]. Resting-state measurement is typically performed with the eyes closed or open. When both conditions are included, the brain’s response to visual stimulation can be evaluated, especially in the form of changes in alpha band activity in occipital areas [36].
Stroboscope light stimulation is also used to evaluate visual cortex activity [37]. If the light stimulation frequency is steady, it is possible to observe increased power equal to this frequency in the EEG in occipital areas. This type of stimulation is known as the steady-state visual-evoked potential (SSVEP) paradigm and can be used to control brain–computer interfaces [38].
In the study of cognitive processes such as attention, the oddball paradigm is often used. In this case, event-related potentials are investigated, mainly the P300 component, which is a positive deflection in EEG signal and usually occurs about 300 ms after the stimulus presentation. The P300 is an attention-related component and is considered an indicator of active detection of targets by the subject [39,40]. Further research has shown that P300 can be separated into two subcomponents, P3a and P3b [41,42], and due to its characteristics, P300 can also be applied to brain–computer interface communication [43].
Considering the results of the literature review, as observed, ASR is regarded as a method with the potential to provide promising results. However, it is still treated as a relatively new method which needs to be explored [31]. The idea of the study presented in this paper is to check if the process of automation of artifact removal, more and more willingly applied in the area of cognitive neuroscience, can affect patterns in the data. The ICA is a well-known, widely applied method which is considered to be safe for EEG activity patterns. We decided to check if adding another method, ASR, in the data-preprocessing phase could change these patterns. Such an influence, if detected, could have a negative impact on data and cause incorrect results.
The ASR, as added to the procedure, was conducted before the ICA, as ASR is performed continuously on small segments of the data whereas ICA should be used on continuous data. The ASR is a non-stationary method using a sliding window, while ICA is a stationary method. The ASR applied before ICA removes less reproducible data discontinuities and prepares the signal for ICA application.
The experimental procedure and the research group used in this study are typical for cognitive neuroscience research. It is worth mentioning that this case study covers the most popular experimental procedures in order to verify the process of preprocessing automation. We did not attempt to perform a direct assessment of the algorithm parameters or apply modified versions of the methods. Instead, we used default values of parameters as they are suggested by the methods developers and applied in other research papers. Another factor worth mentioning is the computational cost, which is an important aspect of the assessment of both approaches as it has a practical influence on the applicability of both solutions, so this aspect was also taken into account in the paper.

2. Materials and Methods

2.1. Subjects

Ten healthy volunteers, 8 adult females and 2 adult males, aged 22–35 years (mean = 26, SD = 4.47), participated in the study. Nine of them showed right-sided laterality. All participants were informed about the possibility to resign from participation at any time without stating the reasons. The experiment was conducted in compliance with the Declaration of Helsinki and approved by the University Research Ethics Committee of Lublin University of Technology (approval no: 8/2019).

2.2. Devices

EEG signals were measured with the GES 300 EEG system (Electrical Geodesics, Inc., Eugene, OR, USA) comprising a Net Amps 300 amplifier (input resistance 200 MΩ; recording ranging 0.01–1000 Hz) and a 64-channel cap with active electrodes ActiCAP (Brain Products, Munich, Germany). In the study, 64 electrodes were used an arranged according to the 10–10 international system. The impedance of the electrodes was kept below 10 kΩ and the signal was referenced to an FCz channel throughout the recording. Data were sampled at 500 Hz and recorded with the Net Station 4.4 (EGI, Eugene, OR, USA). The experimental procedure was designed and displayed on a computer screen with the use of PsychoPy Software v. 3.0. Above the computer screen there was a stroboscope emitting white light. Responses were registered with a response pad built using non-ferrous materials to avoid magnetic induction. The processing of the EEG signal was performed with EEGLab version 2021.1 (USA) [44], and the statistical analysis as well as visualisation of the results was carried out with SPSS 20 (IBM, USA). The ICLabel, an automatic EEG independent component classifier plugin for EEGLAB [45], which is designed to recognise independent components (ICs) such as brain or non-brain sources, was used to remove the ICA components, but the final decision was made by an expert if the component had to be removed. The goal of this paper was to compare the methods which can be used automatically, so this is possible only if the IC components are classified by the algorithm. The clean_rawdata [18], which is also the EEGLab plugin, was used to calculate ASR. The method which was applied in calculating ASR also allows removing channels, line-noisy channels, poorly correlated channels or applying the high-pass filter. The ASR was calculated with parameter “Standard deviation cutoff“ for the removal of bursts, which was set to the default value of 5. This is a conservative, not strongly restrictive value. It was set to 5 based on visual examination. The mentioned functions were calculated in separate steps.

2.3. Procedure

The experimental procedure consisted of five blocks (Figure 1): 1. resting state with the eyes open, 2. resting state with the eyes closed, 3. stroboscopic stimulation with the eyes closed, and 4. the oddball procedure. Each block was separated by a short rest break. Participants were seated in a dimly lit room at a distance of approximately 60 cm from the computer screen on which experimental stimuli were presented.
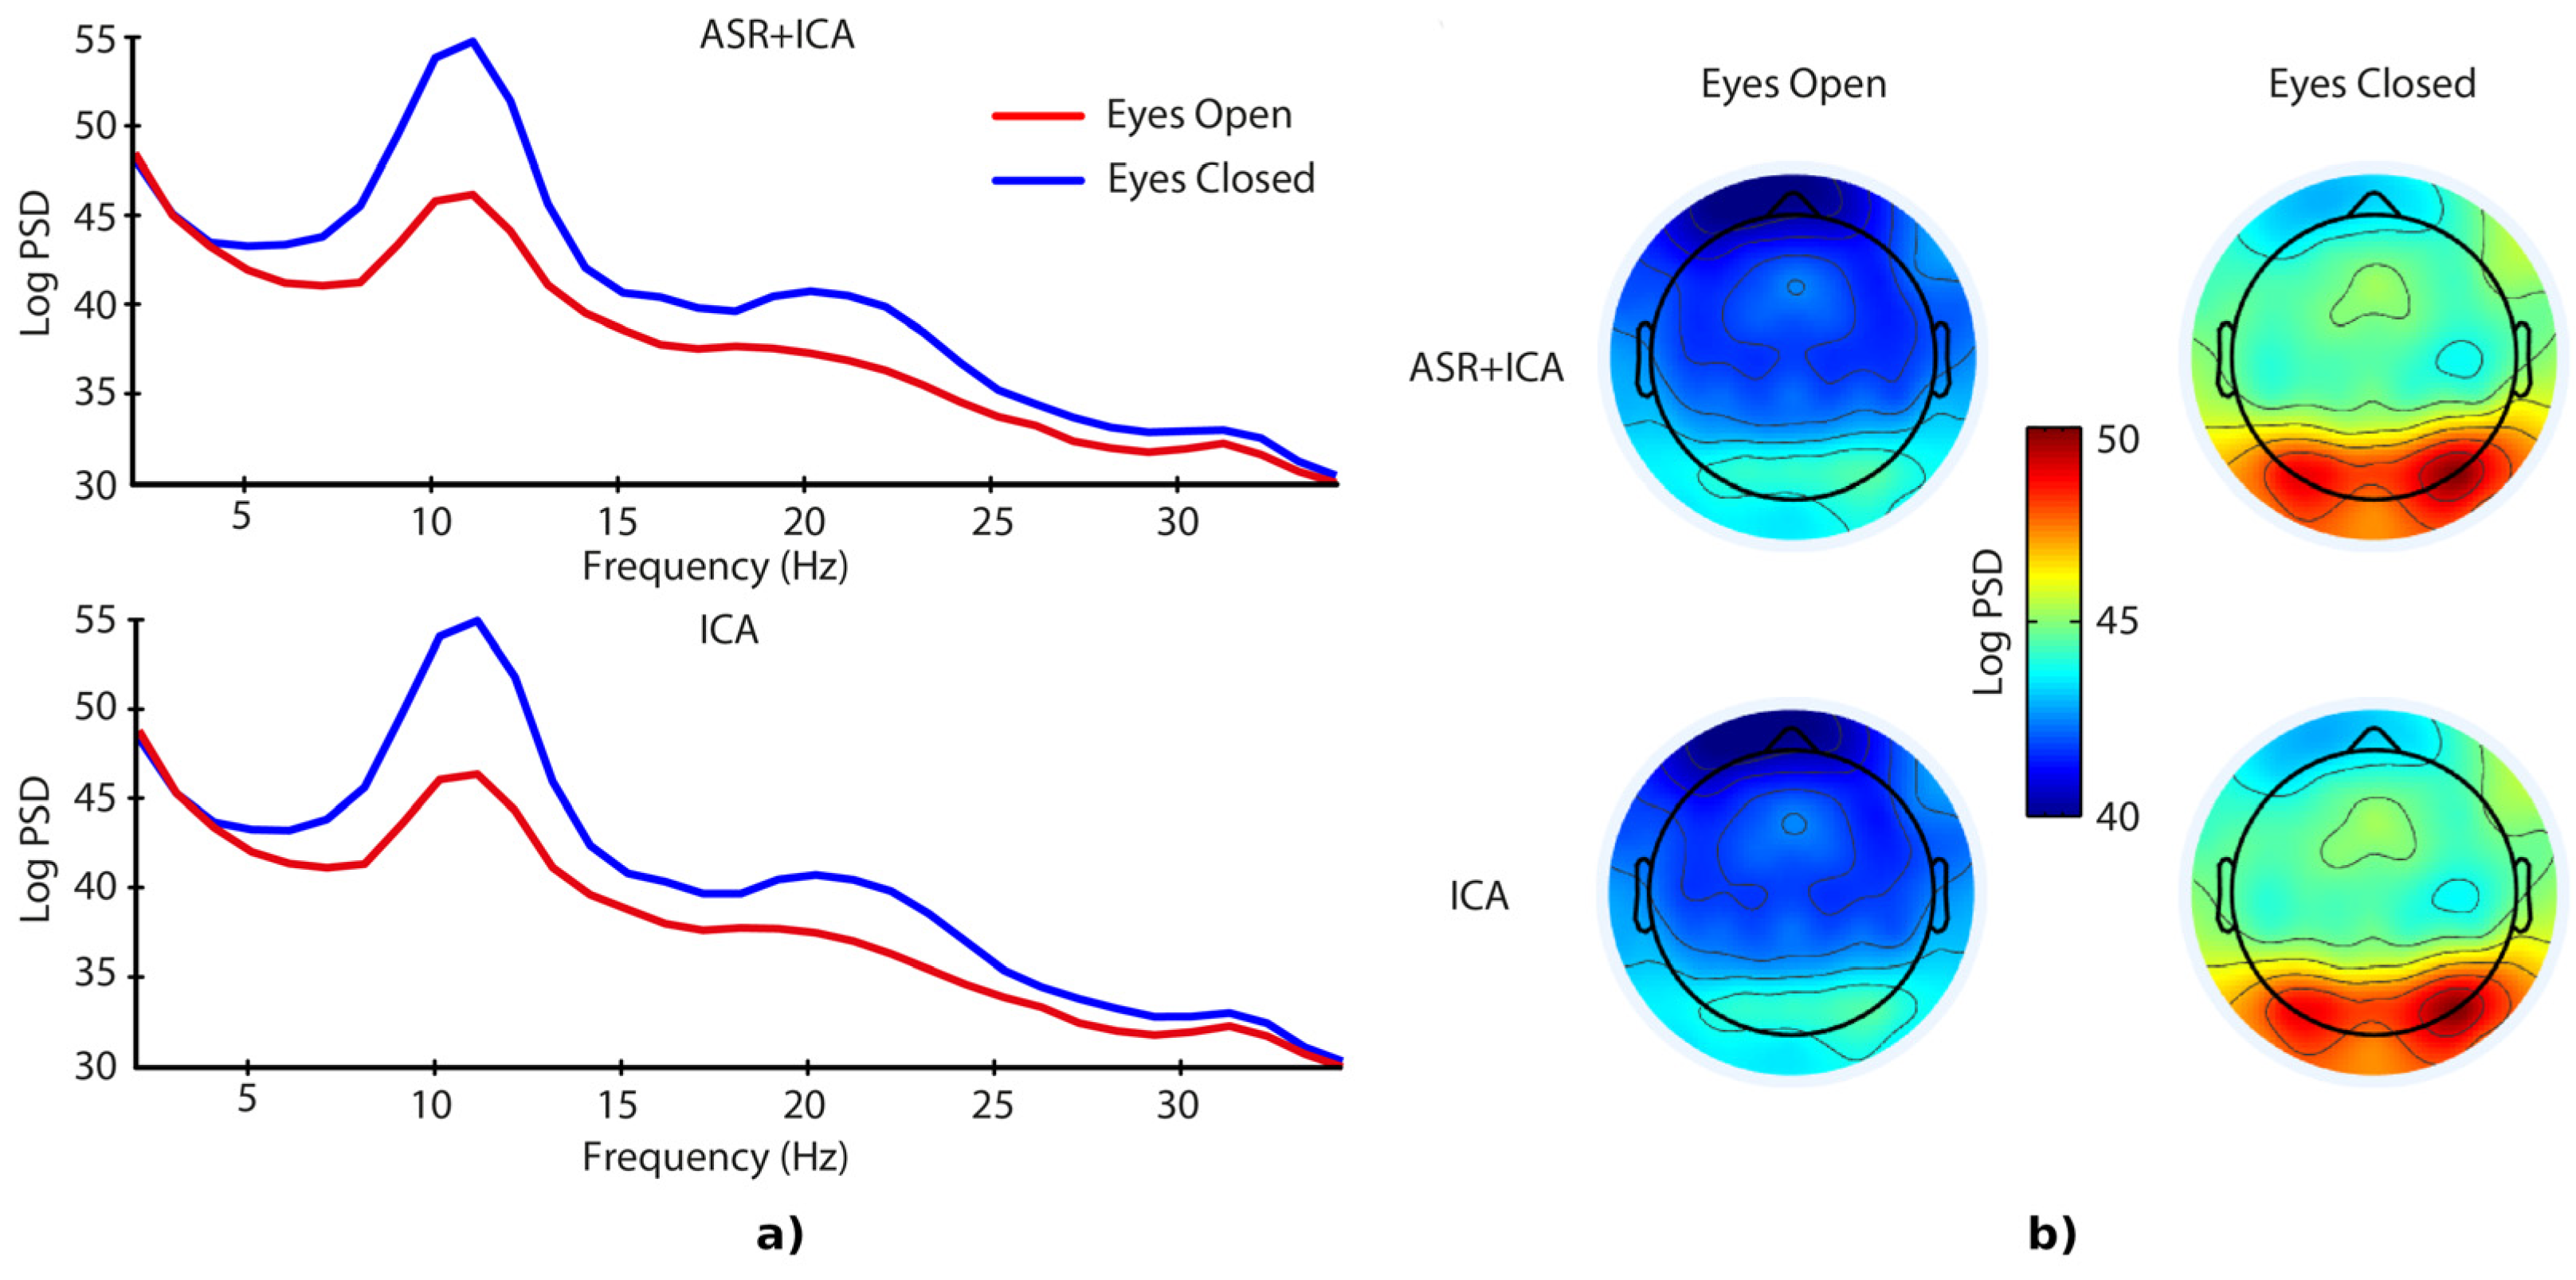
  • Resting state with the eyes open/eyes closed. Participants were instructed to look at the fixation cross at the center of the screen and think of nothing in particular for a period of 120 s. The beginning and the end of a block was announced with a brief sound. In the other condition participants were instructed to close their eyes when they heard a brief sound and think of nothing in particular for a period of 120 s. The end of a block was also announced with a sound which was also a signal to open their eyes.
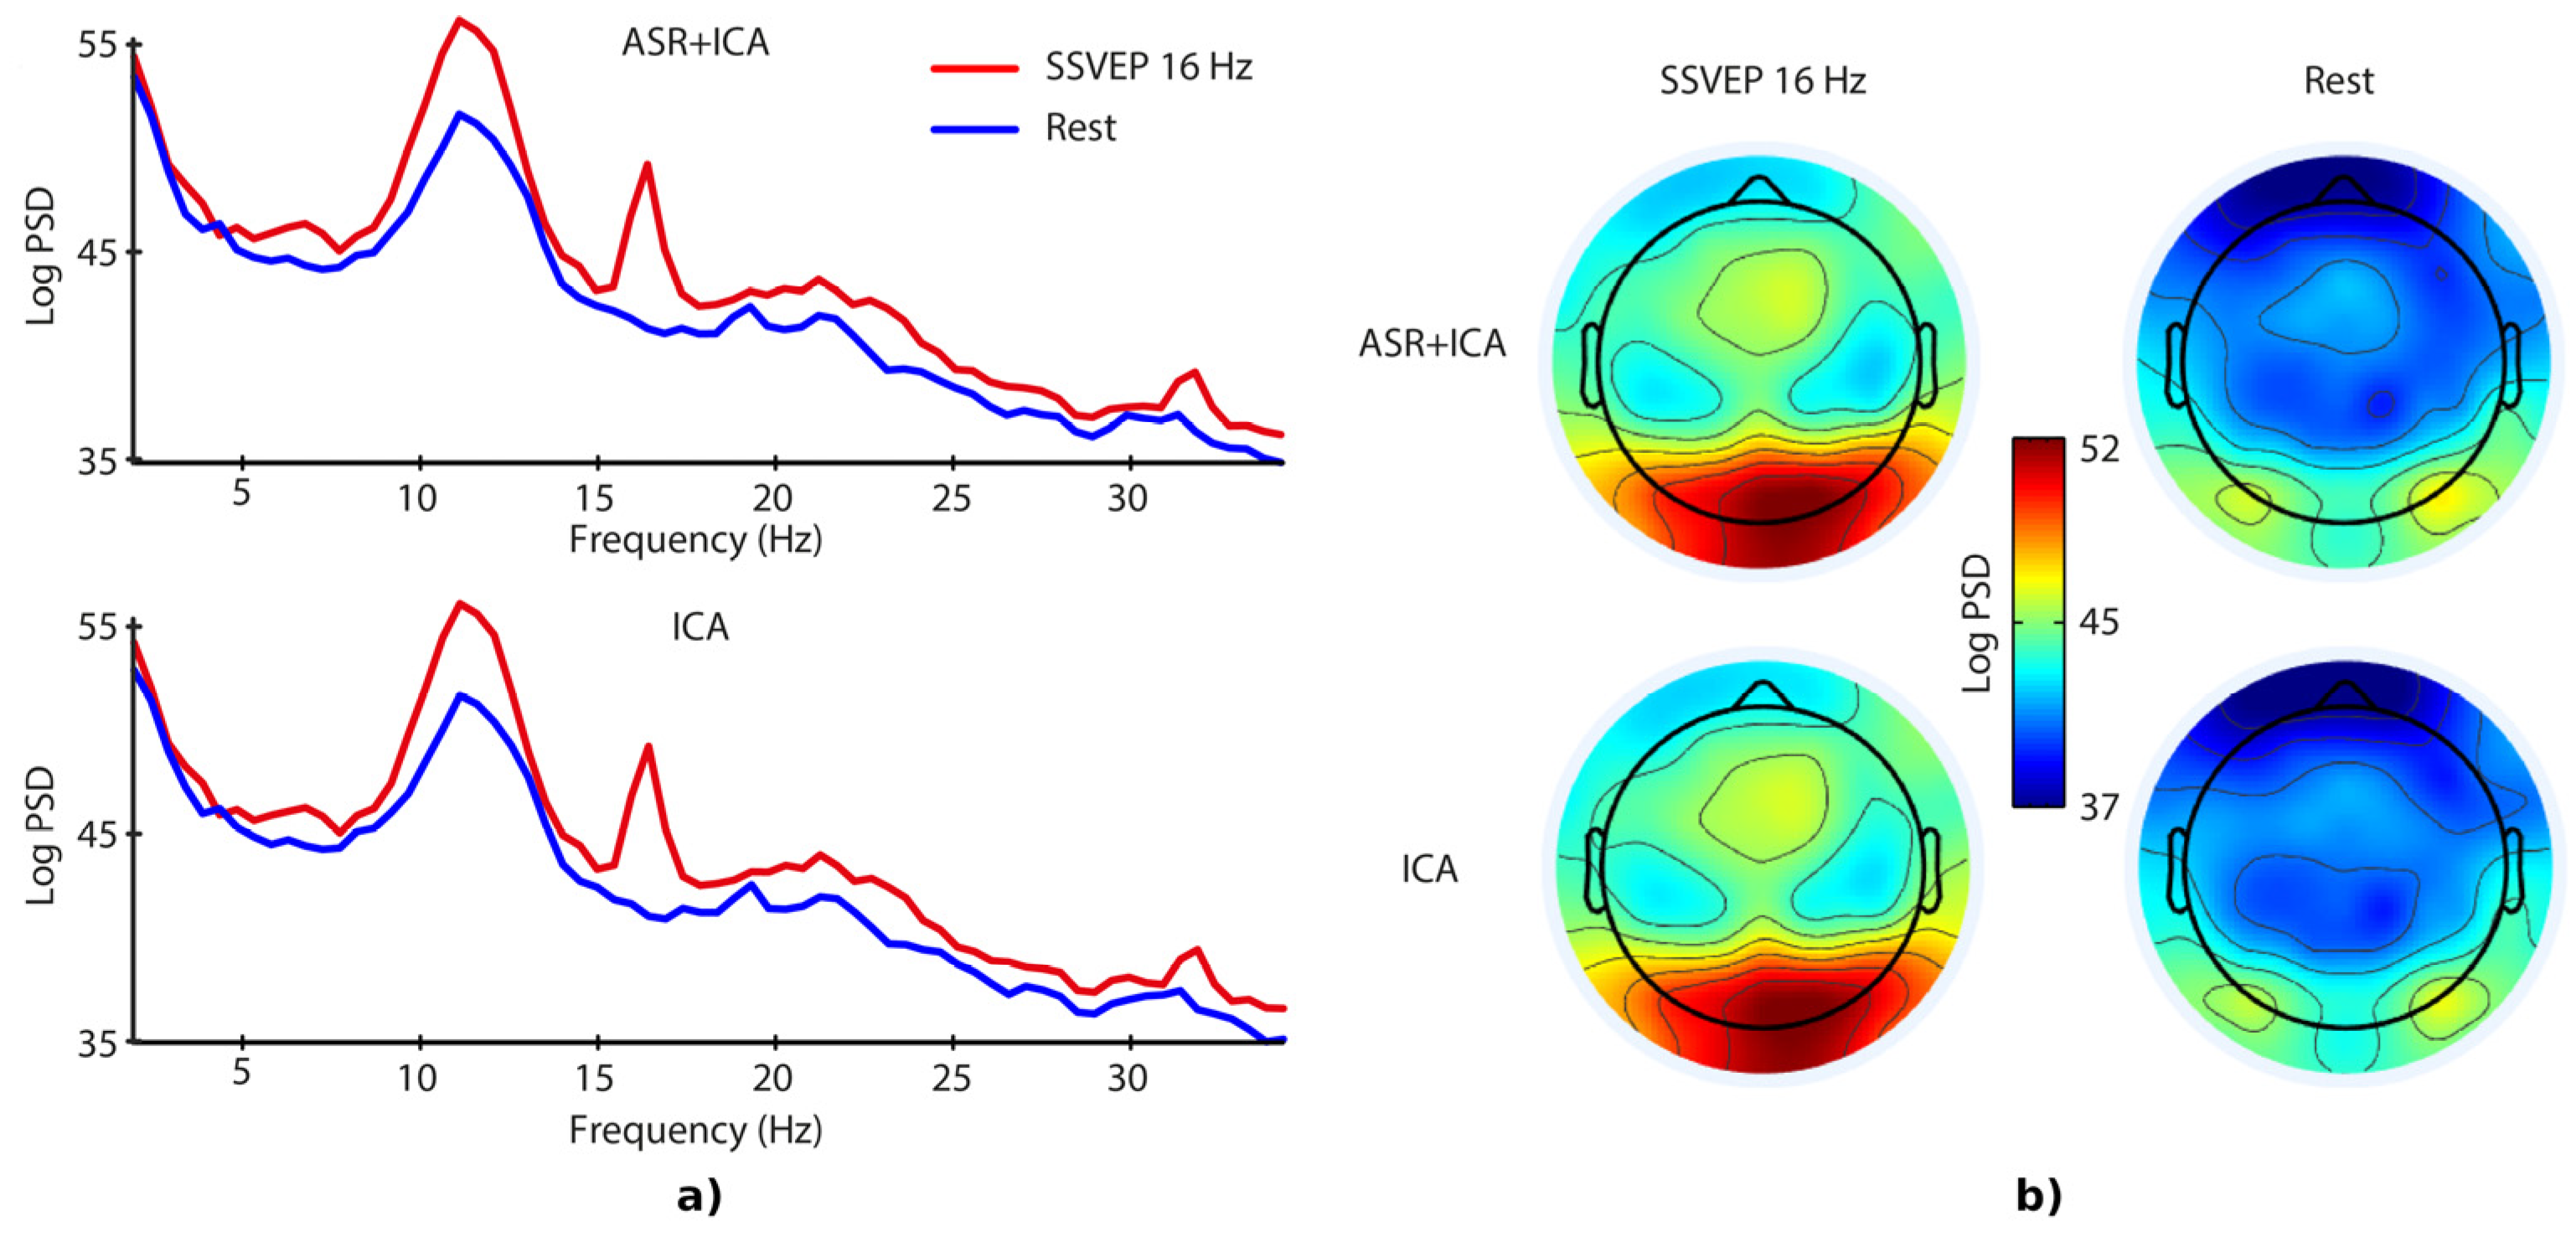
  • Stroboscopic stimulation with the eyes closed. The stroboscope was located straight above the computer screen. Participants were asked to close their eyes as soon as they heard a brief sound and keep them closed during the whole block. A strobe light was emitted at 16 Hz frequency for 8 s. There were 18 trials with 2 s blank screen breaks.
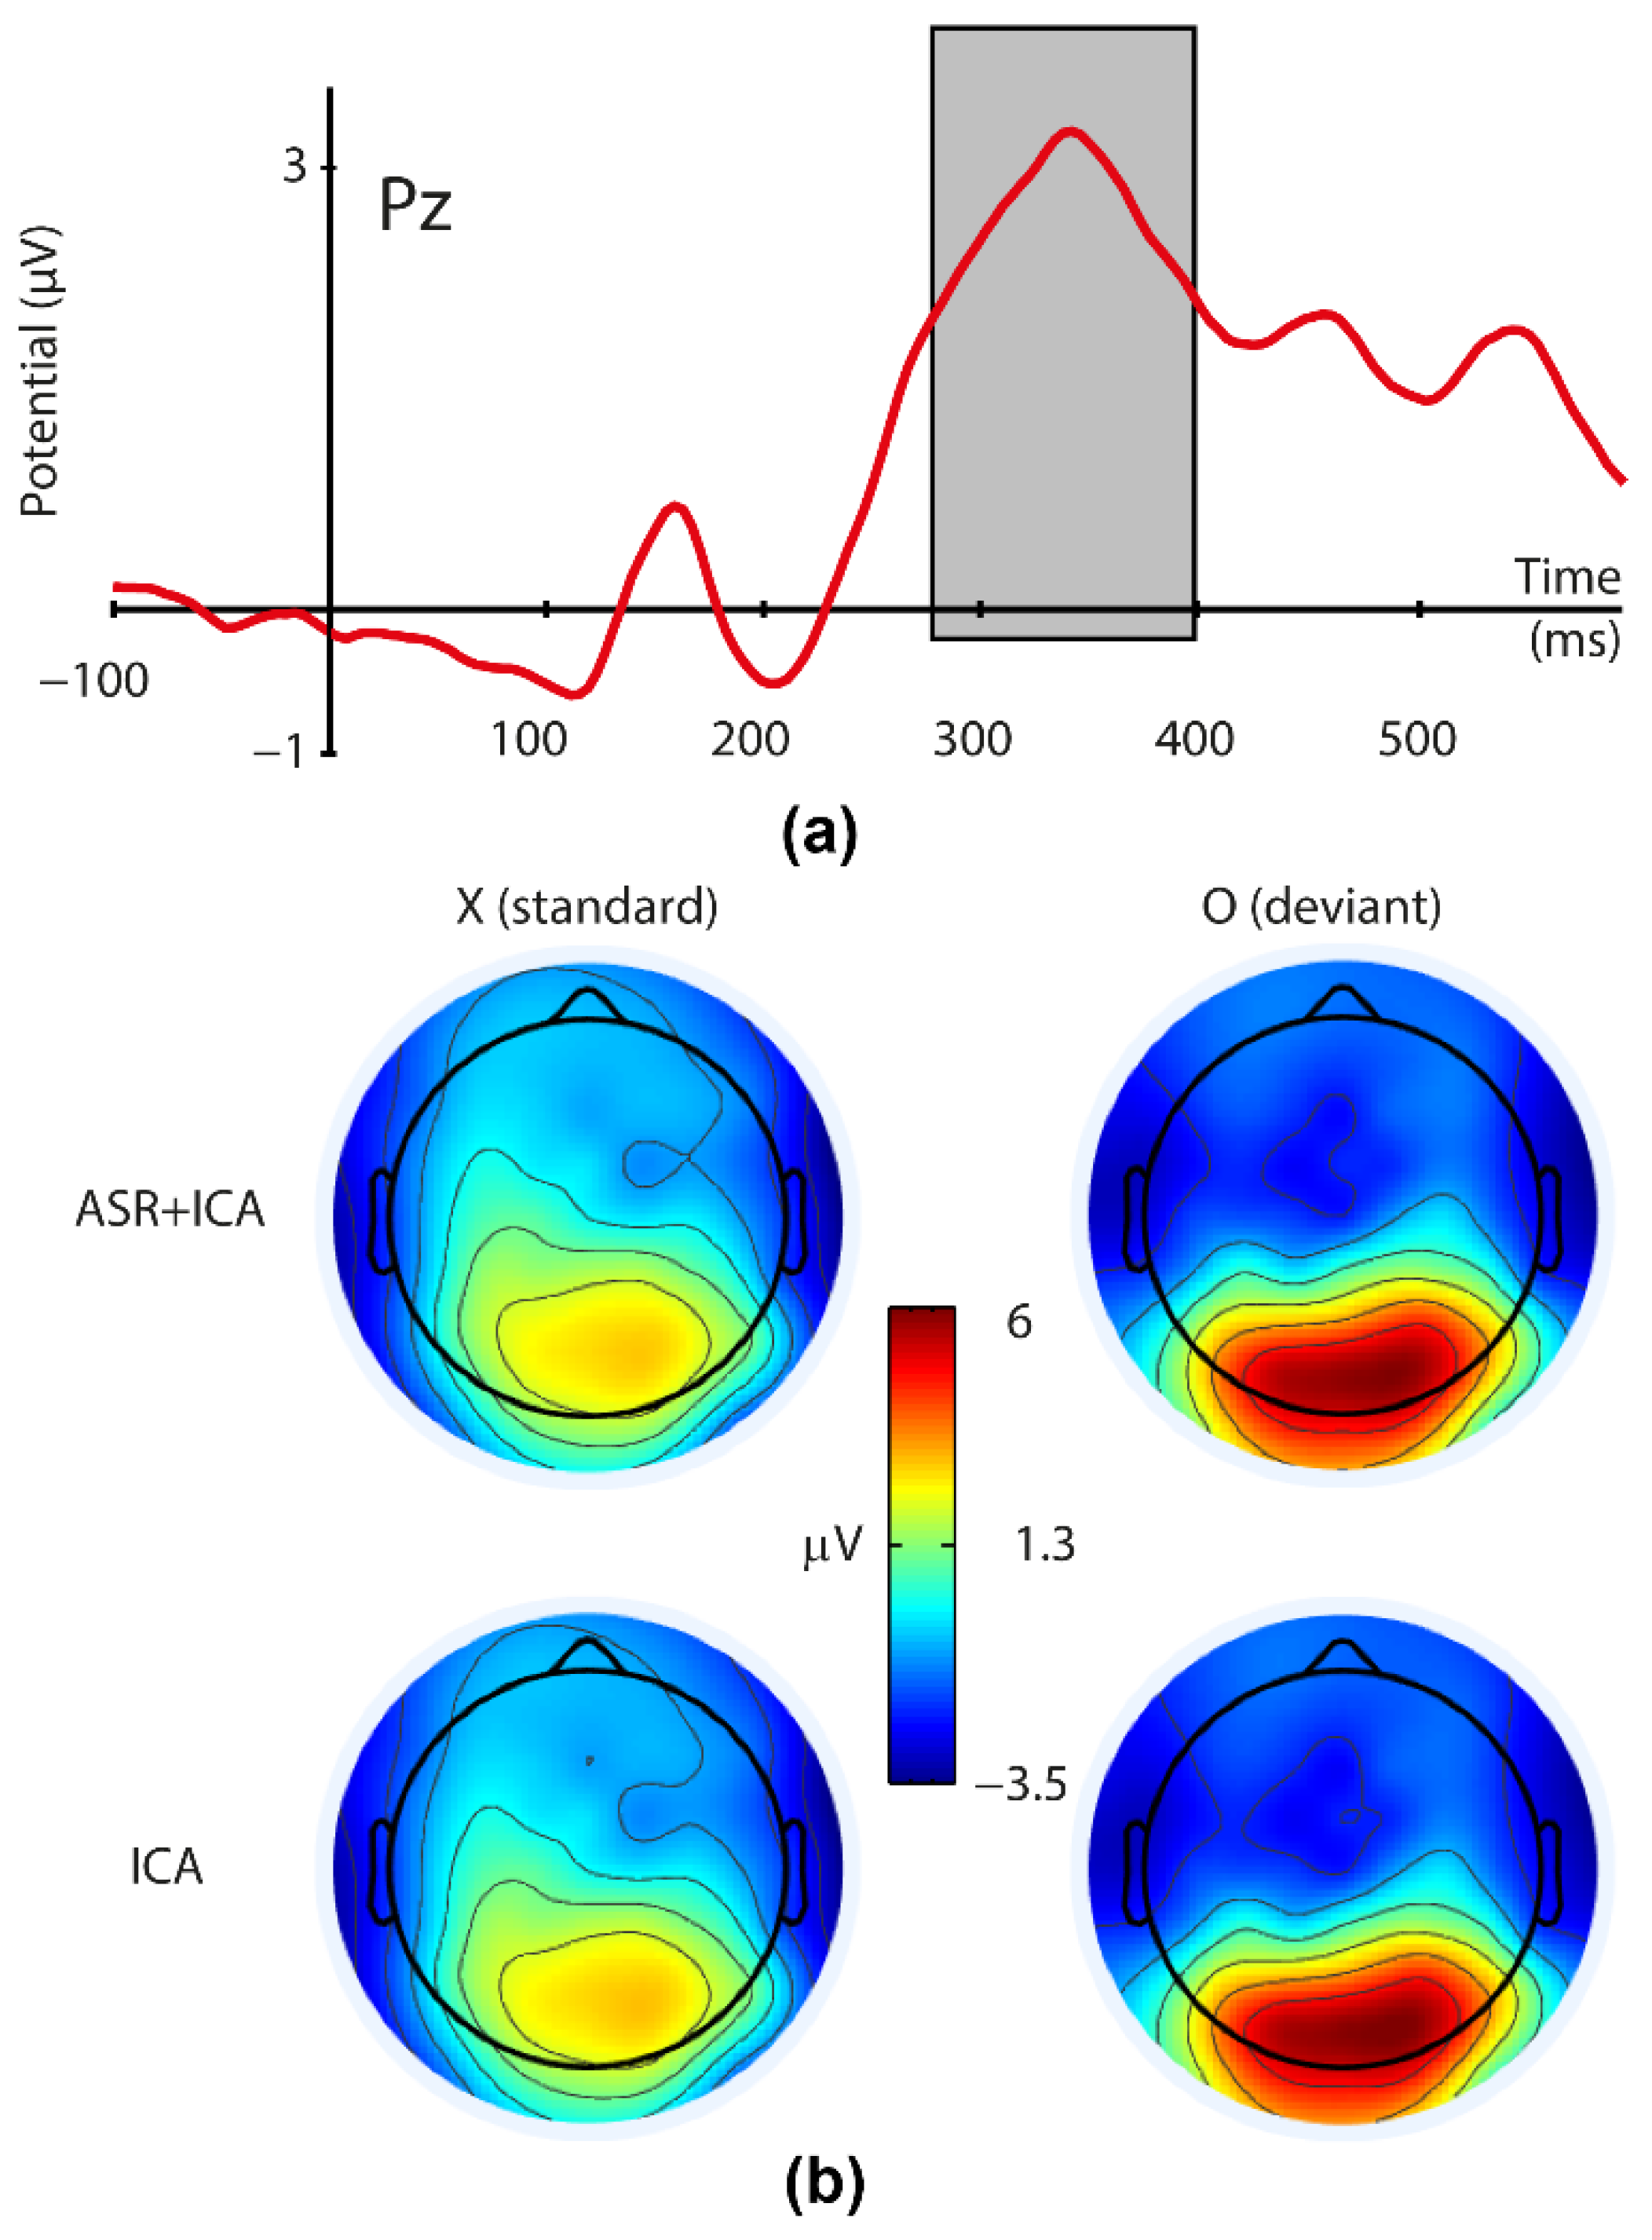
  • The oddball procedure. Sequences consisting of 80% Xs and 20% Os were presented at the center of the computer screen. The participants had to press one button for X’s and another for O’s. Each letter was displayed for 100 ms, followed by a 1400 ms blank screen interstimulus interval (ISI).
Artifacts in the signal, subjected to the analysis process, were naturally appearing artifacts related to person movements such as muscle, eye or heart artifacts and to equipment operating such as line noise, channel noise, etc.

2.4. Data Analysis

The data were processed in several stages. The same preprocessing procedure was used for all recordings (A). Then, ICA and ASR followed by the ICA (ASR + ICA) artifact-removing procedure were performed independently (B). At the next stage, different analyses were used to extract the signal features specific to the experimental procedure (C). Finally, the noise-to-signal ratio values for data sets cleaned with ASR and ICA + ASR were compared with the repeated ANOVA measures, separately for each experimental condition.

2.5. Preprocessing

The EEG data were filtered using a 256th-order finite impulse response (FIR) filter in the band below 1 Hz and above 40 Hz to remove records that did not represent brain activity. Then, all unnecessary signal fragments, such as breaks between experimental conditions, were removed from the dataset. Line noise was removed next with CleanLine EEGLab extension [46] using a sliding window which adaptively estimates sine wave amplitude to subtract. Bad channels were also removed by the means of EEGLab (using clean_rawdata EEGLab procedure with default parameters), following the parameters of the automated algorithm. Channels were identified as bad and removed if the signal is flat for more than 5 s. What is more, channels with a large amount of noise were removed based on their standard deviation (maximal acceptable threshold was set on the default value: 4) and when they were poorly correlated with other channels (the rejection threshold for channel correlation was set to default value: 0.8). Removed channels were then interpolated. The next step of the procedure was additional removal of bad data periods based on a set number of channels (default 25%) passing a standard deviation threshold in a time window. The data were subjected to the process of re-referencing the signal (CAR, common average reference) for all channels except those that had been marked as bad.

2.6. Feature Extraction

The data after the ICA and ASR followed by ICA ASR or the ICA + ASR artifacts rejection were subjected to different processing steps in order to extract the characteristics specific to the experimental procedure. For each experiment, a different electrode montage was selected for analysis and adjusted to the type of effect being measured. A signal from parietal-occipital electrodes was chosen to measure changes in the alpha band (8–13 Hz) activity over visual cortex areas during the relaxed state with eyes open and closed (P3, PZ, P4, POz, O1, and O2) [47]. We expect an increase of alpha band power spectral density (PSD) for the eyes-closed condition compared with the eyes-open condition, as it is known to be one of the strongest human electroencephalographic responses ever discovered [36,48,49]. The electrodes above the left (O1) and right (O2) visual cortex, on the other hand, were chosen to record the response to stroboscopic stimulation [50]. The P300 component, whose propagation extends from the frontal cortex, through the central-parietal area to the occipital region, was chosen as an indicator of the response to stimuli in the oddball procedure [51].
The ASR was calculated using clean_rawdata (EEGLab plugin) with parameter standard deviation cutoff set to the default value of 20 (data regions removed if they exceed 20 times the standard deviation). We decided to leave the default value of the standard deviation cutoff parameter after visual inspection of results. The ICA was applied to remove artifactual components based on ICLabel (EEGLab plugin). No-brain components were removed. The method of data analysis is shown in Figure 2.

3. Results

The analysis of signal-to-noise ratio differences between ASR + ICA and the ICA conditions was performed with the repeated measures ANOVA test for each procedure independently. A Bonferroni correction [52] was applied to avoid false-positive results due to multiple post hoc comparisons (type I errors).

3.1. Resting-State with Eyes Open/Eyes Closed

There were no significant differences in signal-to-noise ratio calculated for the power of alpha band (8–13 Hz) from P3, PZ, P4, POz, O1, and O2 positions (Channel F (1, 9) = 1.432; p = 0.266; Methods x Channel F (1, 9) = 1.03; p = 0.339). Figure 3 shows the power spectral density from channel POz and distribution of alpha band on the skull during both experimental conditions.

3.2. Stroboscopic Stimulation with Eyes Closed

There were no significant differences in signal-to-noise ratio between the ICA and ASR + ICA conditions calculated for the stimulation frequency (16 Hz) from O1 and O2 positions (Methods F (1, 9) = 0.378; p = 0.554; Channel F (1, 9) = 3.623; p = 0.089; Methods x Channel F (1, 9) = 0.08; p = 0.789). Figure 4 shows power spectral density from channel Oz and distribution of 16 Hz frequency on the skull during both experimental conditions.

3.3. Oddball Procedure

We found significant differences in signal-to-noise ratio between ICA and ASR + ICA conditions calculated for the P300 component from positions FZ, FCz, C3, Cz, C4, CPz, P7, P3, Pz, P4, P8, PO, PO3, POz, PO4, PO8, O1, Oz, and O2 for the factors: Stimuli F (1, 8) = 6.698; p = 0.029, ηp2  = 0.43; Channel F (1, 8) = 5.363; p < 0.001, ηp2 = 0.37, and interaction Stimuli x Channel F (1, 18) = 1.814; p = 0.027, ηp2 = 0.17. The overall SNR ratio was higher for the stimulus X (M = 16.78, SE = 3.53) than O (M = 6.44, SE = 3.53). However, the post hoc comparisons with Bonferroni correction did not confirm that these differences between stimulus O and X occurred on specific channels. Figure 5 shows the average ERP from Pz location and distribution of amplitude averaged for the P300 time window.

4. Discussion

The result of ASR + ICA and the ICA comparison in stroboscopic stimulation, oddball, and resting state procedures did not show significant differences. A possible explanation for the significant effect of factor stimuli in oddball condition is that stimulus X was presented five times more frequently than stimulus O during the experiment. The interaction of stimuli and channel factors in the same analysis did not indicate that the difference between X and O stimuli occurred regularly on the specific channels. These differences may be explained by differences in the number of trials averaging in both conditions.
The results of all experimental conditions might be interpreted as that both methods, ICA and ASR + ICA, allow for achieving a similar quality of the signal. Assuming that ICA is a widely known and commonly applied algorithm proven to be efficient in EEG artifact analysis, the comparison of ASR + ICA and ICA approaches shows that the signal might be cleared with an ASR method without data loss. Considering the fact that ASR is automated, significantly faster and therefore more convenient to use than manual artifact removal, it might be successfully used in the process of EEG data analysis. It could be also a special advantage in cases where signal processing is conducted in real time, e.g., to control brain–computer interfaces.
However, our study does not answer all the questions about the potential advantages or disadvantages of automatic signal correction algorithms. There are a number of methods of EEG analysis with specific requirements for the preprocessing of data, such as connectivity or source-localisation. Additionally, there are markers in the electroencephalogram data typical of special clinical groups or research paradigms, e.g., epileptic seizures. The influence of automatic signal correction on the reliability of these effects requires further research, as well as comparing the results of signal classification by algorithms with the indications of neurophysiological experts.
From the view of computational cost, continuing the ICA analysis with the use of ASR does not affect the pipeline exhaustedly. Computational cost of ICA method (estimated for FastICA implementation) is O(2md(d + 1)n), where n is the number of samples, d is the dimension and m is the number of iterations [53]. The computational cost of ASR, which is based on the PCA method, is O(d2(d + 1)n) [53] on the assumption that PCA is performed in ASR for data chunks into which the signal is divided. The ICA is a method of non-closed form solution, so its algorithms use iterative procedures with problems of convergence difficulties or high computational load [30]. The PCA-based ASR has a closed-form solution and its operation time is very fast compared with ICA, and the result is achieved in a fraction of the time needed to complete the ICA procedure. Even though the selection of the k parameter in the ASR procedure [27] might affect the calculation performance slightly, such a potential performance loss is not felt throughout the whole procedure. That is why, from the computational point of view, adding ASR to the procedure does not affect the time of calculations.

5. Conclusions

Our research was the first attempt to compare the effectiveness of two approaches to automatic EEG data correction on data from popular experimental procedures. Statistical comparisons were made on the results of commonly used data analysis methods in time, frequency or time-frequency domains. There was a high similarity in the signal-to-noise ratio after applying independently ICA or ASR + ICA to the same data. This may lead us to the conclusion that both approaches provide very similar effects in the form of signal quality improvement. At the same time, the use of ASR could be more efficient than manual artifact removal.
The article had the following limitations. The number of participants having taken part in the experiment can be increased in order to obtain more diverse signal samples. Publicly available datasets could be utilised in the experiment. Such an approach allows comparing results with others and enables other researchers to repeat the experiment. Another limitation of the research is that, although we did not notice differences, they might be found during analysis using different implementations or different parameters of applied methods. Potential influences on the analysis might also be present when using different window sizes or different sampling frequencies. All these aspects constitute an area for further research, as results might change. Especially, various implementations of the methods, for instance, different versions of the clean raw data procedure or ICA method implementations should be used with caution. These issues were not discussed in this paper, as we used the most typical configuration and we did not consider different versions of applied methods. However, if major changes were applied to these methods, they may affect the obtained results. Our further studies will focus on addressing the abovementioned limitations.

Author Contributions

Conceptualisation, D.Z., M.P.-W.; methodology, D.Z., M.P.-W., P.A., E.Z.-M.; validation, D.Z., M.P.-W.; formal analysis, M.P.-W., M.K., D.Z.; resources, D.Z., E.Z.-M.; data curation, M.P.-W., M.K.; writing—original draft preparation, M.P.-W., M.K., D.Z.; writing—review and editing, M.P.-W., D.Z.; visualisation, P.A., M.P.-W. All authors have read and agreed to the published version of the manuscript.

Funding

This research received no external funding.

Institutional Review Board Statement

The experiment was conducted in compliance with the Declaration of Helsinki and approved by the University Research Ethics Committee of Lublin University of Technology (approval no: 8/2019).

Informed Consent Statement

Informed consent was obtained from all subjects involved in the study.

Data Availability Statement

The data that support the findings of this study are available from the corresponding author, upon reasonable request.

Acknowledgments

We would like to thank Agnieszka Czubak, Emilia Gołda, Jakub Janczura and Paulina Iwanowicz for their help in data registration.

Conflicts of Interest

The authors declare no conflict of interest.

References

  1. Jiang, X.; Bian, G.B.; Tian, Z. Removal of artifacts from EEG signals: A review. Sensors 2019, 19, 987. [Google Scholar] [CrossRef] [PubMed] [Green Version]
  2. Urigüen, J.A.; Garcia-Zapirain, B. EEG artifact removal-state-of-the-art and guidelines. J. Neural Eng. 2015, 12, 031001. [Google Scholar] [CrossRef] [PubMed]
  3. Leif, S.; Laguna, P. Bioelectrical Signal Processing in Cardiac and Neurological Applications; Elsevier Academic Press: Cambridge, MA, USA, 2005. [Google Scholar]
  4. Croft, R.J.; Barry, R.J. Removal of ocular artifacts from the EEG: A review. J. Clin. Neurophysiol. 2000, 30, 5–9. [Google Scholar] [CrossRef] [PubMed]
  5. Goncharova, I.I.; McFarland, D.J.; Vaughan, T.M.; Wolpaw, J. EMG contamination of EEG: Spectral and topographical characteristics. J. Clin. Neurophysiol. 2003, 114, 1580–1593. [Google Scholar] [CrossRef]
  6. Fish, B.J. Fisch and Spehlmann’s EEG Primer: Basic Principles of Digital and Analog EEG; Elsevier: Cambridge, MA, USA, 1999. [Google Scholar]
  7. Mannan, M.M.N.; Kamran, M.A.; Jeong, M.Y. Identification and removal of physiological artifacts from electroencephalogram signals: A review. IEEE Access 2018, 6, 30630–30652. [Google Scholar] [CrossRef]
  8. Joyce, C.A.; Gorodnitsky, I.F.; Kutas, M. Automatic removal of eye movement and blink artifacts from EEG data using blind component separation. Psychophysiology 2004, 41, 313–325. [Google Scholar] [CrossRef] [Green Version]
  9. Ahmed, M.; Iqubal, Z.; Sinha, N.; Ghaderpour, E.; Phadikar, S.; Ghosh, R. A Novel Baseline Removal Paradigm for Subject-Independent Features in Emotion Classification Using EEG. Bioengineering 2023, 10, 54. [Google Scholar] [CrossRef]
  10. Delorme, A.; Sejnowski, T.; Makeig, S. Enhanced detection of artifacts in EEG data using higher-order statistics and independent component analysis. NeuroImage 2007, 34, 1443–1449. [Google Scholar] [CrossRef] [Green Version]
  11. Jung, T.P.; Makeig, S.; McKeown, M.J.; Bell, A.J.; Lee, T.W.; Sejnowski, T.J. Imaging brain dynamics using Independent Component Analysis. Proc. IEEE Inst. Electr. Electron. Eng. 2001, 89, 1107–1122. [Google Scholar] [CrossRef]
  12. Berg, P.; Scherg, M. Dipole modelling of eye activity and its application to the removal of eye artefacts from the EEG and MEG. Clin. Phys. Physiol. Meas. 1991, 12, 49–54. [Google Scholar] [CrossRef]
  13. DeClercq, W.; Vergult, A.; Vanrumste, B.; VanPaesschen, W.; VanHuffel, S. Canonical correlation analysis applied to remove muscle artifacts from the electroencephalogram. IEEE Trans. Biomed. Eng. 2006, 53, 2583–2587. [Google Scholar] [CrossRef] [PubMed]
  14. Lee, T.W.; Girolami, M.; Sejnowski, T.J. Independent component analysis using an extended infomax algorithm for mixed subgaussian and supergaussian sources. Neural Comput. 1999, 11, 417–441. [Google Scholar] [CrossRef] [PubMed]
  15. Wang, Z.; Peng, X.; TieJun, L.; Yin, T.; Xu, L.; DeZhong, Y. Robust removal of ocular artifacts by combining Independent Component Analysis and system identification. Biomed. Signal Process. Control 2014, 10, 250–259. [Google Scholar] [CrossRef]
  16. Raduntz, T.; Scouten, J.; Hochmuth, O.; Meffert, B. EEG artifact elimination by extraction of ICA-component features using image processing algorithms. J. Neurosci. Methods 2015, 243, 84–93. [Google Scholar] [CrossRef] [PubMed] [Green Version]
  17. Delorme, A.; Palmer, J.; Onton, J.; Oostenveld, R.; Makeig, S. Independent EEG sources are dipolar. PLoS ONE 2012, 7, e30135. [Google Scholar] [CrossRef]
  18. Kothe, C.A.; Makeig, S. BCILAB: A platform for brain-computer interface development. J. Neural Eng. 2013, 10, 056014. [Google Scholar] [CrossRef] [Green Version]
  19. Mullen, T.R.; Kothe, C.A.E.; Chi, Y.M.; Ojeda, A.; Kerth, T.; Makeig, S.; Jung, T.P.; Cauwenberghs, G. Real-time neuroimaging and cognitive monitoring using wearable dry EEG. IEEE Trans. Bio-Med. Eng. 2015, 62, 2553–2567. [Google Scholar] [CrossRef] [Green Version]
  20. Kothe, C.A.E.; Jung, T.P. Artifact Removal Techniques with Signal Reconstruction. U.S. Patent Application No. 14/895,440, 3 June 2014. [Google Scholar]
  21. Pion-Tonachini, L.; Hsu, S.H.; Chang, C.Y.; Jung, T.P.; Makeig, S. Online automatic artifact rejection using the real-time EEG source-mapping toolbox (REST). Proceedings of 2018 40th Annual International Conference of the IEEE Engineering in Medicine and Biology Society (EMBC), Honolulu, HI, USA, 18–21 July 2018; pp. 106–109. [Google Scholar]
  22. Chang, C.Y.; Hsu, S.H.; Pion-Tonachini, L.; Jung, T.P. Evaluation of Artifact Subspace Reconstruction for Automatic Artifact Components Removal in Multi-channel EEG Recordings. IEEE Trans. Biomed. Eng. 2019, 67, 1114–1121. [Google Scholar] [CrossRef]
  23. Bulea, T.C.; Prasad, S.; Kilicarslan, A.; Contreras-Vidal, J.L. Sitting and standing intention can be decoded from scalp EEG recorded prior to movement execution. Front. Neurosci. 2014, 8, 376. [Google Scholar] [CrossRef] [Green Version]
  24. Bulea, T.C.; Kim, J.; Damiano, D.L.; Stanley, C.J.; Park, H.S. Prefrontal, posterior parietal and sensorimotor network activity underlying speed control during walking. Front. Hum. Neurosci. 2015, 9, 247. [Google Scholar] [CrossRef]
  25. Kumaravel, V.P.; Buiatti, M.; Farella, E. Hyperparameter selection for reliable EEG denoising using ASR: A benchmarking study. In Proceedings of the 2021 IEEE International Conference on Bioinformatics and Biomedicine (BIBM), Houston, TX, USA, 9–12 December 2021; pp. 3638–3641. [Google Scholar]
  26. Chang, C.Y.; Hsu, S.H.; Pion-Tonachini, L.; Jung, T.P. Evaluation of Artifact Subspace Reconstruction for Automatic EEG Artifact Removal. In Proceedings of the 2018 40th Annual International Conference of the IEEE Engineering in Medicine and Biology Society (EMBC), Honolulu, HI, USA, 17–21 July 2018; pp. 1242–1245. [Google Scholar]
  27. Cataldo, A.; Criscuolo, S.; De Benedetto, E.; Masciullo, A.; Pesola, M.; Schiavoni, R.; Invitto, S. A Method for Optimizing the Artifact Subspace Reconstruction Performance in Low-Density EEG. IEEE Sens. J. 2022, 22, 21257–21265. [Google Scholar] [CrossRef]
  28. Anders, P.; Müller, H.; Skjaeret-Maroni, N.; Vereijken, B.; Baumeister, J. The influence of motor tasks and cut-off parameter selection on artifact subspace reconstruction in EEG recordings. Med. Biol. Eng. Comput. 2020, 58, 2673–2683. [Google Scholar] [CrossRef] [PubMed]
  29. Kumaravel, V.P.; Kartsch, V.; Benatti, S.; Vallortigara, G.; Farella, E.; Buiatti, M. Efficient artifact removal from low-density wearable EEG using artifacts subspace reconstruction. In Proceedings of the 2021 43rd Annual International Conference of the IEEE Engineering in Medicine & Biology Society (EMBC), Mexico City, Mexico, 1–5 November 2021; pp. 333–336. [Google Scholar]
  30. Blum, S.; Jacobsen, N.; Bleichner, M.G.; Debener, S. A Riemannian modification of Artifact Subspace Reconstruction for EEG artifact handling. Front. Hum. Neurosci. 2019, 13, 141. [Google Scholar] [CrossRef] [PubMed]
  31. Tsai, B.Y.; Diddi, S.V.S.; Ko, L.W.; Wang, S.J.; Chang, C.Y.; Jung, T.P. Development of an Adaptive Artifact Subspace Reconstruction Based on Hebbian/Anti-Hebbian Learning Networks for Enhancing BCI Performance. IEEE Trans. Neural Netw. Learn. Syst. 2022, 1, 1–14. [Google Scholar] [CrossRef]
  32. Van, L.D.; Tu, Y.C.; Chang, C.Y.; Wang, H.J.; Jung, T.P. Hardware-Oriented Memory-Limited Online Artifact Subspace Reconstruction (HMO-ASR) Algorithm. IEEE Trans. Circuits Syst. II Express Briefs 2021, 68, 3493–3497. [Google Scholar] [CrossRef]
  33. Button, K.S.; Ioannidis, J.; Mokrysz, C.; Nosek, B.A.; Flint, J.; Robinson, E.S.; Munafò, M.R. Power failure: Why small sample size undermines the reliability of neuroscience. Nat. Rev. Neurosci. 2013, 14, 365–376. [Google Scholar] [CrossRef] [Green Version]
  34. Klug, M.; Gramann, K. Identifying key factors for improving ICA-based decomposition of EEG data in mobile and stationary experiments. Eur. J. Neurosci. 2021, 54, 8406–8420. [Google Scholar] [CrossRef]
  35. Custo, A.; Van De Ville, D.; Wells, W.M.; Tomescu, M.; Brunet, D.; Michel, C.M. Electroencephalographic Resting-State Networks: Source Localization of Microstates. Brain Connect 2017, 7, 671–682. [Google Scholar] [CrossRef]
  36. Barry, R.J.; Clarke, A.R.; Johnstone, S.J.; Magee, C.A.; Rushby, J.A. EEG differences between eyes-closed and eyes-open resting conditions. Clin. Neurophysiol. 2007, 118, 2765–2773. [Google Scholar] [CrossRef] [PubMed]
  37. Cohn, N.B.; Dustman, R.E.; Shearer, D.E. The effect of age, sex and interstimulus interval on augmenting and reducing of occipital VEPs. Electroencephalogr. Clin. Neurophysiol./Evoked Potentials Sect. 1985, 62, 177–183. [Google Scholar] [CrossRef] [PubMed]
  38. Bin, G.; Gao, X.; Yan, Z.; Hong, B.; Gao, S. An online multi-channel SSVEP-based brain-computer interface using a canonical correlation analysis method. J. Neural Eng. 2009, 6, 046002. [Google Scholar] [CrossRef] [PubMed]
  39. Squires, N.K.; Squires, K.C.; Hillyard, S.A. Two varieties of long-latency positive waves evoked by unpredictable auditory stimuli in man. Electroencephalogr. Clin. Neurophysiol. 1975, 38, 387–401. [Google Scholar] [CrossRef] [PubMed]
  40. Picton, W.T. The P300 wave of the human event-related potential. J. Clin. Neurophysiol. 1992, 9, 456–479. [Google Scholar] [CrossRef] [PubMed]
  41. Katayama, J.I.; Polich, J. P300 from one-, two-, and three-stimulus auditory paradigms. Int. J. Psychophysiol. 1996, 23, 33–40. [Google Scholar] [CrossRef]
  42. Polich, J. Updating P300: An integrative theory of P3a and P3b. Clin. Neurophysiol. 2007, 118, 2128–2148. [Google Scholar] [CrossRef] [Green Version]
  43. Fazel-Rezai, R.; Allison, B.Z.; Guger, C.; Sellers, E.W.; Kleih, S.C.; Kübler, A. P300 brain computer interface: Current challenges and emerging trends. Front. Neuroeng. 2007, 5, 14. [Google Scholar] [CrossRef] [Green Version]
  44. Delorme, A.; Makeig, S. EEGLAB: An open source toolbox for analysis of single-trial EEG dynamics including independent component analysis. J. Neurosci. Methods 2004, 134, 9–21. [Google Scholar] [CrossRef] [Green Version]
  45. Pion-Tonachini, L.; Kreutz-Delgado, K.; Makeig, S. ICLabel: An automated electroencephalographic independent component classifier, dataset, and website. NeuroImage 2019, 198, 181–197. [Google Scholar] [CrossRef] [Green Version]
  46. Mullen, T. CleanLine EEGLAB Plugin; Neuroimaging Informatics Tools and Resources Clearinghouse (NITRC): San Diego, CA, USA, 2012. [Google Scholar]
  47. Bellato, A.; Arora, I.; Kochhar, P.; Hollis, C.; Groom, M.J. Atypical electrophysiological indices of eyes-open and eyes-closed resting-state in children and adolescents with ADHD and autism. Brain Sci. 2020, 10, 272. [Google Scholar] [CrossRef]
  48. Berger, H. Über das elektrenkephalogramm des menschen. Arch. Psychiatr. Nervenkrankh. 1933, 98, 231–254. [Google Scholar] [CrossRef]
  49. Adrian, E.D.; Matthews, B.H. The Berger rhythm: Potential changes from the occipital lobes in man. Brain 1934, 57, 355–385. [Google Scholar] [CrossRef]
  50. Müller-Putz, G.R.; Eder, E.; Wriessnegger, S.C.; Pfurtscheller, G. Comparison of DFT and lock-in amplifier features and search for optimal electrode positions in SSVEP-based BCI. J. Neurosci. Methods 2008, 168, 174–181. [Google Scholar] [CrossRef] [PubMed]
  51. Polich, J.; Margala, C. P300 and probability: Comparison of oddball and single-stimulus paradigms. Int. J. Psychophysiol. 1997, 25, 169–176. [Google Scholar] [CrossRef] [PubMed]
  52. Armstrong, R.A. When to use the Bonferroni correction. Ophthalmic Physiol. Opt. 2014, 34, 502–508. [Google Scholar] [CrossRef]
  53. Laparra, V.; Camps-Valls, G.; Malo, J. Iterative gaussianization: From ICA to random rotations. IEEE Trans. Neural Netw. 2011, 22, 537–549. [Google Scholar] [CrossRef] [PubMed]
Figure 1. Outline of the experimental procedures: (a) resting state with the eyes open and eyes closed; (b) stroboscopic stimulation with the eyes closed; (c) the oddball ERP procedure.
Applsci 13 01605 g001
Figure 2. Data analysis procedure.
Applsci 13 01605 g002
Figure 3. Results of eyes-open/eyes-closed conditions: (a) resting-state log10 power spectrum density from channel POz; (b) maps of alpha band distribution on the skull (the upper part of the figure presents ASR + ICA and the lower part represents the ICA condition).
Applsci 13 01605 g003
Figure 4. Results of visual stimulation (SSVEP) and rest conditions: (a) power spectrum density (log10) from channel Oz; (b) maps of 16 Hz frequency distribution on the skull (the upper part of the figure presents ASR and the lower part represents the ICA condition).
Applsci 13 01605 g004
Figure 5. Results of the oddball task conditions: (a) ERP on the Pz electrode averaged across conditions; (b) scalp map of the amplitude averaged for the 280–400 ms time window.
Applsci 13 01605 g005
Disclaimer/Publisher’s Note: The statements, opinions and data contained in all publications are solely those of the individual author(s) and contributor(s) and not of MDPI and/or the editor(s). MDPI and/or the editor(s) disclaim responsibility for any injury to people or property resulting from any ideas, methods, instructions or products referred to in the content.

