Article

Automated Reconstruction of Existing Building Interior Scene BIMs Using a Feature-Enhanced Point Transformer and an Octree

1
China Railway Siyuan Survey and Design Group Co., Ltd., Wuhan 430063, China
2
Department of Civil Engineering, Southeast University, Nanjing 210096, China
*
Author to whom correspondence should be addressed.
Appl. Sci. 2023, 13(24), 13239; https://doi.org/10.3390/app132413239
Submission received: 23 October 2023 / Revised: 30 November 2023 / Accepted: 8 December 2023 / Published: 14 December 2023

Abstract

:
Building information models (BIMs) offer advantages, such as visualization and collaboration, making them widely used in the management of existing buildings. Currently, most BIMs for existing indoor spaces are manually created, consuming a significant amount of manpower and time, severely impacting the efficiency of building operations and maintenance management. To address this issue, this study proposes an automated reconstruction method for an indoor scene BIM based on a feature-enhanced point transformer and an octree. This method enhances the semantic segmentation performance of point clouds by using feature position encoding to strengthen the point transformer network. Subsequently, the data are partitioned into multiple segments using an octree, collecting the geometric and spatial information of individual objects in the indoor scene. Finally, the BIM is automatically reconstructed using Dynamo in Revit. The research results indicate that the proposed feature-enhanced point transformer algorithm achieves a high segmentation accuracy of 71.3% mIoU on the S3DIS dataset. The BIM automatically generated from the field point cloud data, when compared to the original data, has an average error of ±1.276 mm, demonstrating a good reconstruction quality. This method achieves the high-precision, automated reconstruction of the indoor BIM for existing buildings, avoiding extensive manual operations and promoting the application of BIMs for the maintenance processes of existing buildings.

1. Introduction

A BIM is a digital building information modeling technology that integrates multidimensional data, such as geometric shape, spatial relationships, material, component information, construction sequence, cost, and time of building projects into an integrated model. It is widely used in various stages, such as architectural design [1,2], construction [3], equipment management [4], and operation and maintenance [5]. Meanwhile, a BIM can effectively assist in the operation and maintenance of construction projects, promoting collaboration and communication among all areas involved in the project [6]. However, there are currently many difficulties when reconstructing indoor BIM models of existing buildings, such as indoor occlusion, high complexity [7], and the interrelationships between indoor target objects [8].
At present, there are three main methods for indoor BIM reconstructions, namely, image-based 3D reconstructions [9], traditional geometric modeling techniques [10], and point cloud-based 3D reconstruction methods [11]. The image-based 3D reconstruction method requires a large amount of image data from different perspectives [12]. Traditional geometric modeling has a high accuracy, but requires professional modeling personnel and a longer time to conduct [13]. The point cloud-based 3D reconstruction method is widely used for indoor scene 3D reconstructions, for example, using a geometric feature enhancement [14] and combining images with point clouds [15] to achieve the BIM reconstruction of indoor scenes. However, overall, most indoor BIMs are manually created by modelers referring to point clouds or on-site photos [15]. Due to the large volume of point cloud data in indoor environments and the complex spatial layout, it is difficult to model target objects in complex indoor scenes. A method based on point cloud data that can achieve rapid, accurate, and automatic BIMs of indoor scenes is still lacking, to date. This seriously hinders the application of BIMs in the operation and maintenance stages of existing buildings, and limits the development of building intelligence.
Considering the problems of low efficiency and low automation in BIM reconstructions of existing indoor scenes, this paper proposes an automated reconstruction method for BIMs of indoor scenes based on the feature-enhanced point transformer and octree algorithms. This study aims to achieve the automated semantic segmentation of indoor point cloud data through deep learning and further complete the reconstruction of the point cloud data into BIMs. This article studies the application of point cloud data to BIM indoor 3D reconstruction technology and improves the performance of the point transformer network through a feature position encoding enhancement to achieve point cloud semantic segmentation. Subsequently, the data are divided into entities using an octree to obtain the geometric and spatial information for the target subjects in the indoor scene. Finally, the BIM 3D reconstruction is completed by building Dynamo in Revit, and the accuracy of the automatically reconstructed BIM model is verified by combining the original data.
The method proposed in this study enables the rapid, accurate, and automated construction of BIMs through on-site point cloud data, avoiding the manual reconstruction process of traditional BIMs and enhancing BIM reconstruction efficiency. Addressing the challenges posed by the vast and complex spatial layout of the point cloud data for existing building interiors, it achieves the precise segmentation of intricate indoor point cloud data and the automated reconstruction of high-quality BIMs. This approach provides data support for the application of BIMs in the operation and maintenance of existing buildings.

2. Literature Review

2.1. Semantic Segmentation

Semantic segmentation is the segmentation of object targets in an image based on predefined semantic categories, providing consistent semantic information. Different information expressed by each object in the image is obtained through the texture features, scene information, and other higher-order semantic features of the image itself [16]. Traditional point cloud segmentation algorithms usually use basic features, such as geometric features, and the color information of point clouds to design feature describers, and then establish feature filters based on these feature describers for segmentation [17]. Currently, more and more research is applying convolutional neural networks to point cloud semantic segmentation; typical examples include PointNet [18], PointNet++ [19], etc. The transformer network utilizes a self-attention mechanism to learn the correlation between different positions in a sequence [20]. Through the similarity between point cloud features and natural language features, transformer and its optimization models have been proven to present strong learning abilities in point cloud classification and segmentation tasks [21]. Transformer has been widely used for point cloud data segmentation, such as plant point clouds [22], autonomous driving point clouds [23], etc. In addition, a large number of studies have been conducted to optimize transformers, such as SAT3D [24], Mask3D [25], etc.
However, due to the complexity of indoor environments, semantic segmentation in indoor scenes remains a challenging task. To date, the methods for indoor point cloud data segmentation focus on large-scale planar structures, ignoring other sharp structures and details, which lead to a decrease in the accuracy of a scene’s reconstruction [26]. At the same time, the large volume of point cloud data created by the complexity of indoor scenes causes segmentation algorithms to consume a lot of time [27]. Numerous studies have been conducted on the accuracy and efficiency of point cloud segmentation in indoor scenes [28,29]. The research improves the transformer model and achieves the rapid and high-precision segmentation of indoor large-scale point cloud data through attention and feature enhancement modules.

2.2. Object Segmentation

Object segmentation aims to extract different objects or targets from images or 3D data. The goal is to divide the input data into multiple semantic subregions or objects, each representing an independent entity in the image or scene. Currently, there are four main categories of objection segmentation methods: threshold based [30], edge detection based [31], region based [32], and deep learning based [33]. Similar to image semantic segmentation, more and more research is focusing on the application of deep learning in the object segmentation method. The main research can be divided into fully supervised [34], weakly supervised [35], and interactive 3D-object segmentation [36]. However, object segmentation through deep learning also requires a large amount of data support, especially for a point cloud data annotation with a dense 3D point cloud segmentation, which is more time-consuming. In addition, the accuracy (IoU) of object segmentation achieved through deep learning is currently not perfect [37].
Octree is a typical spatial-based objection segmentation algorithm that presents advantages, such as efficient spatial utilization, rapid search ability, flexibility, visualization, and parallel processing when processing 3D spatial data [38]. It can efficiently process and manage 3D data, providing rapid search and segmentation outcomes, making objection segmentation tasks more efficient and accurate. The octree algorithm is currently applied in point cloud compression [39]), surface reconstruction [40], and other fields. This study achieved objection segmentation-based semantic segmentation results through octree, providing data support for the subsequent establishment of the monomer BIM.

2.3. Reconstruction of an Existing Building BIM

A BIM (building information model) is a digital building information modeling technology that is currently widely used in various stages of construction. For existing buildings, such as historical and cultural buildings, large shopping malls, office buildings, etc., BIMs can provide important visual digital support for building protection, operation, and maintenance purposes [41]. According to the existing sources of building data, BIM reconstruction can be divided into reconstructions based on on-site and remote data [42].
Remote data mainly includes CAD drawings [43] and corresponding drawings’ images [44] for the purpose of the reconstruction. In this study, the existing indoor scenes of buildings involving a large number of non-forward designed objects (such as tables, chairs, etc., in conference rooms) were clearly not suitable for BIM reconstructions produced from the remote data. The reconstruction of on-site data mainly combined on-site point cloud data [45,46] and image data [47]. Image-based methods mainly use image processing techniques to extract features in order to recognize target building objects and reconstruct 3D models from building images [48]. Point cloud-based methods typically only construct geometric models and need to be combined with other algorithms to further generate informative models [49]. Point cloud data has high requirements for measurement equipment and is prone to noise interference. The processing of large-scale data also requires data processing software. These original point clouds cannot be directly used to generate 3D models [50]. Therefore, a series of point cloud processing technologies are being continuously developed, such as point cloud preprocessing, point cloud segmentation, and point cloud object recognition [45,51,52]. This study used point cloud data as the raw data to reconstruct the indoor scenes of existing buildings. The point cloud data were processed through point transformer and octree, and finally, a BIM 3D reconstruction was completed through building Dynamo in Revit.

3. Methodology

This paper aimed to achieve the automatic semantic segmentation of indoor point cloud data through deep learning, followed by the reconstruction of point cloud data into a BIM. As illustrated in Figure 1, the research initially enhanced the point transformer network through feature position encoding and ball tree sampling to improve the performance of the point cloud semantic segmentation, enabling the computers to analyze objects in a three-dimensional scene. The optimized point cloud semantic segmentation model underwent pre-training and feasibility testing on the S3DIS dataset. Subsequently, the segmented point cloud data were divided into multiple entities using an octree to obtain the geometric and spatial information of target objects in indoor scenes. The obtained geometric and spatial information of entities were used in Revit, through Dynamo, to create BIM three-dimensional reconstructions, mapping the digital world to the physical world. The accuracy of the automatically reconstructed BIM was verified by assessing the average distance error during the fitting process of the BIM with the original point cloud data. The feasibility of the proposed method was validated through the collection of on-site meeting-room point cloud data. The feature-enhanced point transformer and octree algorithm proposed in this study are detailed in the subsequent sections in this chapter.

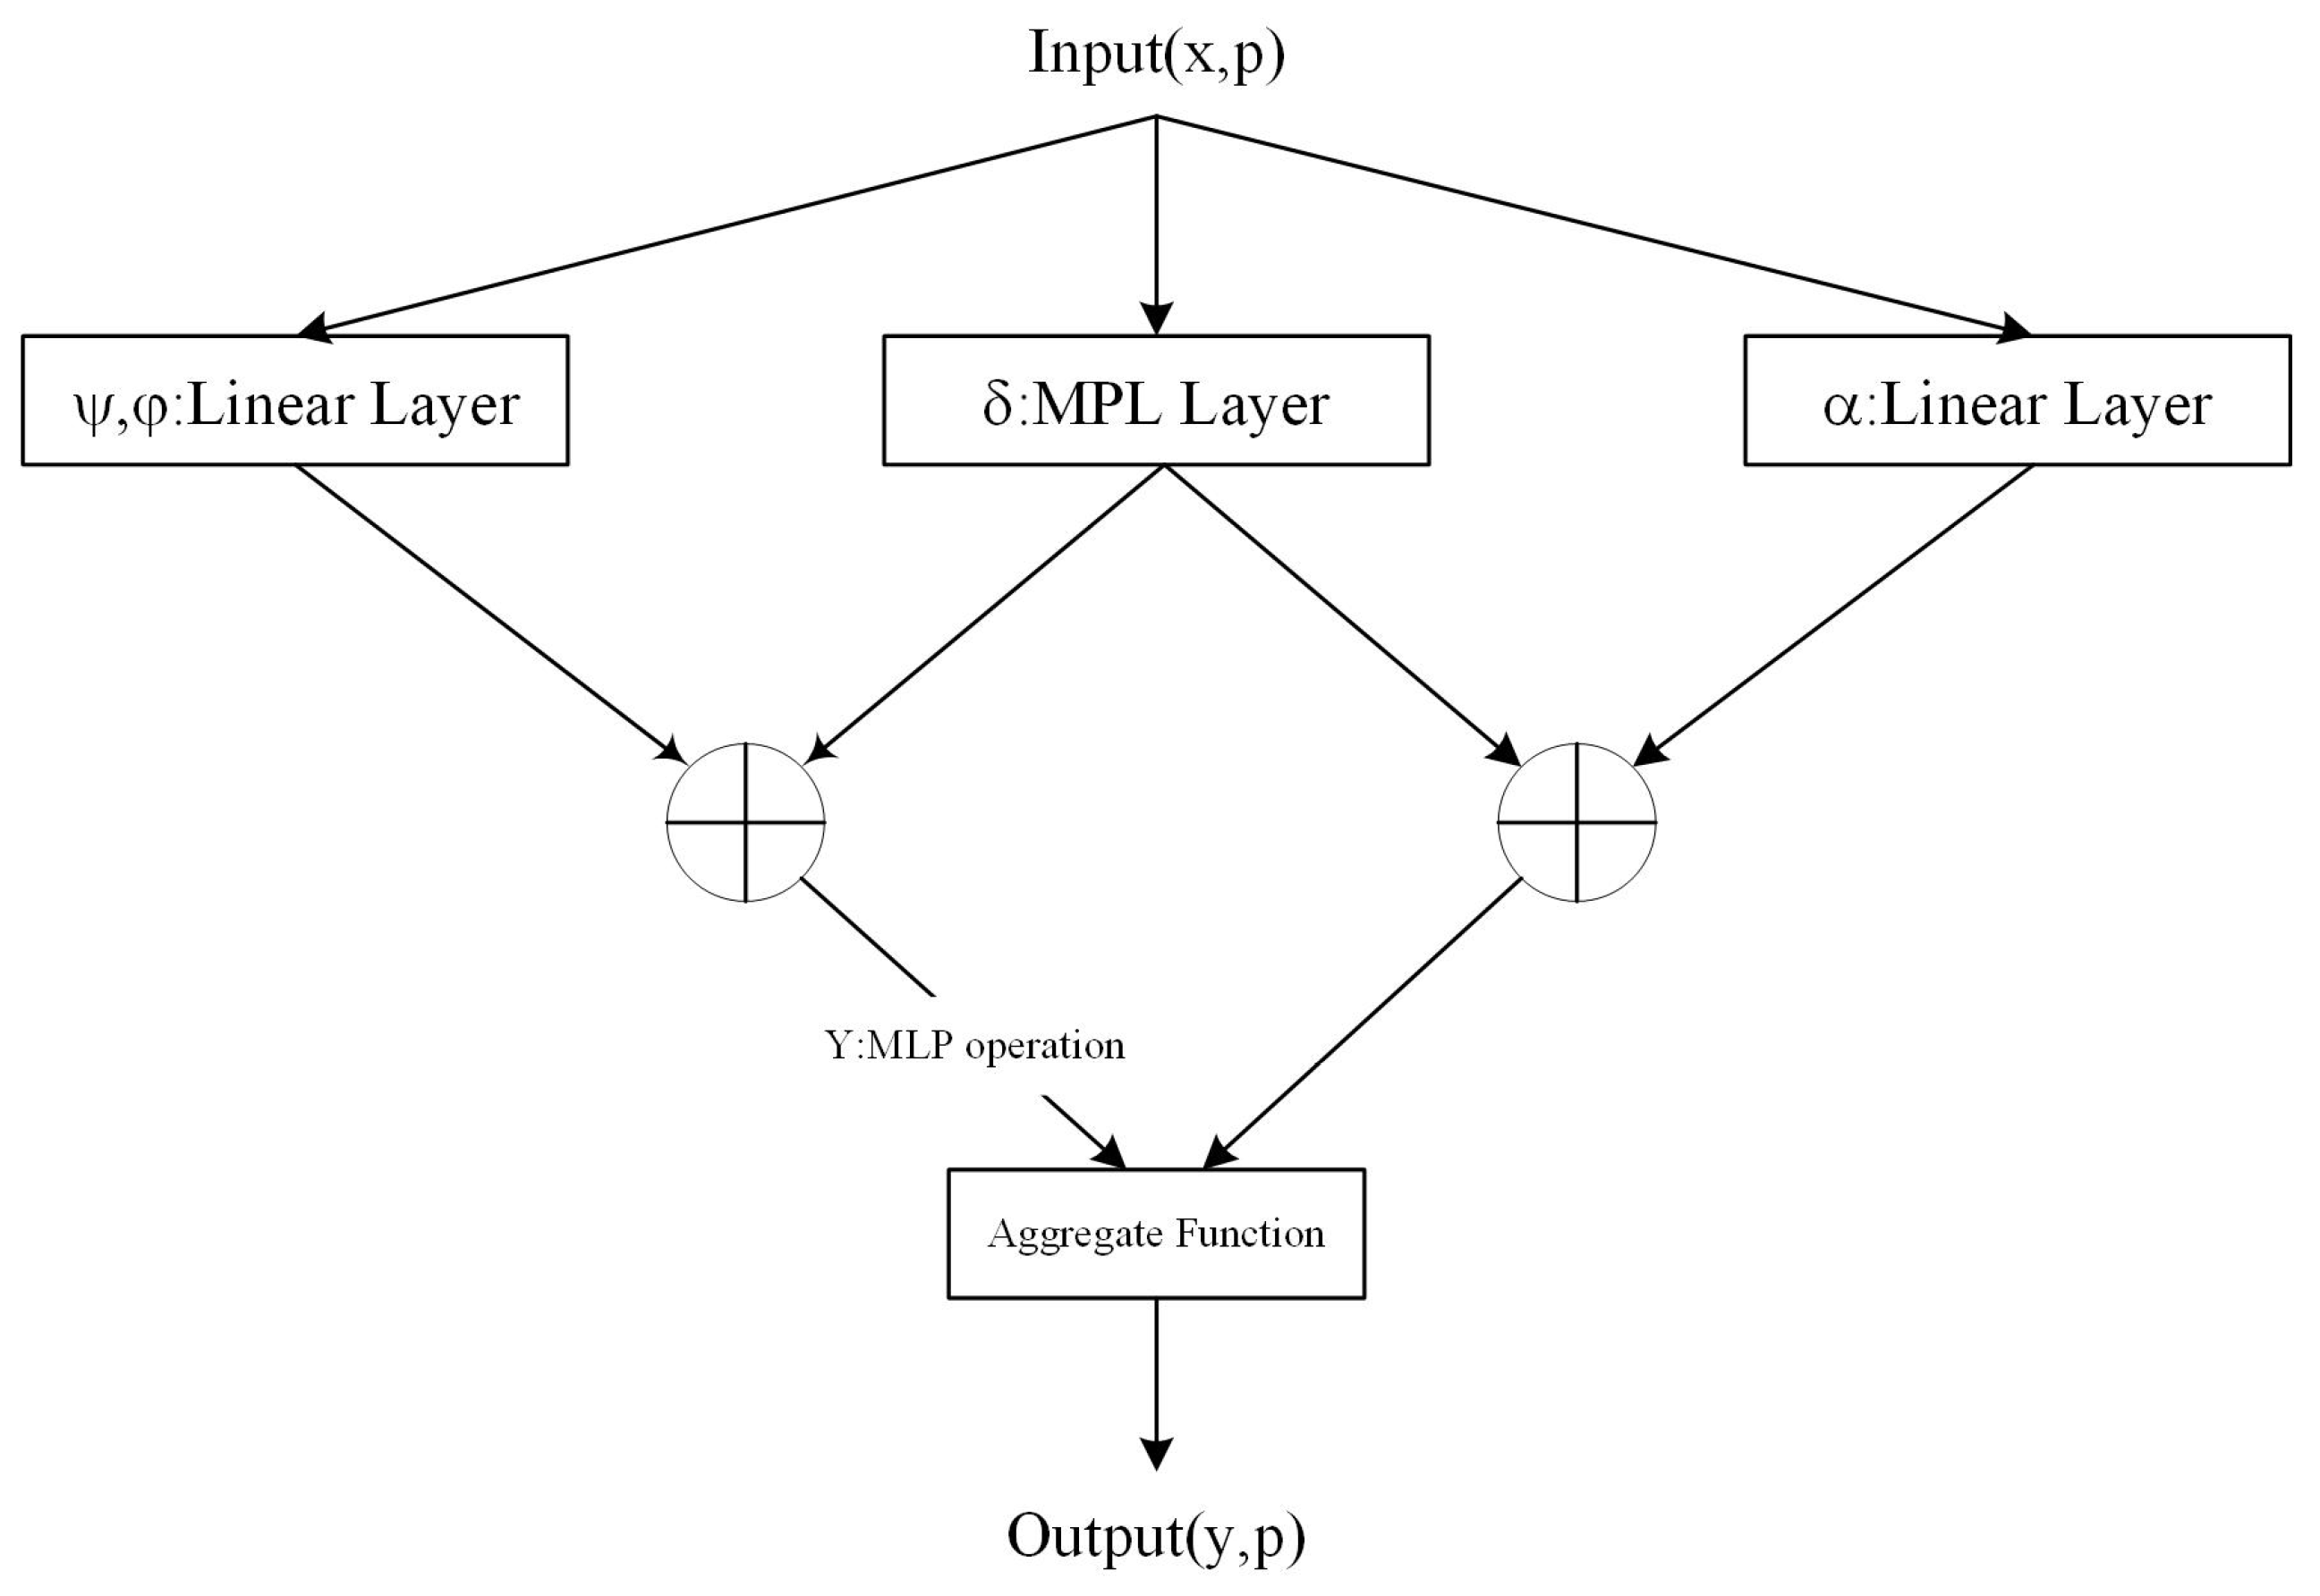
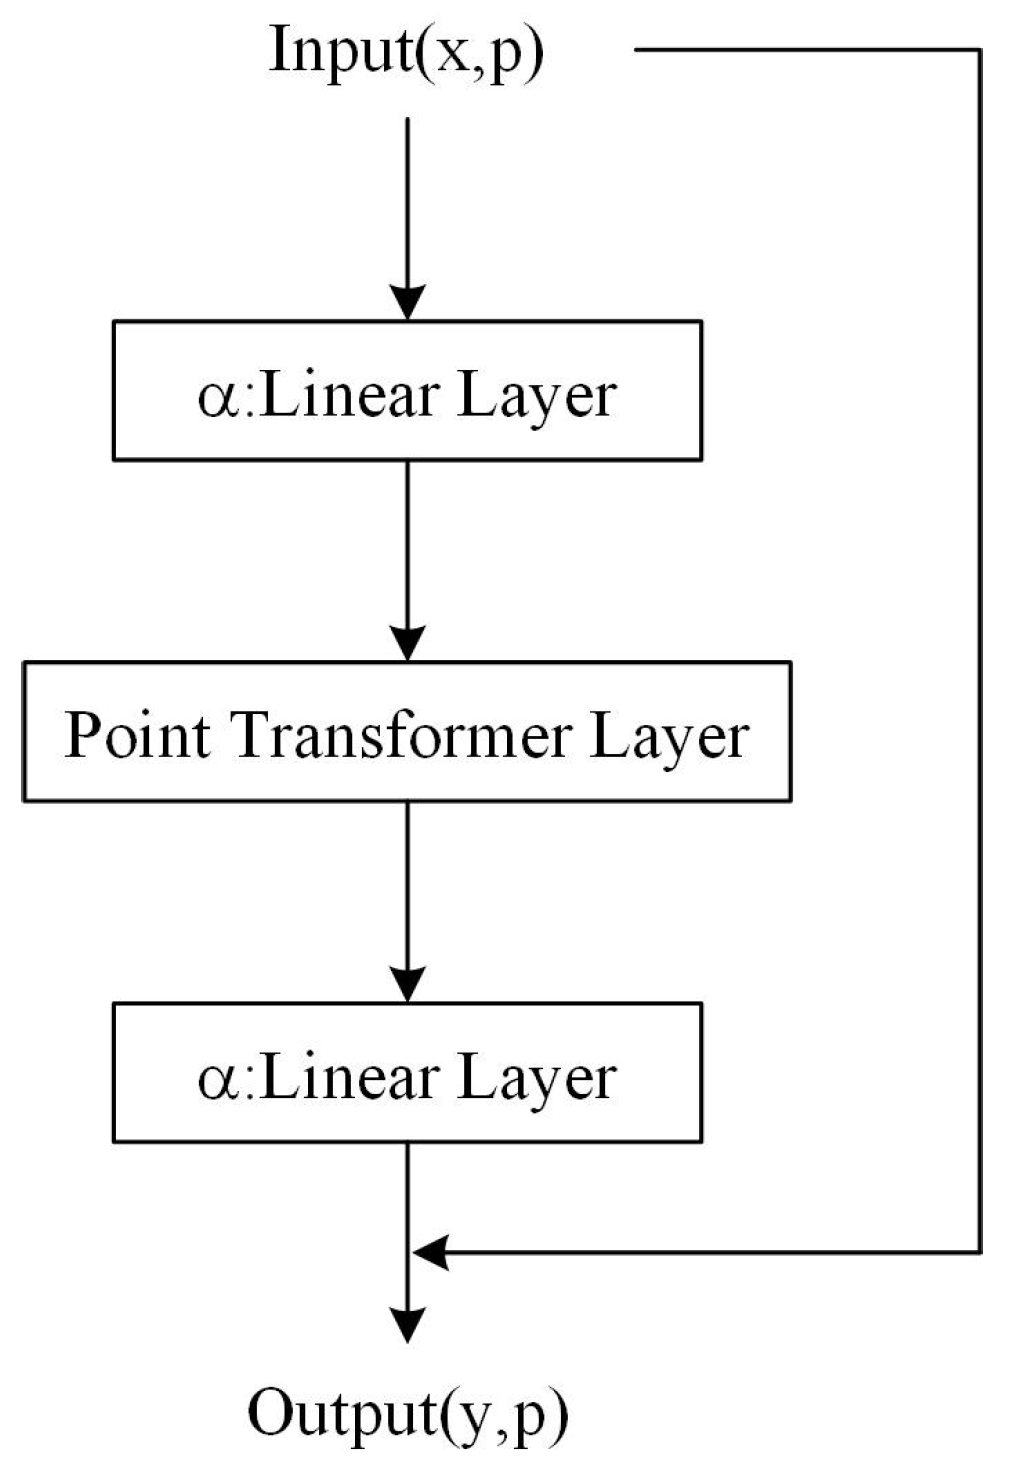
3.1. Feature-Enhanced Point Transformer

Point transformer is a deep learning model for point cloud data, with the core of the point transformer layer, which uses a “Vector Self-Attention Mechanism” and combines a position encoder to extract local and global features from point clouds. In comparison to other point cloud feature extraction algorithms, the point transformer is better suited for use concerning large and complex 3D scenes, thereby advancing the technological capabilities of understanding extensive point clouds [21]. This study builds upon the point transformer to perform the semantic segmentation of indoor point cloud data.
The inputs of the point transformer layer was the point coordinates and corresponding feature vectors. The position encoder obtained the position encoding vector, which was then concatenated with the feature vectors to obtain the original feature representation of the point. By using the “Vector Self-Attention Mechanism” to weighted average the features of the points, the attention vector, γ , of each point was obtained, and then concatenated with the original feature vectors, obtaining new feature representations of points α through MLPs (multi-layer perceptrons). Finally, we concatenated the position encoding vector with the new feature representation to obtain the final point feature representation, as shown in Formula (1):
y i = x j X ( i ) ρ ( γ ( φ ( x i ) ψ ( x j ) + δ ) ) ( α ( x i ) + δ )
Subset X ( i ) X is the local neighborhood of x i . The mapping function for point transformer γ is an MLP containing two linear layers and an ReLU nonlinear function. In this way, the point transformer layer is able to perform a local feature transformation and self-attention calculation on each data point and its neighborhood to better capture the correlation between the data points. Figure 2 shows the structure of the point transformer layer.
Based on this, the point transformer constructs a residual point transformer block with a point transformer layer as the core, as shown in Figure 3.
The transformer block integrates a self-attention layer, with the input consisting of a set of feature vectors, x, and associated three-dimensional coordinates, p. Point transformer blocks can facilitate information exchange between local feature vectors and apply the generated new feature vectors as outputs to all data points, adapting to the content of feature vectors and their layout in a three-dimensional space. A point transformer is the main feature aggregation function in a complete 3D point cloud-understanding network, without using a convolution for preprocessing or auxiliary branching. The complete network architecture for the semantic segmentation is shown in Figure 4.
From the perspective of the entire network, the feature encoder of the point transformer for semantic segmentation and classification purposes had five stages, which operated on gradually downsampled point sets. The downsampling rates for these stages were [1, 4, 4, 4, 4]. Therefore, the cardinality values of each short point set are [N, N/4, N/16, N/64, N/256], where N is the number of input points. The number of stages and downsampling rates can vary depending on the application. For example, lightweight networks of components can be rapidly processed, with continuous stages connected by conversion modules: downward conversion for feature encoding and upward conversion for feature encoding.
In the output stage, for semantic segmentation tasks, the final decoder generates feature vectors for each point in the input point set. The network application MLP maps this function to the final logic. For classification tasks, this network performs global AVG pooling on point-by-point features to obtain the global feature vectors corresponding to the entire point set. The global feature vector ultimately obtains the global classification result through the MLP layer.

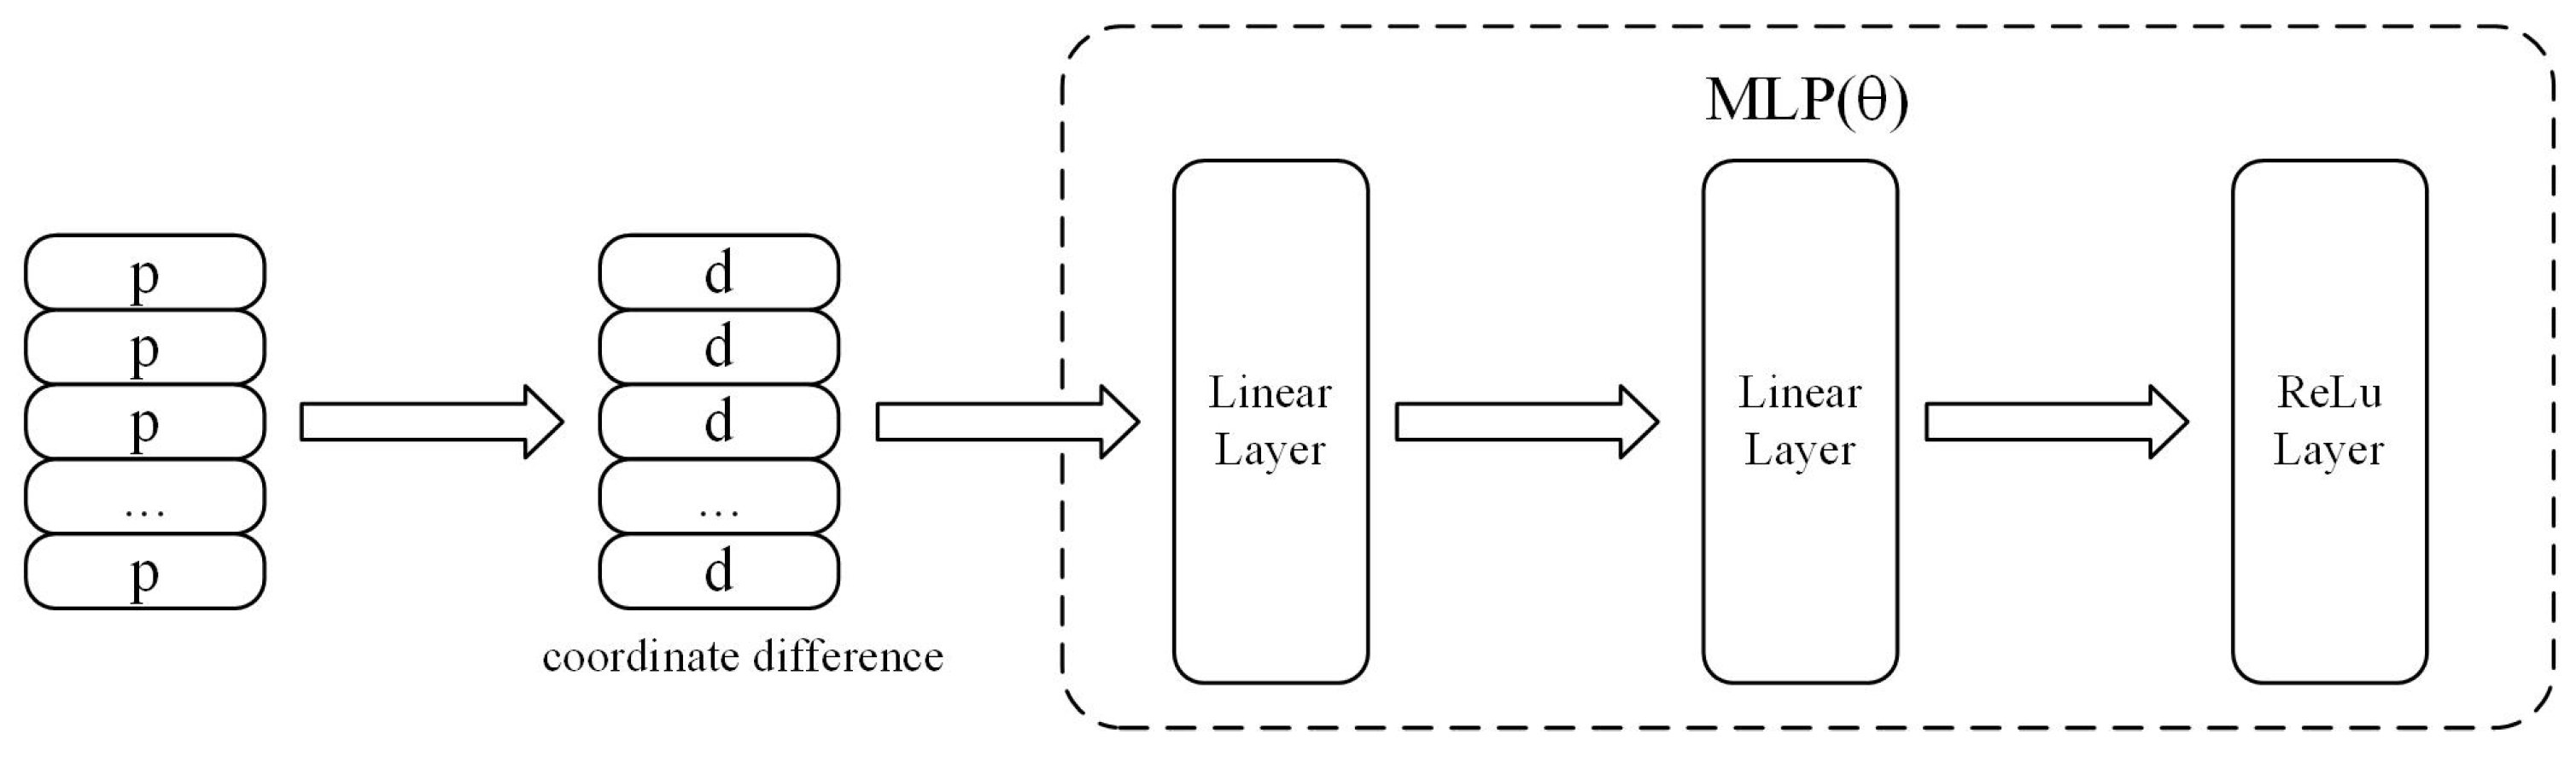
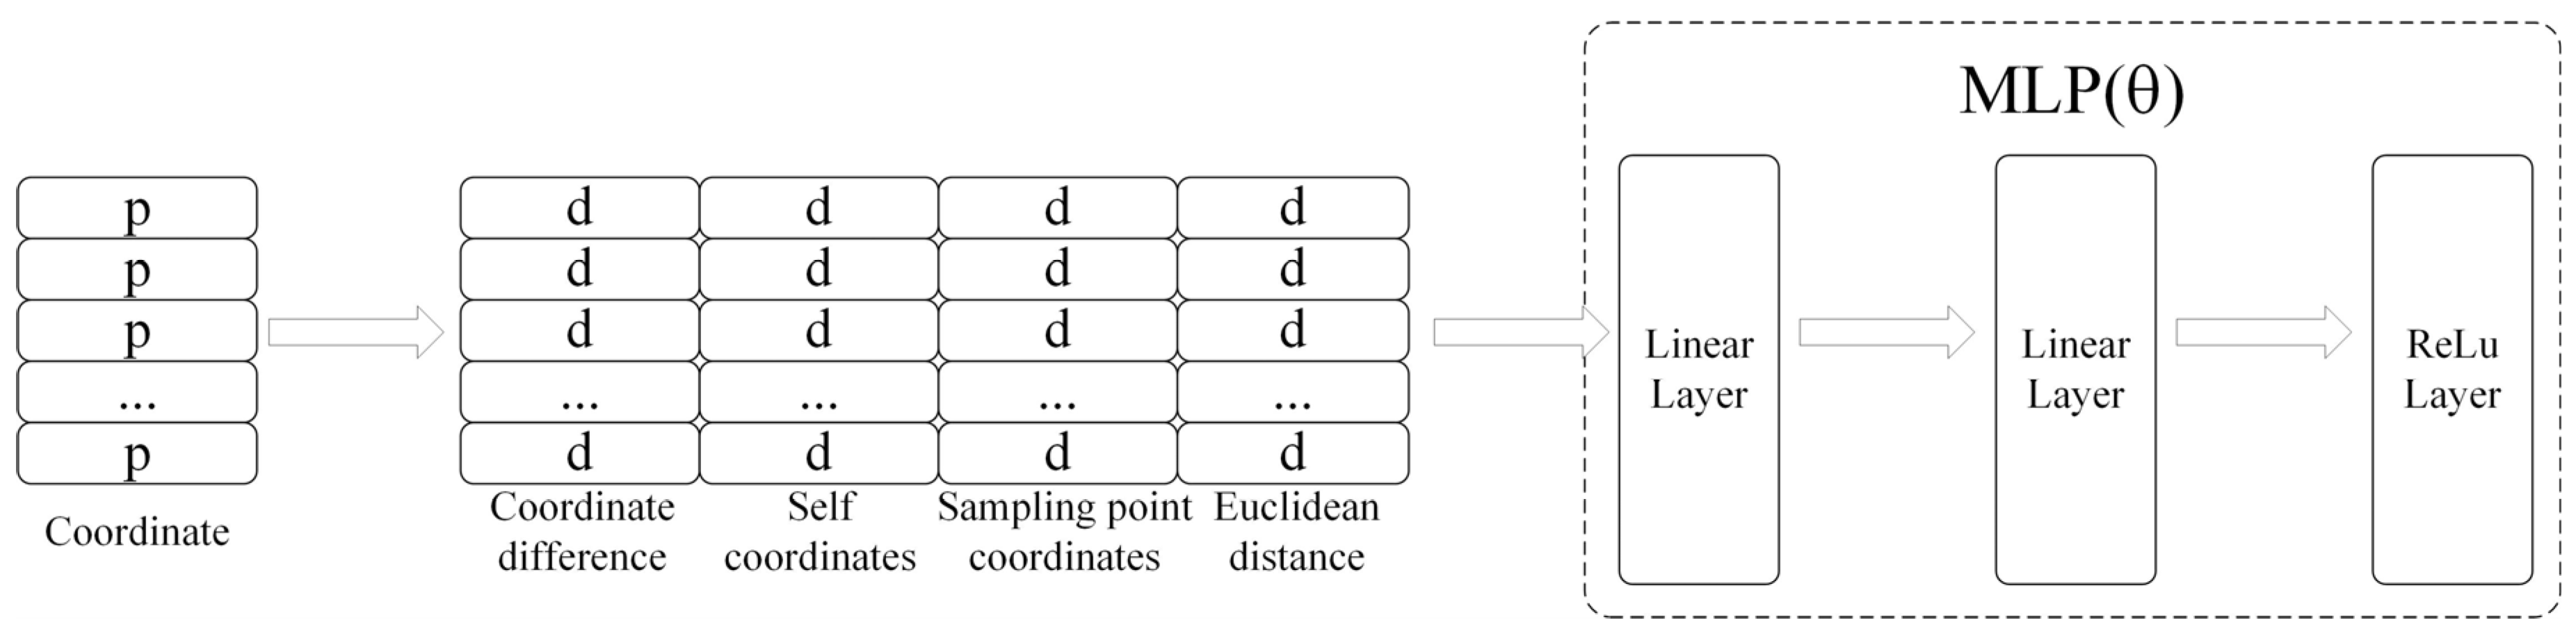
3.1.1. Feature Position Enhancement

During the process of point cloud information encoding in the point transformer network, each data point and its neighboring points are considered as a local space, which contains the coordinates and additional information of the point, as well as the coordinates and additional information of neighboring points related to the point. The point transformer layer performs feature aggregation and self-attention calculations by inputting these local spaces and utilizing the relative positions between each point in these spaces and its neighboring points. The network encoding structure is shown in Figure 5. In this way, the point transformer layer can effectively process point cloud data and improve its feature representation ability.
In order to utilize the geometric and structural relationships of point clouds and fully utilize the input point cloud information more effectively, this study designed a new point transformer layer structure based on the basic structure of the point transformer layer, which enhanced the geometric information of point clouds through local spatial information encoding. The network design not only preserved the original coordinates of each point, but also added information on the three-dimensional coordinates of the central sampling point, the coordinates of the point relative to the central sampling point, and the Euclidean distance. By adding this information, the geometric and structural information of the local space of the point cloud could be encoded more completely. This improved point transformer layer could more concretely display the local spatial information of point clouds. By adding information, such as the original coordinates, relative positions, and relative distances of the points, the geometric structure and spatial information of point clouds could be learned more accurately and effectively.
For a single point, the corresponding MLP processing content changed in the point transformer layer after a local spatial information encoding enhancement. The single-point feature acquisition operation in the original local space can be represented by Formula (2), while the improved single-point information encoding can be represented by Formula (2):
δ = θ ( p i p j ( p i p j ) p i p i )
In this formula, p i is the coordinate of the sampling point in the local space; p j is the coordinate of the sampling point in the local space; ( p i p j ) is the coordinate difference between the sampling point and a certain domain point; p i p i is the Euclidean distance between the sampling point and a certain domain point; and encoding function θ is an MLP with two linear layers and one nonlinear ReLU layer.
The improved network structure adopted a design based on a local spatial encoding information enhancement, which fully encoded the local spatial information of each point, including the coordinates, relative coordinates, and Euclidean distance of the central sampling point. During the network processing stage, MLP neural networks were used to aggregate features for each point and connect the encoded information with the original point information so that the feature vectors of each point contained rich spatial information. After the ReLu activation function operation, the information of the point cloud was further compressed and connected to the point cloud coordinates to obtain the feature vectors of the entire local space, as shown in Figure 6.
Compared to the original point transformer network, the enhanced point transformer network based on local spatial geometric information encoding could better learn the spatial geometry and structural information of point clouds and present a better performance. The experimental results further validate this hypothesis.

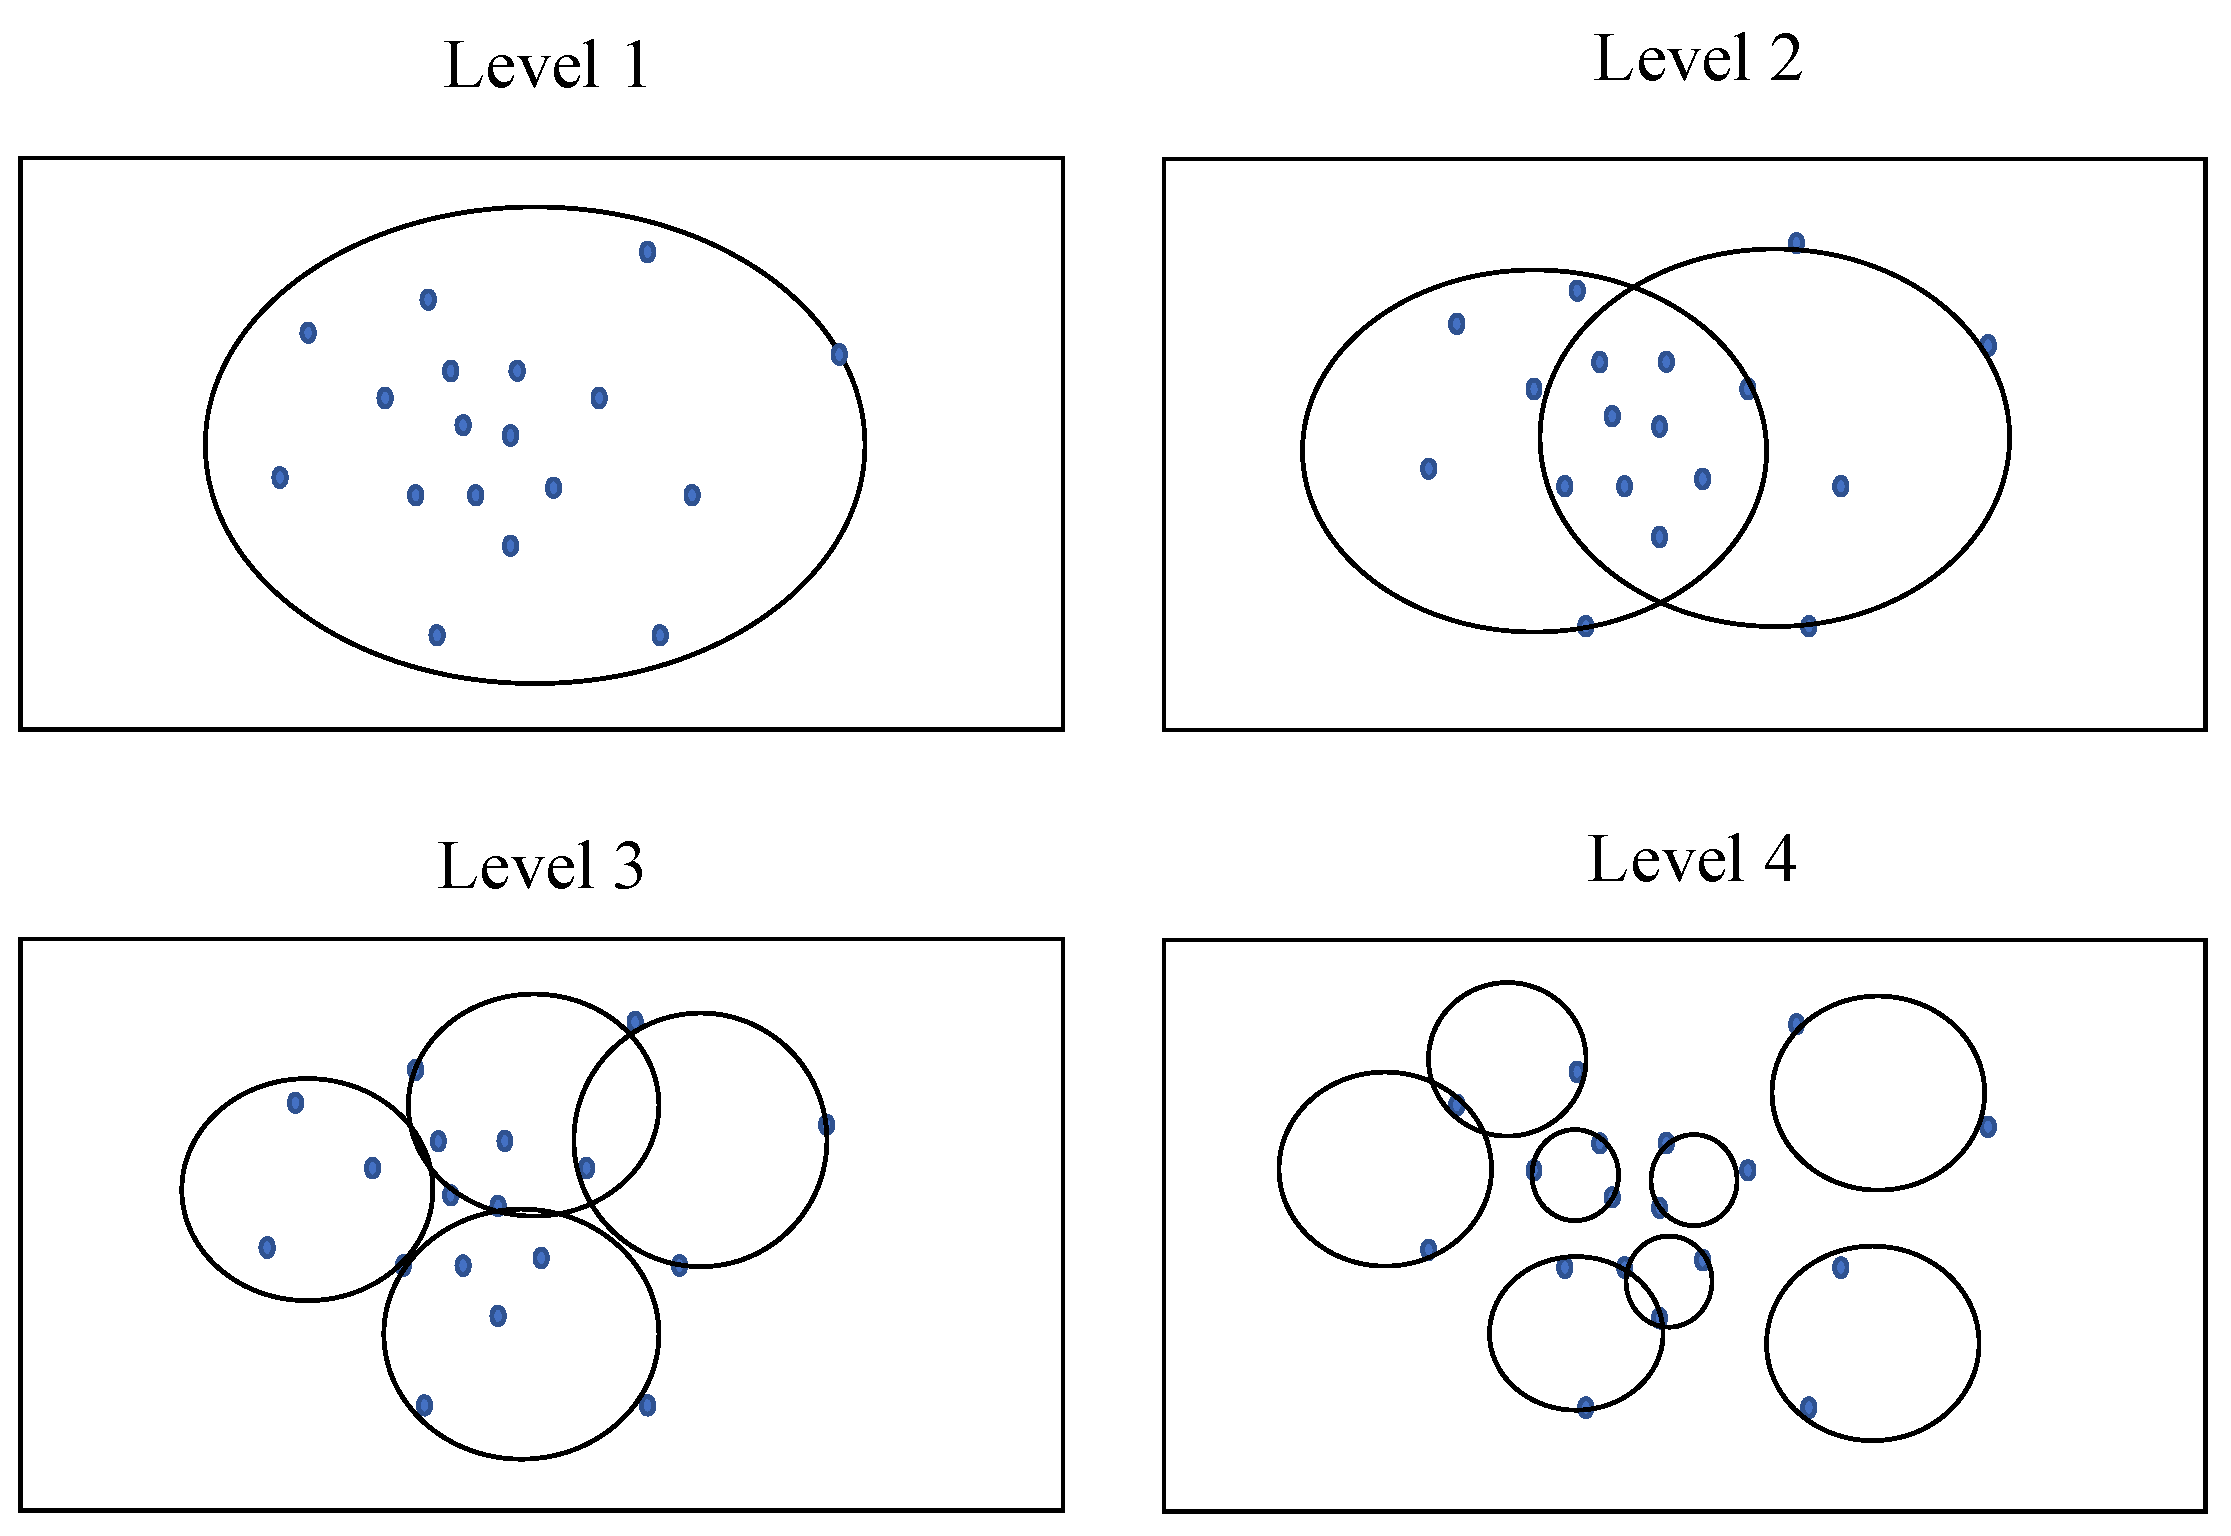
3.1.2. Ball Tree Downsampling Module

The transition down layer in the point transformer network performs downsampling operations, and the module is shown in Figure 7. However, KNN sampling is usually used to obtain a set of neighboring points around a point when processing point clouds. Due to differences in the density and sampling methods of point clouds, the number of neighboring points around each point may be very different, resulting in different sizes of local regions being used for calculations [53]. This makes it difficult for the network to converge, as local regions of different sizes cannot receive appropriate weight adjustments. Therefore, it is necessary to adopt a more concise and accurate method for feature downsampling.
The ball tree is a spatial partitioning data structure used to organize points in a multidimensional space. The ball tree algorithm is an extension of the KNN algorithm designed for high-dimensional data. In this study, we optimized the efficiency of a point transformer to process high-dimensional point cloud data by introducing the ball tree algorithm. This optimization was conducted to achieve more accurate and stable sampling results, as illustrated in Figure 8.
The ball tree algorithm is a tree-like structure used for performing a rapid nearest neighbor search, and it ensures a fixed local neighborhood, which is beneficial for learning local features [19]. The construction of the ball tree involves two steps: computing the spherical range and partitioning the data points. In each node, the spherical range for all data points is computed, and the two farthest points are selected as splitting points. Then, the data points are divided into left and right subsets based on these splitting points, and corresponding child nodes are created. This process continues until a node contains only one or less K data points. The abovementioned process is illustrated in Figure 9.
The search algorithm for the ball tree method is a top-down recursive algorithm used to find the nearest neighbor of a target point. It begins at the root node and moves downward, locating the leaf node that contains the target point. Within that leaf node, it identifies the observation point closest to the target point. This distance serves as an upper bound for the nearest neighbor distance. Then, the algorithm checks if any sibling nodes of the leaf node might contain observation points closer to the target point than this upper bound. If a sibling node’s region cannot possibly contain the desired observation points, the algorithm stops the recursive search for that sibling node. Otherwise, the algorithm continues to recursively search the sibling nodes and their child nodes until it finds the nearest neighbor or has searched all nodes. As the algorithm traverses each node, it calculates the distance between that node and the target point. If this distance is shorter than the current minimum distance, the algorithm updates the current minimum distance to this distance and designates the current node as the current nearest neighbor. The pseudocode for search Algorithm 1 is presented below.
Algorithm 1: Ball Tree Search Algorithm.
Function ball_tree_search is
       Global: Q—Cache of k nearest neighbors (initially containing a point at infinity), q—Corresponding to Q, storing distances between points in Q and the test point
       Input: k—Search for k nearest neighbors, t—Test point, node—Current node
       Output: None
       If distance(t, node.pivot) − node.radius ≥ max(q) then
              Return
       End if
       If node is a leaf node, then
              Add node.p to Q and update q accordingly
              If there are more k nearest neighbors in Q, remove the point in Q that is farthest from the test point and update q accordingly
       Otherwise
              Recursively search the two child nodes of the current node
              ball_tree_search(k, t, node.s1)
              ball_tree_search(k, t, node.s2)
       End if
End function
The ball tree algorithm is an efficient data structure that can be utilized for point cloud semantic segmentation tasks to enhance both model accuracy and efficiency. In the case of the point transformer network, this study employs a ball tree construction to efficiently prune redundant points, thereby improving the algorithm’s efficiency and accuracy.

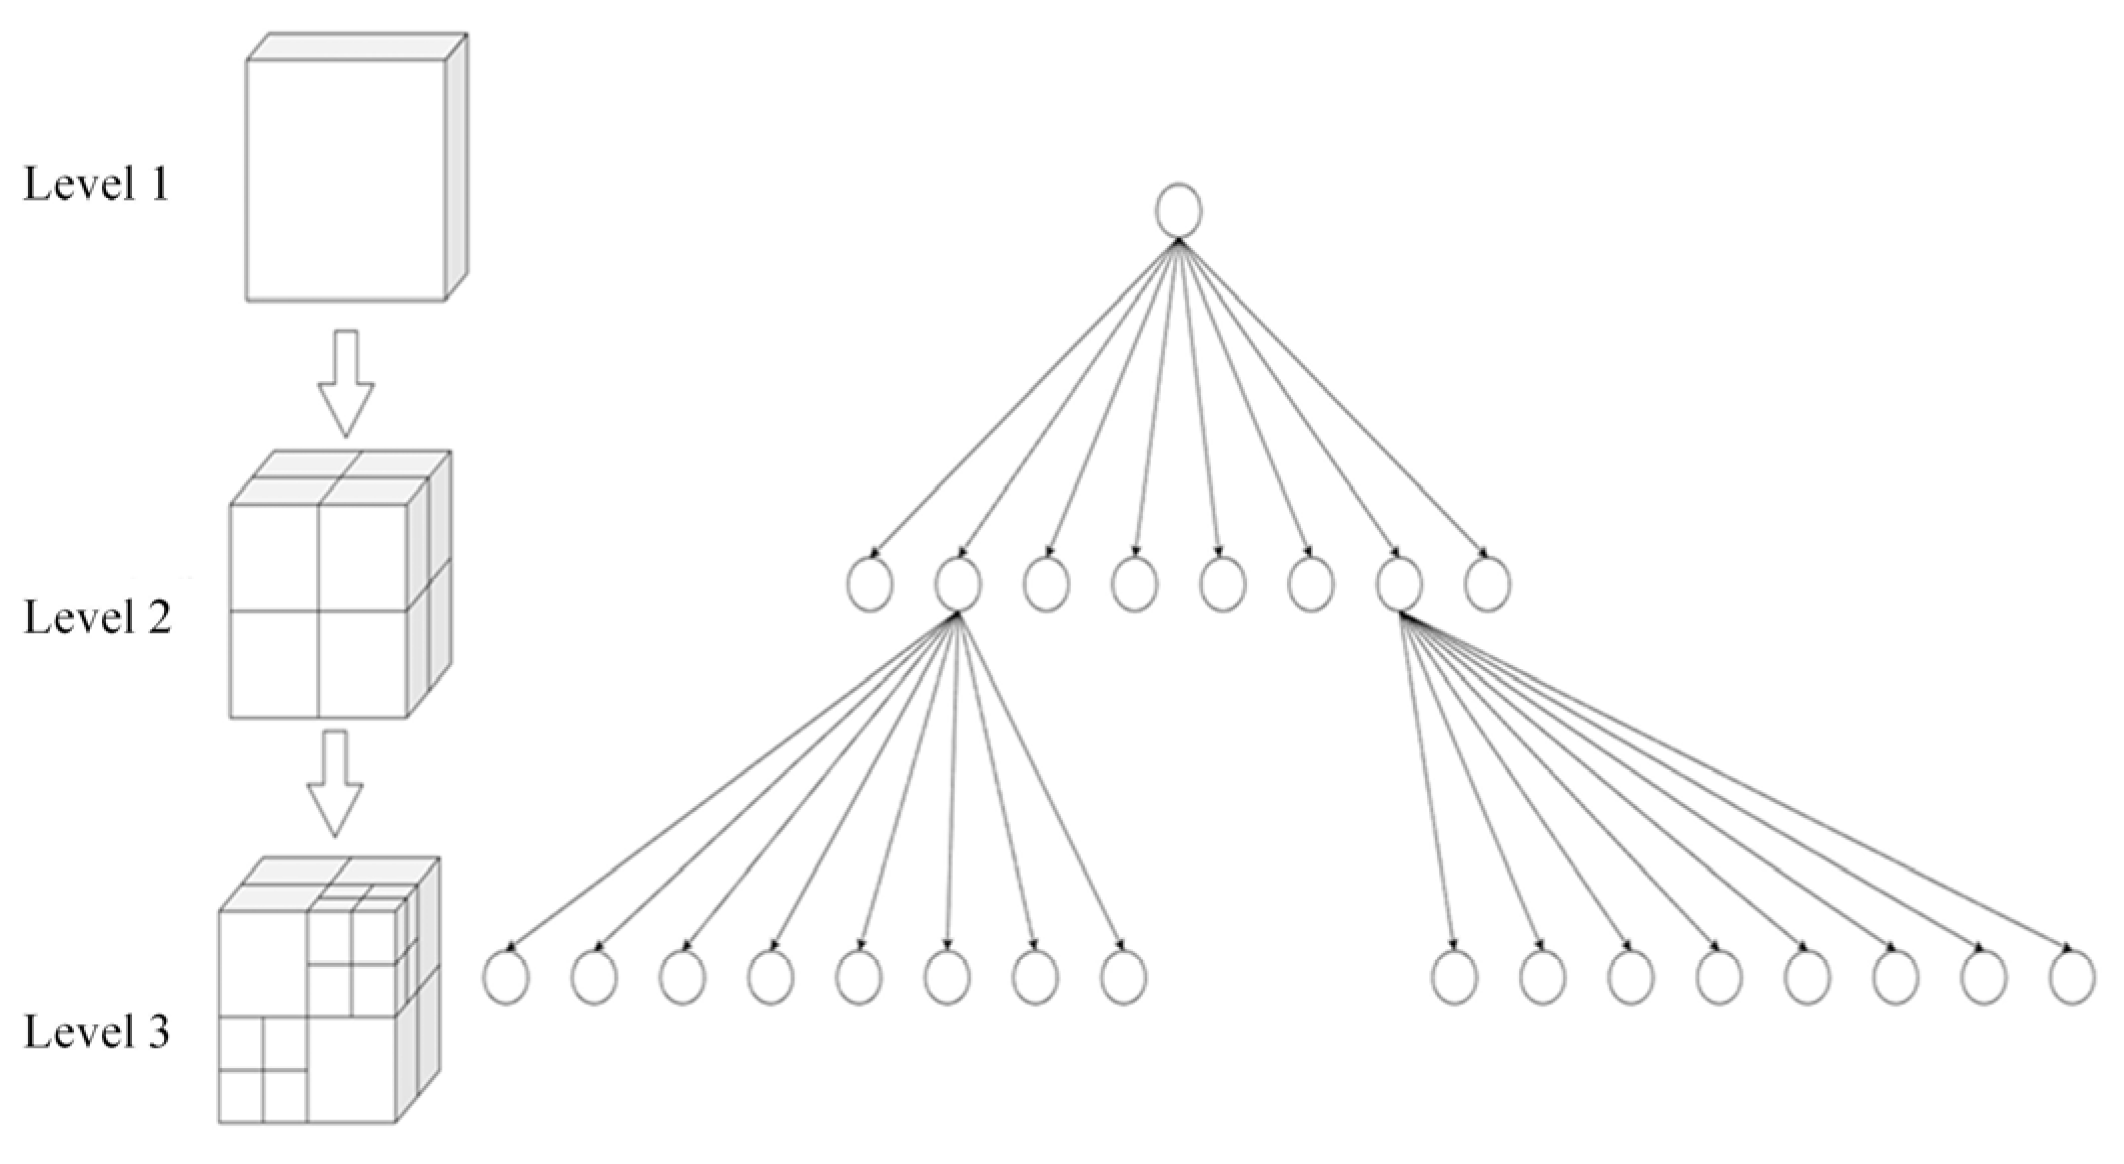
3.2. Octree Algorithm

The octree algorithm is a commonly used tree-like data structure for managing three-dimensional data [54]. The fundamental idea behind octrees is to partition three-dimensional space into a series of cubes (also known as volume elements) and build a tree-like structure based on this division. Each node in the octree represents a volume element in the form of a cubic region, and every node has eight child nodes. The combined volume of these eight child nodes is equal to the volume of their parent node, as illustrated in Figure 10. The octree algorithm exhibits significant advantages in handling high-dimensional data and adaptability [55]. It finds wide applications in various fields of three-dimensional computer graphics, such as ray tracing, collision detection, 3D modeling, and more [56]. The processes of creating an octree are as follows:
  • Set a maximum recursion depth to prevent infinite recursion and performance issues caused by excessive subdivisions;
  • Determine the maximum size of the scene, which serves as the initial size of the cubic region;
  • Add individual elements successively to the cubic regions that can contain them and do not have child nodes;
  • If the current cubic region has not reached the maximum recursion depth, divide it into eight equal parts and allocate all individual elements to the child cubic regions;
  • If the number of individual elements assigned to a child cubic region is the same as that of its parent cubic region, an additional subdivision is considered meaningless, and the subdivision process stops;
  • Repeat steps 3–5 until the maximum recursion depth is reached.
Using point cloud data as an example, each cubic region records the number of point cloud points it contains. When this count decreases to below a certain threshold, the subdivision of that cubic region is halted. This approach helps avoid performance issues associated with excessive subdivisions and filters out some noisy point cloud data, enabling a more precise delineation of each individual object.

4. Experimental Results and Analysis

4.1. Experimental Configuration

In order to train deep learning networks, it is necessary to configure experimental environments in both hardware and software contexts. The hardware devices used in this study included 40 Intel (R) Xeon (R) E5-2630 v4 CPUs with a frequency of 2.2 GHz, 24 DDR4 memory modules that together formed a 128 GB memory space, and 3 Tesla T4 16G graphics cards. In terms of the software environment, the operating system used was Ubuntu 16.04, the main programming language was Python 3.7, the main GPU acceleration software used was CUDA11.6, the deep learning framework used was Pytorch, and the main environment management system used for programming was Anaconda.

4.2. Feasibility Verification of the Feature-Enhanced Point Transformer

The research model’s pre-training phase utilized the S3DIS [57] three-dimensional point cloud dataset. This dataset covered an area of over 6000 square meters and contained more than two-hundred-million labeled points. The study divided the S3DIS dataset into six regions based on the building areas and employed a cross-validation approach. In this paper, common metrics, such as the IoU (intersection over union), mIoU (mean intersection over union), and OA (overall accuracy), were employed as accuracy evaluation metrics for the segmentation results. The comparative results are presented in Table 1.
From the results, it can be seen that the improved network model proposed in this paper has a relatively higher semantic segmentation accuracy at r = 0.2. Specifically, the IoU improved by 1.0% compared to the original point transformer (k = 16) network, and the OA improved by 1.1%. This indicates that the improvement based on the ball tree algorithm can effectively enhance the accuracy of the point cloud semantic segmentation, providing strong support for practical applications. This is because, in some unevenly distributed point sets, the original network’s KNN-based queries can lead to a decrease in the network model’s generalization ability. Additionally, this experiment also found that increasing the value of K for the KNN and the query radius, r, for the ball tree algorithm improved the network’s performance to some extent. For example, point transformer (k = 64) relative to point transformer (k = 16) and feature-enhanced point transformer (r = 0.2) relative to feature-enhanced point transformer (r = 0.1) both showed improved network performances, but at the cost of longer computation times.
The intersection over union (IoU) values for each category were also calculated, and their averages were determined. The S3DIS dataset contained 13 semantic categories and the specific statistical results are shown in Table 2. From the table, it can be observed that the improved network model generally exhibits a higher segmentation accuracy compared to the original model in most categories. For example, in the office area, the improved model shows a 2.2% increase in the segmentation accuracy for the “chair” category compared to the original model, and an 0.8% increase in the accuracy for the “wall” category. Generally, in semantic segmentation and local sampling processes, there are often more stringent requirements for categories such as “desk”, “chair”, and “sofa” compared to architectural components, like “wall” and “door”. Categories like “desk” and “chair” have more local details, requiring more precise segmentation and sampling activities. These details include chair armrests, chair legs, table edges, table legs, and other structural elements. These local details are crucial for the overall structure and functionality of desks and chairs, hence the higher demands for semantic segmentation and local sampling. In contrast, categories, like “wall” and “door”, typically have simpler geometric shapes and structures, resulting in fewer local details and less requirements for segmentation and sampling.
Therefore, in the point cloud semantic segmentation process, the semantic segmentation of categories, like “desk” and “chair”, places higher demands on the network’s ability to perform local segmentations. It is evident that the improved network significantly enhances its capability for performing local segmentations. These results demonstrate that the feature-enhanced point transformer can substantially improve the accuracy of the point cloud semantic segmentation compared to the original network, and it holds great potential for practical applications.
To provide a more intuitive demonstration of the semantic segmentation results, we selected some models where the differences in semantic segmentation performances were more evident in the visualizations, as shown in Figure 11.

4.3. Results and Analysis

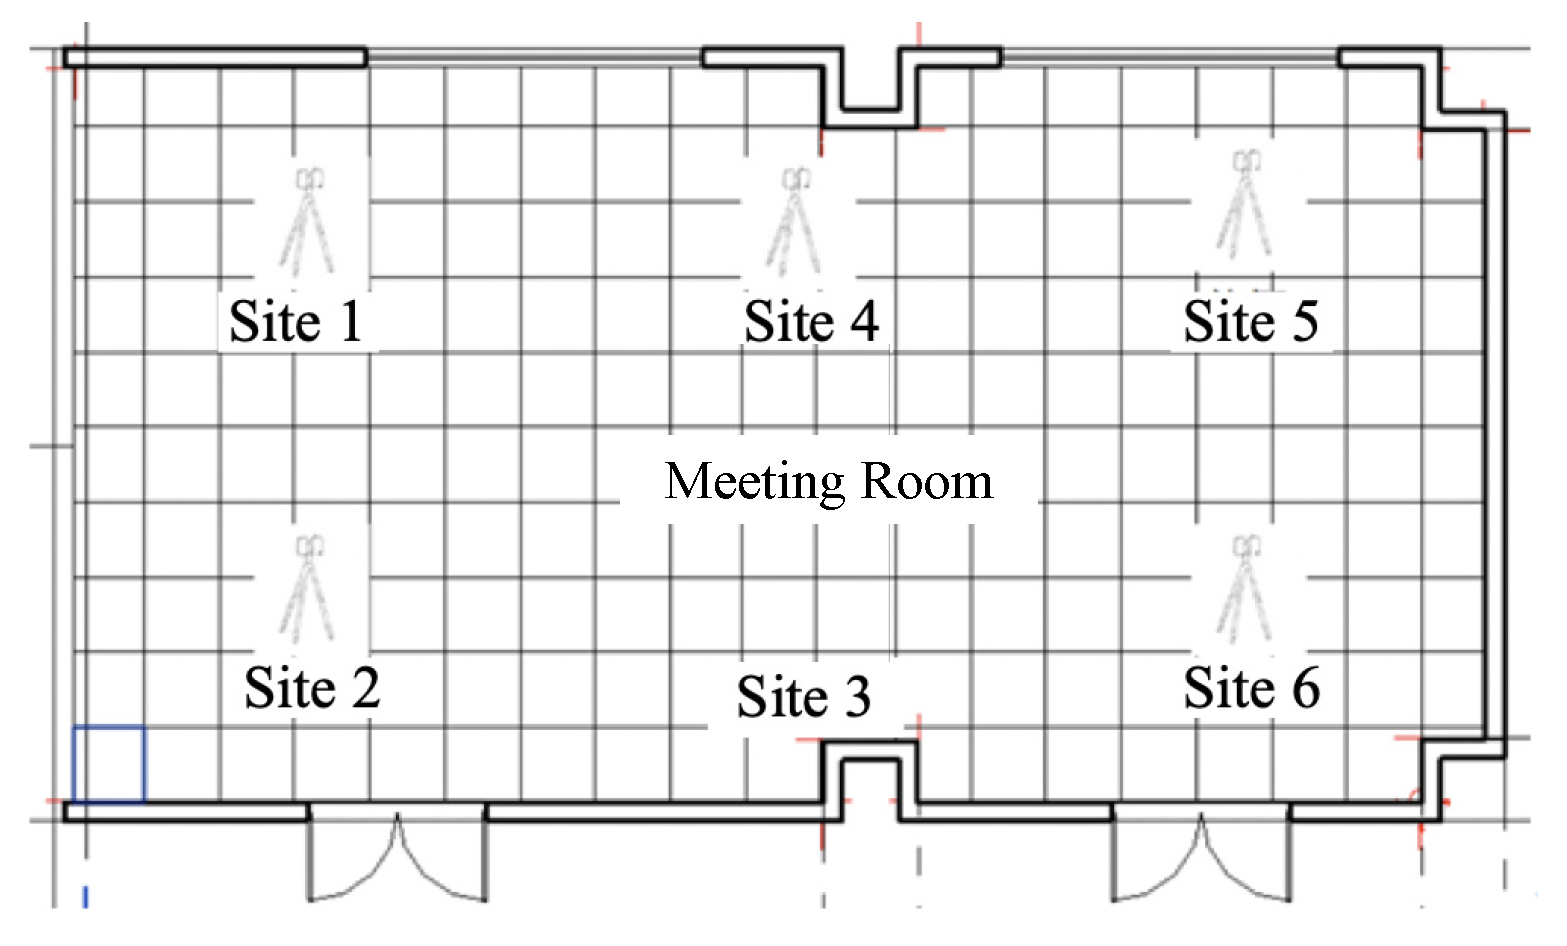
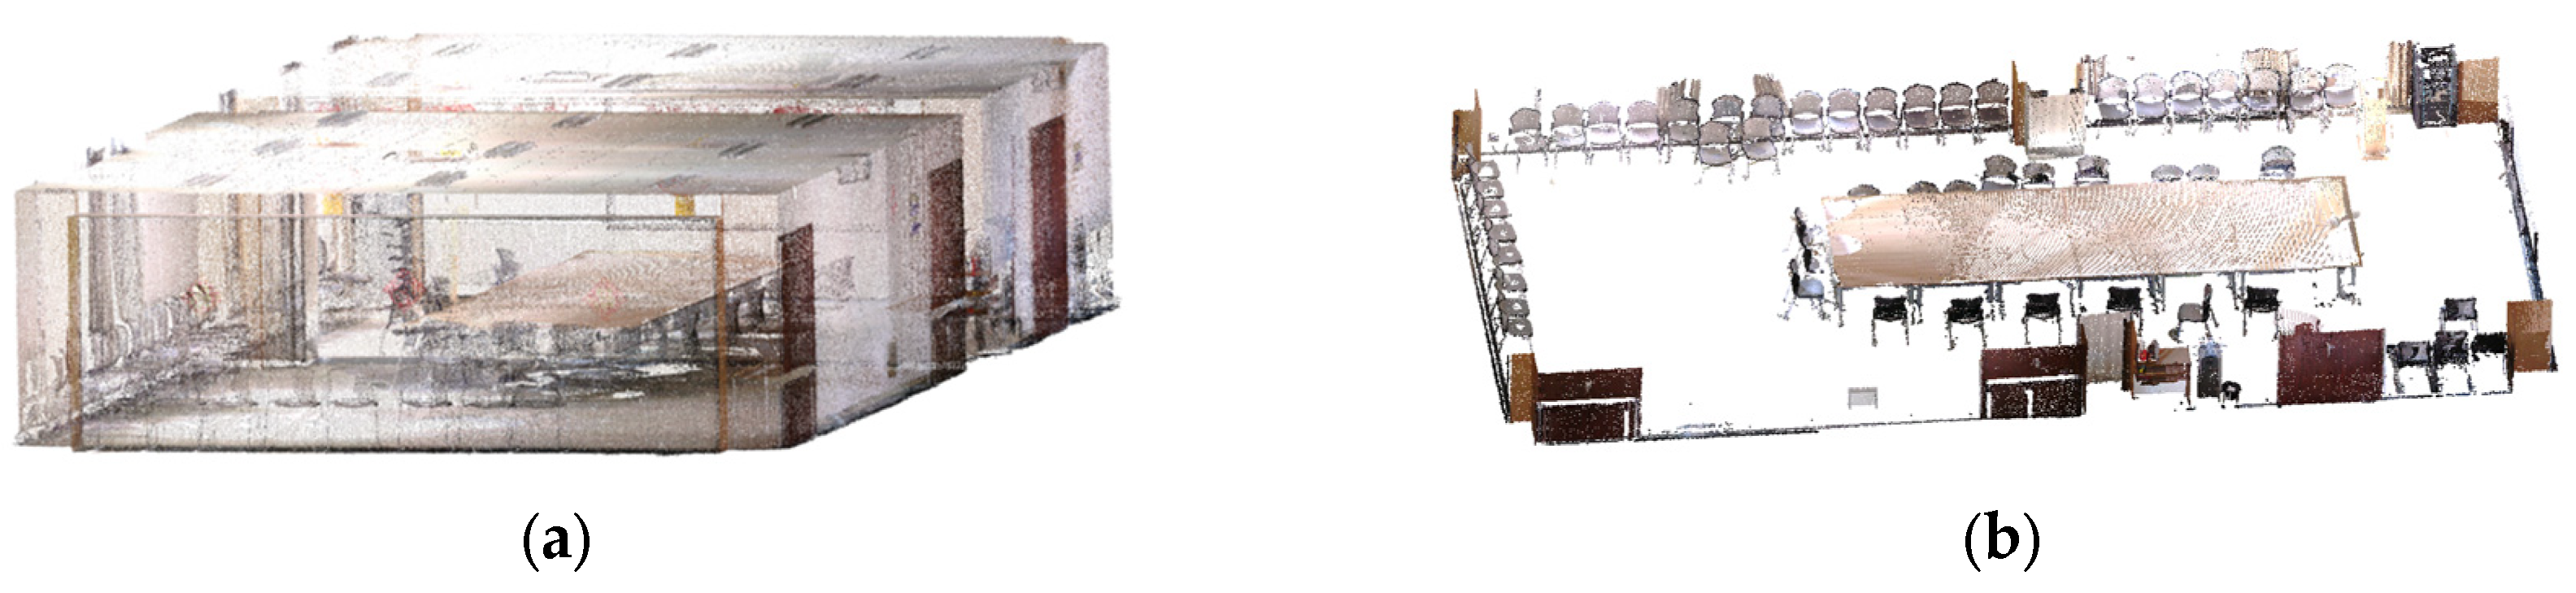
4.3.1. Data Collection

The point cloud data collection presented in this study was conducted using the FARO FOCUS 150 3D laser scanner. Six scanning stations were deployed, with a resolution of 11.0 million points, and color scanning was employed, as depicted in Figure 12.
While preserving the geometric features of the point cloud model, uniform grid-based downsampling was employed. The resulting downsampled point cloud data for the conference room are shown in Figure 13.

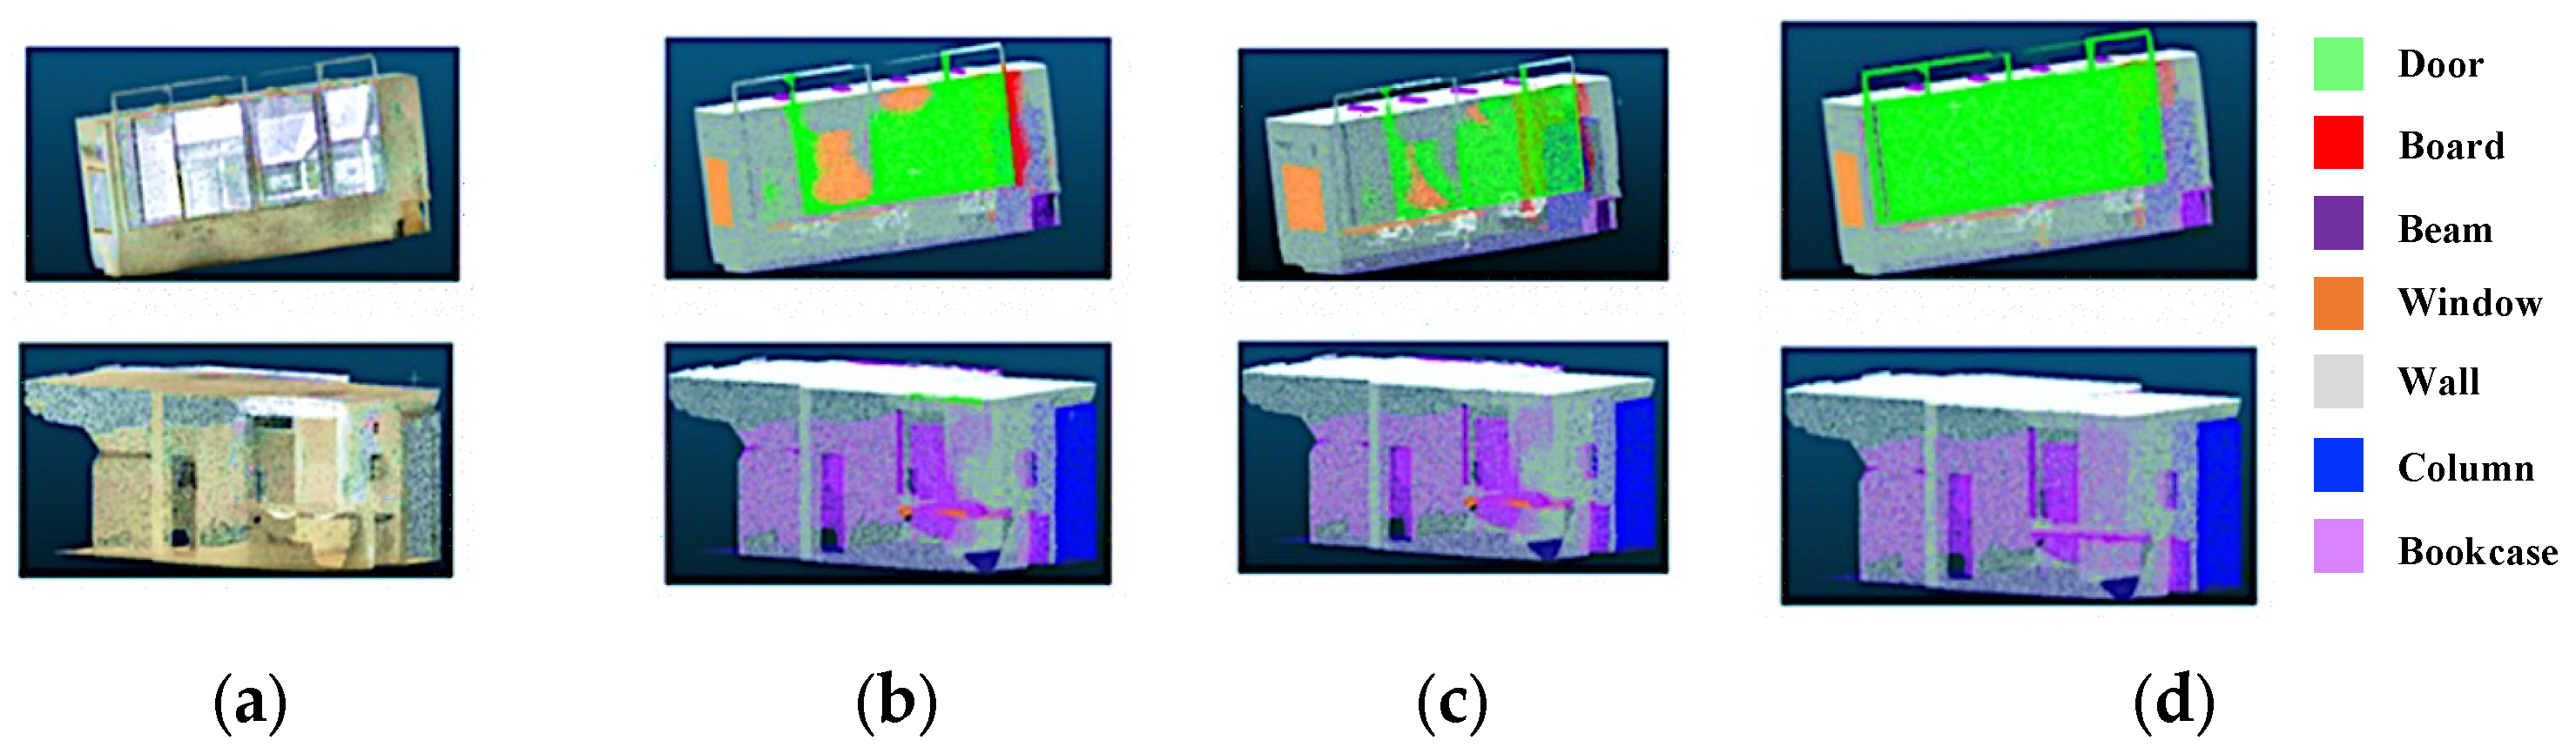
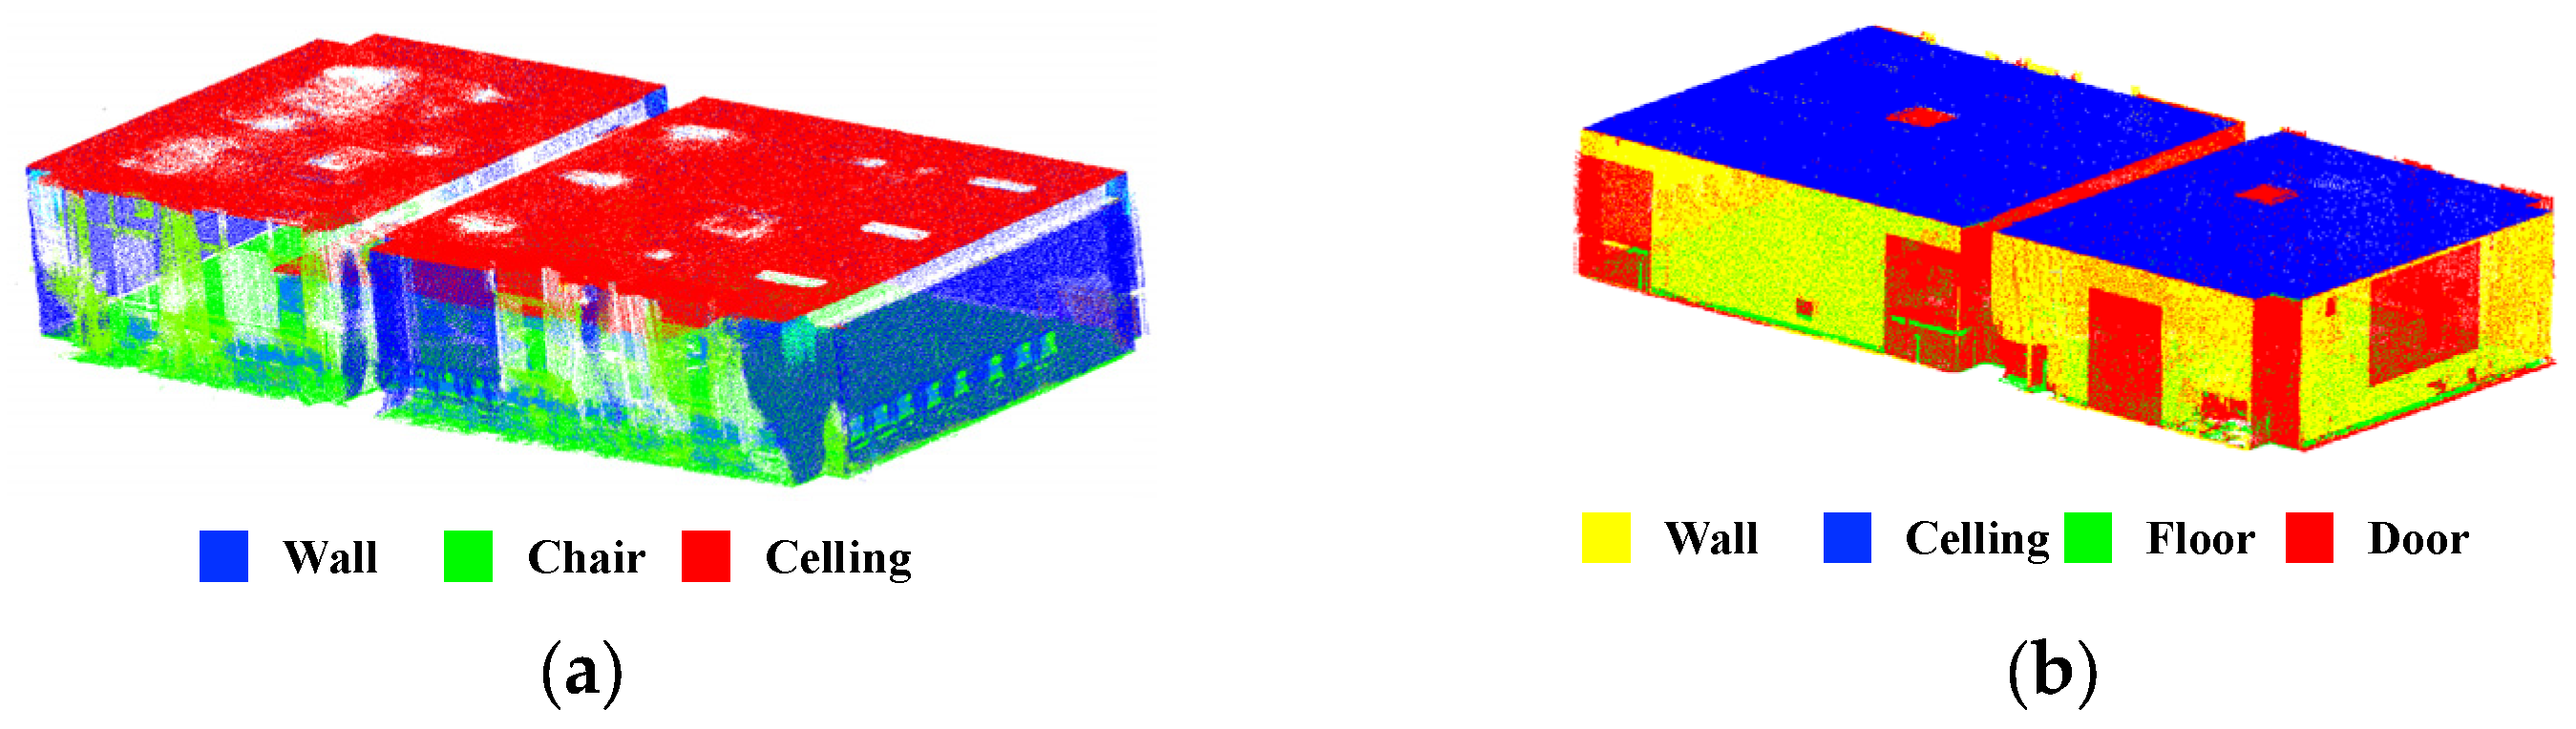
4.3.2. Semantic Segmentation

This research focused on collecting the data from a conference room and performing a semantic segmentation using a feature-enhanced point transformer. The algorithmic segmentation results are shown in Figure 14a, while the manually annotated results are shown in Figure 14b. In some regions where certain categories were closely related, such as windows, wooden boards, and walls, the algorithmic segmentation often misclassified windows as wooden boards or walls. Additionally, in areas where chairs and walls were close to each other, the model indirectly segmented a portion of the chair’s point cloud as part of the wall. These issues indicate that there is still room for improvement in achieving accurate local semantic segmentation results for point clouds. Overall, the results of the automatic segmentation can be substituted for manual segmentation results; although, improvements in local semantic segmentation’s accuracy are needed.
The accuracy of the conference room point cloud data collected in this study was noticeably lower than that of the data in the S3DIS dataset. This was because the conference room point cloud data collected in this study were more complex compared to the data in the S3DIS dataset. The scene included elements such as lanterns, projectors, projection screens, central air conditioning, curtains, and more. The presence of these elements had an impact on the accuracy of the semantic segmentation in the conference room. The semantic segmentation of the interior of the conference room point cloud data is shown in Figure 15.

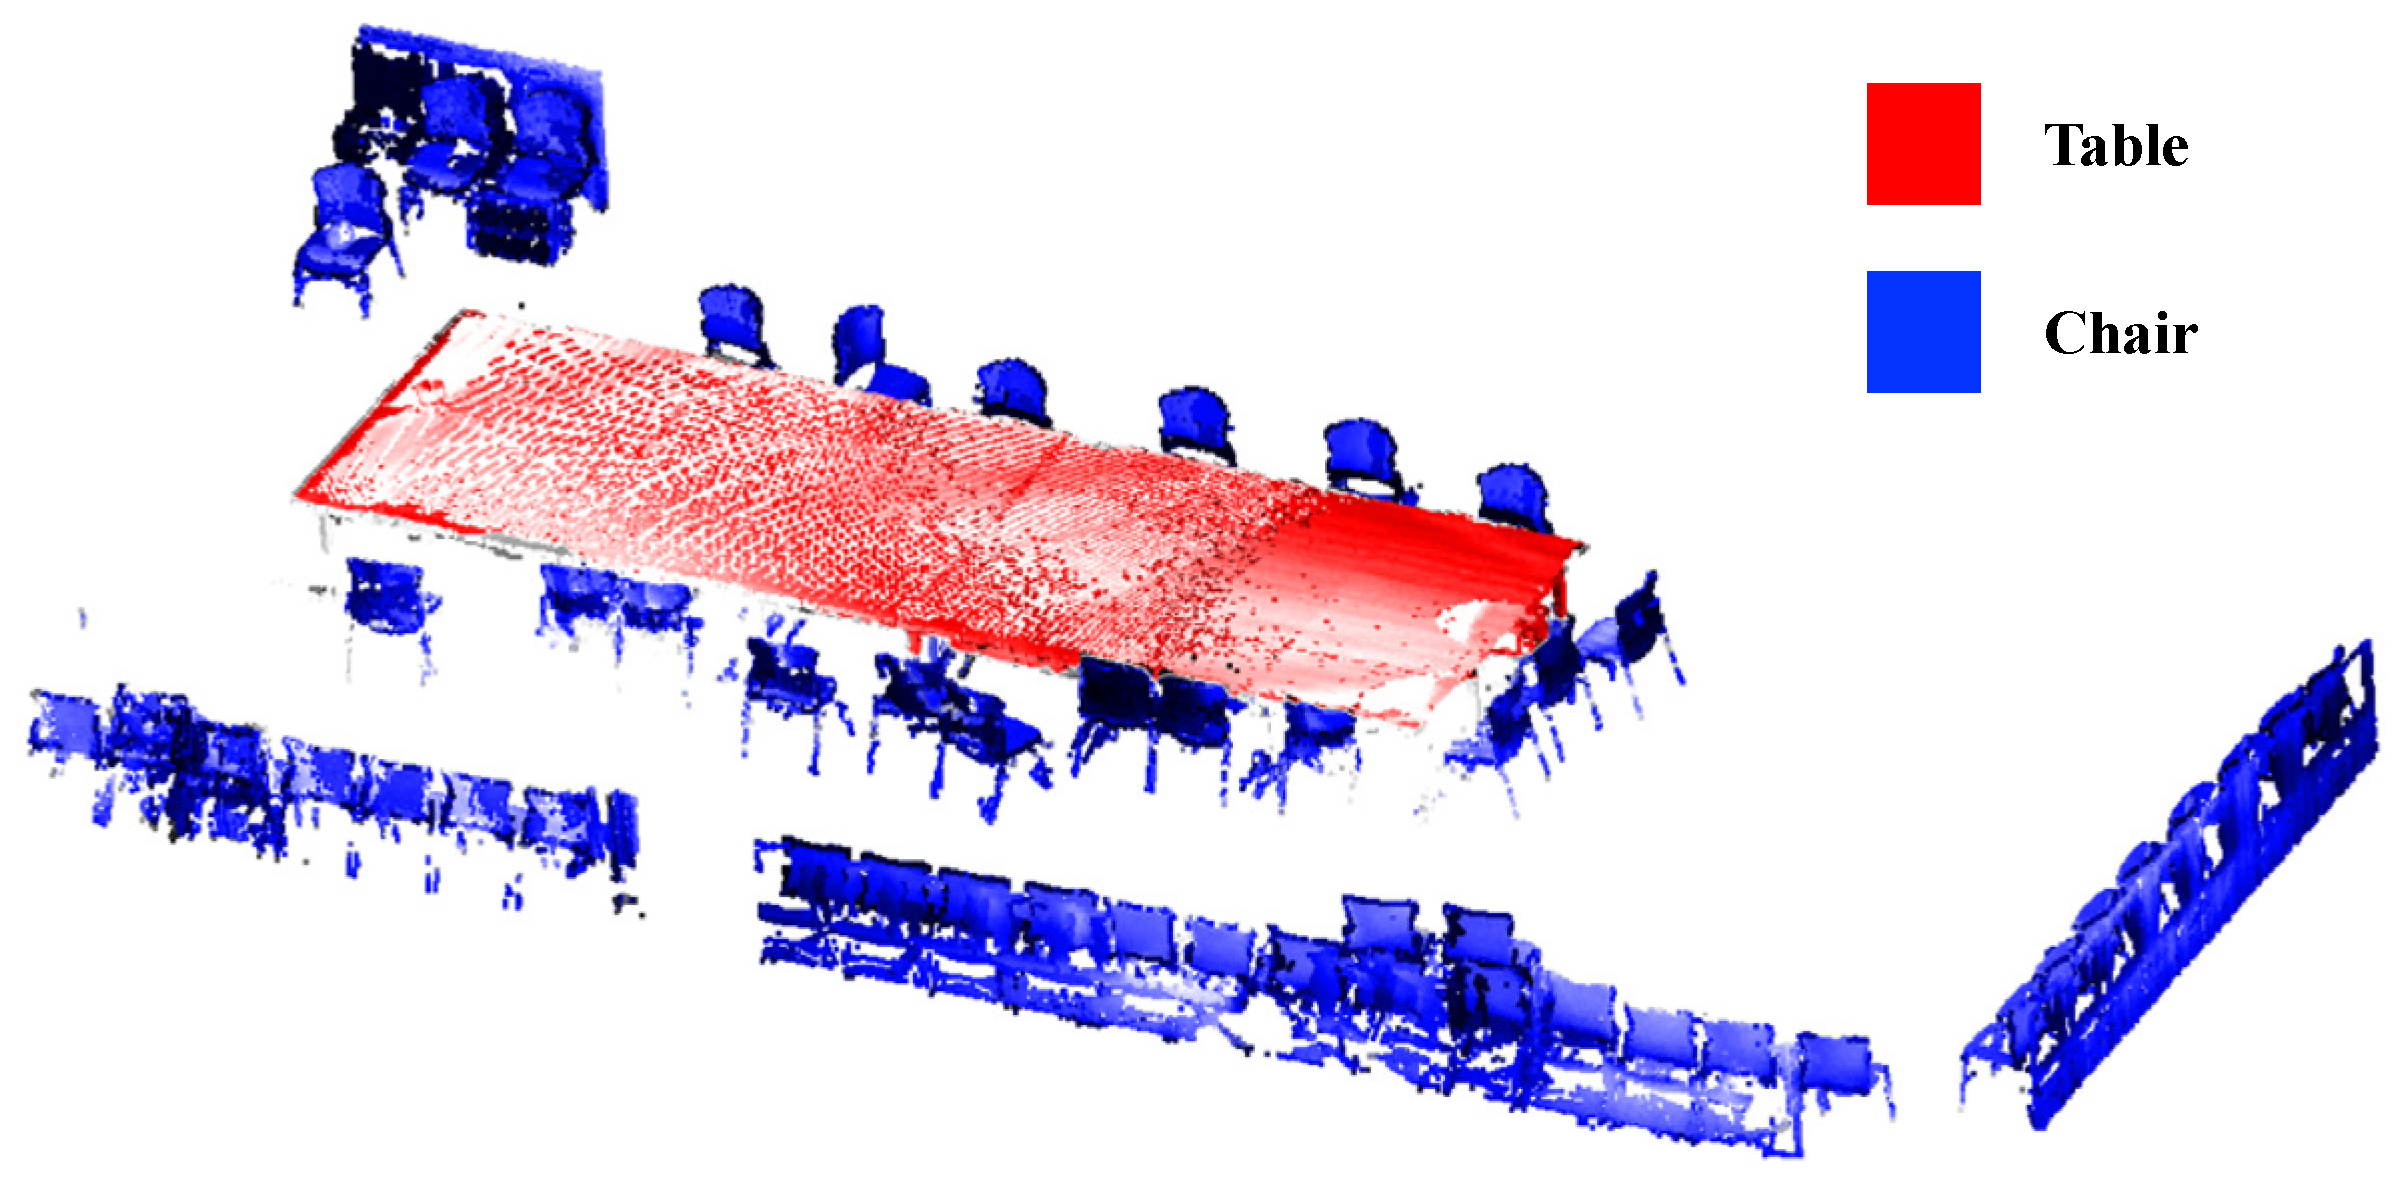
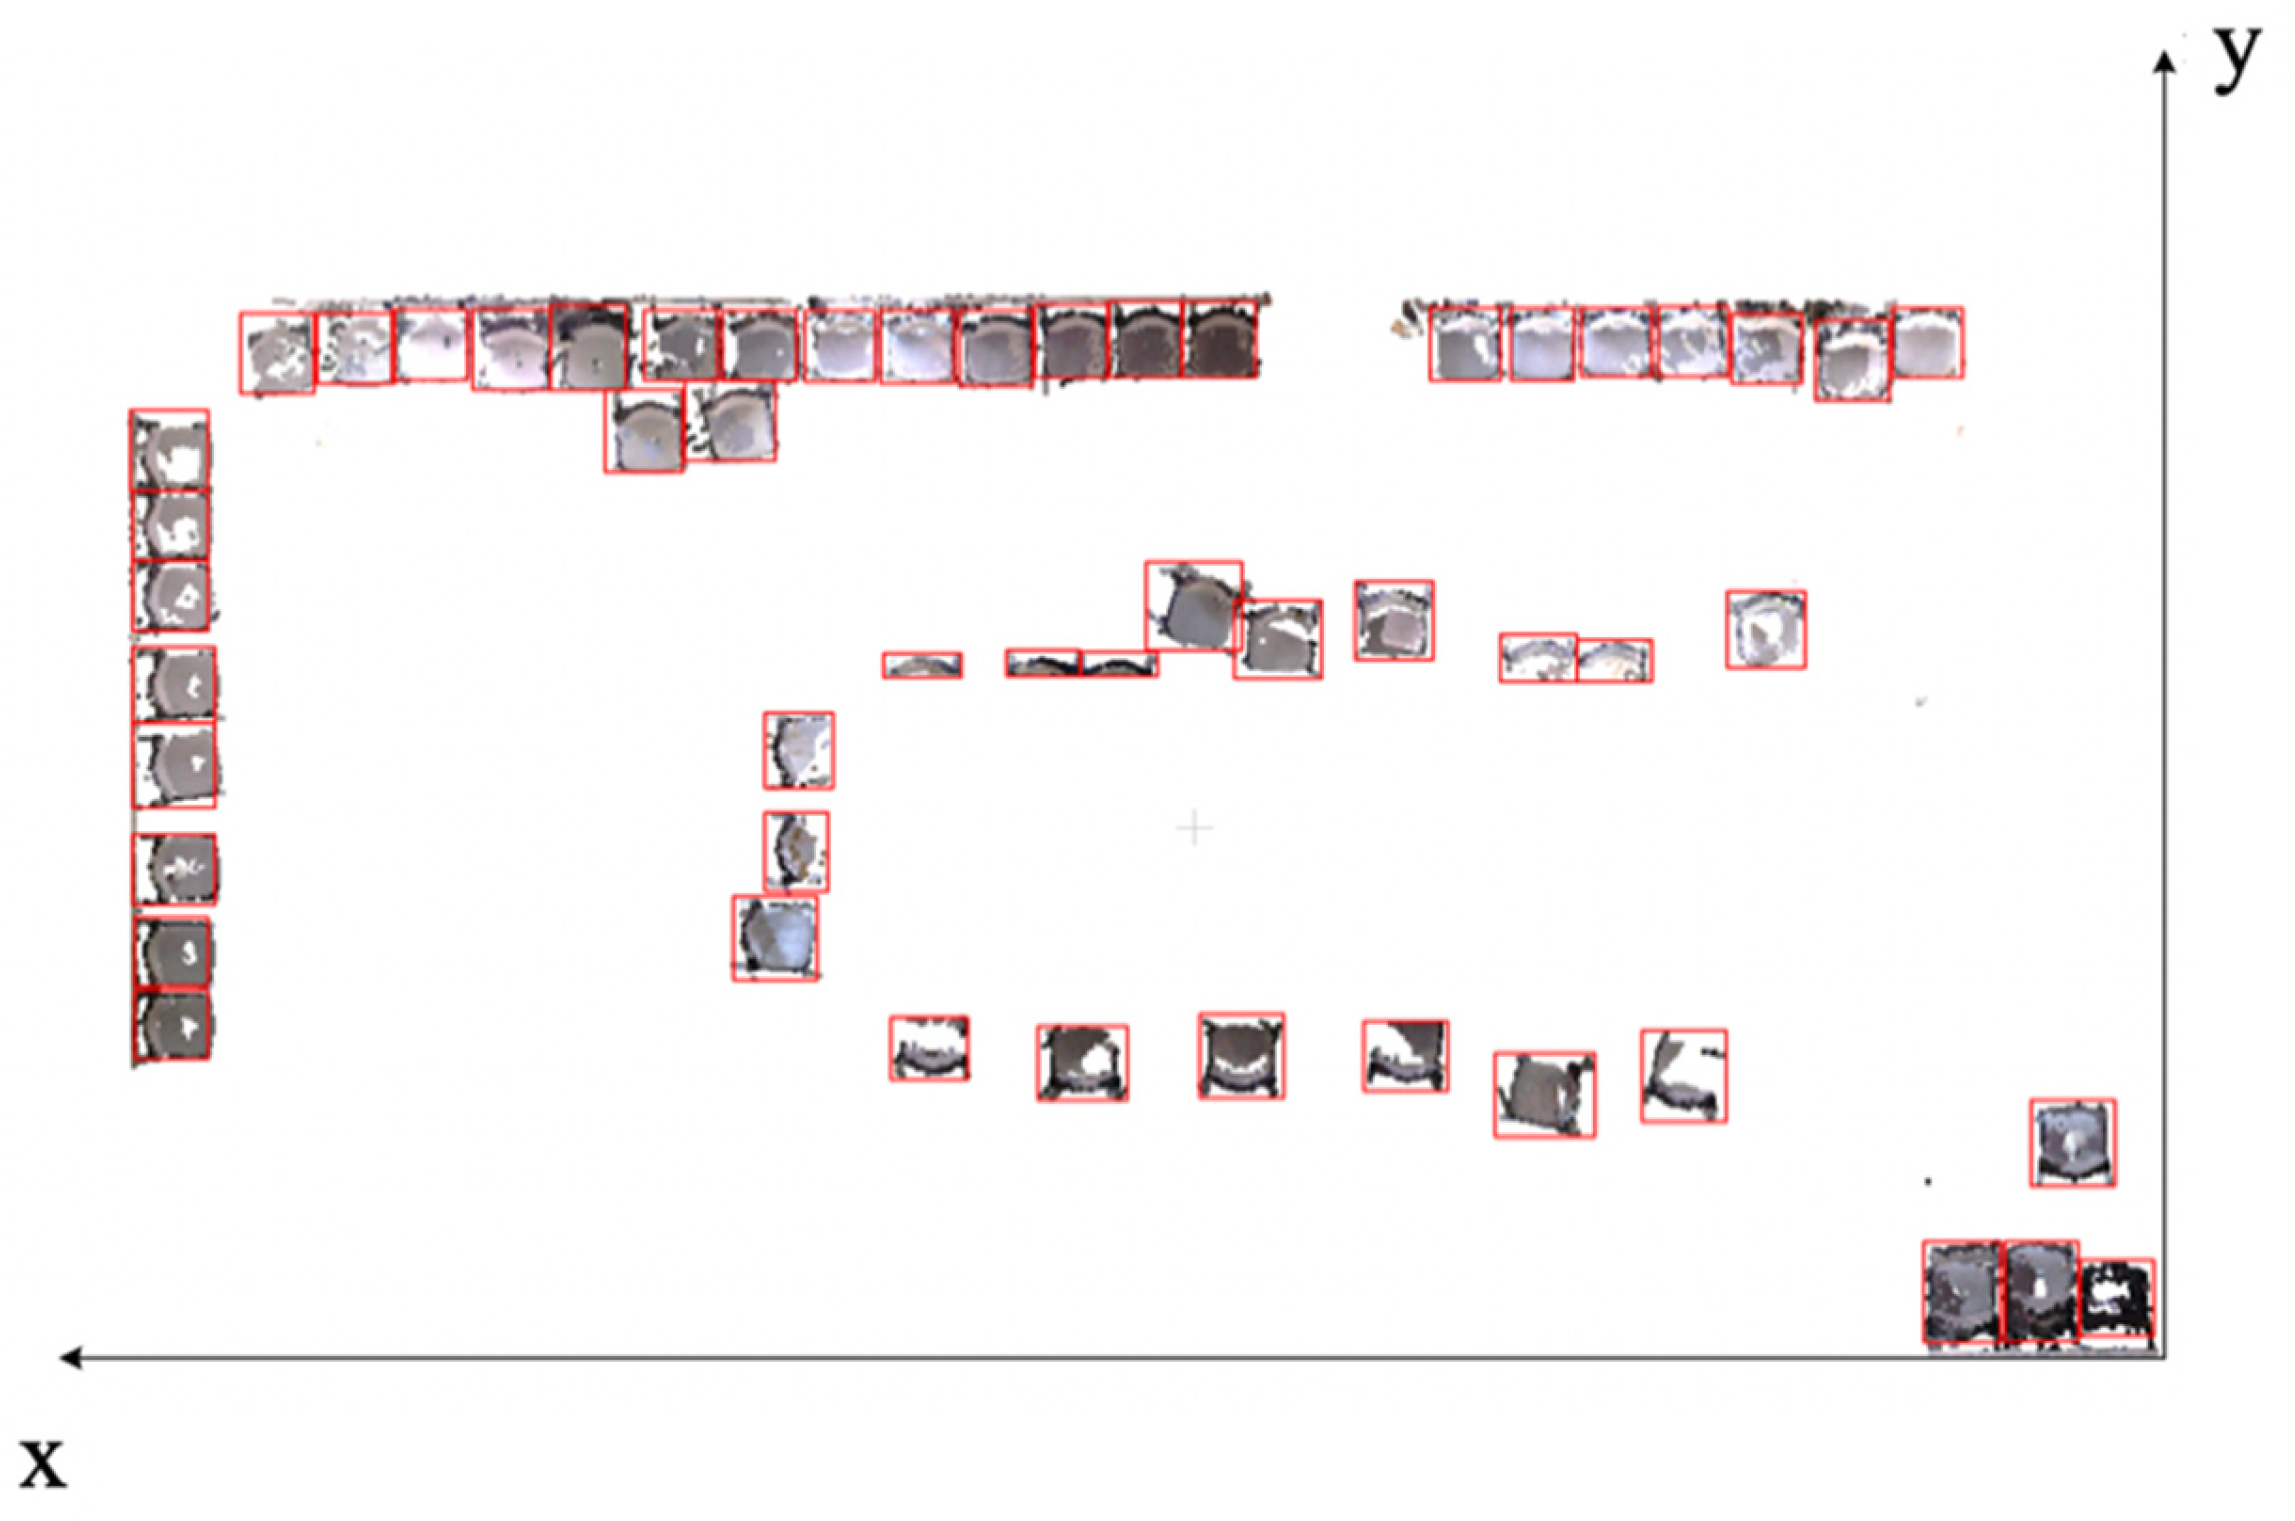
4.3.3. Object Segmentation

The research focused on reconstructing semantic elements, such as tables and chairs, in the indoor scene. Before partitioning, the point cloud data for tables were filtered based on the label values because there was only one table present in this scenario. After filtering, the chair point cloud was subjected to entity segmentation using the octree algorithm. The results are illustrated in Figure 16.
Simultaneously with the partitioning of each object, it was essential to record their XYZ coordinates for the subsequent reconstruction of BIM (building information model) elements using Revit 2016. This process involved importing the collected data into Revit software and then using the XYZ coordinate information to restore the position attributes of the objects, subsequently reconstructing the BIM elements. It was crucial to ensure that the recorded XYZ coordinates aligned with the coordinate system of the Revit model to prevent inaccuracies or an incorrect reconstruction of the BIM elements.
Assuming that there are n points, p 1 , p 2 , p n , their coordinates are ( x 1 , y 1 , z 1 ) , ( x 2 , y 2 , z 2 ) , , ( x n , y n , z n ) . The coordinates of the centroid, C, of these points are presented in Formula (3). Their normal vector coordinates are ( N x 1 , N y 1 , N z 1 ) , ( N x 2 , N y 2 , N z 2 ) , , ( N x n , N y n , N z n ) . The normal vector of the entire point cloud is presented in Formula (4).
X = 1 n x i / n ; Y = 1 n y i / n ; Z = 1 n z i / n
N x = 1 n N x i / n ; N y = 1 n N y i / n ; N z = 1 n N z i / n
By summing the normal vectors of each point in the point cloud, we could determine the orientation of each target object. Due to the presence of only one conference table entity in the data, there was no need to use octree for the objection segmentation. The method for obtaining the conference table’s position information was the same as previously mentioned. Regarding the semantic segmentation of the conference table, since the network’s local segmentation capability was relatively lower compared to the chair elements, the semantic segmentation of the conference table was more complete. In this study, the length, width, and height information of the conference table were directly reconstructed. The individual point cloud of the conference table is shown in Figure 17.
The formula for obtaining the length, width, and height information of the conference table is shown in Figure 5:
length = max 0 < i < n x i min 0 < i < n x i width = max 0 < i < n y i min 0 < i < n y i h e i g h t = max 0 < i < n z i min 0 < i < n z i
Based on the calculations above, a partial dataset is obtained, as shown in Table 3, where x , y , and z represent the spatial coordinates of the BIM elements, and N x , N y , N z represent the normal direction of the component.

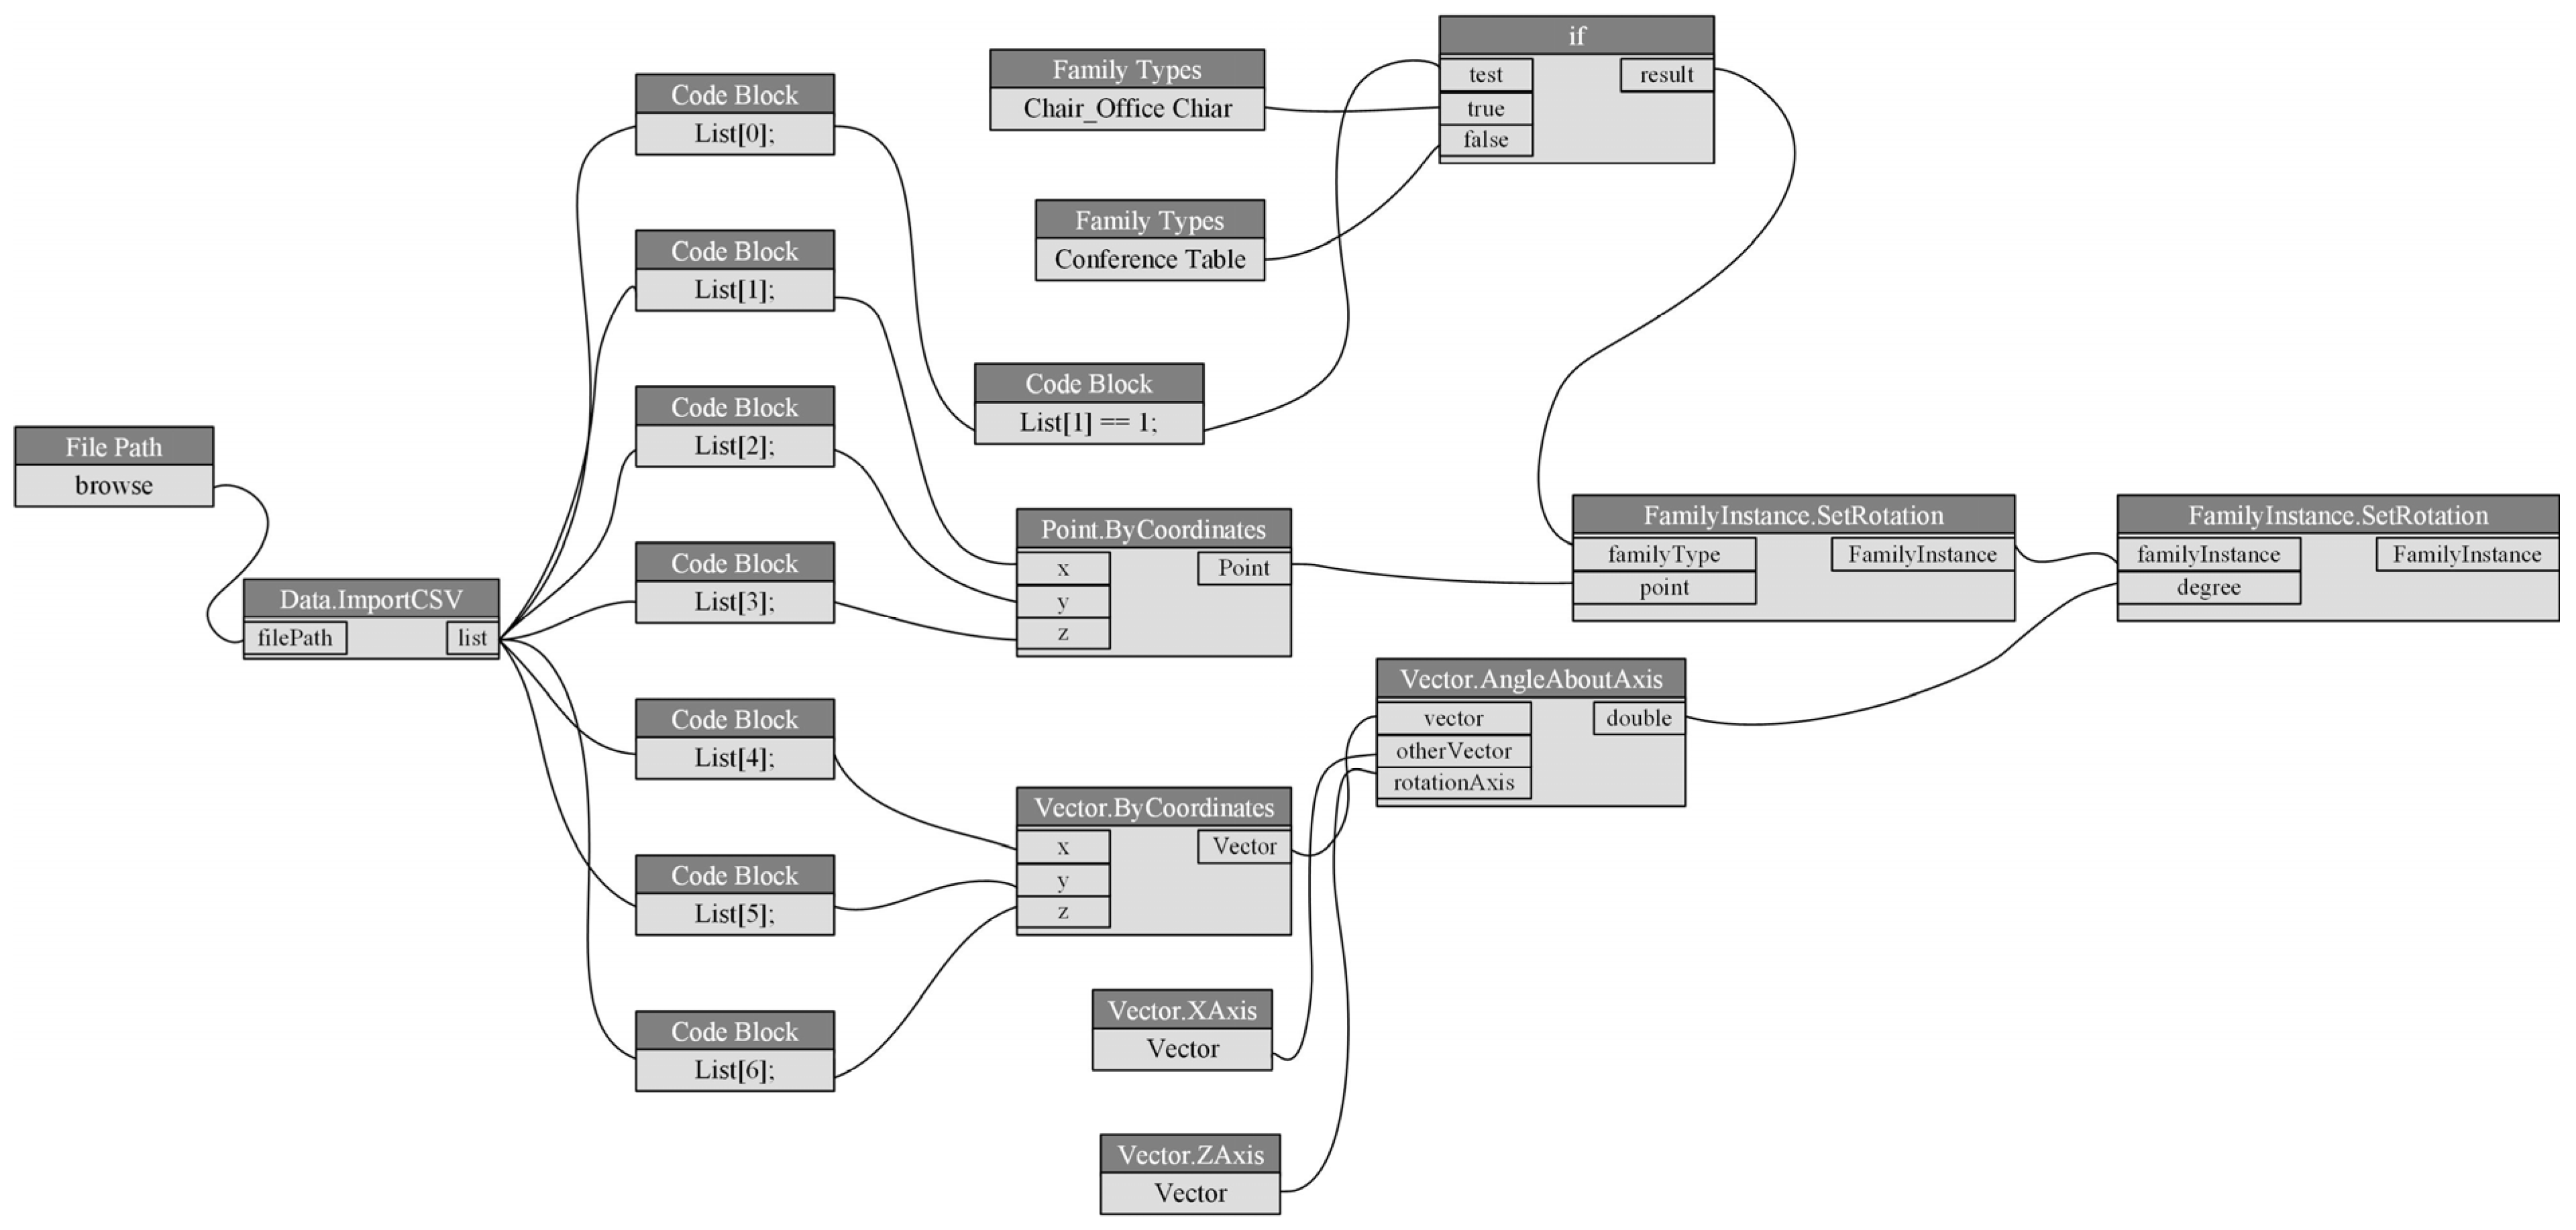
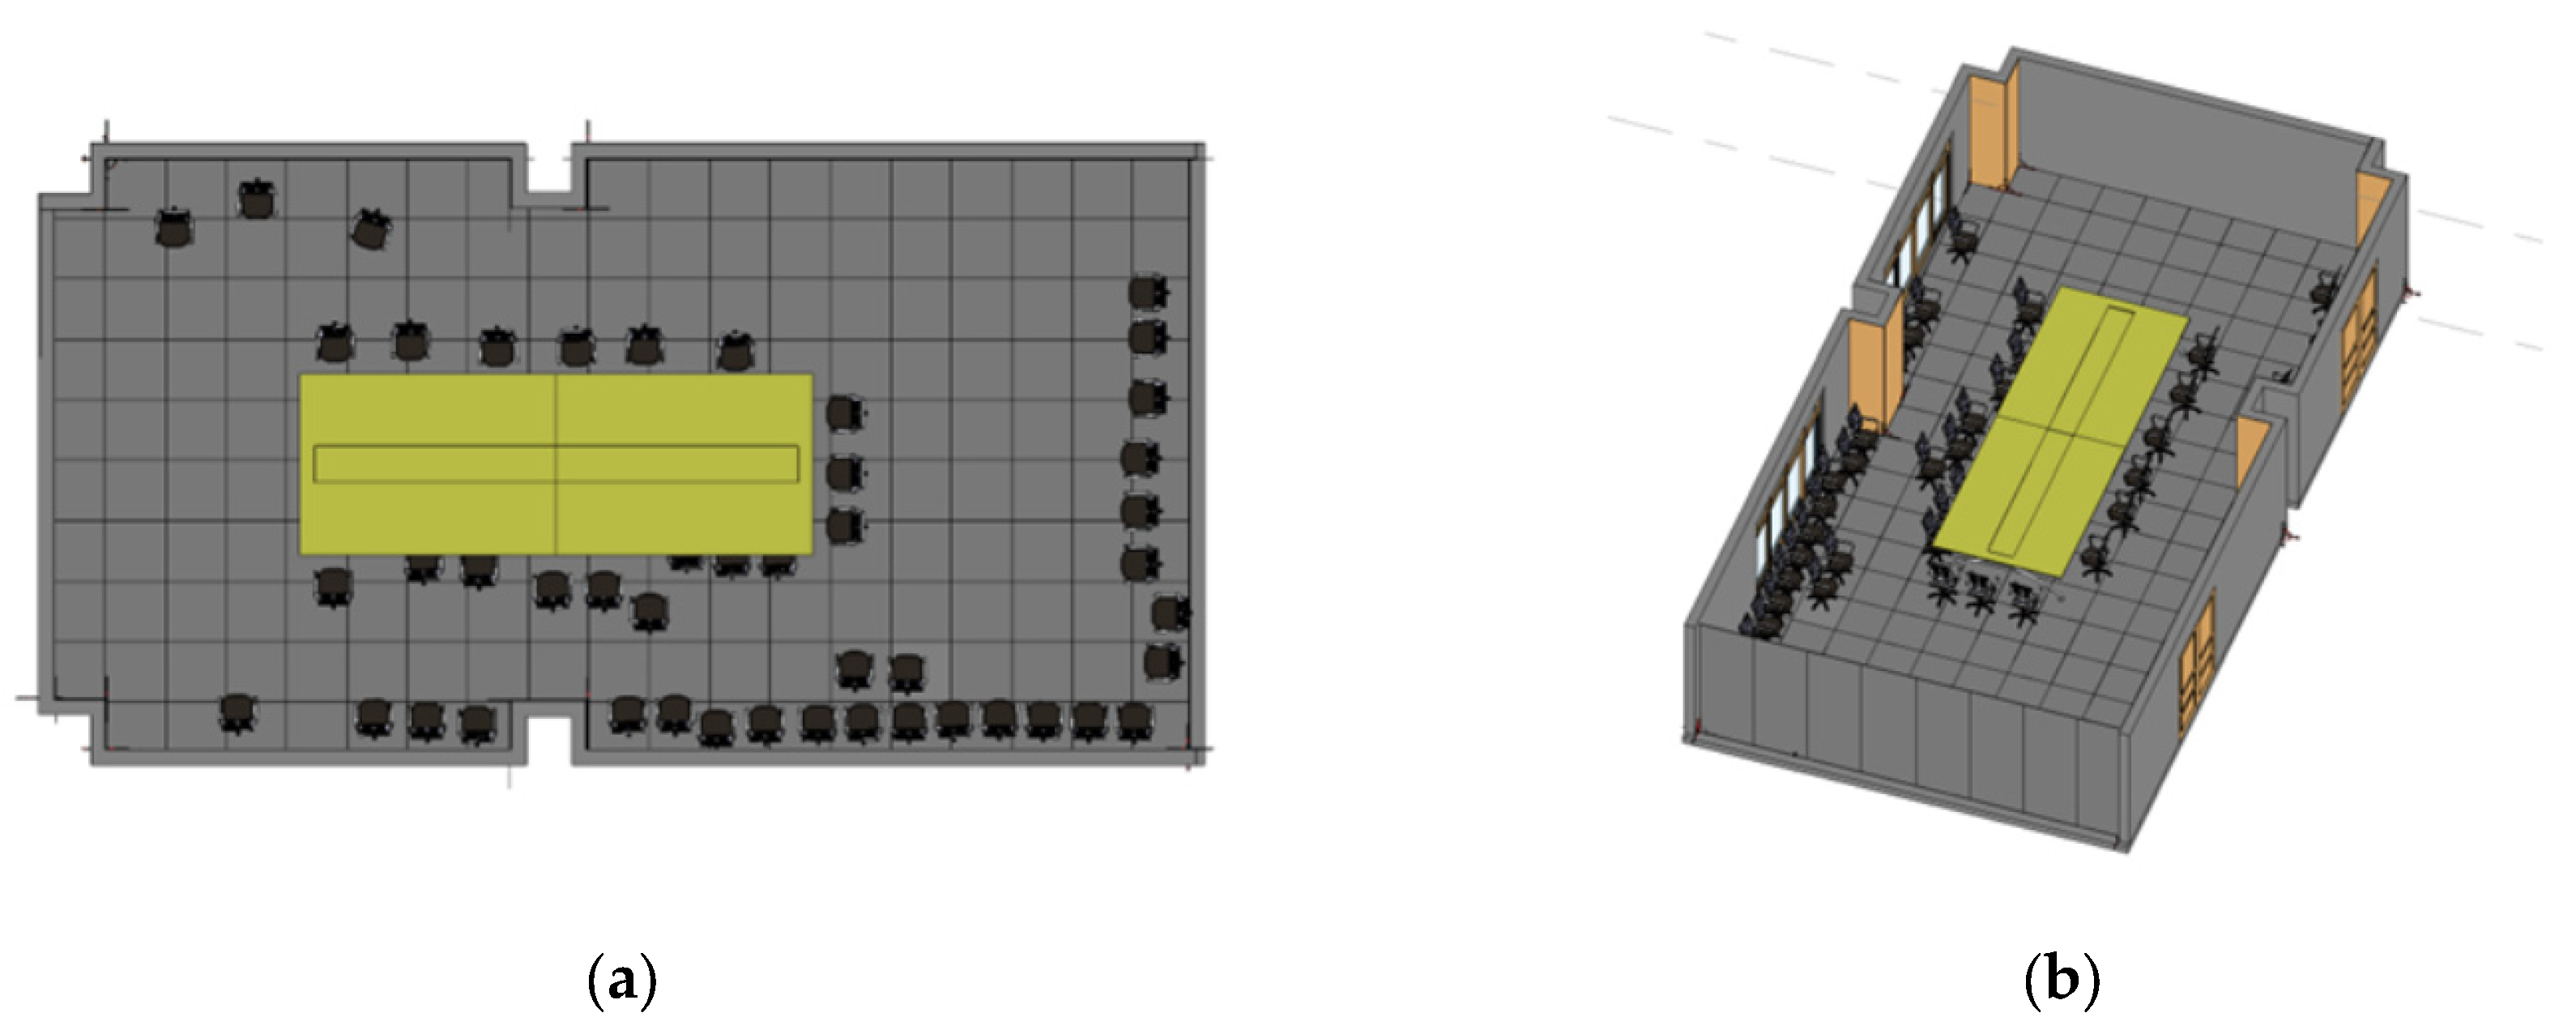
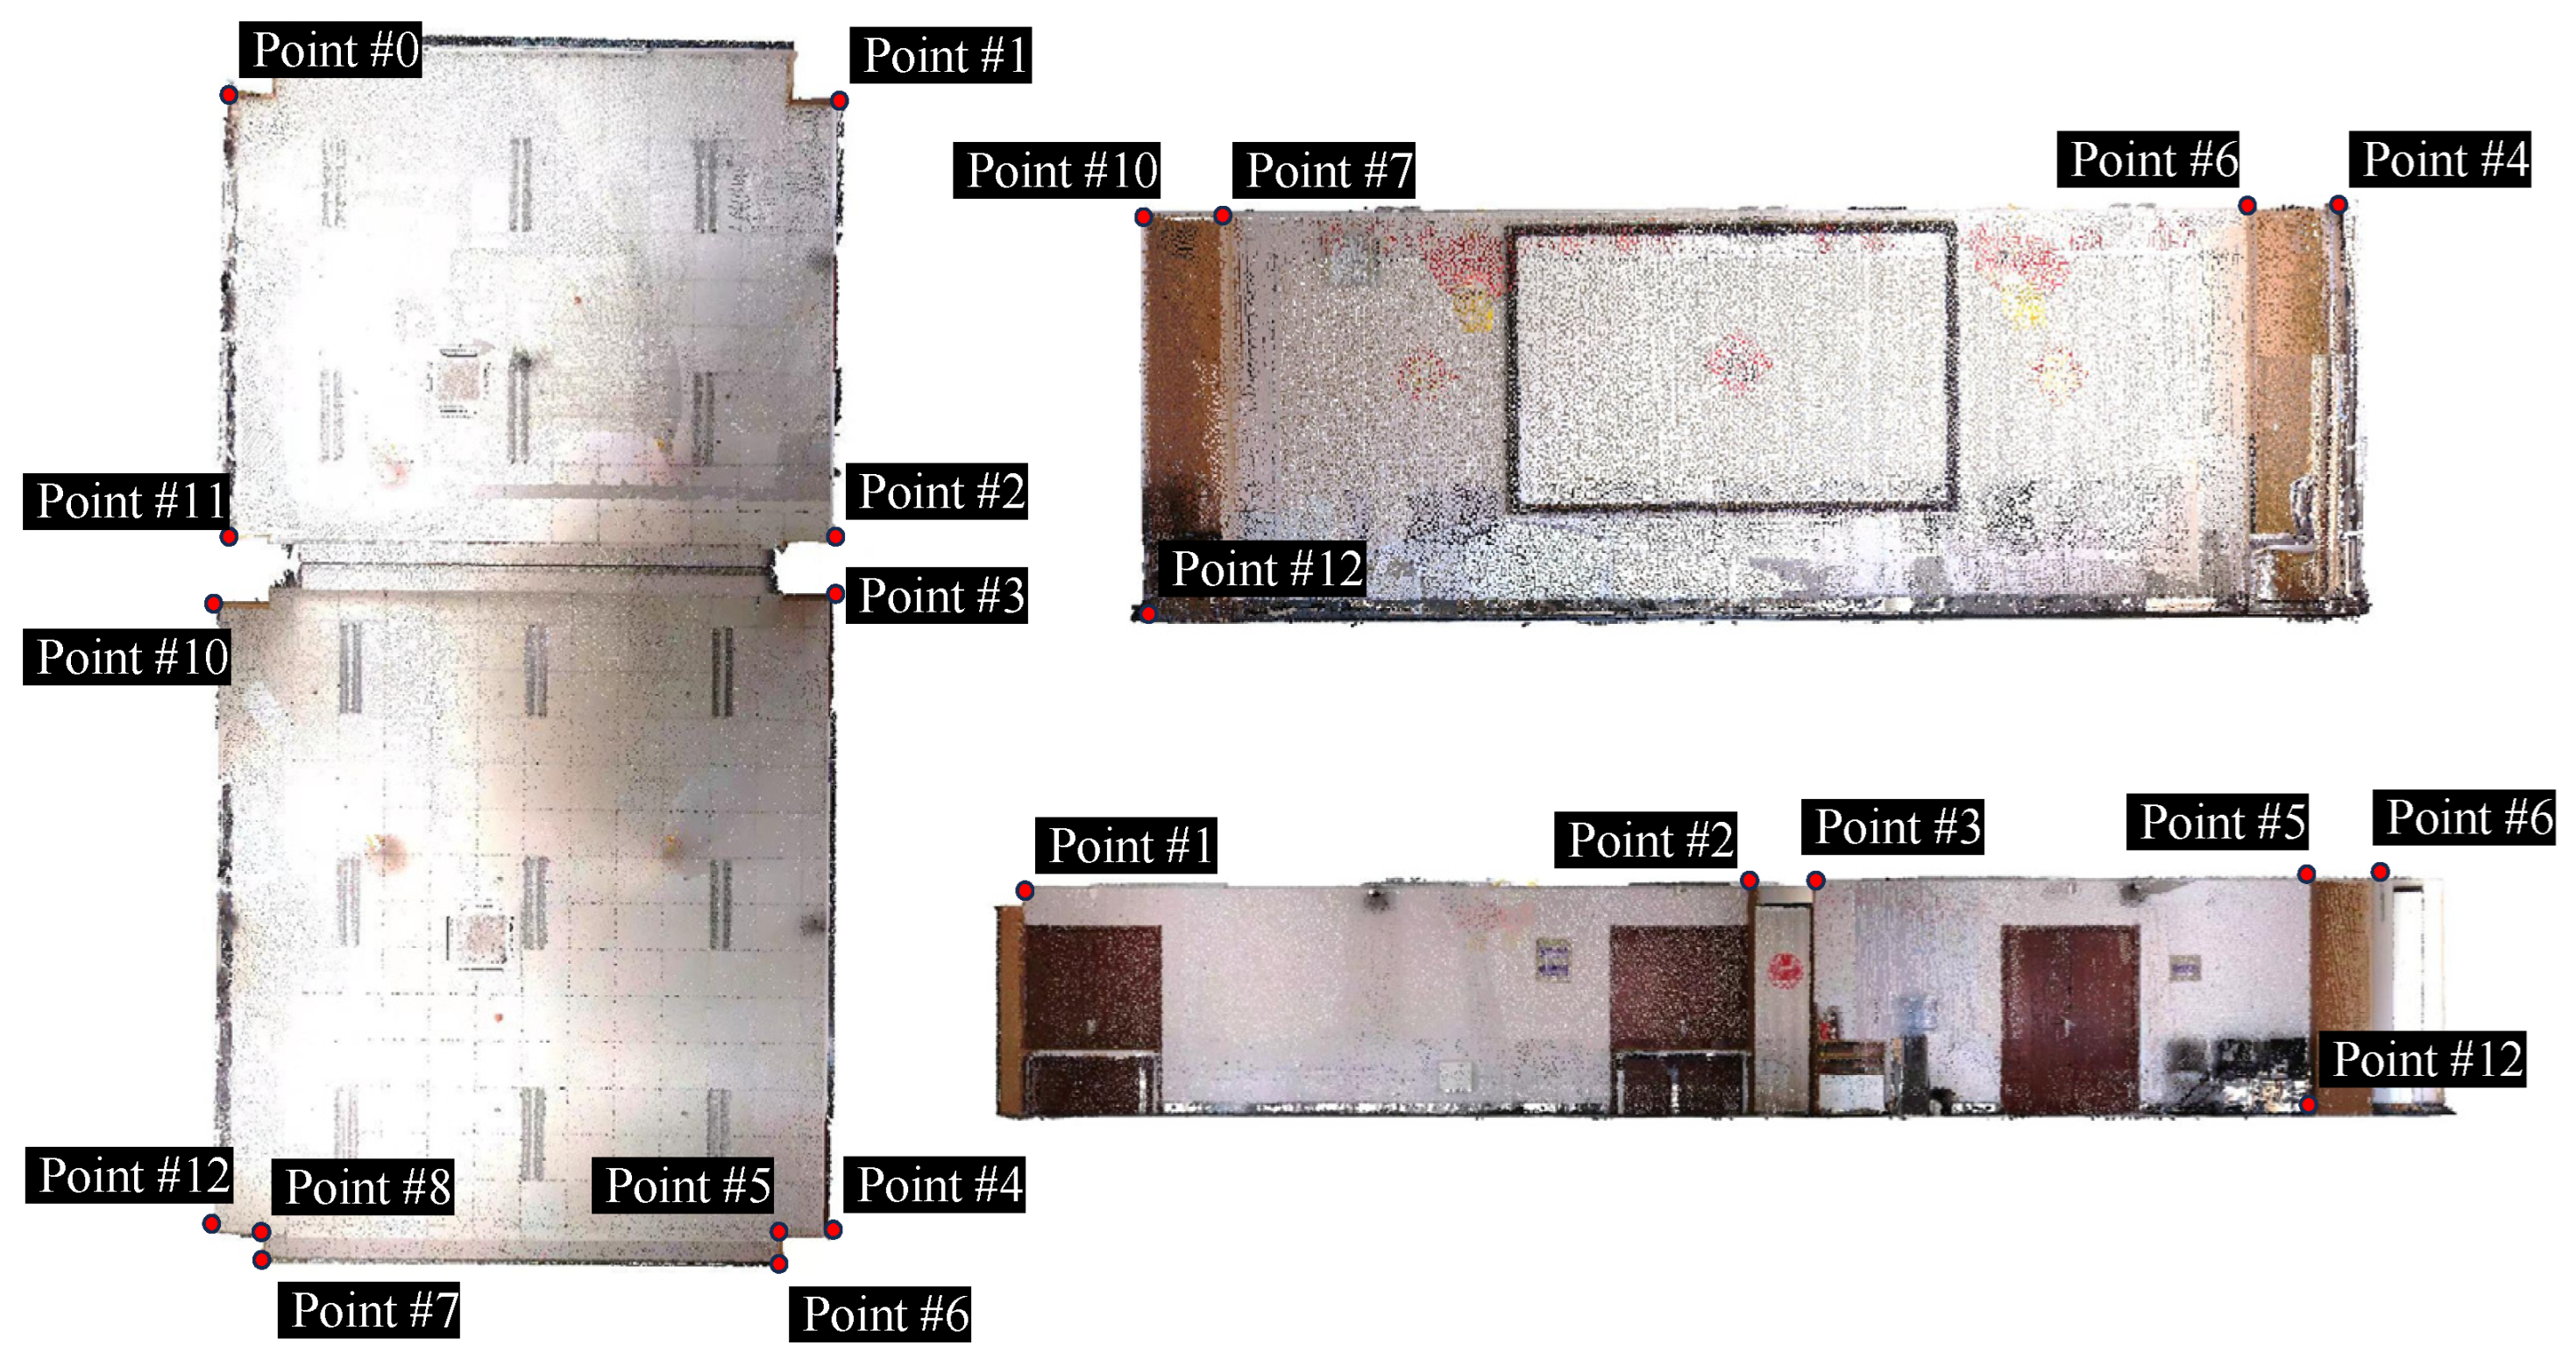
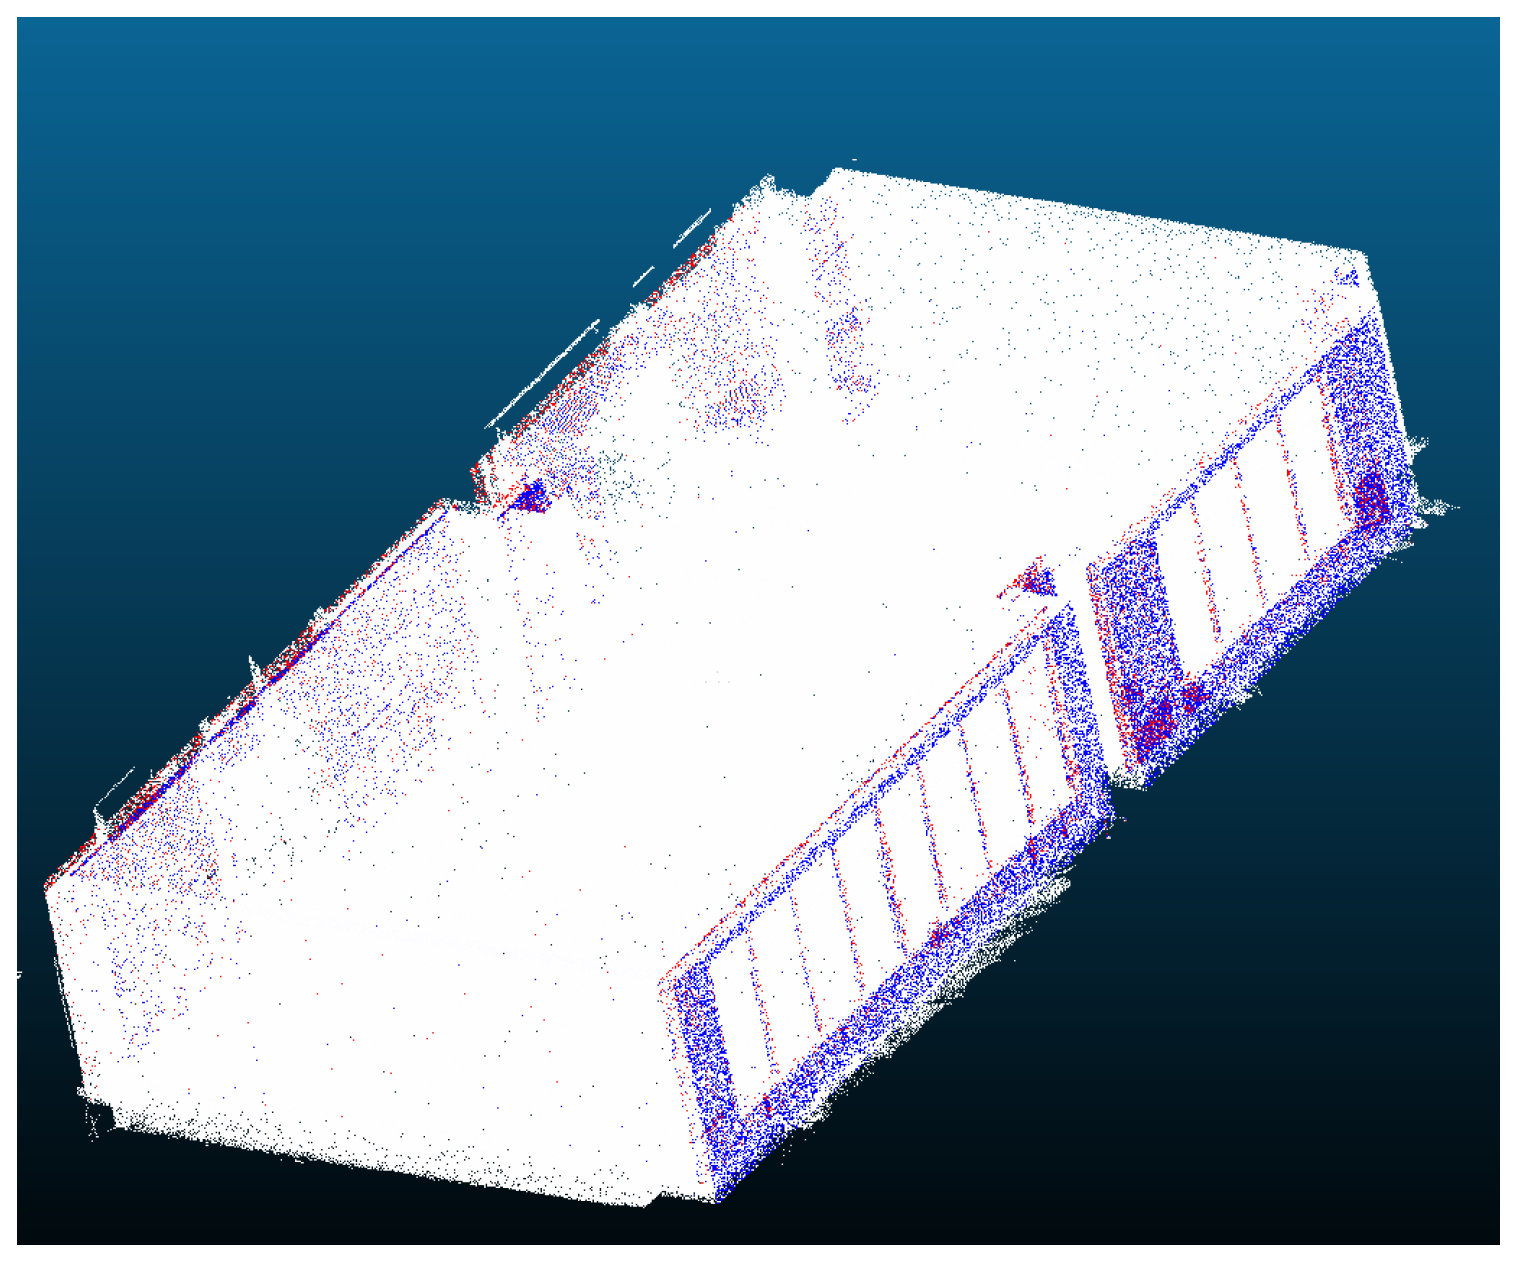
4.3.4. Automatic Reconstruction of the BIM

Dynamo is an open source visual programming platform based on the Autodesk Revit API, designed to assist users in customizing BIM workflows. In contrast to traditional text-based programming languages, visual programming languages use graphical elements instead of textual expressions, enabling users to write scripts and define logic through graphical operations [58]. In this section, Autodesk Dynamo was employed as a visual scripting tool for importing Excel data and generating Revit models of tables and chairs in the indoor scene. The Revit models for the tables and chairs needed to be predefined. The table’s Revit model was adjusted based on the calculated length, width, and height from the entity segmentation, while the chair was replaced with a standard conference chair model. The Dynamo workflow is illustrated in Figure 18.
This process started by using the “file path” node to read the file address and input it into the “Data.importCSV” node. This node can read a CSV file and store it in the form of a list. Then, an “if” statement was used to determine the type of BIM element to be generated based on the attributes in “list [0]”. Then, “list [1]”, “list [2]”, and “list [3]” were used to determine the placement point’s position, which was then input into the “Point.ByCoordinates” node to generate an instance. Moreover, “list [4]”, “list [5]”, and “list [6]” were used to determine the object’s normal direction, which was then input into the “Vector.ByCoordinates” node to obtain a normal vector. Finally, the “Vector.AngleAboutAxis” node was used to rotate it, with respect to the Z-axis, to ensure that the BIM element was correctly positioned. The completed BIM three-dimensional reconstruction model is shown in Figure 19.
The research compared the collected point cloud data with the constructed BIM to investigate the feasibility of the automated BIM reconstruction method. Twelve key points were selected from various perspectives, including the top, side, and front views of the original point cloud data, as shown in Figure 20. A comparison was performed between these key points, and the deviation between the original point cloud data and BIM was calculated to assess the consistency of the BIM created in the study. The research assumed that the distances captured in the actual point cloud data were equal to the design distances. The distances between the points in the figure presented above were calculated, and their deviations from the constructed BIM model are presented in Table 4.
From the table, it can be observed that the errors in the BIM model reconstruction results are mostly within 2 mm, with the largest deviation occurring between Points #6 and #7, reaching 6.777 mm. This was due to the presence of pipeline obstructions in the corners during the data collection process, leading to voids in the original data. During the BIM reconstruction process, these voids resulted in certain inaccuracies when aligning with the original point cloud data. Upon analyzing the areas with larger errors, it was found that this deviation was caused by the thickness of certain wall decorations during the finishing process, leading to discrepancies in the design. To provide a more intuitive representation of the deviation between the BIM model and the actual point cloud, this study used the ICP algorithm to visualize the errors, as shown in Figure 21.
Based on the comprehensive analysis of the experiments, the method proposed in this study demonstrated its feasibility in terms of its accuracy. The feature-enhanced point transformer algorithm achieved an accuracy of 71.3% mIoU, surpassing traditional segmentation algorithms. The average error when reconstructing a BIM was effectively controlled within 2 mm, indicating the high precision of the reconstruction results. In practical engineering applications, to leverage the point cloud data collected, the BIM reconstruction method proposed in this study, based on the feature-enhanced point transformer and octree, enabled a rapid and automated indoor BIM reconstruction. This contributed valuable data support for the application of BIMs for the operation and management of existing buildings.

5. Conclusions

In response to the insufficient research on the low efficiency and automation of BIM reconstructions for existing indoor scenes, this study proposed an automated reconstruction method for an indoor scene BIM based on a feature-enhanced point transformer and octree algorithms. Using the point cloud data collected from a conference room, the study achieved the automated reconstruction of complex indoor scenes in existing buildings, validating the feasibility of the proposed method. The feature-enhanced point Transformer algorithm presented in the study achieved a high segmentation accuracy of 71.3% mIoU. The average error of the reconstructed BIM was effectively controlled within 2 mm, indicating the high precision of the reconstruction results. The proposed method addressed the challenges of dealing with large and spatially complex point cloud data in existing building interiors, enabling the high-precision and automated reconstructions of indoor BIMs. This eliminated the need for extensive manual operations, thereby enhancing the efficiency of BIM reconstructions. The study contributed valuable data support for the application of BIMs for the operation and maintenance management of existing buildings. The feature-enhanced point transformer algorithm introduced in this study exhibited higher accuracy results than traditional algorithms, providing robust algorithmic support for point cloud data segmentation practices.
However, the study presented certain limitations. The semantic segmentation network in this research was trained on the S3DIS dataset, which comprised only 13 classes of point cloud labels, limiting its ability to fully cover all types of elements in various indoor scenes. Moreover, the BIM often included rich attributes, and relying on a single-point cloud dataset to achieve semantic segmentation resulted in limited information being obtained, constraining the development of point clouds for building information modeling. Future research should focus on establishing more generalized and detailed point cloud data training sets. Additionally, exploring how to enhance the accuracy and reliability of BIM reconstructions by integrating different data sources, such as images, point clouds, and RFID tags, and enriching the attribute information of elements, is crucial to better support the development of building information models.

Author Contributions

Conceptualization, J.C. and Z.X. (Zhao Xu); methodology, J.C., Y.L., Z.X. (Zheng Xie) and Z.X. (Zhao Xu); software, Z.X. (Zheng Xie) and S.W.; validation, Y.L., Z.X. (Zheng Xie), S.W. and Z.X. (Zhao Xu); formal analysis, J.C. and Z.X. (Zhao Xu); investigation, Y.L., Z.X. (Zheng Xie), S.W. and Z.X. (Zhao Xu); writing—original draft preparation, J.C., Y.L., Z.X. (Zheng Xie) and Z.X. (Zhao Xu); writing—review and editing, J.C., Y.L., S.W. and Z.X. (Zhao Xu); visualization, Y.L. and Z.X. (Zheng Xie); funding acquisition, Z.X. (Zhao Xu). All authors have read and agreed to the published version of the manuscript.

Funding

This research was funded by the National Natural Science Foundation of China (72071043), the Natural Science Foundation of Jiangsu Province (BK20201280), and the Ministry of Education of Humanities and Social Science Project in China (20YJAZH114).

Institutional Review Board Statement

Not applicable.

Informed Consent Statement

Not applicable.

Data Availability Statement

The data presented in this study are available on request from the corresponding author. The data are not publicly available due to privacy.

Acknowledgments

The authors specially thank all the survey participants and reviewers of the paper.

Conflicts of Interest

Author Junwei Chen and Author Shaofeng Wang were employed by the company China Railway Siyuan Survey and Design Group Co., Ltd. The remaining authors declare that the research was conducted in the absence of any commercial or financial relationships that could be construed as a potential conflict of interest.

References

  1. Meyer, T.; Brunn, A.; Stilla, U. Change detection for indoor construction progress monitoring based on BIM, point clouds and uncertainties. Autom. Constr. 2022, 141, 104442. [Google Scholar] [CrossRef]
  2. Utkucu, D.; Sözer, H. Interoperability and data exchange within BIM platform to evaluate building energy performance and indoor comfort. Autom. Constr. 2020, 116, 103225. [Google Scholar] [CrossRef]
  3. Cao, Y.; Kamaruzzaman, S.; Aziz, N. Green Building Construction: A Systematic Review of BIM Utilization. Buildings 2022, 12, 1205. [Google Scholar] [CrossRef]
  4. Tang, S.; Shelden, D.R.; Eastman, C.M.; Pishdad-Bozorgi, P.; Gao, X. A review of building information modeling (BIM) and the internet of things (IoT) devices integration: Present status and future trends. Autom. Constr. 2019, 101, 127–139. [Google Scholar] [CrossRef]
  5. Hou, G.; Li, L.; Xu, Z.; Chen, Q.; Liu, Y.; Qiu, B. A BIM-Based Visual Warning Management System for Structural Health Monitoring Integrated with LSTM Network. KSCE J. Civ. Eng. 2021, 25, 2779–2793. [Google Scholar] [CrossRef]
  6. Farnsworth, C.B.; Beveridge, S.; Miller, K.R.; Christofferson, J.P. Application, Advantages, and Methods Associated with Using BIM in Commercial Construction. Int. J. Construct. Educ. Res. 2014, 11, 218–236. [Google Scholar] [CrossRef]
  7. Murali, S.; Speciale, P.; Oswald, M.R.; Pollefeys, M. Indoor Scan2BIM: Building information models of house interiors. In Proceedings of the 2017 IEEE/RSJ International Conference on Intelligent Robots and Systems (IROS), Vancouver, BC, Canada, 24–28 September 2017; pp. 6126–6133. [Google Scholar] [CrossRef]
  8. Hichri, N.; Stefani, C.; De Luca, L.; Veron, P. Review of the “AS-BUILT BIM” Approaches. Int. Arch. Photogramm. Remote Sens. Spat. Inf. Sci. 2013, XL-5/W1, 107–112. [Google Scholar] [CrossRef]
  9. Han, X.F.; Laga, H.; Bennamoun, M. Image-Based 3D Object Reconstruction: State-of-the-Art and Trends in the Deep Learning Era. IEEE Trans. Pattern Anal. Mach. Intell. 2021, 43, 1578–1604. [Google Scholar] [CrossRef]
  10. Hong, K.; Wang, H.; Zhu, B. Small Defect Instance Reconstruction Based on 2D Connectivity-3D Probabilistic Voting. In Proceedings of the 2021 IEEE International Conference on Robotics and Biomimetics (ROBIO), Sanya, China, 27–31 December 2021; pp. 1448–1453. [Google Scholar] [CrossRef]
  11. Garrido, M.; Paraforos, D.; Reiser, D.; Vázquez Arellano, M.; Griepentrog, H.; Valero, C. 3D Maize Plant Reconstruction Based on Georeferenced Overlapping LiDAR Point Clouds. Remote Sens. 2015, 7, 17077–17096. [Google Scholar] [CrossRef]
  12. Fan, B.; Kong, Q.; Wang, X.; Wang, Z.; Xiang, S.; Pan, C.; Fua, P. A Performance Evaluation of Local Features for Image-Based 3D Reconstruction. IEEE Trans. Image Process. 2019, 28, 4774–4789. [Google Scholar] [CrossRef]
  13. Asadi, K.; Ramshankar, H.; Noghabaei, M.; Han, K. Real-Time Image Localization and Registration with BIM Using Perspective Alignment for Indoor Monitoring of Construction. J. Comput. Civ. Eng. 2019, 33, 04019031. [Google Scholar] [CrossRef]
  14. Mahmood, B.; Han, S.; Lee, D.-E. BIM-Based Registration and Localization of 3D Point Clouds of Indoor Scenes Using Geometric Features for Augmented Reality. Remote Sens. 2020, 12, 2302. [Google Scholar] [CrossRef]
  15. Wang, B.; Wang, Q.; Cheng, J.C.P.; Song, C.; Yin, C. Vision-assisted BIM reconstruction from 3D LiDAR point clouds for MEP scenes. Autom. Constr. 2022, 133, 103997. [Google Scholar] [CrossRef]
  16. Yang, K.; Hu, X.; Bergasa, L.M.; Romera, E.; Huang, X.; Sun, D.; Wang, K. Can we pass beyond the field of view? Panoramic annular semantic segmentation for real-world surrounding perception. In Proceedings of the 2019 IEEE Intelligent Vehicles Symposium (IV), Paris, France, 9–12 June 2019; pp. 446–453. [Google Scholar] [CrossRef]
  17. Nguyen, A.; Le, B. 3D point cloud segmentation: A survey. In Proceedings of the 2013 6th IEEE Conference on Robotics, Automation and Mechatronics (RAM), Manila, Philippines, 12–15 November 2013; pp. 225–230. [Google Scholar] [CrossRef]
  18. Qi, C.R.; Su, H.; Mo, K.; Guibas, L.J. PointNet: Deep Learning on Point Sets for 3D Classification and Segmentation. In Proceedings of the 2017 IEEE Conference on Computer Vision and Pattern Recognition (CVPR), Honolulu, HI, USA, 21–26 July 2017; pp. 77–85. [Google Scholar] [CrossRef]
  19. Qi, C.R.; Yi, L.; Su, H.; Guibas, L.J. PointNet++: Deep hierarchical feature learning on point sets in a metric space. In Proceedings of the 31st International Conference on Neural Information Processing Systems, Long Beach, CA, USA, 4–9 December 2017; pp. 5105–5114. [Google Scholar] [CrossRef]
  20. Zhao, H.; Jiang, L.; Jia, J.; Torr, P.H.; Koltun, V. Point transformer. In Proceedings of the IEEE/CVF International Conference on Computer Vision, Montreal, QC, Canada, 10–17 October 2021; pp. 16259–16268. [Google Scholar] [CrossRef]
  21. Guo, M.-H.; Cai, J.-X.; Liu, Z.-N.; Mu, T.-J.; Martin, R.R.; Hu, S.-M. PCT: Point cloud transformer. Comput. Vis. Media 2021, 7, 187–199. [Google Scholar] [CrossRef]
  22. Du, R.; Ma, Z.; Xie, P.; He, Y.; Cen, H. PST: Plant segmentation transformer for 3D point clouds of rapeseed plants at the podding stage. ISPRS J. Photogramm. Remote Sens. 2023, 195, 380–392. [Google Scholar] [CrossRef]
  23. Ando, A.; Gidaris, S.; Bursuc, A.; Puy, G.; Boulch, A.; Marlet, R. RangeViT: Towards Vision Transformers for 3D Semantic Segmentation in Autonomous Driving. In Proceedings of the IEEE/CVF Conference on Computer Vision and Pattern Recognition, Vancouver, BC, Canada, 17–24 June 2023; pp. 5240–5250. [Google Scholar] [CrossRef]
  24. Ibrahim, M.; Akhtar, N.; Anwar, S.; Mian, A. SAT3D: Slot Attention Transformer for 3D Point Cloud Semantic Segmentation. IEEE Trans. Intell. Transp. Syst. 2023, 24, 5456–5466. [Google Scholar] [CrossRef]
  25. Schult, J.; Engelmann, F.; Hermans, A.; Litany, O.; Tang, S.; Leibe, B. Mask3D: Mask Transformer for 3D Semantic Instance Segmentation. In Proceedings of the 2023 IEEE International Conference on Robotics and Automation (ICRA), London, UK, 29 May–2 June 2023; pp. 8216–8223. [Google Scholar] [CrossRef]
  26. Zhao, B.; Hua, X.; Yu, K.; Xuan, W.; Chen, X.; Tao, W. Indoor Point Cloud Segmentation Using Iterative Gaussian Mapping and Improved Model Fitting. IEEE Trans. Geosci. Remote Sens. 2020, 58, 7890–7907. [Google Scholar] [CrossRef]
  27. Zhong, Y.; Zhao, D.; Cheng, D.; Zhang, J.; Tian, D. A Fast and Precise Plane Segmentation Framework for Indoor Point Clouds. Remote Sens. 2022, 14, 3519. [Google Scholar] [CrossRef]
  28. Fotsing, C.; Hahn, P.; Cunningham, D.; Bobda, C. Volumetric wall detection in unorganized indoor point clouds using continuous segments in 2D grids. Autom. Constr. 2022, 141, 104462. [Google Scholar] [CrossRef]
  29. Hsieh, C.-S.; Ruan, X.-J. Automated Semantic Segmentation of Indoor Point Clouds from Close-Range Images with Three-Dimensional Deep Learning. Buildings 2023, 13, 468. [Google Scholar] [CrossRef]
  30. Li, Y.; Xu, W.; Chen, H.; Jiang, J.; Li, X. A Novel Framework Based on Mask R-CNN and Histogram Thresholding for Scalable Segmentation of New and Old Rural Buildings. Remote Sens. 2021, 13, 1070. [Google Scholar] [CrossRef]
  31. Xu, Z.; Baojie, X.; Guoxin, W. Canny edge detection based on Open CV. In Proceedings of the 2017 13th IEEE International Conference on Electronic Measurement & Instruments (ICEMI), Yangzhou, China, 20–22 October 2017; pp. 53–56. [Google Scholar] [CrossRef]
  32. Macher, H.; Landes, T.; Grussenmeyer, P. Point clouds segmentation as base for as-built BIM creation. ISPRS Ann. Photogramm. Remote Sens. Spat. Inf. Sci. 2015, II-5/W3, 191–197. [Google Scholar] [CrossRef]
  33. Li, J.; Sun, A.; Han, J.; Li, C. A Survey on Deep Learning for Named Entity Recognition. IEEE Trans. Knowl. Data Eng. 2022, 34, 50–70. [Google Scholar] [CrossRef]
  34. Liang, Z.; Li, Z.; Xu, S.; Tan, M.; Jia, K. Instance segmentation in 3D scenes using semantic superpoint tree networks. In Proceedings of the IEEE/CVF International Conference on Computer Vision, Montreal, QC, Canada, 10–17 October 2021; pp. 2783–2792. [Google Scholar] [CrossRef]
  35. Liu, Z.; Qi, X.; Fu, C.-W. One thing one click: A self-training approach for weakly supervised 3d semantic segmentation. In Proceedings of the IEEE/CVF Conference on Computer Vision and Pattern Recognition, Nashville, TN, USA, 20–25 June 2021; pp. 1726–1736. [Google Scholar] [CrossRef]
  36. Shen, T.; Gao, J.; Kar, A.; Fidler, S. Interactive annotation of 3D object geometry using 2D scribbles. In Proceedings of the Computer Vision–ECCV 2020: 16th European Conference, Glasgow, UK, 23–28 August 2020; Proceedings, Part XVII 16, 2020. pp. 751–767. [Google Scholar] [CrossRef]
  37. Kontogianni, T.; Celikkan, E.; Tang, S.; Schindler, K. Interactive Object Segmentation in 3D Point Clouds. In Proceedings of the 2023 IEEE International Conference on Robotics and Automation (ICRA), London, UK, 29 May–2 June 2023; pp. 2891–2897. [Google Scholar] [CrossRef]
  38. Vo, A.-V.; Truong-Hong, L.; Laefer, D.F.; Bertolotto, M. Octree-based region growing for point cloud segmentation. ISPRS J. Photogramm. Remote Sens. 2015, 104, 88–100. [Google Scholar] [CrossRef]
  39. Cui, M.; Long, J.; Feng, M.; Li, B.; Kai, H. OctFormer: Efficient octree-based transformer for point cloud compression with local enhancement. In Proceedings of the AAAI Conference on Artificial Intelligence, Washington, DC, USA, 7–14 February 2023; pp. 470–478. [Google Scholar] [CrossRef]
  40. Yuan, G.; Fu, Q.; Mi, Z.; Luo, Y.; Tao, W. SSRNet: Scalable 3D Surface Reconstruction Network. IEEE Trans. Visual Comput. Graph. 2022, 29, 4906–4919. [Google Scholar] [CrossRef] [PubMed]
  41. López, F.; Lerones, P.; Llamas, J.; Gómez-García-Bermejo, J.; Zalama, E. A Review of Heritage Building Information Modeling (H-BIM). Multimodal Technol. Interact. 2018, 2, 21. [Google Scholar] [CrossRef]
  42. Zhao, Y.; Deng, X.; Lai, H. Reconstructing BIM from 2D structural drawings for existing buildings. Autom. Constr. 2021, 128, 103750. [Google Scholar] [CrossRef]
  43. Domínguez, B.; García, Á.L.; Feito, F.R. Semiautomatic detection of floor topology from CAD architectural drawings. Comput.-Aided Des. 2012, 44, 367–378. [Google Scholar] [CrossRef]
  44. Ahmed, S.; Liwicki, M.; Weber, M.; Dengel, A. Improved Automatic Analysis of Architectural Floor Plans. In Proceedings of the 2011 International Conference on Document Analysis and Recognition, Beijing, China, 18–21 September 2011; pp. 864–869. [Google Scholar] [CrossRef]
  45. Ma, J.W.; Czerniawski, T.; Leite, F. Semantic segmentation of point clouds of building interiors with deep learning: Augmenting training datasets with synthetic BIM-based point clouds. Autom. Constr. 2020, 113, 103144. [Google Scholar] [CrossRef]
  46. Lu, G.; Yan, Y.; Sebe, N.; Kambhamettu, C. Indoor localization via multi-view images and videos. Comput. Vis. Image Underst. 2017, 161, 145–160. [Google Scholar] [CrossRef]
  47. Hamledari, H.; McCabe, B.; Davari, S. Automated computer vision-based detection of components of under-construction indoor partitions. Autom. Constr. 2017, 74, 78–94. [Google Scholar] [CrossRef]
  48. Zhao, Y.; Deng, X.; Lai, H. A Deep Learning-Based Method to Detect Components from Scanned Structural Drawings for Reconstructing 3D Models. Appl. Sci. 2020, 10, 2066. [Google Scholar] [CrossRef]
  49. Xue, F.; Lu, W.; Chen, K. Automatic Generation of Semantically Rich As-Built Building Information Models Using 2D Images: A Derivative-Free Optimization Approach. Comput. Aided Civil Infrastruct. Eng. 2018, 33, 926–942. [Google Scholar] [CrossRef]
  50. Ma, Z.; Liu, S. A review of 3D reconstruction techniques in civil engineering and their applications. Adv. Eng. Inf. 2018, 37, 163–174. [Google Scholar] [CrossRef]
  51. Adam, A.; Chatzilari, E.; Nikolopoulos, S.; Kompatsiaris, I. H-Ransac: A Hybrid Point Cloud Segmentation Combining 2d and 3d Data. ISPRS Ann. Photogramm. Remote Sens. Spat. Inf. Sci. 2018, IV-2, 1–8. [Google Scholar] [CrossRef]
  52. Bassier, M.; Van Genechten, B.; Vergauwen, M. Classification of sensor independent point cloud data of building objects using random forests. J. Build. Eng. 2019, 21, 468–477. [Google Scholar] [CrossRef]
  53. Abeywickrama, T.; Cheema, M.A.; Taniar, D. k-nearest neighbors on road networks: A journey in experimentation and in-memory implementation. Proc. VLDB Endow. 2016, 9, 492–503. [Google Scholar] [CrossRef]
  54. Tatarchenko, M.; Dosovitskiy, A.; Brox, T. Octree Generating Networks: Efficient Convolutional Architectures for High-resolution 3D Outputs. In Proceedings of the 2017 IEEE International Conference on Computer Vision (ICCV), Venice, Italy, 22–29 October 2017; pp. 2107–2115. [Google Scholar] [CrossRef]
  55. Lu, B.; Wang, Q.; Li, A.N. Massive Point Cloud Space Management Method Based on Octree-Like Encoding. Arab. J. Sci. Eng. 2019, 44, 9397–9411. [Google Scholar] [CrossRef]
  56. Wang, P.-S.; Liu, Y.; Guo, Y.-X.; Sun, C.-Y.; Tong, X. O-CNN: Octree-based convolutional neural networks for 3d shape analysis. ACM Trans. Graph. 2017, 36, 1–11. [Google Scholar] [CrossRef]
  57. Armeni, I.; Sener, O.; Zamir, A.R.; Jiang, H.; Brilakis, I.; Fischer, M.; Savarese, S. 3D Semantic Parsing of Large-Scale Indoor Spaces. In Proceedings of the 2016 IEEE Conference on Computer Vision and Pattern Recognition (CVPR), Las Vegas, NV, USA, 27–30 June 2016; pp. 1534–1543. [Google Scholar] [CrossRef]
  58. Divin, N.V. BIM by using Revit API and Dynamo. A review. AlfaBuild 2020, 14, 1404. [Google Scholar] [CrossRef]
Figure 1. Research flowchart.
Applsci 13 13239 g001
Figure 2. The structure of the point transformer layer.
Applsci 13 13239 g002
Figure 3. Residual of point transformer block.
Applsci 13 13239 g003
Figure 4. The network structure of the point transformer.
Applsci 13 13239 g004
Figure 5. Network encoding structure of the point transformer.
Applsci 13 13239 g005
Figure 6. Feature-enhanced local spatial encoding network structure.
Applsci 13 13239 g006
Figure 7. Transition down layer.
Applsci 13 13239 g007
Figure 8. Ball tree-based downsampling module.
Applsci 13 13239 g008
Figure 9. The partition process of the ball tree algorithm.
Applsci 13 13239 g009
Figure 10. Octree partitioning process.
Applsci 13 13239 g010
Figure 11. Semantic segmentation visualization: (a) real data; (b) transformer; (c) feature-enhanced transformer; (d) label.
Applsci 13 13239 g011
Figure 12. Schematic diagram of the scanning stations.
Applsci 13 13239 g012
Figure 13. Complete point clouds for the conference room: (a) raw data; (b) internal structural data.
Applsci 13 13239 g013
Figure 14. Comparison of experimental results and ground truth values: (a) algorithmic segmentation; (b) manual segmentation.
Applsci 13 13239 g014
Figure 15. The results of the automatic semantic segmentation of tables and chairs.
Applsci 13 13239 g015
Figure 16. Indoor chair segmentation results.
Applsci 13 13239 g016
Figure 17. Point cloud of conference table.
Applsci 13 13239 g017
Figure 18. Dynamo visual programming workflow.
Applsci 13 13239 g018
Figure 19. BIM reconstruction results: (a) BIM top view; (b) BIM 3D schematic diagram.
Applsci 13 13239 g019
Figure 20. Selection of key points.
Applsci 13 13239 g020
Figure 21. The precise registration results using ICP.
Applsci 13 13239 g021
Table 1. Overall intersection over union (mIoU) and segmentation accuracy (OA) values.
Feature Extraction ModelmIoU (%)OA (%)
Point Net42.7079.1
Point Net++49.3981.1
Point Transformer (k = 16)70.390.8
Point Transformer (k = 64)70.891.2
Feature-Enhanced Point Transformer (r = 0.1)70.691.1
Feature-Enhanced Point Transformer (r = 0.2)71.391.9
Table 2. Specific class intersection over union (IoU).
ClassPoint Transformer (k = 64) (%)Feature-Enhanced Point Transformer (%)
mIoU70.871.3
Ceiling9595.3
Floor98.598.6
Wall88.389.1
Beam00.1
Column3837.8
Window64.463.5
Door74.374.1
Table89.189.3
Chair84.485.6
Sofa74.376.1
Bookcase80.281.3
Board7677.1
Clutter58.358.9
Table 3. Part of the spatial location information of indoor objects.
Label x / m y / m z / m N x N y N z
Desk3.0423.2910.5600.802−0.4790.999
Chair #12.4675.1180.619−0.032−0.0130.999
Chair #20.2270.2130.048−0.0380.0150.999
Chair #33.3821.7410.4490.0570.0100.998
Chair #42.8021.8340.4670.0380.0180.999
Chair #51.5471.9670.4510.0640.0070.998
Chair #61.0164.7060.4540.0360.0030.999
Chair #71.2064.7640.5370.0360.0030.999
Chair #81.2757.3290.5050.0420.0030.999
Chair #92.4854.6110.5080.0500.0310.998
Table 4. Deviation accuracy between key points.
NO.BIM DistancesDesign DistancesErrors
Point #0–Point #1779.516 mm780 mm−0.484 mm
Point #1–Point #2801.626 mm800 mm−1.570 mm
Point #2–Point #380.962 mm80 mm−0.962 mm
Point #3–Point #4517.951 mm520 mm2.049 mm
Point #4–Point #580.144 mm80 mm−0.144 mm
Point #5–Point #680.114 mm80 mm−0.114 mm
Point #6–Point #7613.223 mm620 mm6.777 mm
Point #7–Point #880.144 mm80 mm−0.144 mm
Point #8–Point #980.114 mm80 mm−0.114 mm
Point #9–Point #10517.951 mm520 mm2.049 mm
Point #10–Point #1180.962 mm80 mm−0.962 mm
Point #11–Point #12260.061 mm260 mm−0.061 mm
Average error±1.276 mm
Disclaimer/Publisher’s Note: The statements, opinions and data contained in all publications are solely those of the individual author(s) and contributor(s) and not of MDPI and/or the editor(s). MDPI and/or the editor(s) disclaim responsibility for any injury to people or property resulting from any ideas, methods, instructions or products referred to in the content.

