1. Introduction
Since the national “new infrastructure” and other development strategies were put forward, in which the “energy Internet” has become an important form of construction, the “West–East Gas Transmission”, “West-to-East Electricity Transmission”, and other national cross-regional energy transmission projects have been implemented, effectively alleviating China’s energy load center distribution imbalance and other issues to a great extent, to meet the social development needs of electricity, oil and natural gas, and other energy forms [
1]. However, the new infrastructure also faces many problems, for example, to save land area, electricity, oil and gas, and other energy supply facilities often use the “shared corridor” construction method, leading to the inevitable formation of natural gas pipelines, electric power overhead line crossovers, and so on, which cause “two lines and one land” electromagnetic interference problems that are gradually becoming larger concerns [
2,
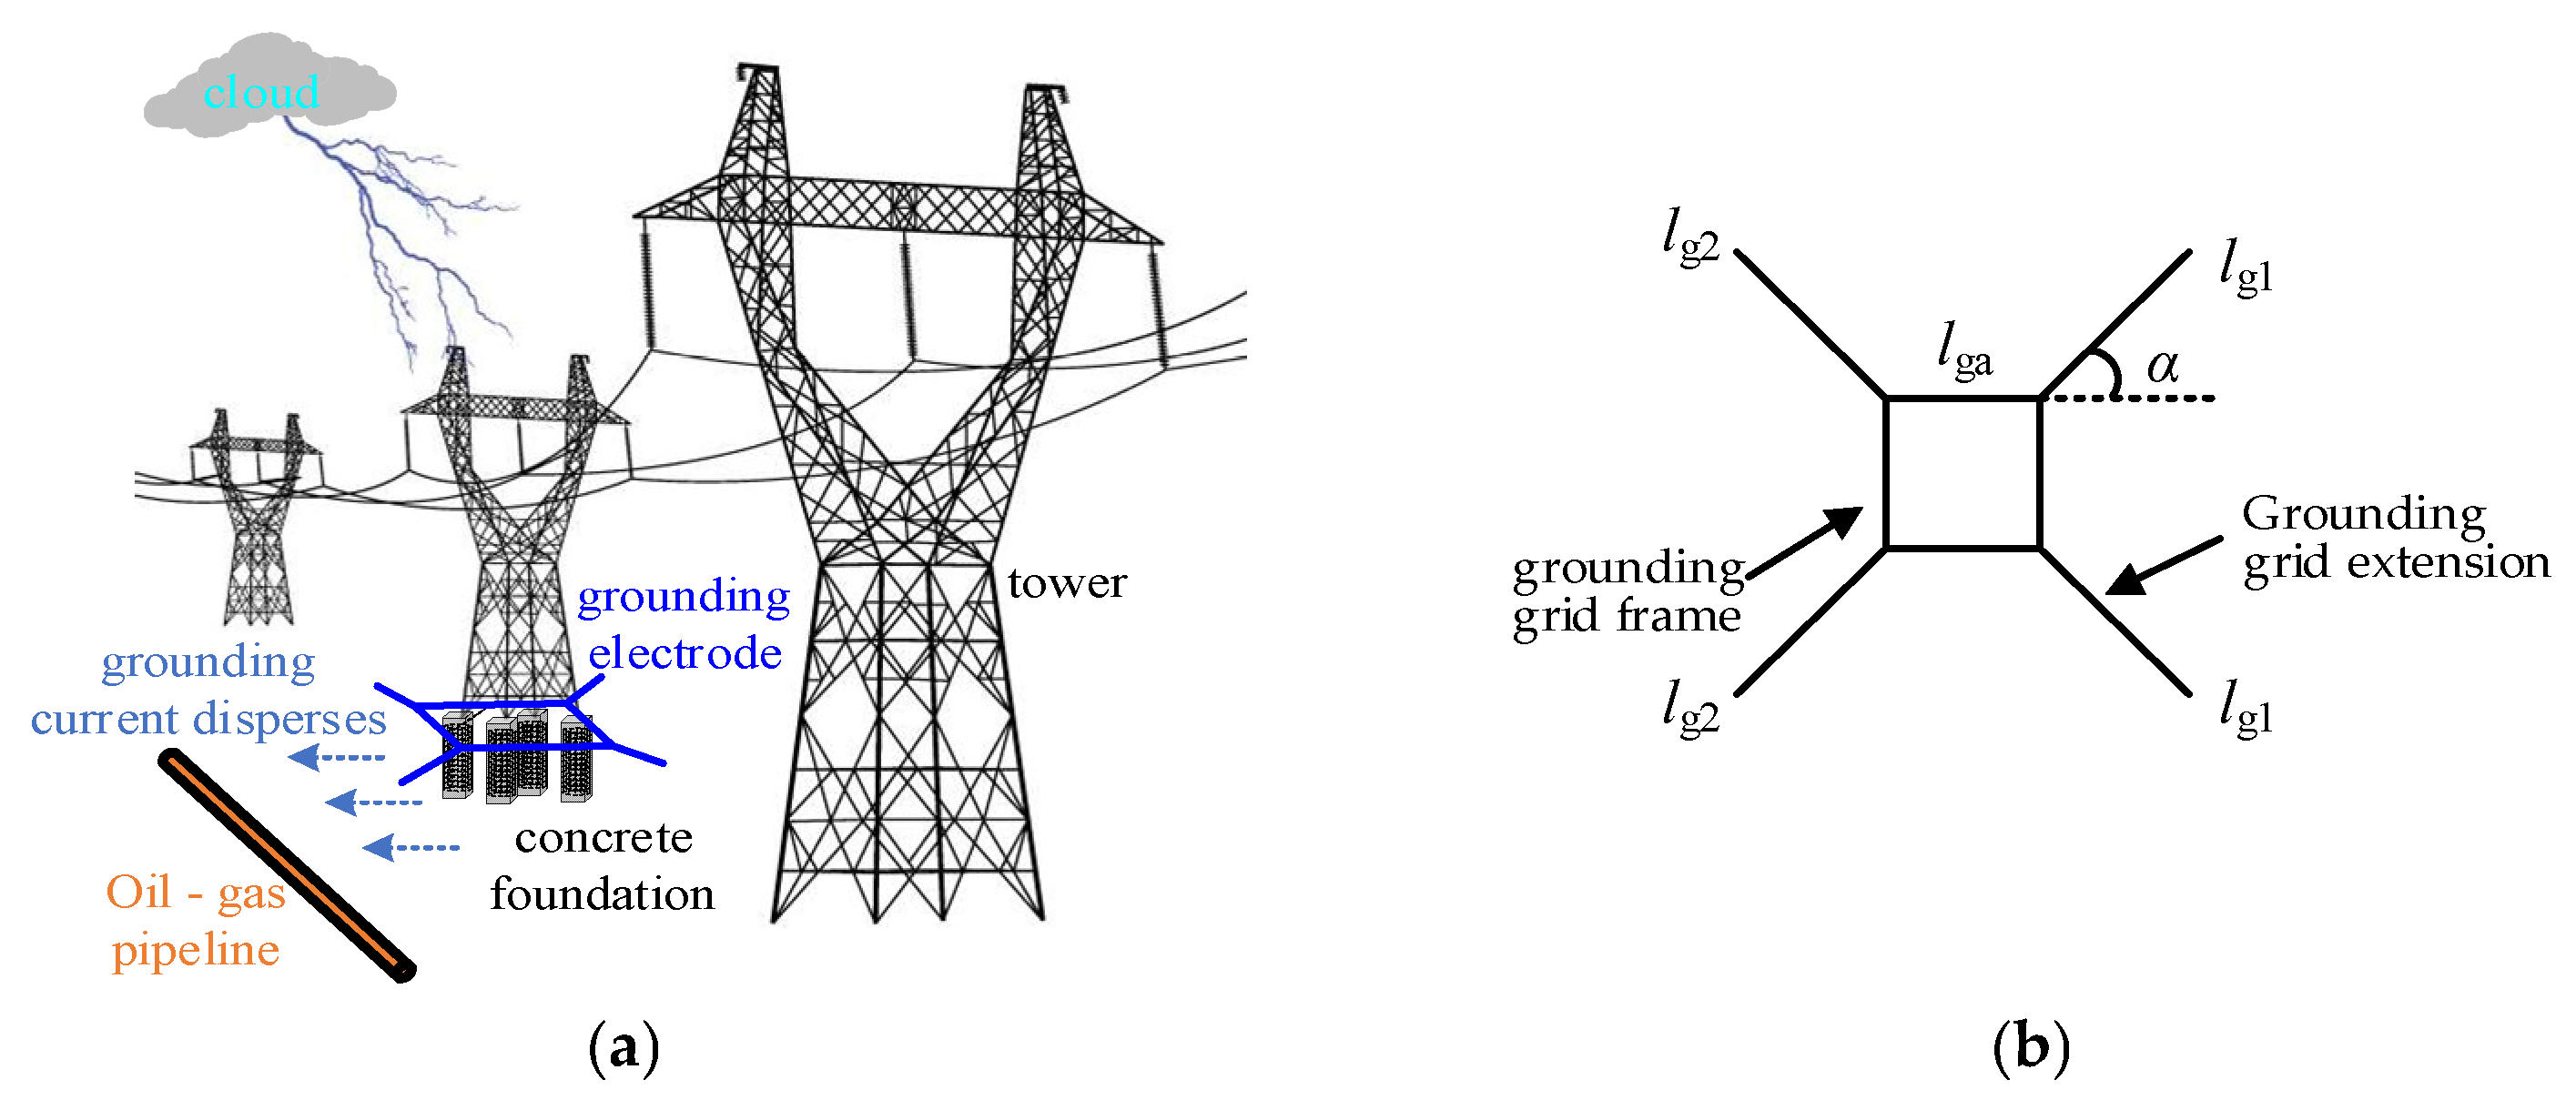
3]. When the overhead power conductor suffers a lightning strike, the lightning current in the intruding conductor will generate a space-alternating electromagnetic field around the conductor such that the adjacent pipeline, due to inductive coupling, produces a pipeline overvoltage [
4,
5]. If the lightning current makes the line insulator flashover, the lightning current will be scattered along the surface of the flashover insulator through the tower grounding grid such that the adjacent pipeline, due to resistive coupling, produces a pipeline overvoltage [
6,
7,
8]. Furthermore, due to the existence of resistive coupling and the pipeline insulation layer’s potential difference, the safe operation of the pipeline has been threatened; thus, research into the overvoltage protection of the transmission line adjacent to the pipeline is of great significance.
Protection for the transmission line near the natural gas pipeline mainly includes two aspects: the first concerns protection for the DC transmission line, research into the DC leakage current near the natural gas pipeline, and metal layer corrosion research to determine some measures to slow down or inhibit the metal layer corrosion; the second concerns the normal operation of the overhead line, research into grounding faults, and how a lightning strike near the natural gas pipeline induces overvoltage through studying some measures to reduce the magnitude of the pipeline overvoltage.
Lucca Giovanni studied the effect of pipe insulation coating breakage on electromagnetic interference between transmission lines and pipelines and proposed a law stating that the resistance of pipe insulation to soil decreases over time [
9]. Mo Bingyu et al. used Maxwell’s system of equations to derive the pipeline-induced electromotive force originating from the AC transmission line; established the pipeline equivalent circuit; analyzed the electromagnetic coupling to the neighboring underground pipelines during the steady-state operation of the AC transmission line; and, combined with a practical case, proposed a measurement method that can be corrected to the pipeline–ground potential distribution at the same moment [
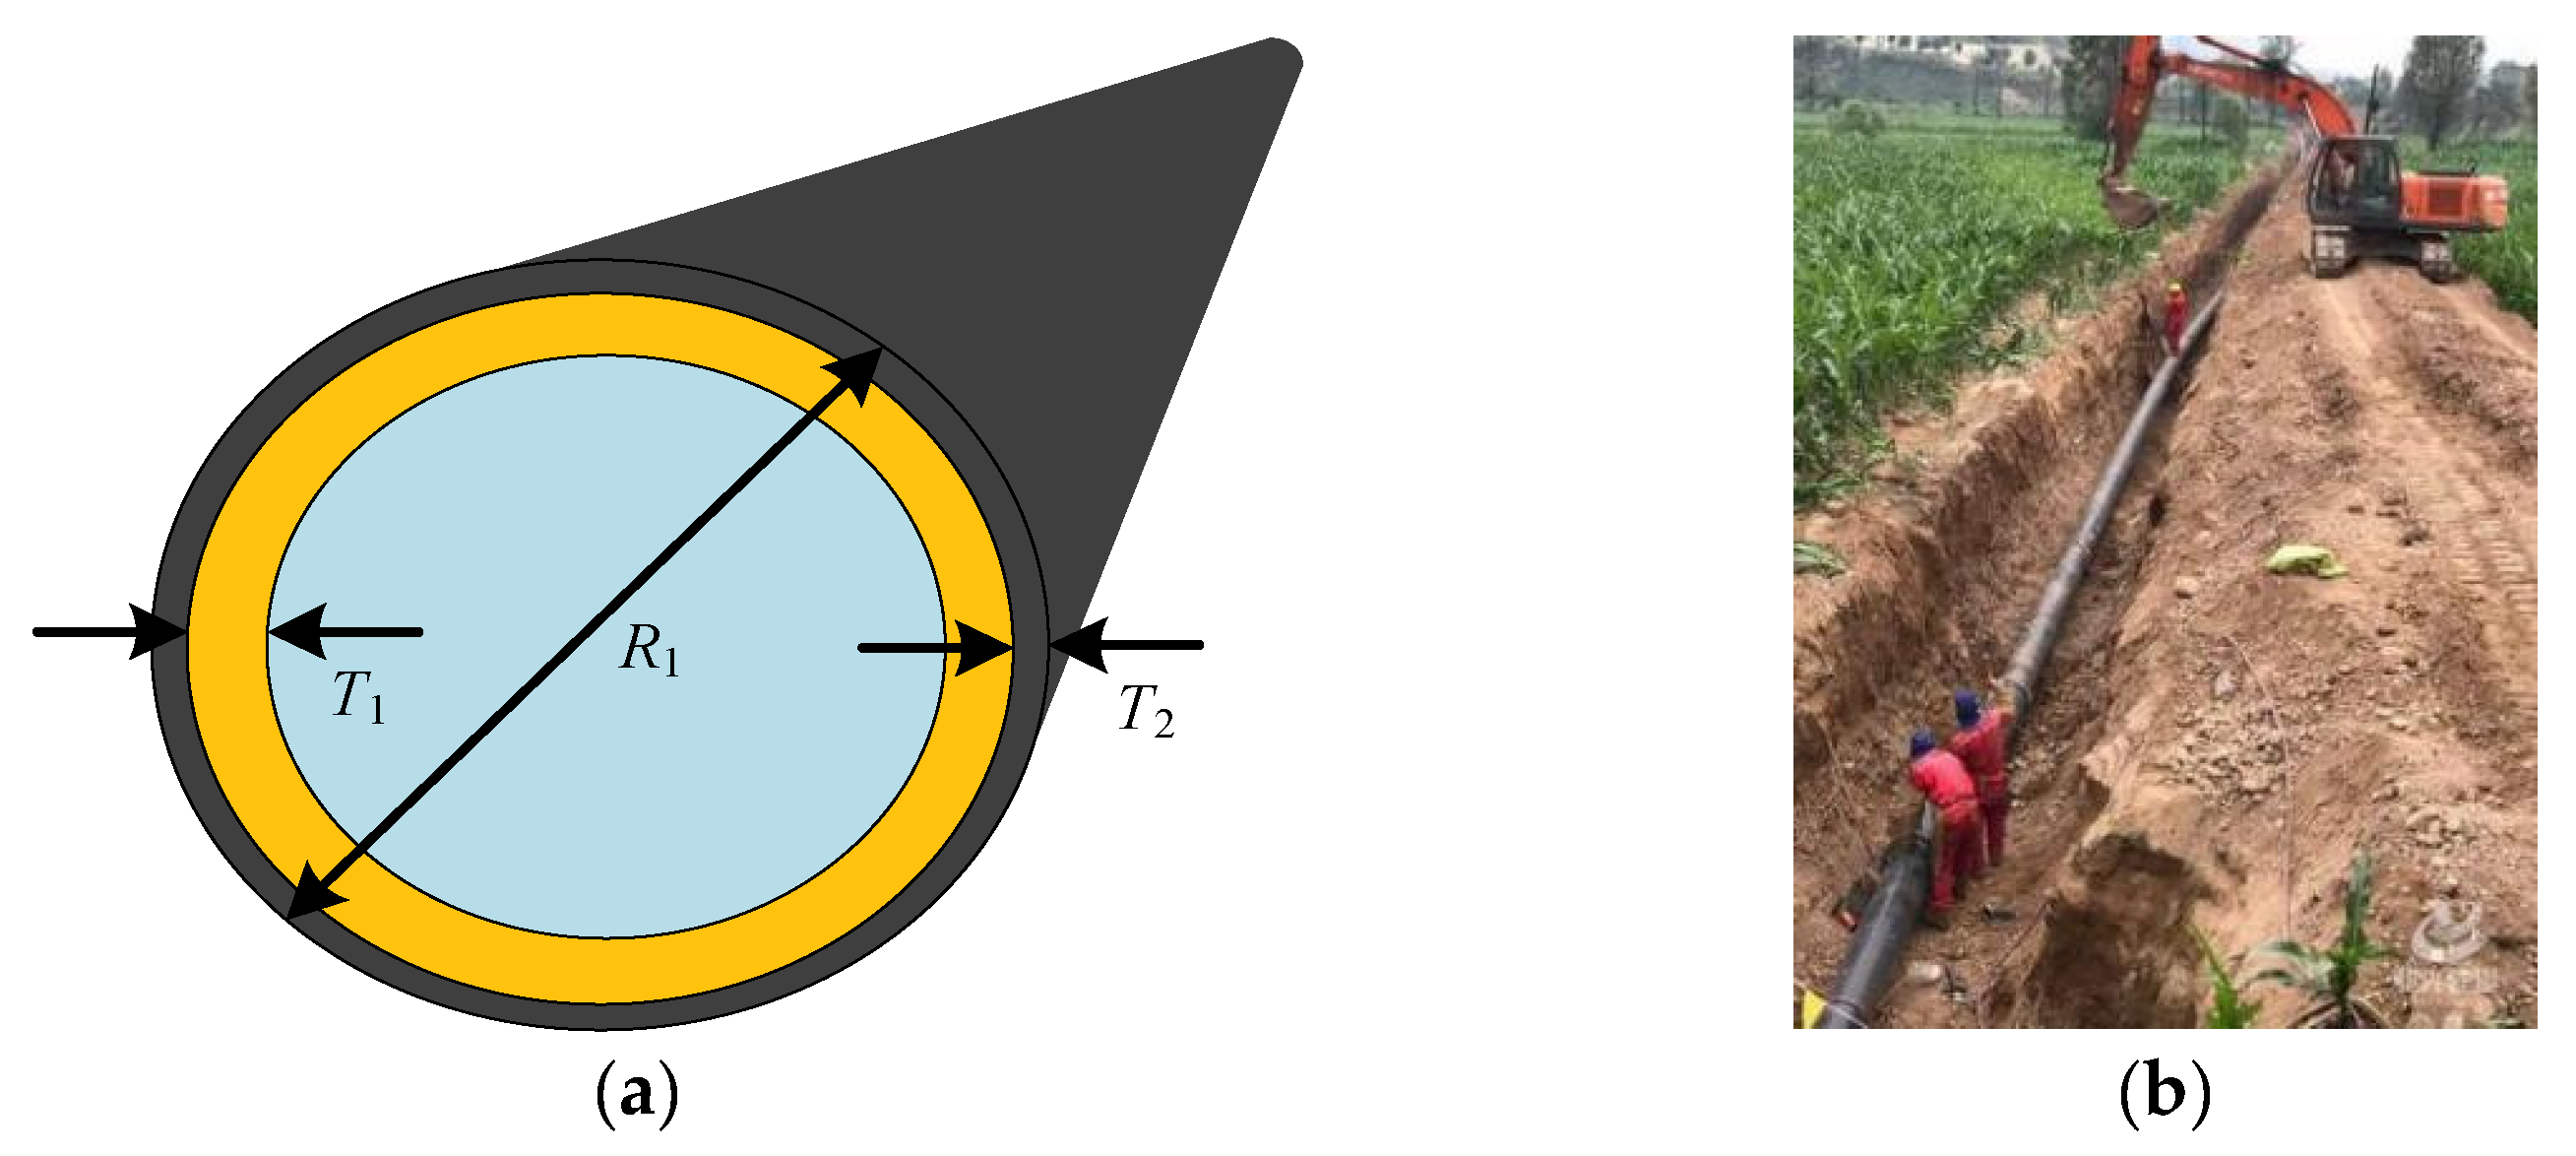
10]. Based on the influence of the pipeline coating resistance on the pipeline characteristic impedance, M. Rabbani concluded that the smaller the impedance, the smaller the induced voltage on the pipeline; conversely, the greater the impedance of the coating, the greater the voltage difference between the pipeline and the coating [
11]. G.T. Quickel, by characterizing accidentally perforated pipes, concluded that the cause of the pipe perforation is a high-voltage arcing discharge from the pipe wall to the ground, which is mainly due to lightning strikes or the occurrence of ground faults in the overhead lines, and proposed three methods for protecting the insulation joint of the pipeline [
12].
A significant amount of research has been conducted both domestically and internationally on protecting natural gas pipelines from electromagnetic interference caused by overhead lines. This research primarily focuses on two aspects: steady-state interference protection and lightning overvoltage protection. Currently, solid-state decouplers are commonly used for steady-state interference protection, while limited research has been performed on lightning overvoltage protection for pipelines. This paper aims to investigate the impact of grounded, scattered lightning currents on nearby natural gas pipelines and assess the effectiveness of solid-state decouplers in reducing the voltage endured by the pipeline’s insulating layer. The simulation results are then used to determine the optimal length for laying bare copper wire, as presented in the provided equation.
4. Analysis of Pipeline Overvoltage under the Action of Multi-Tower Flow
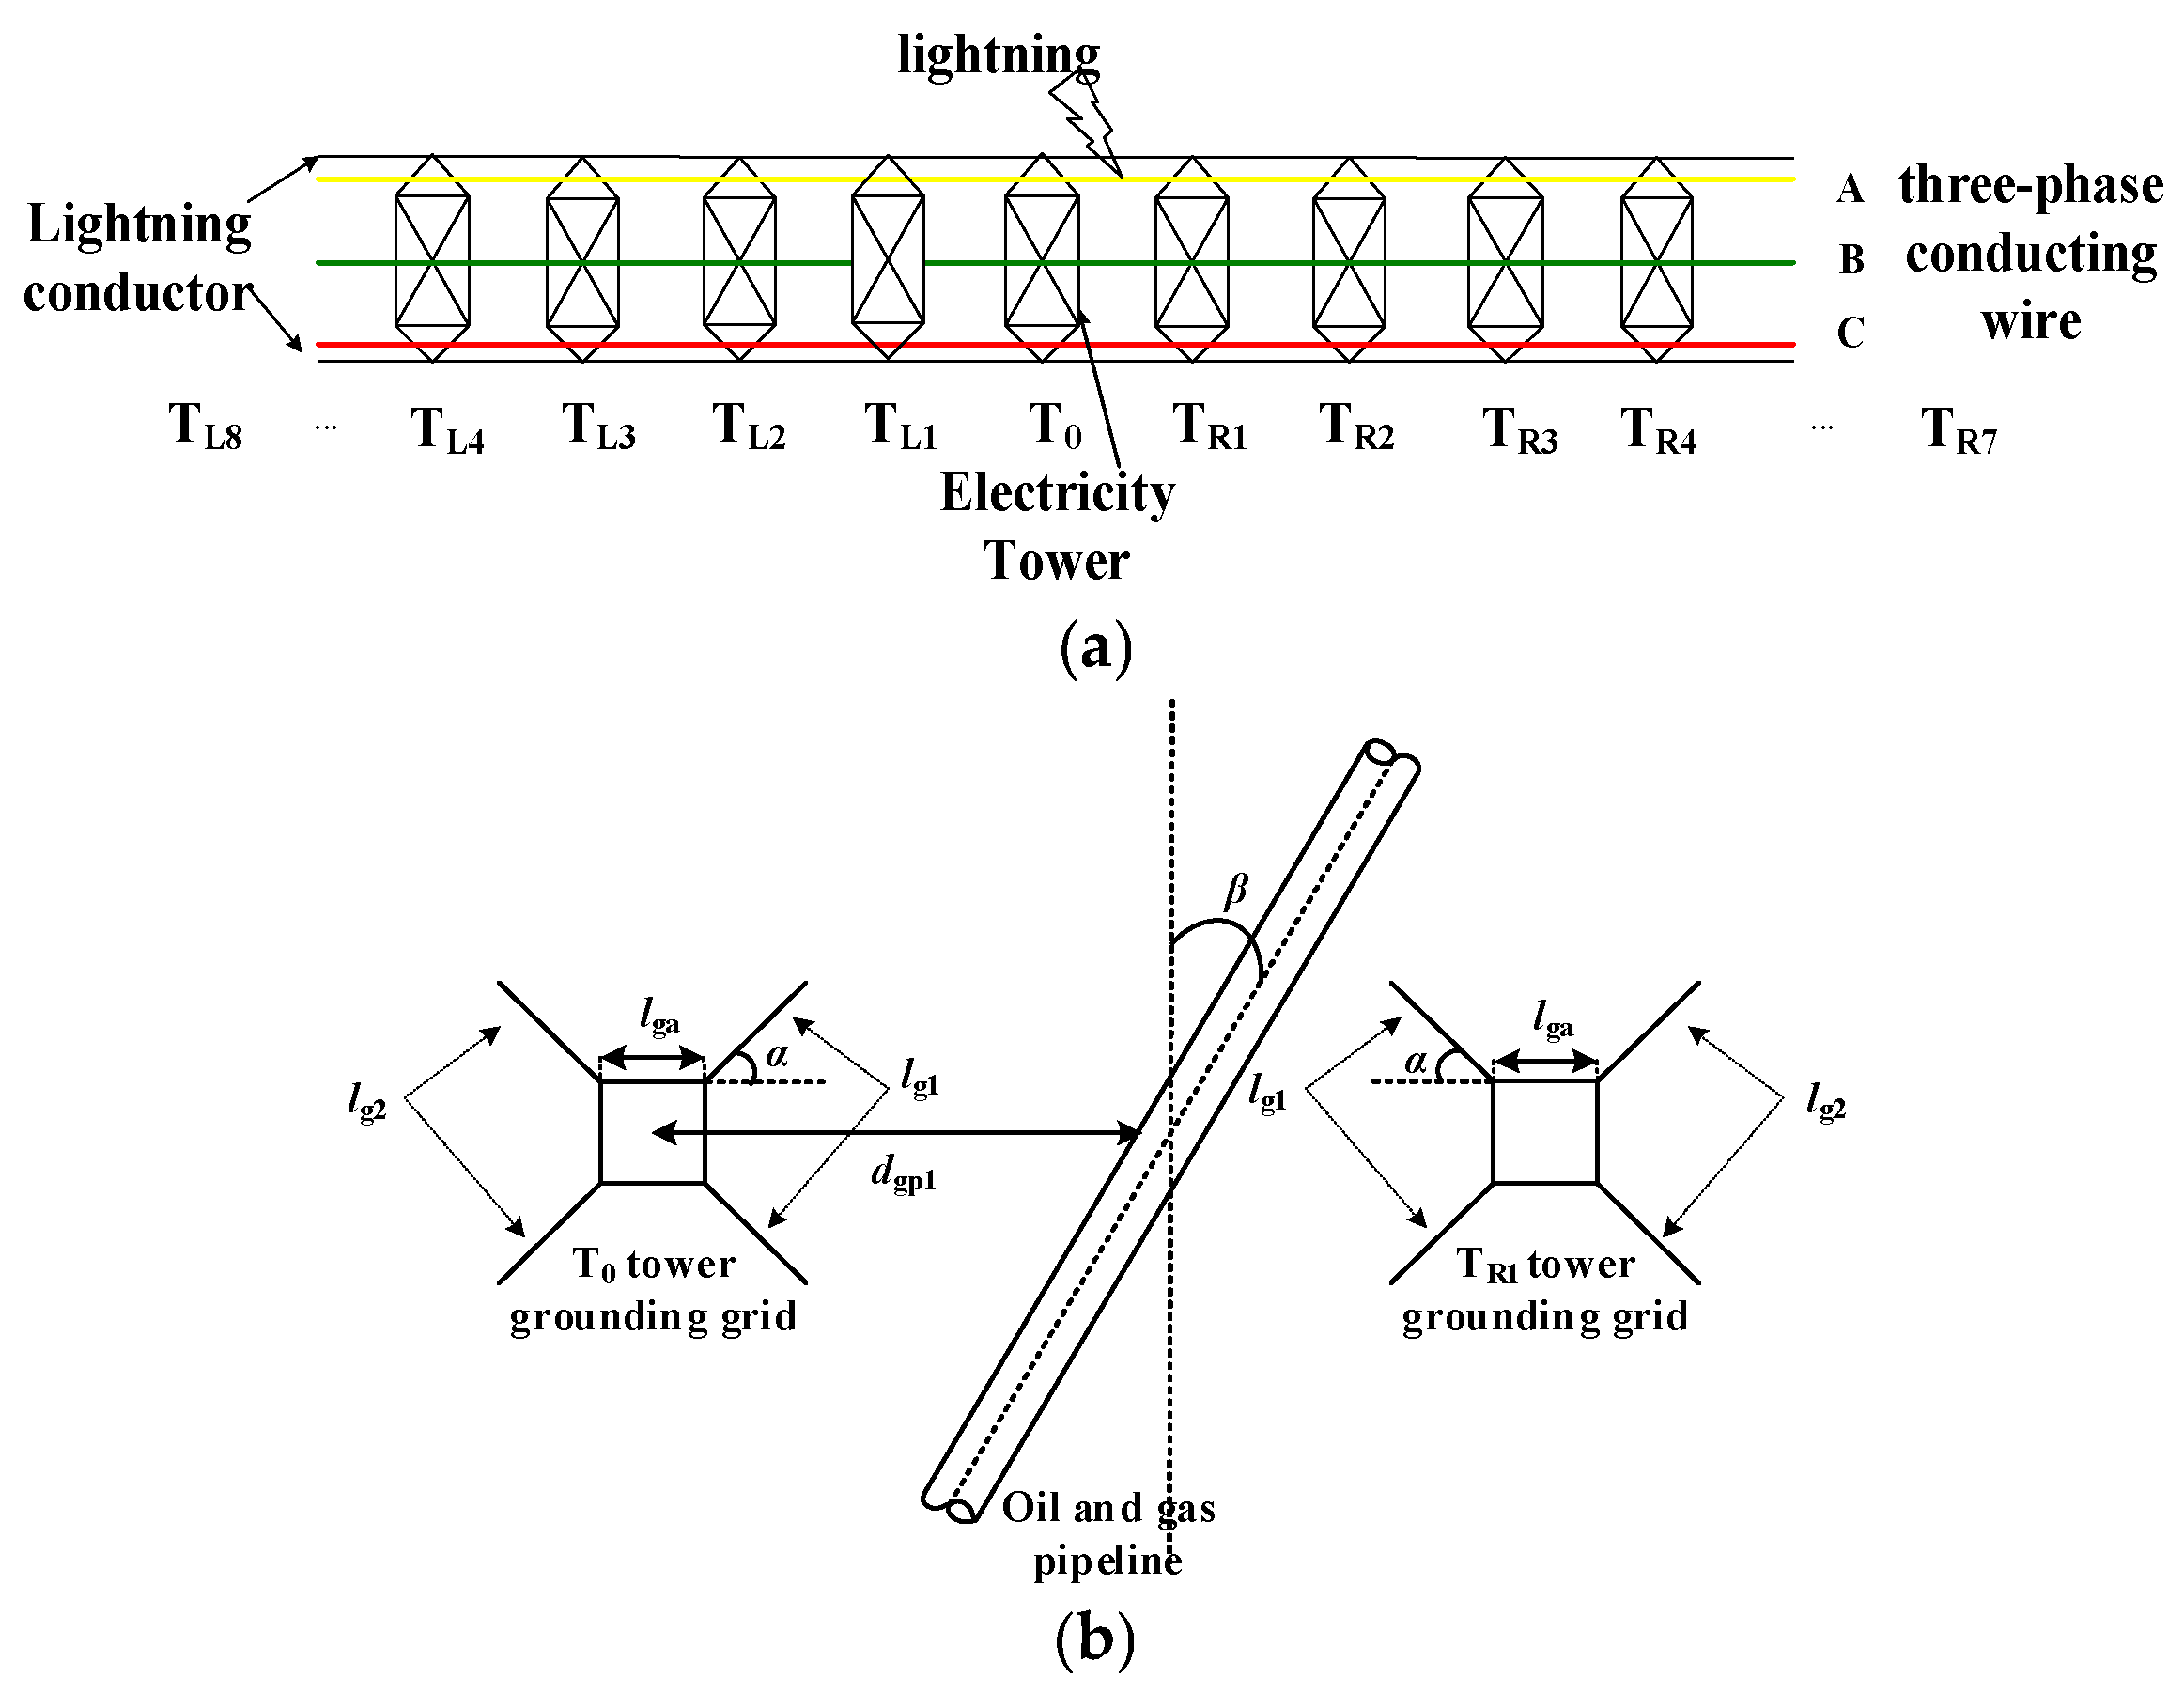
When the power overhead conductor is struck by lightning, the lightning current can cause the line insulator to flashover. In this situation, the lightning current disperses along the surface of the flashover insulator through the tower grounding grid. Due to the presence of resistive coupling, the potential of the soil area near the grounding grid and the steel layer of the adjacent pipeline will increase. As a result, there will be a potential difference between the soil area near the pipeline and the steel layer of the pipeline, leading to a potential difference in the insulating layer. In this paper, based on the ATP-EMTP simulation results, the mine current of T0 and TR1 tower grounding grid is introduced into the COMSOL model.
When the lightning impulse current disperses through the tower grounding grid, it will cause a nearby rise in ground potential. The equation for calculating the potential
Vt is shown in Equation (1):
where
k is the impact coefficient,
it is the current into the mine through the tower, and
R is the tower grounding resistance.
Without considering the tower foundation, the grounding resistance
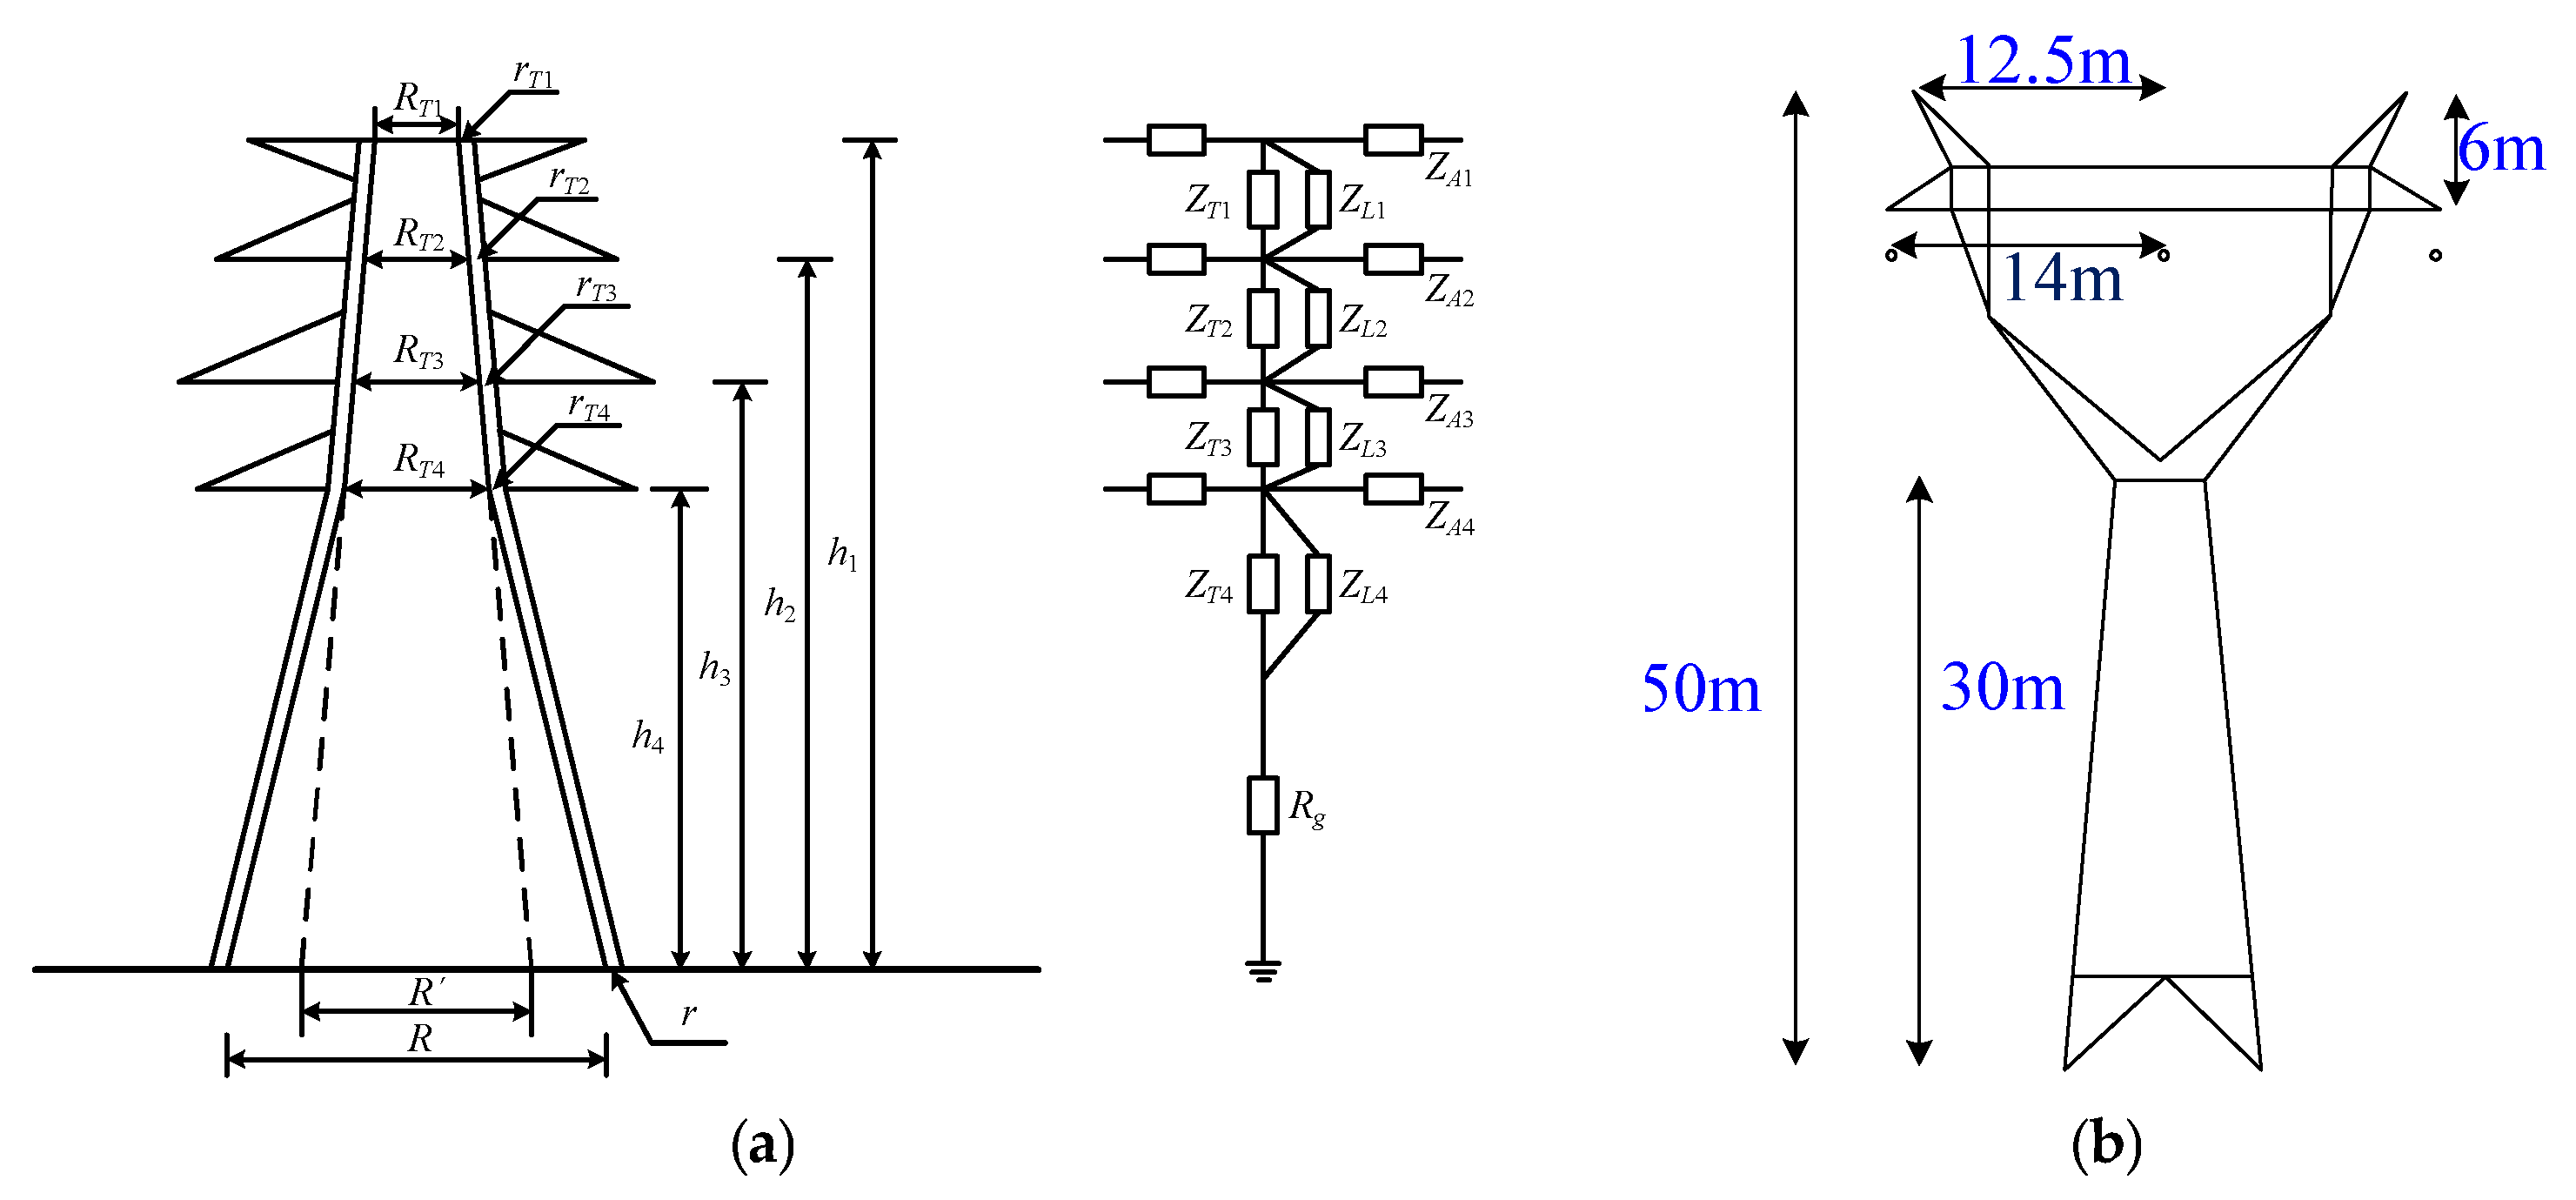
R of the power tower can be calculated according to term Equation (2) when the grounding device is a box extension shape.
In term Equation (2), L = 4(lga + lg1), where lga and lg1 are the length of the frame and the epitaxial ray, respectively; h is the buried depth of grounding device; d is the diameter of the grounding body; and At = 1.76.
The ground potential Vt near the grounding grid will increase due to the dispersion of lightning current. However, as the distance from the grounding grid increases, the ground potential will gradually decrease. The equation for calculating the ground potential rise caused by resistive coupling at a point outside the insulating layer of a gas pipeline is represented by Equation (3).
In Equation (3),
x is the distance from the point to the tower grounding device and
re is the radius of the equivalent hemispherical grounding body of the tower. Its
re calculation term equation is shown in term Equation (4).
The theoretical term equation suggests that the lightning overvoltage of gas pipelines is influenced by factors such as the spacing between pipelines, the amplitude of lightning current, and soil parameters. Therefore, a simulation analysis will be conducted to examine these influencing factors.
4.1. The Influence of Lightning Peak Current
In order to investigate the impact of lightning peak current on lightning overvoltage of natural gas pipelines at the cross-crossing under the influence of lightning stroke conductor, certain parameters were fixed: soil resistivity (ρ) of 1000 Ω·m, spacing between pipelines (
dgp1) of 40 m, and cross angle (
β) of 0°. Lightning peak currents of 25 kA, 30 kA, 35 kA, 40 kA, 45 kA, and 50 kA were sequentially selected. The lightning current waveforms of T
0 and T
R1 tower grounding grids under different lightning peak currents were imported into COMSOL Multiphysics.
Figure 5 illustrates these waveforms. The lightning overvoltage amplitude of natural gas pipelines at the cross-crossing of overhead lines is depicted in
Figure 7.
Figure 8 presents the potential height distribution of the tower grounding grid and crossing natural gas pipeline under different lightning peak currents.
Based on the results shown in
Figure 7a, it can be observed that as the lightning peak current increases, both the induced voltage amplitude of the metal layer and the induced voltage amplitude of the insulation layer of the natural gas pipeline also increase. Specifically, when the lightning peak current is raised from 25 kA to 50 kA, the induced voltage amplitude of the metal layer rises from 22.61 kV to 42.25 kV, while the induced voltage amplitude of the insulation layer increases from 25.55 kV to 47.56 kV. Similarly,
Figure 7b illustrates a similar trend in the voltage amplitude of the pipeline insulation layer with respect to the lightning peak current. In this case, as the lightning peak current increases from 25 kA to 50 kA, the voltage amplitude of the pipeline insulation layer increases from 3.46 kV to 7.23 kV, representing a significant increase of 108.96%.
The reason for studying the variation law mentioned above is that as the amplitude of the lightning current increases, the current flowing into the earth through the tower also increases. This, in turn, leads to an increase in the potential of the tower grounding grid and the surrounding soil, under the same soil resistivity. Consequently, the resistive coupling effect of the gas pipeline is aggravated. Equation (1) demonstrates that this rise in potential will cause the nearby ground potential to increase, resulting in a larger potential difference between the outer insulation layer and the metal layer of the pipeline. Thus, it is evident that the amplitude of the lightning current directly influences the voltage amplitude of the pipeline insulation layer.
Based on the results shown in
Figure 8, it is evident that the potential height of the T
0, T
R1 tower grounding grid and the surrounding soil increases significantly with the increase in lightning peak current. This can be attributed to the increased flow of scattered lightning through the tower grounding grid. When the soil resistivity remains constant, the potential of both the tower grounding grid and the surrounding soil increases, thereby exacerbating the resistive coupling effect on the natural gas pipeline. At the same time, it can be obviously seen that the potential height at the center of the natural gas pipeline is significantly higher than the potential height at both ends of the natural gas pipeline.
4.2. The Influence of Soil Resistivity
In order to investigate the impact of soil resistivity on the overvoltage of natural gas pipelines at the cross-crossing during lightning strikes, several parameters were set as follows: the lightning peak current (I
0) was fixed at 50 kA, the distance between the “tube-line” (
dgp1) was set to 40 m, and the cross angle of the “tube-line” (β) was 0°. The soil resistivity (ρ) was varied, with values of 200 Ω·m, 500 Ω·m, 800 Ω·m, 1000 Ω·m, 1200 Ω·m, and 1500 Ω·m being selected sequentially. The current waveform of the lightning current passing through the T
0 and T
R1 tower grounding grid under different soil resistivity conditions is shown in
Figure 6. The resulting lightning overvoltage amplitude of the natural gas pipeline at the cross-crossing is presented in
Figure 9. Additionally,
Figure 10 illustrates the potential distribution of the tower grounding grid and the natural gas pipeline at the cross-crossing for different soil resistivity values.
According to
Figure 9a, it can be observed that the induced voltage of the metal layer and insulation layer of the natural gas pipeline increases as the soil resistivity increases. When the soil resistivity increases from 200 Ω·m to 1500 Ω·m, the induced electric potential amplitude of the natural gas pipeline and the induced voltage amplitude of the insulation layer increase from 9.68 kV and 13.07 kV to 59.63 kV and 64.80 kV, respectively. This represents an increase of 516.01% and 395.79% for the induced electric potential amplitude and induced voltage amplitude, respectively. The results in
Figure 9b demonstrate that as soil resistivity increases, the pressure resistance of the pipeline insulation layer gradually increases. However, after reaching a certain point, the increase in pressure resistance becomes less pronounced. For instance, when the soil resistivity increases from 200 Ω·m to 1000 Ω·m, the withstand voltage of the insulating layer increases from 4.25 kV to 7.23 kV, representing a 70.12% increase. On the other hand, when the soil resistivity increases from 1000 Ω·m to 1500 Ω·m, the withstand voltage of the insulating layer only increases from 7.23 kV to 7.35 kV, resulting in a mere 1.66% increase.
The reason for studying the variation law mentioned above is that an increase in soil resistivity can impede the spreading of the tower grounding grid to the surrounding soil. As a result, the mine current is more likely to spread towards the far end of the extension ray, leading to an increase in the effective spreading area of the tower grounding grid and the soil potential near the grounding grid. This, in turn, exacerbates the impact of the tower grounding grid on the gas pipeline. When the soil resistivity prevents the tower grounding grid from dispersing into the surrounding soil, the induced voltage and withstand voltage of the metal layer and insulating layer of the gas pipeline increase. Conversely, when the mine current decreases, the induced voltage and withstand voltage of the metal layer and insulating layer of the gas pipeline decrease. Therefore, the interaction of these two factors causes the induced voltage and withstand voltage of the metal layer and insulating layer of the gas pipeline to exhibit an upward trend.
Figure 10 illustrates that an increase in soil resistivity obstructs the spread of the tower grounding grid box into the surrounding soil. Consequently, the mine current tends to spread towards the far end of the extension ray such that the effective spreading area of the tower grounding grid and the soil potential near the grounding grid will increase, which will lead to the aggravation of the influence of the tower grounding grid on the natural gas pipeline.
4.3. The Influence of “Tube-Line” Spacing
The study investigates the impact of different “tube” spacings (
dgp1) on the overvoltage of a natural gas pipeline when subjected to lightning strikes. The fixed soil resistivity (ρ) is 1000 Ω·m and the lightning peak current (I
0) is 50 kA. The “tube” cross angle (β) is 0°. The “tube” spacing options considered are 40 m, 50 m, 60 m, 70 m, 80 m, and 90 m.
Figure 11 illustrates the amplitude of lightning-induced overvoltage on the natural gas pipeline at the intersection.
Figure 12 shows the distribution of potential height for the tower grounding grid and the intersecting natural gas pipeline under different “pipeline” spacings.
Based on the findings of
Figure 11a, it was observed that as the spacing between pipelines increases, the induced electric potential of both the metal layer and the insulation layer of the natural gas pipeline decreases. Specifically, when the pipeline spacing increases from 40 m to 90 m, the induced voltage of the metal layer decreases from 42.25 kV to 30.96 kV and the induced voltage of the insulating layer decreases from 47.56 kV to 32.37 kV; these reductions correspond to a decrease of 26.72% and 31.94%, respectively.
Figure 11b illustrates that the withstand electric potential of the pipeline insulation layer gradually decreases with the increase in pipeline spacing. However, as the spacing continues to increase, the voltage drop trend of the insulation layer becomes more gradual. For instance, when the spacing increases from 40 m to 70 m, the withstand voltage of the insulating layer decreases from 7.23 kV to 2.53 kV, a decrease of 65.01%. When the spacing further increases from 70 m to 90 m, the withstand voltage of the insulating layer decreases from 2.53 kV to 1.91 kV, representing a decrease of only 24.51%.
The reason for studying the variation law mentioned above is that the pipeline’s center is closer to the tower grounding grid and the effective dispersion area of the tower grounding grid. This proximity causes a more significant impact of the tower grounding grid dispersion on the center of the pipeline. When the spacing between the pipeline and the tower is small, the center of the pipeline is more affected by the dispersion of the tower grounding grid at both ends. As a result, the induced voltage curve along the insulation layer becomes more prominent. However, when the spacing between the pipeline and the tower increases within a certain range, the difference in the impact of the tower grounding grid dispersion on the center of the pipeline and the two ends reduces. Consequently, the overall curve of the induced voltage along the insulation layer becomes relatively flat.
Figure 12 demonstrates that altering the “tube-line” spacing dgp1 does not impact the potential height distribution of the grounding grid and the surrounding soil area. In order to ensure that the lightning current components of the scattered current through the T
0 and T
R1 tower grounding grids are approximately equal, the vertical distance between the natural gas pipeline and the T
0 and T
R1 tower grounding grids can be adjusted by changing the “tube-line” spacing
dgp1. This adjustment will affect the extent to which the scattered current from the T
0 and T
R1 grounding grids impacts the natural gas pipeline. Consequently, a minimum value of pipeline overvoltage can be achieved in this scenario.
5. Pipeline Overvoltage Protection Based on Solid-State Decoupler
The solid-state decoupler is a product designed to protect against AC/DC interference. It combines embedded current drainage, surge protection, and AC decoupling, and has a high capacity for breaking impact currents. Internally, it typically consists of capacitors, thyristors (or diodes), and surge protection devices connected in parallel.
Figure 13 illustrates the appearance and internal circuitry of the solid-state decoupler, while
Table 3 provides its technical parameters.
This section aims to decrease the electric potential of the pipeline insulation layer by utilizing the specific wiring method of the solid-state decoupler. It also seeks to validate the solid-state decoupler’s ability to reduce the voltage of the pipeline insulation layer through modeling and simulation.
Figure 14a illustrates the simulation diagram. In this setup, a bare copper wire is placed parallel to the natural gas pipeline, with a distance of 1m between them. The length of the bare copper wire is determined based on the current dispersion characteristics of the tower grounding grid. In order to save cost and avoid excessive design, the laying length of bare copper wire
pl1 is defined as shown in
Figure 14b. The calculation term equation of laying length of bare copper wire is shown in term Equation (1). In this section,
pl1 = 0 m indicates that there are no protective measures for natural gas pipelines.
In term Equation (5), pl1 is the length of bare copper wire laying, dgp1 is the “tube-line” spacing, and lga is the length of the epitaxial ray.
To evaluate the effectiveness of the method, a simulation model is created using COMSOL Multiphysics simulation software, as illustrated in
Figure 14a. The aim is to analyze the impact of varying laying lengths of bare copper wire (
pl1) on the resistive coupling overvoltage of natural gas pipelines at the cross-crossing. The simulation parameters used are as follows: lightning peak current (I
0) = 50 kA, soil resistivity (ρ) = 1000 Ω·m, spacing between the tube and the line (
dgp1) = 40 m, length of the epitaxial ray (
lg1 =
lg2 = 20 m), commutation angle (α) = 45°, and cross angle between the tube and the line (β) = 0°. The laying lengths of bare copper wire considered are
pl1 = 0 m, 30 m, 40 m, 50 m, 80 m, and 200 m.
Figure 15 depicts the overvoltage amplitude of natural gas pipelines under different lengths of bare copper wire, as determined through simulation calculations.
According to the results shown in
Figure 15, as the length of the bare copper wire increases, the induced voltage of the metal layer of the natural gas pipeline also increases gradually, while the voltage of the pipeline insulation layer decreases gradually. This phenomenon occurs because the solid-state decoupler causes an instantaneous short-circuit between the bare copper wire and the pipeline when subjected to lightning impulse current. The soil potential in the area where the bare copper wire is located is much higher than the induced voltage of the pipeline metal layer, leading to an increase in the induced voltage of the pipeline metal layer during the short-circuiting process. On the other hand, the induced electric potential of the pipeline insulation layer remains relatively stable and fluctuates within a certain range, which can be disregarded. The withstand electric potential of the insulation layer depends on the difference between the induced voltage of the pipeline insulation layer and the metal layer. Therefore, when the induced voltage of the insulation layer changes slightly and the induced electric potential of the metal layer continues to increase, the withstand voltage of the insulation layer gradually decreases.
When the bare copper wire length (pl1) is 0 m, the induced voltage amplitude of the metal layer of the natural gas pipeline is 42.25 kV and the voltage amplitude of the insulating layer is 7.23 kV. When the bare copper wire length is 80 m, the induced voltage amplitude of the metal layer of the natural gas pipeline is 43.43 kV and the voltage amplitude of the insulating layer is 5.45 kV. Similarly, when the bare copper wire length is 200 m, the induced voltage amplitude of the metal layer of the natural gas pipeline is 43.59 kV and the voltage amplitude of the insulating layer is 5.39 kV. It can be observed that increasing the length of the bare copper wire from 0 m to 80 m results in a decrease in the withstand voltage of the pipeline insulation layer from 7.23 kV to 5.45 kV, representing a decrease of 24.62%. However, when the length increases from 80 m to 200 m, the withstand voltage of the pipeline insulation layer decreases only slightly from 5.45 kV to 5.39 kV, representing a decrease of 1.10%.
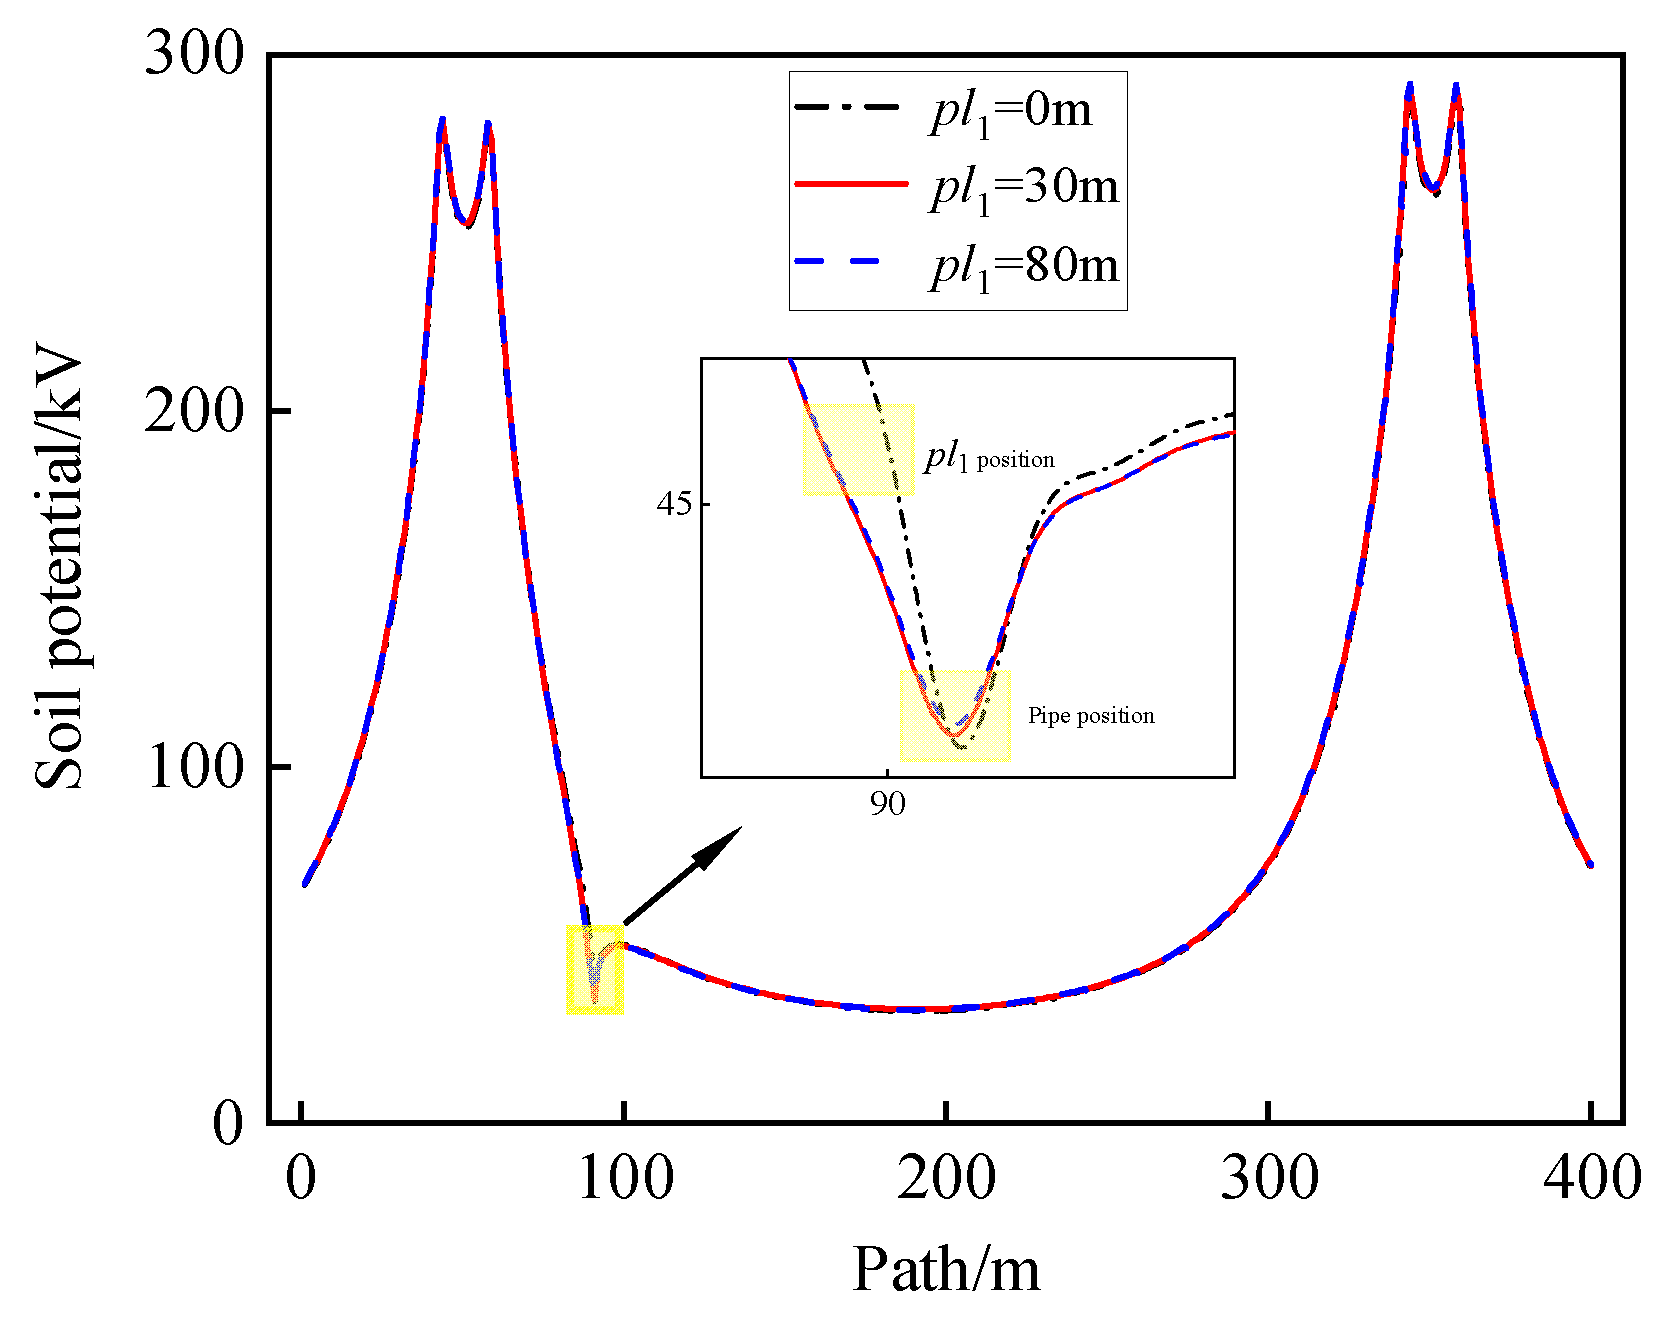
To better understand the impact of the external bare copper wire of the solid-state decoupling device on the overvoltage of the natural gas pipeline, in close proximity, we focused our research on the central section of the tower grounding grid. This section, which is perpendicular to the natural gas pipeline, was chosen as the research path.
Figure 16 illustrates this selection, with a research path length (
lr) of 400 m and depth (h
3) = 2 m. By conducting simulation calculations, we obtained the soil potential change curve for the path under different lengths of the bare copper wire (
pl1), as depicted in
Figure 17.
Figure 17 demonstrates that the implementation of solid-state decoupling primarily alters the soil potential surrounding the bare copper wire and the pipeline location. However, it has minimal impact on the soil potential of the tower grounding grid and other regions. As the length of the bare copper wire increases, the soil potential around it gradually decreases. Conversely, the soil potential at the pipeline position exhibits a gradual increase.
The subsequent increase of 120 m of bare copper wire has minimal impact on reducing the voltage of the pipeline insulation layer. Therefore, increasing the length of the bare copper wire does not improve the overvoltage protection effect of the pipeline. In practical engineering, it is more economical and convenient to determine the length of the bare copper wire according to
Figure 14b. The detailed calculation term equation is shown in term Equation (5).


