Article

Impulse Characteristics of Soil Treated with Enhancement Materials and Various Moisture Contents

Faculty of Engineering, Multimedia University, Persiaran Multimedia, Cyberjaya 63100, Malaysia
*
Author to whom correspondence should be addressed.
Appl. Sci. 2024, 14(2), 547; https://doi.org/10.3390/app14020547
Submission received: 17 November 2023 / Revised: 21 December 2023 / Accepted: 21 December 2023 / Published: 8 January 2024

Abstract

:
Due to the high mineral contents of additives and enhancement materials (EMs), EMs have become popular in treating soil, which expectedly improves the electrical characteristics of soil. Much of the published work on the effectiveness of EMs is based on investigations at low magnitudes of voltage, current and frequency; however, the study of these EMs under high-impulse conditions has not been widely addressed. In this work, the experimental results of a small-mesh ground electrode without EMs and treated with EMs, where the latter was poured with a controlled amount of water, are presented. The impulse impedance was expected to change appreciably due to the ionic conduction in soil and the use of EMs with a high water content; however, the impulse impedance was found to be weak and dependent on the water content, and the inductive effect was found to be significant at the voltage and current decay times. This indicates that, even though EMs and highly wetted soil can reduce the soil resistivity and relative resistance value, special attention has to be given to the impulse characteristics of the ground electrodes, particularly at tail/decay times.

1. Introduction

A grounding system is important for providing electrical safety to personnel and equipment at or near electrical installations. The design of a grounding system starts with an assessment of the soil resistivity at the sites of interest. As is generally known, several methods are considered in the design process to reduce this ground resistance value, which include considering the soil resistivity and ground electrodes. At sites of high soil resistivity, a low ground resistance value can be achieved by extending the ground electrodes, but this approach is sometimes uneconomical due to the high costs, limited ground area, little variation in ground resistance values as the electrodes are increased [1,2] and the presence of an inductive effect, which can be significant under high-impulse currents [3,4]. An inductive effect is indicated by a delay in the current rise times; the longer the ground electrodes, the slower the current rise times. It was noted in [3] that, although a grid has a larger ground resistance value at a steady state compared to a horizontal electrode of 33 m, the inductive effect was found to be higher in the latter, which can contribute to a higher-impulse impedance and ground potential rise (GPR). Similarly, it was seen in [4] that the delay in the rising current is longer in the substation, which has a lower steady-state ground resistance value than the imitative ground electrode. Longer front rise times in large grid electrodes were also observed in [5]. However, in other publications [6,7,8], this inductive effect was not so observable or discussed. Further, despite using several ground electrodes, the trend in the current rise times is not significant and the current rise times may occur randomly, as these parameters are fast, of several microseconds and are due to the high conduction at the peak current. Other than the indication of inductive components from the delay in the current rise times, in several studies [7,8], an inductive effect was indicated from the voltage and current traces at the discharged times that swung to the opposite polarity.
In this paper, for the purpose of better understanding the swinging of these traces to the opposite polarity and determining the factors affecting it, simulation work was carried out. All of these clear observations that the inductive effect can be significant in a ground electrode under a high-impulse current, which are indicated from the delay in the current rise time and voltage and the swinging of the current traces to negative, lead to the judgement that other approaches for achieving a good performance of grounding systems under high-impulse currents need to be considered.
Having stated all of these reasons, there is a need to consider another parameter, soil resistivity, for which the method to achieve low soil resistivity is the use of EMs. Various types of EMs are available commercially, where the data of their performances are usually presented as the power frequency performance [9,10,11,12,13,14,15]. Different EMs are expected to have different performances, as demonstrated in [9,10,11,12,13,14,15]. Some studies on various EMs have also been conducted under high-impulse conditions. However, some EMs are not available locally, and the characteristics of the EM used in this study may not necessarily have the same characteristics as those published. The soil resistivity values can be high in some regions, and on rare occasions, conductive minerals such as those found in EMs can be used to greatly reduce the soil resistivity. Many studies have found that the effect of EMs improves significantly in the presence of water [9,12,13,14]. As EMs contain conductive minerals, they would be expected to appreciably reduce the soil conductivity and ground resistance values in the presence of water. However, it was noticed in field measurement research [16,17] that a low soil-ionisation process is seen in low-resistivity soil, which is indicated as a small percentage of the fall in Zimp from its steady-state value.
In soil, as the permittivity of air is low (~1), the electric field in air voids and interfacial surfaces within the soil is, therefore, enhanced. Due to this, arcing can be initiated from these air voids when subjected to high stress (i.e., voltage magnitudes, soil conductivity). The electrons can be from the air voids of high electric fields and can be liberated from the electrode, where the number of electrons can increase due to collisions and also from the adequate energy gained from the ionisation process. The electrons in the avalanche move very fast compared to the positive ions. Hence, the positive ions remain virtually in their original positions and the head of the avalanche will be filled with fast-moving electrons. This leads to streamer propagation from the electrode or these air voids that are ionised, which can lead to streamers proceeding across the soil, forming a conducting path of a highly ionised region or a full breakdown in the soil.
When soil of low resistivity is subjected to a high voltage, the electrons released due to the soil ionisation process or from the electrodes may not be effective, as these electrons diffuse due to the low soil resistivity, which produces a rather constant rate of conduction in the soil mass when the voltage penetrates the air gap in the soil. Studies on increasing the water content in soil under high-impulse currents, which have mostly tested this using a laboratory approach, have also shown similar characteristics [18,19], where the water content had little influence on the breakdown voltage or the critical electric field, although in [19], the soil characteristics were found to be significant for soil mixed with a water content of less than 4%.
As the effectiveness of EMs is dependent on the presence of water, as seen in [12,13,14,15], for a low voltage and a low current, the number of studies on the impulse characteristics of EMs with various water contents is limited. Some papers have been published on the effect of the water content in EMs [20] and have observed that the lower the soil resistivity, the lower the fall of resistance from its steady state. However, this work was mostly carried out in a laboratory, and there is still a need to investigate it using field measurements, which can provide more realistic data on the impact of the characteristics of EMs on soil under high-impulse conditions. In [20], a significant fall in the resistance value was noticed as the percentage of water increased from 1% to 10% in sand mixed with 5% sodium chloride (NaCl), which was more than a 90% difference between the resistance at 1% and that at 10%. When Androvitsaneas et al. [14] carried out tests on a ground rod installed under three conditions—natural, foundation concrete and slurry bentonite—in summer and autumn, using power frequency tests and under impulse conditions with EMs, they noticed that the resistance installed in bentonite had the best performance in autumn and winter due to its high water absorption. In their study [6], an impulse voltage level of up to 11 kV was used, where the ionisation effect may not have been so observable.
Due to the various grain sizes and conductivity of EM, the characteristics of ground electrodes installed in EMs with various percentages of water content would be expected to appreciably change. In this paper, a small grid was constructed, where the soil was treated with EM, and some amount of water content was poured on top of the electrode to imitate light and heavy rain in typical tropical countries. The results were discussed in terms of voltage and current traces, impulse impedance, current rise and discharged times. A peculiar observation, where the voltage and current traces swung to opposite impulse polarity during the discharge, was seen for (ii) the ground electrodes with the EM and (iii) the ground electrodes with the EM and water content. Though the traces swinging to opposite polarities at the discharged times has also been observed in several studies [7,8], no detailed studies have attempted to explore the factors affecting it. Further analysis with computational methods shows that that the magnitude of the swing is dependent on the RDC and voltage/current magnitudes. This study shows that regarding the interest in fulfilling the design criteria by having a low ground resistance value, it must be acknowledged that other problems may arise, where the inductive effect can become more significant in ground electrodes with a low ground resistance value.

2. Experimental Arrangement
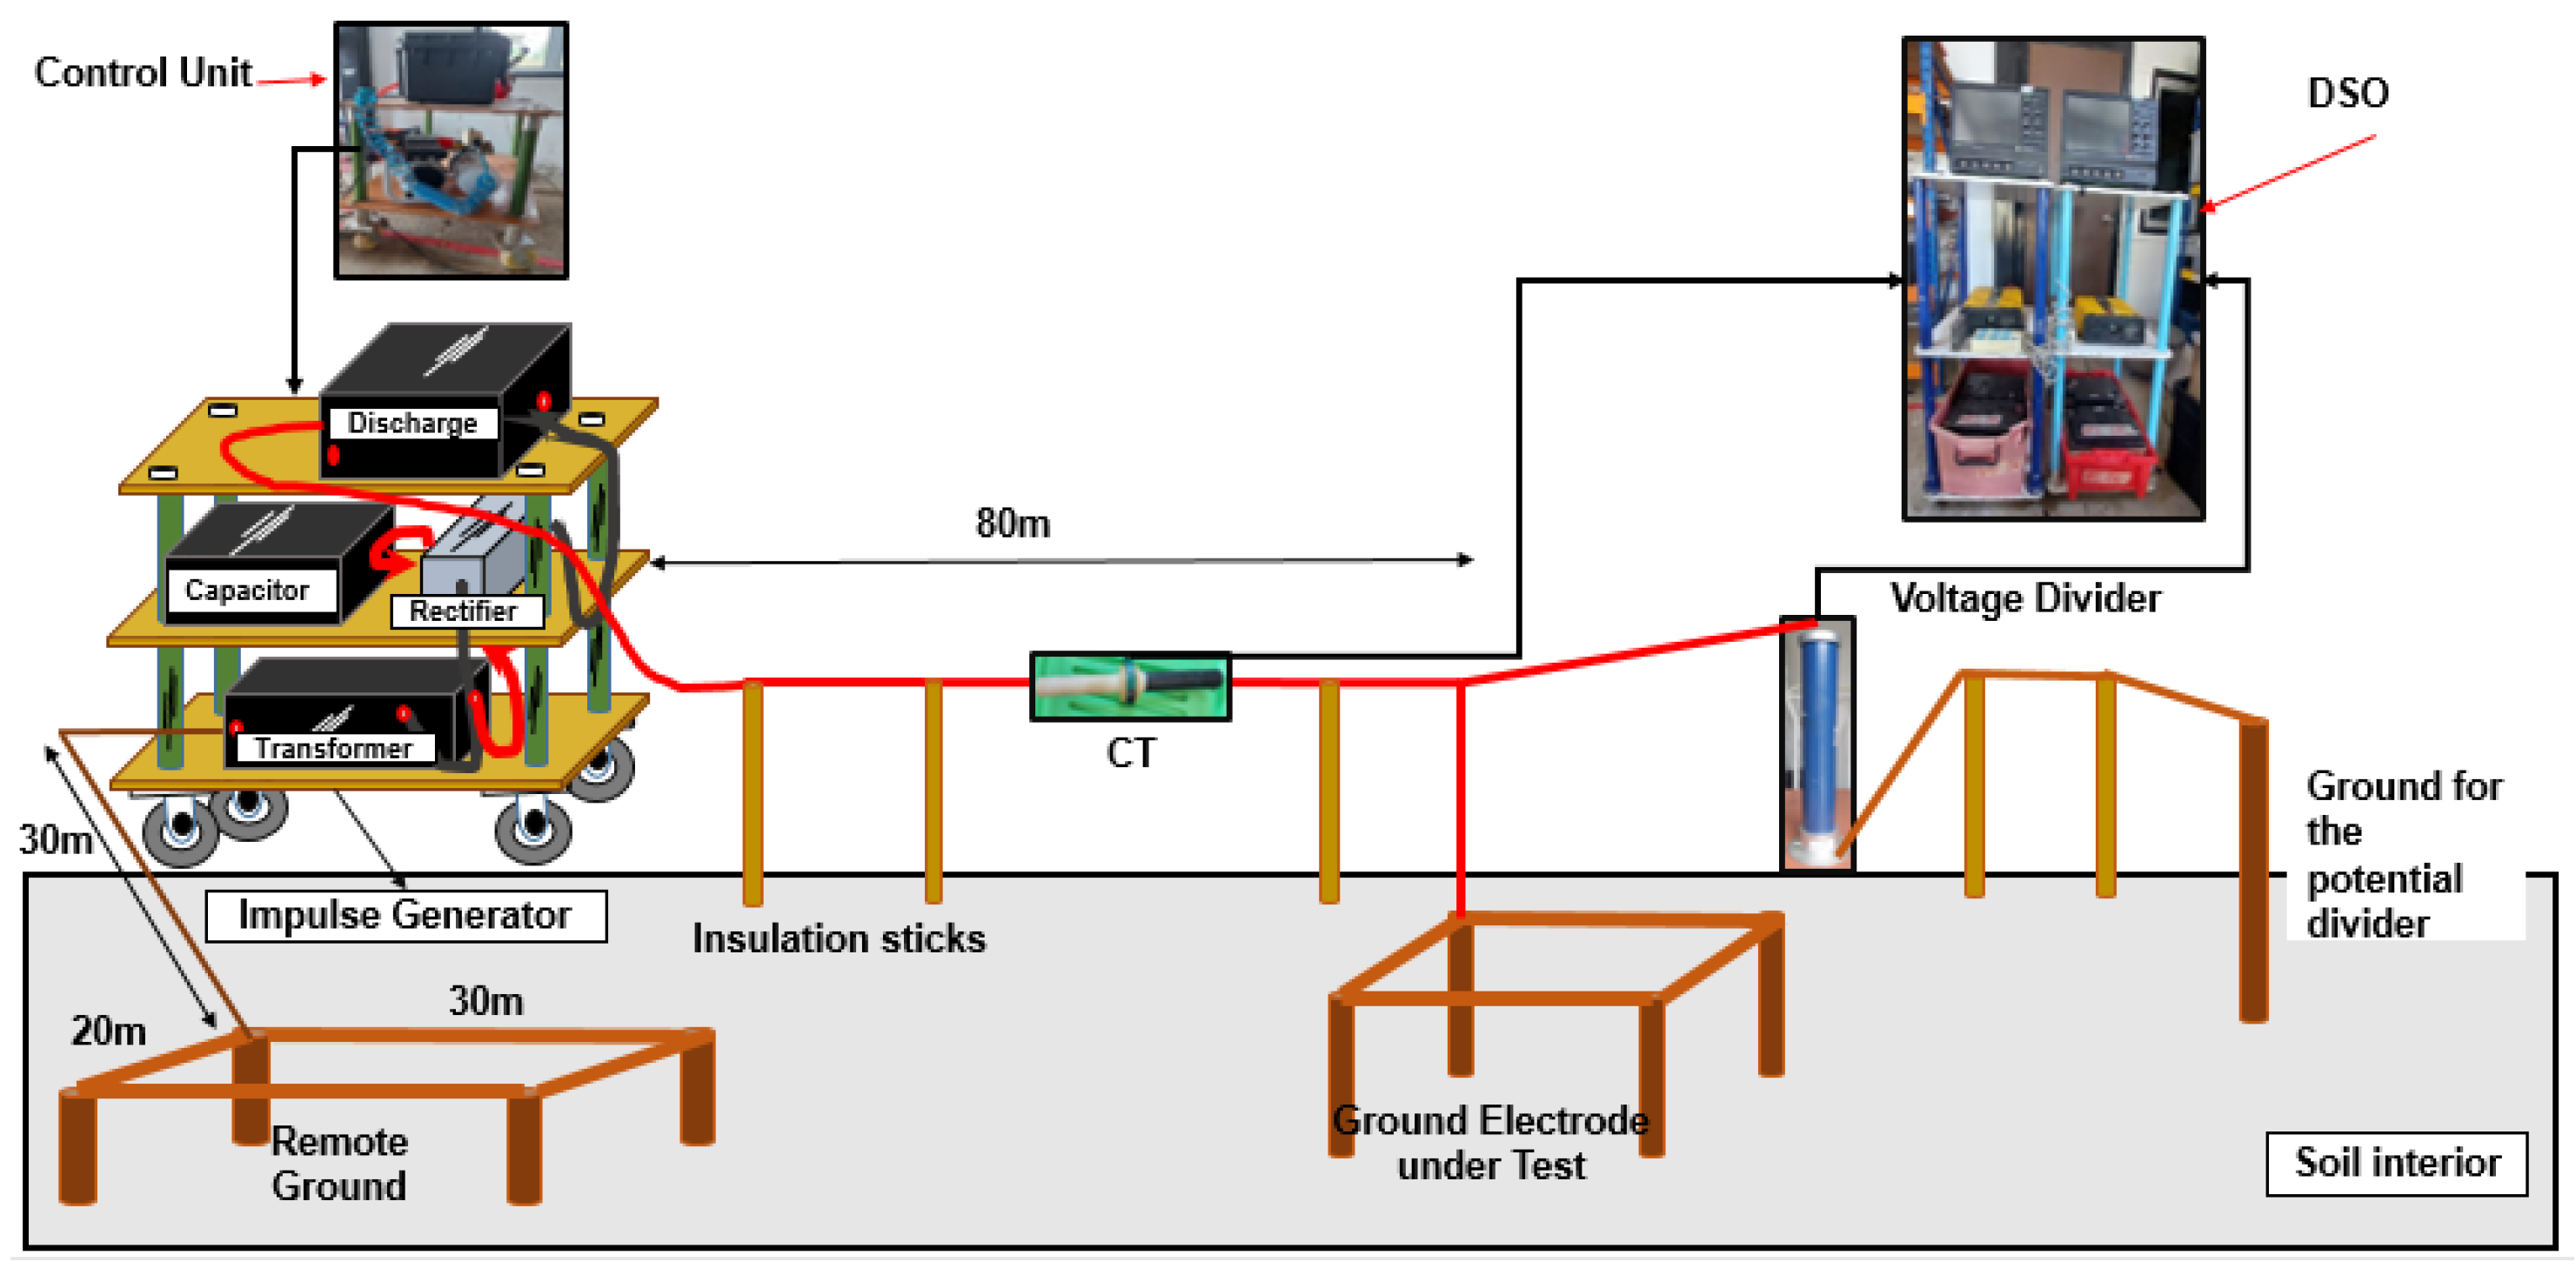
2.1. Test Set-Up

Figure 1 shows the adopted experimental arrangement at the field site, where the impulse generator generates high voltages of up to 100 kV and high current impulses of up to 1.5 kA. The current measurement was achieved using a current transformer with a sensitivity of 0.01 V/A and a response time of 20 ns. The voltage measurement was achieved using a resistive divider with a ratio of 1000:1 and a response time of 40 ns. The voltage and current traces were captured using a Digital Storage Oscilloscope (DSO). The remote ground consisted of a large square grid measuring 10 m by 10 m, which was further subdivided into a four-quadrant sub-grid. The ground resistance value was 8 Ω.

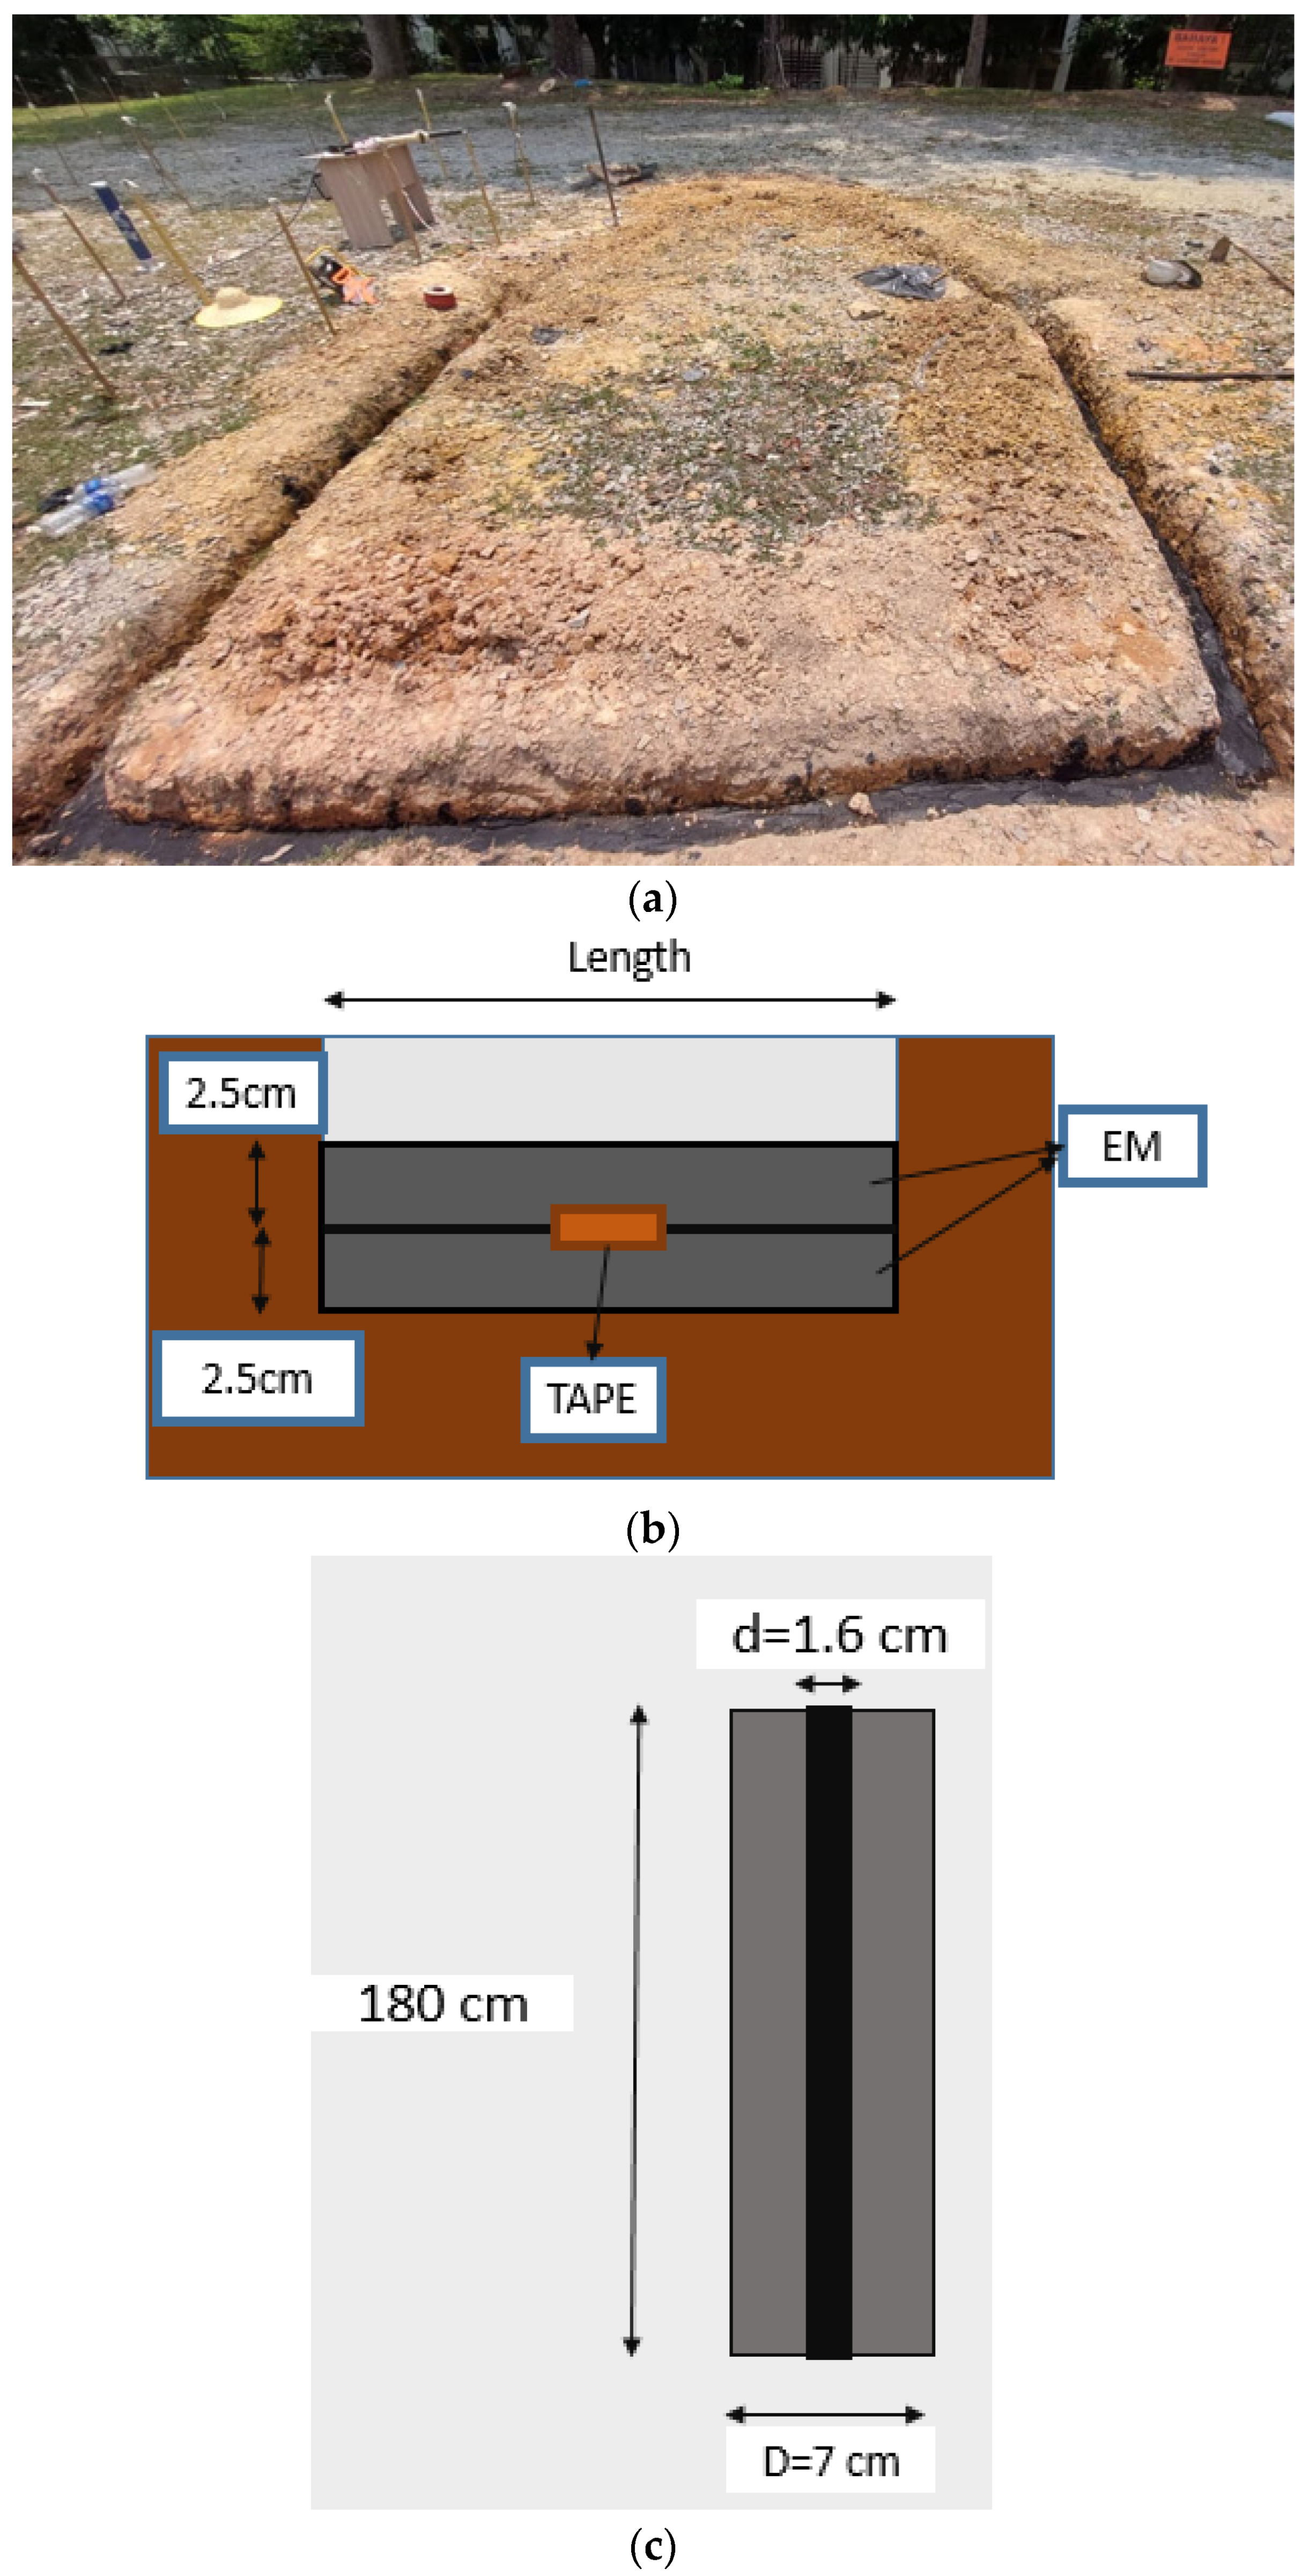
2.2. Ground Electrode

Figure 2 shows a small grid ground electrode, installed 30 cm below the ground’s surface, connected to a rod electrode at each corner of the grid. Copper tapes, with a width of 25 mm and a thickness of 3 mm, were used to connect these copper rod electrodes measuring 16 mm in diameter and 1.8 m in length. The ground electrodes can be categorised into three main parts: (i) a 2 m × 2 m ground electrode installed in natural soil, denoted as GEN; (ii) 2 m × 2 m ground electrodes installed in soil treated with EMs, denoted as GEM; and (iii) GEM ground electrodes poured with 10 L, 20 L, 50 L and 100 L of water, denoted as GEM_10L, GEM_20L, GEM_50L and GEM_100L, respectively. For the ground electrode (i), trenches with the size of 10 m width and matching the length of the grid were made, where the copper tapes were laid along the trench, backfilled with heap soil and gently tapped on these installations (see Figure 3), and the rod electrodes were driven into the soil by hammering all the way to a depth of 1.8 m. Ground resistance measurements at a low voltage and low current and impulse tests with increasing voltage magnitudes under both impulse polarities were then conducted on the ground electrode. Ground electrode (ii) can be divided into two parts: horizontal and vertical electrode installations. For the former, the soil in the trench was excavated. The copper tapes, which were installed earlier, were removed to facilitate the placement of the 2.5 cm thick EM underneath and on the copper tapes. The powdered EM was mixed with a specified percentage of water content, which turned it into a slurry mixture (see Figure 3a). This was then poured into the trenches. The mixture was prepared based on the manufacturer’s requirements (10 L of water was mixed with 25 kg of EM, which turned the EM into a slurry mixture). This mixture was prepared first before it was placed on and under the copper tapes. It was stated in the manufacturer’s data sheet that the EM complies with IEC62561-7 [21], with its composition comprising carbon-based graphite powder and Portland cement.
The amount needed for the horizontal ground electrode was based on the 5 cm thickness and the lengths of the copper tapes (see Figure 3b), whereas for the vertical rod electrode, the amount needed was based on the 7 cm diameter of the hole, subtracting the 1.6 cm diameter of the ground electrode and considering the length of the rod electrode of 1.8 m (see Figure 3c).
The copper tapes were laid back in the trenches, and another layer of the slurry form of EM, measuring 2.5 cm in thickness, was placed on the copper tapes. Heap soil was used to backfill the trenches and was tapped gently on the ground. To install the rod electrodes, the rod electrode that was installed earlier in (i) was pulled out to create a pre-hole, which was then filled with EM. A bore hole with a diameter of 7 cm was made, and the slurry form of EM was poured into the hole while ensuring the rod remained in the middle of this hole. Similar to (i), low voltage, low current and impulse tests were carried out on ground electrode (ii), GEM and ground electrode (iii) (GEM_10L, GEM_20L, GEM_50L and GEM_100L).
Figure 2. Ground electrodes used in this study.
Applsci 14 00547 g002
Figure 3. Ground electrode installed in soil with the EM: (a) installation of 2 m × 2 m ground electrodes with the EM; (b) installation of the horizontal ground electrode in the EM on soil; (c) installation of the vertical ground electrode in the EM on soil.
Applsci 14 00547 g003

2.3. Soil Resistivity, EM and Water Content

Using the Wenner measurement method, the soil resistivity was experimentally determined at the site, and CDEGS was used to establish the two-layer soil models. The soil resistivity data obtained using the Wenner method were keyed into the RESAP module of CDEGS, allowing the user to choose the number of layers. In this study, the two-layer soil model was defined. The soil resistivity values of the upper and lower layers, ρ1 and ρ2, respectively, and the height of the first layer, h1, are shown in Table 1. Two measurements were carried out: ‘before excavation and installation work’, in which no changes to the soil were made and the measurements were carried out on day 1 before any excavation or installation work commenced at the site, and ‘after the addition of EM and water content’, representing the soil resistivity measurements that were conducted after all the tests were completed on day 3. As the EM was poured only in the trenches and the water content was poured on the small working area where the ground electrodes were installed, little change in soil resistivity was observed. The percentage difference observed for all the parameters was below 20%. The measurements were conducted for a number of traverses, with each traverse spanning approximately 150 m in length for all three main configurations. The weather conditions changed minimally during the 3-day test period, which predominantly consisted of hot temperatures and high humidity.
The tests were carried out within 3 days. The ground electrode (i) GEN was examined on the first day, followed by electrode (ii) GEM on the second day and ground electrodes (iii) GEM_10L, GEM_20L, GEM_50L and GEM_100L on the third day.
Table 1. Two-layer soil resistivity profile using CDEGS.
Test ConditionsSoil Resistivity Profile
ρ1 (Ωm)ρ2 (Ωm)h1 (m)h2 (m)
Before excavation and installation work202.15341.122.71Infinite
After the addition of EM and Water Content (WC)207.79289.312.95Infinite

3. Experimental Test Results

3.1. Steady-State Ground Resistance Values, RDC

Before the impulse tests were carried out on these ground electrodes, measurements on all the ground electrodes (i–iii) were first conducted under steady-state conditions using a fall-of-potential (FoP) method to obtain the ground resistance values (RDC). Table 2 summarises the RDC values of all the ground electrodes used. The table indicates that the addition of EM substantially reduced the RDC by more than 40%, as evidenced in the comparison between ground electrodes (i) and (ii). The appreciable fall in RDC from (i) GEN to (ii) GEM is thought to be due to the high conductivity of the EM mixture, as well as the increased conductive area resulting from the placement of EM slurry on and under the copper strips or around the vertical rod electrode, which improved the RDC. A steady conduction pattern of ground electrode (ii) GEM can also be seen from the close RDC values between (ii) GEM and (iii) GEM_10L, where the addition of 10 L of water content did not affect the RDC value. As more water was poured into the soil, close RDC values between (ii) and all the ground electrodes (iii) were seen. The highly conductive nature of ground electrode (ii) GEM shows that the current flowed steadily, suggesting that any changes to the soil or ground electrode may not significantly change the RDC. This aligns with the findings presented in the standards [22], in which, for the grounding systems with low RDC values, variations in some parameters (water and salt content) will not significantly change the RDC values.

3.2. Impulse Test Results

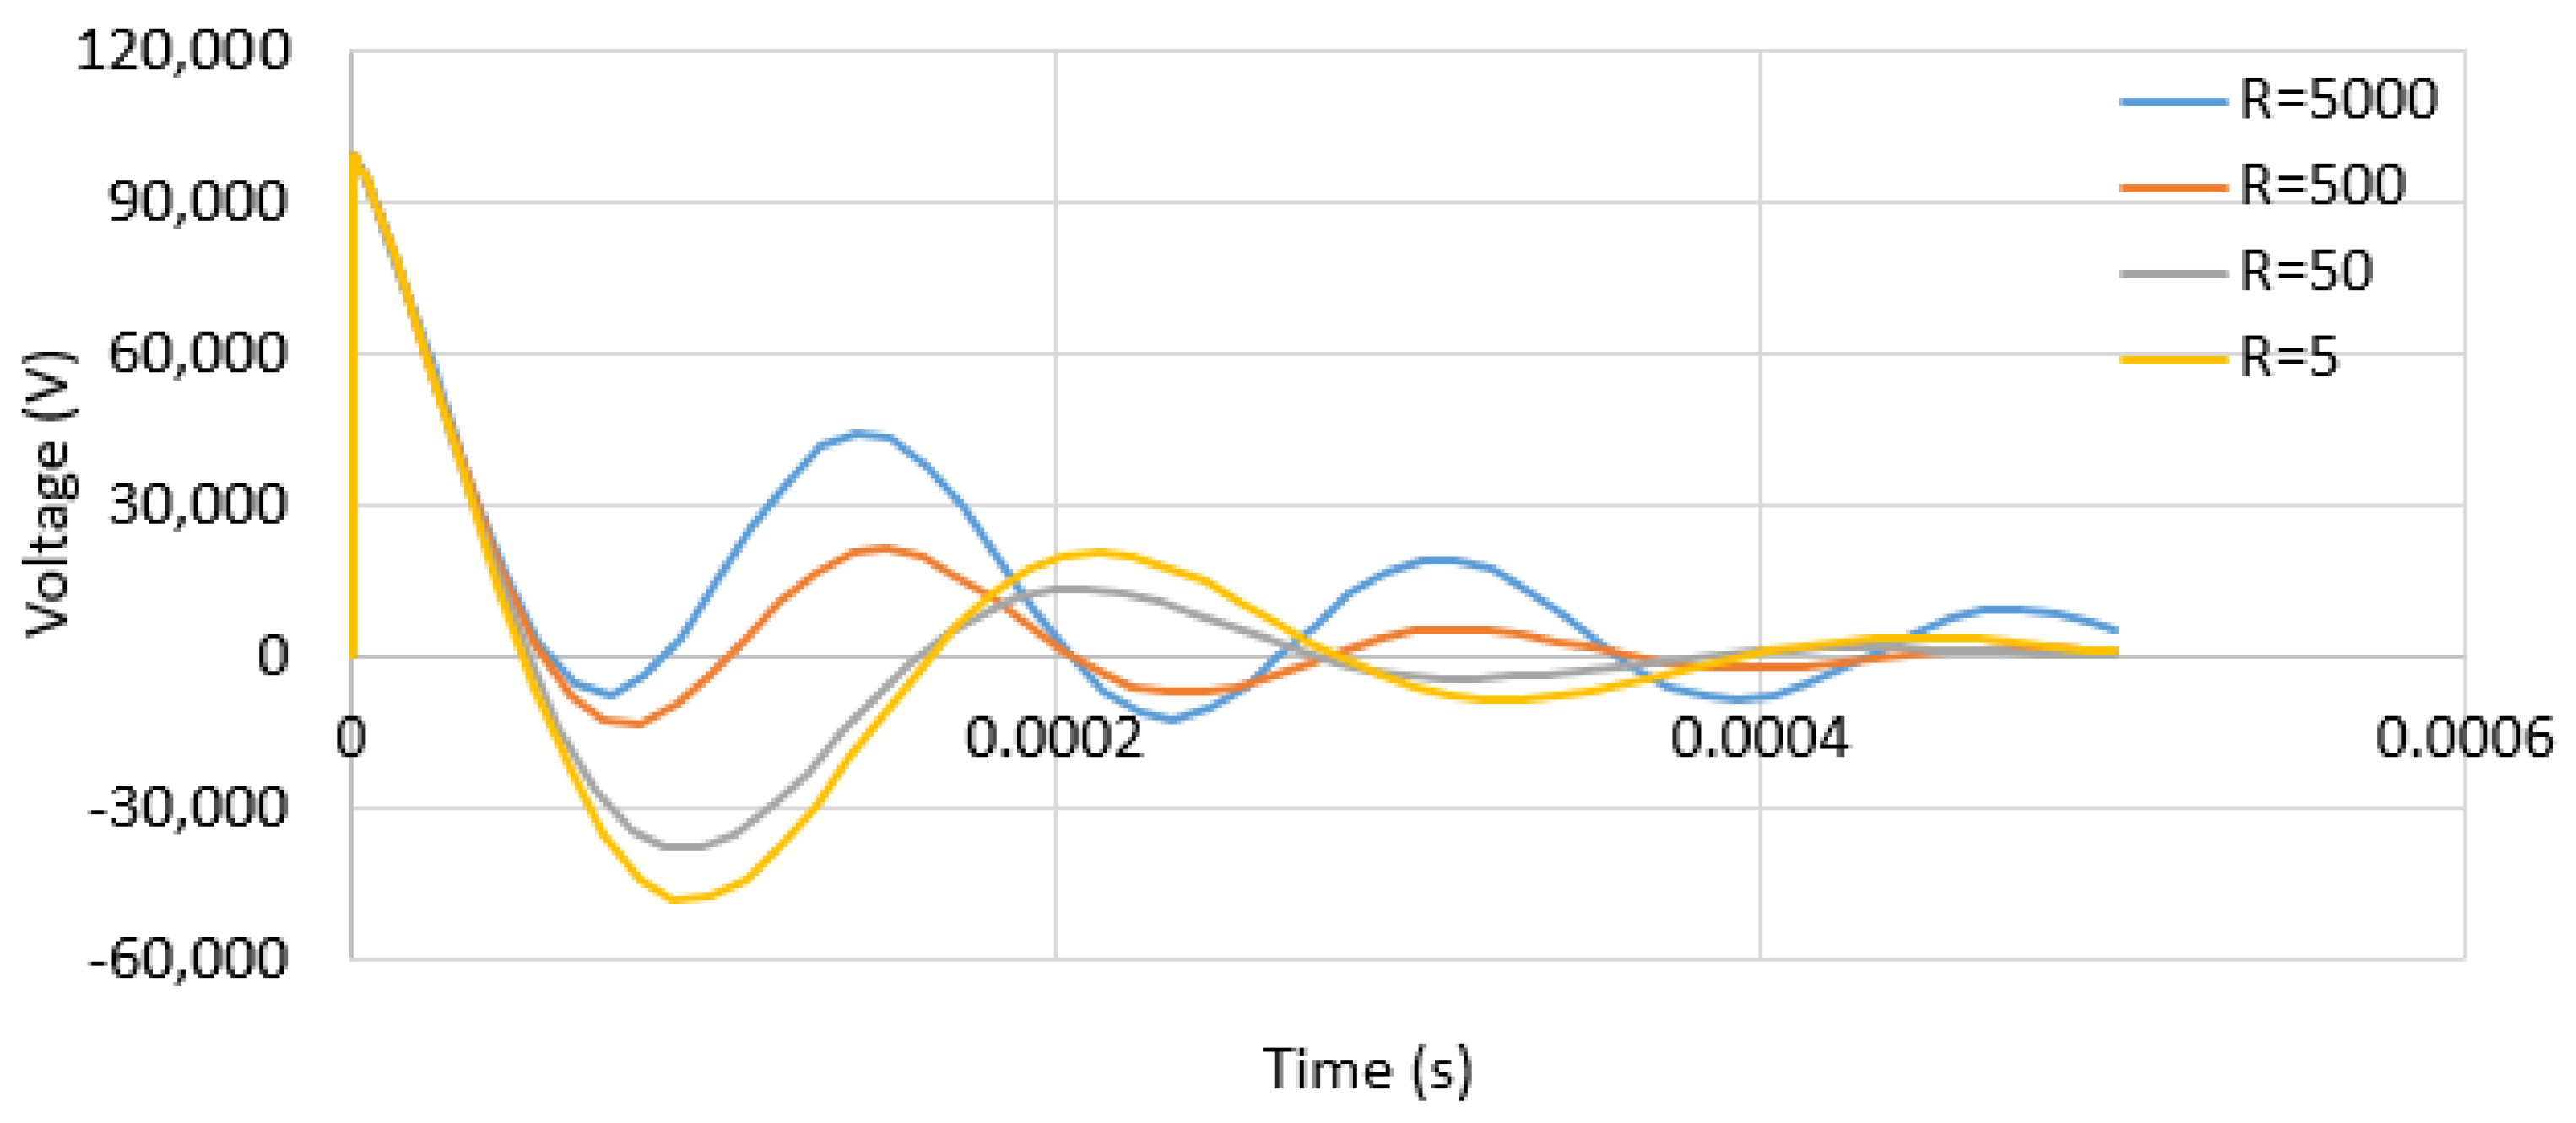
3.2.1. Voltage and Current Traces

Figure 4 and Figure 5 show the voltage and current traces of positive-impulse polarity for ground electrodes (i) and (ii), respectively. For all the ground electrodes (iii), the voltage and current traces are similar to those seen in (ii) for all added water content (WC) and voltage levels. Similar trends were also seen for negative-impulse polarity. As can be seen in both figures, the traces are fairly similar, but the voltage and current traces were found to discharge to zero for electrode (ii), whereas the traces for electrode (ii) and all the electrodes (iii)a–(iii)d swung towards the opposite polarity or overshot at the discharged times. This shows that the overshoot only occurs in low RDC values. Careful measurements was carried out on the voltage and current magnitudes of the traces that swung to the opposite polarity, revealing that the higher the applied voltage, the higher the magnitude of voltage swung to the opposite polarity was. It was found that the impulse polarity had no effect on the magnitudes of the overshoot.
A few studies did not explain the reason for the overshoot, whereas several studies [7,8] have indicated that these overshoots result from the inductive effect of the test load, although no specific demonstration has been conducted to validate this claim. Hence, for the purpose of enhancing our understanding regarding these traces swinging to the opposite polarity, a simple impulse circuit was established, where the test load consisted of inductance in series with resistance, as shown in Figure 6. This equivalent circuit has been used in several publications [18] to represent grounding systems under high-impulse currents. However, in their study [18], the parameters that affect the swing of voltage and current traces to the opposite polarity were not highlighted. Their results were mainly related to the ionisation effect, which mainly occurs during the front or crest times [16,17,18,19,20]. In this work, the test circuit was simulated using the PSPICE circuit transient analysis program. Switch t_open represents the impulse generator spark gap switch. Some inductance (L1), capacitance (C1) and resistance (R1) elements were used to generate the test circuit so that a standard of 1.2/50 μs was achieved. The equivalent circuit of the test circuit is represented by the inductance (L7) in series with the parallel branch of capacitance (C6) and resistance (R2). The R2 changed from as low as 5 Ω to as high as 50,000 Ω, demonstrating the effect of resistance on the overshoot of voltage and current at discharged times. The value of L7 was purposely set in the milli-Henry range to establish a clear relationship when R2 was changed, whereas C6 was found to have little effect on the results.
Figure 7 and Figure 8 show the voltage and current traces, respectively, for the changes in resistance values while keeping the inductance value constant. As can be seen, similar to the experimental results, the lower the ground resistance value (i.e., with the addition of EM and water content), which relatively increases the current magnitude, the higher the overshoot. This is because as the resistance values are reduced, the inductance component, which is in series with the resistance, becomes significant, leading to higher overshoot levels. The voltage and current traces were further analysed, and the impulse impedance, current rise and discharged times are presented in the next sections.
Figure 6. Test circuit used in the PSPICE simulation.
Applsci 14 00547 g006
Figure 7. Voltage traces of the test load for various resistance values at a charging voltage of 100 kV.
Applsci 14 00547 g007
Figure 8. Current traces of the test load for various resistance values at a charging voltage of 100 kV.
Applsci 14 00547 g008

3.2.2. Impulse Impedance, Zimp

From the voltage and current traces, the impulse impedance (Zimp) values were measured by dividing the voltage magnitude at the peak current by the peak current. A graph illustrating impulse impedance against increasing current magnitudes for all ground electrodes was plotted, as shown in Figure 9. It was noticed from the figure that the Zimp of ground electrode (i) exhibits a slight dependency on current magnitudes, indicating the occurrence of a potential soil ionisation process in the soil, where high potentials may build up within the air voids and interfaces between the soil and ground electrodes. On the other hand, the Zimp of the other ground electrodes (ii) and (iii)a–(iii)d with lower RDC values was independent of the current magnitude, indicating that the current may reach a saturation point, where the free electrons produced may diffuse due to the low soil resistivity, preventing voltage build up in the air voids. The Zimp values of all the ground electrodes were found to be lower than the RDC values by approximately 30% for electrode (i) and 23% for electrodes (ii) and (iii)a–(iii)d, which may be due to possible ionisation in the soil. Furthermore, these results were found to be independent of impulse polarity.

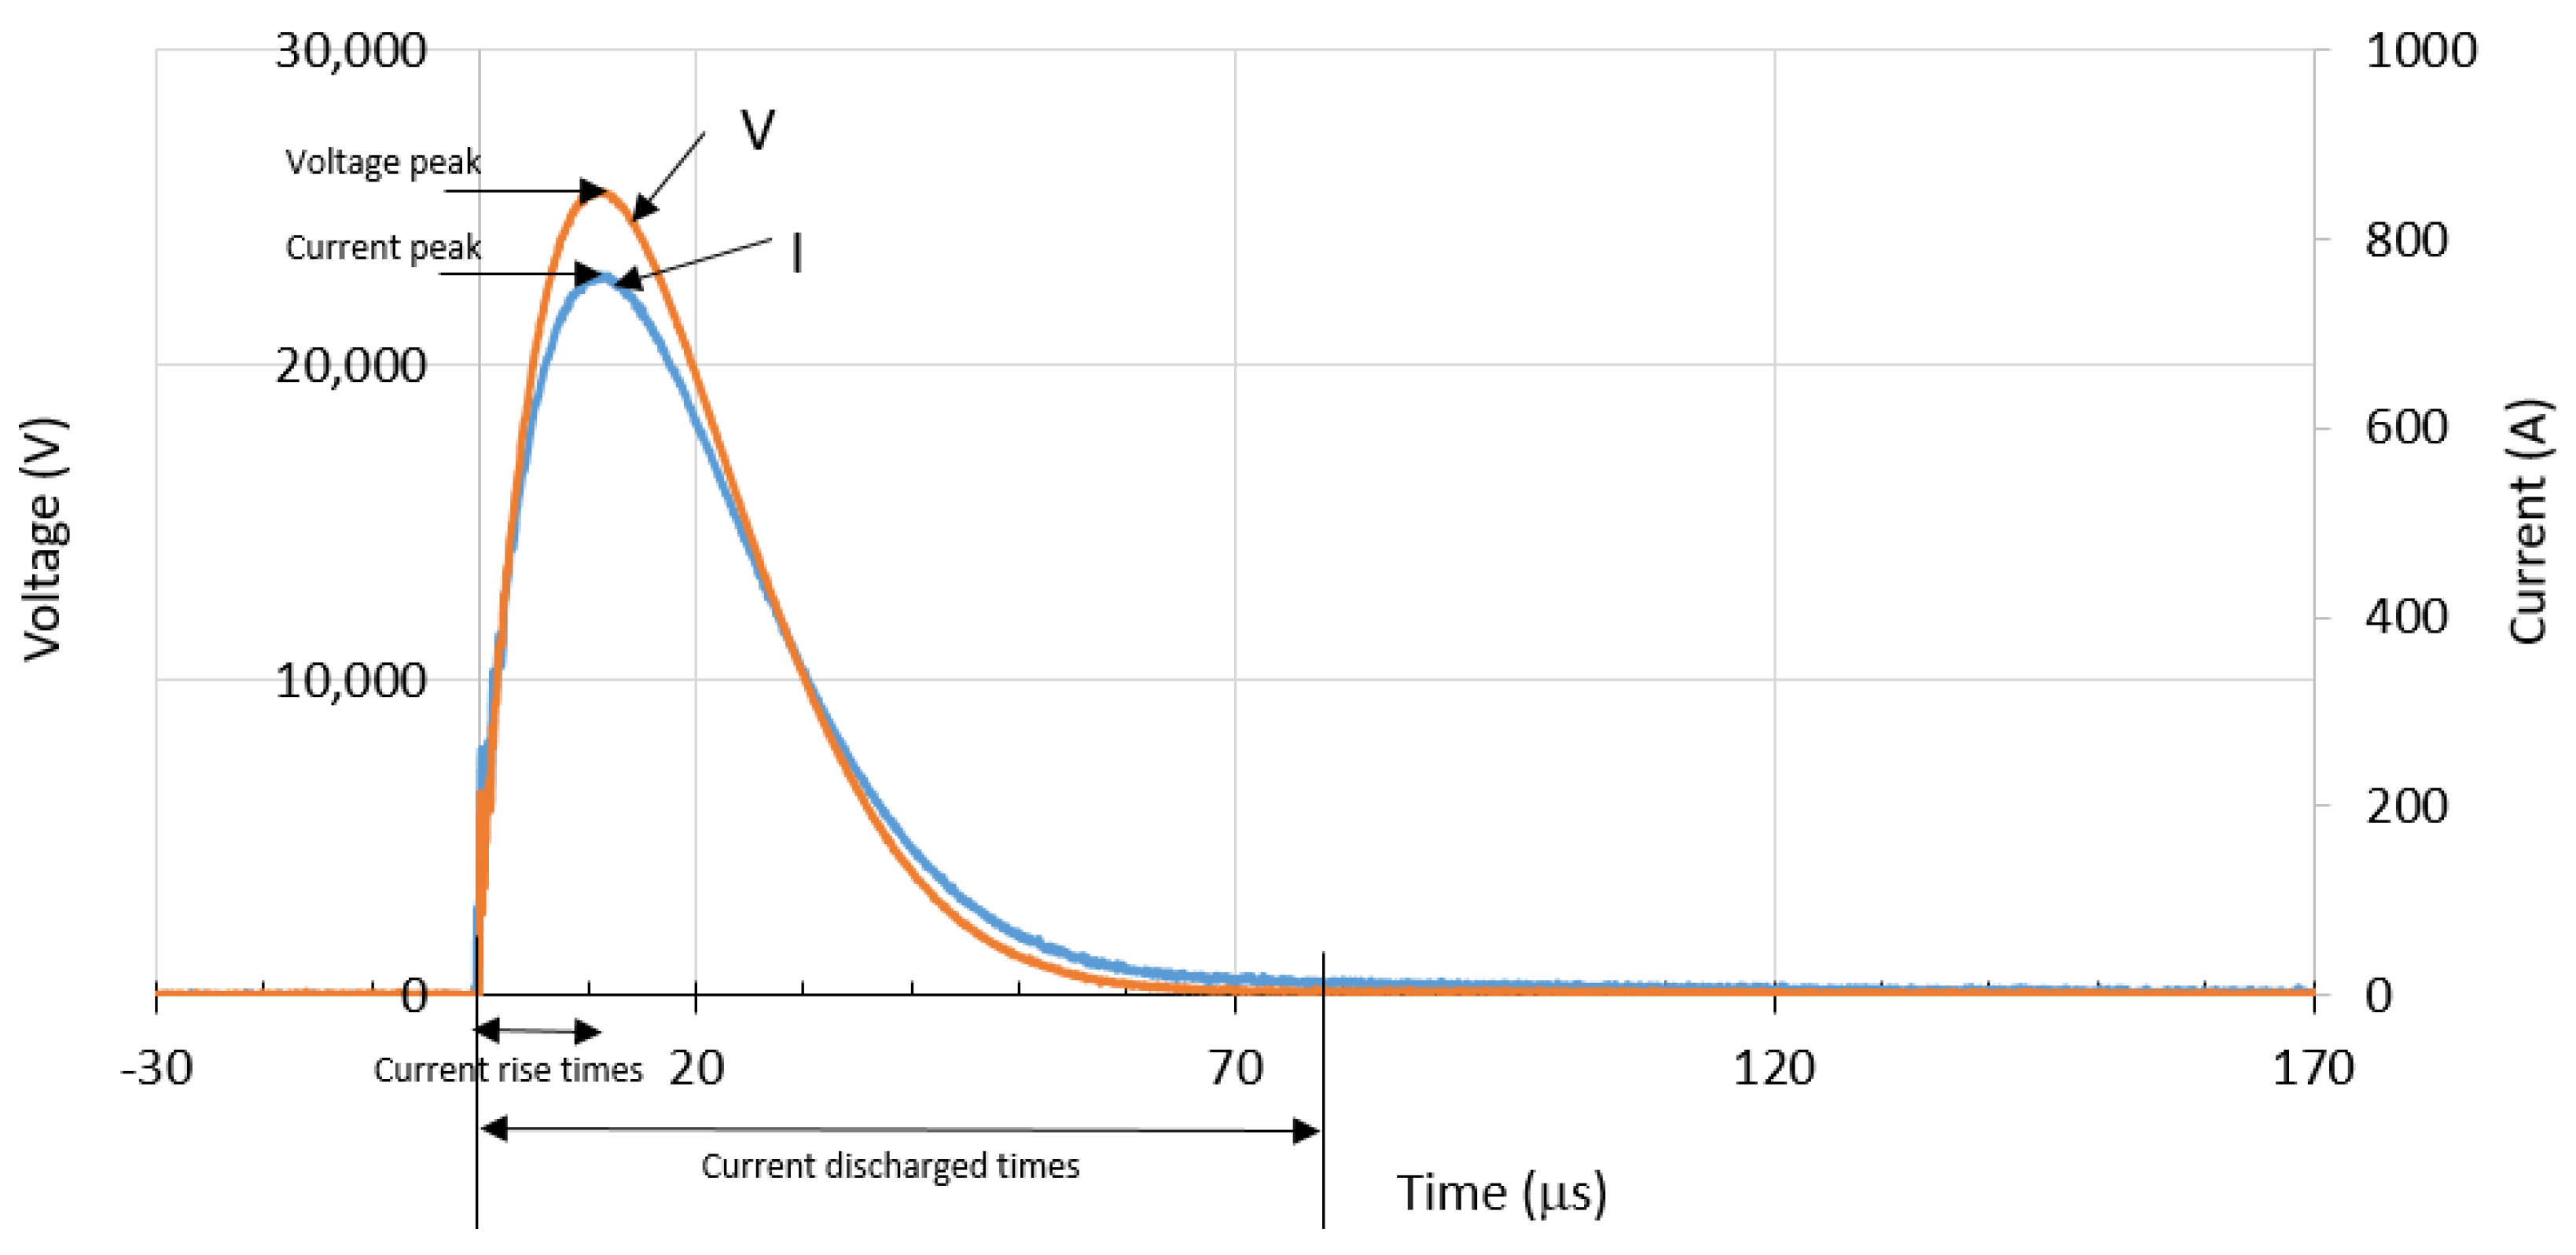
3.2.3. Current Rise and Discharged Times

For every voltage and current trace, the current rise and discharged times were measured, as shown in Figure 4. Figure 10 and Figure 11 show the current rise and discharged times, respectively, with increasing peak currents for all the ground electrodes. The current rise times can be defined as the time taken for the air voids in soil to break down and achieve fully conductivity. These times were found to be independent of the impulse polarity, ground electrodes and current magnitudes. The current discharge times represent the time taken to discharge the current to the ground. Faster current discharge to the ground occurred in ground electrodes (ii) GEM and (iii)a–(iii)d (GEM_10L, GEM_20L, GEM_50L and GEM_100L) due to their lower RDC or Zimp values, indicating relatively better conduction than ground electrode (i) with higher RDC and Zimp values. The trend of better conduction at higher current magnitudes is also observable in ground electrode (i), where the current discharged times were found to decrease with increasing currents. However, we observed that the current discharged times of electrode (i) GEN were longer in positive polarity compared to negative polarity, despite the higher discharge activity observed in positive polarity. Hence, better conduction is expected to take place in positive compared to negative polarity. This could be due to statistical discharge behaviour in the soil, which could arise from non-uniformity in the soil properties.

4. Conclusions

The experimental test results concerning small-grid ground electrodes installed in natural soil, EM-treated soil and EM-treated soil with added water contents of 10 L, 20 L, 50 L and 100 L, depicted as ground electrode (i) GEN, (ii) GEM and (iii) GEM_10L, GEM_20L, GEM_50L and GEM_100L, respectively, are presented in this paper. The soil resistivity profile showed a small change in its values when the measurements were carried out before any groundwork and after placing the EM and pouring the WC. This minimal change in the soil properties occurred only within the working area where the grid electrode was installed, whereas the soil resistivity profile was measured over a larger ground area. On the other hand, significant changes were seen in the RDC values for the same ground electrodes installed in natural and EM-treated soil with added water content, with an increase of more than 40%. This indicates that EM may be an effective material in reducing RDC values.
When all the ground electrodes were subjected to high-impulse conditions, an appreciable difference was seen for ground electrodes (ii) and (iii), where the voltage and current traces swung to the opposite polarity or overshot. Conversely, this overshoot phenomenon was not seen in ground electrode (i). The magnitude of the overshoot was found to be higher in instances of lower RDC and increased with increasing applied voltage/current magnitudes. The simulation work confirmed that the overshoot resulted from the inductive test load, which became significant in the ground electrodes with low RDC values (electrodes (ii) GEM and (iii) GEM_10L, GEM_20L, GEM_50L and GEM_100L). The impulse impedance values for all the ground electrodes were measured and found to be independent of current magnitudes in the ground electrodes with low RDC values (electrodes (ii) and (iii)); however, a slight dependency of impulse impedance on current magnitude was seen in ground electrode (i).
The time to peak current was measured and found to be close for all the ground electrodes and was independent of current magnitude and impulse polarity for all the ground electrodes. The current discharged times were found to be independent of current magnitude for ground electrodes (ii) and (iii). Higher current discharged times were found for ground electrode (i) due to its high RDC value. Current discharged times for ground electrode (i) were found to decrease with increasing current magnitude and were influenced by impulse polarity. The slower current discharged times observed in positive-impulse polarity compared to negative-impulse polarity in electrode (i) and their dependency on current magnitudes were thought to be due to the conduction mechanism governed by the ionisation process in soil, since this process, which causes non-linear behaviour in soil, is known to be affected by voltage/current magnitudes and impulse polarity. On the other hand, for the other electrodes ((ii) and (iii)), high conduction in the soil was observed. A steady flow of current in these ground electrodes resulted in closely matched current discharged times, independent of the current magnitudes and impulse polarity.
An important observation in this study is the increased significance of the inductive effect under high-impulse conditions in ground electrodes with low RDC values. Hence, in fulfilling the design requirement of grounding systems, which is to reduce the low RDC, it is important to consider the inductive effect, which can be significant when subjected to high-impulse conditions.

Author Contributions

Conceptualization, U.M., F.A. and N.M.N.; methodology, U.M., F.A. and N.M.N.; PSPICE Student 9.1 software, N.M.N.; validation, U.M. and F.A.; formal analysis, U.M., F.A. and N.M.N.; investigation, U.M., F.A. and N.M.N.; resources, N.M.N.; data curation, U.M.; writing—original draft preparation, U.M. and N.M.N.; writing—review and editing, N.M.N.; visualization, U.M. and N.M.N.; supervision, N.M.N.; project administration, N.M.N.; funding acquisition, N.M.N. All authors have read and agreed to the published version of the manuscript.

Funding

This research was funded by the Ministry of Higher Education of Malaysia (MOHE) under the Fundamental Research Grant Scheme (FRGS), grant number FRGS/1/2021/TK0/MMU/02/8, and Telekom Malaysia Research & Development, grant number MMUE 210072.

Institutional Review Board Statement

Not applicable.

Informed Consent Statement

Not applicable.

Data Availability Statement

Data are contained within the article.

Conflicts of Interest

The authors declare no conflicts of interest.

References

  1. BS7430:2011; Code of Practice Earthing. BSI Standards Publication: London, UK, 2011.
  2. Dwight, H.B. Calculation of resistances of ground. Trans. Am. Inst. Electr. Eng. 1936, 55, 1319–1328. [Google Scholar] [CrossRef]
  3. Harid, N.; Griffiths, H.; Mousa, S.; Clark, D.; Robson, S.; Haddad, A. On the analysis of impulse test results on grounding systems. IEEE Trans. Ind. Appl. Ind. Appl. 2011, 51, 5324–5334. [Google Scholar] [CrossRef]
  4. Mohamad Nor, N.; Abdullah, S.; Rajab, R.; Othman, Z. Comparison between utility sub-station and imitative earthing systems when subjected under lightning response. Int. J. Electr. Power Energy Syst. 2012, 43, 156–161. [Google Scholar] [CrossRef]
  5. Stojkovic, Z.; Savic, M.S.; Nahman, J.M.; Salamon, D.; Bukorovic, B. Sensitivity Analysis of Experimentally Deter-mined Grounding Grid Impulse Characteristics. IEEE Trans. Power Appar. Syst. 1998, 13, 1136–1141. [Google Scholar] [CrossRef]
  6. Clark, D.; Mousa, S.; Harid, N.; Griffiths, H.; Haddad, A. Lightning current performance of conventional and enhanced rod ground electrodes. IEEE Transactions. Electromagn. Compat. 2021, 63, 1179–1188. [Google Scholar] [CrossRef]
  7. Sekioka, S.; Hara, T.; Ametani, A. Development of a nonlinear model of a concrete pole grounding resistance. In Proceedings of the International Conference on Power Systems Transients, Lisbon, Portugal, 3–7 September 1995; pp. 463–468. [Google Scholar]
  8. Sonoda, T.; Takesue, H.; Sekioka, S. Measurement on surge characteristics of grounding resistance of counterpoises for impulse currents. In Proceedings of the 25th International Conference on Lightning Protection, Rhodes, Greece, 18–22 September 2000; pp. 411–415. [Google Scholar]
  9. Androvitsaneas, V.P.; Gonos, I.F.; Stathopulos, I.A. Performance of ground enhancing compounds during the year. In Proceedings of the International Conference on Lightning Protection (ICLP), Vienna, Austria, 2–7 September 2012. [Google Scholar]
  10. Wan Ahmad, W.F.H.; Jasni, J.; Krishnan, P.; Ab-Kadir, M.Z.A. Performance of bentonite and vermiculite mixtures as grounding enhancement materials. In Proceedings of the 12th Asia-Pacific International Conference on Lightning (APL), Langkawi, Malaysia, 12–15 June 2023. [Google Scholar]
  11. Siow, C.L.; Abd Kadir, M.Z.A.; Gomes, C.; Azis, N. Steady state performance of improvised ufer grounding practice. In Proceedings of the International Conference on Lightning Protection (ICLP), Shanghai, China, 11–18 October 2014. [Google Scholar]
  12. Androvitsaneas, V.P.; Christodoulou, C.A.; Gonos, I.F.; Stathopulos, I.A. Electric resistivity variation of ground enhancing compounds under field conditions. In Proceedings of the IEEE International Conference on High Voltage Engineering and Application (ICHVE), Athens, Greece, 10–13 September 2018. [Google Scholar]
  13. Gomes, C.; Lalitha, C.; Priyadarshanee, C. Improvement of earthing systems with backfill materials. In Proceedings of the 30th International Conference on Lightning Protection (ICLP), Cagliari, Italy, 13–17 September 2010. [Google Scholar]
  14. Androvitsaneas, V.P.; Gonos, I.F.; Stathopulos, I.A. Experimental study on transient impedance of grounding rods encased in ground enhancing compounds. Electr. Power Syst. Res. 2016, 139, 109–115. [Google Scholar] [CrossRef]
  15. Androvitsaneas, V.P.; Gonos, I.F.; Stathopulos, I.A. Research and applications of ground enhancing compounds in grounding systems. IET Gener. Transm. Distrib. 2017, 11, 3195–3201. [Google Scholar] [CrossRef]
  16. Mohamad Nor, N.; Syed Abdullah, S. Impulse characteristics of ground electrodes in low resistivity soil. IEEJ Trans. Electr. Electron. Eng. 2023, 18, 1104–1110. [Google Scholar]
  17. Clark, D.; Guo, D.; Lathi, D.; Harid, N.; Griffiths, H.; Ainsley, A.; Haddad, A. Controlled large-scale tests of practical grounding electrodes—Part II: Comparison of analytical and numerical predictions with experimental results. IEEE Trans. Power Deliv. 2014, 29, 1240–1248. [Google Scholar] [CrossRef]
  18. Mohamad Nor, N.; Haddad, A.; Griffiths, H. Characterisation of ionisation phenomena in soils under fast impulses. IEEE Trans. Power Deliv. 2006, 21, 353–361. [Google Scholar]
  19. He, J.; Zeng, R.; Zhang, B. Methodology and Technology for Power System Grounding, 1st ed.; Chow, S., Ed.; John Wiley & Sons Singapore Pte. Ltd.: Singapore, 2013. [Google Scholar]
  20. Mohamad Nor, N.; Haddad, A.; Griffiths, H. Performance of earthing systems of low resistivity soils. IEEE Trans. Power Deliv. 2006, 21, 2039–2047. [Google Scholar]
  21. IEC62561-7; Lightning Protection System Components (LPSC)—Part 7: Requirements for Earthing Enhancing Compounds. IEC: Geneva, Switzerland, 2018.
  22. IEEE Std 80-2013; Guide for Safety in AC Substation Grounding. IEEE Standards Association: Piscataway, NJ, USA, 2013.
Figure 1. Test arrangement used in this study.
Applsci 14 00547 g001
Figure 4. Voltage and current traces of electrode (i) GEN at a charging voltage of 50 kV.
Applsci 14 00547 g004
Figure 5. Voltage and current traces of electrode (ii) GEM at a charging voltage of 50 kV.
Applsci 14 00547 g005
Figure 9. Impulse impedance versus peak current for all ground electrodes.
Applsci 14 00547 g009
Figure 10. Current rise times versus peak current for all ground electrodes.
Applsci 14 00547 g010
Figure 11. Current discharged times versus peak current for all ground electrodes.
Applsci 14 00547 g011
Table 2. Measured ground resistance values, RDC.
Ground ElectrodesMeasured Ground Resistance Value (Ω)
GEN39.7
GEM22.2
GEM_10L22.5
GEM_20L22.8
GEM_50L23.1
GEM_100L22.5
Disclaimer/Publisher’s Note: The statements, opinions and data contained in all publications are solely those of the individual author(s) and contributor(s) and not of MDPI and/or the editor(s). MDPI and/or the editor(s) disclaim responsibility for any injury to people or property resulting from any ideas, methods, instructions or products referred to in the content.

