1. Introduction
The presence of soluble salts in porous cultural heritage materials can cause significant decay through crystallisation or hydration cycles upon interaction with the environment and fluctuating relative humidity (RH) and temperature [
1,
2,
3,
4,
5,
6]. The exact RH and temperature ranges that can cause issues depend on the salt mix present. Quantitative analysis of the salt ions present is required to assess this. When these conditions are met, the extent of damage depends on the amount of salt present. In many instances, low concentrations of salts engender apparent stability of an object. If this variability in response can be predicted from analysis, decisions can be made about which objects and situations require environmental control. Providing this control can be expensive and have a negative impact on sustainability. The standard analytical approach at present is to drill a sample from the object [
7]. The diameter of sample needed depends on the grain size, with larger grain sizes requiring larger samples to be representative. Samples are generally taken to at least 2 cm in depth, with the surface 1–2 mm discarded. The samples are dried, weighed, extracted with high-purity water, filtered and analysed with ion chromatography. The results can be used with thermodynamic modelling to determine the temperature and RH regions within which pressure is generated by that particular salt mixture [
8]. This has proved an effective strategy to design preventive conservation strategies to minimise salt damage [
9,
10,
11,
12], although the detailed behaviour of some species mixes remains unclear [
13]. While an effective approach, drilling a sample is clearly undesirable, and two alternative methods have been investigated; poulticing the surface to extract a salt sample and combined non-invasive analysis with a microwave moisture meter and dielectric capacitance meter. The microwave moisture meter is unaffected by the presence of soluble salts in the water in the object, whilst the dielectric capacitance is significantly changed from that of pure water. A number of parameters of each method were investigated. There is an enormous body of work investigating poulticing to remove soluble salts from stone and other porous media. The understanding of mechanisms has developed greatly, and new poultice media are being developed [
14,
15,
16]. However, this is often not fully quantitative and generally focusses on how much salt is removed, not whether the salt removed through poulticing is representative of that in the body of the object. Unsuccessful extraction from wall paintings has been reported using poultices [
17].
At present, no non-invasive method exists to determine salt species concentrations inside porous media. The SUSI© equipment uses dielectrics and can map water content and a parameter labelled as the salinity index, which is related to conductivity of the salt solution, but does not identify the individual salts [
18]. Hyperspectral imaging in the far infrared (1100–2500 nm) has shown promise with sample salts [
19], but its applicability to all common salt mixtures has not been determined, nor its information depth. This means drilling will have to be continued as a sampling method. The investigated method, if successful, could be used to prioritise which objects to drill. Also, if a mapping method can be found, this will be valuable in deciding the most representative areas to take samples from.
Mixed salts (acetate/formate with chloride/nitrate) can be formed via reaction with soluble salts in the porous media and carboxylic acids in the environment (especially in enclosures) [
20,
21,
22]. Their presence is an important indication that the environment requires mediation to reduce the carboxylic acid concentration. Traditional analysis with X-ray diffraction (XRD) can be complicated through lack of standard patterns and is relatively slow. In-situ analysis with direct reflection FTIR microscopy can provide spectra of sufficient quality for identification and has a much faster workflow. An example with cuneiform tablets is presented and the cause for some tablets to react, whilst others did not, is investigated.
For stone and shale, the presence of expanding clays often leads to structural damage in fluctuating RH environments [
4,
23]. Traditional analysis again involves drilling a sample, followed by crushing or grinding, extracting with acid for limestone or centrifuging for sandstone and shale. The clay fraction, less than 2 micrometres is then deposited from water onto a low-crystallinity polytetrafluoroethylen filter in such a way as to align the clay particles. The filter is dried and analysed with XRD. The drying of the clay can buckle the sample, which requires re-laying of the clay down onto the filter and drying. This can significantly increase the analysis time. Fourier transform infra-red spectroscopy (FTIR) can identify clays without the need for an aligned, parallel sample. Reflectance FTIR and near-infrared spectroscopy (NIR) were investigated as non-invasive techniques to analyse the clay in situ. In some stones, the clay beds are parallel to and below the surface, requiring a certain depth of penetration for the beam to allow analysis. The detection limit and depth of penetration of the two techniques was assessed. These methods have been developed for kaolinite, sepiolite, and palygorskite clays, but expansion to the muscovite has been investigated in this work. Sepiolite and Palygorskite are common in Egyptian limestones and kaolinite in UK limestones and sandstones. However, muscovite is found in many UK stones, at least those analysed from English Heritage collections. Of over 250 analysed, 16% had muscovite present compared to 9% with kaolinite, although this is clearly a limited sample. This clay has also been identified as a major cause of deterioration of the limestone from the Amaravati Stupa in India [
24]. The analysis of muscovite samples extracted from limestones with direct reflectance FTIR and NIR has been investigated and compared with results from conventional drilling, digestion, and XRD analysis.
2. Methods and Materials
2.1. Poulticing Tests
Caen stone, an ooloitic limestone, was selected for tests as this soft stone is readily hand sawn and drilled, has low soluble salt content and an even texture. The stone was hand sawn into cubes (150 mm by 150 mm by 150 mm, each approximately 8.5 kg). These were impregnated with salt mixtures (sodium chloride, NaCl and sodium nitrate, NaNO
3) through immersion in the solutions detailed in
Table 1. The solutions were selected to replicate those found in the limestone objects [
4,
25].
After drying, (at 45% RH), any salts on the surface were removed by brushing, and the percentage of impregnated salt was estimated from the mass increase of the dried stone after impregnation. Each block was drilled in triplicate, using a 4 mm drill bit. The drill was inserted 1 cm at a time and samples collected separately. The stone powders were dried at 110 °C for 48 hours and weighed. The dried powders were extracted with 10 mL of 18.2 MΩ cm−1 water. The water extract was filtered (50 µm polypropylene filter) and analysed with ion chromatography, using a Dionex 600 ion chromatograph (Thermo Fisher Scientific, Waltham, MA, USA), with AS14 columns with 8 mM sodium carbonate, 18 mM sodium bicarbonate eluent for anions, and CS12 column with 1 mM methane sulfonic acid eluent for cations.
In order to determine the water penetration depth, a series of 1.4 mm diameter holes were drilled into the cubes at depths of 1, 2, 3, and 4 cm. A series of polyolefin-coated copper wires (1 mm diameter) were inserted into the cubes in pairs 1 cm apart. Polymer-sheathed, solid copper wires were forced into contact with the bottom of the drill holes using a Universal Tester applying 1 kN force. The impedance between each pair of wires was read with a Hioki LCR Meter IM3523. A calibration was generated, by inserting a single pair of wires into 3 cm by 3 cm by 2 cm blocks, wetting by soaking and running measurements at 90, 80, 70, 60, 50, 40, and 30% RH in a Memmert HCP240 environmental chamber with one set being weighed and a second set using the impedance measuring system. This was performed in triplicate.
Whatman number 1 paper poultices (3 layers of paper soaked in 18.2 MΩ cm
−1 water) were applied to the edge of the impregnated blocks. The RH was between 45 and 57% during the experiments. The poultices were dried, extracted, and analysed as described previously. After poulticing, the blocks were drilled again and salt concentrations determined. The ion ratios were calculated from the poultices and the average of the 0–2 cm drillings. A sensitivity analysis was undertaken, feeding the values from the different approaches into the ECOS model and examining the calculated RH stability ranges [
26].
2.2. Non-Invasive Salt Measurements
The information depth of an Hf Systems M350 microwave moisture meter with R1M331483 head and a Protimeter Survey Master dielectric meter was tested. A graduated Perspex measuring cylinder was filled with spray-dried calcite powder. The powder had been produced in size ranges 1–10, 20–40, and 50–100 µm in diameter. Using different-sized powders produced different pore structures and densities in the powder column. The powders were compacted by placing on a vibratory platform. The initial depth of powder was carefully saturated with 18.2 MΩ cm−1 water. A layer of dry powder was then added on top of this. The upper dry layers were 20, 25, 30, and 35 mm deep. The meter was then placed on top of the dried powder layer and the moisture content read.
This was repeated with a series of salt solutions including sodium chloride, sodium nitrate, sodium sulphate, potassium chloride, potassium sulphate, potassium nitrate, magnesium chloride, and magnesium sulphate.
A limestone object, a fragment from the Thetford tombs of the Dukes of Norfolk, was mapped using the Moist 350 microwave moisture meter (hf sensor GmbH, Leipzig, Germany) and Surveymaster (Protimeter, Taunton, UK) in the same points. The salts present had been previously analysed and found to be an approximate mixture of 3:1 nitrate:chloride, with sodium as the major cation. This would indicate a deliquescent RH of 68% RH. The object was humidified to above this value to ensure the salts were in solution for the analysis. Previous storage conditions had exceeded this value at least 20 times per year over the past three decades. The resolution was determined with the 44 mm diameter of the microwave head.
2.3. Mixed Acetate Salts on Cuneiform Tablets
An outbreak of mixed acetate salt efflorescence on cuneiform tablets was investigated. The tablets had been stored in wooden cabinets for over 80 years without significant issues. A small amount of salt efflorescence was observed, and this was found to be sodium chloride in over 30 instances analysing with XRD. Well under 3% of the tablets were observed to be affected. Prior to moving to a new storage location, a visual survey of over 30,000 tablets was undertaken and any instances of visible salt or surface damage recorded. During a heating failure, the RH rose above 80%, and large numbers of tablets were observed to be affected by salt efflorescence afterwards. The normal analytical procedure was to remove a sample of the efflorescence for initial XRD and later FTIR, as the technique was much faster. The very large number of samples needing to be analysed necessitated a new approach. The salts were analysed on the tablet surfaces with a direct reflection FTIR microscope, using a Nicolet Avator 360 bench (Thermo Fisher, Waltham, MA, USA) and Inspect IR microscope, which had been found to be very useful for similar analyses previously. This was found to produce identifiable spectra in just 5 scans, taking less than 15 s per sample. A representative sample (20 each) of affected and unaffected tablets were analysed by drilling (2 mm bit due to the fine nature of the cuneiform matrix) from break surfaces. The powders were dried and analysed for salts as before.
2.4. Clay Analysis and Non-Invasive Analysis
Samples of muscovite clay from acid digestion of 12 limestones that yielded the most clay were analysed with a Phillips 1830/1840 X-ray Diffractometer (Phillips, Amsterdam, The Netherlands), a Bruker Alpha FTIR (Bruker, Billerica, MA, USA) with attenuated total reflectance (ATR) accessory, or Analytic Labspec 4 NIR spectrometer (Analytik, Jena, Germany). To investigate non-invasive analyses, dried powders were then mixed with calcite powder and sequentially diluted to produce mixtures from 10 to 1% of the muscovite clay by mass. The mixtures were analysed with the Bruker Alpha FTIR with a reflectance accessory and Analytic Labspec 4 NIR spectrometer. The same limestone object was mapped with both techniques to investigate the clay distribution.
To investigate the information depth of the analyses, calcite (Analar BDH, Dubai, United Arab Emirates) powder was pressed into a series of discs of different thickness from 0.5 to 4 mm using a KBr pellet press. The FTIR analyses of the clay and calcite mixtures were then repeated with the calcite discs of different thicknesses inserted between the mixed clay sample and the spectrometer, and the calcite depth from which an analysis can be made was determined.
To compare the method with drilled samples and XRD, the 12 limestones from which the samples originated were analysed with the Analytic Labspec 4 spectrometer at 3 points, adjacent to the original drill hole. Eleven other limestones were analysed initially with NIR and then had samples drilled and analysed with both ATR-FTIR and XRD for comparison.
3. Results
3.1. Poulticing Tests
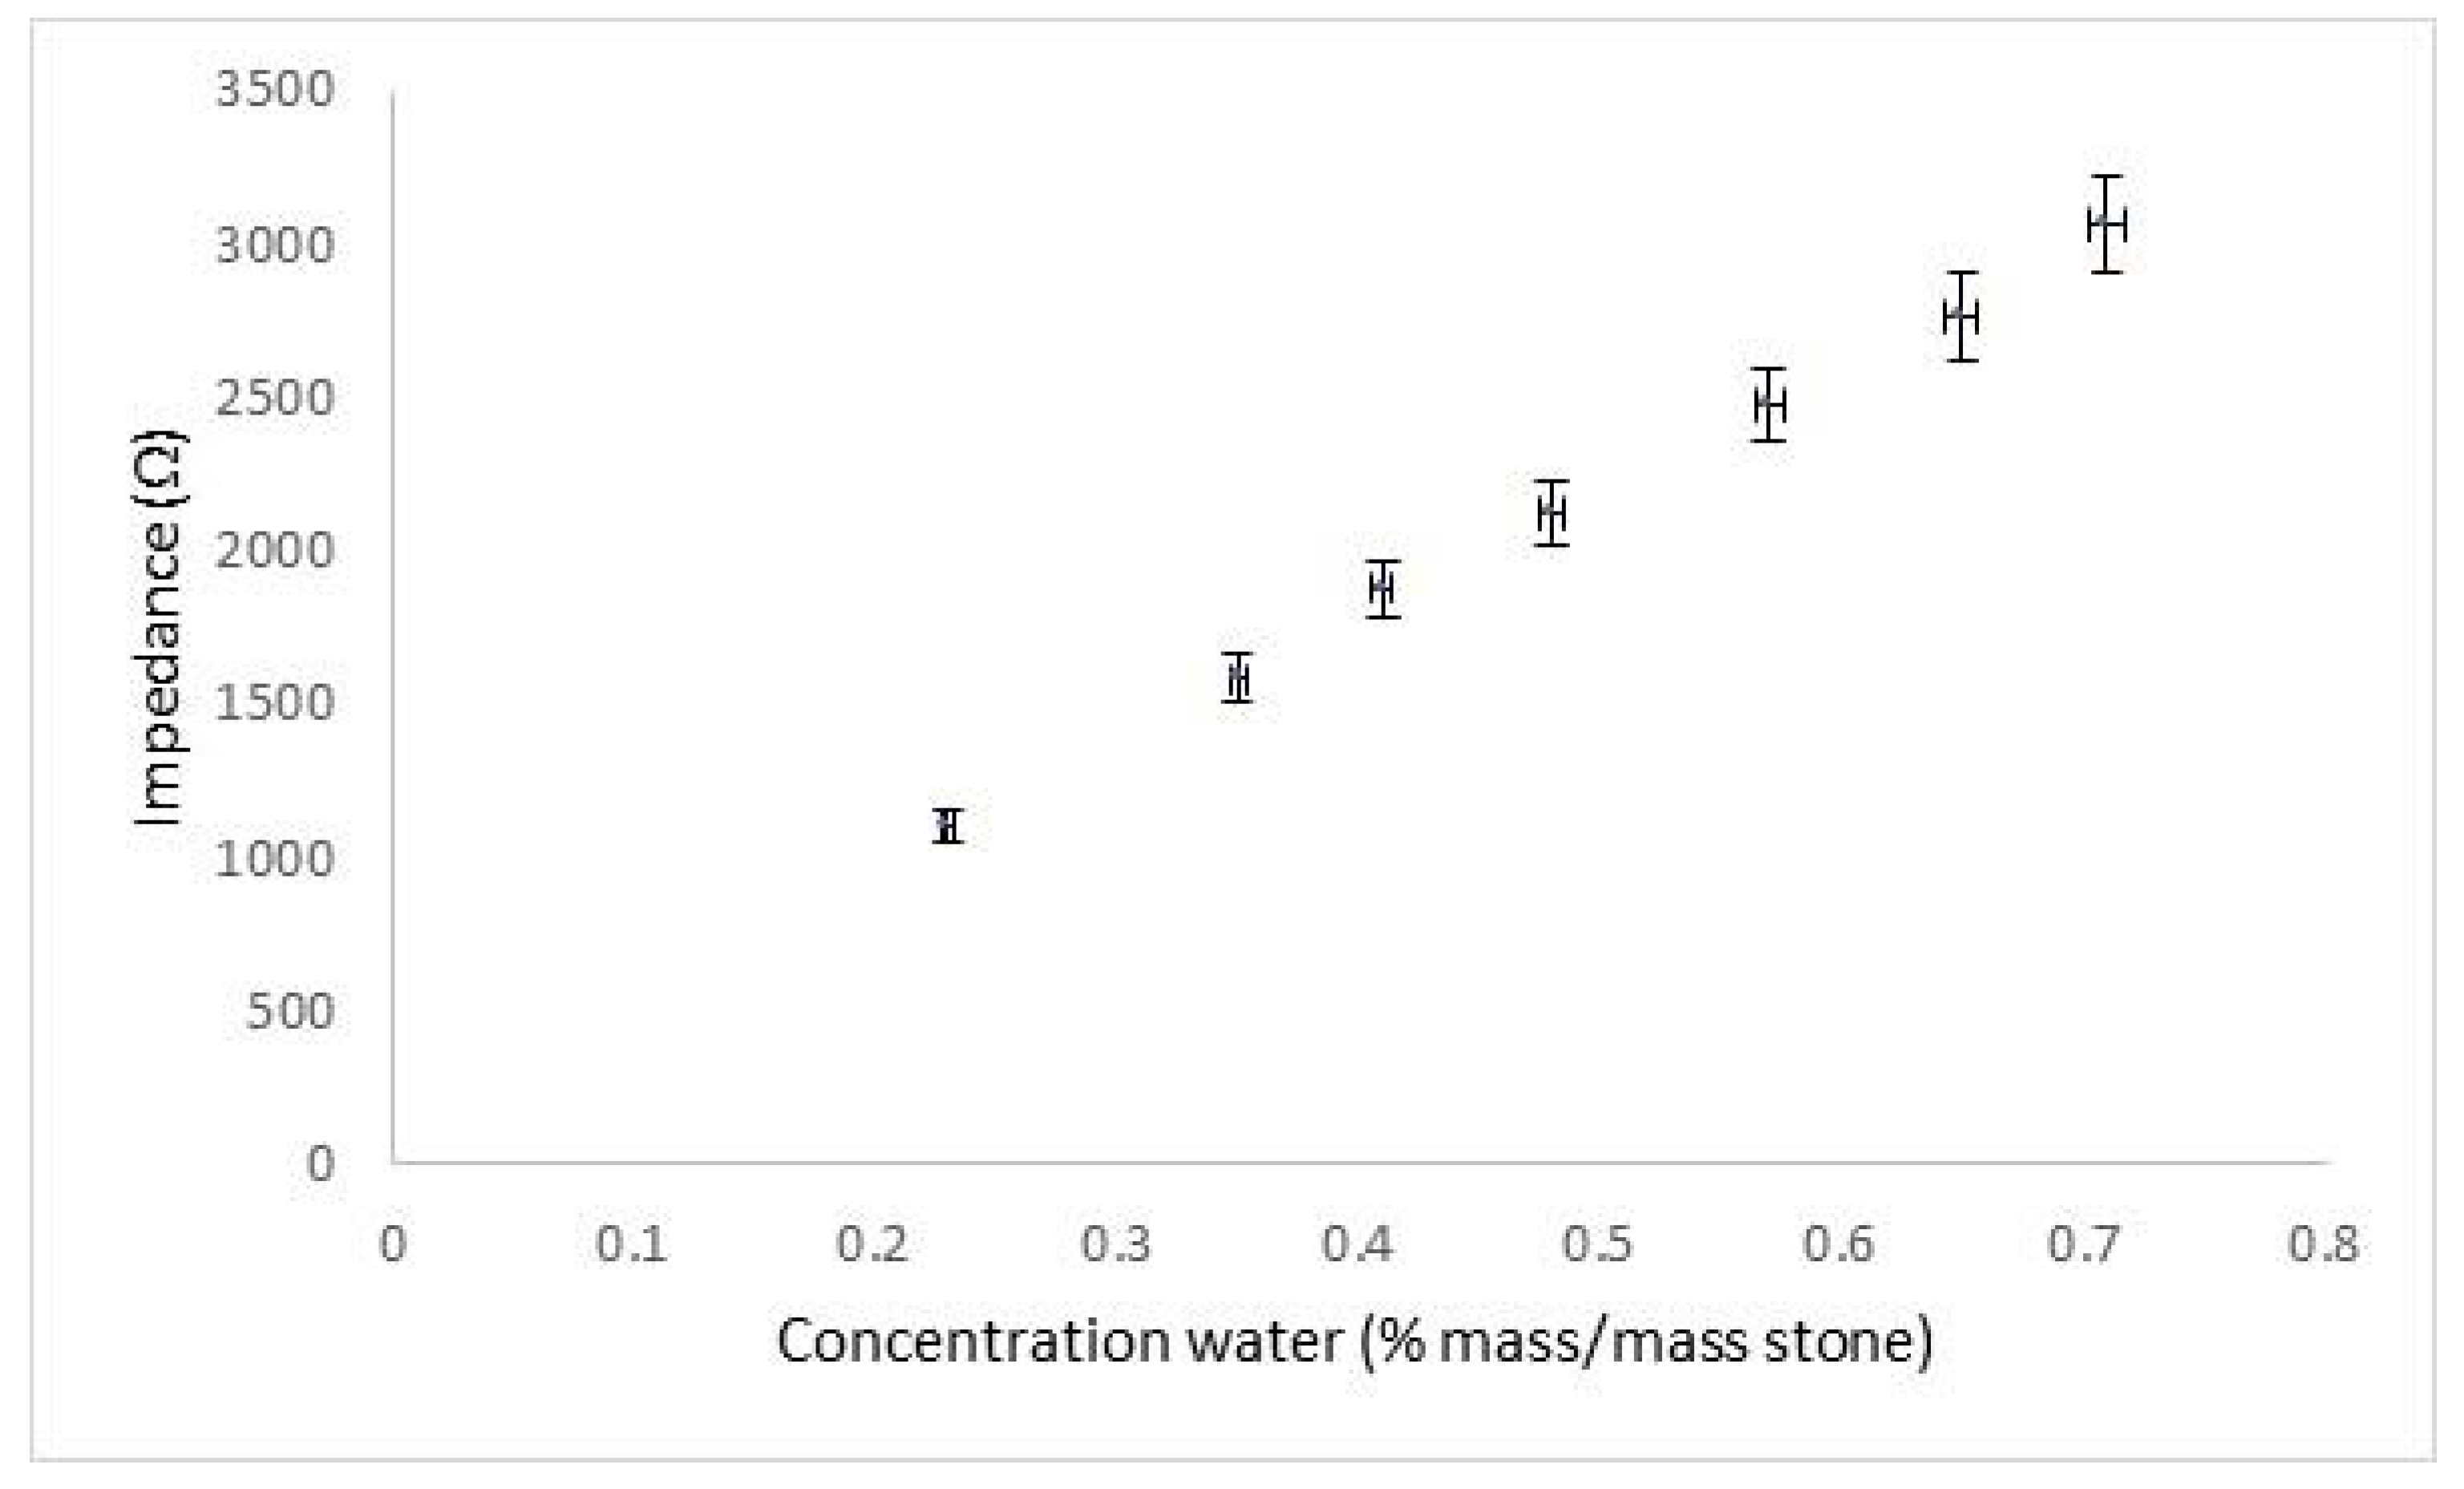
The water calibration for impedance between 1 cm separated electrodes is shown in
Figure 1.
A good linear response was recorded, with detection down to 0.23%, as defined by ISO 11929 [
27]. Whilst lower concentrations of liquid water would not be detected by the system, this value was considered sufficient to determine the waterfront from poulticing.
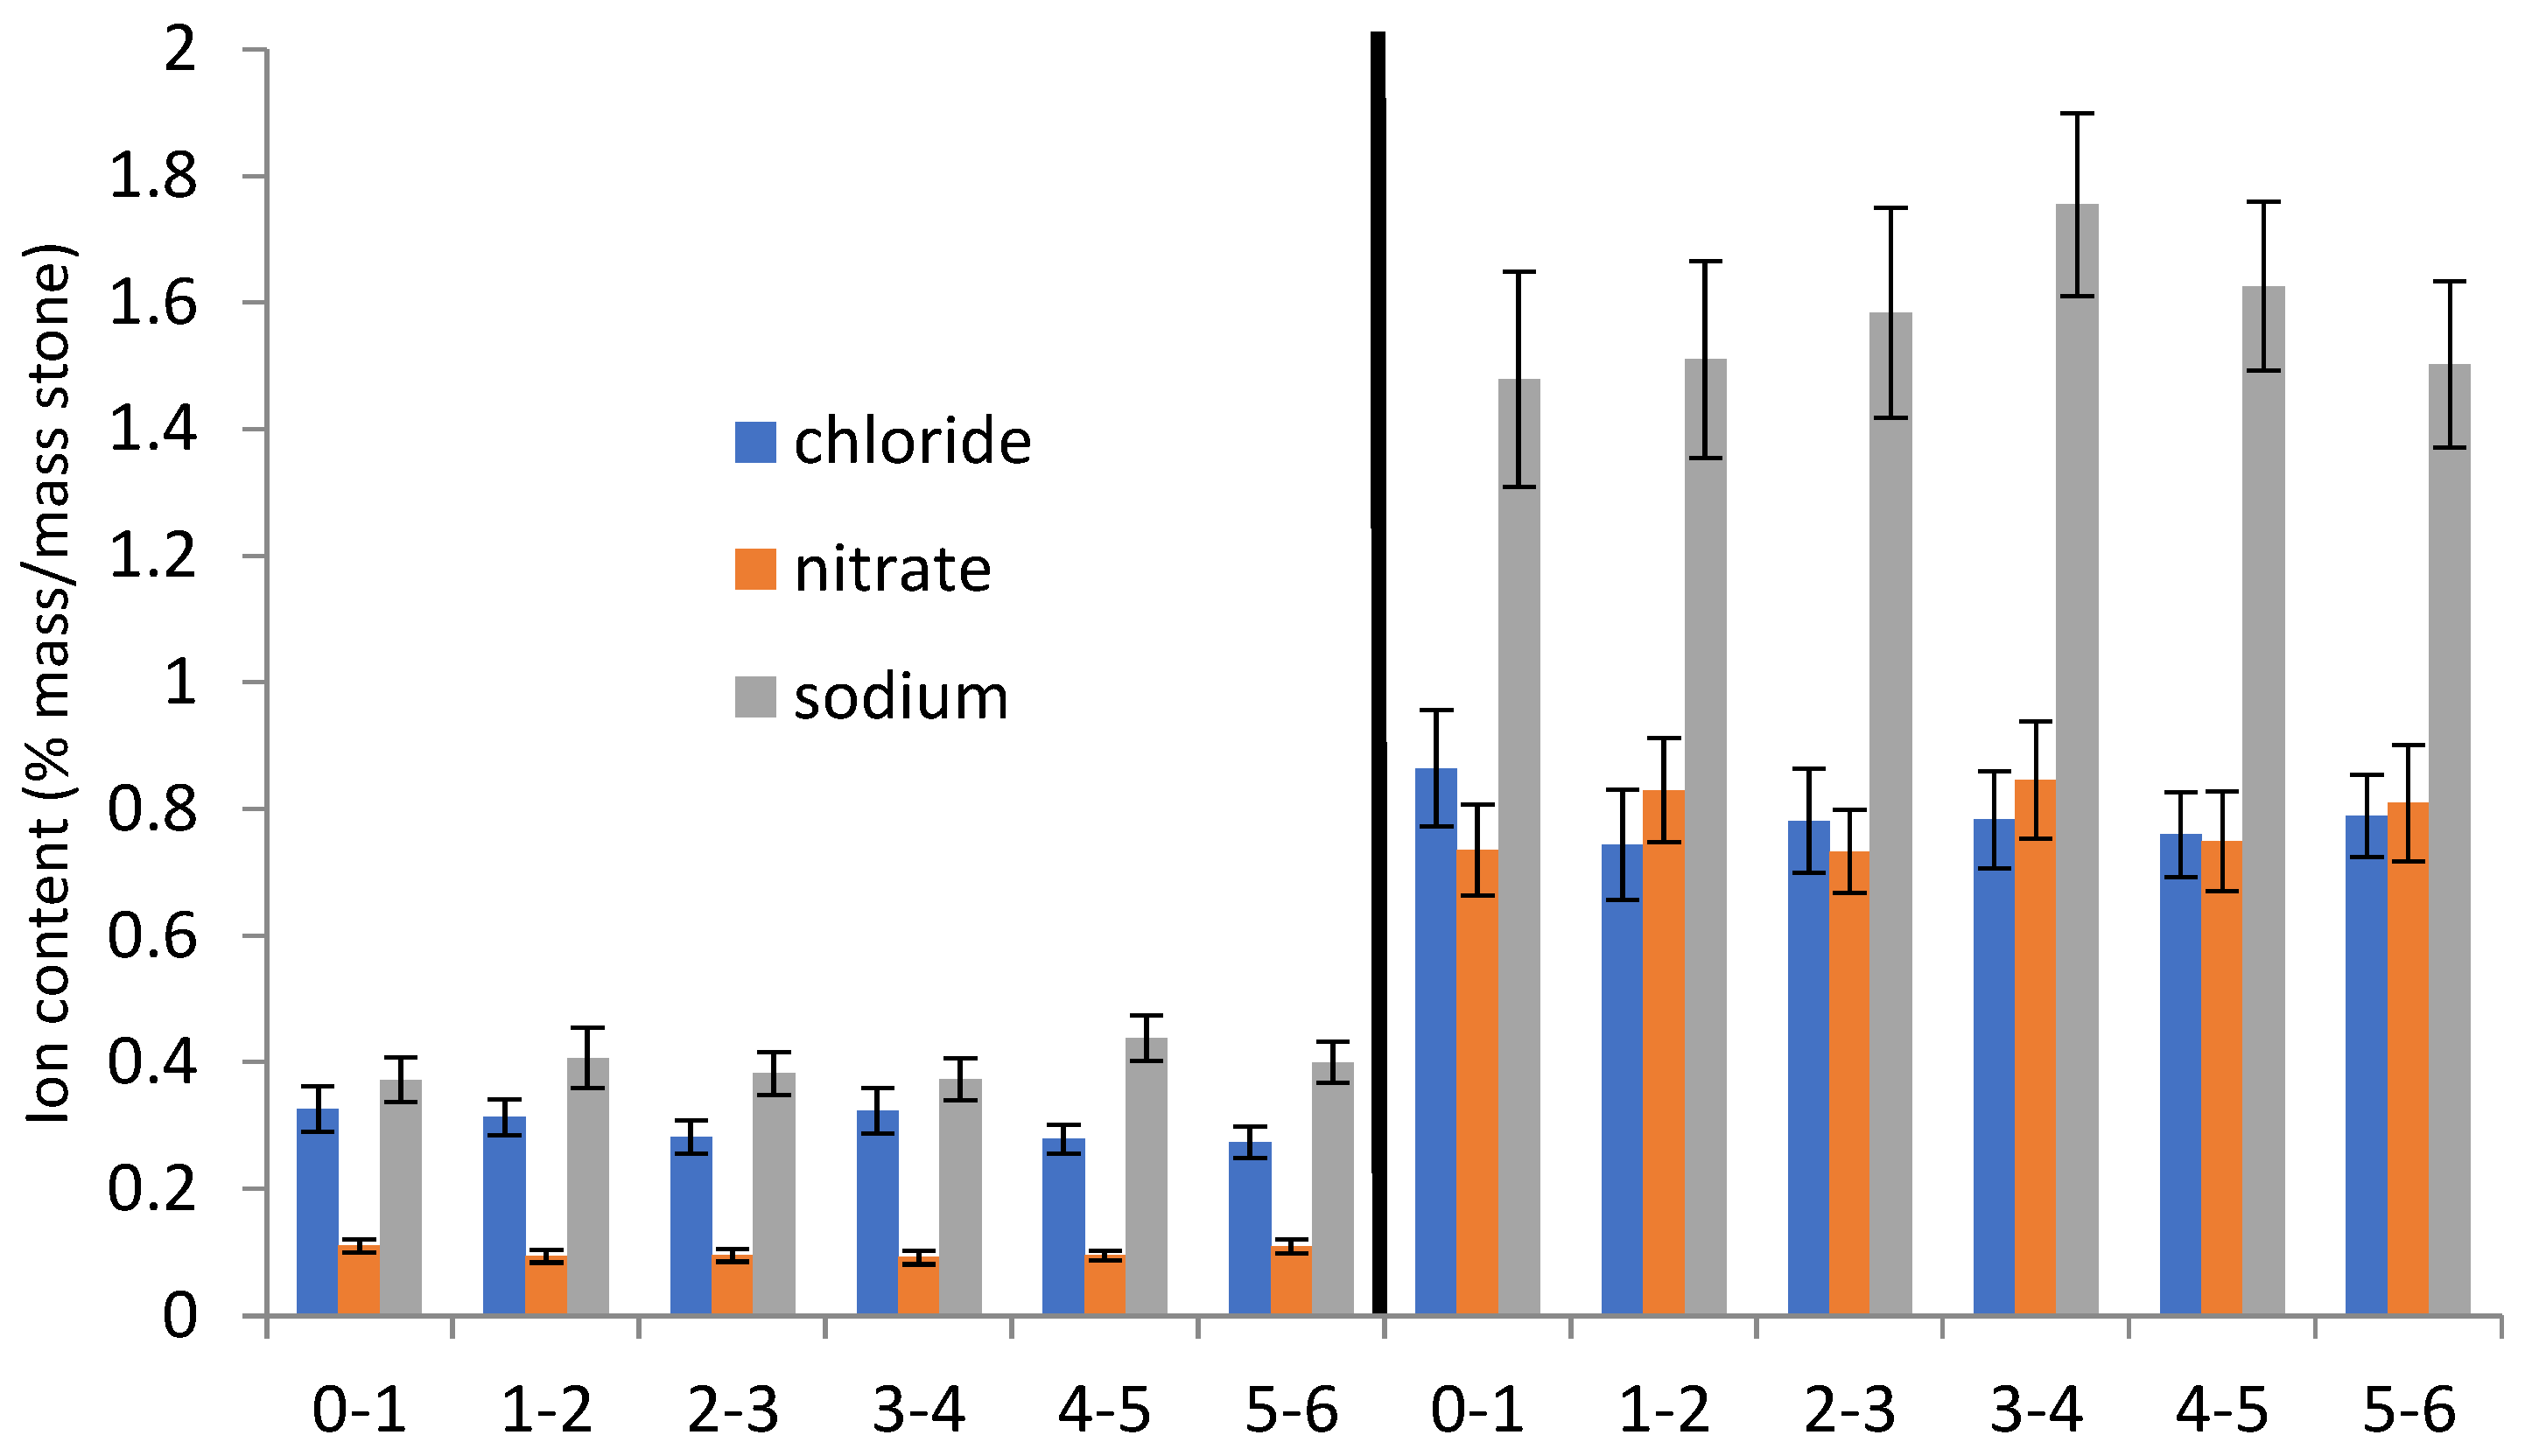
The initial analysed salt contents at different depths are shown in
Figure 2 and
Figure 3.
Figure 3 shows results considered to be representative of the whole large data set.
The stone impregnation appears to have been consistent, with less than 10% difference between the triplicate drillings.
The ratios of chloride:nitrate:sodium for the initial 2 cm of the stone drillings and the solutions extracted from the poultices are shown in
Table 2, with nitrate or chloride set to 1.
The sodium, chloride, and nitrate in the poultices show very similar ratios to those from the drilled samples down to 2 cm depth. This indicates that this method can be used as an alternative to the conventional detection method based on drilling and ion chromatography.
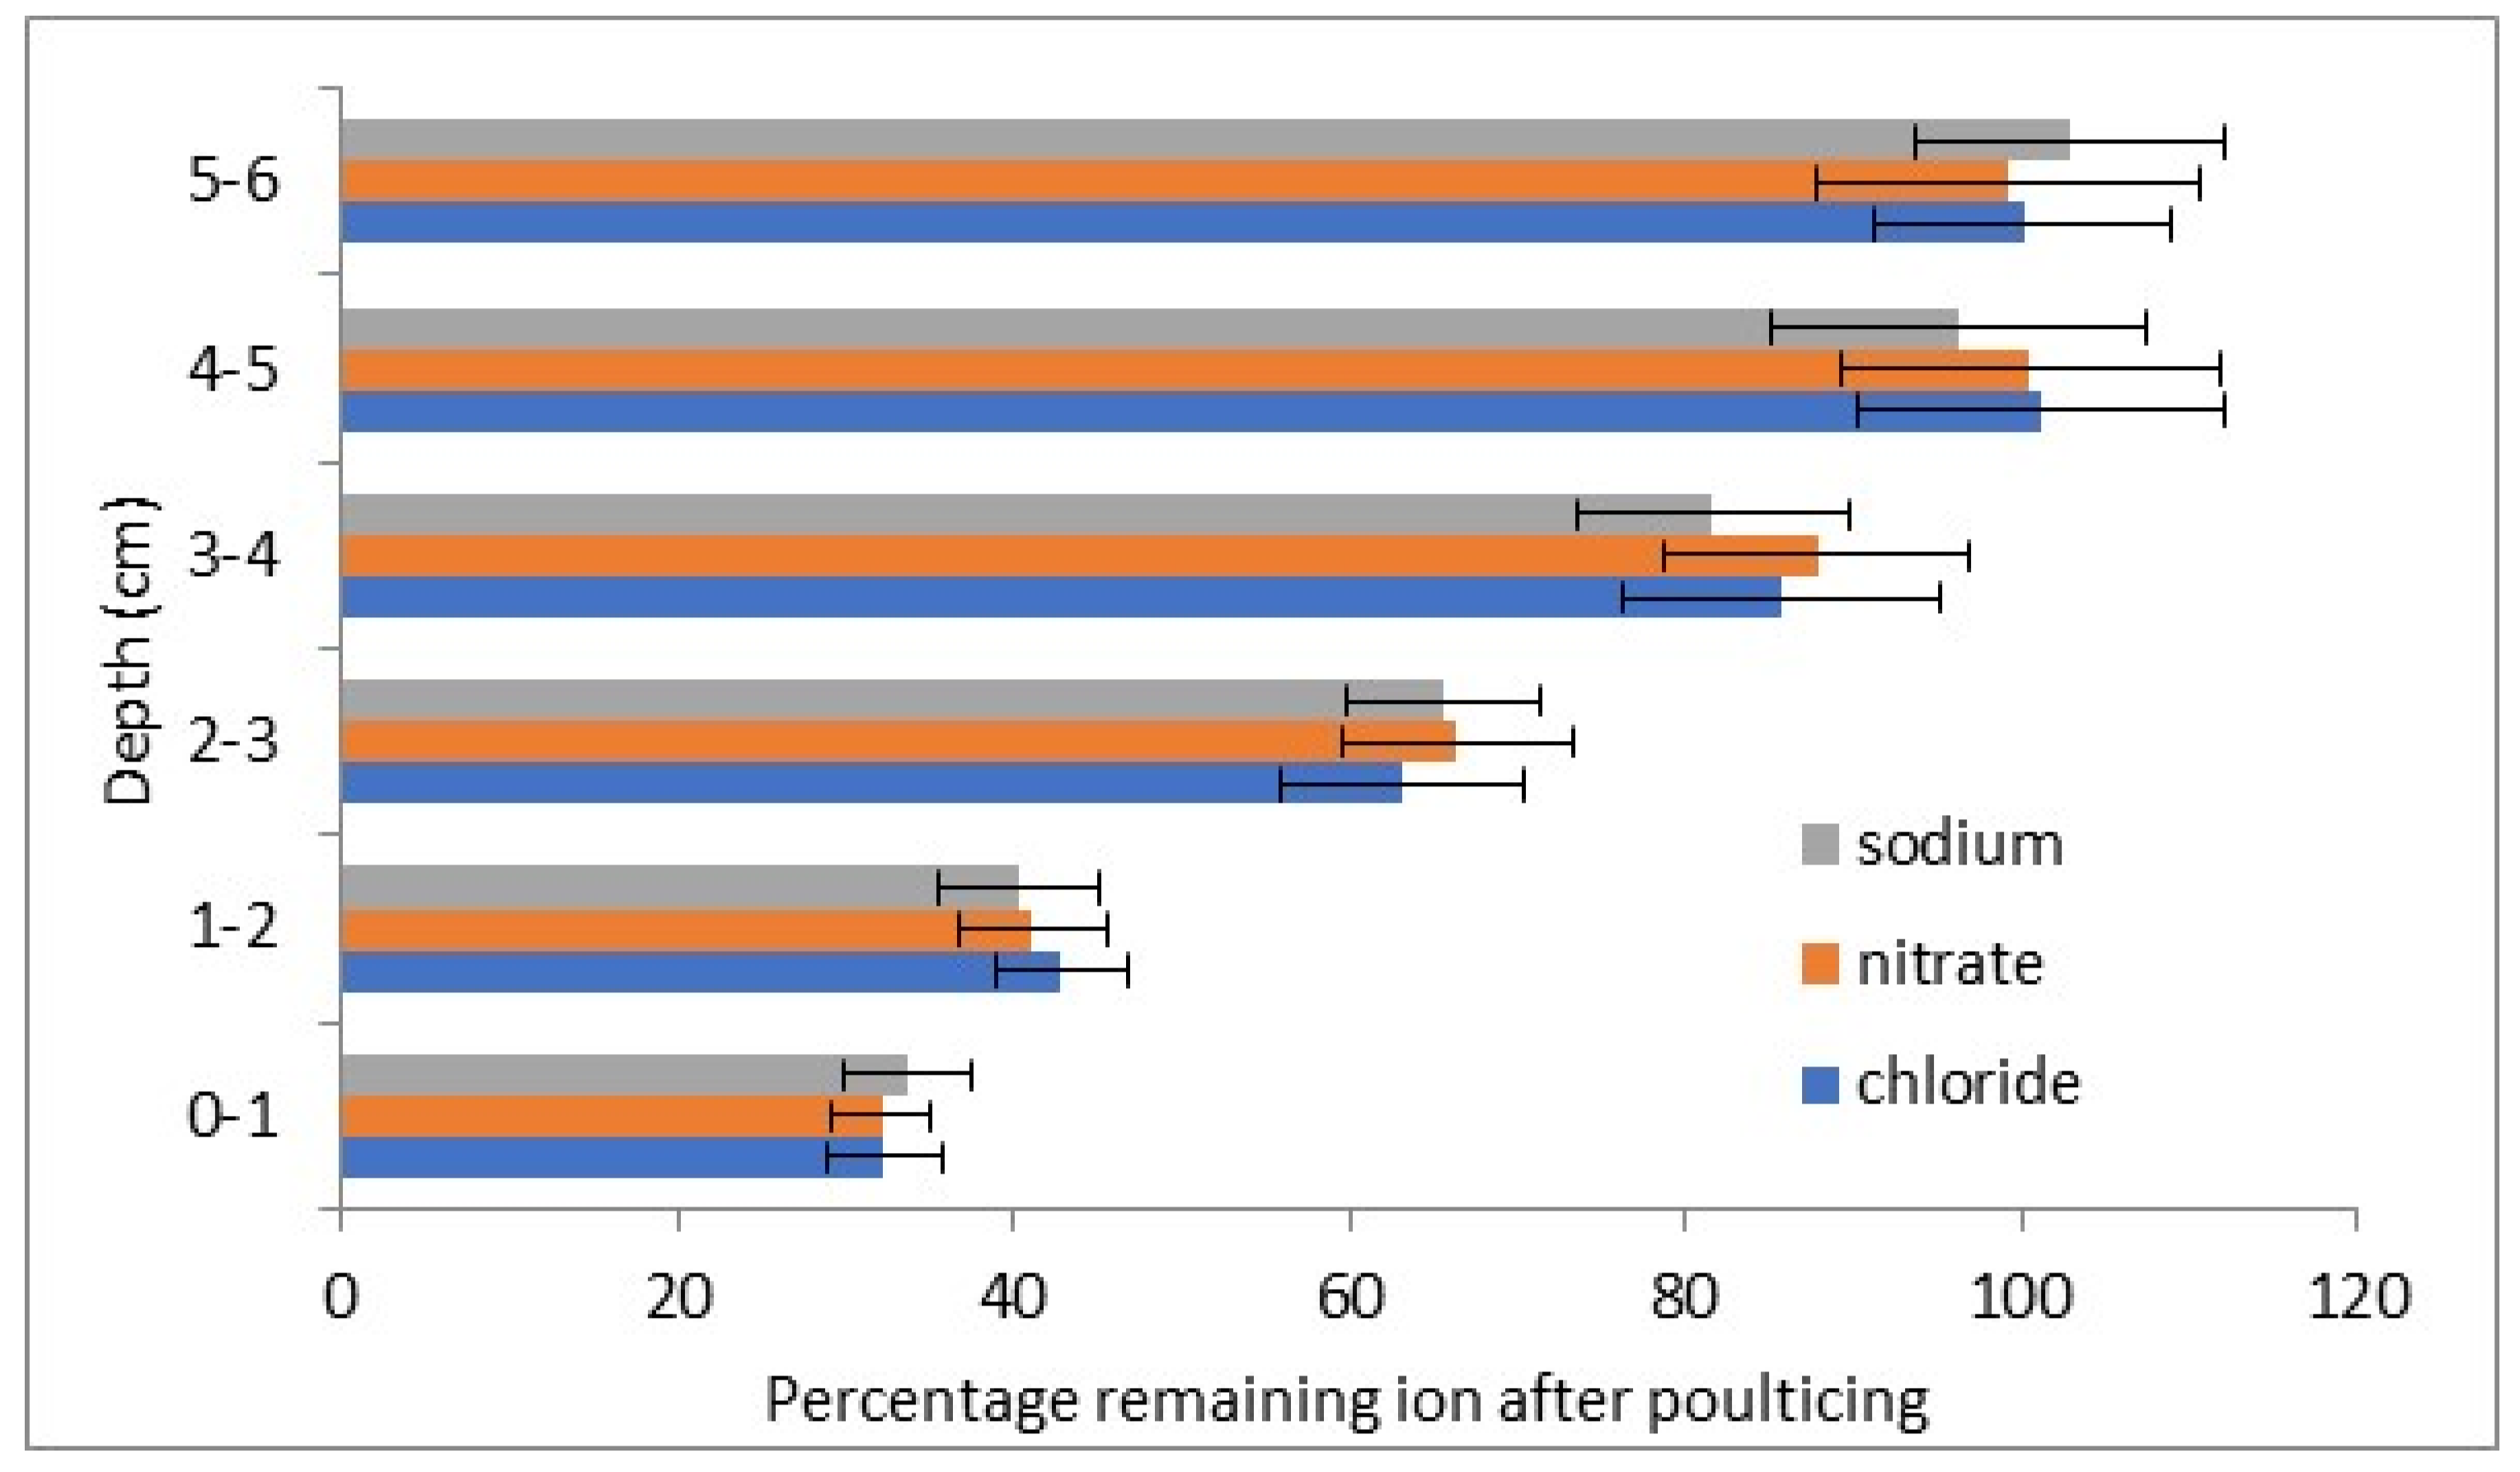
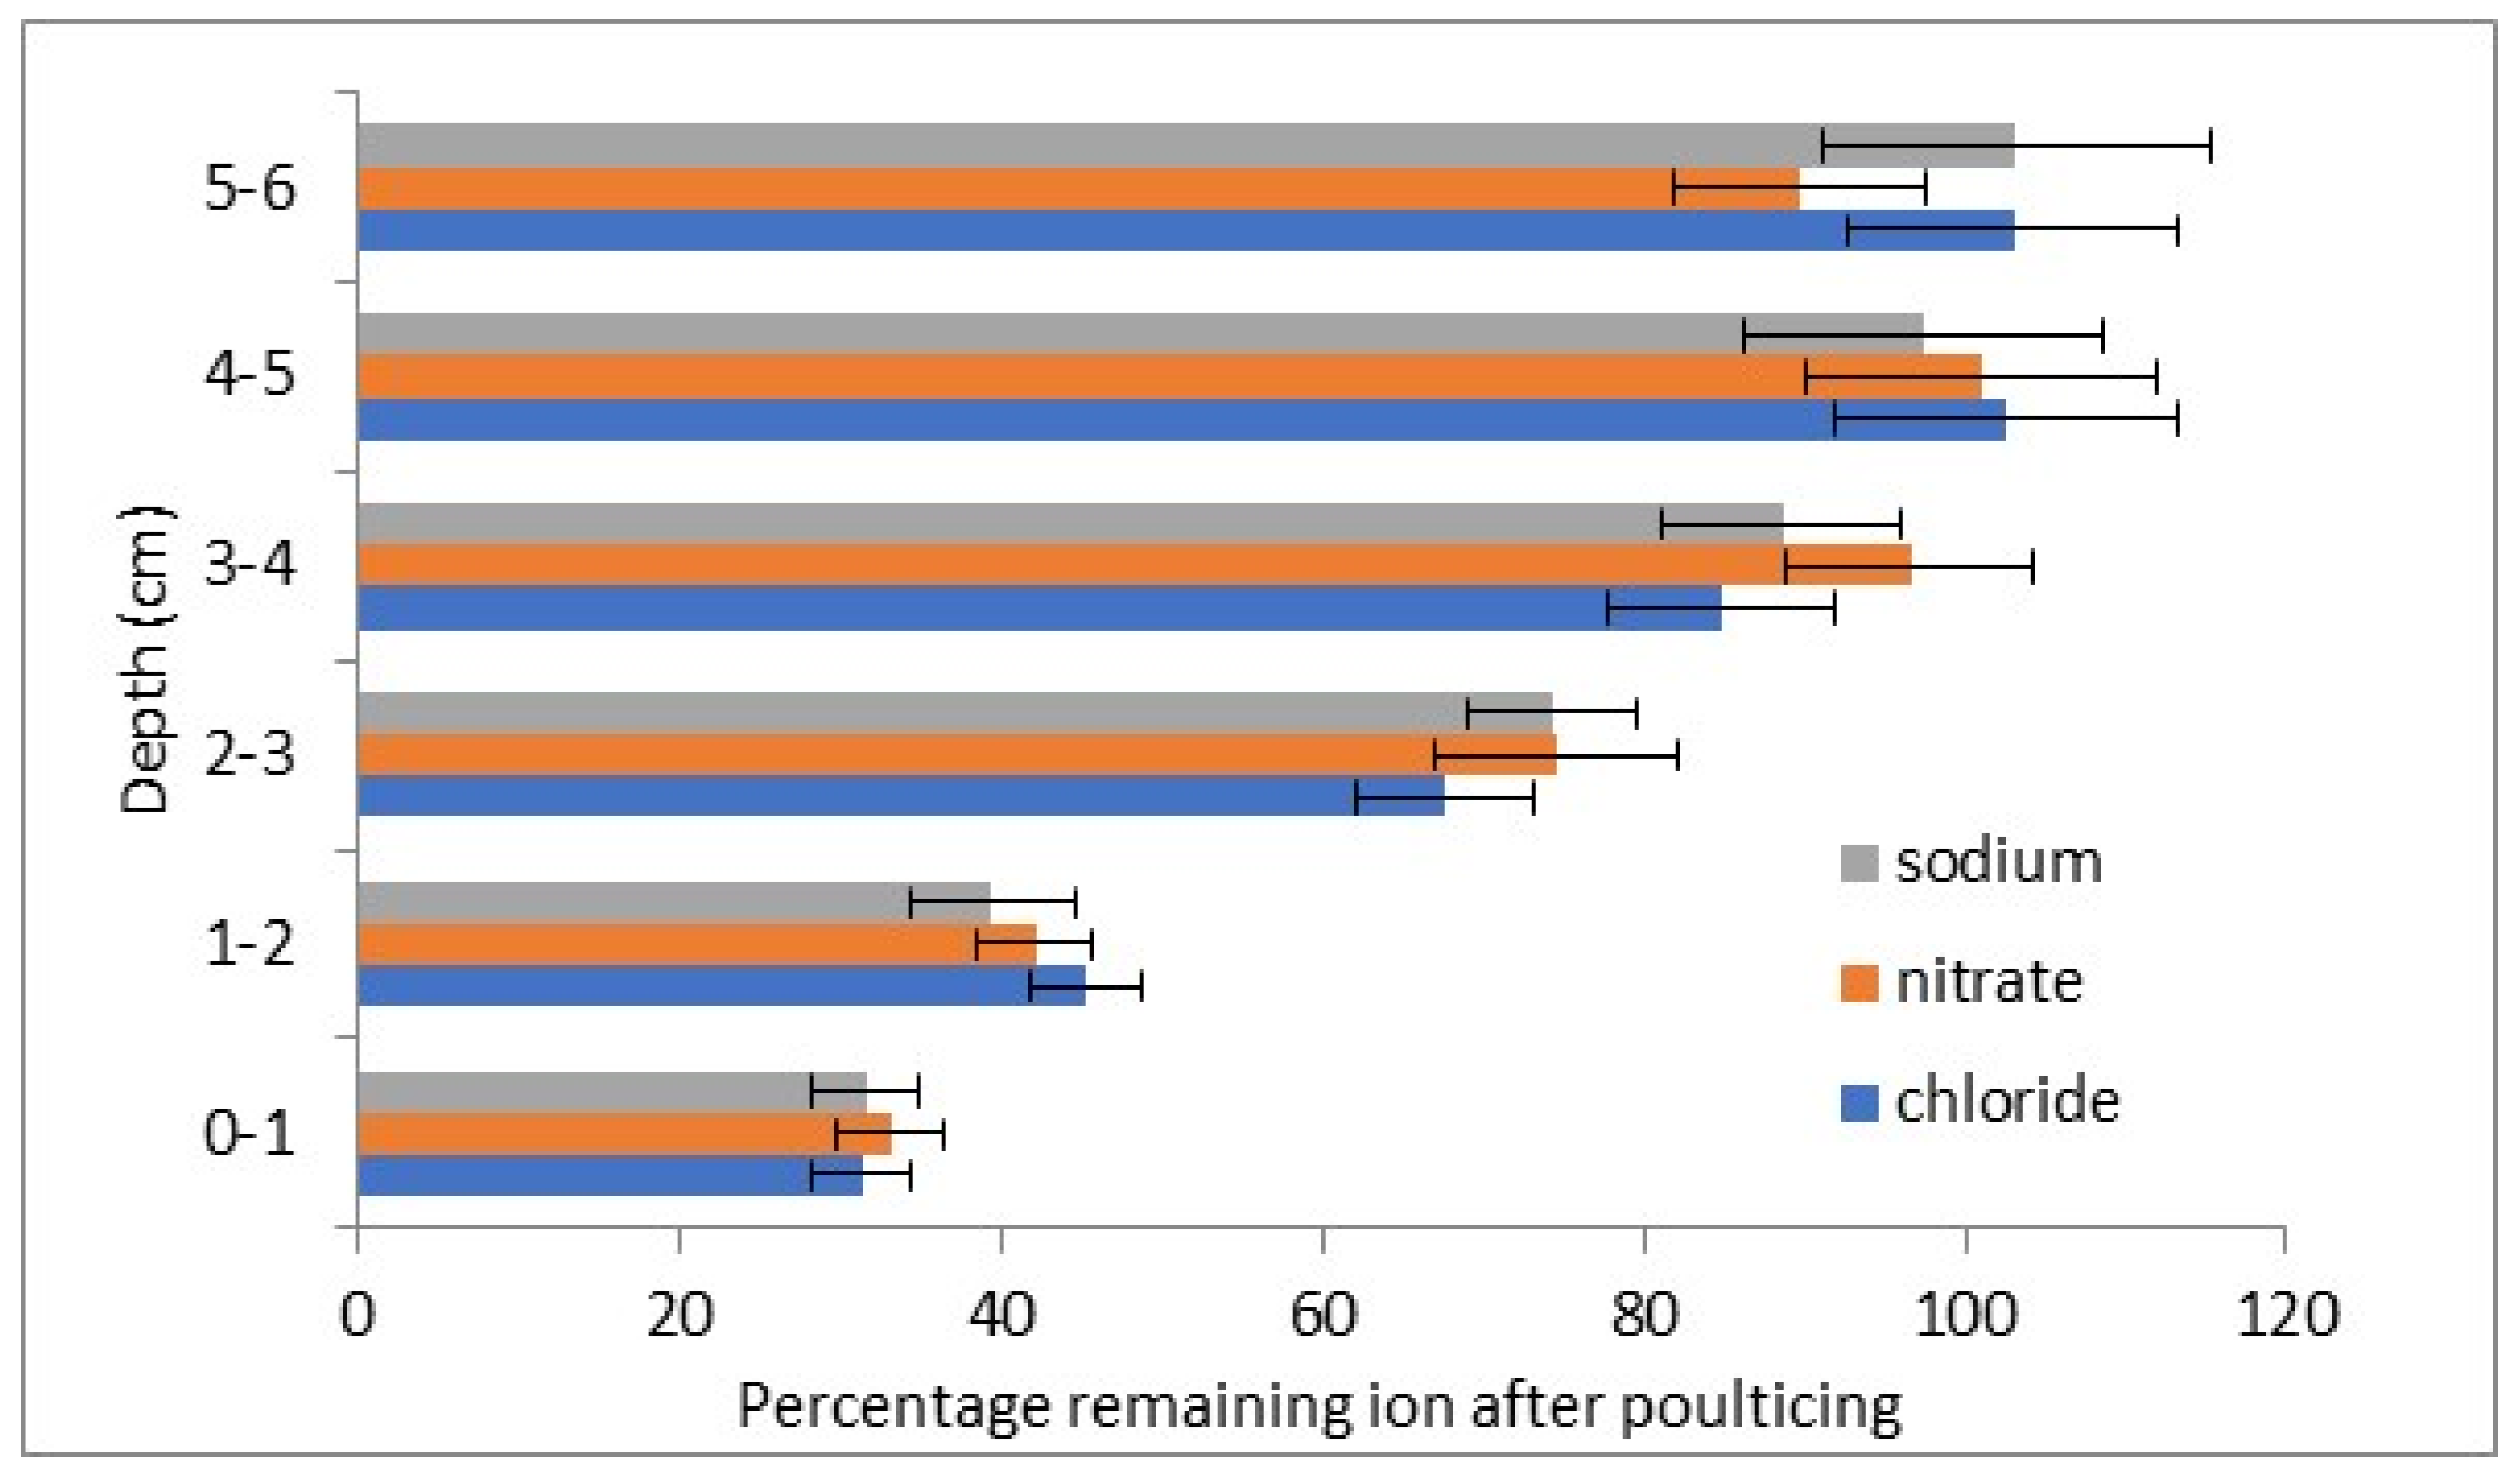
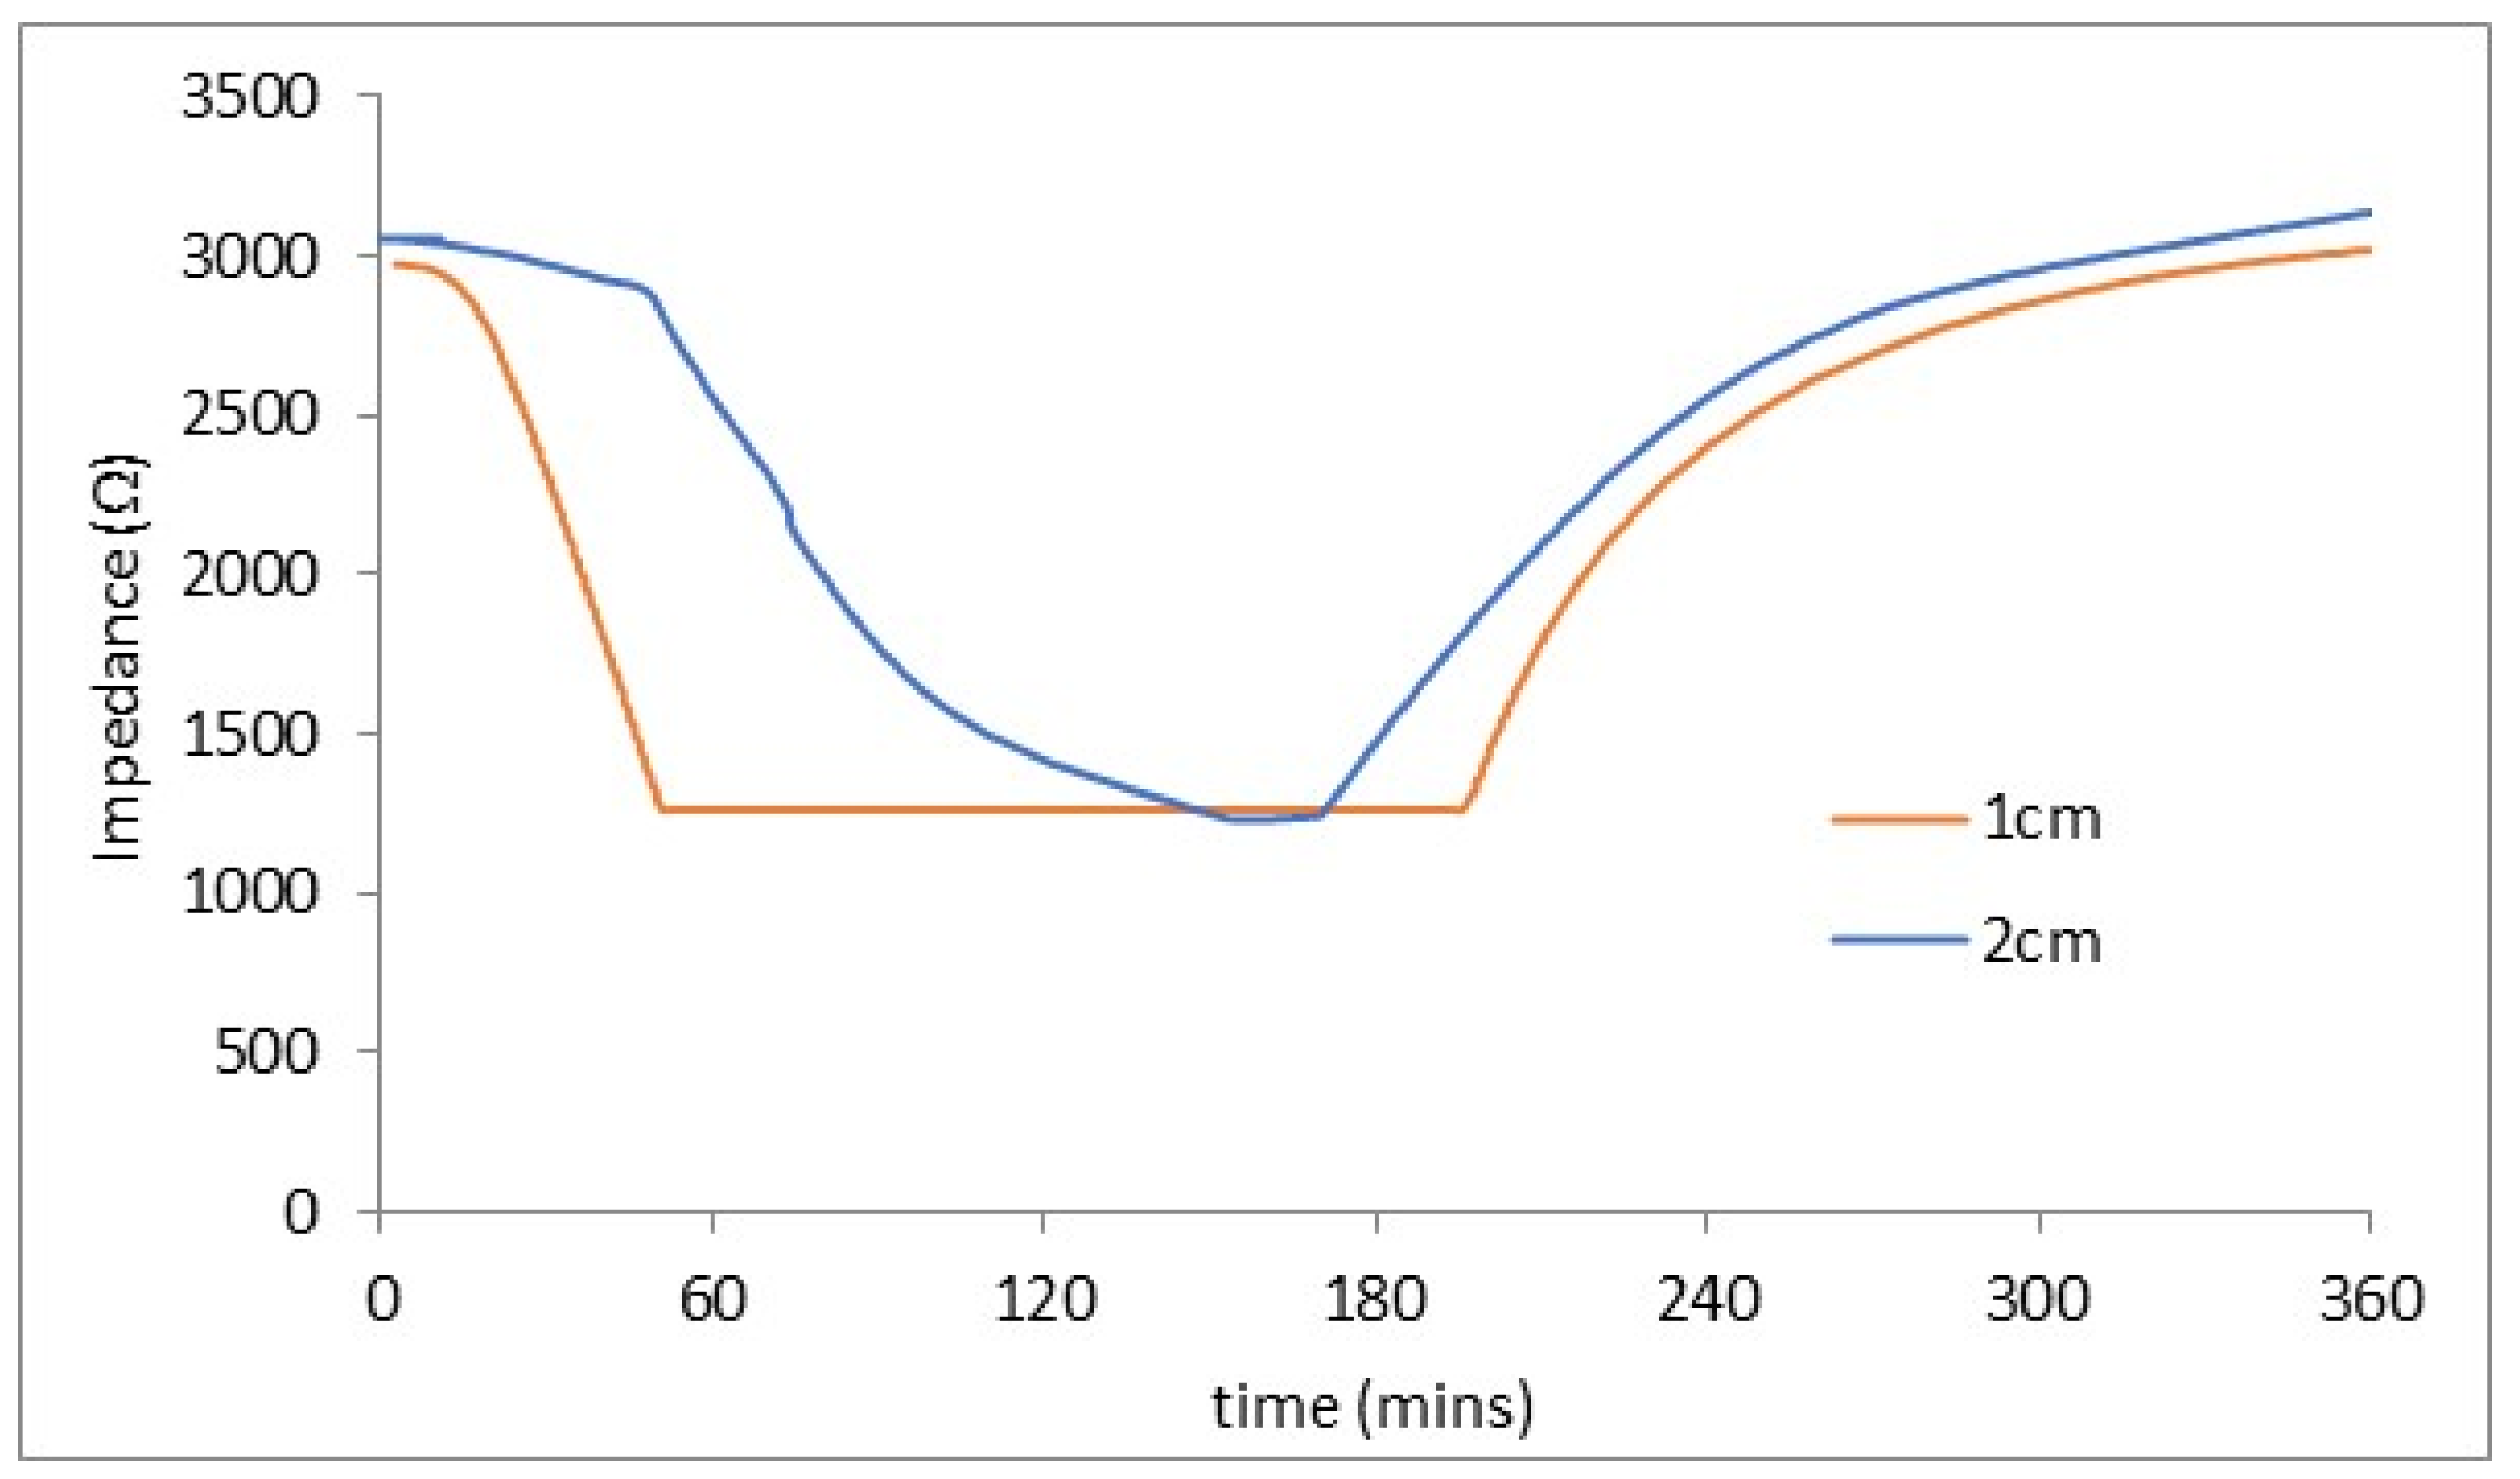
Figure 4 and
Figure 5 show the depth distribution of two representative stone blocks after poulticing.
The salt concentrations from the subsequent drillings show reduced levels at 3 cm depth (positive t tests with 96–99% certainty) and likely also at 4 cm (positive t tests with 89–93% certainty). No reductions in salt concentrations at 5 and 6 cm were observed.
Figure 6 shows the electrode impedance results from representative stone C.
The embedded electrodes indicated liquid water had penetrated to a depth of 2 cm, but none was detected at a 3 cm depth.
The poultices appear to have removed a substantial portion of the salt from the surface 2 cm of the stone. The ion balances appear to have been retained with the system investigated. This is important as thermodynamic modelling, ECOS, uses these values to determine the stable and unstable temperature and RH regions for the salt mixture present. The ECOS sensitivity analysis showed the variation in values from the two techniques led to the upper RH stability value increasing from 68 to 70%. For the salt mixture tested, temperature has little effect. This RH variation is within the instrumental error of many hygrometers used to monitor heritage environments [
28]. Poulticing appears sufficiently representative of the salts present to allow ECOS calculations to assess suitable environments. Uncertainty as to the information depth means the conversion from ion concentration per area to per volume is unpredictable. Whilst the results are likely to allow gross-scale calculations of stability, this uncertainty would mean results near the boundaries between stable and unstable would need to be confirmed with drilled samples. However, a significant portion of stones and tablets could be successfully analysed this way.
3.2. Non-Invasive Salt Measurements
The microwave moisture meter recorded water at 3.0 cm, but not a 3.5 cm calcite depth. The protimeter moisture meter recorded water at 2.5, but not a 3.0 cm calcite depth. There was no effect of the different pore structures examined. These values agree well with those quoted by the manufacturer of the microwave moisture meter. The measured protimeter depth is a little deeper than that in the manufacturer’s literature, 19 mm. It is uncertain exactly what level of detection and what situations this refers to.
The difference in apparent water content between the microwave and dielectric moisture meter plotted against the measured conductivity of the test solutions is shown in
Figure 6.
The difference in value gives an indication of salt concentration. This method will only work when the salts are in solution.
The differences are plotted against the measured conductivity in
Figure 7.
A good linear relationship was observed. It is extremely difficult to produce samples with known water contents to assess errors in moisture content with these two techniques. Differences in conductivity of 2.3 mS/cm were clearly distinguishable, and the conductivity error is expected to be below 0.05 mS/cm from the weighing errors in preparing solutions.
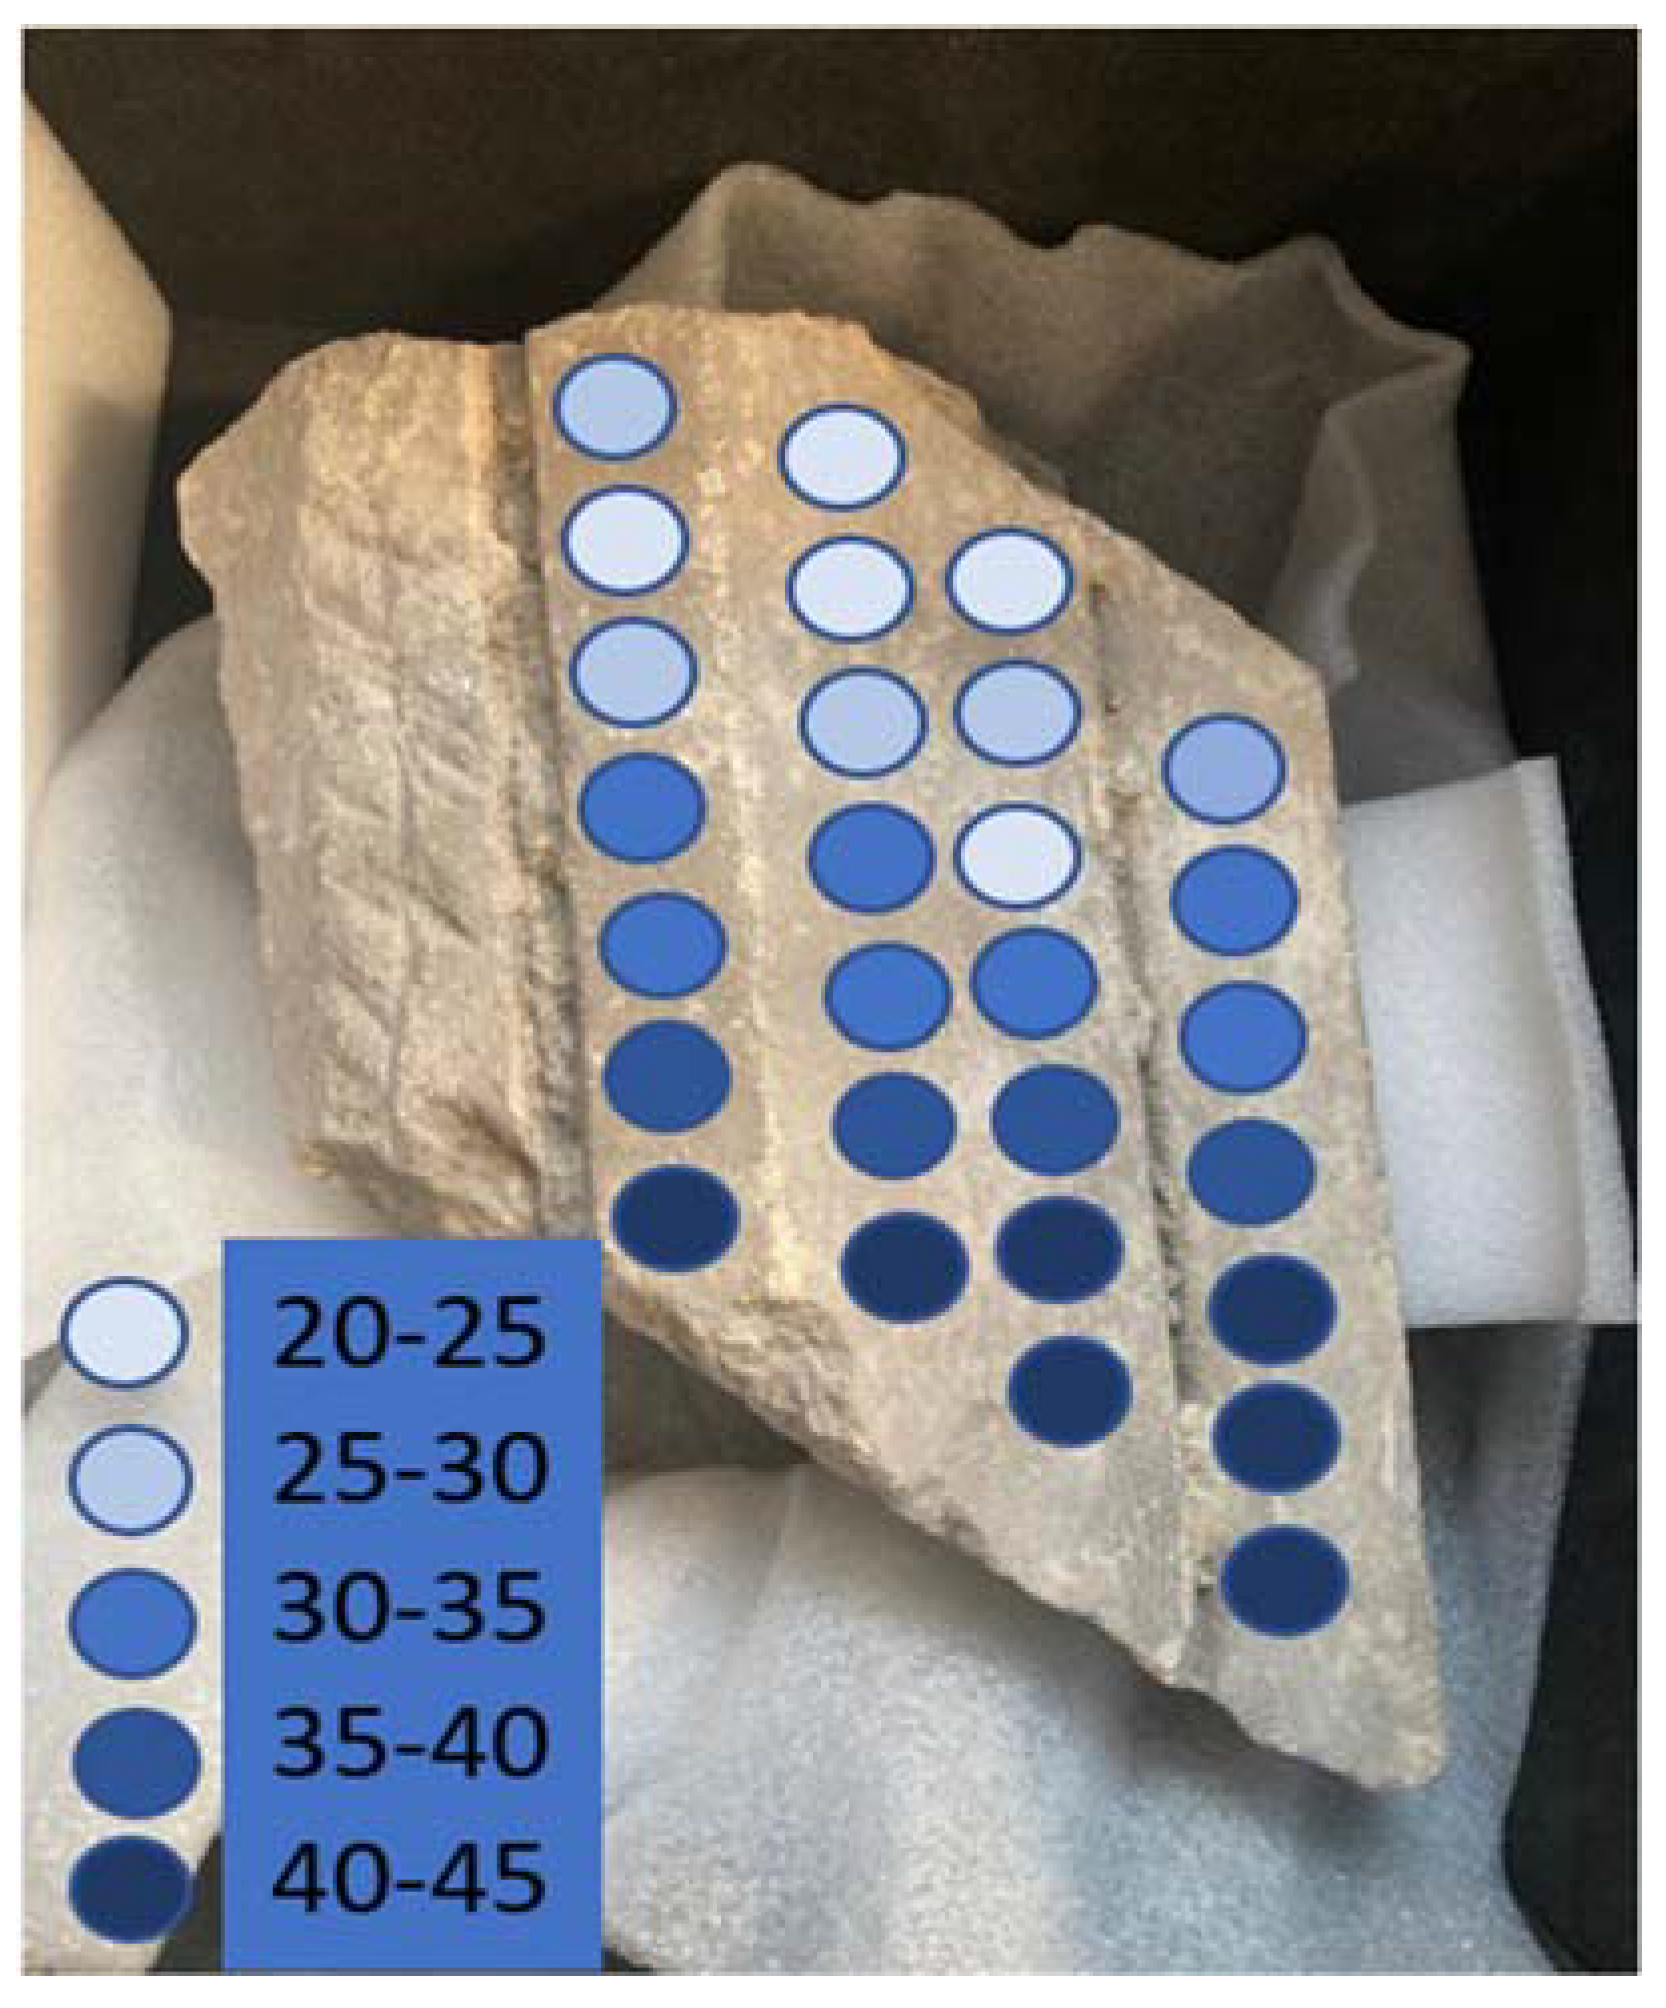
The result of mapping of the Thetford tombs fragment is shown in
Figure 8.
3.3. Mixed Acetate Salts on Cuneiform Tablets
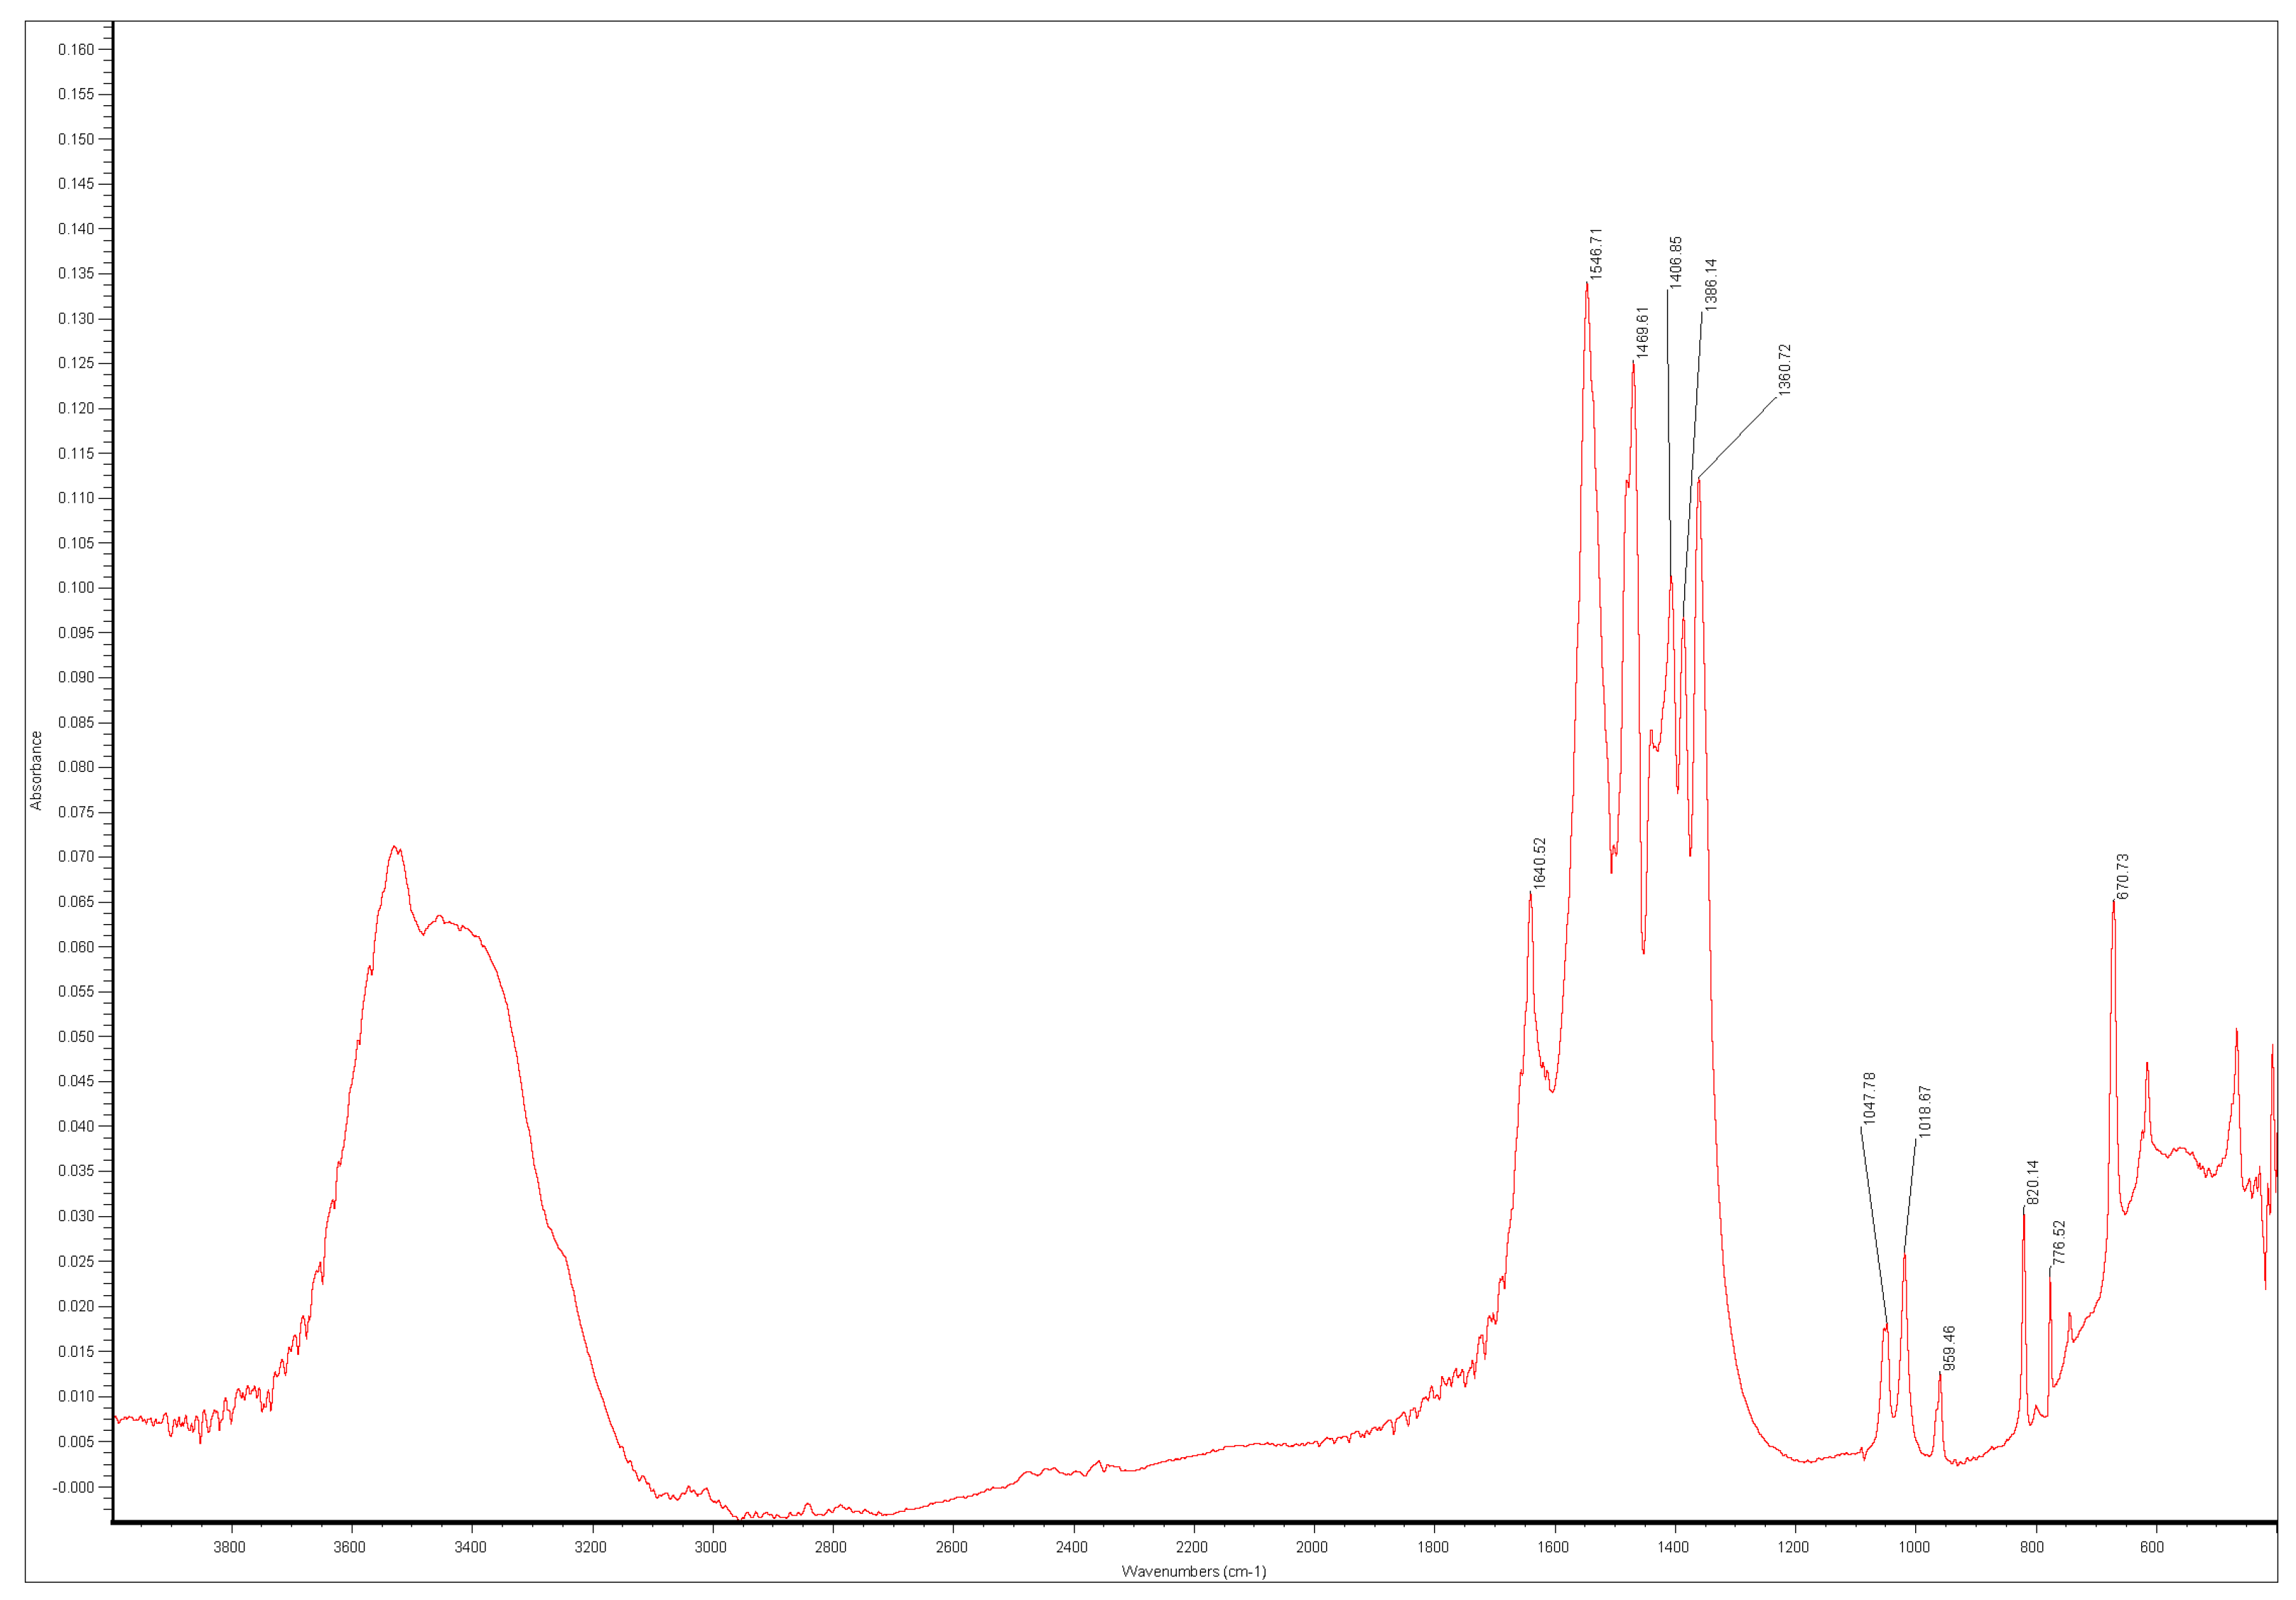
The FTIR spectrum of one of the salt crystals is shown in
Figure 9.
The spectrum is a reasonable match for that of thecotricite published by Eggert [
22], but the absorption bands at 1547 cm
−1 and 777 cm
−1 are at higher wavenumbers (cf 1530 and 743). All 280 spectra showed similar shifts. Twenty samples were removed and analysed with the diamond ATR for comparison with Eggert’s analyses. This did not materially affect the peak positions. The removed samples were dissolved in water and analysed with ion chromatography. The ion ratios were within 5% of those expected [
22].
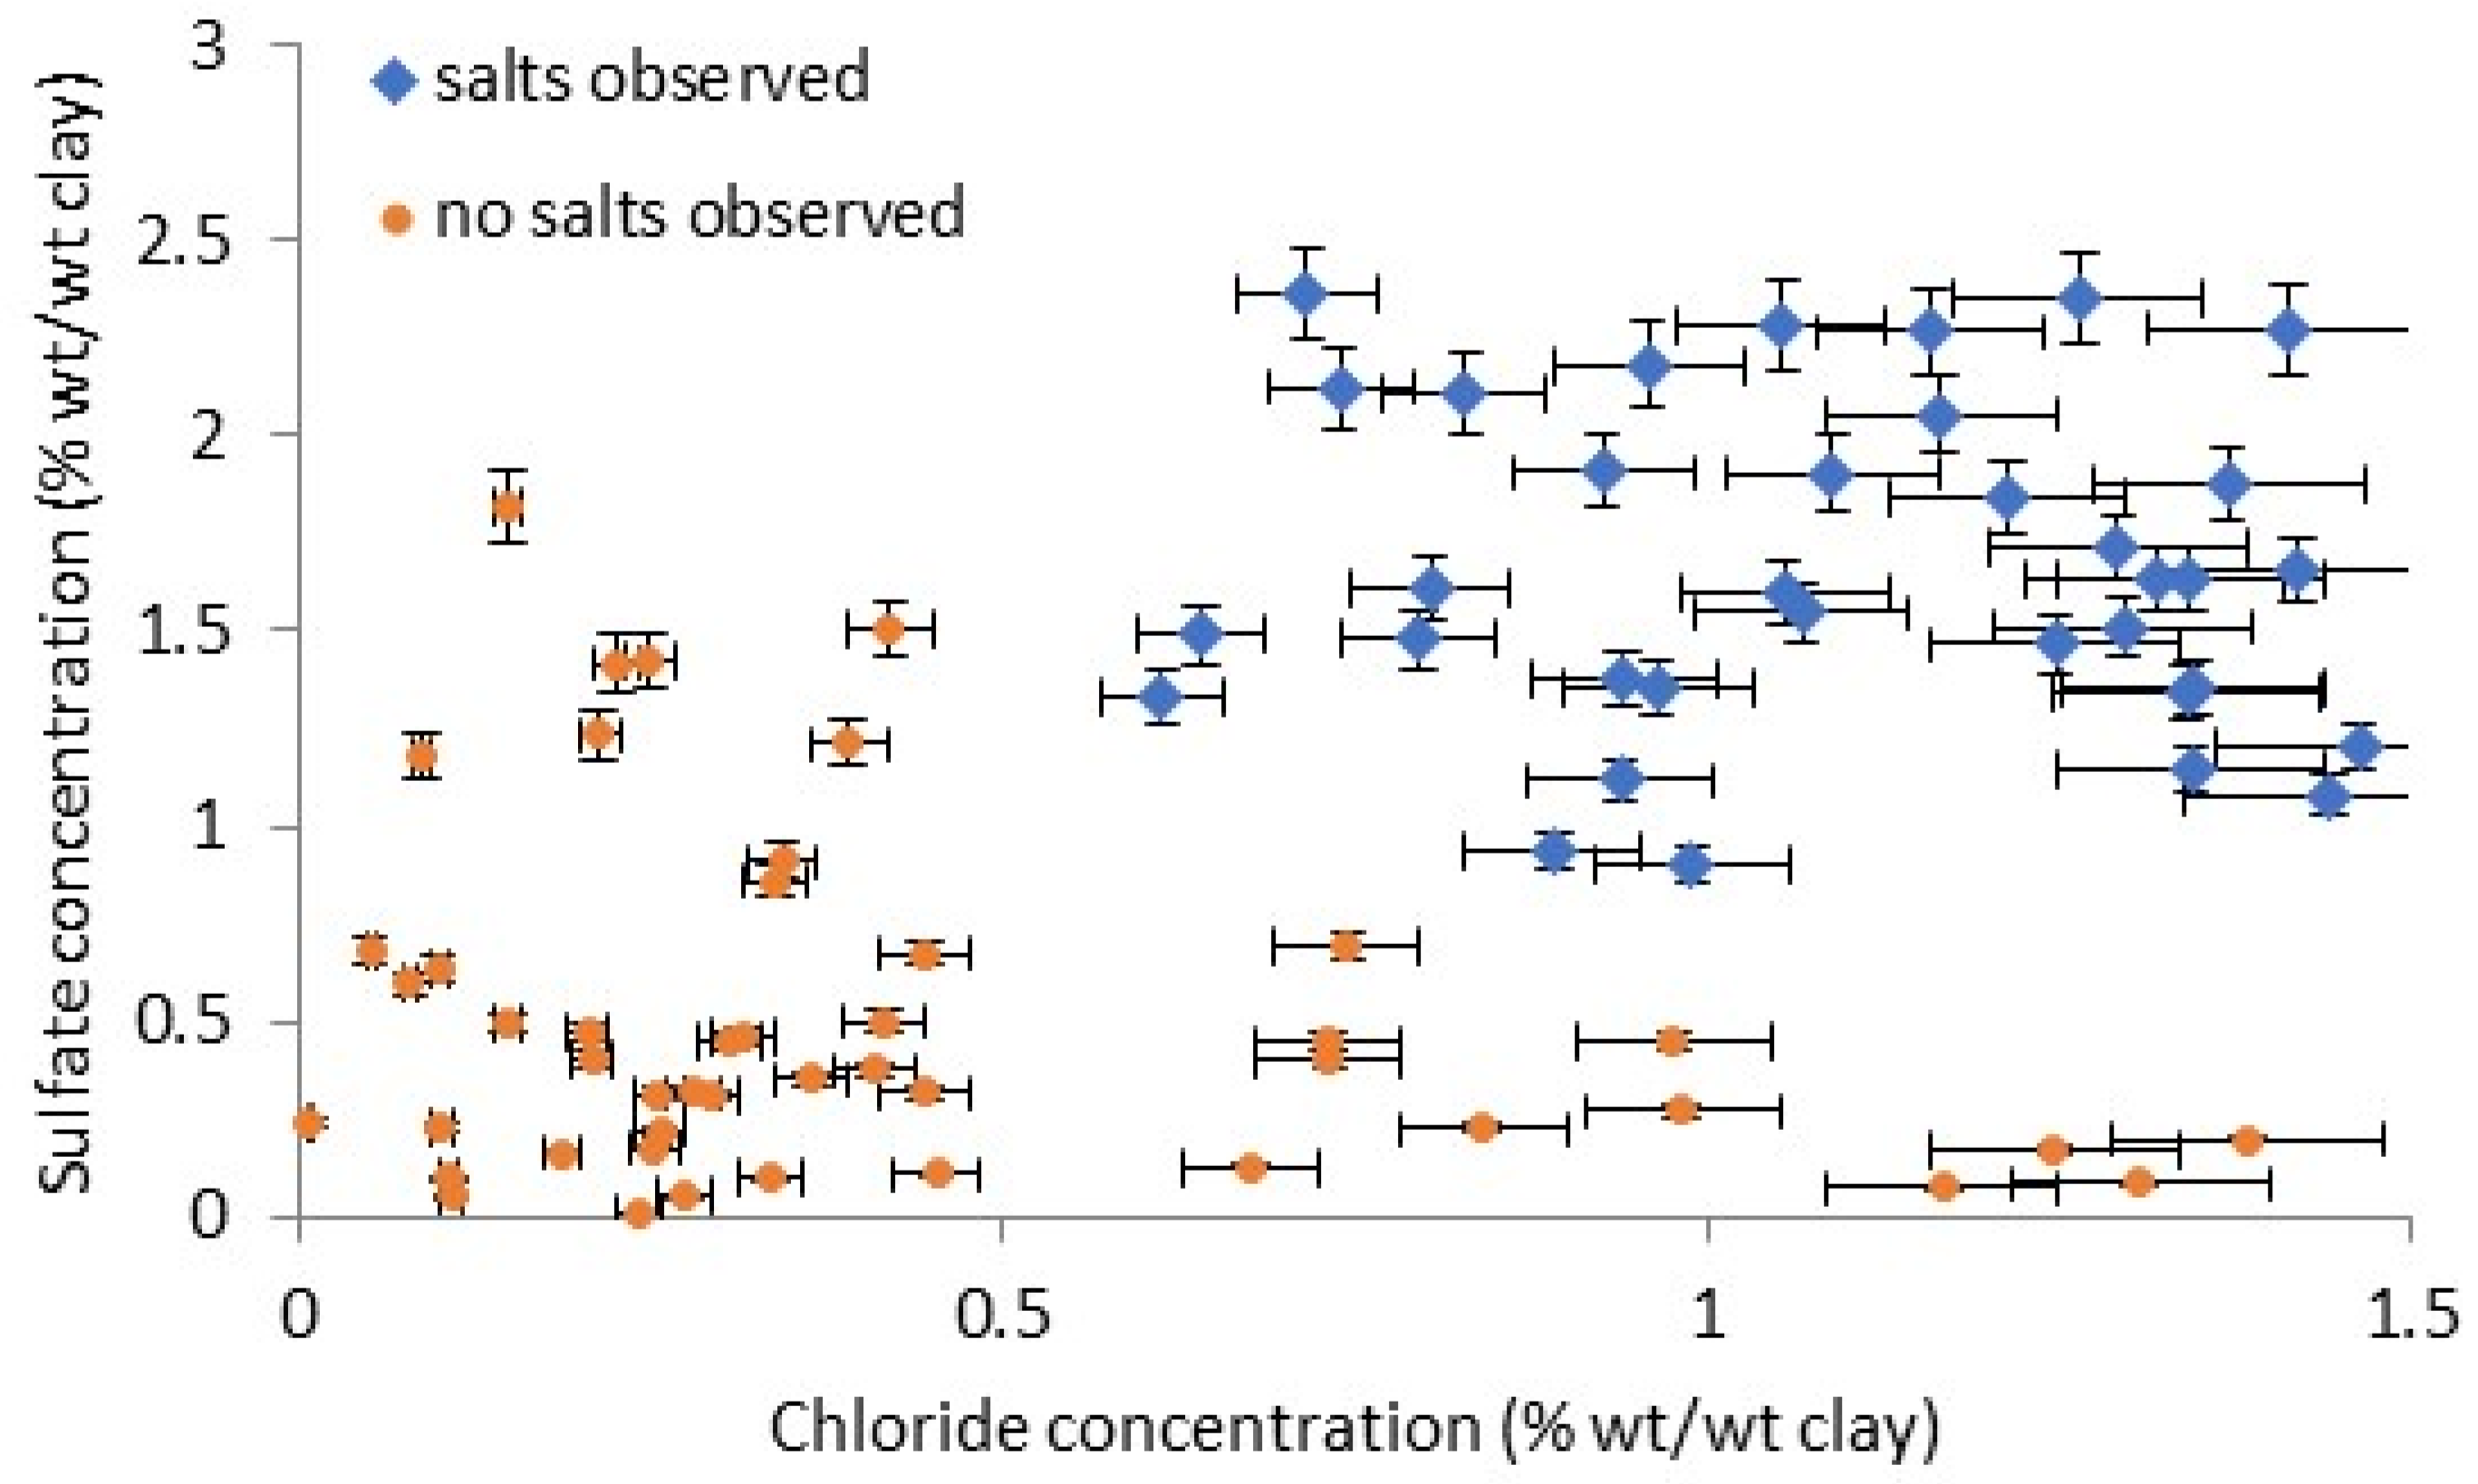
Various combinations of the salt ions present in the tablets were investigated to determine if any gave a good separation between the affected and unaffected tablets. Only chloride and sulphate were observed to achieve this. Nitrate, sodium, calcium, and some potassium were also present, but overlapped. The measured salt concentrations in the analysed cuneiform tablets as chloride versus sulphate are shown in
Figure 10. The vast majority of the cations, over 90%, were sodium.
There is a distinct separation of the tablets with and without observed efflorescence.
It should be noted that this relationship is empirical, and further analysis would be required to better define and indeed determine if it continues to hold for more analyses and if sharp barriers exist between the two sets of tablets.
3.4. Clay Analysis and Non-Invasive Analysis
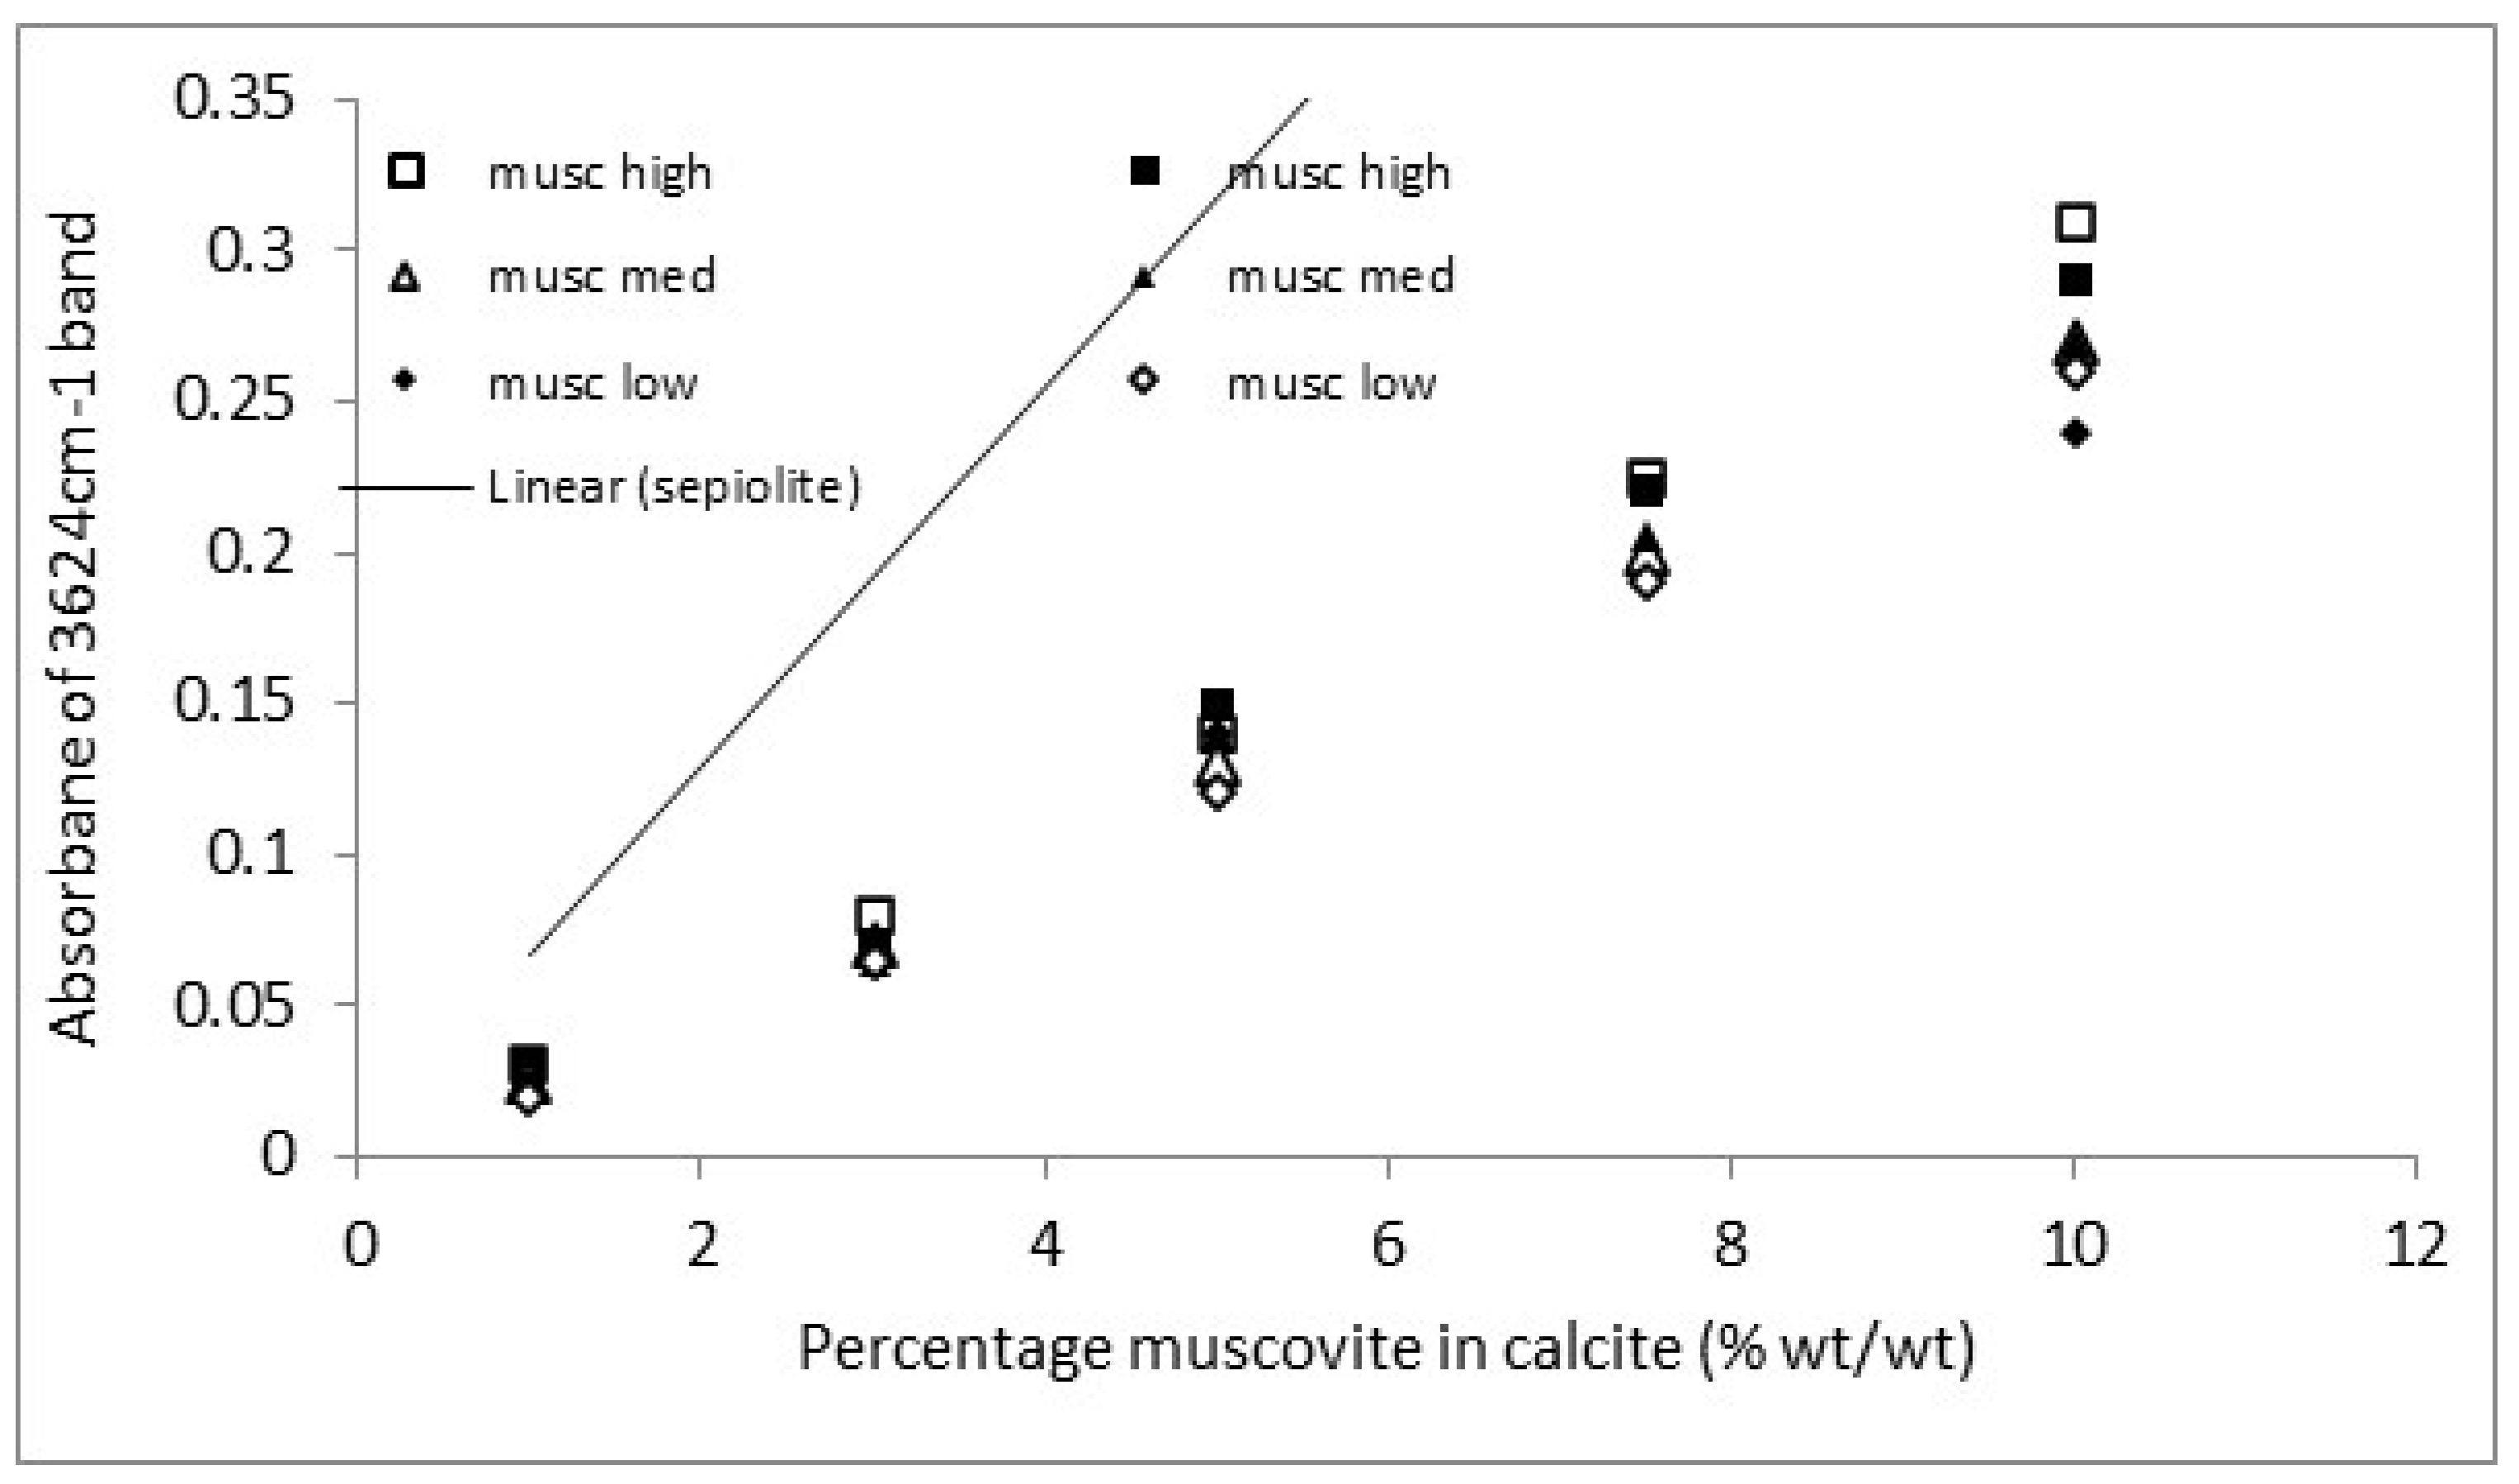
The ATR-FTIR was found to generate good-quality spectra from all samples. Muscovite has a very distinctive hydroxyl stretching band at 3624 cm
−1 [
29].
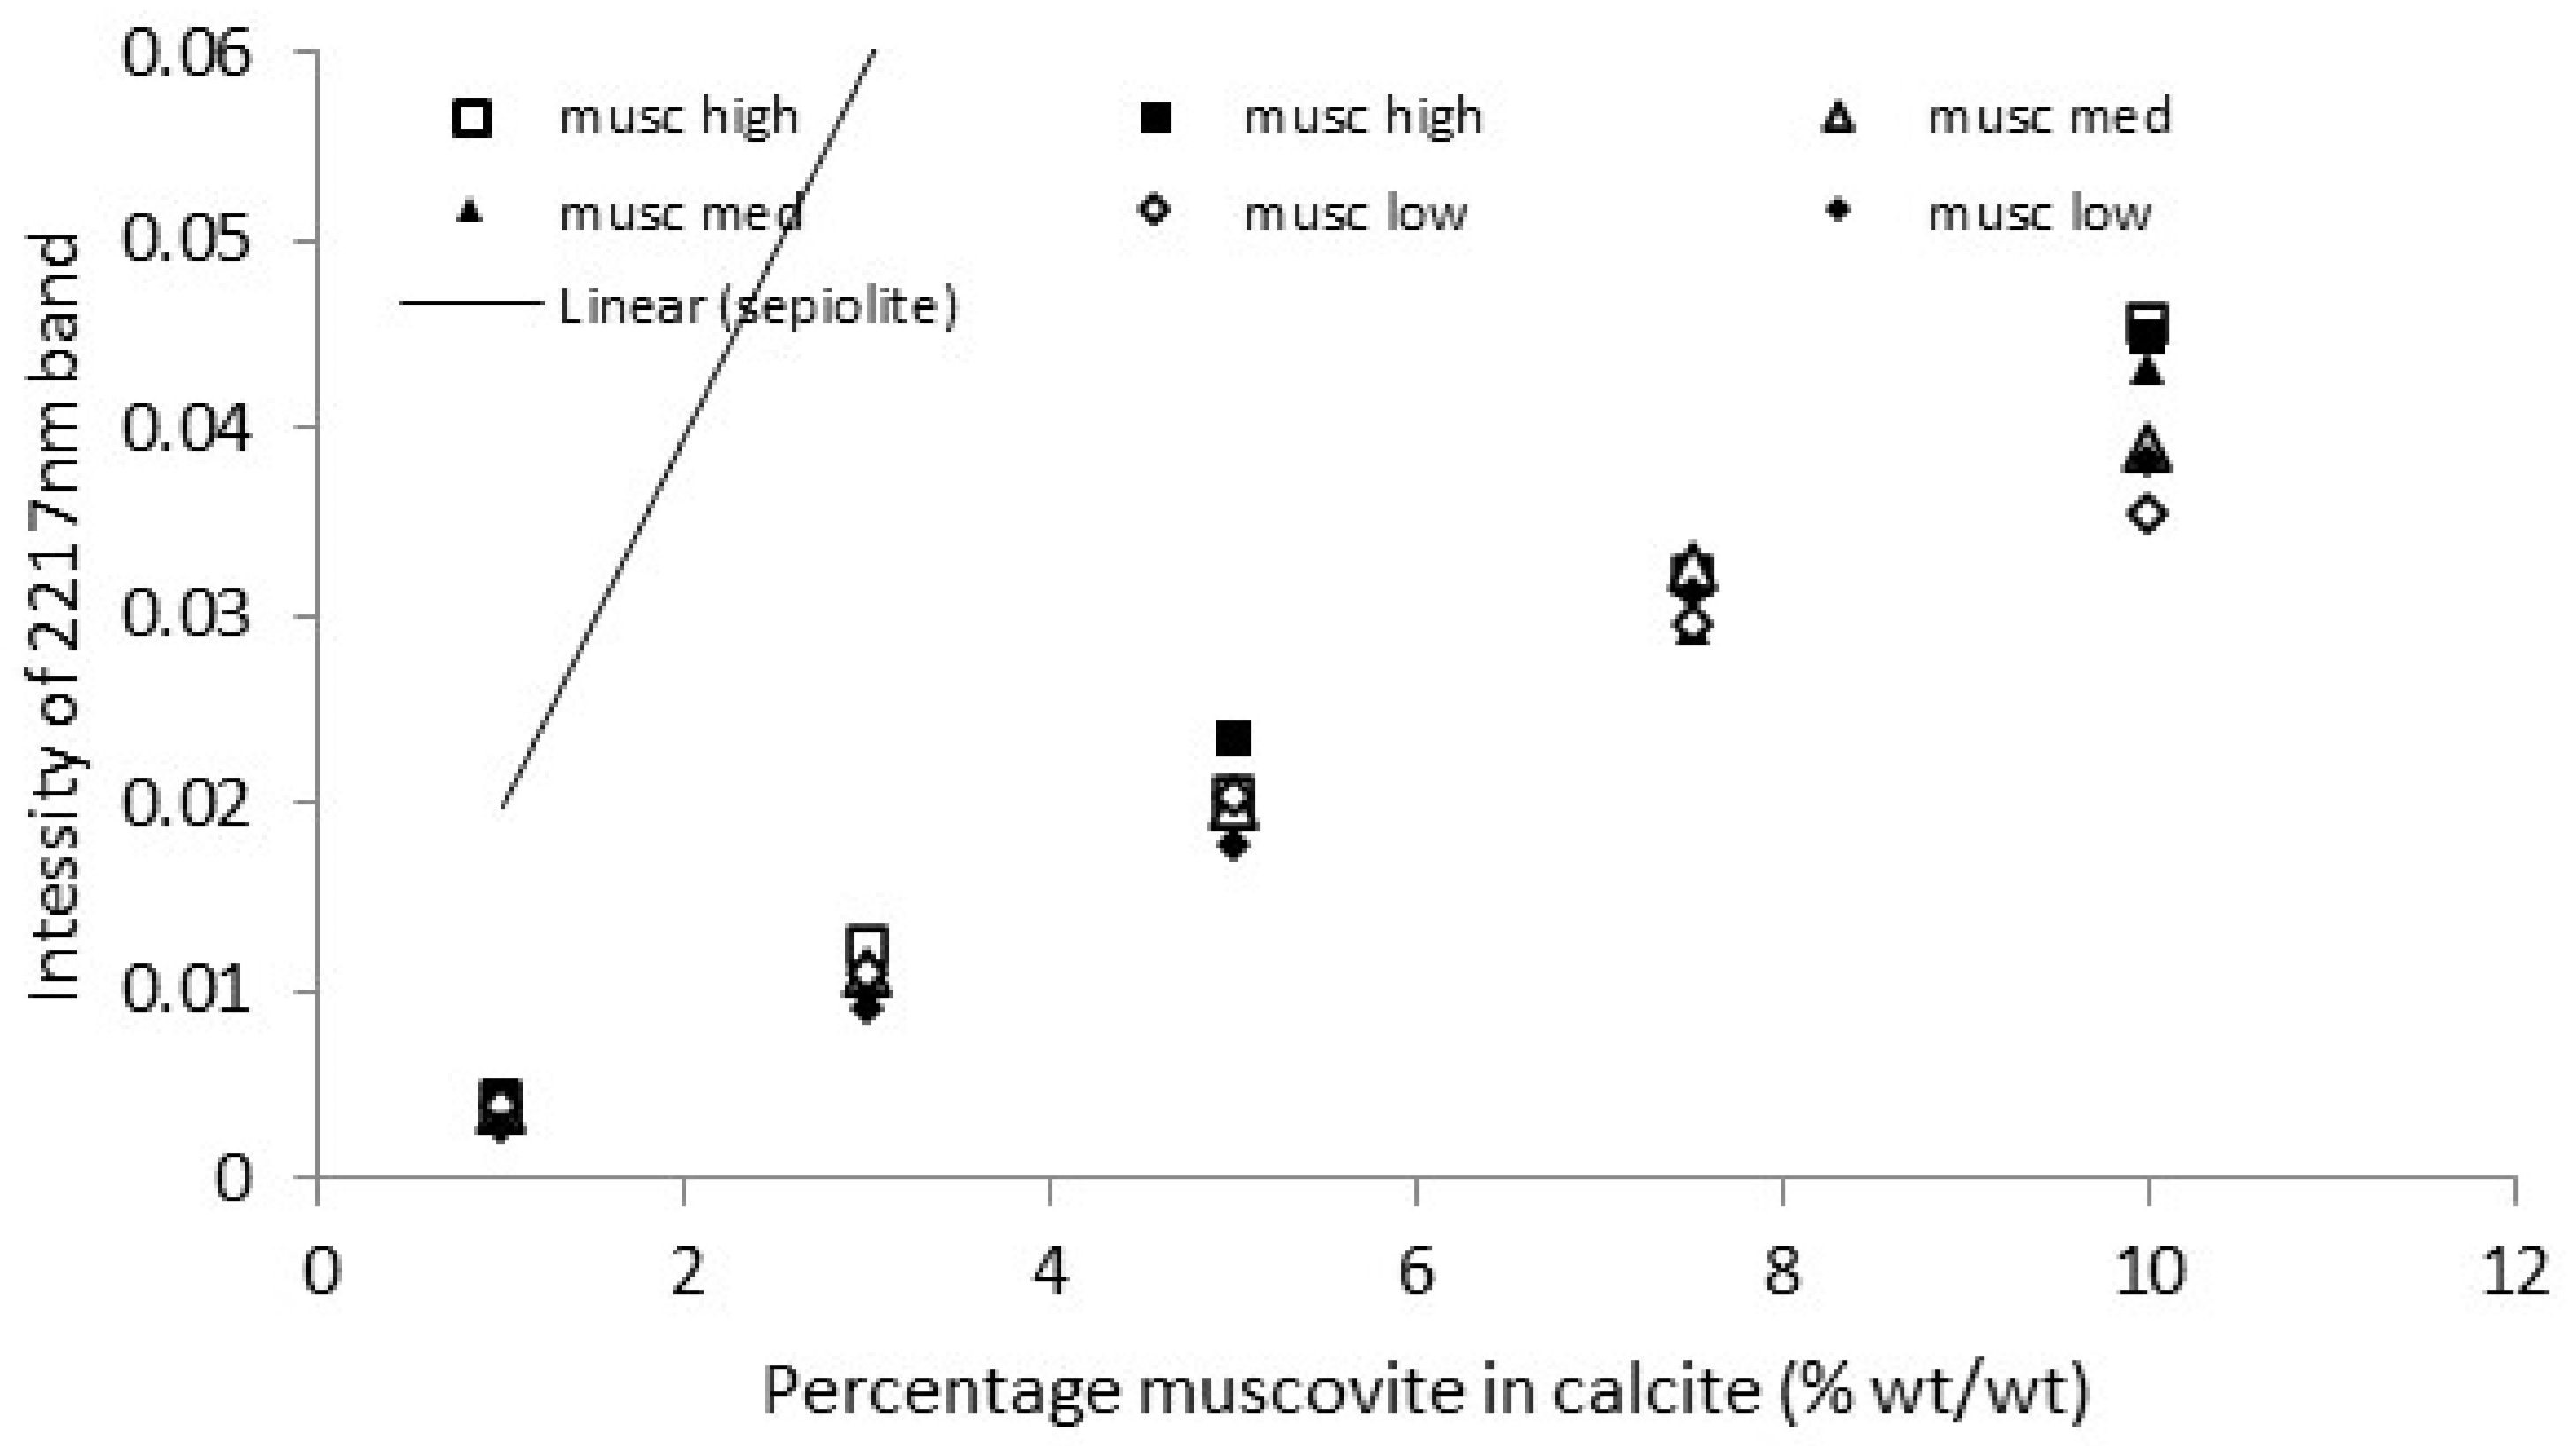
The calibration graphs for a representative set of the 12 muscovite clays in calcite are shown in
Figure 11 and
Figure 12. The data sets for the two regression lines with the highest slope, two with the closest to mean slopes, and two with the lowest slopes are shown. The regression lines themselves are not included to improve clarity of the figures. The pre-viously determined calibration lines for sepiolite [
25] are included for comparison.
A decent set of calibrations for clay concentrations above 2 or 4% by mass is shown. This indicates the two non-invasive techniques can indeed be used to quantify clay pre-sent in calcitic stones. There are small differences in the calibration for each clay sample, but using a general calibration is likely to provide results of sufficient accuracy to be use-ful. The NIR also showed a good calibration with the peak at 2217 nm [
30]. The peak position is indicative of a lower Al(iv) content, with higher contents shifting the peak towards 2199 nm [
31]. The external reflection FTIR was more sensitive, with a steeper slope than the NIR and lower detection limit.
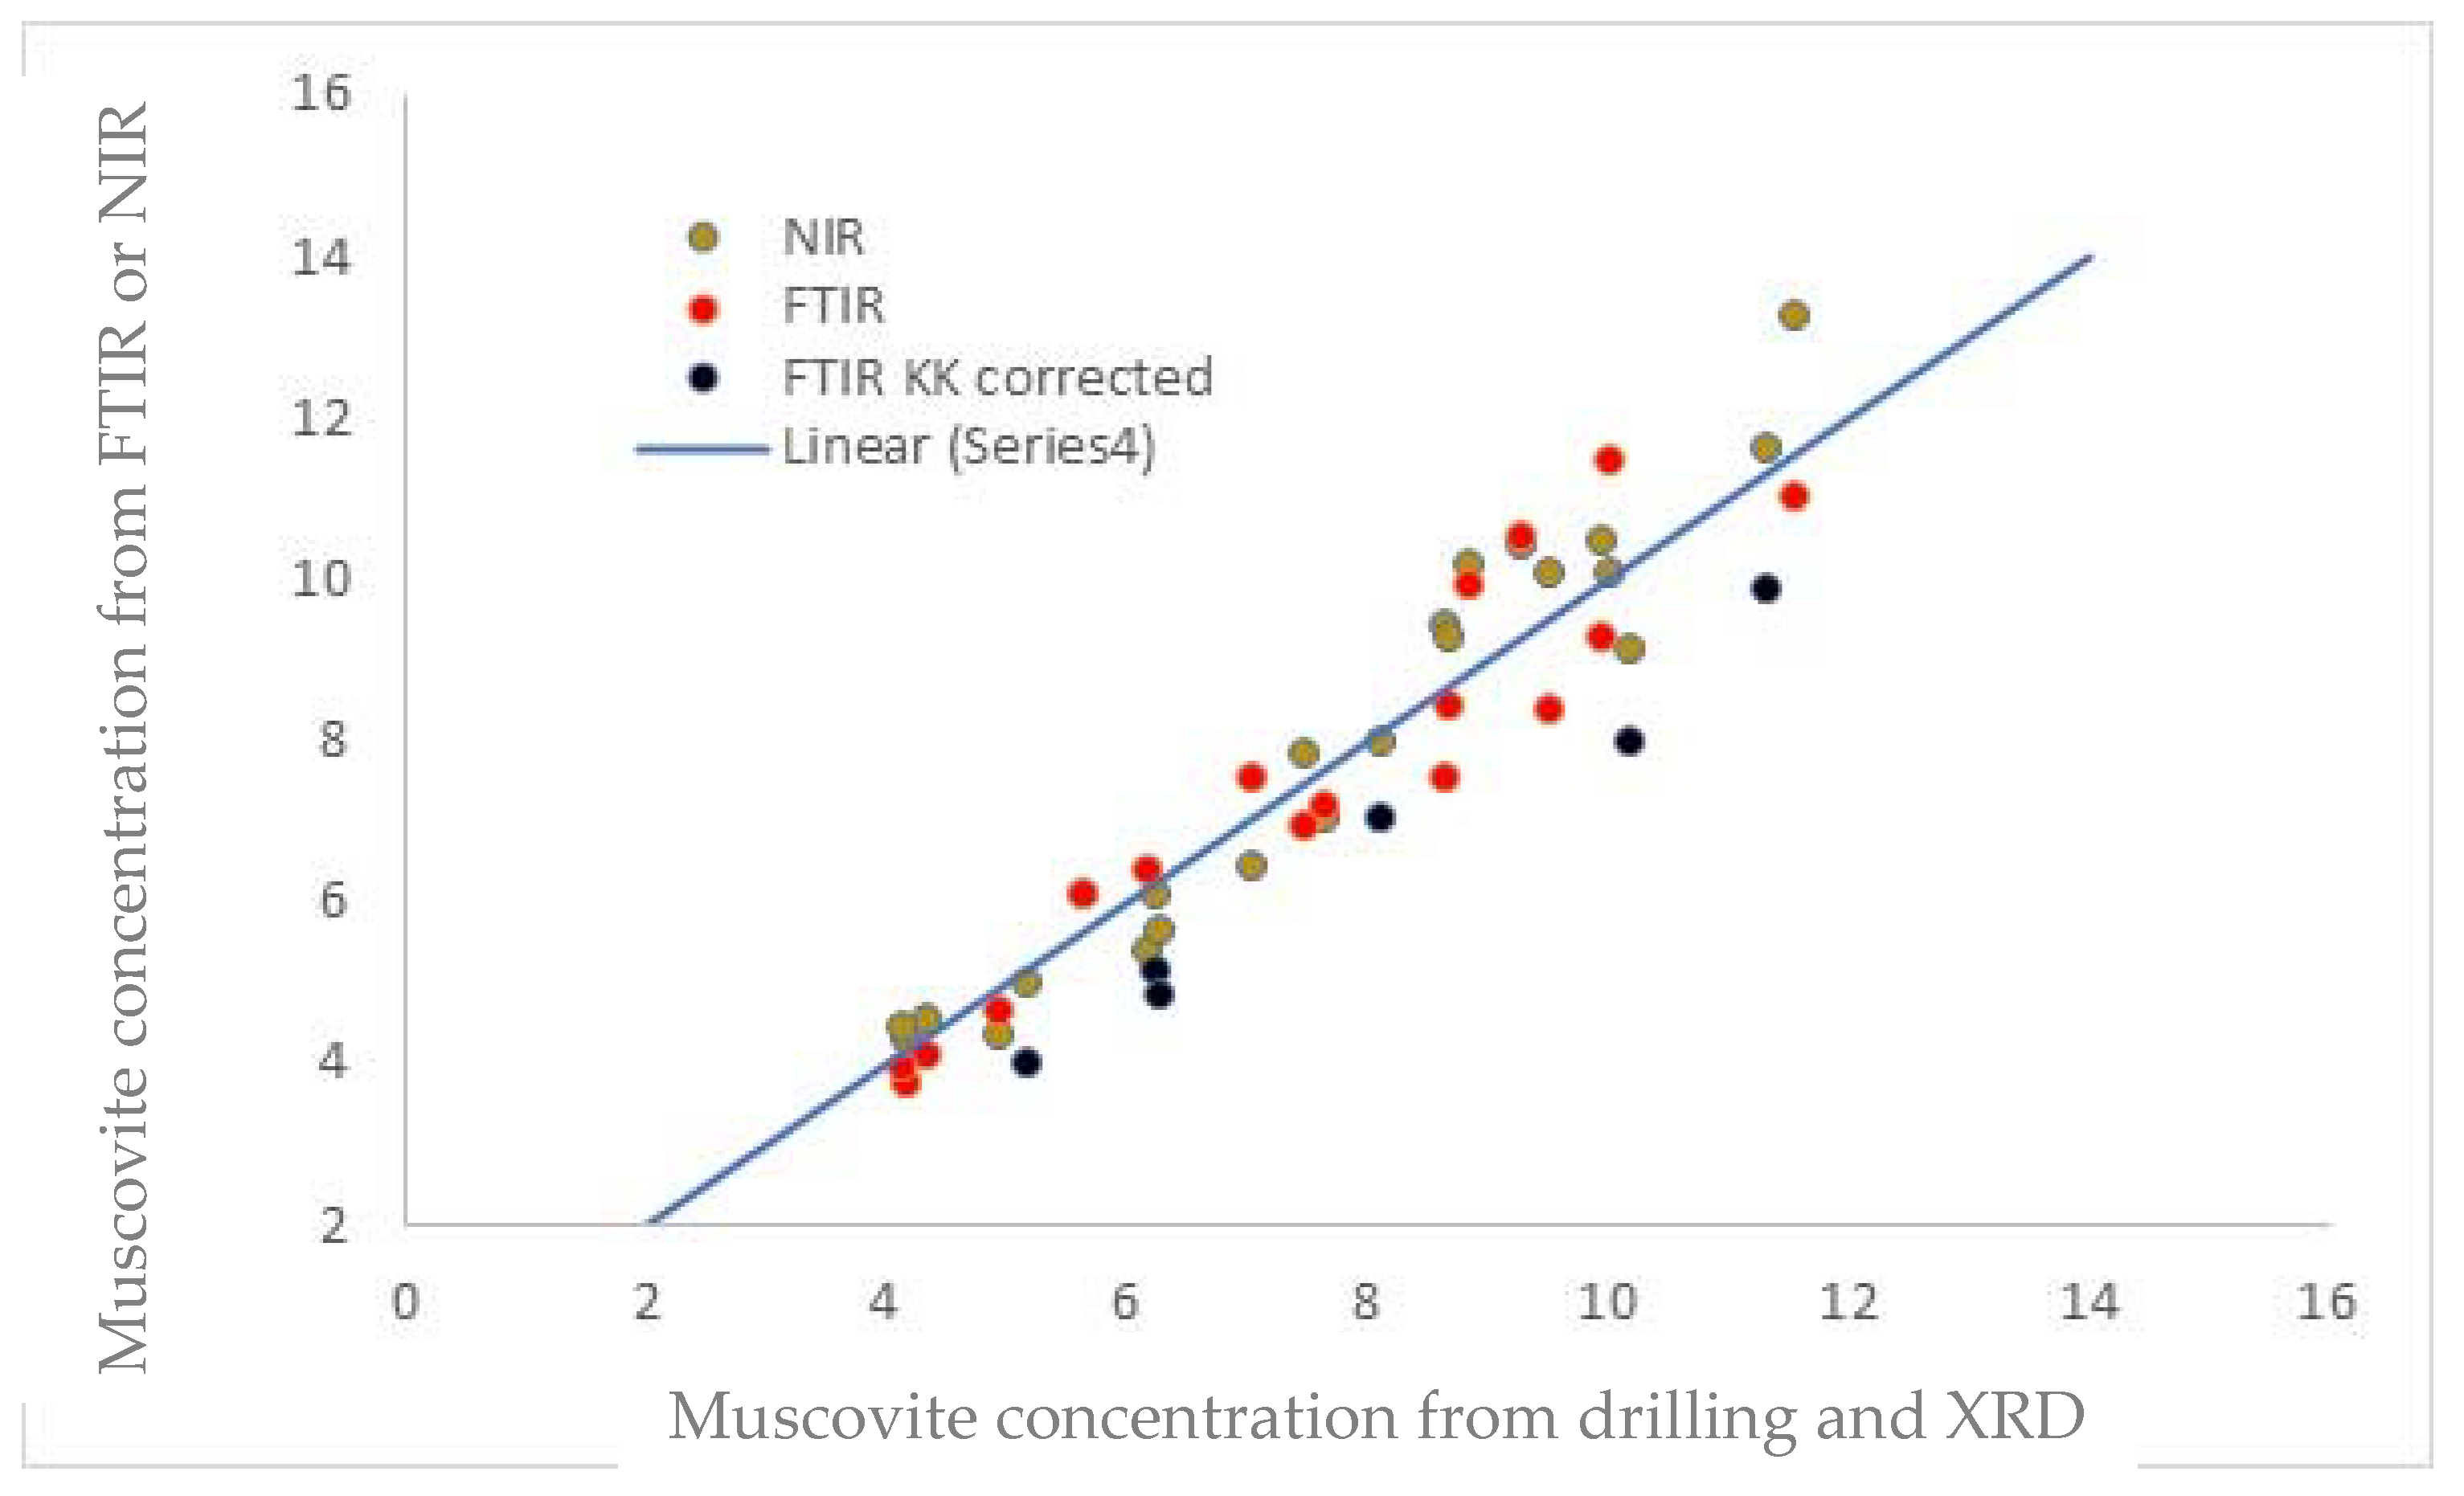
ER-FTIR is prone to generate anomalous spectra due to dispersion effects. If this was strong, the Kramers–Kronig (KK—Nicolet Omnic software) correction produced good peak shapes, but for some mixed examples, it was not successful. Over 60 stone objects were analysed with the muscovite clay present. With multiple attempts, less than 4% of these did not produce identifiable spectra with ER-FTIR, a much lower rate than stones with kaolinite, palygorskite, or sepiolite present. The comparisons with the conventional detection method of digestion followed by XRD are shown in
Figure 13. Six of these required KK corrections of the ER-FTIR spectra (marked in black).
Excluding the KK-corrected FTIR spectra, the NIR and FTIR results correlated well with those from digestion and XRD. The maximum deviation from the conventional method was 14.8% of the value. The KK values appear to be systematically low. Researchers have highlighted different results from KK corrections run on different software packages [
32], although others have reported good results [
33], and improvements to the method have been suggested [
32].
Both techniques could detect the muscovite clay to depths of 2 mm. The narrow-focus NIR fibre performed better, with clay at a 3 mm depth being detected. Previous examination of limestones and Amaravatti limestones with scanning electron microscopy (SEM) has indicated beds of parallel clay, no further from the surface than 1.5 mm. For the larger analytical area of the FTIR, this value drops to 1.3 mm due to the clay distribution in the stone. This appears to indicate that the information depth is sufficient, but a stone with deeper clay is possible. Deeper information depth can be achieved with the 2 mm NIR probe. However, this is more likely to miss clay bedded perpendicular to the surface, and several instances have been observed with 4 mm between clay beds. Both the larger probe (10 mm) and ER-FTIR (13 mm) would detect this.
Figure 14 shows the measured muscovite clay contents across the stone fragment from Thetford.
4. Discussion and Future Directions
The poulticing approach to sampling soluble salts appears to work well, at least in the situation investigated. Clearly, many more stone types and other substrates and soluble salt ions need testing. This is planned in the GoGreen project [
34]. The application of wet poultices to some stone objects will not be possible, and also further work is required to ensure the poultices protect the surfaces from salt damage when drying. The salt ions were apparently removed from a greater depth than the liquid water had penetrated from the poultice. This could be explained by water vapour penetrating beyond the water front. This would cause the salts to deliquesce, provided the RH was sufficiently high. The salt solution could then be drawn along with the liquid water as the poultice dried and drew the water back into it.
Combining measurements from an Hf Sensor M350 microwave moisture meter and Protimeter Surveymaster gives a reasonable measure of the conductivity of liquid salt solutions in calcite columns. It seems likely that this approach will be extendable to other materials. Separate calibrations are required for each subset of materials with the microwave meter, and software is available to undertake these. The method appears to be feasible, although there is a slight mismatch between the microwave and protimeter information depths. If dielectric meters with deeper information depths can be sourced, they can be combined with different microwave heads to undertake measurements further from the object surface. Heads are available with information depths of 3, 7, 11, 30, and 80 cm from the Hf Sensor. Additionally, the sensitivity of the methods to different depths has not been investigated. We plan to continue with further experiments with the calcite cylinder to investigate this aspect. The combined method can generate maps of object surfaces, which could direct invasive (drilled) sampling between groups of objects and within single objects.
The reflectance FTIR successfully identified the mixed acetate salt found on the cuneiform tablets. The rapid analytical time and limited manipulation of samples allowed many more analyses than previous methods, sample removal and XRD or FTIR. This was important when faced with a large number of instances and gave confidence to the results obtained.
A clear segregation was determined using the chloride and sulphate salt contents of a group of cuneiform tablets exposed to high RH and acetic acid concentrations. Within the analysed group, tablets with no visible salt efflorescence were clearly distinguished from those that underwent heavy reaction. Salt analyses appear to be predictive as to whether a particular tablet will react or not. It is possible the salts present in the tablets deliquesce and the acetic acid deposition into these solutions is increased compared to dry deposition. The observation of reaction only after high RH (the tablets had been previously exposed to summer RHs peaking between 71 and 74% for the past 20 years) does seem different from Linnow’s observation that the salt grows in conditions of 40–60% RH [
35].
Some cuneiform tablets were fired, and the poultice method could be applicable for determining the salts present, although further work on the information depth from poulticing would be required.
The ATR-FTIR successfully identified the removed clay samples. The actual analytical area is less than 1 mm
2 and the information depth for the diamond crystal used is likely to be in the order of 1 µm from the Harrick equation at 3300 cm
−1 and using 1.551–1.613 as the refractive index of muscovite clay [
36,
37,
38,
39]. This could lead to issues with non-homogeneous samples, but multiple analyses should be able to quantify this and still retain significant time savings compared to XRD.
The in situ analyses worked well with both direct-reflection FTIR and NIR. The detection limits are higher than those previously identified for kaolinite, sepiolite, and palygorskite (at least 1%). Only two limestones from over 35 have been analysed with muscovite contents below 3% when it is present, so this appears to be sufficient in almost all instances. For Egyptian limestones, clay (sepiolite and palygorskite) contents above 5% were shown to contribute to decay [
4]. Whilst ER-FTIR has a deeper information depth than NIR, it is prone to generate anomalous spectra due to dispersion effects. If this was strong, the Kramers–Kronig correction produced good peak shapes, but for some mixed examples, it was not successful. The comparison with digestion and XRD showed a very good correlation for most spectra. The 14.8% difference in absolute value is probably sufficient for this application. The KK-corrected spectra appeared to show a different systematic trend. A new calibration could be run for the KK-corrected spectra when enough examples have been identified. The technique can also be used for mapping to direct sampling.
5. Conclusions
Poulticing has been shown to be comparative to drilling a sample to determine the ion concentrations (chloride, nitrate, sodium) in Caenstone. For thermodynamic calculations it appears a suitable substitute, although other stone types and ions need testing. The infor-mation depth is unclear and will cannot replace drilled samples to determine the absolute amounts of salts present. Although schemes to interpret such data in terms of stability are very limited at present.
Reflectance FTIR microscope has proved to be a very useful, rapid technique to identi-fy mixed salts on objects.
Non-invasive FTIR and NIR both work well to quantify muscovite clay in stones. FTIR has a higher detection limit, but its larger analytical area can be useful when clays are distributed unevenly. Both techniques had sufficient information depth to accommodate clays bedded parallel to the surface.


