Abstract
The steel tube-reinforced concrete (STRC) shear wall plays an important role in the seismic design of high-rise building structures. Due to the synergistic collaboration between steel tubes and concrete, they effectively enhance the ductility and energy dissipation capacity of conventional shear walls. To identify vulnerable areas prone to brittle failure and optimize the design, it is essential to develop a rapid method for identifying the failure mode of STRC shear walls. In this study, a fast identification method of STCR shear wall failure modes based on a Blending fusion model with Generative Adversarial Network (GAN) augmented data is proposed. The GAN is employed to address the issue of inadequate experimental data by generating new samples. This method combines classification boosting (Catboost), Random Forest (RF), K-Nearest Neighbors (KNN), and Least Absolute Shrinkage and Selection Operator (LASSO) to establish the Blending-CRKL fusion model to improve the prediction accuracy of the failure mode of STRC shear walls. The results reveal a significant improvement in the prediction performance of KNN, Backpropagation Neural Network (BPNN), RF, Light Gradient Boosting Machine (LightGBM), Catboost, and Blending-CRKL models after augmenting the training set with GAN. On average, the accuracy increased by 13%, precision increased by 81%, recall increased by 48%, and F1 score increased by 67%. The proposed Blending-CRKL fusion model outperforms the tested KNN, BPNN, RF, LightGBM, and Catboost models, achieving an accuracy rate of 97% in predicting the failure mode of STRC shear walls. Additionally, the stability and robustness of the Blending-CRKL model were validated, while the important features and value ranges of different failure modes were analyzed. This study provides a reference for the rapid identification of the failure mode of STRC shear walls.
1. Introduction
Steel tube-reinforced concrete (STRC) shear walls are composite shear walls that have superior performance compared to traditional reinforced concrete (RC) shear walls, and they are widely used in high-rise and super-high-rise buildings [1,2]. To ensure ductile failure, STRC shear walls are typically designed according to the “strong shear weak flexure” principle, similar to RC shear walls [3]. Rapid prediction of the failure modes of STRC shear walls can help engineers better understand the structural and mechanical behavior and take appropriate measures to improve the seismic performance of the structure. The existing literature and standards generally recognize that walls with a small shear–span ratio are more susceptible to shear failure, while walls with a high shear–span ratio are more prone to flexural failure. However, experimental evidence has shown that this viewpoint is not always correct. For example, in the experiments conducted by Greifenhagen et al. [4], two shear walls with a shear–span ratio of 0.69 experienced flexural failure, and in the experiments conducted by Teng et al. [5], three shear walls with a shear–span ratio of 2.2 experienced shear failure. This suggests that the failure mode of shear walls is not only related to the shear–span ratio but also depends on factors such as the loading mechanism, material parameters, and geometric dimensions. Relying solely on the shear–span ratio cannot accurately determine the failure mode. In the past, identification methods mainly relied on experiments and numerical simulations, which ensured accuracy but were time-consuming and costly. Therefore, establishing how to quickly and accurately predict the failure modes of STRC shear walls remains a challenging problem that needs to be addressed.
Due to the availability of data [6], data-driven artificial intelligence analysis methods have made some progress in predicting the failure modes of RC walls in recent years. For instance, Mangalathu et al. [7] established an experimental database consisting of 393 RC shear walls and used eight machine learning (ML) algorithms to predict the failure modes of RC shear walls. The results showed that the Random Forest (RF) algorithm had the highest accuracy in predicting the failure modes, with an accuracy of 86%. Zhang et al. [8] established a database of 429 RC shear walls and used nine ML algorithms to predict the failure modes of RC shear walls. The results showed that the extreme gradient boosting (XGBoost) and gradient boosting (GB) algorithms had the best accuracy in predicting the failure modes of RC walls, with an accuracy of 97%. Liang et al. [9] established a database of 351 RC shear walls and used an automated ML algorithm to predict the failure modes of RC shear walls. The results showed that the automated ML algorithm outperformed five manual ML algorithms in predicting the failure modes of RC shear walls. Siam et al. [10] used unsupervised ML algorithms to predict the failure modes and slip of reinforced masonry shear walls, and the predicted results were consistent with the experimental results. Ma et al. [11] established a database of 107 STRC shear walls and compared the predictive performance of six ML algorithms for the failure modes of these walls. The results showed that the RF algorithm had the best prediction accuracy. However, the “black box” nature of ML makes it difficult to explain the relationship between input and output variables [12]. To address this issue, some propose the Explainable Boosting Machine (EBM) [13] and the Shapley Additive Explanations (SHAP) [14] algorithm to quantify the contribution of each input parameter to the output parameter, thus achieving the goal of explaining predictive models. Researchers have explored this problem; for example, Mangalathu et al. [15] used the SHAP method to quantitatively analyze the impact of various parameters on the failure mode of shear walls based on existing models. Lai et al. [16] used the SHAP algorithm to estimate the relative importance of input features and discussed the influence of each input.
Currently, the application of ML methods in civil engineering is constrained by small and imbalanced datasets, which have a significant impact on the predictive performance of models [17]. Due to the high cost and time-consuming nature of collecting experimental data, the number of samples in the civil engineering field’s database is limited. Therefore, solving the problem of small sample databases is crucial for the application of ML in civil engineering. Some scholars have combined clustering algorithms with cloud models and used bootstrapping methods to expand such small sample datasets [18,19]. In 2002, scholars creatively proposed the Synthetic Minority Over-sampling Technique (SMOTE) [20], which reduces the imbalance in the dataset by artificially synthesizing additional samples. However, this method cannot guarantee the similarity between the generated data and the original data. On the other hand, Generative Adversarial Networks (GANs), as a deep learning algorithm, generate synthetic data that are similar to real data by learning the distribution characteristics of real data [21], making the generated data more diverse and realistic. Some scholars have applied GANs to deal with small sample data. For example, Ma et al. [22] proposed a sample synthesis method based on GANs and hybrid strategies to augment the prediction of hydrogen production in supercritical water. Chen et al. [23] designed three types of GANs to augment the existing small sample concrete compressive strength database, significantly improving the predictive performance of the augmented model.
Current research on the failure modes of structural walls is primarily focused on RC shear walls, and there is limited research on the damage patterns of STRC shear walls using data-driven ML algorithms. Traditional methods based on experiments [24] to explore the seismic performance of STRC shear walls are time-consuming and costly. However, applying ML methods to predict the failure modes of STRC shear walls is efficient and cost-effective, but the lack of sufficient training samples remains a major obstacle in the application of ML methods for recognizing the failure modes of STRC shear walls.
To address these issues, this study leverages the GAN data augmentation technique to develop a Blending fusion model, aiming to accurately and efficiently identify the failure mode of STRC shear walls in small sample scenarios. This provides a novel approach for engineers in the field of civil engineering to apply ML methods when dealing with data scarcity. The main contributions and innovations of this paper are as follows:
- (1)
- The use of GAN for database augmentation of STRC shear walls enables various ML models to fully learn the patterns in the data, addressing the issue of limited training samples of STRC shear walls.
- (2)
- The establishment of a Blending-CRKL fusion model that combines the advantages of Catboost, RF, KNN, and LASSO models significantly improves the prediction accuracy of failure modes of STRC shear walls compared to single ML models tested. The stability and robustness of this model are also validated.
- (3)
- The application of model interpretability methods provides explanations for the Blending-CRKL fusion model, addressing the “black box” issue of ML models. The important features of failure modes of STRC shear walls and the ranges of feature values under different failure modes are analyzed.
2. STRC Shear Wall Failure Modes and Small Sample Database Establishment
2.1. Failure Modes of STRC Shear Walls
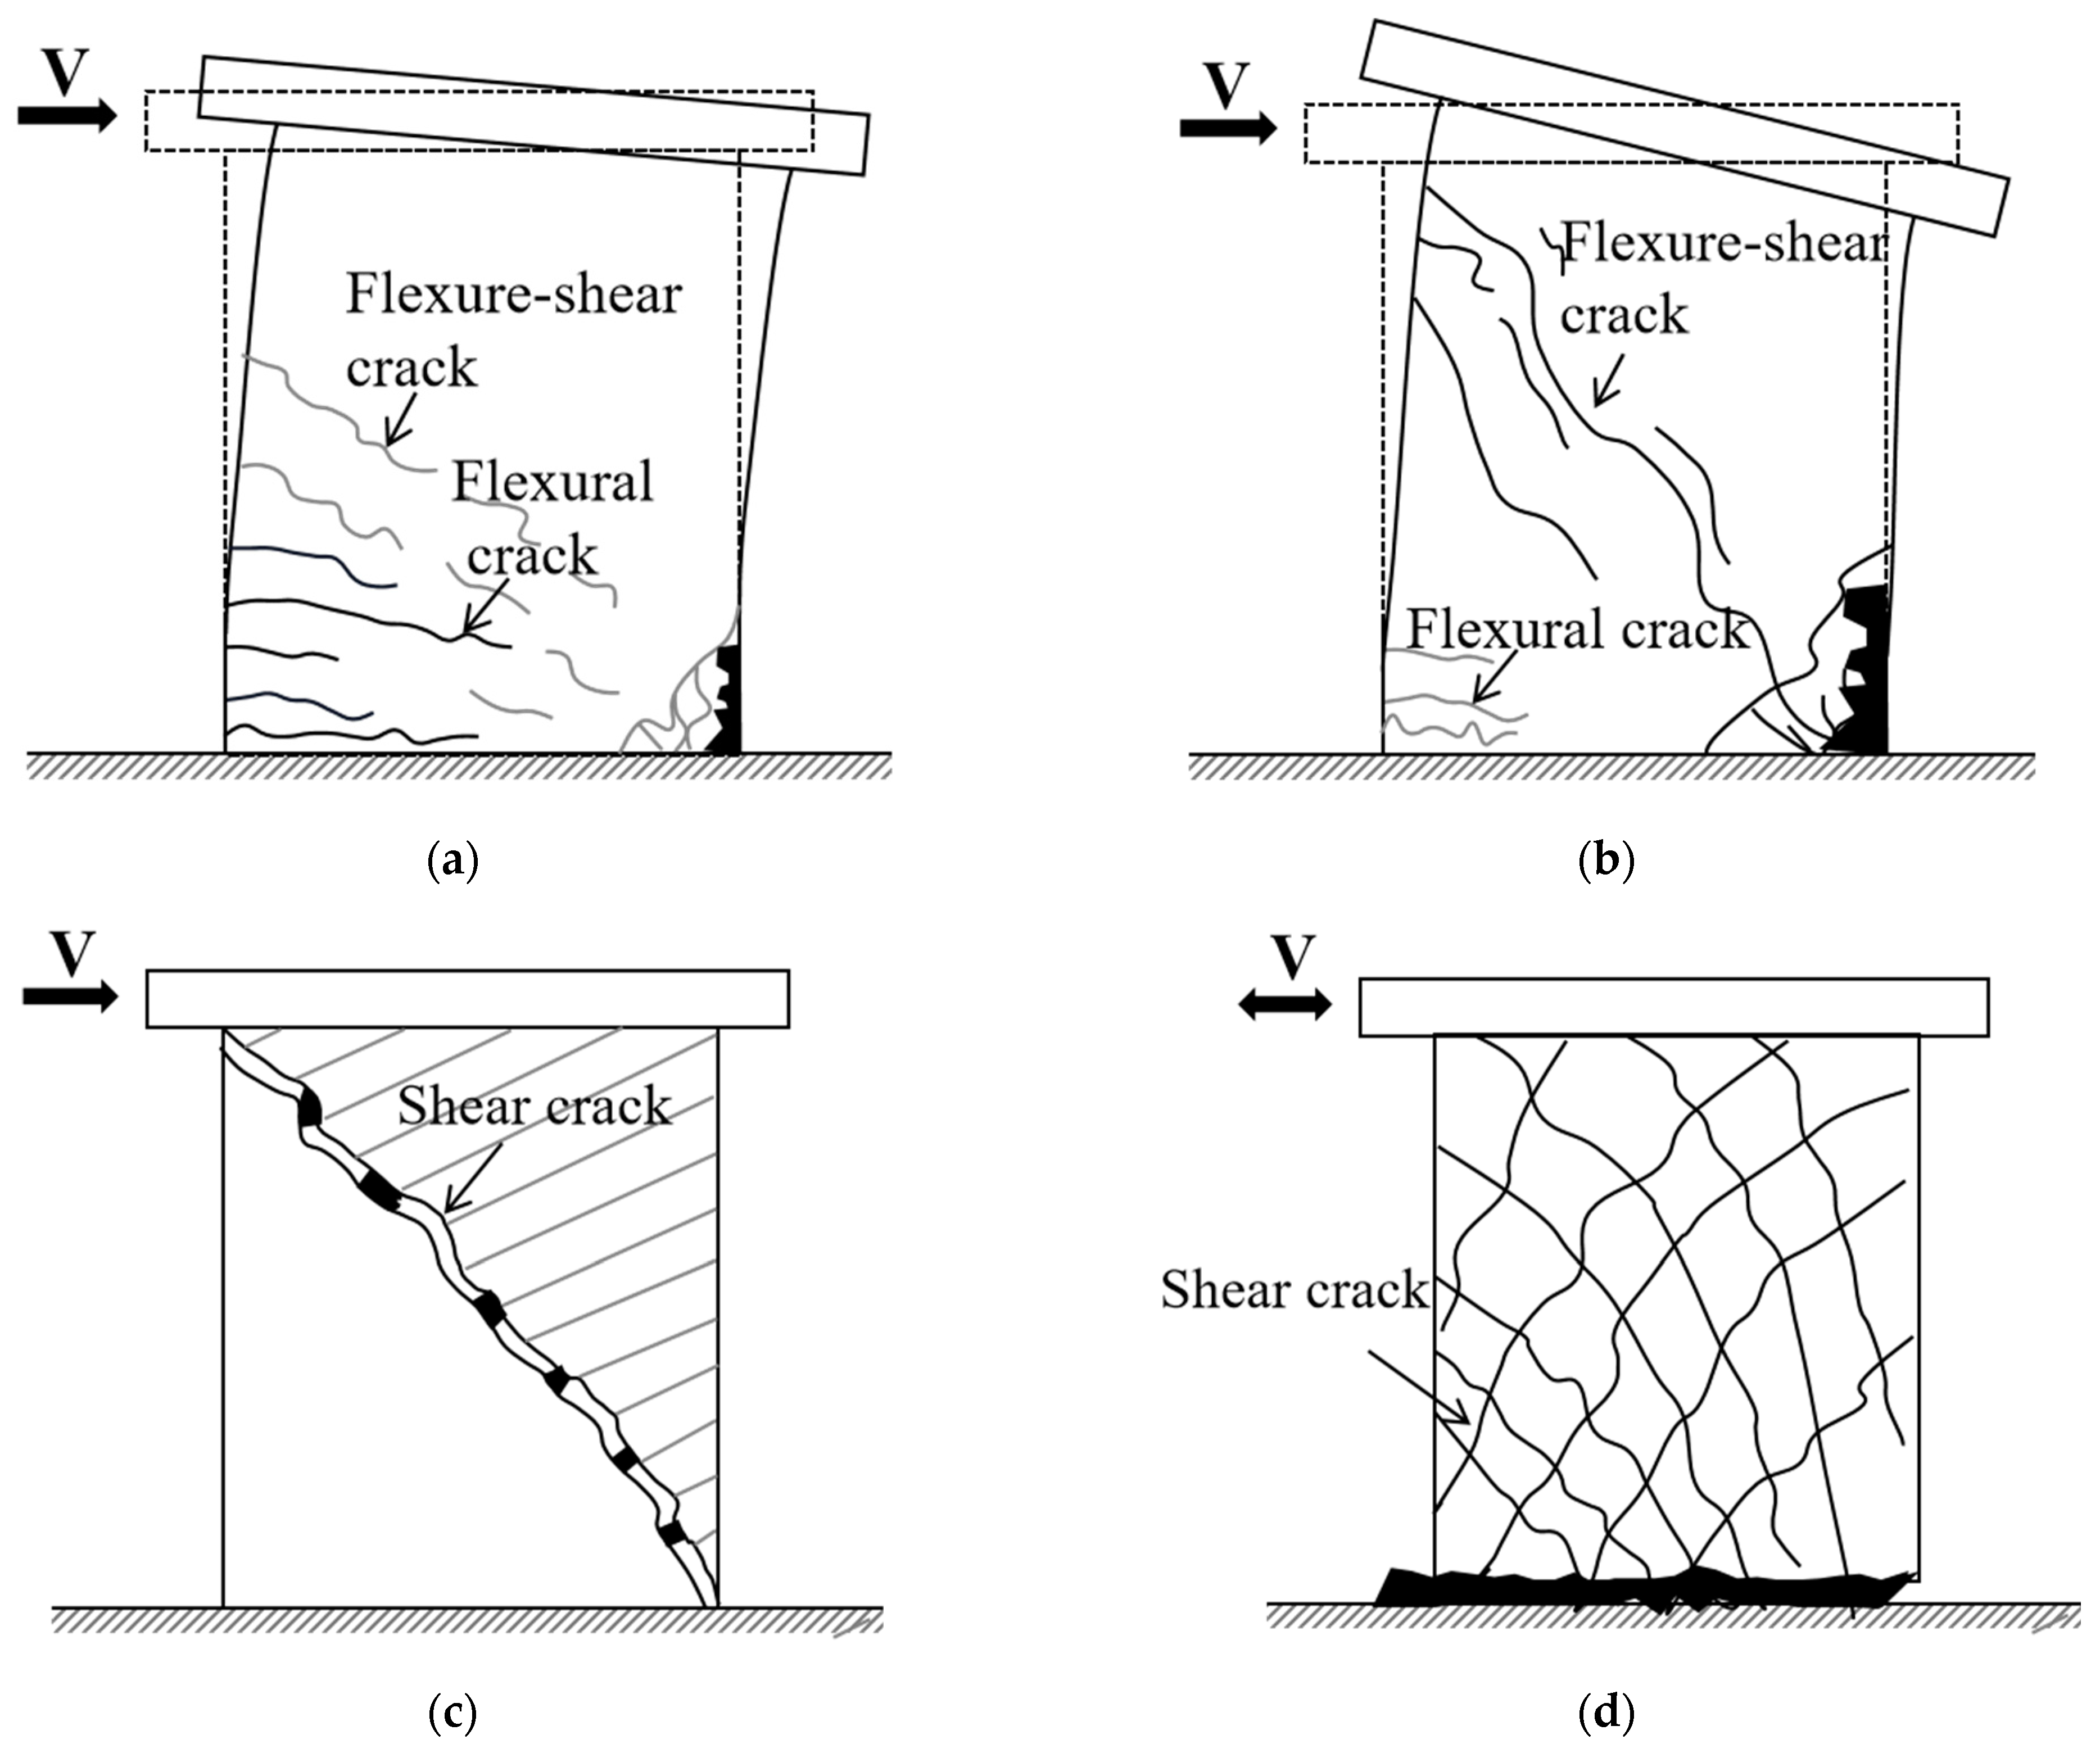
The failure modes of STRC shear walls are similar to those of RC shear walls, mainly including flexural failure, flexural–shear failure, shear failure, and sliding failure [25]. Flexural failure is characterized by flexural deformation, where horizontal flexural cracks first appear in the tensile zone of the wall under the action of horizontal cyclic loads. These cracks gradually extend to the compressed zone of concrete, resulting in a reduction in the height of the compressed zone. Finally, the tensile steel bars yield, accompanied by the crushing of the compressed zone edge concrete or the buckling of the steel tube, the protective layer peeling off, and the wall producing numerous intersecting diagonal cracks [8], exhibiting ductile failure, as shown in Figure 1a. Flexural–shear failure is subjected to both flexural and shear forces, where horizontal flexural cracks first appear in the lower part of the wall and gradually extend obliquely towards the compressed zone. The oblique cracks continue to develop until they reach the compressed zone at the bottom of the wall, and the slope gradually increases to become vertical. Finally, the compressed concrete in the shear zone of the wall undergoes splitting failure under the action of axial compression [26], as shown in Figure 1b. Shear failure is characterized by shear deformation, where diagonal or intersecting diagonal cracks appear in the wall. With the increase in load, the bottom concrete of the wall is crushed, or the steel tube buckles, exhibiting obvious brittle failure characteristics [27], as shown in Figure 1c. Sliding failure is caused by the construction joint set in the wall, resulting in the discontinuity of wall stiffness. Under shear force, the wall slides as a whole, and cracks mostly occur at the construction joint, exhibiting obvious brittle failure characteristics [26,27], as shown in Figure 1d.
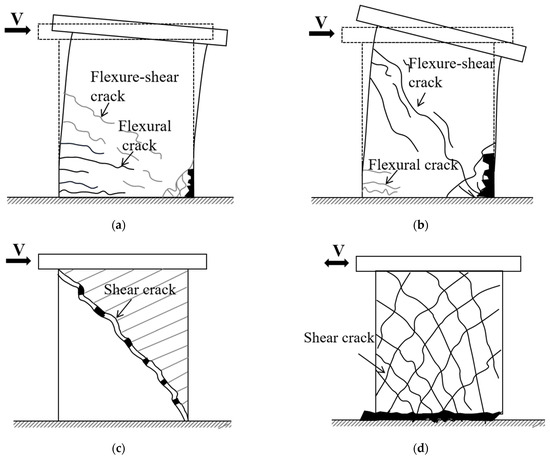
Figure 1.
Schematic diagram of failure mode of STRC shear walls: (a) flexural; (b) flexure–shear; (c) shear; (d) sliding shear.
The failure mode of STRC shear walls is closely related to the wall type. According to ASCE/SEI 41-17 [28], RC shear walls are classified into slender walls (λ ≥ 3), moderate walls (1.5 ≤ λ ≤ 3), and squat walls (λ ≤ 1.5) based on the aspect ratio. Slender walls are more prone to flexural failure, while squat walls, especially those with λ < 1, have a lower occurrence rate of flexural failure and tend to exhibit unpredictable shear failure. Moderate walls are often controlled by both flexural and shear deformation and commonly experience flexural–shear failure.
2.2. Data Collection
Currently, there is limited research on STRC shear walls, and the experimental period is long and costly. It is difficult to establish a sufficiently large database by collecting data from existing studies, resulting in a small sample database. To predict the failure modes of STRC shear walls, we established a database containing 133 STRC shear walls based on existing relevant studies [29,30,31,32,33,34]. To ensure the accuracy of the prediction results, we followed strict rules during data collection. Specifically, the STRC shear walls included in this database meet the following conditions:
- (1)
- The steel tubes are arranged in the boundary unit or the middle of the wall.
- (2)
- The STRC shear walls are single-layered with a symmetrical rectangular cross-section and no openings.
- (3)
- The vertical reinforcement and steel tubes of all STRC shear walls are continuous, without lap splices.
- (4)
- The loading method for testing is cyclic loading.
- (5)
- Walls without special structures, such as hidden steel frames, hidden steel trusses, or shear keys, are excluded from the study.
The collected data cover three types of wall failure modes: shear failure, bending failure, and flexural–shear failure, ensuring that the established model has universal applicability. However, it is evident that the sample size of this database is insufficient, and data augmentation techniques need to be employed to further expand the database.
2.3. Feature Settings
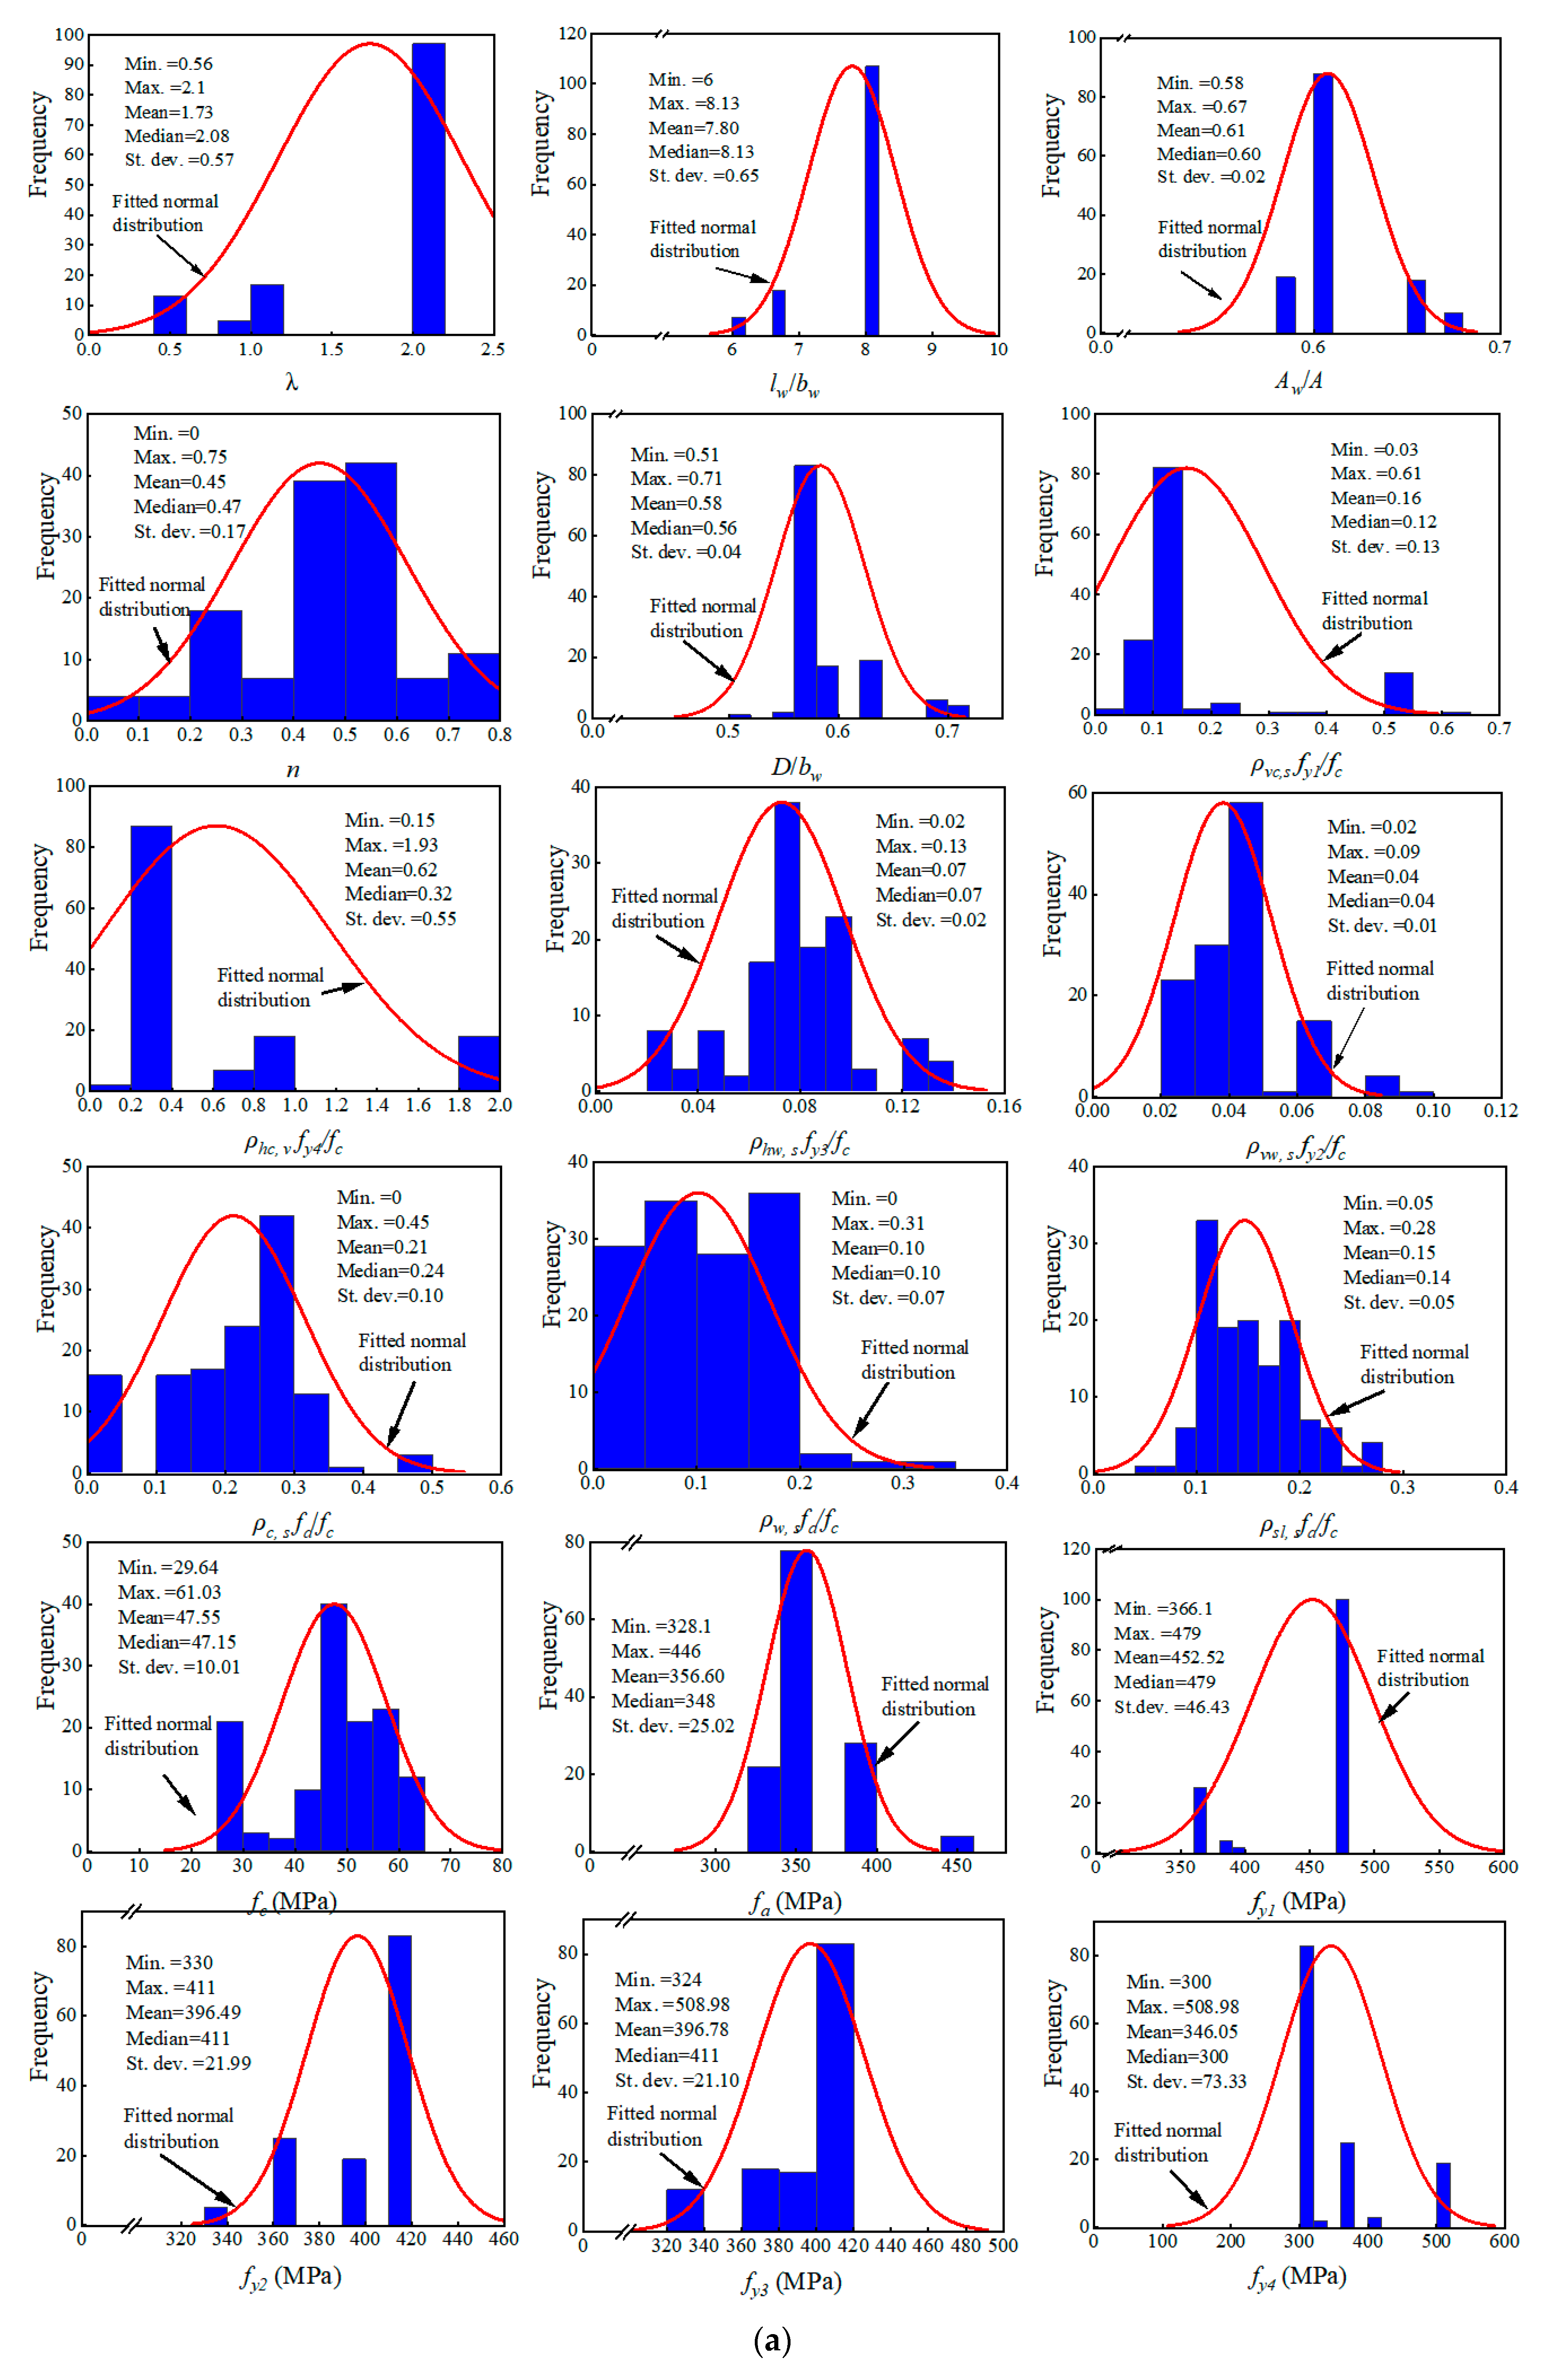
The accuracy and upper limit of ML models are directly influenced by the database and input features [35]. Currently, there is limited research on predicting the shear-bearing capacity of STRC shear walls using data-driven methods. In this paper, the input features are determined mainly by referring to the design codes for concrete structures, combined steel and concrete structures, and the existing literature on the seismic performance test studies of STRC shear walls in various countries, including JGJ 3-2010 [36] (Chinese code), CECS188:2005 [37] (Chinese code), JGJ138-2001 [38] (Chinese Code), ACI 318-19 [39] (American Code), EC-8 [40] (European Code), and the established literature [29,30,31,32,33,34]. This paper establishes 18 input features from three aspects: geometric features (λ, lw/bw, Aw/A, D/bw), material properties (fa, fc, fy1, fy2, fy3, fy4), and mechanical properties (n, ρvc,s fy1/fc, ρvw,s fy2/fc, ρhw,s fy3/fc, ρhc,v fy4/fc, ρc,s fa/fc, ρw,s fa/fc, ρsl,s fa/fc). To minimize the influence of dimensional features on the model’s prediction accuracy, except for material property features, geometric and mechanical feature input features are all dimensionless features. Table 1 provides specific classifications and descriptions for each feature. The distribution histograms and curves of each input feature are shown in Figure 2a, where Min., Max., Mean, Median, and St. dev. represent the minimum value, maximum value, mean, median, and standard deviation, respectively. From Figure 2a, it can be seen that the distribution ranges of each feature are wide, and the database contains comprehensive information. The typical schematic diagram of STRC shear wall components in the database is shown in Figure 3, which demonstrates that the 18 input features can fully reflect the actual parameter characteristics of STRC shear walls.

Table 1.
Classification and definition of input features for STRC shear walls.
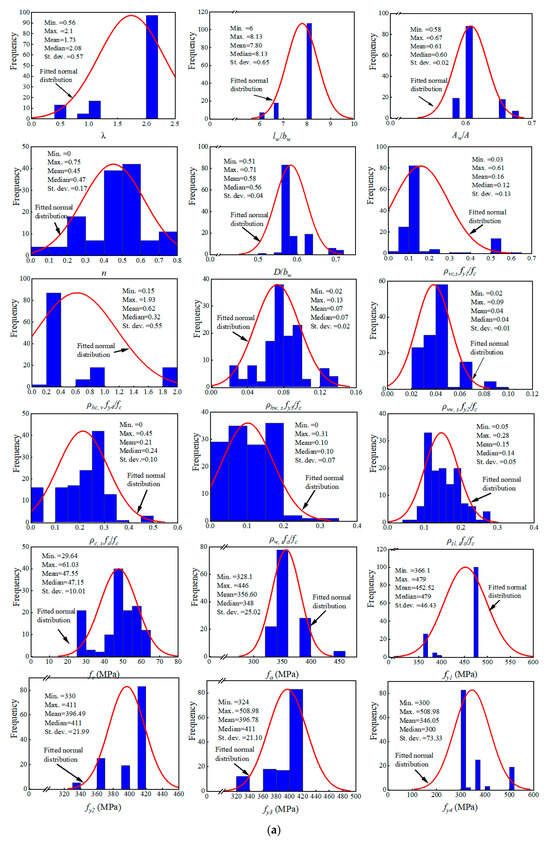

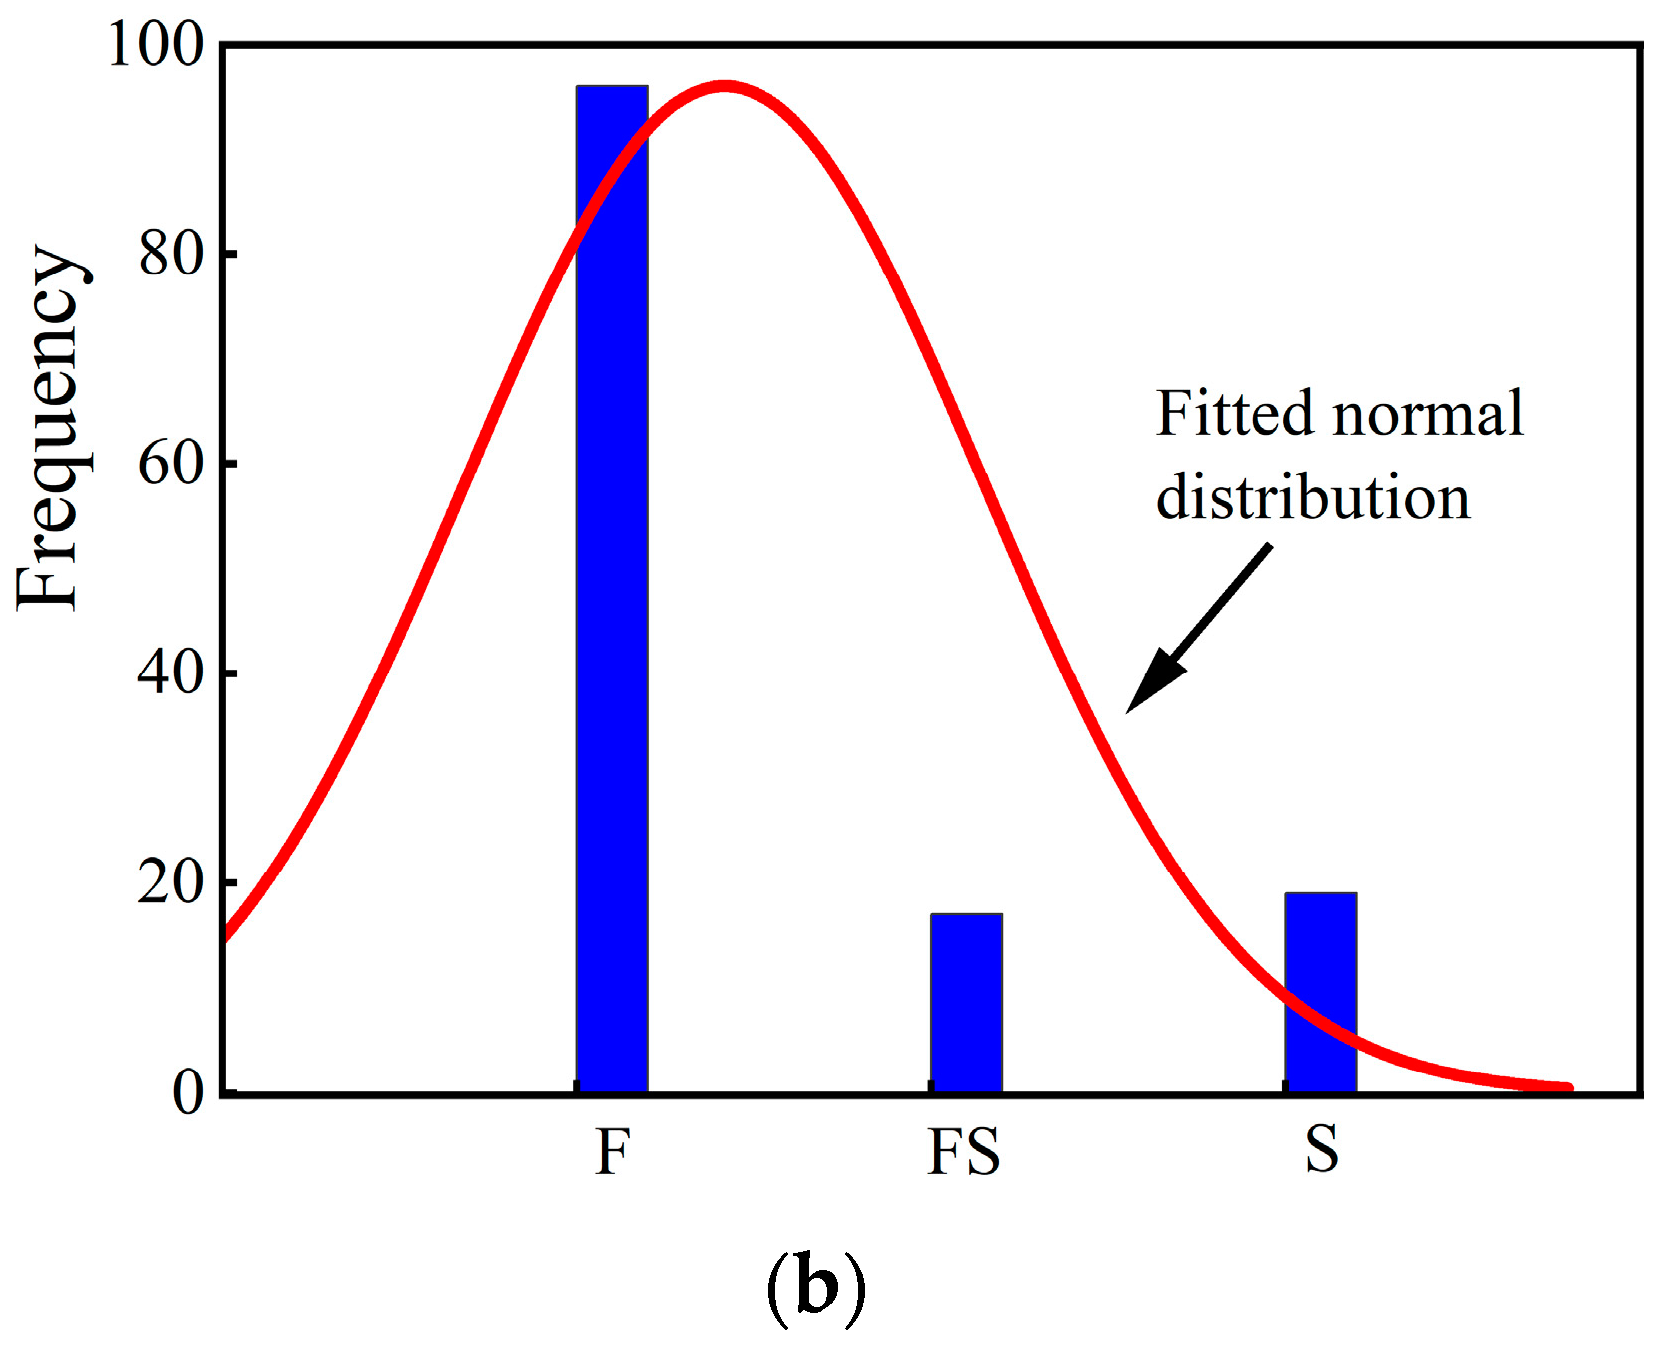
Figure 2.
Distribution of input and output variables in the database: (a) distribution of input variables; (b) distribution of output variables.
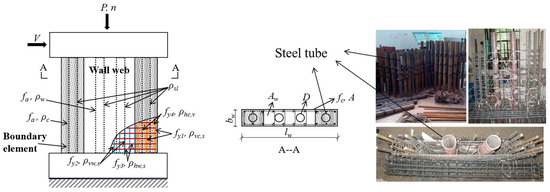
Figure 3.
Typical schematic diagram of STRC shear walls.
The output features of the STRC shear walls are failure modes (F, FS, S). Here, F represents flexural failure, FS represents flexural–shear failure, and S represents shear failure. It is noteworthy that slip failure occurs less frequently in existing tests, and therefore, this paper does not discuss slip failure. The distribution of each output feature is illustrated in Figure 2b.
3. Methodology
3.1. Proposed Framework
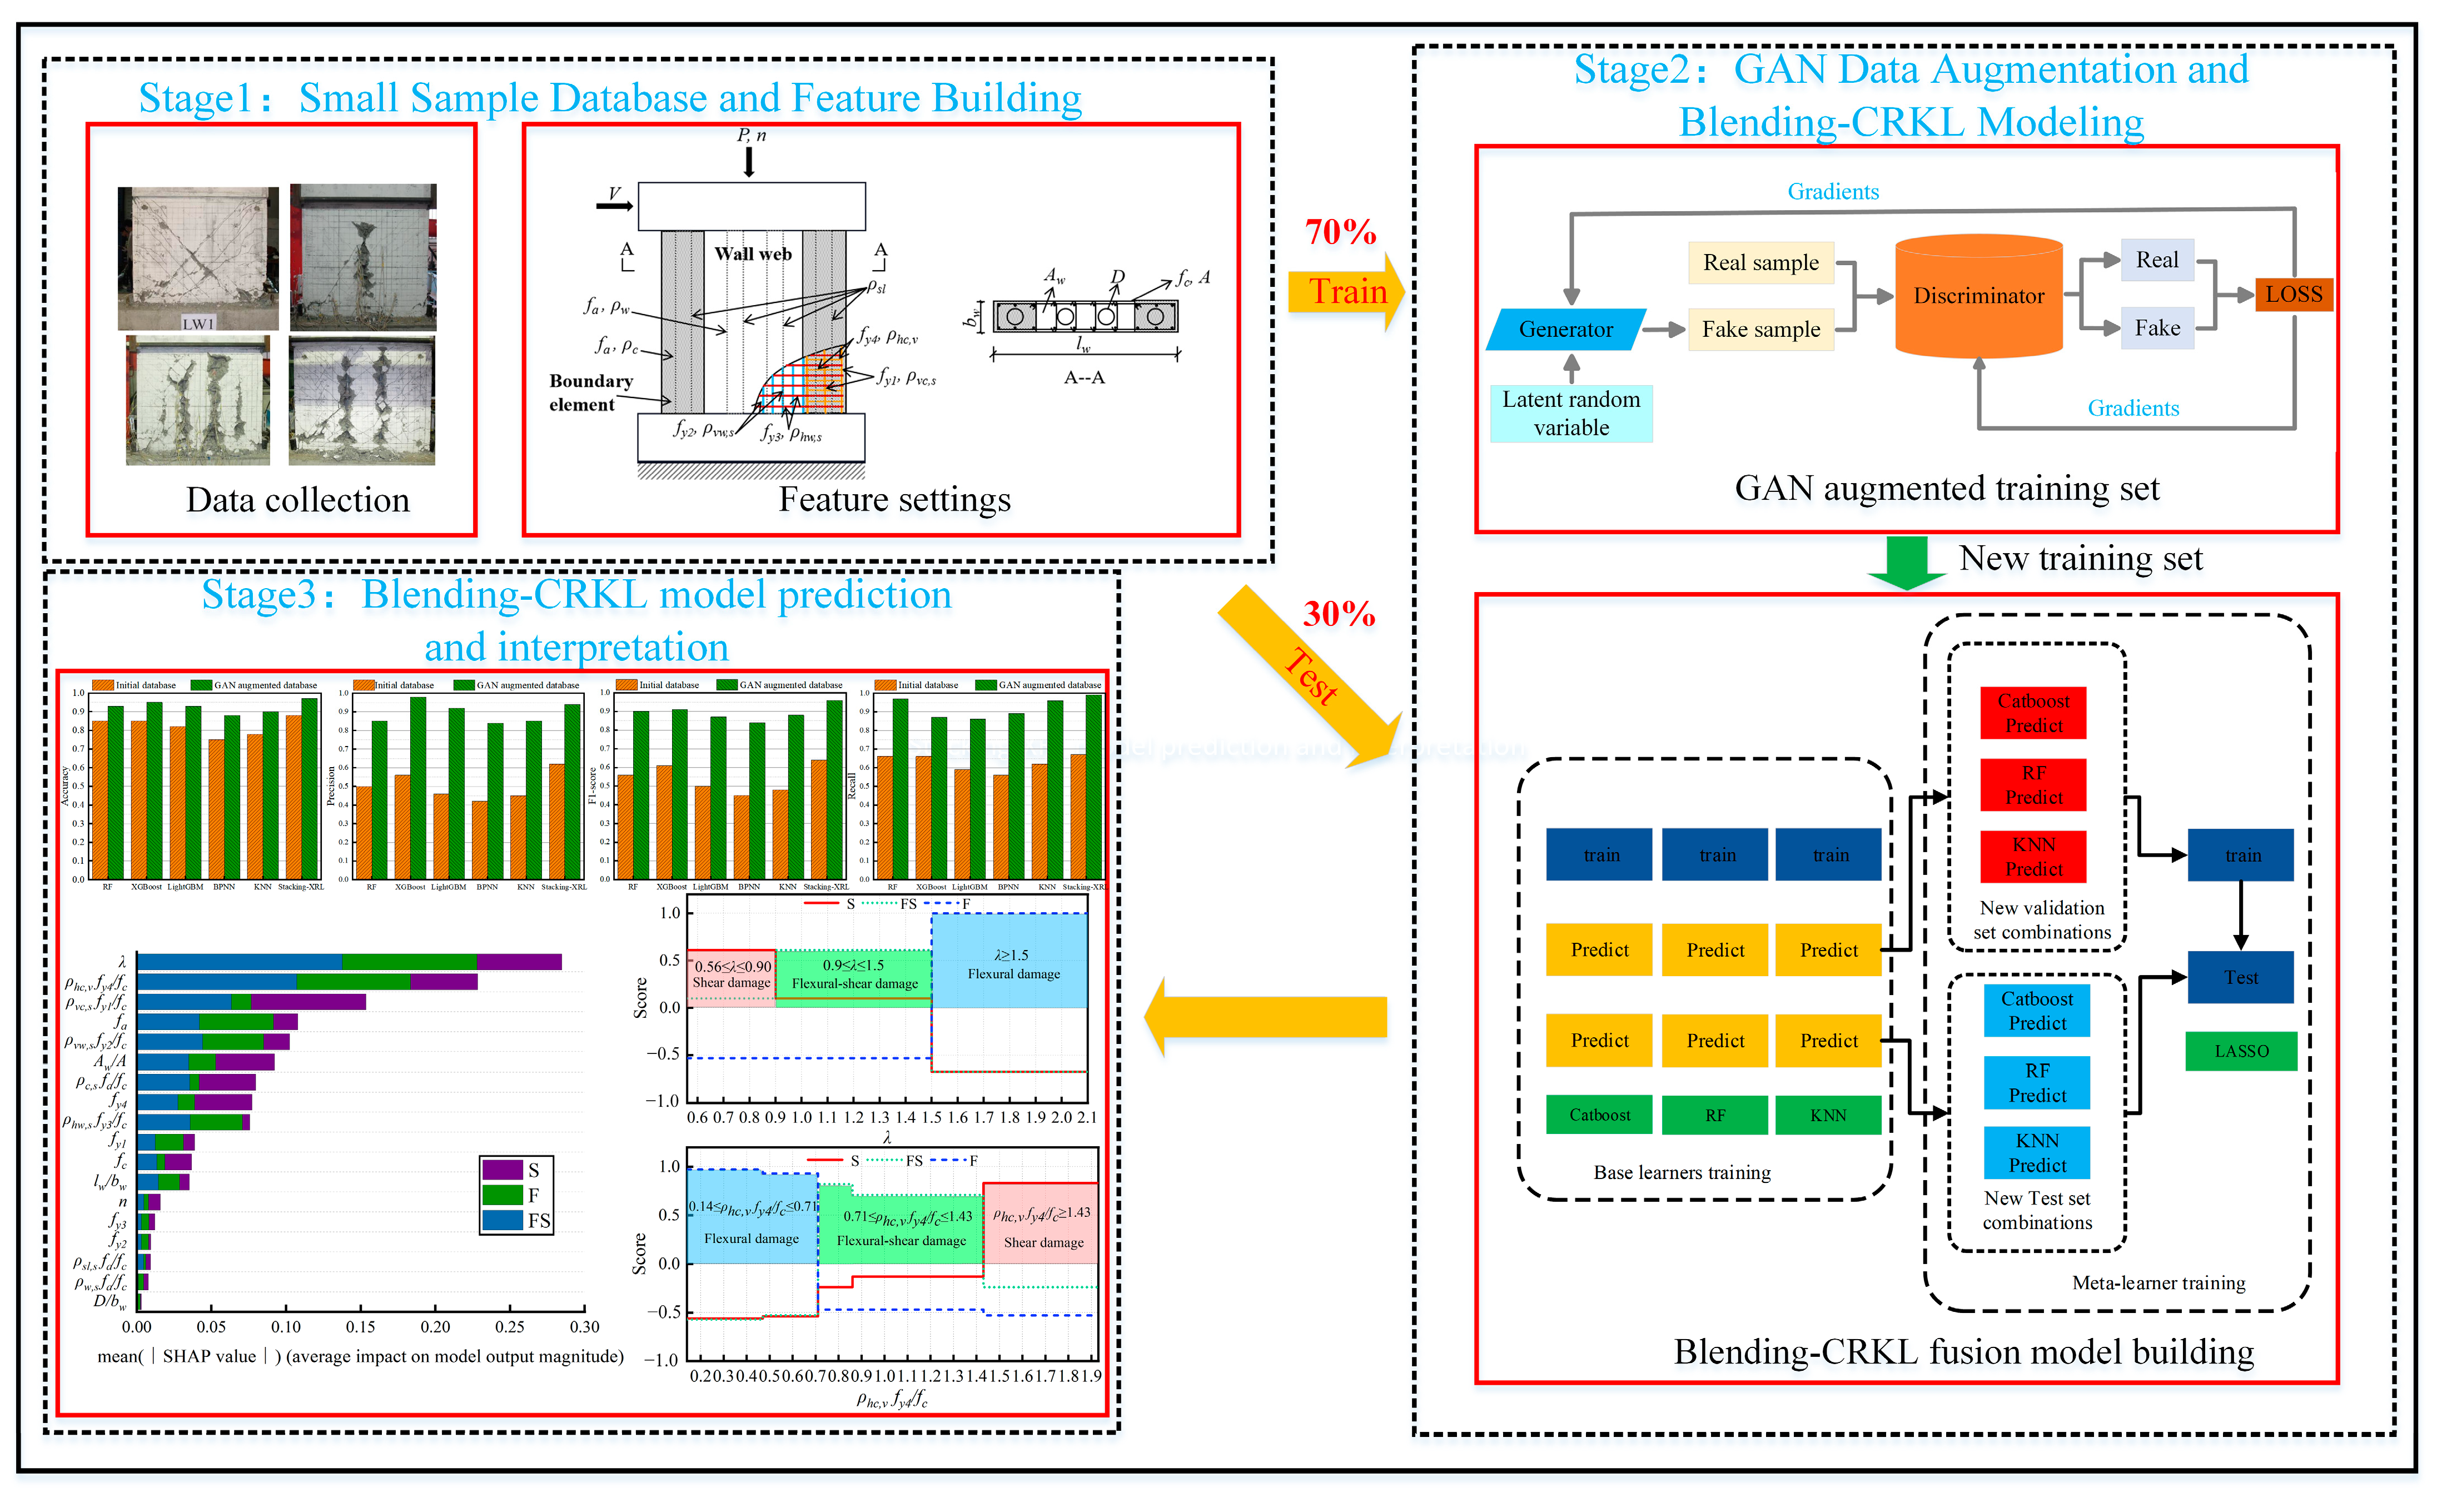
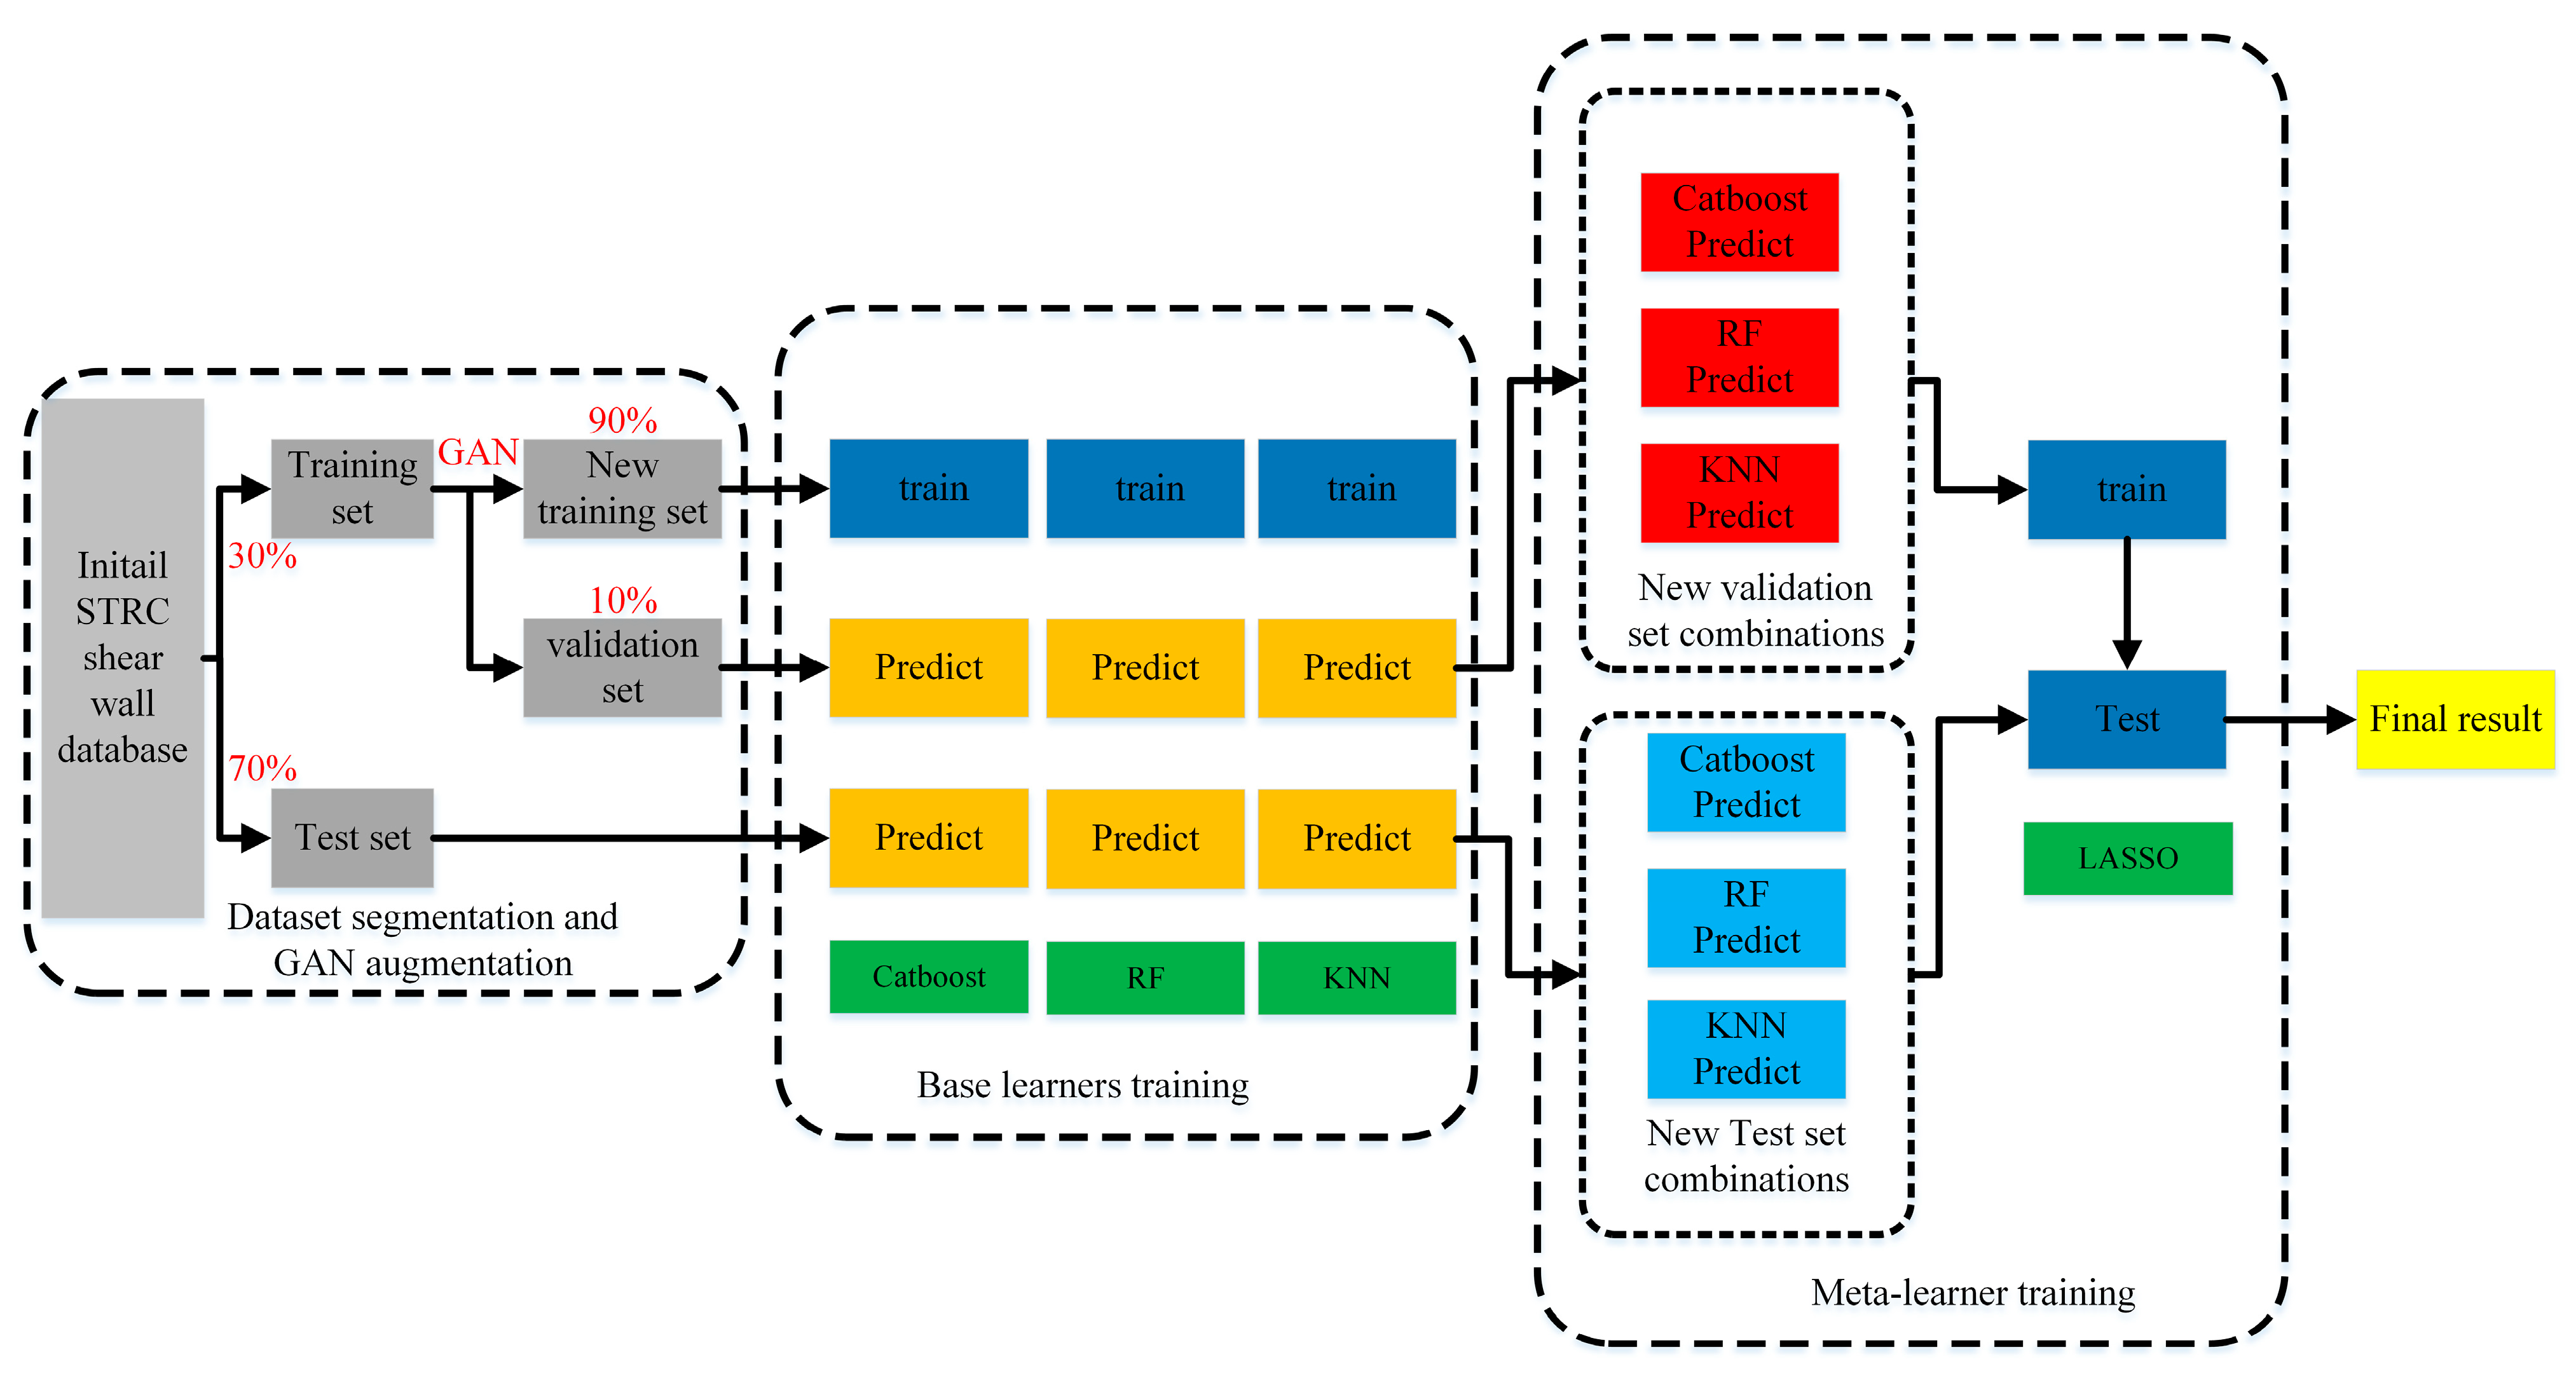
The overall implementation process of applying GAN to the data augmentation of the training set and constructing a Blending-CRKL fusion model for rapid identification of STRC shear wall failure modes is shown in Figure 4. It mainly includes three stages: establishment of a small sample STRC shear wall database and features, GAN data augmentation and Blending model establishment, and Blending-CRKL model prediction and interpretation. The specific process is as follows:
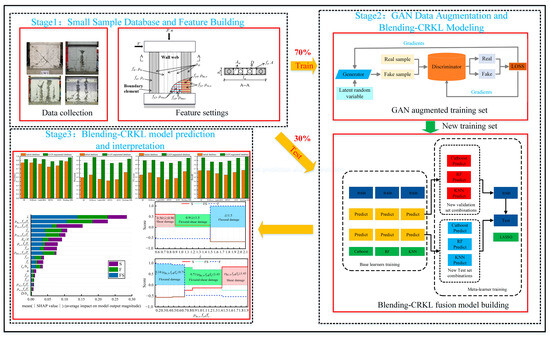
Figure 4.
An implementation framework for predicting and interpreting the failure modes of STRC shear walls by Blending-CRKL fusion model based on GAN augmented data.
- (1)
- In the first stage, a small sample database of STRC shear wall tests is established based on the existing literature [29,30,31,32,33,34], and model features are established based on existing specifications and experimental research.
- (2)
- In the second stage, the deep learning GAN is applied to augment the training set data, and a two-layer Blending algorithm framework is used to establish a fusion model (Blending-CRKL) for RF, Catboost, K-Nearest Neighbors (KNN), and Least Absolute Shrinkage and Selection Operator (LASSO).
- (3)
- In the third stage, the effectiveness of the proposed GAN augmented training set method is verified, and the Blending-CRKL fusion model is used to predict and explain the failure modes of STRC shear walls, analyzing their important features and the characteristic value ranges of different failure modes.
3.2. Generative Adversarial Networks
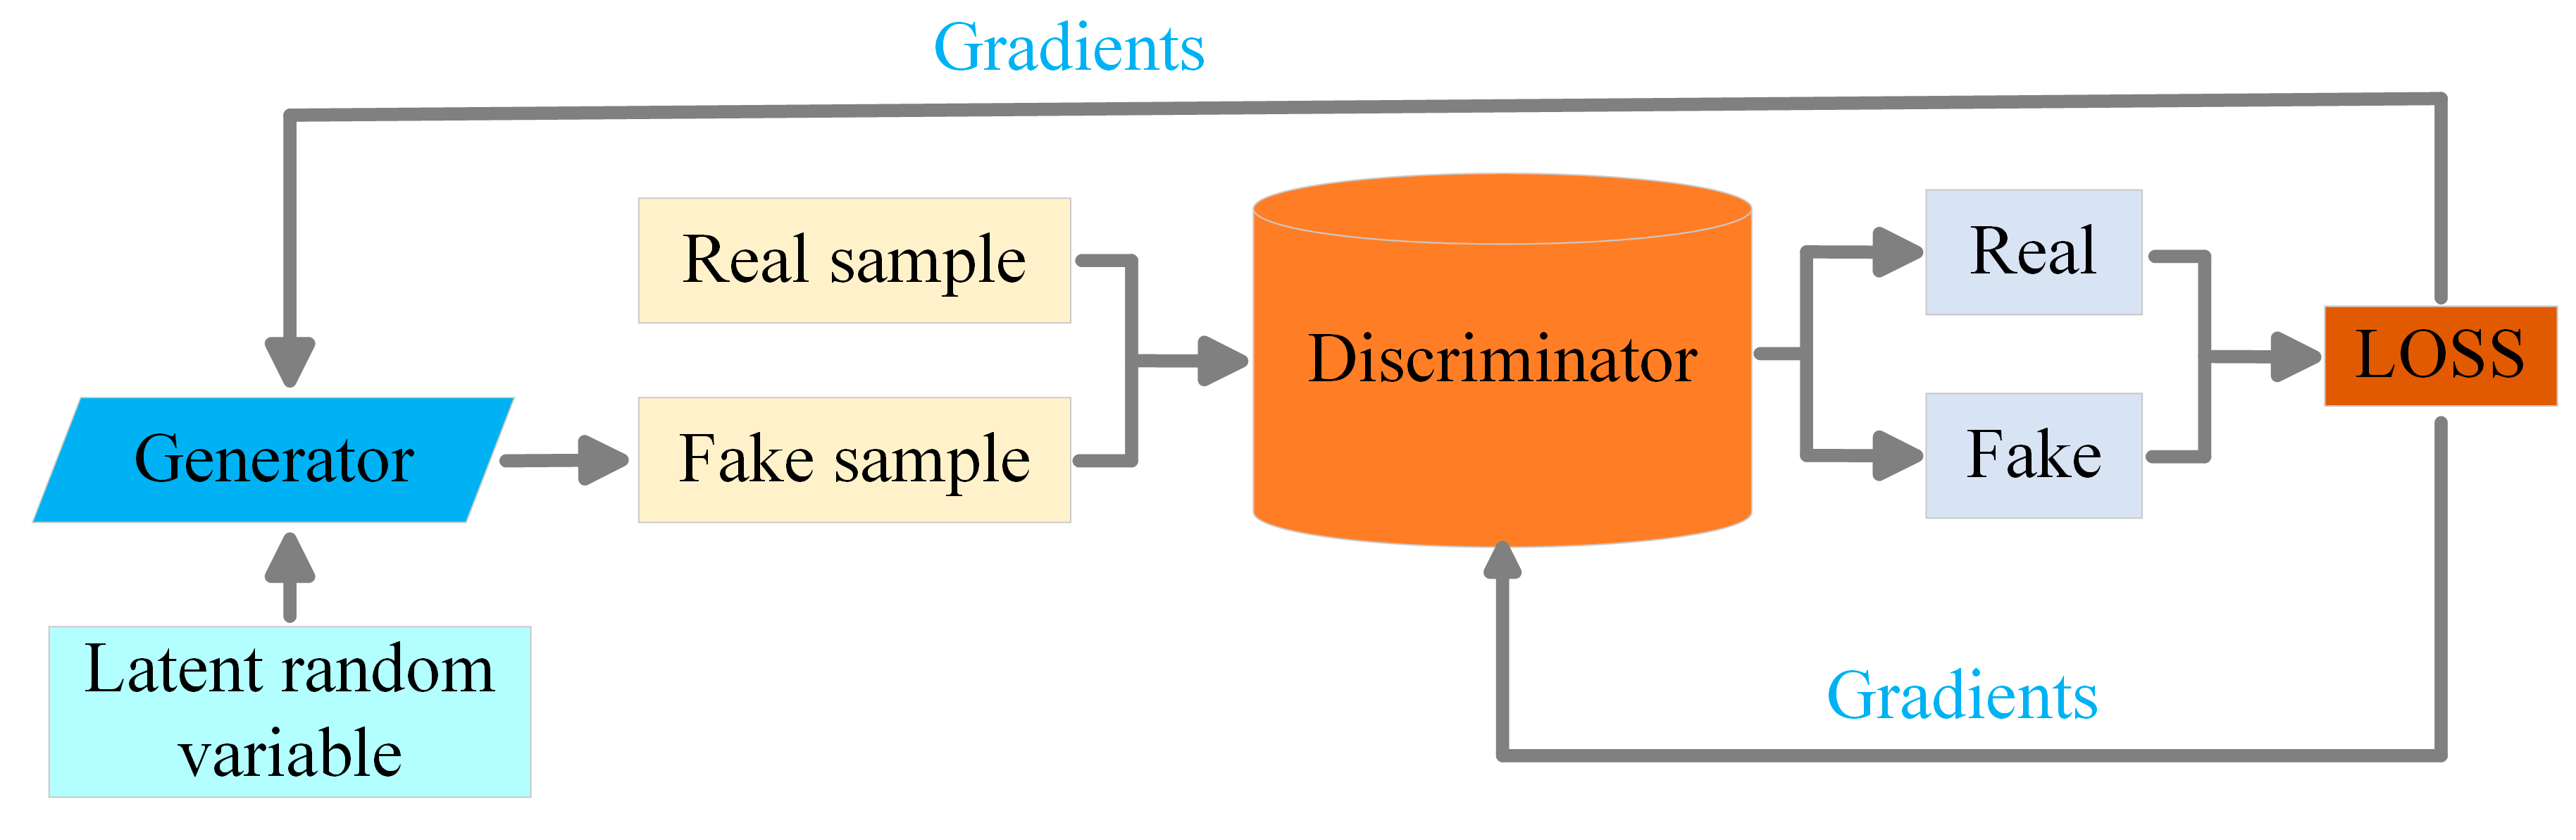
A Generative Adversarial Network (GAN) is a framework proposed by Goodfellow [41] in 2014, which continuously generates new data through the competition between two neural networks. GAN consists of two modules: the generator and the discriminator. The core idea is that the generator and the discriminator play against each other. The generator generates erroneous samples based on random numbers generated from a Gaussian distribution, attempting to deceive the discriminator. The discriminator, on the other hand, tries to distinguish between correct and erroneous samples. The training process continues until the discriminator cannot differentiate between the generated imitation samples and the original real samples. The structure of GAN is shown in Figure 5. The generator is an unsupervised neural network that establishes a production model based on the mathematical and statistical information and features of the data, while the discriminator is a binary classification model.
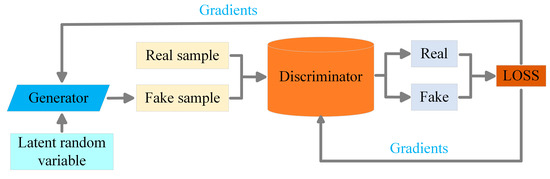
Figure 5.
GAN model structure.
Assuming z is random noise and x is real data, the generative network and the discriminative network can be represented as G and D, respectively. D can be seen as a binary classifier. If the loss function is represented by cross-entropy, the optimization objective function of the model can be expressed as follows:
GAN requires consideration of gradient disappearance during training. The above objective function is usually expressed as follows:
The main objective of G is to minimize the objective function V(G, D) in the expression. G aims to make G(z) closer to real data. In this case, a smaller value of log(1 − D(G(z))) indicates that the data generated by the generator are closer to real data. On the other hand, the purpose of D is to maximize the objective function V(G, D). Ultimately, when the probability of D recognizing real data is D(G(z)) = 0.5, generator G can generate data that are extremely similar to real data.
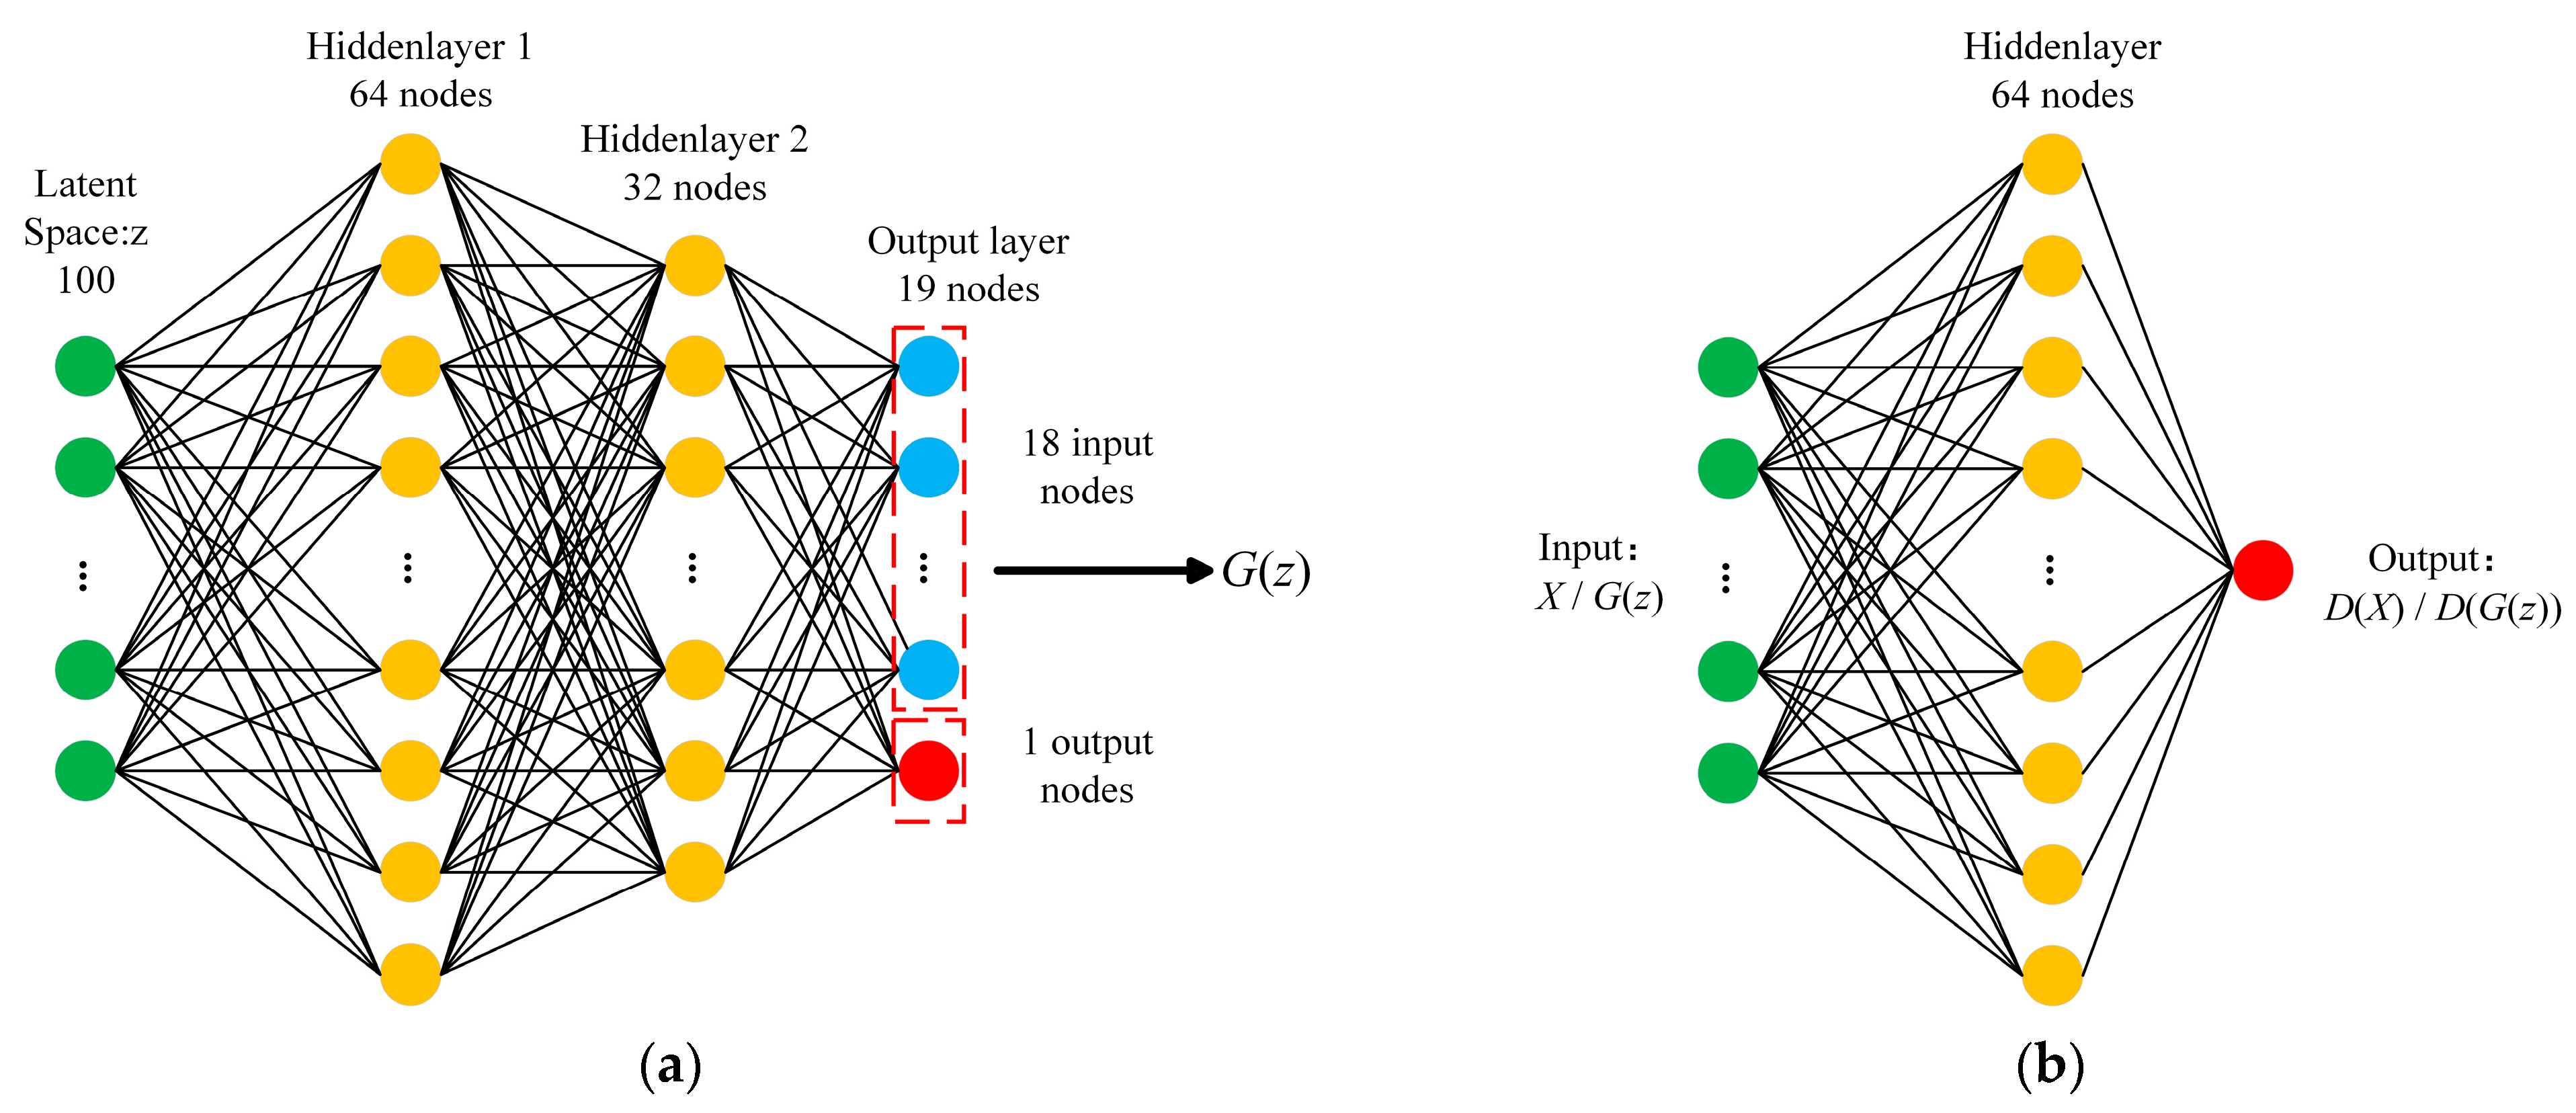
The structures of the generator and discriminator are shown in Figure 6a,b, respectively. In the training process of GAN, the parameter values of a GAN model significantly affect the quality of generated data, and choosing values that are too large or too small may lead to suboptimal results. For instance, the learning rate determines the magnitude of parameter updates in each iteration. A high learning rate can result in unstable training and prevent convergence of gradient descent, while a low learning rate can slow down the training process. Therefore, when generating STRC shear wall data, a balance between accuracy and efficiency should be considered to select appropriate parameter values for the GAN. Unfortunately, there are currently no heuristic optimization techniques available to determine the optimal values for each parameter in a GAN [21]. As a result, a trial-and-error strategy is often adopted, manually testing multiple values for each parameter and selecting relatively better ones. In this study, we tested the learning rate between 0.001 and 0.1, batch size between 20 and 132, noise dimension between 20 and 120, hidden layer size between 16 and 72, and the number of iterations between 50 and 2000. Considering the trade-off between data quality and efficiency, we found that the best performance of the GAN model was achieved with a learning rate of 0.02, batch size of 128, noise dimension of 100, and 1000 iterations. The loss function of the generator adopts the mean absolute error (MAE), and the loss function of the discriminator utilizes the binary cross-entropy (BCE), defined as follows:
where is the predicted value, is the true value, n is the sample size, and denotes the probability that the model output is .
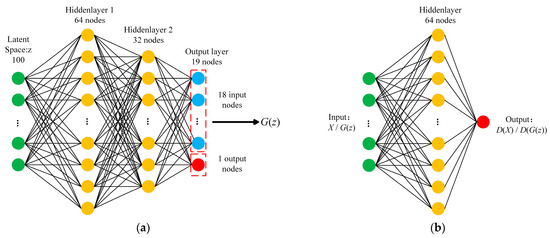
Figure 6.
GAN generator and discriminator network structure: (a) generator; (b) discriminator.
After 1000 iterations of training, the GAN generated 1000 new samples. However, due to the high degree of freedom and scalability of GAN, the generated samples have a certain level of randomness, resulting in some samples that fall outside the desired range. After excluding the samples that exceed the expected range by using the maximum and minimum values of the original data, combined with engineering experience, there are still 242 newly generated samples remaining.
3.3. Blending Fusion Prediction Model Building
To address the issue of inaccurate recognition of the failure modes of STRC shear walls by a single model, this study employs the Blending fusion framework to fuse multiple ML models to improve overall performance. Blending is an ensemble learning fusion framework that allows for the flexible combination of base learners and meta-learners, using disjoint datasets for training different layers, thus avoiding the problem of data leakage [42].
Blending is defined as multiple base learners are known (g1, g2, g3, …, gt, …, gn), and each gt has the same weight. For the classification problem:
where G(x) represents the fused model, and K denotes the label category value. The base learners in the Blending framework should have good predictive performance but differ in the model structure. This is because models with good predictive performance can enhance the overall prediction accuracy of the ensemble model, while the diversity among models determines the generalization ability of the ensemble model. On the other hand, the meta-learner should be relatively simple to avoid model overfitting. Therefore, in this study, within a two-layer Blending framework, Catboost, RF, and KNN are chosen as base learners, while LASSO is selected as the meta-learner, resulting in a multi-model fusion model named the Blending-CRKL model. The process flowchart for this fusion model in predicting the damage pattern of STRC shear walls is shown in Figure 7, with the specific steps outlined as follows:

Figure 7.
The prediction process of the Blending-CRKL fusion model.
- (1)
- Dataset segmentation and GAN augmentation. In this study, the initial collected STRC shear wall database was randomly divided into a 70% training set and a 30% testing set. The training set was used for model training, while the testing set was used for model validation. To fully train the model, the 242 new samples generated by GAN were merged with the training set samples, resulting in a new training set containing 347 samples. And 10% of the samples of the new training set are randomly selected as the validation set.
- (2)
- Training process of base learners. The Blending fusion model utilizes Catboost, RF, and KNN models as base learners, training them separately on the new training set and making predictions on the validation and test sets. The predicted values of the validation set by the Catboost, RF, and KNN models are used as the training set for the next layer, while the predictions on the test set are used as the test set for the next layer.
- (3)
- Training process of the meta-learner. In the training process of the LASSO meta-learner, a new training set is formed using the predicted values of the base learners on the validation set, and the LASSO model is trained on this new training set. The final prediction results are obtained by testing the model on a new test set, which consists of the predicted values of the base learners on the test set.
3.4. Model Evaluation Criteria
To comprehensively evaluate the predictive performance of the failure modes of STRC shear walls, this paper considers them as classification prediction problems. For the failure modes, this paper selects precision, recall, accuracy, and F1-score as evaluation indicators [14]:
where TP, TN, FP, and FN indicate true positives, true negatives, false positives, and false negatives for STRC shear wall failure modes.
Precision represents the proportion of the number of samples correctly predicted as positive examples to the number of samples predicted as positive examples, measuring the model’s ability to predict positive examples. The recall represents the proportion of the number of samples correctly predicted as positive examples to the number of actual positive examples, measuring the classifier’s ability to identify positive examples. Accuracy represents the proportion of the number of samples correctly classified by the model to the total number of samples, and higher accuracy indicates better model performance. F1-score is a comprehensive indicator that considers precision and recall, which is the harmonic mean of precision and recall, and higher F1-score values indicate better model performance.
4. Analysis of Results and Discussion
4.1. Comparison of Model Prediction Performance before and after GAN Augmented Training Set
To validate the effectiveness of the GAN data augmentation technique in handling small-sample STRC shear wall data, this study employed six models, including traditional ML models (BPNN, KNN), boosting ensemble learning models (Catboost, LightGBM), bagging ensemble learning model (RF), and the proposed Blending-CRKL model, to predict the failure mode of STRC shear walls. By comparing these six models, we gain a comprehensive understanding of the changes in prediction performance metrics for different types of models before and after applying GAN data augmentation. These models were trained using both the initial training set and the GAN-augmented training set; the changes in prediction performance metrics are presented in Figure 8, and detailed results are provided in Table 2.
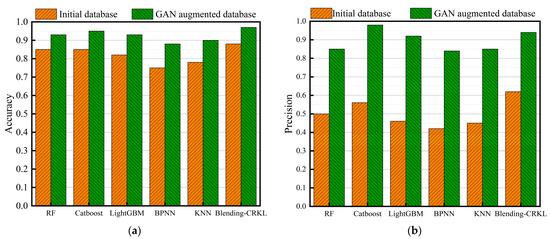

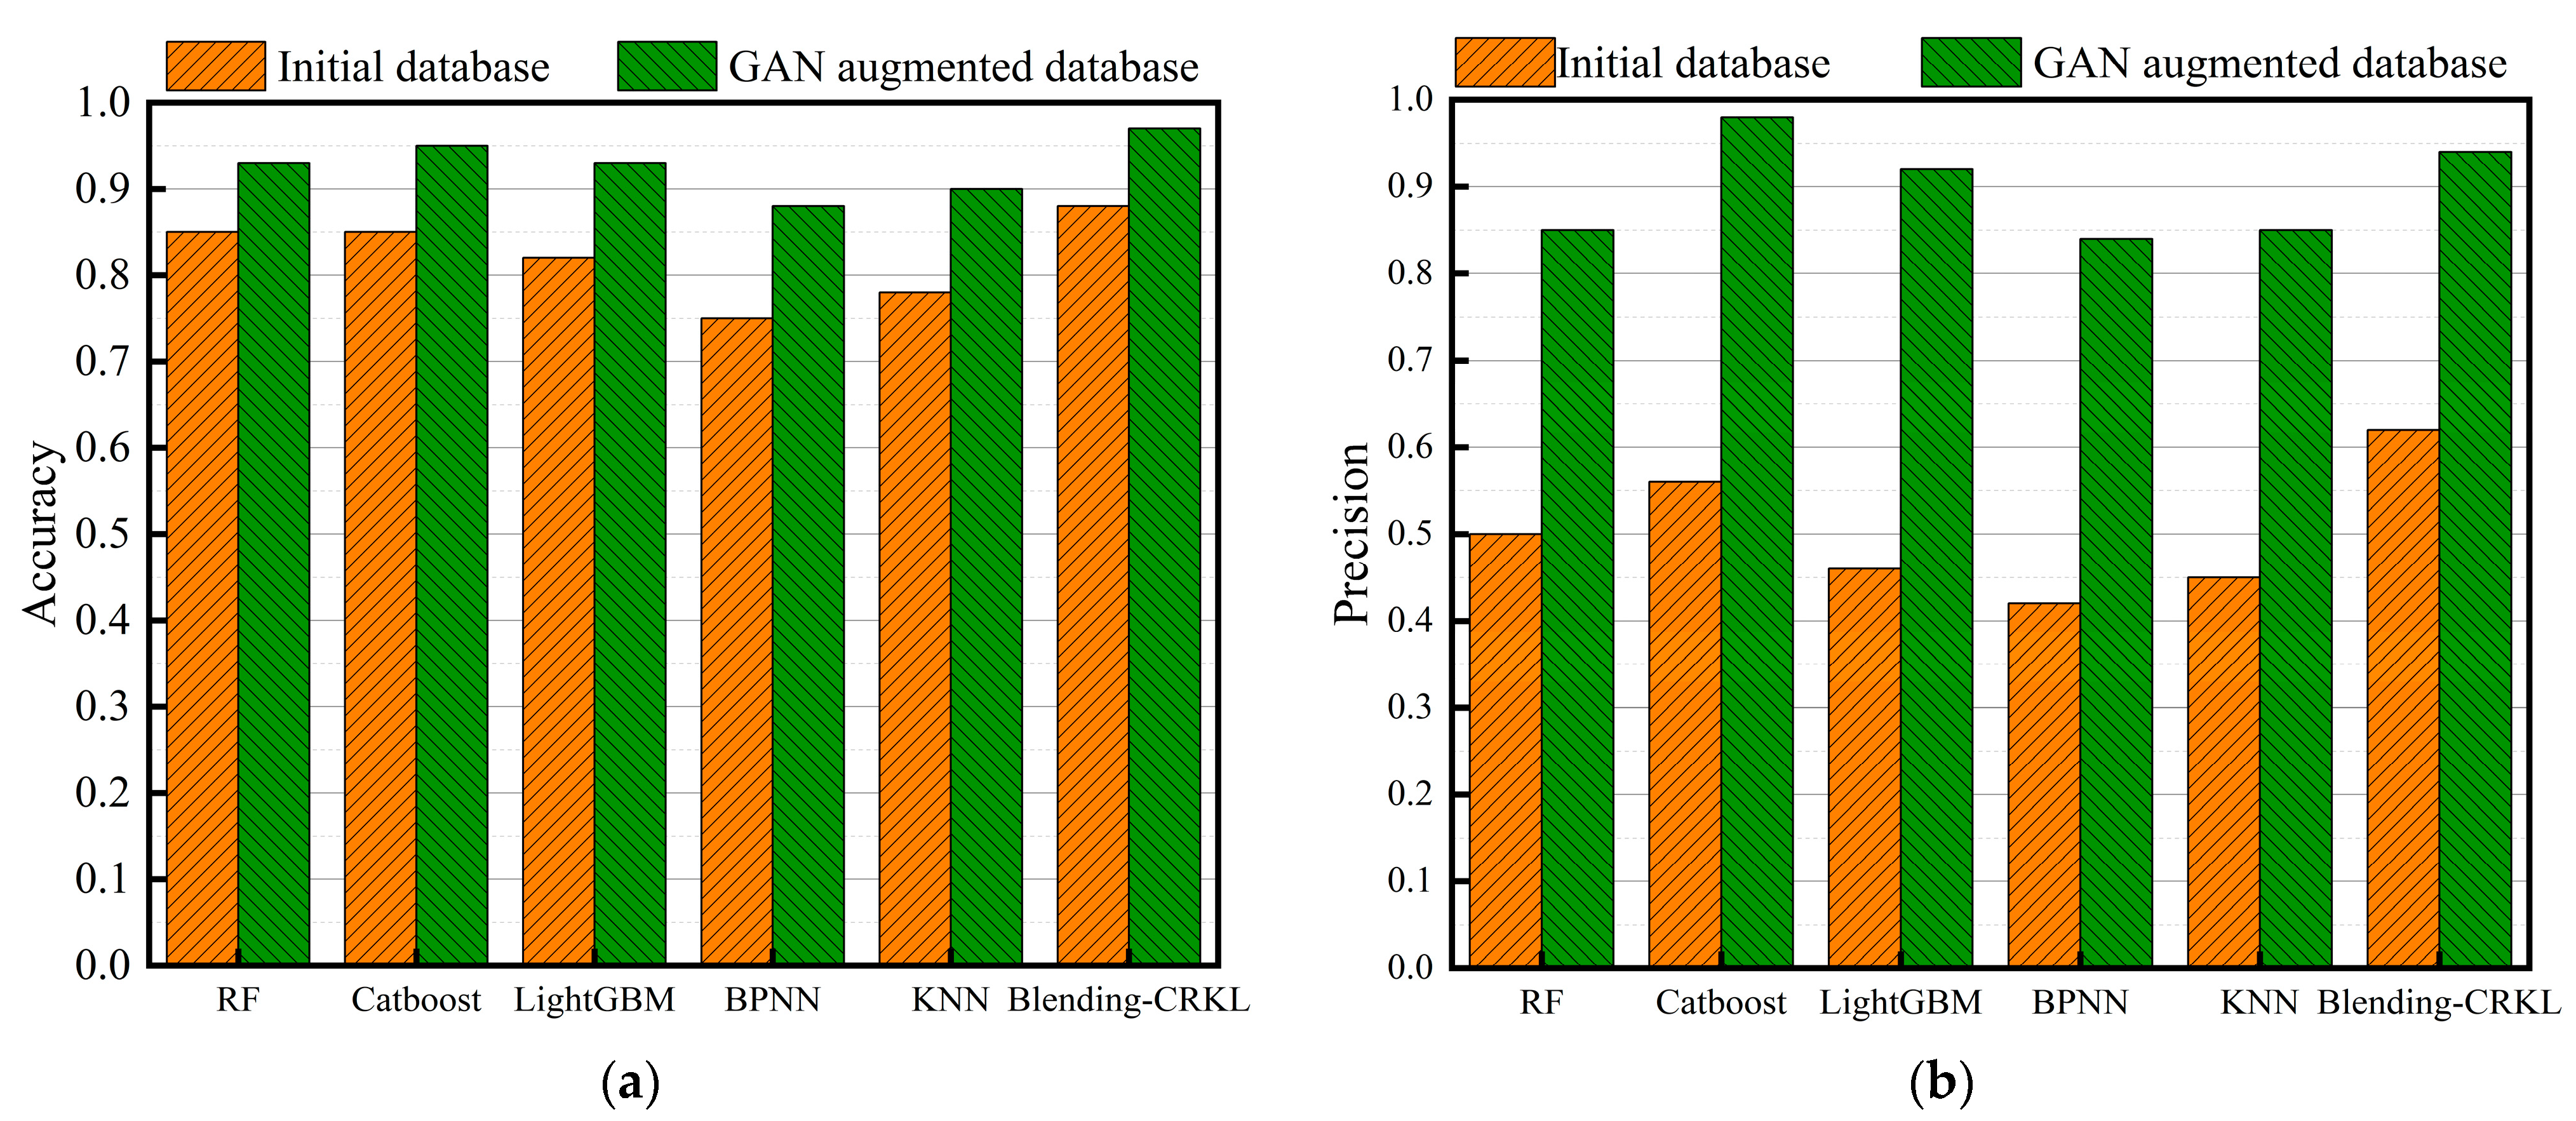
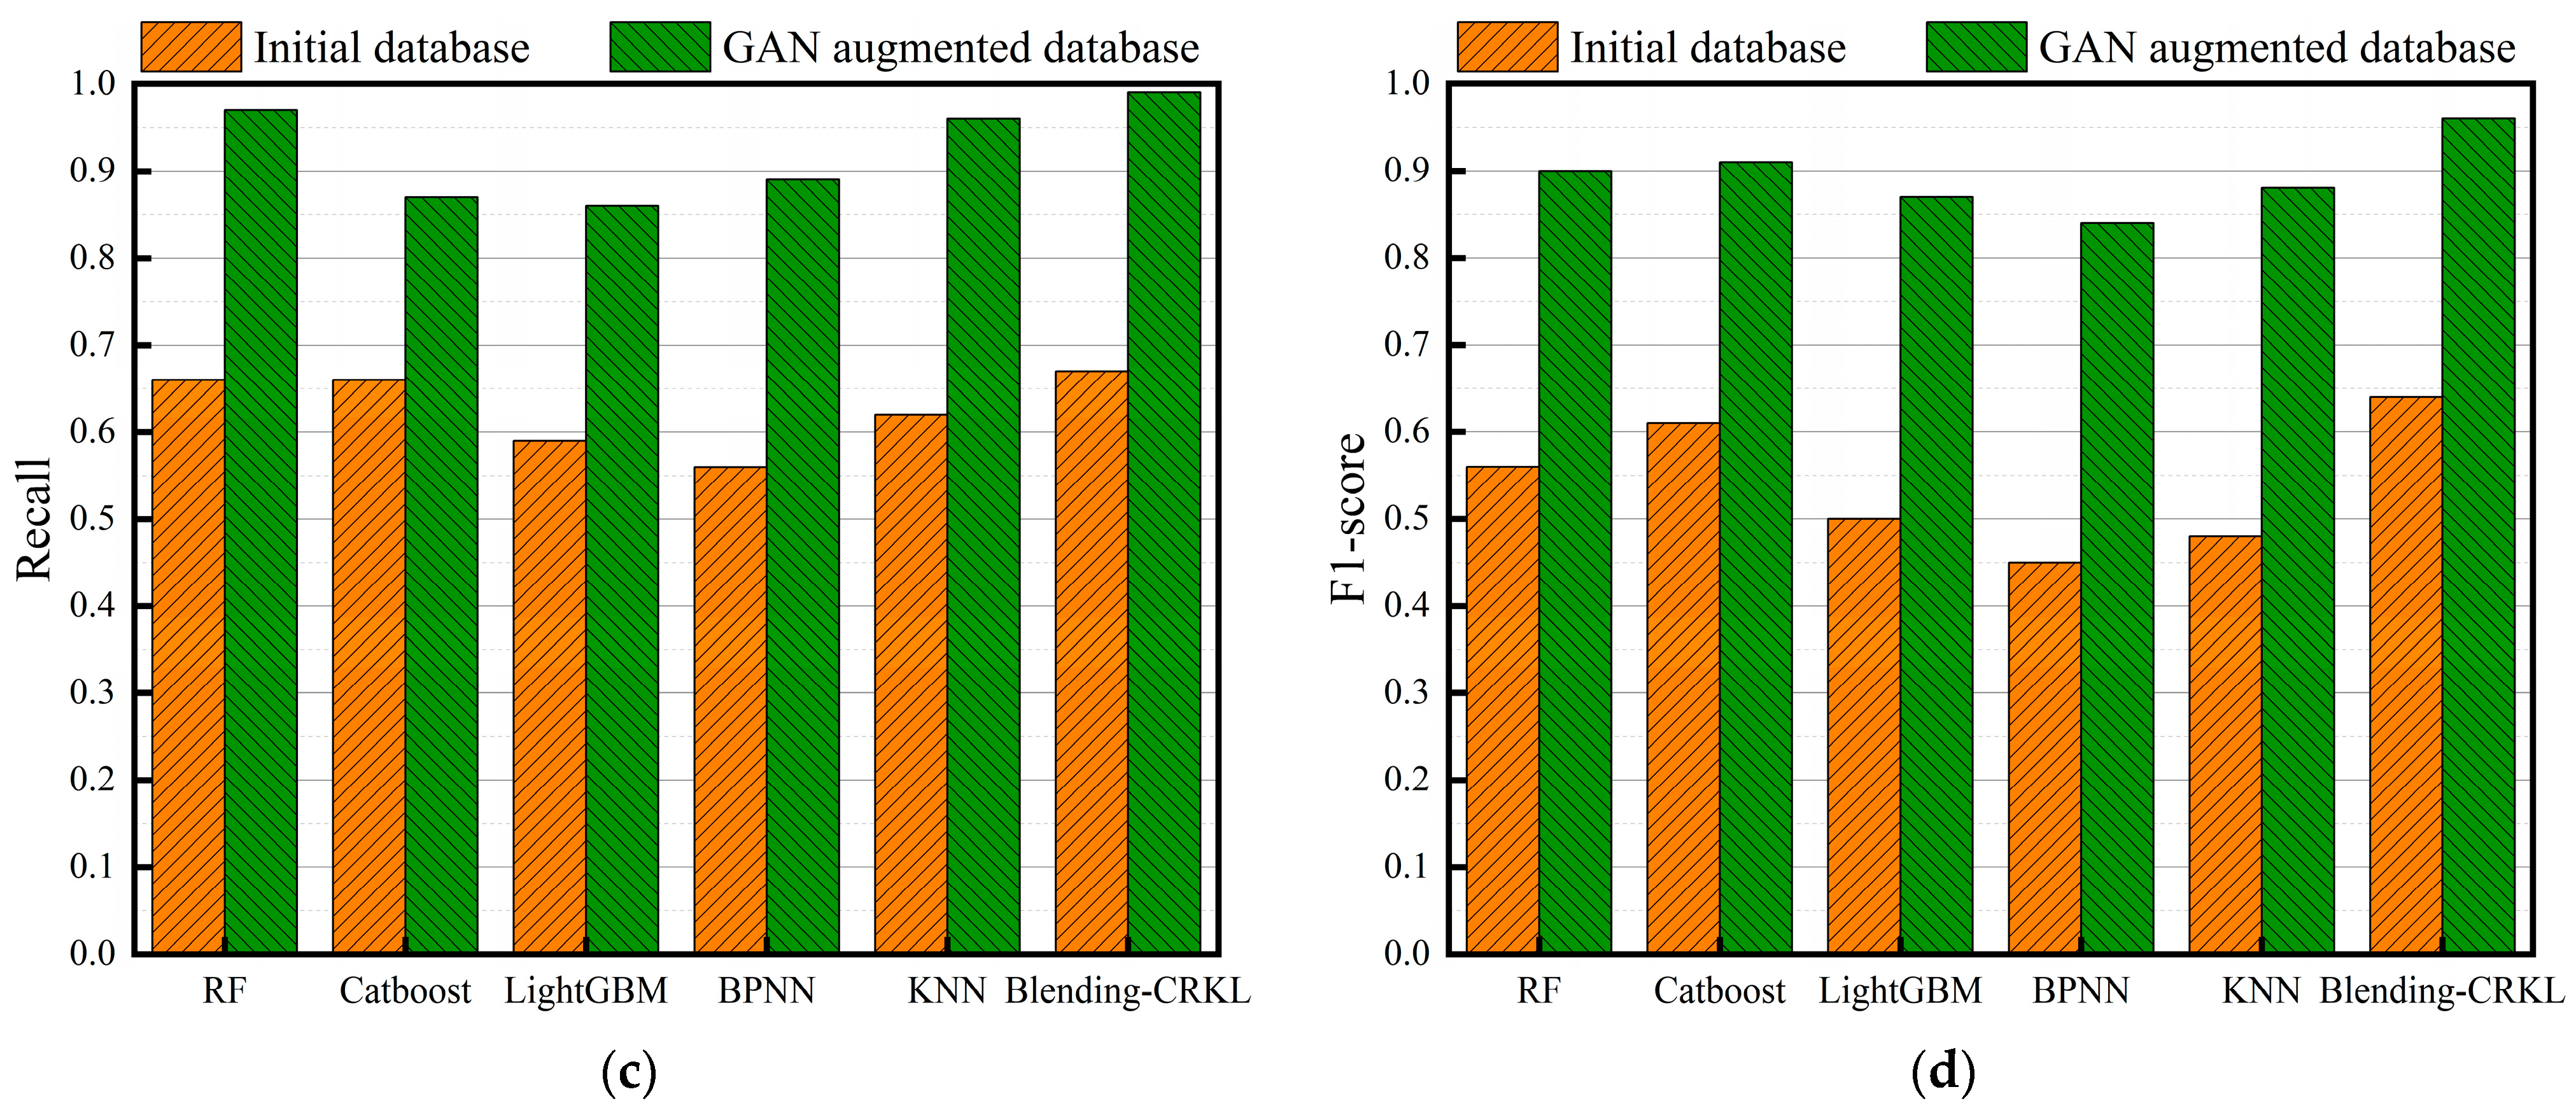
Figure 8.
Performance comparison of STRC shear walls failure modes prediction models before and after GAN augmented training set: (a) accuracy; (b) precision; (c) recall; (d) F1-score.
Table 2.
Metrics improvement of STRC shear wall failure modes prediction models before and after GAN data augmentation.
From Figure 8, it can be observed that the accuracy, precision, recall, and F1 scores of all six models have significantly improved after using GAN for data augmentation. The accuracy of the six models has increased from 0.75–0.88 to 0.88–0.97. Particularly, the proposed Blending-CRKL model achieved an accuracy of 0.97 after improvement. It is also evident that both in the GAN-augmented dataset and the original dataset, the Blending-CRKL model outperforms other models in terms of accuracy, precision, recall, and F1-score. According to Table 2, compared to the initial training set, the average accuracy, precision, recall, and F1 scores of the six models have improved by 13%, 81%, 48%, and 67%, respectively. The proposed Blending-CRKL model in this paper has also shown improvement in all four metrics, with increases of 10%, 94%, 48%, and 50%, respectively.
In summary, for the failure modes prediction of STRC shear walls, GANs address the issue of insufficient training samples by generating new samples. The use of GANs to augment the training set significantly improves the predictive performance of the model, indicating that GANs are highly effective in handling small sample databases.
4.2. Comparison of Various ML Models
To assess the performance of the Blending-CRKL fusion model in predicting the failure modes of STRC shear walls, KNN, BPNN, RF, LightGBM, and Catboost were used for comparison. The input features for all six models included the 18 features described in Section 2.3 of this paper. The training sets were augmented using GAN, while the initial partitioned test sets were used for evaluation. The models were implemented using codes based on the open-source Python-3.6.5 software package Scikit-learn, with default parameter settings.
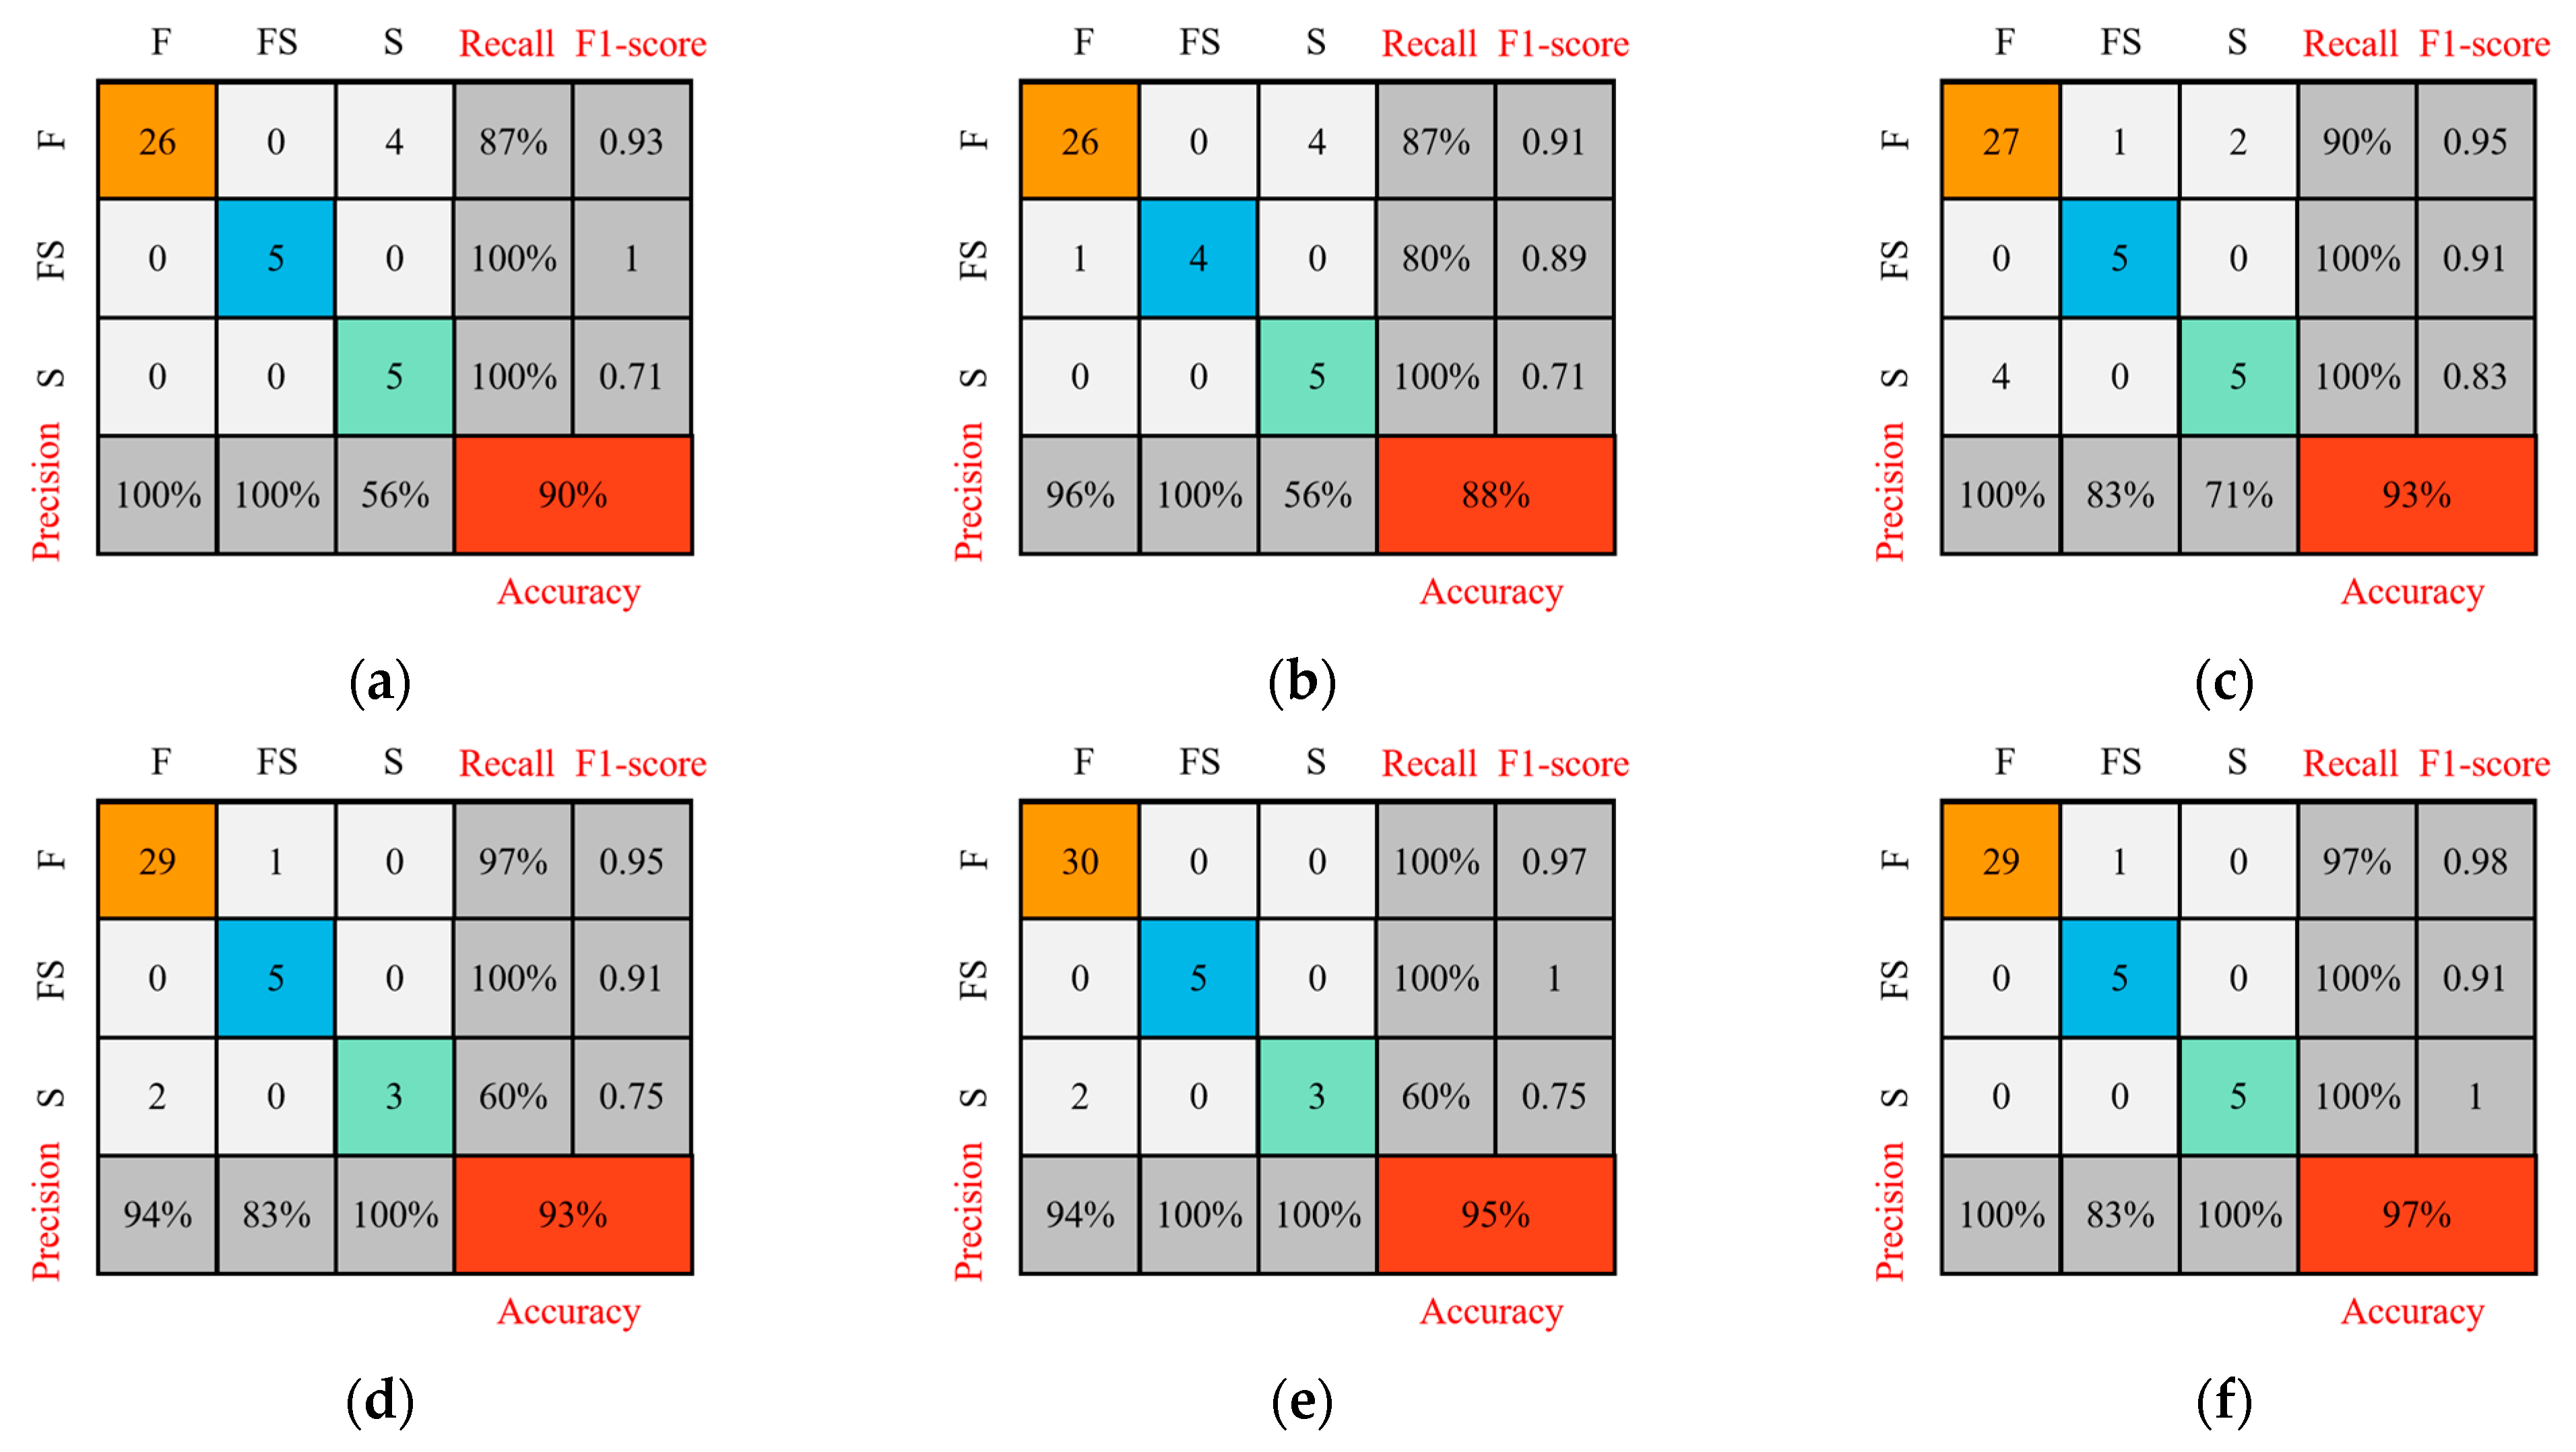
The confusion matrix is a commonly used method for evaluating classification tasks, as it provides a detailed overview of the predictive performance of each ML model. In this paper, the diagonal line of the confusion matrix represents the number of correct predictions of STRC shear wall failure modes by the ML models in the test set, while the positions beyond the diagonal line represent the number of incorrect predictions. The confusion matrices for the prediction of failure modes of STRC shear walls by the six models in the test set are shown in Figure 9. From Figure 9, it can be observed that overall, the six models exhibit good predictive accuracy for the failure modes of STRC shear walls. Except for the BPNN model, the accuracy of the other models exceeds 90%, with the Blending-CRKL model achieving the highest accuracy of 97%, followed by the Catboost model. Compared to the KNN and Catboost models, the Blending-CRKL fusion model has the lowest F1-score for the flexural–shear failure mode (FS), indicating poorer predictive performance for this failure mode of STRC shear walls. However, overall, the Stacking-CRK fusion model still demonstrates significant advantages over individual models in predicting the failure modes of STRC shear walls.
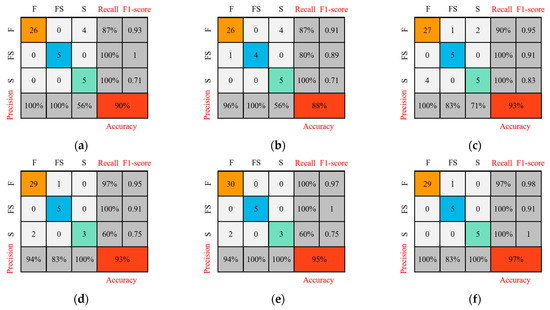
Figure 9.
Comparison of confusion matrices for different STRC shear wall damage mode prediction models: (a) KNN; (b) BPNN; (c) RF; (d) LightGBM; (e) Catboost; (f) Blending-CRKL.
4.3. Checking of Robustness and Reliability for Stacking-CRK Model
The robustness of the ML model refers to its resistance to changes and perturbations in the input data. In practical applications, input data are affected by various factors, such as noise, missing values, outliers, etc. If the model is more sensitive to the changes and perturbations of these factors, the prediction performance of the model is bound to be affected. Reliability check refers to whether the model performs consistently on different datasets. There can be various ways to divide the training and testing sets. If the prediction performance of the model varies widely under different datasets, the reliability of the model cannot be guaranteed. Therefore, it is necessary to test the robustness and stability of the model. In this study, the STRC shear wall database established in Section 3.1 was randomly partitioned into training and testing sets in a 7:3 ratio for 100 iterations. The training sets for each iteration were augmented using GAN, and the Blending-CRKL model was used to predict the failure modes of STRC shear walls. The performance metrics of the model are shown in Figure 10. Despite variations in the predictive accuracy of the Blending-CRKL model on different datasets during the 100 random experiments, overall, the model still demonstrates excellent performance. From Figure 10, it can be seen that the precision, recall, F1-score, and accuracy of the Blending-CRKL model fluctuate around 97%, 96% and 0.96, 96%, respectively, with a maximum standard deviation of 1.48. These results indicate that the Blending-CRKL established in this paper exhibits good robustness and stability, making it suitable for predicting the failure modes of STRC shear walls.
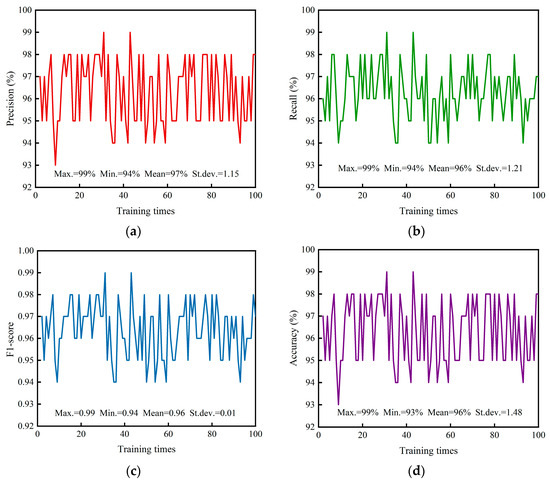
Figure 10.
STRC shear wall failure modes predictability metrics: (a) precision; (b) recall; (c) F1-score; (d) accuracy.
4.4. Interpretation of STRC Shear Walls Failure Modes Prediction Model
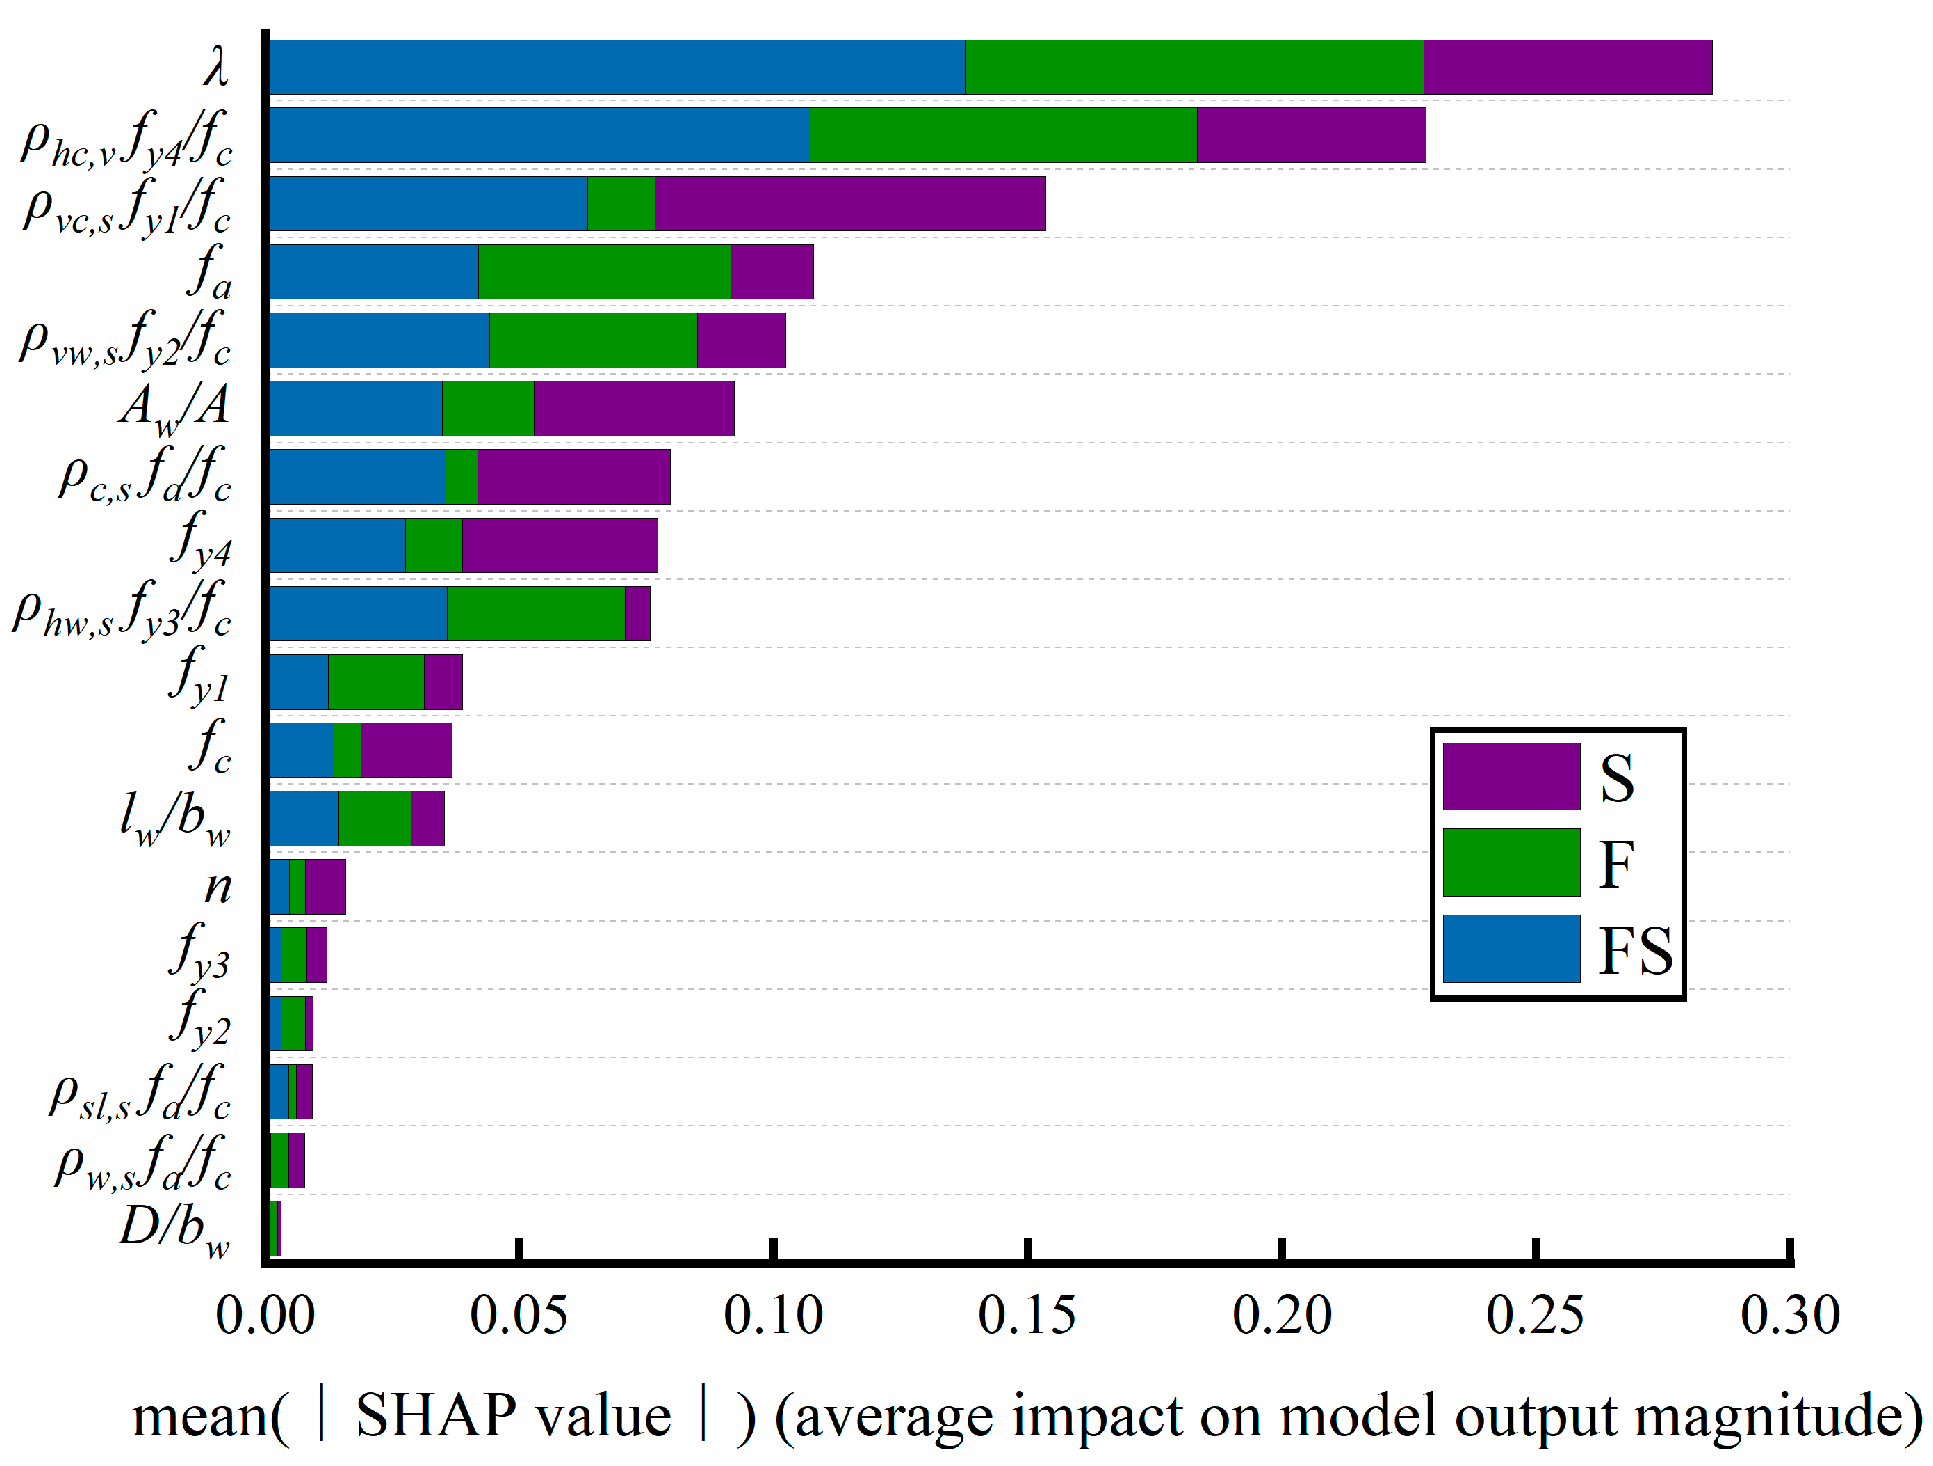
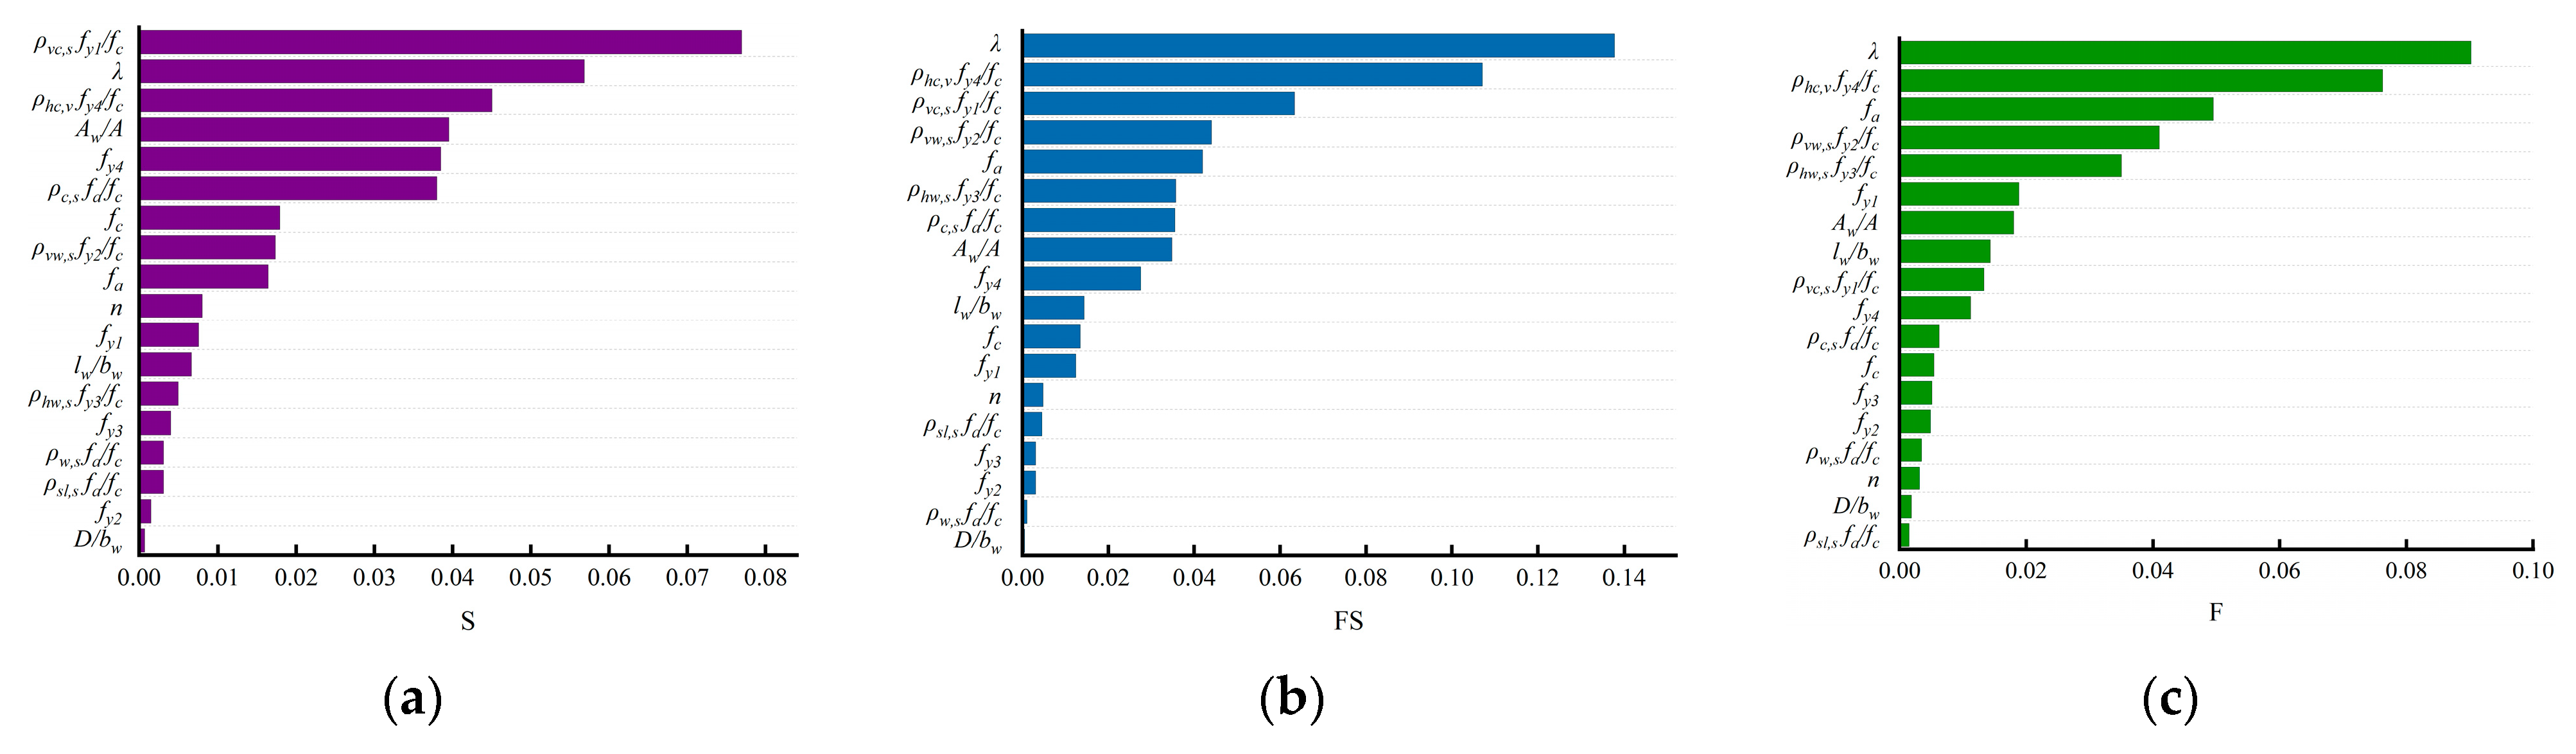
To analyze the significant variables of the STRC shear walls failure modes, this study employs the SHAP [12] method for global interpretation of the Blending-CRKL model. Figure 11 shows the ranking of the important features of the STRC shear walls failure modes prediction model. The horizontal coordinates indicate the absolute value of the Shapley value of each feature, and the larger the value indicates, the more important the feature is. From Figure 11, it can be seen that the shear–span ratio (λ) plays the most important role in recognizing the failure modes of STRC shear walls, followed by the horizontal bar index in the boundary element (ρhc,v fy4/fc) and the vertical bar index in the boundary element (ρvc,s fy1/fc). The influence of the steel tubular diameter-to-wall thickness ratio (D/bw) on the failure mode is very small. As shown in Figure 12, different failure modes have different important characteristics. In flexural and flexural–shear failure, the most important feature is shear–span ratio (λ), while in shear failure, the most important feature is the vertical bars index in boundary element (ρvc,s fy1/fc). Therefore, the reinforcement configuration of the boundary elements plays a crucial role in the shear and flexural shear failure of STRC shear walls.

Figure 11.
Ranking of important features of STRC shear wall failure modes.
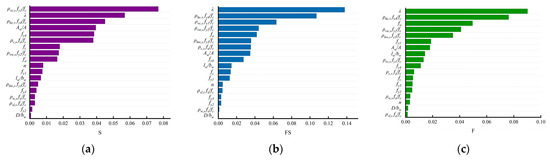
Figure 12.
Ranking of important features for different STRC shear wall failure modes.
4.5. STRC Shear Walls Failure Modes Boundary Analysis
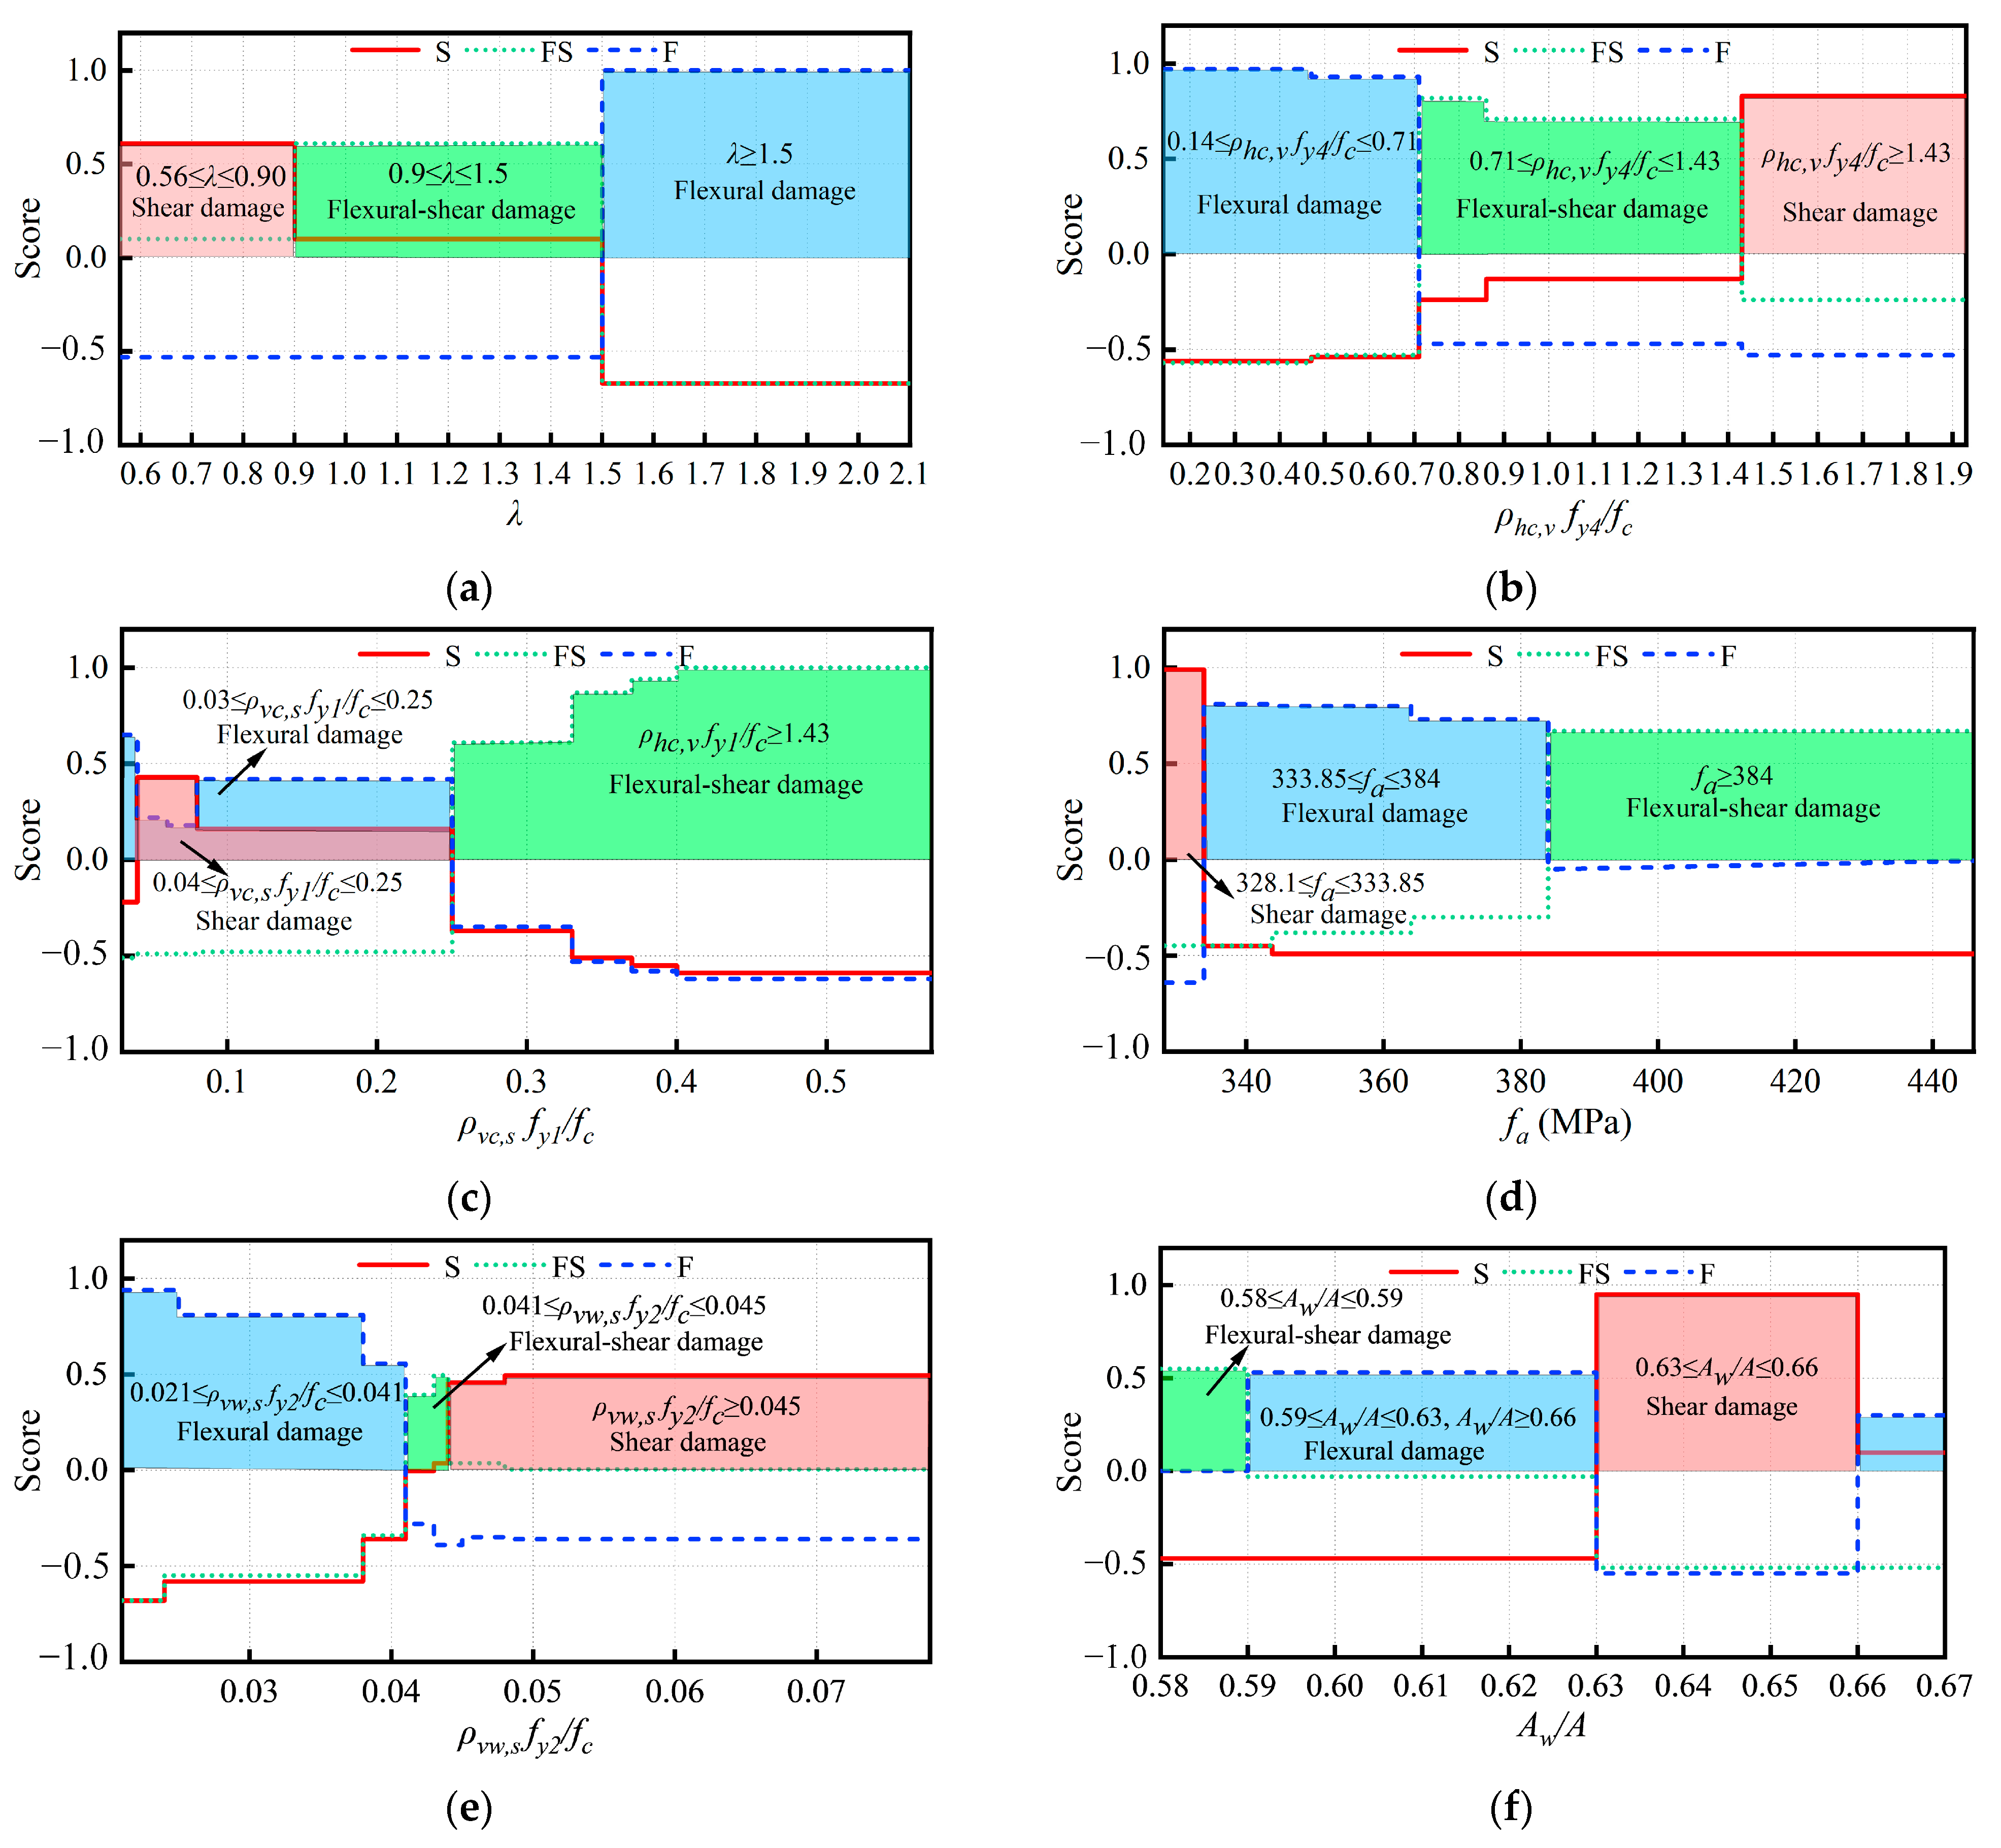
Boundary analysis of the failure modes of STRC shear walls can help structural engineers to better predict the failure modes of the walls and provide references for the corresponding design and strengthening. While flexural failure (F) and shear failure (S) of STRC shear walls are easily identified, flexural shear failure (FS) is often difficult to identify. Therefore, it is necessary to analyze the failure boundary conditions of SRCT shear walls. In this study, the relationship between the influence of the first six important features on the failure modes in the STRC shear walls was quantified, as shown in Figure 13. The horizontal coordinate indicates the value of the feature, and the vertical coordinate score represents the probability of occurrence. From Figure 13a, it can be seen that when λ ≥ 1.5, the score of flexural failure (F) occurs in STRC shear walls is close to 1, while the scores of shear failure (S) and flexural shear failure (FS) are negative, indicating that flexural failure is more likely to occur in STRC shear walls when λ ≥ 1.5. When 0.90 ≤ λ ≤ 1.50, the score for flexural shear failure (FS) is greater than 0.5, and the score for shear failure (S) is about 0.1, indicating that STRC shear walls with λ in this range are more likely to have flexural shear failure (FS) and have a smaller probability of shear failure (S). When 0.56 ≤ λ ≤ 0.90, shear failure (S) is more likely to occur. This is due to the fact that for higher or lower shear–span ratios (λ), many STRC shear walls are controlled by flexural moments or shear forces, respectively, while for moderate shear–span ratios (λ), many STRC shear walls are controlled by both flexural moments and shear forces. A similar analysis leads to a range of values for the remaining features for different failure modes, as shown in Table 3. It should be noted that the range of values for this parameter is based on the STRC shear wall database established in this study, and further discussion may be required for values outside the range of parameters collected in the database. In general, the larger the shear–span ratios (λ) of STRC shear walls, the higher the probability of flexural failure. The greater the horizontal bars index in boundary element (ρhc,v fy4/fc), vertical bars index in web (ρvw,s fy2/fc), and area share of webs (Aw/A), the greater the susceptibility of STRC shear walls to shear failure, while the greater the vertical bars index in boundary element (ρvc,s fy1/fc) and concrete compressive strength (fa), the greater the susceptibility of STRC shear walls to flexural shear failure.
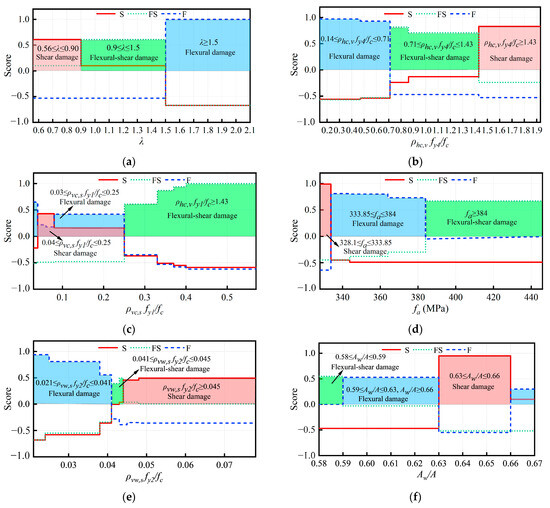
Figure 13.
Dependency diagram of the first 6 important features in the STRC shear wall damage model: (a) λ; (b) ρhc,v fy4/fc; (c) ρvc,s fy1/fc; (d) fa(MPa); (e) ρvw,s fy2/fc; (f) Aw/A.
Table 3.
The top 6 important features of STRC shear walls under different failure modes take a range of values.
5. Conclusions
To address the challenge of limited training data for the recognition of failure modes in STRC shear walls, this study proposes a GAN-based approach to augment the training data. The Blending-CRKL model is utilized to combine the advantages of multiple individual models, thereby improving the accuracy of failure mode prediction in STRC shear walls. Additionally, an analysis is conducted on the significant features of failure modes in STRC shear walls, and the parameter value ranges under different failure modes. The main conclusions are as follows:
- (1)
- By augmenting the training dataset with GAN, we improved the predictive performance of STRC shear wall failure mode models. Compared to the initial dataset, the six models exhibited significant enhancements with average increases of 13% in accuracy, 81% in precision, 48% in recall, and 67% in F1-score. This approach effectively addresses the poor predictive performance issue in small sample databases, enhancing the accuracy of models.
- (2)
- The Blending-CRKL fusion model proposed in this study outperformed the other models in predicting the failure modes of STRC shear walls. It achieved an outstanding accuracy of 97% when trained with the GAN-augmented dataset, surpassing the performance of KNN, BPNN, RF, LightGBM, and Catboost models. Additionally, the Blending-CRKL model demonstrated good robustness and stability, making it highly suitable for accurately predicting the failure modes of STRC shear walls.
- (3)
- The Blending-CRKL fusion model was explained using SHAP. The results showed that the shear–span ratio (λ) is the most important feature for identifying the failure modes of STRC shear walls, followed by the horizontal bar index in the boundary element (ρhc,v fy4/fc) and the vertical bar index in the boundary element (ρvc,s fy1/fc). Additionally, the reinforcement configuration of the boundary elements plays a crucial role in the shear and flexural failure of STRC shear walls.
- (4)
- Analysis of the features value range of different failure modes of STRC shear walls reveals that as the shear–span ratio (λ) increases, the probability of flexural failure also increases. A larger value of the boundary element horizontal bar index (ρhc,v fy4/fc), the vertical bar index of the web (ρvw,s fy2/fc), and the web area ratio (Aw/A) indicates a higher likelihood of shear failure in the shear wall. On the other hand, a larger value of the boundary element vertical bar index (ρvc,s fy1/fc) and the compressive strength of concrete (fa) indicates a higher likelihood of flexural shear failure in the shear wall.
- (5)
- In future research, the Blending-CRKL model proposed in this study can be further improved by expanding the experimental data and validating the predictive results of the model in engineering practice. These efforts will contribute to continuously enhancing the prediction accuracy of the model.
Author Contributions
Conceptualization, G.Y. and Z.M.; methodology, G.Y.; software (Python-3.6.5), G.Y.; validation, G.Y.; formal analysis, G.Y. and J.Z.; investigation, J.Z.; resources, J.Z.; data curation, G.Y.; writing—original draft preparation, G.Y.; writing—review and editing, W.X.; visualization, G.Y.; supervision, W.X. and J.Z.; project administration, Z.M. and J.Z.; funding acquisition, J.Z. and W.X. All authors have read and agreed to the published version of the manuscript.
Funding
This research received no external funding.
Institutional Review Board Statement
Not applicable.
Informed Consent Statement
Not applicable.
Data Availability Statement
Data are contained within the article.
Conflicts of Interest
The authors declare no conflict of interest.
References
- Wan, L.C.; Hong, Y.D.; Jian, W.Z. Experimental Study and Theoretical Analysis on Seismic Performance of RC Shear Wall with STRC Columns and Embedded Steel Plate. Adv. Mater. Res. 2012, 446–449, 1006–1013. [Google Scholar]
- Zhou, J.; Fang, X.; Yao, Z. Mechanical behavior of a steel tube-confined high-strength concrete shear wall under combined tensile and shear loading. Eng. Struct. 2018, 171, 673–685. [Google Scholar] [CrossRef]
- Li, X.; Zhao, Z.; Qian, J.; Liu, S.; Le, H.E.; Han, X. Experimental studies on seismic performance of precast shear walls with hybrid vertical rebar connections. J. Harbin Inst. Technol. 2020, 52, 1–9. [Google Scholar]
- Greifenhagen, C.; Lestuzzi, P. Static cyclic tests on lightly reinforced concrete shear walls. Eng. Struct. 2005, 27, 1703–1712. [Google Scholar] [CrossRef]
- Teng, S.; Chandra, J. Cyclic Shear Behavior of High-Strength Concrete Structural Walls. ACI Struct. J. 2016, 113, 1335–1345. [Google Scholar] [CrossRef]
- Vadyala, S.R.; Betgeri, S.N.; Matthews, J.C.; Matthews, E. A Review of Physics-based Machine Learning in Civil Engineering. Results Eng. 2022, 13, 100316. [Google Scholar] [CrossRef]
- Mangalathu, S.; Jang, H.; Hwang, S.-H.; Jeon, J.-S. Data-driven machine-learning-based seismic failure mode identification of reinforced concrete shear walls. Eng. Struct. 2020, 208, 110331. [Google Scholar] [CrossRef]
- Zhang, H.; Cheng, X.; Li, Y.; Du, X. Prediction of failure modes, strength, and deformation capacity of RC shear walls through machine learning. J. Build. Eng. 2022, 50, 104145. [Google Scholar] [CrossRef]
- Liang, D.; Xue, F. Integrating automated machine learning and interpretability analysis in architecture, engineering and construction industry: A case of identifying failure modes of reinforced concrete shear walls. Comput. Ind. 2023, 147, 103883. [Google Scholar] [CrossRef]
- Siam, A.; Ezzeldin, M.; El-Dakhakhni, W. Machine learning algorithms for structural performance classifications and predictions: Application to reinforced masonry shear walls. Structures 2019, 22, 252–265. [Google Scholar] [CrossRef]
- Ma, G.; Wang, Y. Failure mode prediction and explanation of concrete-filled steel tubular shear walls based on machine learning. Earthq. Eng. Eng. Dyn. 2022, 42, 143–152. (In Chinese) [Google Scholar]
- Kim, E.-J. Analysis of Travel Mode Choice in Seoul Using an Interpretable Machine Learning Approach. J. Adv. Transp. 2021, 2021, 6685004. [Google Scholar] [CrossRef]
- Barbados, A.; Corcho, S. Vehicle Fuel Optimization Under Real-World Driving Conditions: An Explainable Artificial Intelligence Approach. arXiv 2021, arXiv:2107.06031. [Google Scholar]
- Štrumbelj, E.; Kononenko, I. Explaining prediction models and individual predictions with feature contributions. Knowl. Inf. Syst. 2014, 41, 647–665. [Google Scholar] [CrossRef]
- Mangalathu, S.; Hwang, S.-H.; Jeon, J.-S. Failure mode and effects analysis of RC members based on machine-learning-based SHapley Additive exPlanations (SHAP) approach. Eng. Struct. 2020, 219, 110927. [Google Scholar] [CrossRef]
- Lai, D.; Demartino, C.; Xiao, Y. Interpretable machine-learning models for maximum displacements of RC beams under impact loading predictions. Eng. Struct. 2023, 281, 115723. [Google Scholar] [CrossRef]
- Cakiroglu, C.; Islam, K.; Bekdaş, G.; Kim, S.; Geem, Z.W. Interpretable Machine Learning Algorithms to Predict the Axial Capacity of FRP-Reinforced Concrete Columns. Materials 2022, 15, 2742. [Google Scholar] [CrossRef]
- Ding, H.; Lu, Y.; Sze, N.; Chen, T.; Guo, Y.; Lin, Q. A deep generative approach for crash frequency model with heterogeneous imbalanced data. Anal. Methods Accid. Res. 2022, 34, 100212. [Google Scholar] [CrossRef]
- Wang, J.; Wu, Y. Credibility evaluation method of small sample data based on cluster cloud model. J. Syst. Simul. 2019, 31, 1263. [Google Scholar]
- Chawla, N.V.; Bowyer, K.W.; Hall, L.O.; Kegelmeyer, W.P. SMOTE: Synthetic Minority Over-sampling Technique. J. Artif. Intell. Res. 2002, 16, 321–357. [Google Scholar] [CrossRef]
- Wang, T.; Trugman, D.; Lin, Y. SeismoGen: Seismic Waveform Synthesis Using GAN with Application to Seismic Data Augmentation. J. Geophys. Res. Solid Earth 2021, 126, e2020JB020077. [Google Scholar] [CrossRef]
- Ma, Z.; Wang, J.; Feng, Y.; Wang, R.; Zhao, Z.; Chen, H. Hydrogen yield prediction for supercritical water gasification based on generative adversarial network data augmentation. Appl. Energy 2023, 336, 120814. [Google Scholar] [CrossRef]
- Chen, N.; Zhao, S.; Gao, Z.; Wang, D.; Liu, P.; Oeser, M.; Wang, L. Virtual mix design: Prediction of compressive strength of concrete with industrial wastes using deep data augmentation. Constr. Build. Mater. 2022, 323, 126580. [Google Scholar] [CrossRef]
- Qian, J.; Jiang, Z.; Ji, X. Behavior of steel tube-reinforced concrete composite walls subjected to high axial force and cyclic loading. Eng. Struct. 2012, 36, 173–184. [Google Scholar] [CrossRef]
- Deger, Z.T.; Kaya, G.T. Glass-box model representation of seismic failure mode prediction for conventional reinforced concrete shear walls. Neural Comput. Appl. 2022, 34, 13029–13041. [Google Scholar] [CrossRef]
- Moehle, J.P. Seismic Design of Reinforced Concrete Buildings; McGraw-Hill Education: New York, NY, USA, 2015. [Google Scholar]
- Paulay, T.; Priestley, M. Seismic design of reinforced concrete and masonry buildings. In Seismic Design of Reinforced Concrete and Masonry Buildings; Wiley: New York, NY, USA, 1992. [Google Scholar]
- American Society of Civil Engineers. Seismic Evaluation and Retrofit of Existing Buildings; American Society of Civil Engineers: Reston, VA, USA, 2017. [Google Scholar]
- Yang, G. Study on Seismic Behavior of CFT Composite Shear Walls under High Axial Compression Ratio; Tsinghua University: Beijing, China, 2013. (In Chinese) [Google Scholar]
- Luo, W. The Studies on Force Mechanism of Steel Pipe Concrete Structural Wall of Small Shear Span Ratio; Chang’an University: Xi’an, China, 2014. (In Chinese) [Google Scholar]
- Bai, L.; Zhou, T.H.; Luo, X.W.; Zhang, Y.; Luo, W. Experimental study on the seismic behavior of steel tube confined high-strength concrete shear walls. China Civ. Eng. J. 2014, 47, 9–17. (In Chinese) [Google Scholar]
- Li, Q. Experimental Study on Axial-Flexural Behavior of Shear Walls with Steel Tube-Confined High Performance Concrete; South China University of Technology: Guangzhou, China, 2012. (In Chinese) [Google Scholar]
- Sun, X.M. Experimental Study on Shear Behavior of Shear Wall with Steel Tube-Confined High-Strength Concrete; South China University of Technology: Guangzhou, China, 2013. (In Chinese) [Google Scholar]
- Qiang, J.R.; Jiang, Z.; Ji, X.D. Experimental study on seismic behavior of steel tube-reinforced concrete composite shear walls with high axial compressive load ratio. J. Build. Struct. 2010, 31, 40–48. (In Chinese) [Google Scholar]
- Maleki, A.; Haghighi, A.; Mahariq, I. Machine learning-based approaches for modeling thermophysical properties of hybrid nanofluids: A comprehensive review. J. Mol. Liq. 2021, 322, 114843. [Google Scholar] [CrossRef]
- JGJ 3-2010; Technical Specification for Concrete Structures of Tall Building. China Ministry of Construction: Beijing, China, 2010. (In Chinese)
- CECS 188; Technical Specification for Steel Tube-Reinforced Concrete Column Structure. China Planning Press: Beijing, China, 2005. (In Chinese)
- JGJ 138–2001; Standard Chinese. Technical Specification for Steel Reinforced Concrete Composite Structures. China Architecture and Building Press: Beijing, China, 2002. (In Chinese)
- ACI 318-19; Building Code Requirements for Structural Concrete and Commentary. American Concrete Institute: Farmington Hills, MI, USA, 2019.
- EN 1998-1; Eurocode 8: Design of Structures for Earthquake Resistance, Part-1. European Union; CEN: Brussels, Belgium, 2005.
- Goodfellow, I.; Pouget-Abadie, J.; Mirza, M.; Xu, B.; Warde-Farley, D.; Ozair, S.; Bengio, Y. Generative adversarial networks. Commun. ACM 2020, 63, 139–144. [Google Scholar] [CrossRef]
- García, C.A.; Gil-de-la-Fuente, A.; Barbas, C.; Otero, A. Probabilistic metabolite annotation using retention time prediction and meta-learned projections. J. Cheminform. 2022, 14, 33. [Google Scholar] [CrossRef]


Disclaimer/Publisher’s Note: The statements, opinions and data contained in all publications are solely those of the individual author(s) and contributor(s) and not of MDPI and/or the editor(s). MDPI and/or the editor(s) disclaim responsibility for any injury to people or property resulting from any ideas, methods, instructions or products referred to in the content. |
© 2023 by the authors. Licensee MDPI, Basel, Switzerland. This article is an open access article distributed under the terms and conditions of the Creative Commons Attribution (CC BY) license (https://creativecommons.org/licenses/by/4.0/).