Abstract
Given the high incidence of traffic accidents and fatalities on two-wheeled vehicles, there is a growing need for safety management. However, studies on evaluating two-wheeled vehicle driving in a quantitative and comprehensive form are insufficient. In this study, 11 items were defined for the first step to evaluate two-wheeled vehicle driving: signal violation, central line violation, helmet violation, pedestrian close driving, sidewalk driving, reverse lane driving, speed violation, rapid acceleration, rapid deceleration, rapid turn, and rapid lane change. The items were classified into three categories (traffic violation, pedestrian threat, and reckless driving), and their weights were derived using the AHP technique. For rapid acceleration, rapid deceleration, rapid turn, and rapid lane change, a high-performance driving simulator was used to establish risk criteria and calculate the weight based on the degree of risk. The calculated weight of each item indicates its importance in evaluating two-wheeled vehicle driving, with helmet violation (0.158), speed violation (0.124), and pedestrian close driving (0.122) having the highest weights. Finally, the dangerous driving index for two-wheeled vehicles was calculated by the weights of each evaluation item and applied to the driving trajectory data.
1. Introduction
As the COVID-19 pandemic prompted a transition to a non-face-to-face consumption structure, life logistics services have increased dramatically. According to an online shopping trends survey by Statistics Korea, the domestic food delivery service market grew by about 488% (from 2018 to 2021) during the COVID-19 pandemic, and the market size in 2022 was about KRW 26 trillion, which is still high today [1]. Along with this, the frequency of use of two-wheeled vehicles has increased, and the proportion of delivery-related traffic accidents has grown. Based on the statistics of traffic accidents by vehicle type from the National Police Agency of Korea, the number of accidents involving two-wheeled vehicles averages 9.0% of the total number of accidents, while the number of fatalities accounts for an average of 14.7%, indicating the need for active measures to address two-wheeled vehicle safety issues [2].
Various studies have been carried out on developing indices or systems for evaluating four-wheeled vehicle driving. Dula and Ballard (2003) developed an index to measure a driver’s likelihood of risky driving, incorporating factors such as driving aggression, riskiness, and negative emotions for passenger and freight vehicles [3]. In terms of vehicle insurance, Zheng et al. (2015) proposed a risk assessment index system based on driving style, considering energy, speed, and rotation [4]. Rouf et al. (2018) initially estimated the risky driving index (RDI) by assigning weights based on the frequency of each driving behavior at the time of a traffic crash for nine driving behaviors such as not wearing a car seat belt, exceeding the speed limit, and driving in the emergency lane, and then developed a regression-based model to predict it [5].
Since two-wheeled vehicles lack external protection for the driver and are more difficult to balance than four-wheeled vehicles [6], additional characteristics should be considered, such as rapid turns, rapid lane changes, sidewalk driving, and helmet violation. However, the development of quantitative indicators that comprehensively consider these different two-wheeled vehicle driving behaviors is limited.
In terms of the dangers of driving a two-wheeled vehicle, there have been a number of studies that have focused on the statistical analysis of the relationship between crash severity and influencing factors. Cook et al. (2009) analyzed the association between helmet use and two-wheeled vehicle crash severity using multivariate logistic regression [7]. Jung et al. (2013) used a multinomial logit model to analyze injury severity as a function of helmet use, alcohol/drug effects, and crash type [8]. Chung and Song (2018) developed a nonlinear correlation analysis method to identify important factors affecting the severity of two-wheeled vehicle crashes, considering driver characteristics, road characteristics, and the characteristics of the other vehicle [9]. Vajari et al. (2020) evaluated factors (driver characteristics, environmental characteristics, intersection characteristics, and crash characteristics) on the severity of two-wheeled vehicle crashes at intersections using a multinomial logit model [10]. These studies have focused on the statistical analysis of the items related to two-wheeled vehicle driving. This study focuses on evaluating the driving behavior of individual two-wheeled vehicle drivers, with the main objective being the development of an indicator for this purpose.
In order to comprehensively and quantitatively derive safe driving evaluation indicators for two-wheeled vehicles, it is necessary to calculate the weight of the risk of driving a two-wheeled vehicle for various evaluation items. Each evaluation item has a specific measurement method, such as high-precision GPS and GIS linkage, deep learning, and simulated image. Also, each item cannot be evaluated with the same risk criteria. Therefore, it is reasonable to assign different weights to each item.
This study aims to develop an index to evaluate dangerous driving that quantitatively considers various characteristics of two-wheeled vehicles. Therefore, in this study, the dangerous driving index for two-wheeled vehicles was calculated by considering the weight of each item for 11 evaluation items, such as signal violation, reverse lane driving, helmet violation, and rapid turn. To calculate different weights for each item, the analytic hierarchy process (AHP) was used, which is effective for calculating the importance of multiple evaluation criteria and items, and has been utilized by various studies across different fields [11,12,13,14]. In addition, realistic simulation videos were used to derive the risk criteria for certain evaluation items such as rapid acceleration, rapid deceleration, rapid turn, and rapid lane change. The weights of each evaluation item were then applied to the actual driving data of two-wheeled vehicles to calculate the dangerous driving index for two-wheeled vehicles.
Through the analysis using AHP and simulation videos, the weight for each of the items was assigned. Among the 11 items, helmet violation (0.158), speed violation (0.124), and pedestrian close driving (0.122) ranked highest. Based on the derived weights, a two-wheeled vehicle dangerous driving index was developed, and the index was tested with trajectory data. The developed index can evaluate the degree of safety for driving two-wheeled vehicles and is expected to be utilized for addressing relevant safety issues.
2. Methods for Evaluating Driving Risk
2.1. Evaluation Items
A total of 11 evaluation items were defined through a comprehensive review of items that contribute to two-wheeled vehicle accidents and items that drivers violate, by analyzing the following data: the types of two-wheeled vehicle accidents and law violations through the Traffic Accident Analysis System (TAAS) [15], the survey on two-wheeled vehicle traffic law violations by the Korea Transportation Safety Authority [16], and two-wheeled vehicle violation status data by the Korean National Police Agency [2]. The 11 finalized evaluation items are the following: signal violation (not following a traffic signal), central line violation (crossing the central line on a roadway), helmet violation (not wearing a helmet), pedestrian close driving, sidewalk driving, reverse lane driving (driving in the opposite direction of a lane), speed violation (exceeding the speed limit of a roadway), rapid acceleration, rapid deceleration, rapid turn, and rapid lane change.
Table 1 shows the methodologies to measure and detect violations for each item. Evaluation items such as signal violation, central line violation, helmet violation, and pedestrian close driving are determined through object detection by deep learning models using real-time video and sensor data. For items such as reverse lane driving, speed violation, and sidewalk driving, precise GIS road and sidewalk data with directions and speed limits and GPS-based location data are used to detect violations. In the case of items such as rapid acceleration, rapid deceleration, rapid turn, and rapid lane change, multiple videos with different speeds, accelerations, and angular velocities are created for each item using a realistic driving simulator, and risk criteria are derived through a questionnaire. The data collected through motion sensors are then compared to the risk criteria to determine the degree of violation. Since this paper focuses on calculating the weight of items in evaluating driving, rather than detecting items, it is assumed that the detection of items is accurate.

Table 1.
Two-wheeled vehicle dangerous driving index evaluation items and measurement methods.
2.2. Weight Derivation for Evaluation Items
In this study, the AHP technique is employed to determine the weights for the evaluation items of the two-wheeled vehicle dangerous driving index. The AHP technique is one of the multicriteria decision making (MCDM) methodologies to determine the best alternative or rank of alternatives when there are multiple evaluation criteria and multiple alternatives. It was developed by Saaty (1988) and can be used to organize a complex situation into a hierarchy and then derive the importance of each factor [44].
Weight derivation using the AHP proceeds in the following five steps:
- Create a hierarchy of evaluation items;
- Construct a pairwise comparison matrix based on the survey;
- Calculate the weight of the main criteria and sub criteria by comparison matrix for each respondent;
- Perform a consistency check and exclude inconsistent responses;
- Calculate the weight of each item for the entire response result.
As a first step, the decision-making hierarchy is created as shown in Figure 1 by classifying 11 evaluation items into three categories: traffic violation, pedestrian threat, and reckless driving. The 0th layer is two-wheeled vehicle driving evaluation, the 1st layer is category (main criteria), and the 2nd layer is evaluation item (sub criteria).
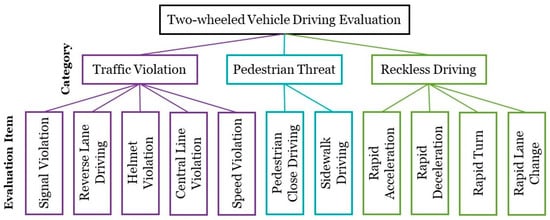
Figure 1.
Hierarchy framework for two-wheeled vehicle driving evaluation.
In the subsequent step, (traffic violation–pedestrian threat), (traffic violation–reckless driving), and (pedestrian threat–reckless driving) pairs are formed and surveys are conducted by category. An example of a category pairwise comparison survey is shown in Figure 2. The numbers from 1 to 9 represent a relative importance scale. A rating of 1 means that the two items are equally important, with larger numbers indicating that one item is more important than the other, and a rating of 9 means that one item is extremely important compared to the other. For example, the response to the first question in Figure 2 means that pedestrian threats are about three times more important than traffic violations.
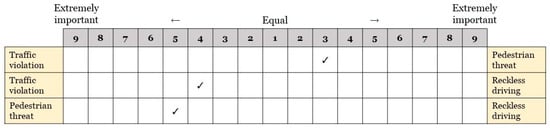
Figure 2.
Example of pairwise comparison survey for categories.
Based on the results of the category pairwise comparison questionnaire, a comparison matrix is constructed. For categories , the relative importance scales , represented by the comparison matrix , are shown in Equation (1).
The weight of each category is calculated through the pairwise comparison matrix. Each element of matrix is normalized by dividing it by the sum of the columns it belongs to, as shown in Equation (2). By averaging the rows of the normalized matrix , the weight matrix for a category is derived as Equation (3). Pairwise comparisons are performed in the same way for the evaluation items that comprise each category, resulting in a weight matrix.
Through consistency ratio, the logical consistency of each respondent’s response result is verified. First, the matrix is derived by multiplying the comparison matrix by the weight matrix . Then, the vector is obtained by dividing the elements of by the corresponding elements of . is calculated by averaging . The consistency index (CI) is derived by Equation (4). The consistency ratio (CR) is the ratio of CI and the corresponding random index (RI), which is equal to Equation (5). When > 0.1, it is judged as a consistent response. In this study, the consistency ratio is calculated through a web-based survey form, allowing respondents to review the response values if they are greater than 0.1 and revise their response instantly.
After the above process is repeated for each criterion of each respondent, a comparison matrix is aggregated using the geometric mean for all respondents. Then, the consistency of the aggregated matrix is checked, and the local weight matrix of the evaluation items is multiplied by the category weight to calculate the global weight for each evaluation item. In this process, the number of evaluation items for each category is not the same: traffic violation—5 items, pedestrian threat—2 items, and reckless driving—4 items. If the number of each sub criterion belonging to each main criterion is different, a serious error occurs in the AHP analysis, so a process for adjusting this is necessary [45]. Therefore, as in Equation (6), the revised weight of evaluation item belonging to category is calculated.
where denotes the weight of category , denotes the weight of evaluation item belonging to category , and denotes the number of evaluation items belonging to category .
In the case of evaluation items belonging to the reckless driving category, which are rapid acceleration, rapid deceleration, rapid turn, and rapid lane change, the risk criteria are not defined, and evaluation according to the degree is necessary. In addition, it is difficult to establish such risk criteria by verbal expression. However, it is impractical to obtain driving data by requiring such reckless behavior during real-world driving. Therefore, using Carla (version 0.9.13), which is a high-performance driving simulator [46], videos were implemented with different degrees of speeds, accelerations, and angular velocities. Then, risk scores from 1 to 5 were collected through survey responses for each video. Based on the response results for each video type, the risk criteria for each item were statistically calculated. These risk criteria are used to determine the weight for each type.
2.3. Calculation of Dangerous Driving Index
Based on the weight of each evaluation item, the dangerous driving index of two-wheeled vehicle driving is finally calculated. The dangerous driving index (DDI) is calculated according to the number of violations and the corresponding weight of each evaluation item, as shown in Equation (7). It indicates the degree of dangerous driving when driving a two-wheeled vehicle, with a value of 0 indicating maximum safe driving. This is applied to two-wheeled vehicle trajectory data, resulting in the dangerous driving index for each driver.
where denotes the weight of evaluation item and denotes the number of violations.
3. Results and Application of Dangerous Driving Index
3.1. Weight for Evaluation Items
In order to employ simulation videos and instantly assess the consistency of the response results, a web-based survey form specifically designed for this study, as shown in Figure 3, is used, as existing survey forms were inadequate for the survey required in this study. When the consistency ratio calculated for the response results of each question is below 0.1, indicating that the response is considered to be inconsistent, a consistency warning notification is displayed, as shown in Figure 3b, so that the respondents could modify their choices.
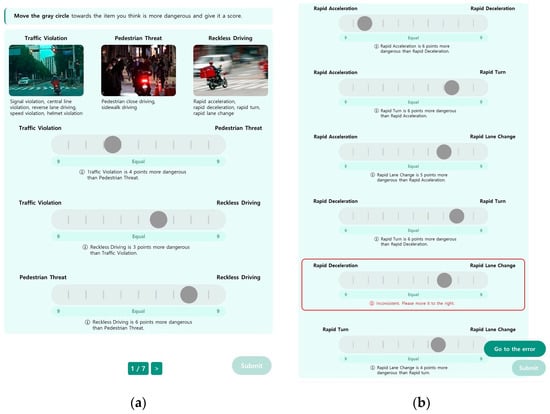
Figure 3.
Screenshot of web survey form for dangerous driving index calculation: (a) example of survey answers; and (b) example of consistency alert.
A survey was conducted using these web-based forms, targeting 100 participants, with a balanced ratio of approximately 1:1:1 among road traffic professionals, two-wheeled vehicle drivers, and common citizens (non-drivers). Figure 4 shows the weights of two-wheeled vehicle driving evaluation items, as derived from the survey results. The weights of the categories (main criteria) are as follows: traffic violation (0.380), pedestrian threat (0.365), and reckless driving (0.255). This signifies that pedestrian threat is more important than reckless driving, and traffic violation is more important than pedestrian threat. The weights of the evaluation items (sub criteria) were highest for helmet violation (0.158), speed violation (0.124), and pedestrian close driving (0.122), indicating that these should be regarded as important attributes for evaluating two-wheeled vehicle driving.
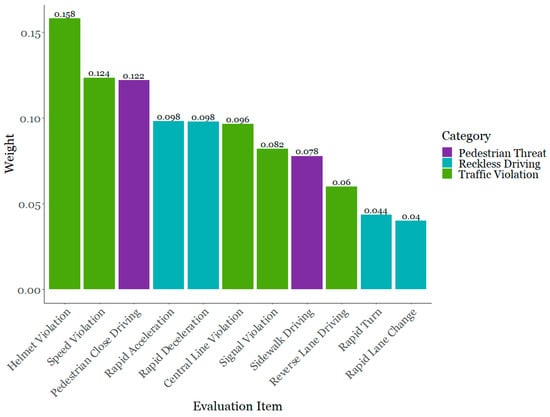
Figure 4.
Weights of two-wheeled vehicle driving evaluation items.
The risk criteria for the reckless driving category were derived based on the average risk score for each video type. A higher level of the simulation video type corresponds to a greater risk. For rapid acceleration and rapid deceleration, five levels of types were considered, and the respondents were instructed to enter a risk score ranging from 0 to 5. For rapid turn and rapid lane change, there were four levels of risk, and the respondents were required to assign a risk score between 0 and 4. The average of the risk scores was then utilized to calculate the weight of each level. Table 2 shows the average risk score and weight for each level within the reckless driving category.
Table 2.
Average risk scores and weights for the reckless driving category.
3.2. Dangerous Driving Index
The dangerous driving index for two-wheeled vehicles is calculated by applying the derived weights to Equation (7). To test the calculation process of the index, trajectory data from two-wheeled vehicles were used, in Suwon and Seongnam, Gyeonggi-do, involving 12 drivers. Figure 5a shows the trajectory of each driver in Suwon, and Figure 5b shows the trajectory in Seongnam. However, certain items were not able to be regarded as the drivers did not violate all items. Therefore, the dangerous driving index tested in this study was calculated based on six items: signal violation, speed violation, pedestrian close driving, rapid acceleration, rapid deceleration, and rapid turn.
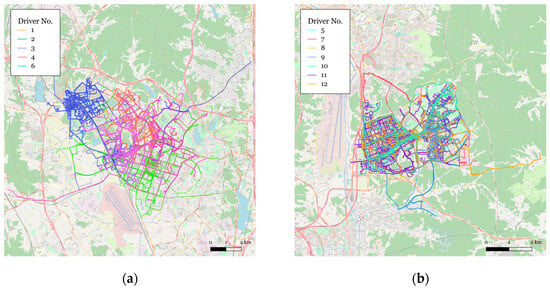
Figure 5.
Two-wheeled vehicle trajectories by region: (a) Suwon, and (b) Seongnam.
Figure 6 displays the distribution of the calculated index for each 10 km trip, using selected drivers as an example. Table 3 shows the finalized dangerous driving index for each driver, updated by averaging the indexes for each 10 km trip. It can be concluded that among the 12 drivers, driver no. 8 was the safest with a dangerous driving index of 11.654, whereas driver no. 9 was the most dangerous with a dangerous driving index of 22.110.
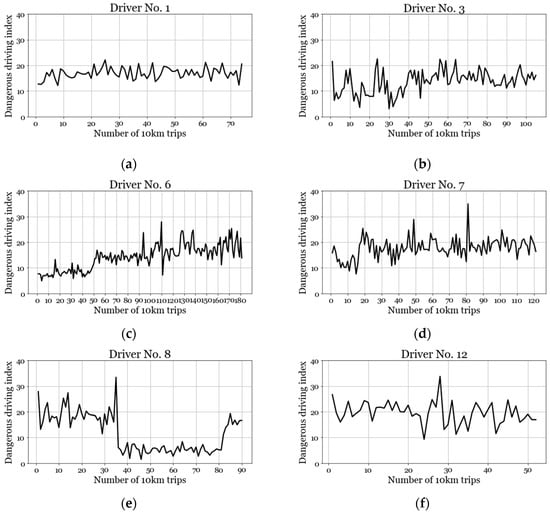
Figure 6.
Dangerous driving index calculated for every 10 km driven by two-wheeled vehicles.
Table 3.
Final dangerous driving index by two-wheeled vehicle driver.
4. Discussion
While there has been limited research on driving evaluation for two-wheeled vehicles, this study employs the AHP technique to comprehensively assess various driving behaviors of two-wheeled vehicles and derive a quantitative driving evaluation index. The AHP analysis of the survey responses indicated that in terms of categories, traffic violations, pedestrian threats, and reckless driving were ranked in order of importance. Among the 11 evaluation items, helmet violation, speed violation, and pedestrian close driving were ranked highly. The dangerous driving index was calculated considering the individual weights and the number of violations for each evaluation item. Additionally, for the reckless driving category, the risk level was also considered.
Although the respective weights for the evaluation items were calculated, during the index calculation process, there was a limitation that it was unable to collect trajectory data of the two-wheeled vehicles for all items detected. Also, in this study, the developed index was tested using the trajectory data of 12 drivers, but it is considered that a larger amount of trajectory data from multiple years will be required for more accurate testing.
Future studies could improve on these limitations, such as collecting accumulated trajectory data over several years or using a two-wheeled vehicle driving simulator to generate data that diversifies the degree of risk in driving and violates all 11 items. It is expected that the dangerous driving index can be further developed by adjusting the weights of each item and improving the index calculation method through further experiments. Also, methods to assess the developed index could be studied to increase the credibility and acceptability of the index.
Moreover, it will also be possible to develop an integrated system for evaluating and managing two-wheeled vehicle driving using these indicators. It can be also expected that this system could be utilized for usage-based insurance (UBI) or government safety management policies, and finally, contribute to the prevention of traffic accidents.
Author Contributions
Conceptualization, S.L.; methodology, S.L. and D.K.; software, S.L. and D.K.; validation, S.L. and D.K.; formal analysis, S.L.; resources, S.L. and D.K.; writing—original draft preparation, S.L.; writing—review and editing, S.L.; visualization, S.L.; project administration, C.J.; funding acquisition, C.J. All authors have read and agreed to the published version of the manuscript.
Funding
This research was funded by grant number (2022-MOIS41-005) of the Citizen-customized Life Safety Technology Development Program funded by the Ministry of the Interior and Safety (MOIS, Korea).
Institutional Review Board Statement
Not applicable.
Informed Consent Statement
Not applicable.
Data Availability Statement
The data presented in this study are available on request from the corresponding author. The data are not publicly available due to privacy.
Conflicts of Interest
The authors declare no conflict of interest.
References
- Statistics Korea. Available online: https://www.kostat.go.kr (accessed on 1 August 2023).
- Korean National Police Agency. Available online: https://www.police.go.kr (accessed on 1 August 2023).
- Dula, C.S.; Ballard, M.E. Development and evaluation of a measure of dangerous, aggressive, negative emotional, and risky driving. J. Appl. Soc. Psychol. 2003, 33, 263–282. [Google Scholar] [CrossRef]
- Zheng, W.; Nai, W.; Zhang, F.; Qin, W.; Dong, D. A Novel Set of Driving Style Risk Evaluation Index System For UBI-Based Differentiated Commercial Vehicle Insurance in China. In Proceedings of the CICTP 2015, Beijing, China, 24–27 July 2015. [Google Scholar] [CrossRef]
- Rouf, K.B.A.; Abdella, G.M.; Al-Khalifa, K.N.; Alhajyaseen, W. Ridge Penalization-Based Generalized Linear Model (GzLM) For Predicting Risky-Driving Index. In Proceedings of the International Conference on Industrial Engineering and Operations Management, Washington, DC, USA, 27–29 September 2018. [Google Scholar]
- Yoo, J.; Choi, I.; Song, S. A Study on Prevention of Traffic Accidents Through Motorcycle Accident Characteristics Analysis. Transp. Technol. Policy 2020, 17, 29–36. [Google Scholar]
- Cook, L.J.; Kerns, T.; Burch, C.; Thomas, A.; Bell, E. Motorcycle Helmet Use and Head and Facial Injuries: Crash Outcomes in CODES-Linked Data (No. HS-811 208). 2009. Available online: https://trid.trb.org/view/904146 (accessed on 14 November 2023).
- Jung, S.; Xiao, Q.; Yoon, Y. Evaluation of motorcycle safety strategies using the severity of injuries. Accid. Anal. Prev. 2013, 59, 357–364. [Google Scholar] [CrossRef]
- Chung, Y.; Song, T.J. Safety analysis of motorcycle crashes in Seoul metropolitan area, South Korea: An application of nonlinear optimal scaling methods. Int. J. Environ. Res. Public. Health 2018, 15, 2702. [Google Scholar] [CrossRef]
- Vajari, M.A.; Aghabayk, K.; Sadeghian, M.; Shiwakoti, N. A multinomial logit model of motorcycle crash severity at Australian intersections. J. Saf. Res. 2020, 73, 17–24. [Google Scholar] [CrossRef]
- Xu, L.; Cheng, G.; Jiang, Q.; Guo, Y. Mode Evaluation and Structure Design of Connection between Pole and Base of Roadside Breakaway Sign in China. Math. Probl. Eng. 2016, 2016, 9620493. [Google Scholar] [CrossRef]
- Nalmpantis, D.; Roukouni, A.; Genitsaris, E.; Stamelou, A.; Naniopoulos, A. Evaluation of Innovative Ideas for Public Transport Proposed by Citizens Using Multi-Criteria Decision Analysis (MCDA). Eur. Transp. Res. Rev. 2019, 11, 22. [Google Scholar] [CrossRef]
- Darko, A.; Chan, A.P.C.; Ameyaw, E.E.; Owusu, E.K.; Pärn, E.; Edwards, D.J. Review of Application of Analytic Hierarchy Process (AHP) in Construction. Int. J. Constr. Manag. 2019, 19, 436–452. [Google Scholar] [CrossRef]
- Van Hoang, T.; Chou, T.Y.; Fang, Y.M.; Nguyen, N.T.; Nguyen, Q.H.; Canh, P.X.; Toan, D.N.B.; Nguyen, X.L.; Meadows, M.E. Mapping forest fire risk and development of early warning system for NW vietnam using AHP and MCA/GIS methods. Appl. Sci. 2020, 10, 4348. [Google Scholar] [CrossRef]
- Traffic Accident Analysis System. Available online: https://taas.koroad.or.kr (accessed on 1 May 2023).
- Korea Transportation Safety Authority. Available online: https://www.kotsa.or.kr/main.do (accessed on 1 May 2023).
- Gokul, R.; Nirmal, A.; Bharath, K.M.; Pranesh, M.P.; Karthika, R. A Comparative Study Between State-Of-The-Art Object Detectors for Traffic Light Detection. In Proceedings of the 2020 International Conference on Emerging Trends in Information Technology and Engineering (ic-ETITE), Vellore, India, 24–25 February 2020. [Google Scholar] [CrossRef]
- Anand, S.R.; Kilari, N.; Kumar, D.U.S.R. Traffic Signal Violation Detection using Artificial Intelligence and Deep Learning. Int. J. Adv. Res. Eng. Technol. 2021, 12, 207–217. [Google Scholar] [CrossRef]
- Wang, Q.; Zhang, Q.; Liang, X.; Wang, Y.; Zhou, C.; Mikulovich, V.I. Traffic lights detection and recognition method based on the improved YOLOv4 algorithm. Sensors 2022, 22, 200. [Google Scholar] [CrossRef]
- Jalayer, M.; Zhou, H.; Zhang, B. Evaluation of navigation performances of GPS devices near interchange area pertaining to wrong-way driving. J. Traffic Transp. Eng. (Engl. Ed.) 2016, 3, 593–601. [Google Scholar] [CrossRef]
- Gagneja, K.; Singh, K.J. Wrong Lane Driving Detection Using Satellite Navigation. In Proceedings of the 2020 International Conference on Emerging Trends in Information Technology and Engineering (ic-ETITE), Vellore, India, 24–25 February 2020. [Google Scholar] [CrossRef]
- Narote, S.P.; Bhujbal, P.N.; Narote, A.S.; Dhane, D.M. A review of recent advances in lane detection and departure warning system. Pattern Recognit. 2018, 73, 216–234. [Google Scholar] [CrossRef]
- Neven, D.; De Brabandere, B.; Georgoulis, S.; Proesmans, M.; Van Gool, L. Towards End-To-End Lane Detection: An Instance Segmentation Approach. In Proceedings of the 2018 IEEE intelligent vehicles symposium (IV), Changshu, China, 26–30 June 2018. [Google Scholar] [CrossRef]
- Tang, J.; Li, S.; Liu, P. A review of lane detection methods based on deep learning. Pattern Recognit. 2021, 111, 107623. [Google Scholar] [CrossRef]
- Mohamad, I.; Ali, M.A.M.; Ismail, M. Abnormal Driving Detection Using Real Time Global Positioning System Data. In Proceedings of the 2011 IEEE international conference on space science and communication (IconSpace), Penang, Malaysia, 12–13 July 2011. [Google Scholar] [CrossRef]
- Amin, M.S.; Jalil, J.; Reaz, M.B.I. Accident Detection And Reporting System Using GPS, GPRS And GSM Technology. In Proceedings of the 2012 International Conference on Informatics, Electronics & Vision (ICIEV), Dhaka, Bangladesh, 18–19 May 2012. [Google Scholar] [CrossRef]
- Kodali, R.K.; Sairam, M. Over Speed Monitoring System. In Proceedings of the 2016 2nd international conference on contemporary computing and informatics (ic3i), Greater Noida, India, 14–17 December 2016. [Google Scholar] [CrossRef]
- Dahiya, K.; Singh, D.; Mohan, C.K. Automatic Detection Of Bike-Riders Without Helmet Using Surveillance Videos In Real-Time. In Proceedings of the 2016 International Joint Conference on Neural Networks (IJCNN), Vancouver, BC, Canada, 24–29 July 2016. [Google Scholar] [CrossRef]
- Long, X.; Cui, W.; Zheng, Z. Safety Helmet Wearing Detection Based On Deep Learning. In Proceedings of the 2019 IEEE 3rd Information Technology, Networking, Electronic and Automation Control Conference (ITNEC), Chengdu, China, 15–17 March 2019. [Google Scholar] [CrossRef]
- Huang, L.; Fu, Q.; He, M.; Jiang, D.; Hao, Z. Detection algorithm of safety helmet wearing based on deep learning. Concurr. Comput. 2021, 33, e6234. [Google Scholar] [CrossRef]
- Charran, R.S.; Dubey, R.K. Two-Wheeler Vehicle Traffic Violations Detection and Automated Ticketing for Indian Road Scenario. IEEE Trans. Intell. Transp. Syst. 2022, 23, 22002–22007. [Google Scholar] [CrossRef]
- Tahboub, K.; Güera, D.; Reibman, A.R.; Delp, E.J. Quality-Adaptive Deep Learning For Pedestrian Detection. In Proceedings of the 2017 IEEE International Conference on Image Processing (ICIP), Beijing, China, 17–20 September 2017. [Google Scholar] [CrossRef]
- Uçar, A.; Demir, Y.; Güzeliş, C. Object recognition and detection with deep learning for autonomous driving applications. Simulation 2017, 93, 759–769. [Google Scholar] [CrossRef]
- Brunetti, A.; Buongiorno, D.; Trotta, G.F.; Bevilacqua, V. Computer vision and deep learning techniques for pedestrian detection and tracking: A survey. Neurocomputing 2018, 300, 17–33. [Google Scholar] [CrossRef]
- Chen, Z.; Khemmar, R.; Decoux, B.; Atahouet, A.; Ertaud, J.Y. Real Time Object Detection, Tracking, And Distance And Motion Estimation Based On Deep Learning: Application To Smart Mobility. In Proceedings of the 2019 Eighth International Conference on Emerging Security Technologies (EST), Colchester, UK, 22–24 July 2019. [Google Scholar] [CrossRef]
- Rahmaniar, W.; Hernawan, A. Real-time human detection using deep learning on embedded platforms: A review. J. Robot. Control 2021, 2, 462–468. [Google Scholar] [CrossRef]
- Kang, B.; Scully, J.Y.; Stewart, O.; Hurvitz, P.M.; Moudon, A.V. Split-Match-Aggregate (SMA) algorithm: Integrating sidewalk data with transportation network data in GIS. Int. J. Geogr. Inf. Sci. 2015, 29, 440–453. [Google Scholar] [CrossRef]
- Saha, M.; Saugstad, M.; Maddali, H.T.; Zeng, A.; Holland, R.; Bower, S.; Dash, A.; Chen, S.; Li, A.; Hara, K.; et al. Project Sidewalk: A Web-Based Crowdsourcing Tool For Collecting Sidewalk Accessibility Data At Scale. In Proceedings of the 2019 CHI Conference on Human Factors in Computing Systems, Glasgow, UK, 4–9 May 2019. [Google Scholar] [CrossRef]
- Vaiana, R.; Iuele, T.; Astarita, V.; Caruso, M.V.; Tassitani, A.; Zaffino, C.; Giofrè, V.P. Driving behavior and traffic safety: An acceleration-based safety evaluation procedure for smartphones. Mod. Appl. Sci. 2014, 8, 88–96. [Google Scholar] [CrossRef]
- Wang, X.; Wang, X.; Cai, B.; Liu, J. Combined alignment effects on deceleration and acceleration: A driving simulator study. Transp. Res. Part C Emerg. Technol. 2019, 104, 172–183. [Google Scholar] [CrossRef]
- Yuan, J.; Abdel-Aty, M.; Cai, Q.; Lee, J. Investigating drivers’ mandatory lane change behavior on the weaving section of freeway with managed lanes: A driving simulator study. Transp. Res. Part F Traffic Psychol. Behav. 2019, 62, 11–32. [Google Scholar] [CrossRef]
- Gutiérrez-Moreno, R.; Barea, R.; López-Guillén, E.; Araluce, J.; Bergasa, L.M. Reinforcement Learning-Based Autonomous Driving at Intersections in CARLA Simulator. Sensors 2022, 22, 8373. [Google Scholar] [CrossRef]
- Malik, S.; Khan, M.A.; El-Sayed, H. CARLA: Car learning to act—An inside out. Procedia Comput. Sci. 2022, 198, 742–749. [Google Scholar] [CrossRef]
- Saaty, R.W. The analytic hierarchy process—What it is and how it is used. Math. Model. 1987, 9, 161–176. [Google Scholar] [CrossRef]
- Choi, M.C. Evaluation of Analytic Hierarchy Process Method and Development of a Weight Modified Model. Manag. Inf. Syst. Rev. 2020, 39, 145–162. [Google Scholar] [CrossRef]
- Dosovitskiy, A.; Ros, G.; Codevilla, F.; López, A.; Koltun, V. CARLA: An Open Urban Driving Simulator. In Proceedings of the 1st Annual Conference on Robot Learning, Mountain View, CA, USA, 13–15 November 2017. [Google Scholar]
Disclaimer/Publisher’s Note: The statements, opinions and data contained in all publications are solely those of the individual author(s) and contributor(s) and not of MDPI and/or the editor(s). MDPI and/or the editor(s) disclaim responsibility for any injury to people or property resulting from any ideas, methods, instructions or products referred to in the content. |
© 2023 by the authors. Licensee MDPI, Basel, Switzerland. This article is an open access article distributed under the terms and conditions of the Creative Commons Attribution (CC BY) license (https://creativecommons.org/licenses/by/4.0/).