Article

Study on the Driver Visual Workload of Bridge-Tunnel Groups on Mountainous Expressways

1
School of Civil Engineering, Chongqing Jiaotong University, Chongqing 400074, China
2
School of Traffic and Transportation, Chongqing Jiaotong University, Chongqing 400074, China
*
Author to whom correspondence should be addressed.
Appl. Sci. 2023, 13(18), 10186; https://doi.org/10.3390/app131810186
Submission received: 19 July 2023 / Revised: 2 September 2023 / Accepted: 7 September 2023 / Published: 11 September 2023
(This article belongs to the Special Issue Vehicle Safety and Crash Avoidance)

Abstract

:
Mountainous expressways with bridge-tunnel groups are characterized by complex environments and high driving risks, making them crucial sections for highway safety. This study applied eye-tracking techniques to evaluate driving safety and comfort in bridge-tunnel groups. Drivers’ pupil diameter and fixation point distribution were measured in real vehicle tests. The influence of tunnel length, adjacent tunnel spacing, and natural lighting on drivers’ pupil diameters were compared and analyzed. The maximum transient velocity of pupil area was introduced to describe the drivers’ visual load and driving comfort. The results indicate that the driving workload reaches its maximum in the first tunnel in bridge-tunnel groups and is positively correlated with the tunnel length in other sections. Excessive or insufficient distance between adjacent tunnels is detrimental to driving comfort. The driving workload is higher at night compared to during the day. Moreover, the greater tunnel length in bridge-tunnel groups and the larger number of tunnels, suggest a higher driving workload for drivers. Above all, strengthening the design and management of bridge-tunnel groups in mountainous expressways is necessary.

1. Introduction

With the continuous improvement of the expressway network in China, the mountainous expressways in the central and western regions have been extensively constructed, with a rapid increase in the mileage of bridges and tunnels. The accessibility of bridges and tunnels in mountainous areas allows for short-distance crossing of complex terrains, traffic efficiency improvement, and fragile ecological environmental protection of the mountains. In China, the “Technical Standards for Highway Engineering” (JTG B01-2014 [1]) defines an extra-large bridge as a bridge with a total span length greater than 1000 m or a single-span length greater than 150 m. Bridges with total span lengths ranging from 100 m to 1000 m or with a single-span length range of 40–150 m are classified as large bridges. Similarly, tunnels can also be categorized by length according to the standard as follows: extra-long tunnels with a length larger than 3000 m, long tunnels with a length range of 1000–3000 m, medium tunnels with lengths between 500 and 1000 m, and short tunnels with a length range within 500 m.
By 2020, China had 912,800 highway bridges with a length of 66,285,500 m, an increase of 34,500 bridges and 5,651,000 m over the previous year. Among them, 6444 extra-large bridges with a total length of 11,629,700 m and 119,935 large bridges with a total length of 32,777,700 m were built. The country also had 21,316 highway tunnels with a length of 21,999,300 m, an increase of 2249 tunnels and 3,032,700 m over the previous year. A total of 1394 extra-long tunnels with a total length of 6,235,500 m and 5541 long tunnels with a total length of 9,633,200 m were built [2]. The adjacent tunnels and bridges form tunnel or bridge-tunnel groups. With the expansion of long tunnels, extra-long tunnels, extra-large bridges, and bridge-tunnel groups, the proportion of tunnel and bridge sections in the total highway mileage continues to increase, and their proportion may even exceed that of ordinary road sections. For example, the Chengkai Expressway in Chongqing, China, measures a total length of 128 km, and bridges and tunnels occupy 78% of the total length. In the case of the Yakang Expressway, in Sichuan Province, China, the study road, bridges, and tunnels account for 82% of the total length (135 km).
The operational safety in mountainous bridge-tunnel groups is closely related to factors such as terrain, climate, road alignment, the combination of special structures, and driver behavior, making them potentially high-risk sections challenging safety and efficiency [3,4]. Amundsen and Ranes studied traffic accidents in Norwegian road tunnels and found that the accident rate at tunnel entrances was the largest, and the severity of accidents inside tunnels was higher than on open roads [5]. Caliendo and Guglielmo’s research indicated that the rates of severe accidents and costs inside tunnels were generally higher than those on corresponding highways in Italy [6]. With the growing construction of bridge-tunnel groups on the mountainous expressways in China, accidents under such road conditions have received increasing attention. The traffic accidents in the bridge-tunnel groups in the Chongqing section of the Yuxiang Expressway accounted for approximately 23.2% of the aggregate road accidents [7]. Some serious accidents have occurred in the bridge-tunnel groups on expressways in western China. On 10 August 2017, a large bus collided with the entrance of the Qinling No. 1 Tunnel when traveling on a bridge-tunnel section, resulting in 36 deaths and 13 injuries [8].
Tunnels are considered bottleneck sections of expressways and exhibit characteristics such as confinement, inaccessibility, and difficulties in communication and rescue. Given that tunnel groups consist of adjacent tunnels, drivers experience rapid transitions between “dark adaptation” and “light adaptation” when they continually enter and exit tunnels, making tunnel groups sensitive areas on roads. Due to the complex terrain of mountainous expressways, bridge-tunnel groups sections with long tunnels, and steep downhill sections with large altitude differences are prone to severe accidents. In this sense, driving safety and comfort in such sections have been a concern [9]. Tunnels are typical road sections with poor visual environments, and driving in tunnels is relatively risky [10]. At present, transportation standards and regulations in China lack specific provisions regarding the design of tunnel group alignments [11,12,13]. Tunnel groups on mountainous expressways feature long tunnel distances, numerical tunnels, short tunnel spacings, and significant variations in lighting conditions inside and outside tunnels. Collisions are the main traffic accidents in bridge-tunnel groups, and high accidents occur at the entrance and exit areas. Rapid alternations in illuminance at entrances and exits and excessive vehicle speeds are the main causes of accidents [14,15]. The traffic environment of tunnel groups is more complex than individual tunnels. The interactions between tunnels increase the driving risks. Research on tunnel group design and operational management is needed [16].
Due to unique locations and complex external environments, bridge sections, typically have higher collision severity, mostly from single-vehicle collisions, than normal sections of highways, tunnels, and service areas [17]. Traffic risks intensify under poor visibility and adverse weather conditions [18]. The upstream and downstream of the river-crossing bridge are considered high-risk corridors in freeway bridge sections [19].
Affected by unique and complex terrain, increasing sections on mountainous expressways constitute long tunnels, bridge-tunnel groups, and various interchanges. The proximity between these structures or the difficulty in identifying traffic signs leads to risky behaviors such as short-distance lane changes and rear-end collisions [20]. Roads of mountainous highway bridge-tunnel groups are narrow, with high curvature and steep slopes. Chen et al. have established traffic operational risk classification criteria for bridge-tunnel groups based on the cumulative frequency curve of average risk indicators [21]. The bridge-tunnel-interchange group sections on mountainous expressways operate in completely enclosed environments, making traffic accident rescue operations difficult, and these segments have a widespread and long-lasting impact [22]. During vehicle operation, drivers need to control their vehicles to perform lane changes, following maneuvers, overtaking maneuvers, etc. This process requires coordination among drivers, vehicles, roads, and the environment in which drivers play a crucial role [23].
Researchers have increasingly explored the integration of physiological, psychological, and driving behavior studies, with eye trackers and physiological monitors widely used in investigating driver behavior characteristics. Driver behavior can be divided into three stages: visual perception, judgment and decision-making, and driving operation. Specifically, road perception and visual cognition are important human factors for driving comfort and safety [24]. Drivers mainly rely on their vision to obtain information during driving. In this sense, driver vision is directly responsible for traffic safety [25,26]. Eye-tracking research began in the 1970s and has gained further development [27]. Simulation modeling, driving simulation, and on-road vehicle experiments are research methods for studying the eye movement behavior of drivers traveling in highway tunnels.
Through these experiments, drivers’ eye movement data are collected to analyze various indicators such as pupil diameter size, standardized pupil diameter, average speed of pupil area change, maximum transient velocity of pupil area ( M T P A ), pupil constriction, etc. [28,29]. Shang et al. found the eye-gaze behavior of drivers can be used to evaluate driving safety and comfort in tunnel groups [16]. Xu et al. reported that drivers were most significantly affected within the range between 250 m before the tunnel entrance and 50 m before the tunnel exit by collecting electrocardiogram (ECG) and eye movement data from 25 drivers during simulated driving [30]. Du et al. evaluated drivers’ perception of curvature through indoor simulation tests [31]. Qi et al. commented that the cubic spline interpolation function model could better fit the dynamic changes in the mean pupil diameter and heart rate [32]. He et al. concluded that the drivers’ visual load increased with the increasing rates of pupil diameter [33]. Zhu et al. conducted a real-vehicle experiment with participants in different tunnels. They used visual characteristic parameters to study the variations in the drivers’ mental workload when exiting an extra-long tunnel on an expressway [34].
In summary, previous research focuses on tunnels or tunnel groups, with a predominant use of simulation models and limited real-vehicle experiments. Researchers have collected and analyzed data on the driving speed, visual perception, and ECG indicators of drivers in tunnel or tunnel group environments, providing valuable references for this paper.
Studies on driver behavior characteristics have been conducted in simulated environments or in less realistic environments. Researchers have found that the perception of mental workload differs between simulator-based driving experiments and real-world scenarios [35]. On this basis, this study performed real-vehicle experiments on mountainous expressways. A total of 20 drivers participated in the driving tasks in the bridge-tunnel groups. During the experiments, eye-tracking devices were used to collect indicators such as fixation points, and pupil diameter of the drivers. In addition, information such as vehicle speed, locations, and driving videos were collected simultaneously. This paper aims to investigate the aspects further as follows: the distribution of drivers’ fixation points in different sections of the bridge-tunnel group; the influence of factors such as tunnel length, distance between adjacent tunnels, and natural lighting on drivers’ pupil diameter; the driving workload in the tunnel entrance and exit sections of the bridge-tunnel group. The results can provide a reference for the design and operation of bridge-tunnel groups on expressways.

2. Materials and Methods

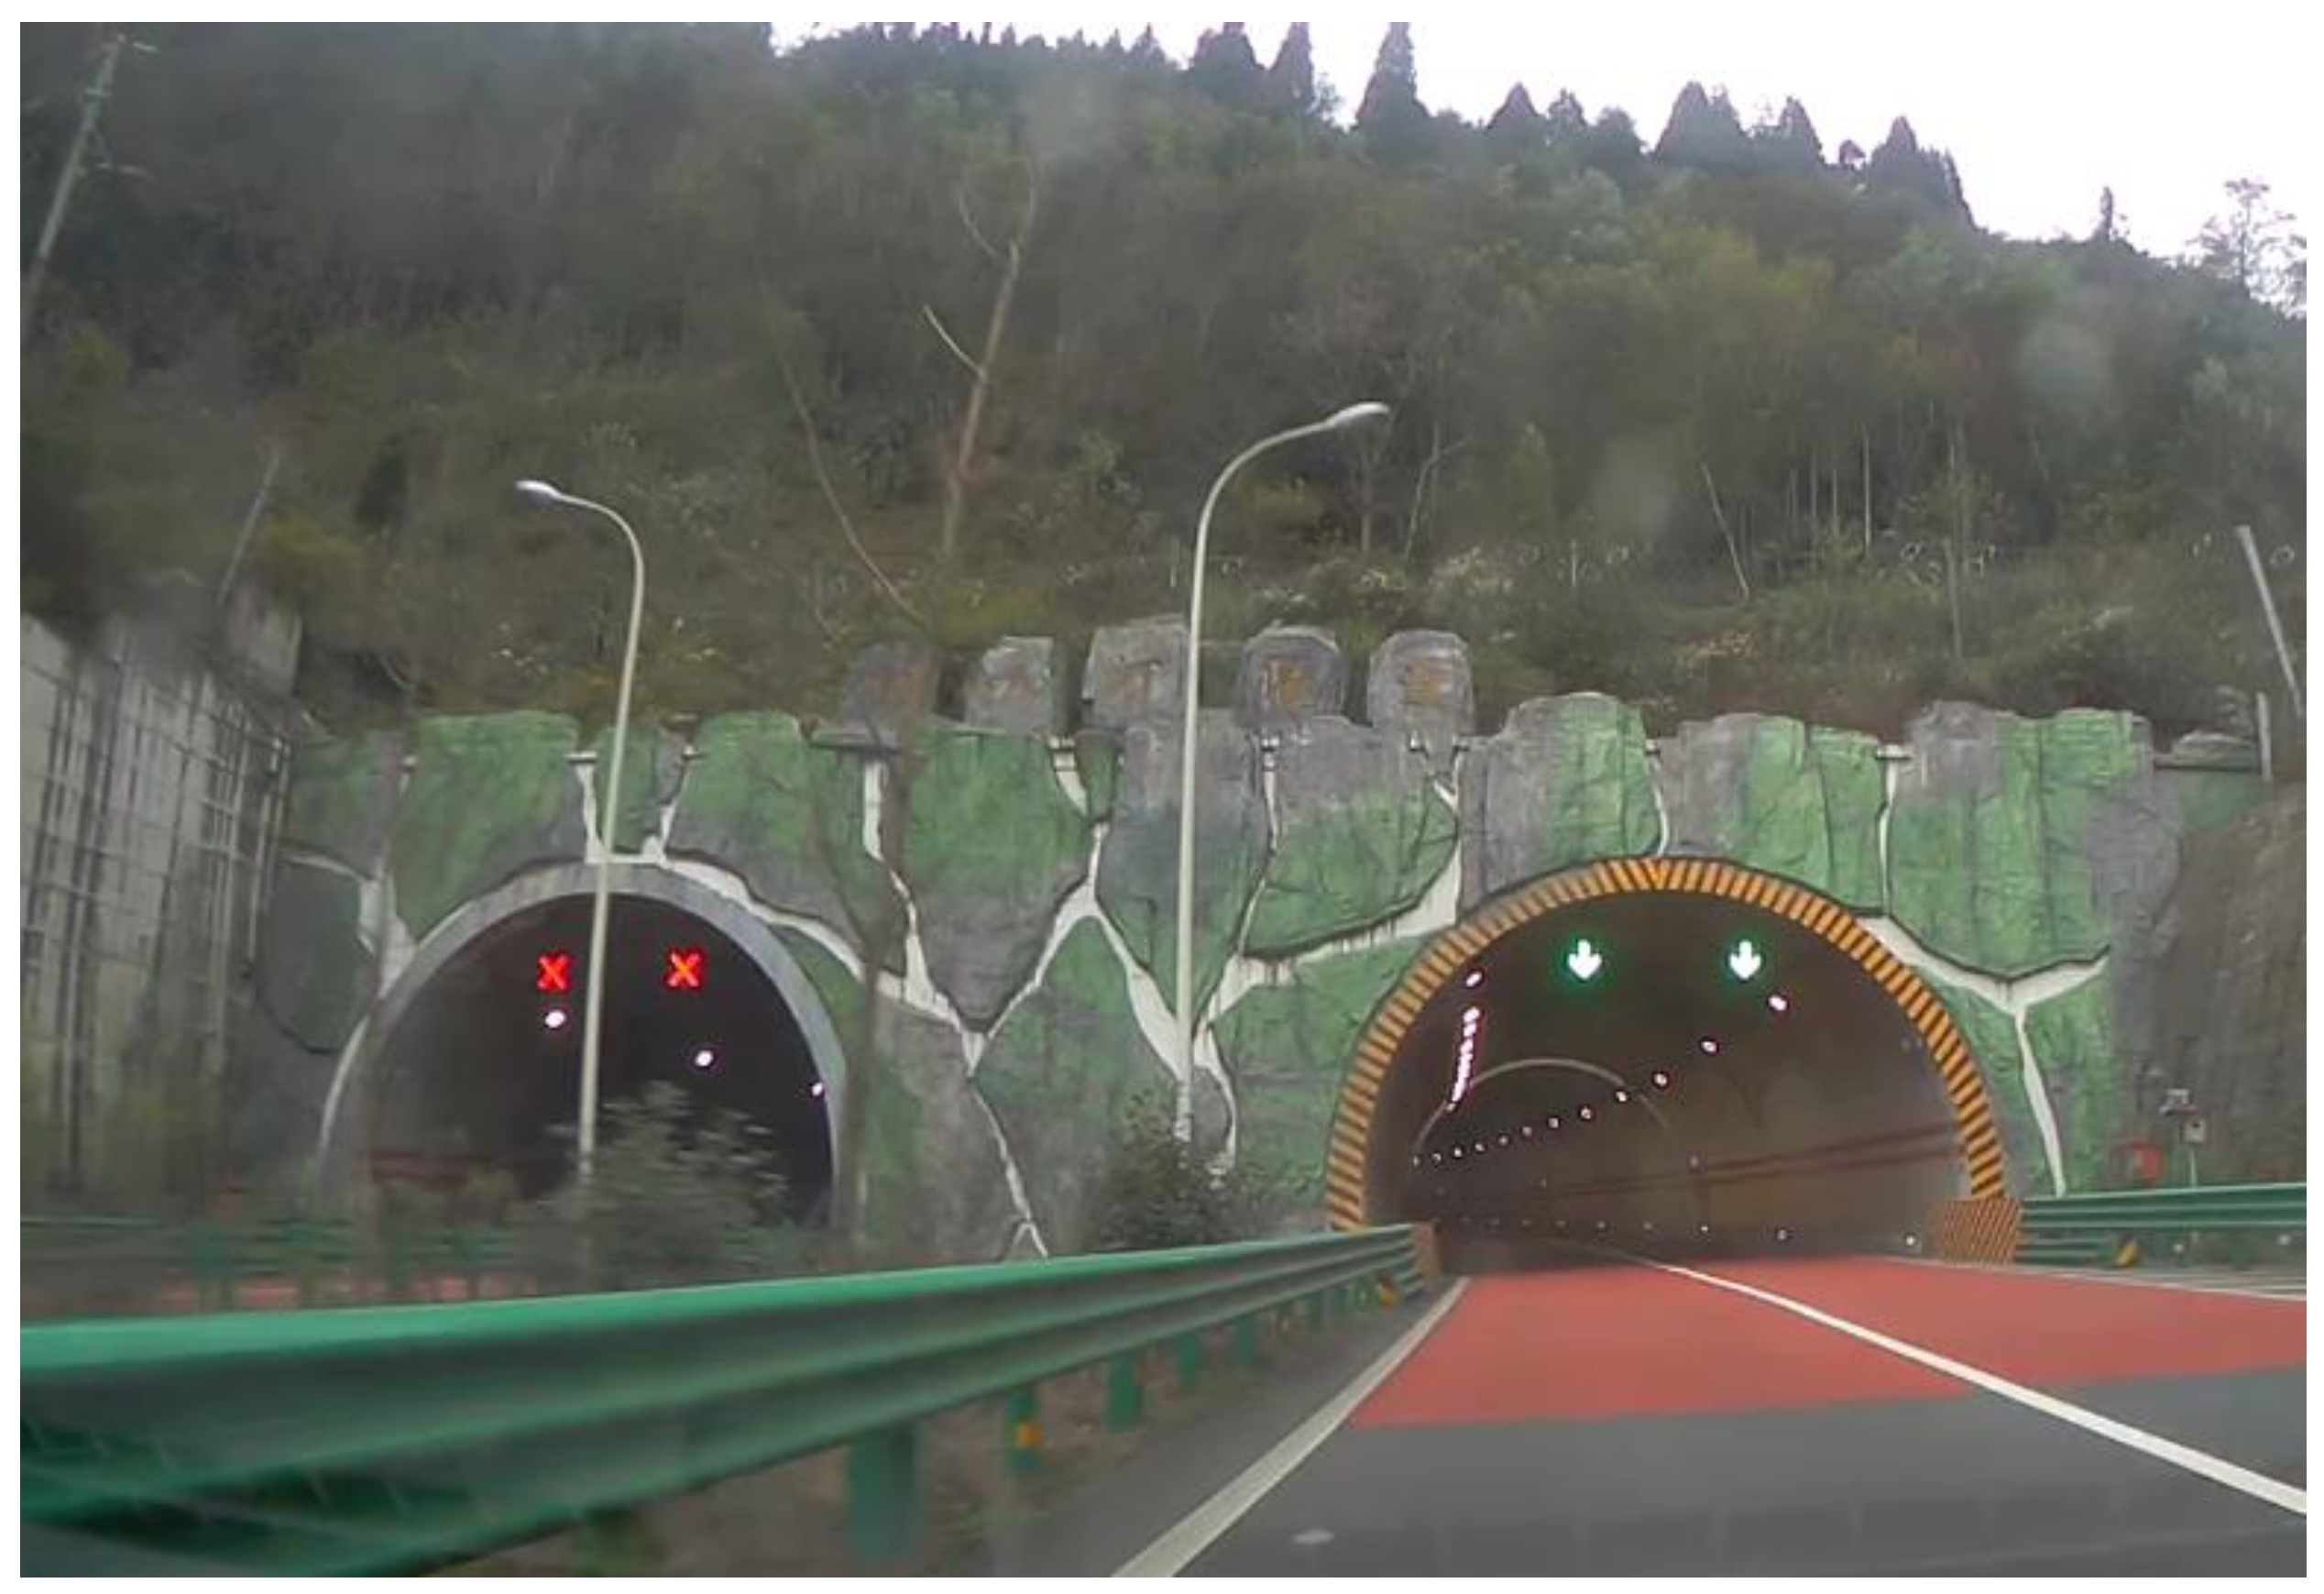
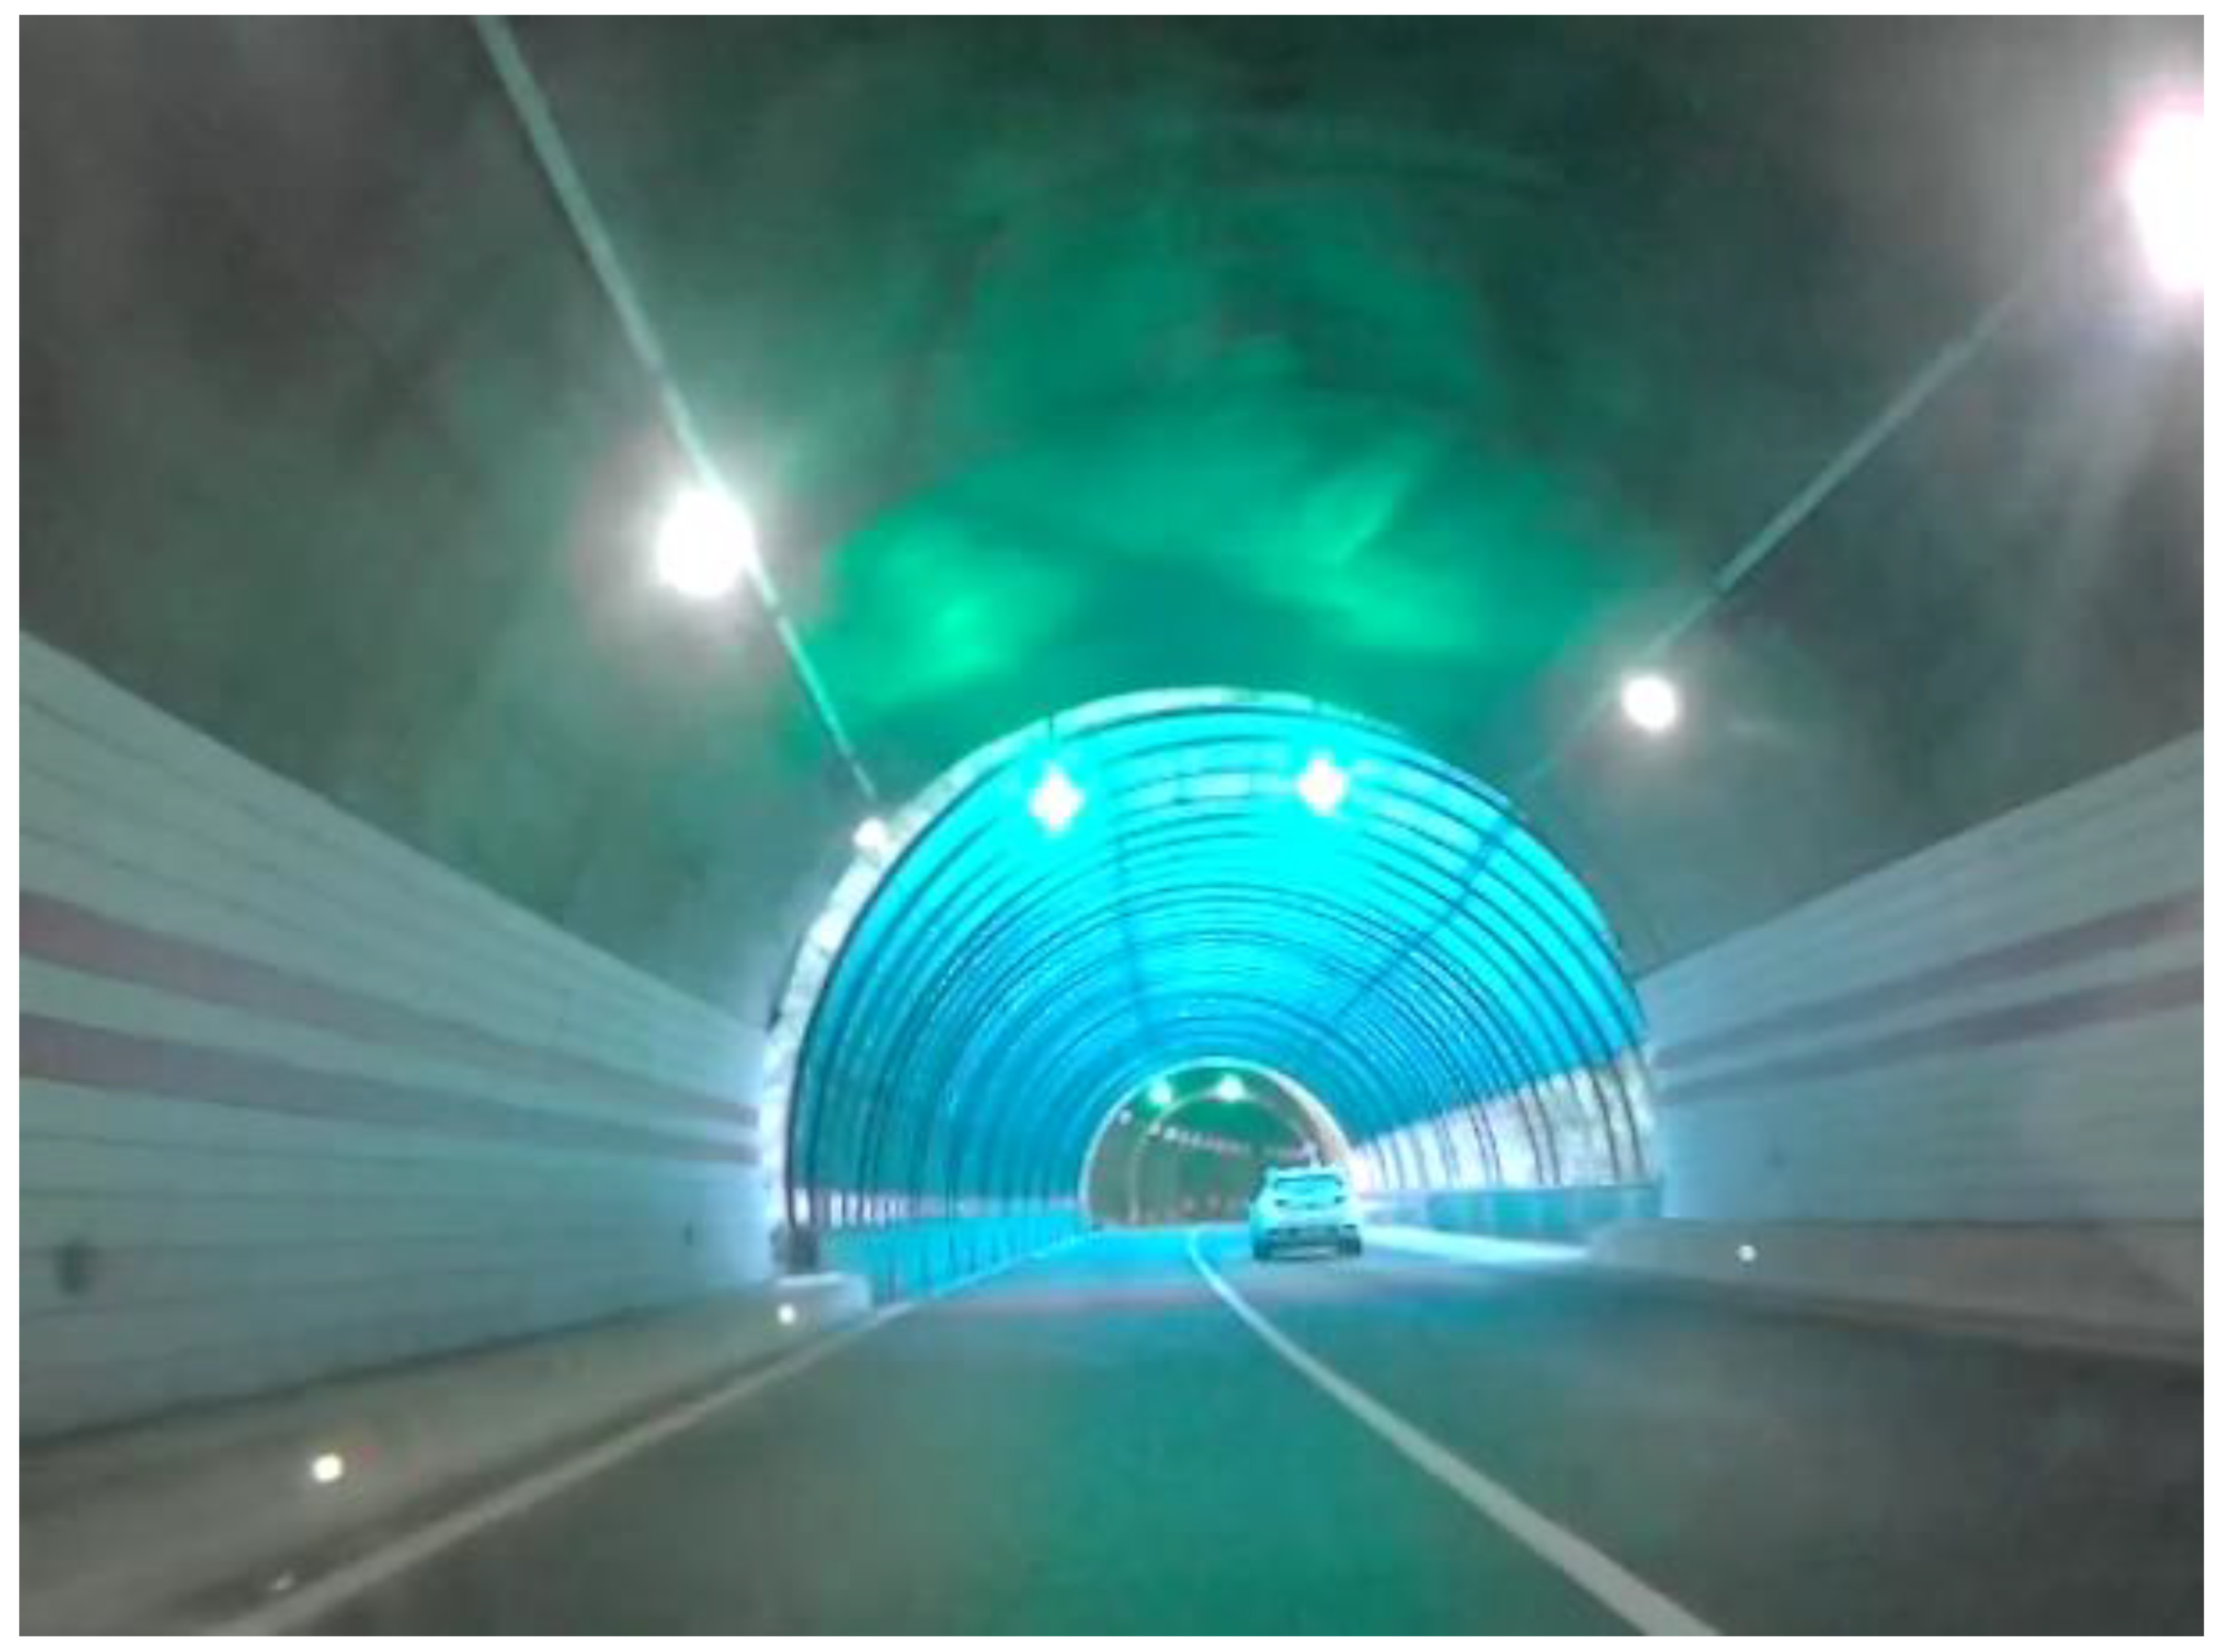
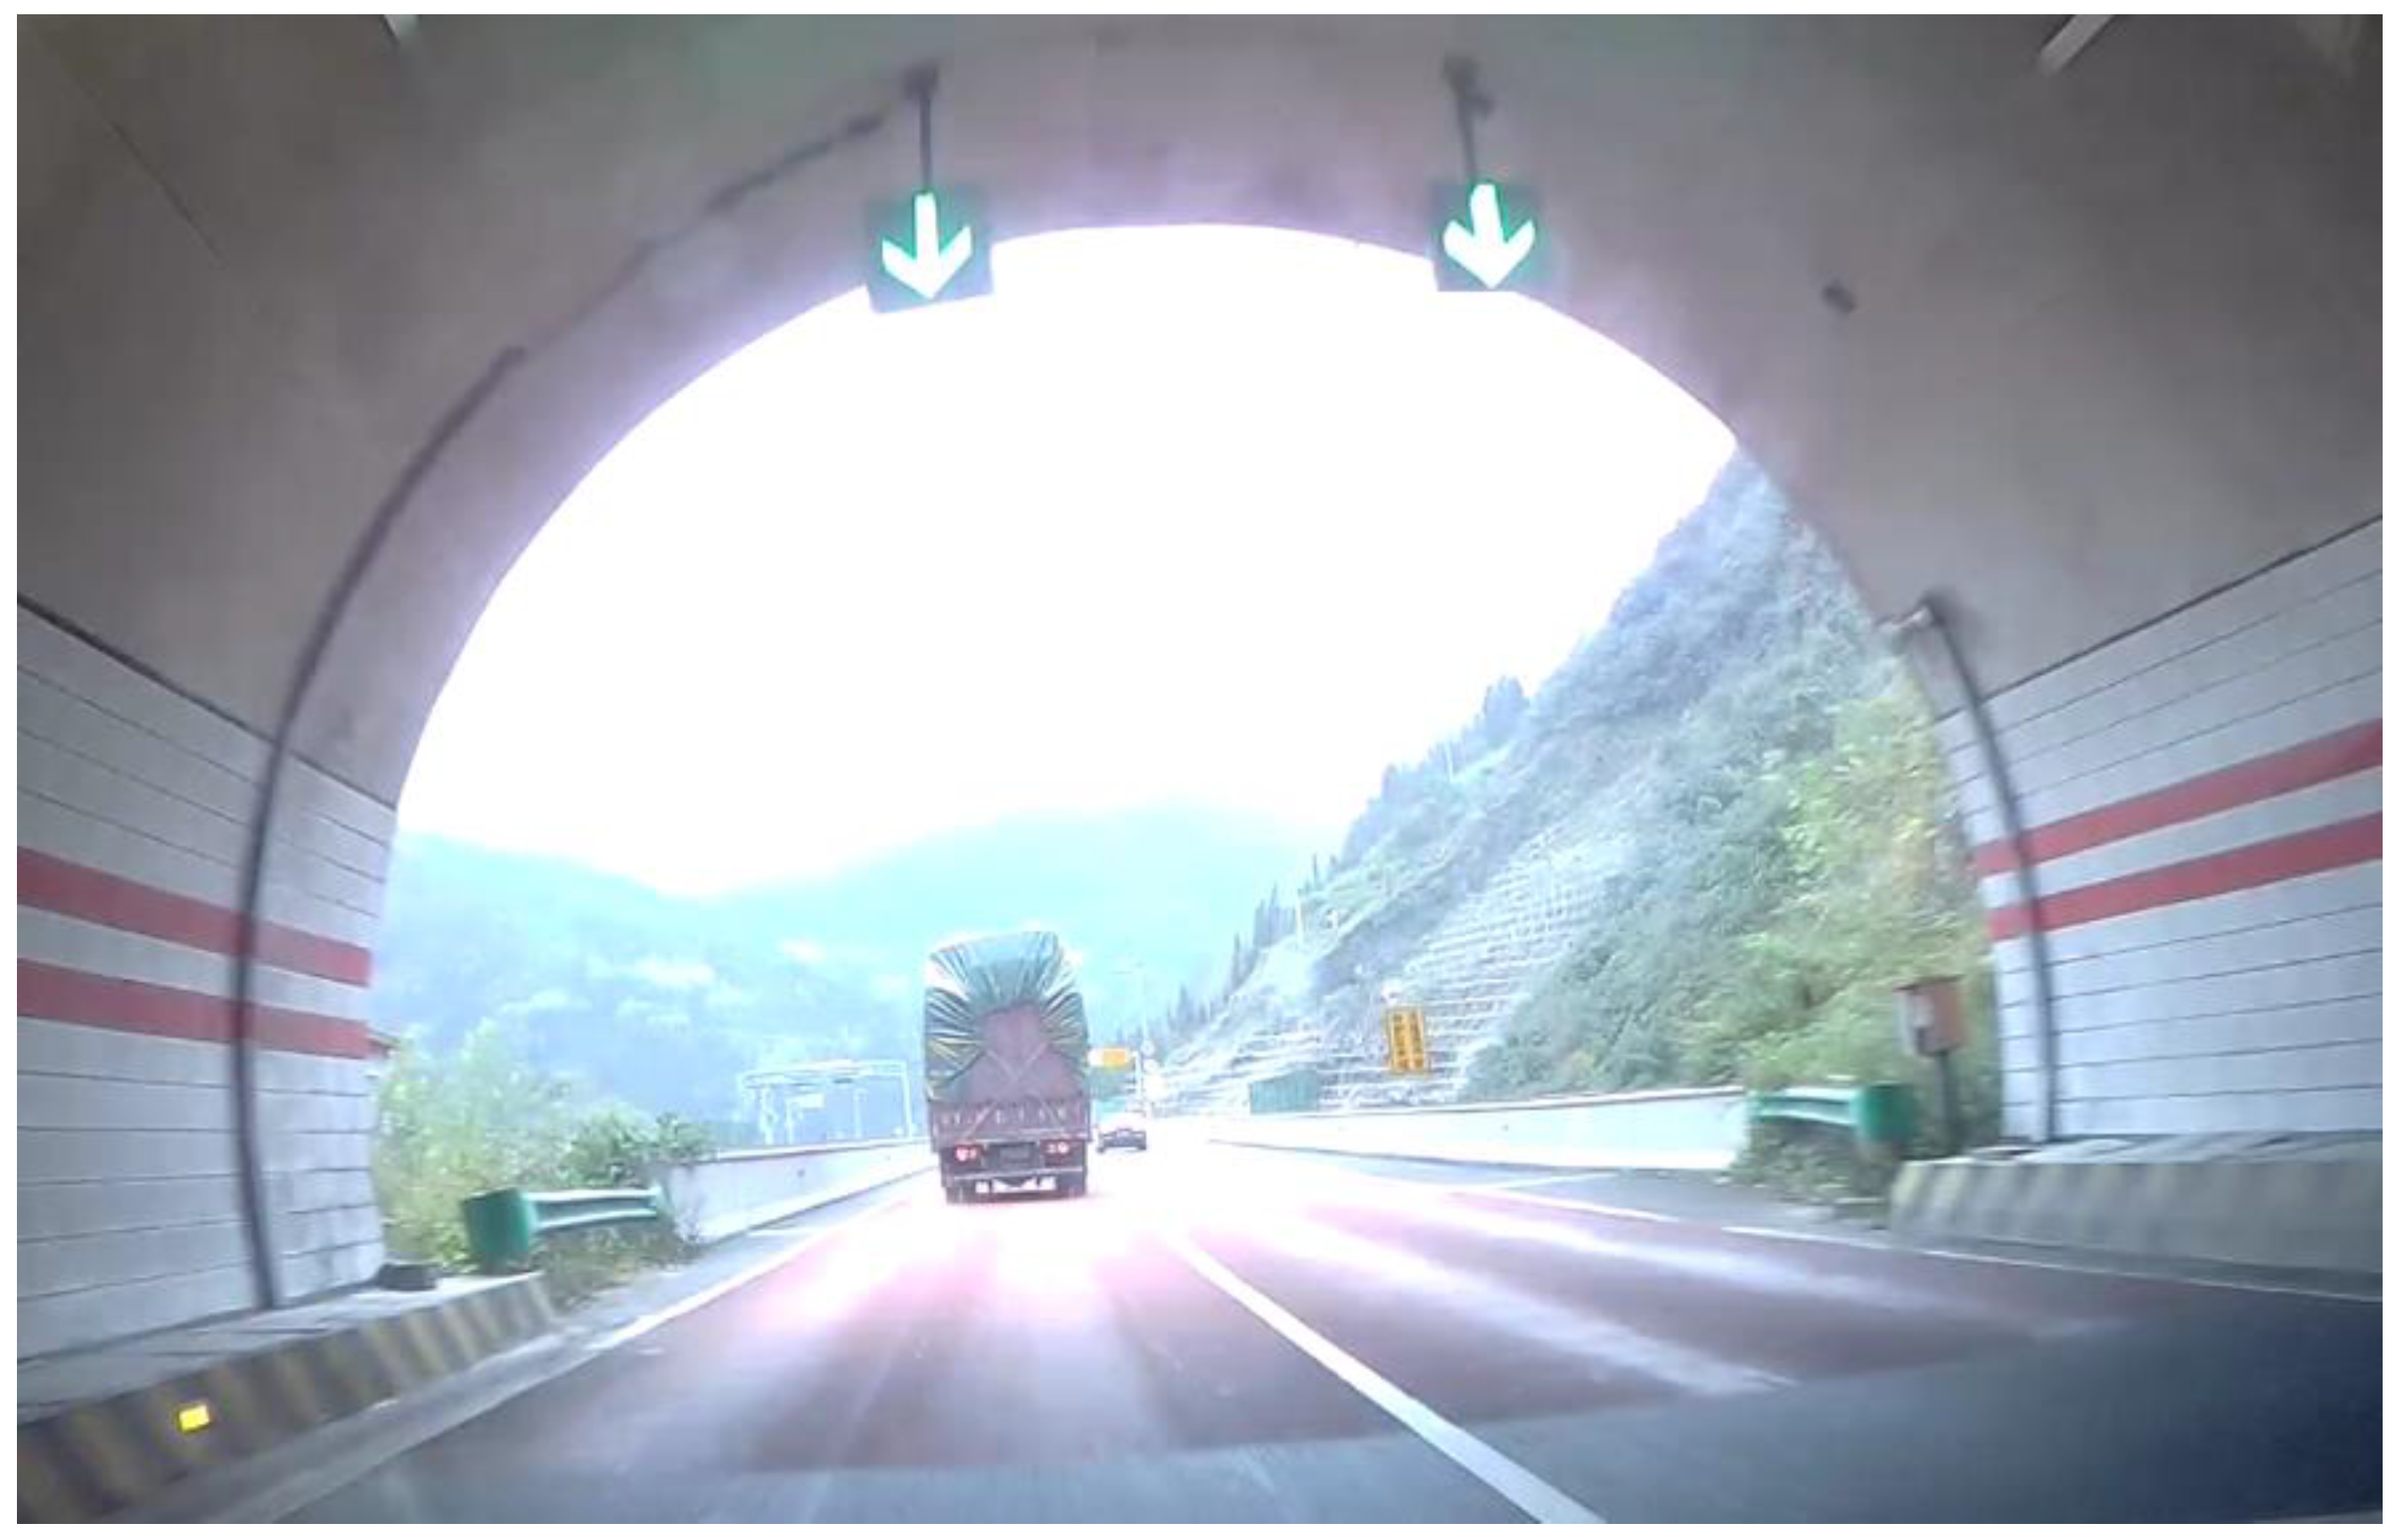
2.1. Experimental Scenario

The definitions of highway bridge groups and tunnel groups are illustrated in Table 1. Briefly, the highway tunnel groups comprise two or more tunnels with a certain spacing, including continuous and adjacent tunnels. The connecting zone of a tunnel group is subjected to abrupt changes in the traffic environment and frequent accidents. Considering these changes in lighting conditions and road surface friction when entering and exiting tunnels, drivers struggle to maintain a safe distance and speed between vehicles, resulting in a high risk of rear-end collisions. Frequent changes in the visual environment greatly impact the psychological and physiological qualities of drivers.
To ensure the visual needs of drivers in tunnels, the “Guidelines for Design of Lighting of Highway Tunnels” (JTGT-D70/2-01-2014 [36]) divides tunnel lighting into threshold, transition, interior, and exit zones. The illumination for tunnel threshold, transition, and exit zones consists of basic and enhanced lighting, and the former is the same as that of the interior zone. In mountainous highway bridge-tunnel sections in China, the speed limit is typically 80 km/h. Accordingly, the recommended lengths for the threshold, transition, and exit zones are 100, 300, and 60 m, respectively. Recommended luminance for threshold, transition, interior, and existing zones are 39–78 cd/m2, 1.56–11.7 cd/m2, 1.5–3.5 cd/m2, and 7.5–12.5 cd/m2, respectively.
Based on the definitions of bridge and tunnel group, this paper adopts the definition of bridge-tunnel group in the “Guidelines for Design of Lighting of Highway Tunnels” (JTGT-D70/2-01-2014 [36]) and “Operating Safety Technology of Freeway Special Section” [37]. In Du’s research on the minimum fixation time of drivers in tunnel sections, the maximum lighting adaptation time of tunnel exit was suggested at 12 s [38]. The types of bridge-tunnel groups along mountainous freeways are defined as follows:
Table 1. Definition of highway bridge group and tunnel group.
NameDefinition
Freeway tunnel groupA freeway tunnel group refers to a collection of tunnels where the distance between adjacent tunnel portals is less than 100 m [39]. It is a collective term for adjacent or continuous tunnels [40]. The vehicles entering the downstream tunnel will affect those traveling between downstream and upstream tunnels [41].
Adjacent tunnelsAdjacent tunnels comprise two tunnels with a distance between their portals of less than 250 m [36]. When the design speed is 80 km/h, the maximum spacing should be controlled within 110 m [42]. If the length of the connecting section between the tunnel groups is less than the stopping sight distance, drivers exiting the upstream tunnel may fail to brake promptly when they observe obstacles at the entrance of the downstream tunnel. The vehicles entering the downstream tunnel may affect those traveling inside the upstream tunnel [41].
Continuous tunnelsContinuous tunnels are two tunnels with a distance between them, ranging from 250 to 1000 m [12,36]. At the design speed of 80 km/h, the distance between continuous tunnels should not exceed 377 m [42]. This distance ensures that drivers exiting the upstream tunnel can brake promptly when seeing obstacles at the entrance of the downstream tunnel during light adaptation [41].
Freeway bridge groupA bridge group is a road section with two or more bridges spaced within 1 km, among which at least one bridge has a length of 500 m or more. It describes a group of bridges spaced at a certain distance, typically on expressways [37,43].
Bridge-tunnel groupA bridge-tunnel group is a section of road where the distance between the bridges and tunnels, tunnels, or bridges is less than or equal to the travel distance in 5 s at the designed vehicle speed [43].
Direct type: The starting and ending points of the bridge are directly connected with the entrance and exit of the tunnel.
Indirect type: A road section located between the bridge segment and the tunnel entrance/exit, with a length less than the driving distance within the recommended adaptation time (12 s).
The experimental road was the Yakang Expressway in Sichuan, China, which extends from Ya’an City to Kangding City. The Yakang Expressway is a bidirectional four-lane highway with a roadbed width of 24.5 m. Each lane is 3.75 m wide and designed at 80 km/h. The road is located in the transition zone between the Sichuan Basin and the Qinghai-Tibet Plateau, with an elevation ranging from 600 to 2500 m, and a vertical difference of up to 1900 m. Opened to traffic in late 2018, it features 44 tunnels and 129 bridges, with the bridge and tunnel mileage accounting for 82% of the total length. It serves as a typical example of mountainous expressways in the central and western regions of China. For this experiment, two tunnel-bridge groups on the Yakang Expressway were selected: the Shawan tunnel-bridge Group (Section A) and the Lahabahe tunnel-bridge Group (Section B). Section A has a total length of 28.77 km, with 9 tunnels (five extra-long tunnels and four long tunnels), and the average longitudinal gradient is 1.88%. The length of bridges and tunnels is 99.53% of the total length. Section B has a total length of 10.9 km, with seven tunnels including an extra-long tunnel, two long tunnels, three medium tunnels, and a short tunnel. Detailed information on these tunnels in the experimental sections is listed in Table 2. Typical experimental scenarios are shown in Figure 1, Figure 2 and Figure 3.

2.2. Participants

In this research, 20 drivers with an average age of 36 were recruited in Ya’an City, Sichuan Province, China, including 12 males and 8 females. These subjects had an average driving experience of 8 years and an average annual driving distance of 18,000 km. The experiment was conducted in accordance with the principles outlined in the Declaration of Helsinki of 1975, as revised in 2000. Participants were prohibited from consuming alcohol the day before the experiment and were in good physical health.

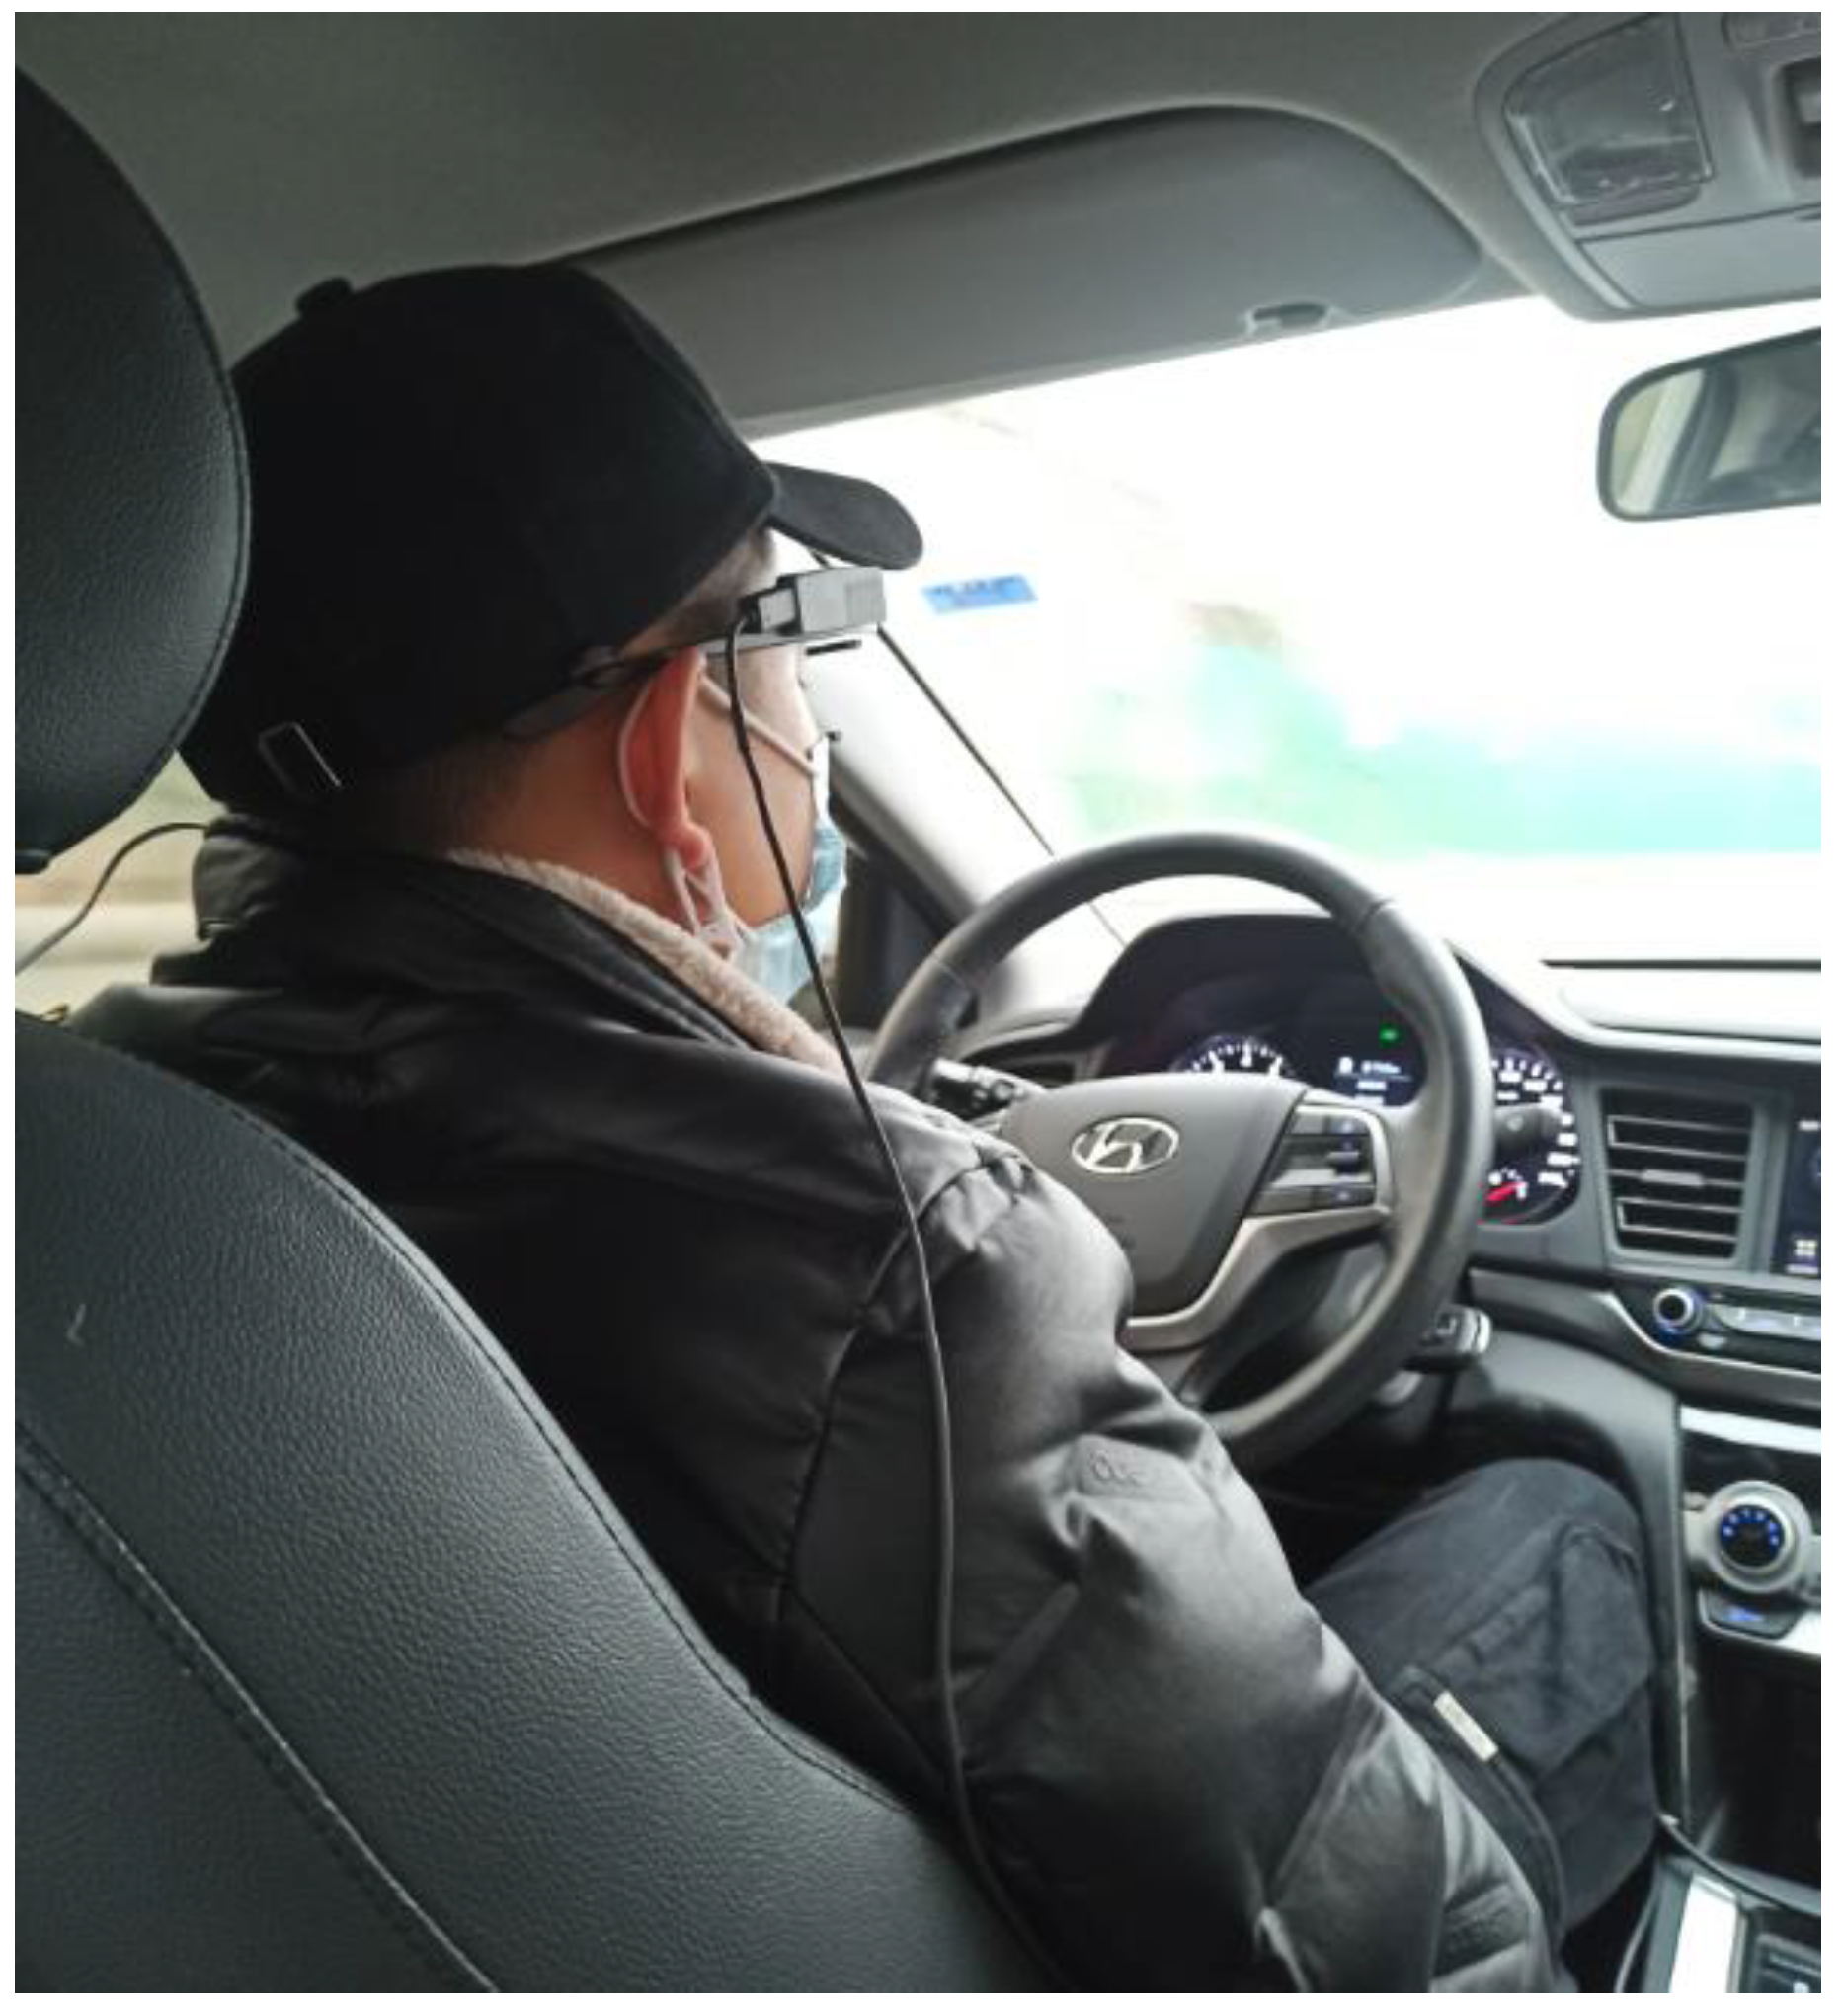
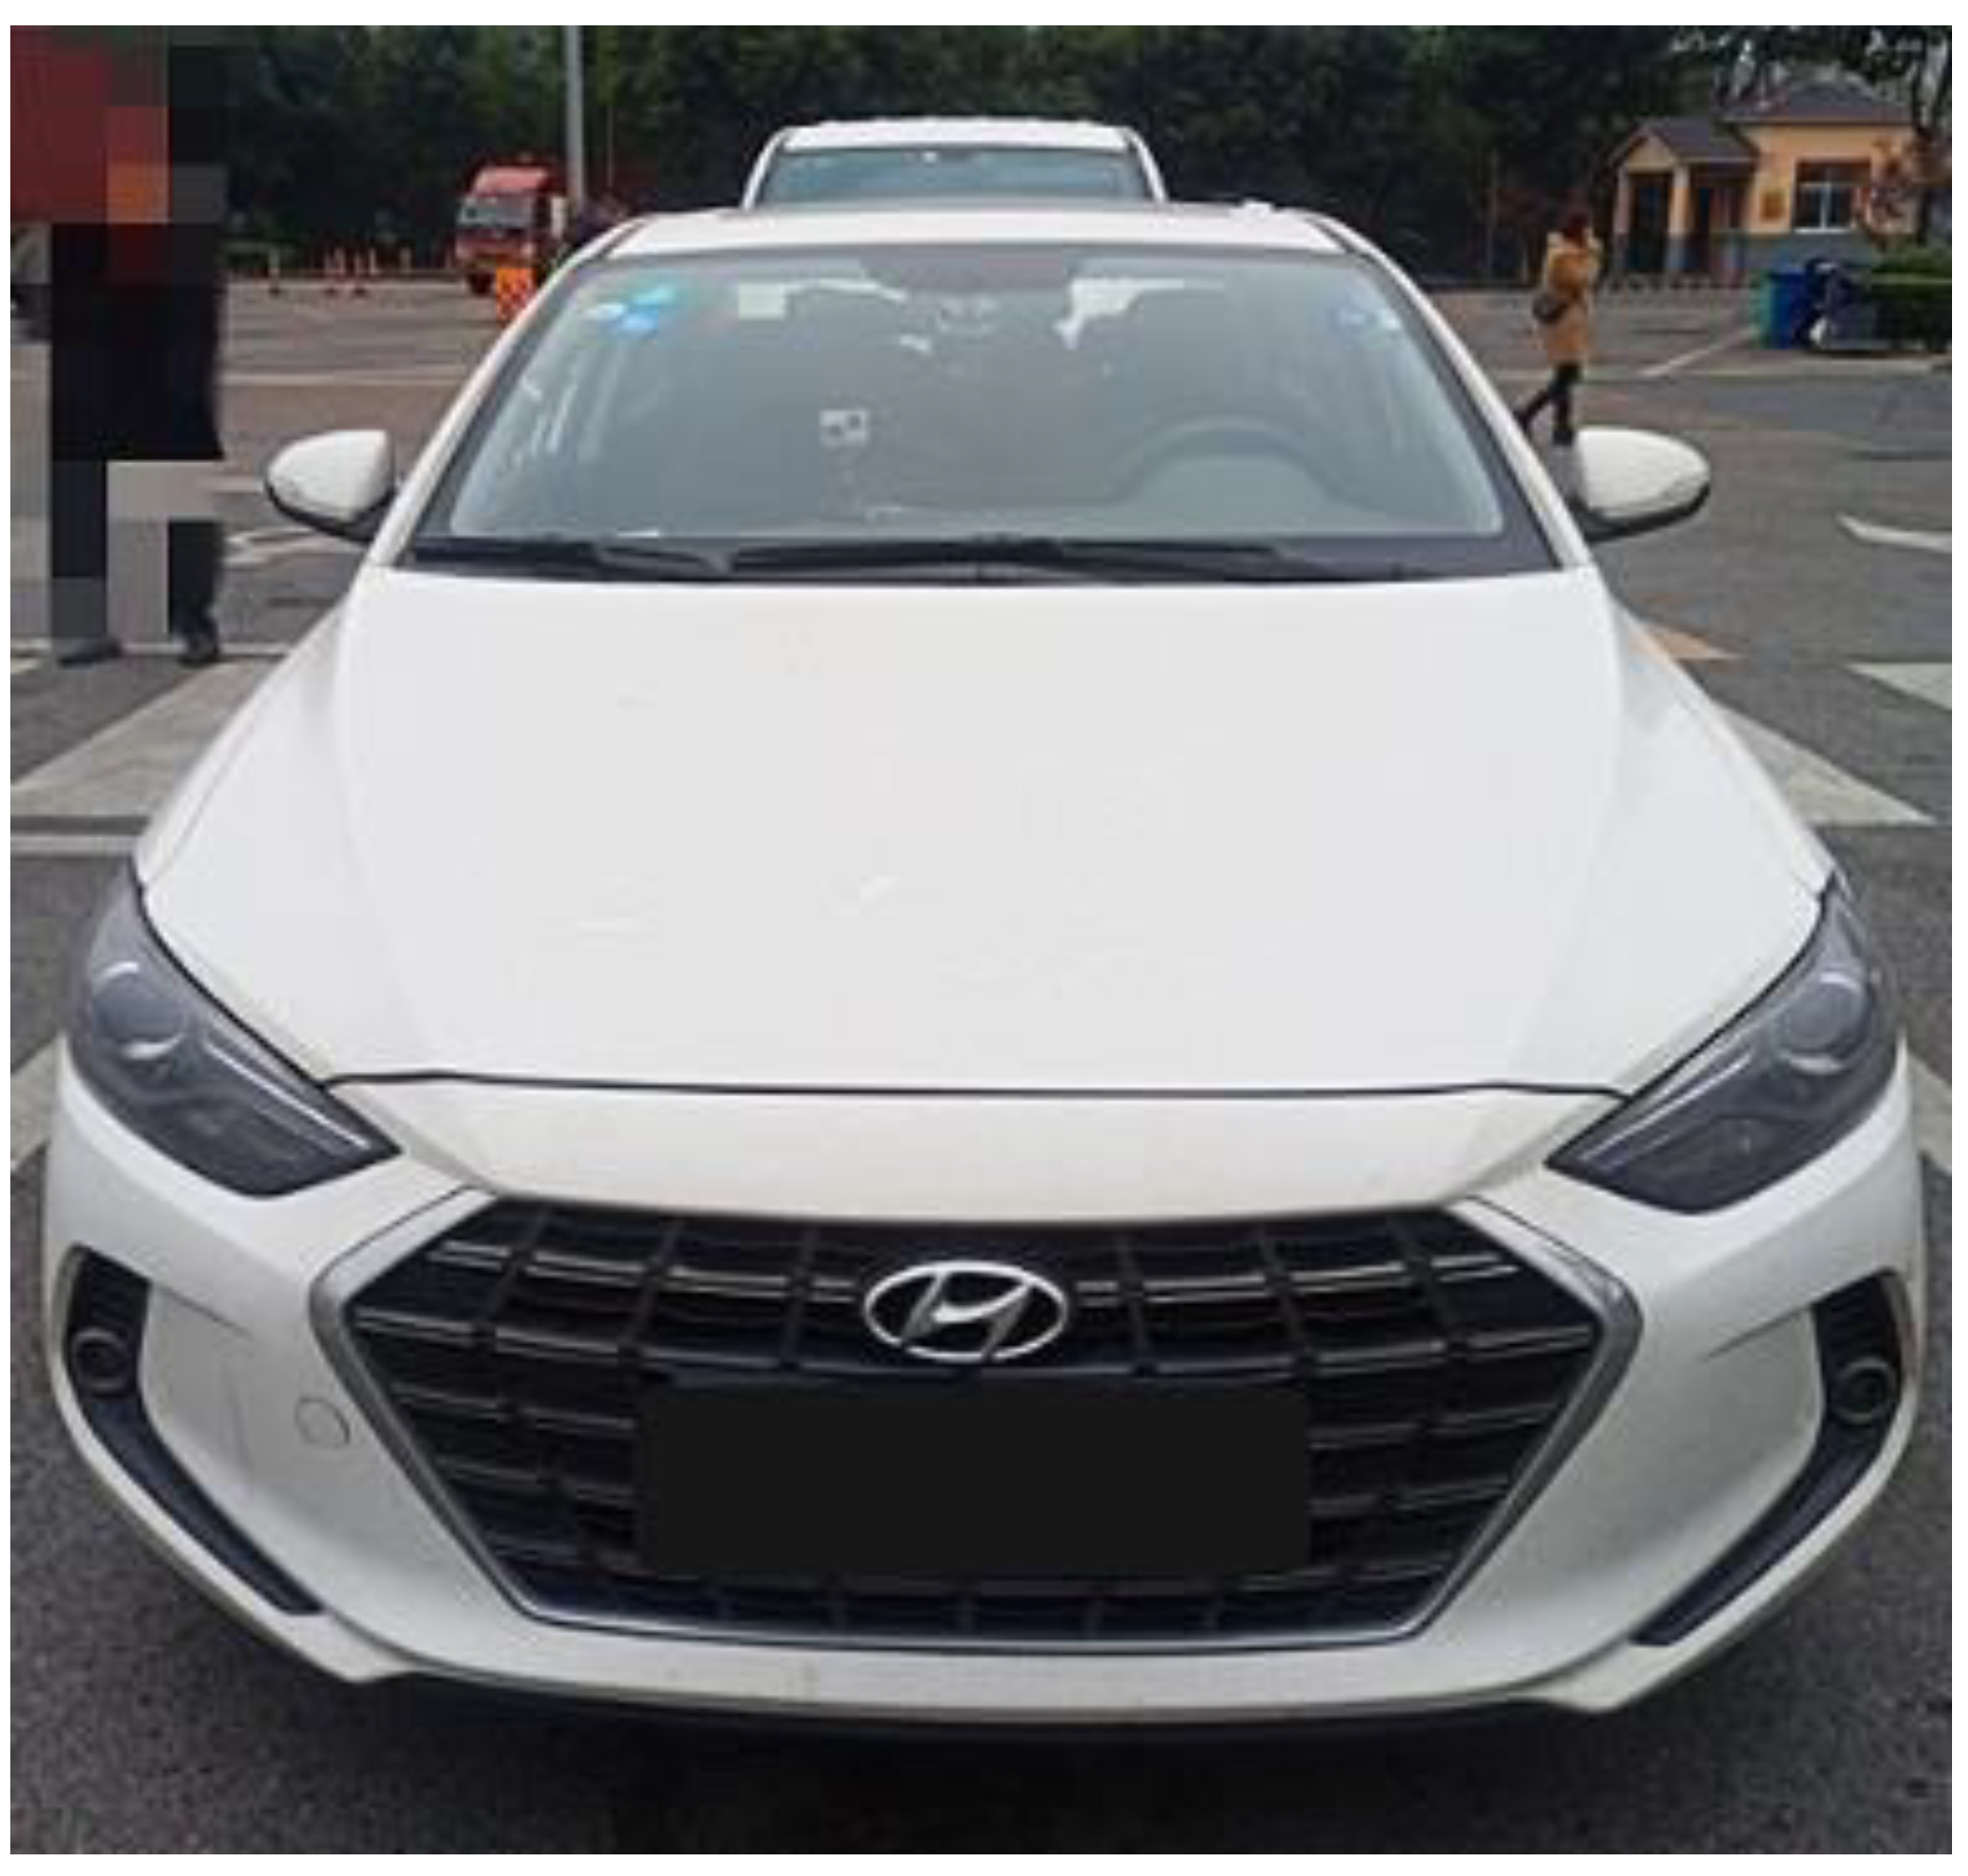
2.3. Test Vehicle and Facilities

The temporal and spatial characteristics of eye movement are the physiological and behavioral manifestations during visual information extraction, which is related to human psychological activities. The Tobii Pro Glasses 2 wearable eye tracker enables wireless real-time observation. This lightweight device ensures comfort and freedom of movement for the participants during experiments. It captures natural visual behavior data at a sampling rate of 50 Hz. The human–machine synchronized cloud platform (ErgoLAB 3.0) intelligently overlays data from eye-tracking videos onto specified targets, generating visual results with quantified data or extracting eye-tracking metrics. The test vehicle is a 2019 Hyundai Elantra, with body dimensions of 4610/1800/1450 mm (length/width/height) and a wheelbase of 2700 mm. The vehicle is equipped with a 1.5 L engine mated with a 6-speed continuously variable transmission, which meets the driving requirements of the experimental roads.

2.4. Experimental Procedure

The experiment was conducted from November 15 to 7 December 2021. Considering the reduced number of tourists and traffic control measures for large trucks during the winter season on the Yakang Expressway, the traffic flow on the experimental sections was relatively small. During the experimental period, the traffic volume for Section A ranged from 2000 to 3500 vehicles per day, and that for Section B was between 4000 and 6000 vehicles per day. These vehicles were operated under free-flow conditions.
To analyze the impact of natural lighting on driving behavior, the experimental period was divided into daytime and nighttime. Luding County is located between Sections A and B, about 10 km from both sections. According to the weather forecast, the sunrise time at Luding during the experimental period was from 07:36:02 to 07:52:14, the sunset was from 18:15:17 to 18:11:10, and the duration of darkness was from 18:40:29 to 18:37:10. Considering the weather forecast and the actual conditions, daytime and nighttime were set from 10:00 a.m. to 3:00 p.m. and from 7:00 p.m. to 9:00 p.m., respectively. The temperature in the test area ranged from 5 to 19 °C, and the weather was cloudy or sunny. The speed limit on the experimental sections was 80 km/h, and drivers were instructed to drive freely according to their driving habits, adhering to traffic laws and regulations. The experimental procedure were shown in Figure 4, Figure 5 and Figure 6.

3. Results

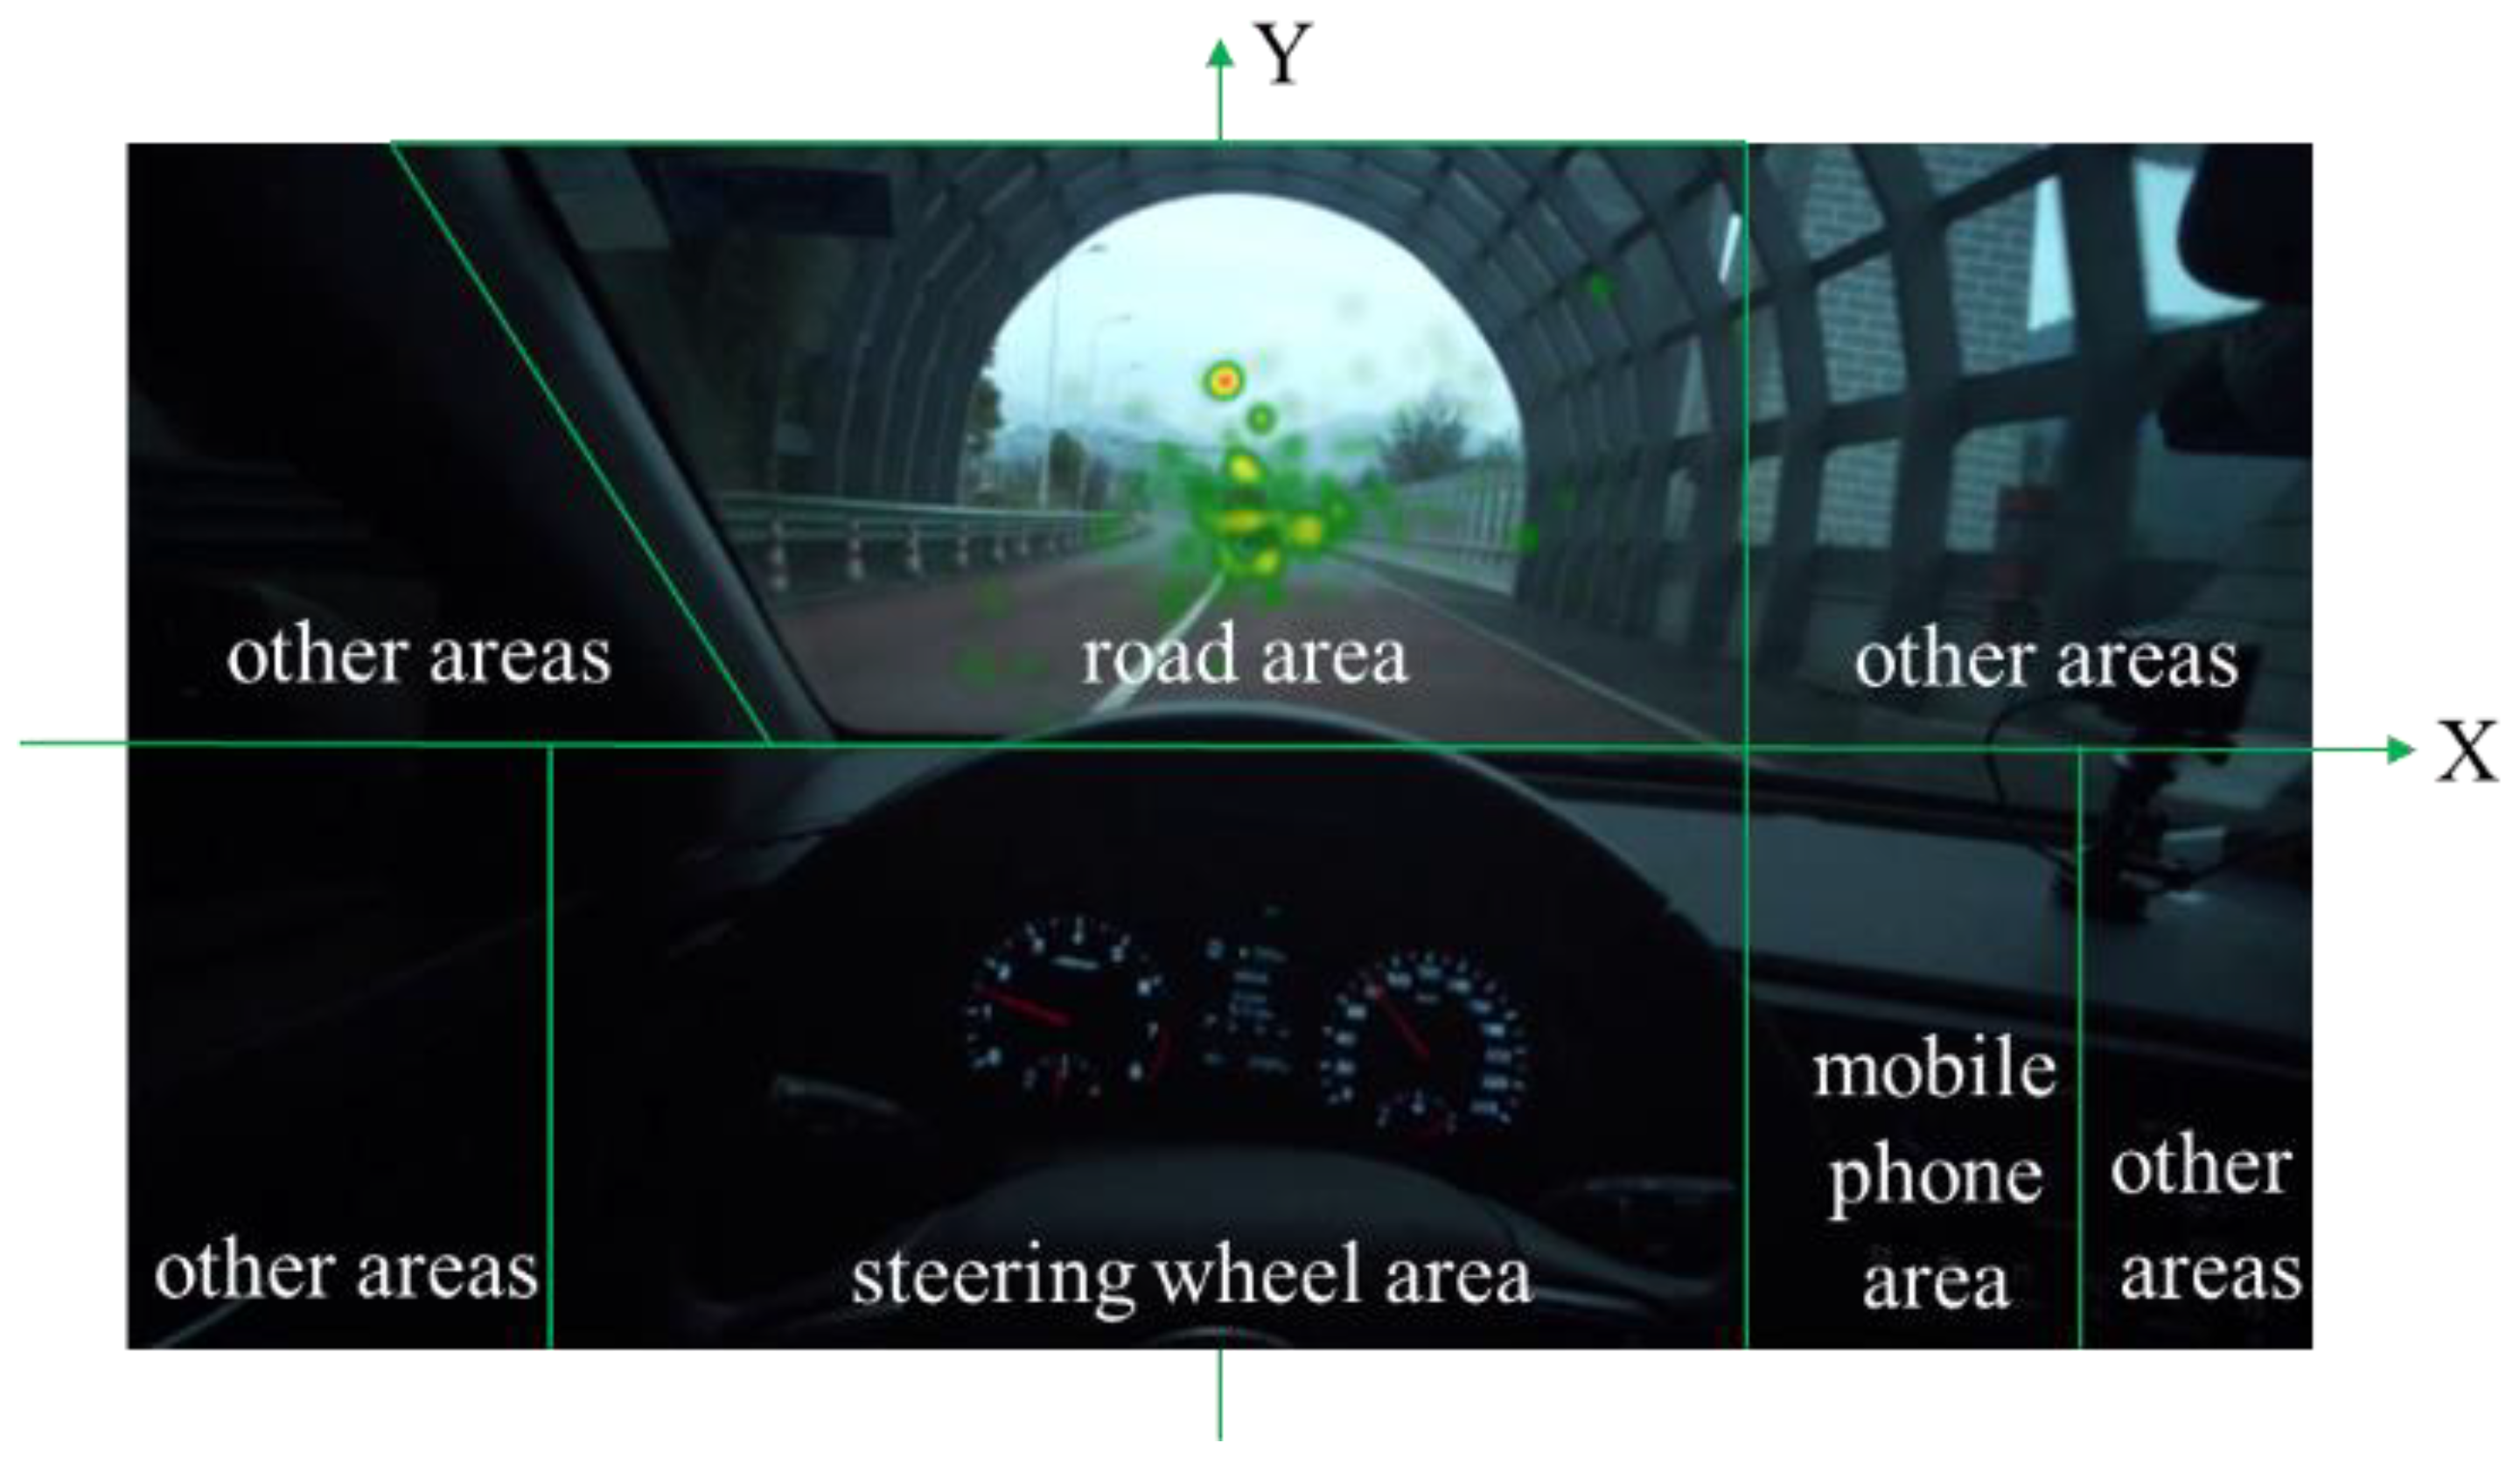
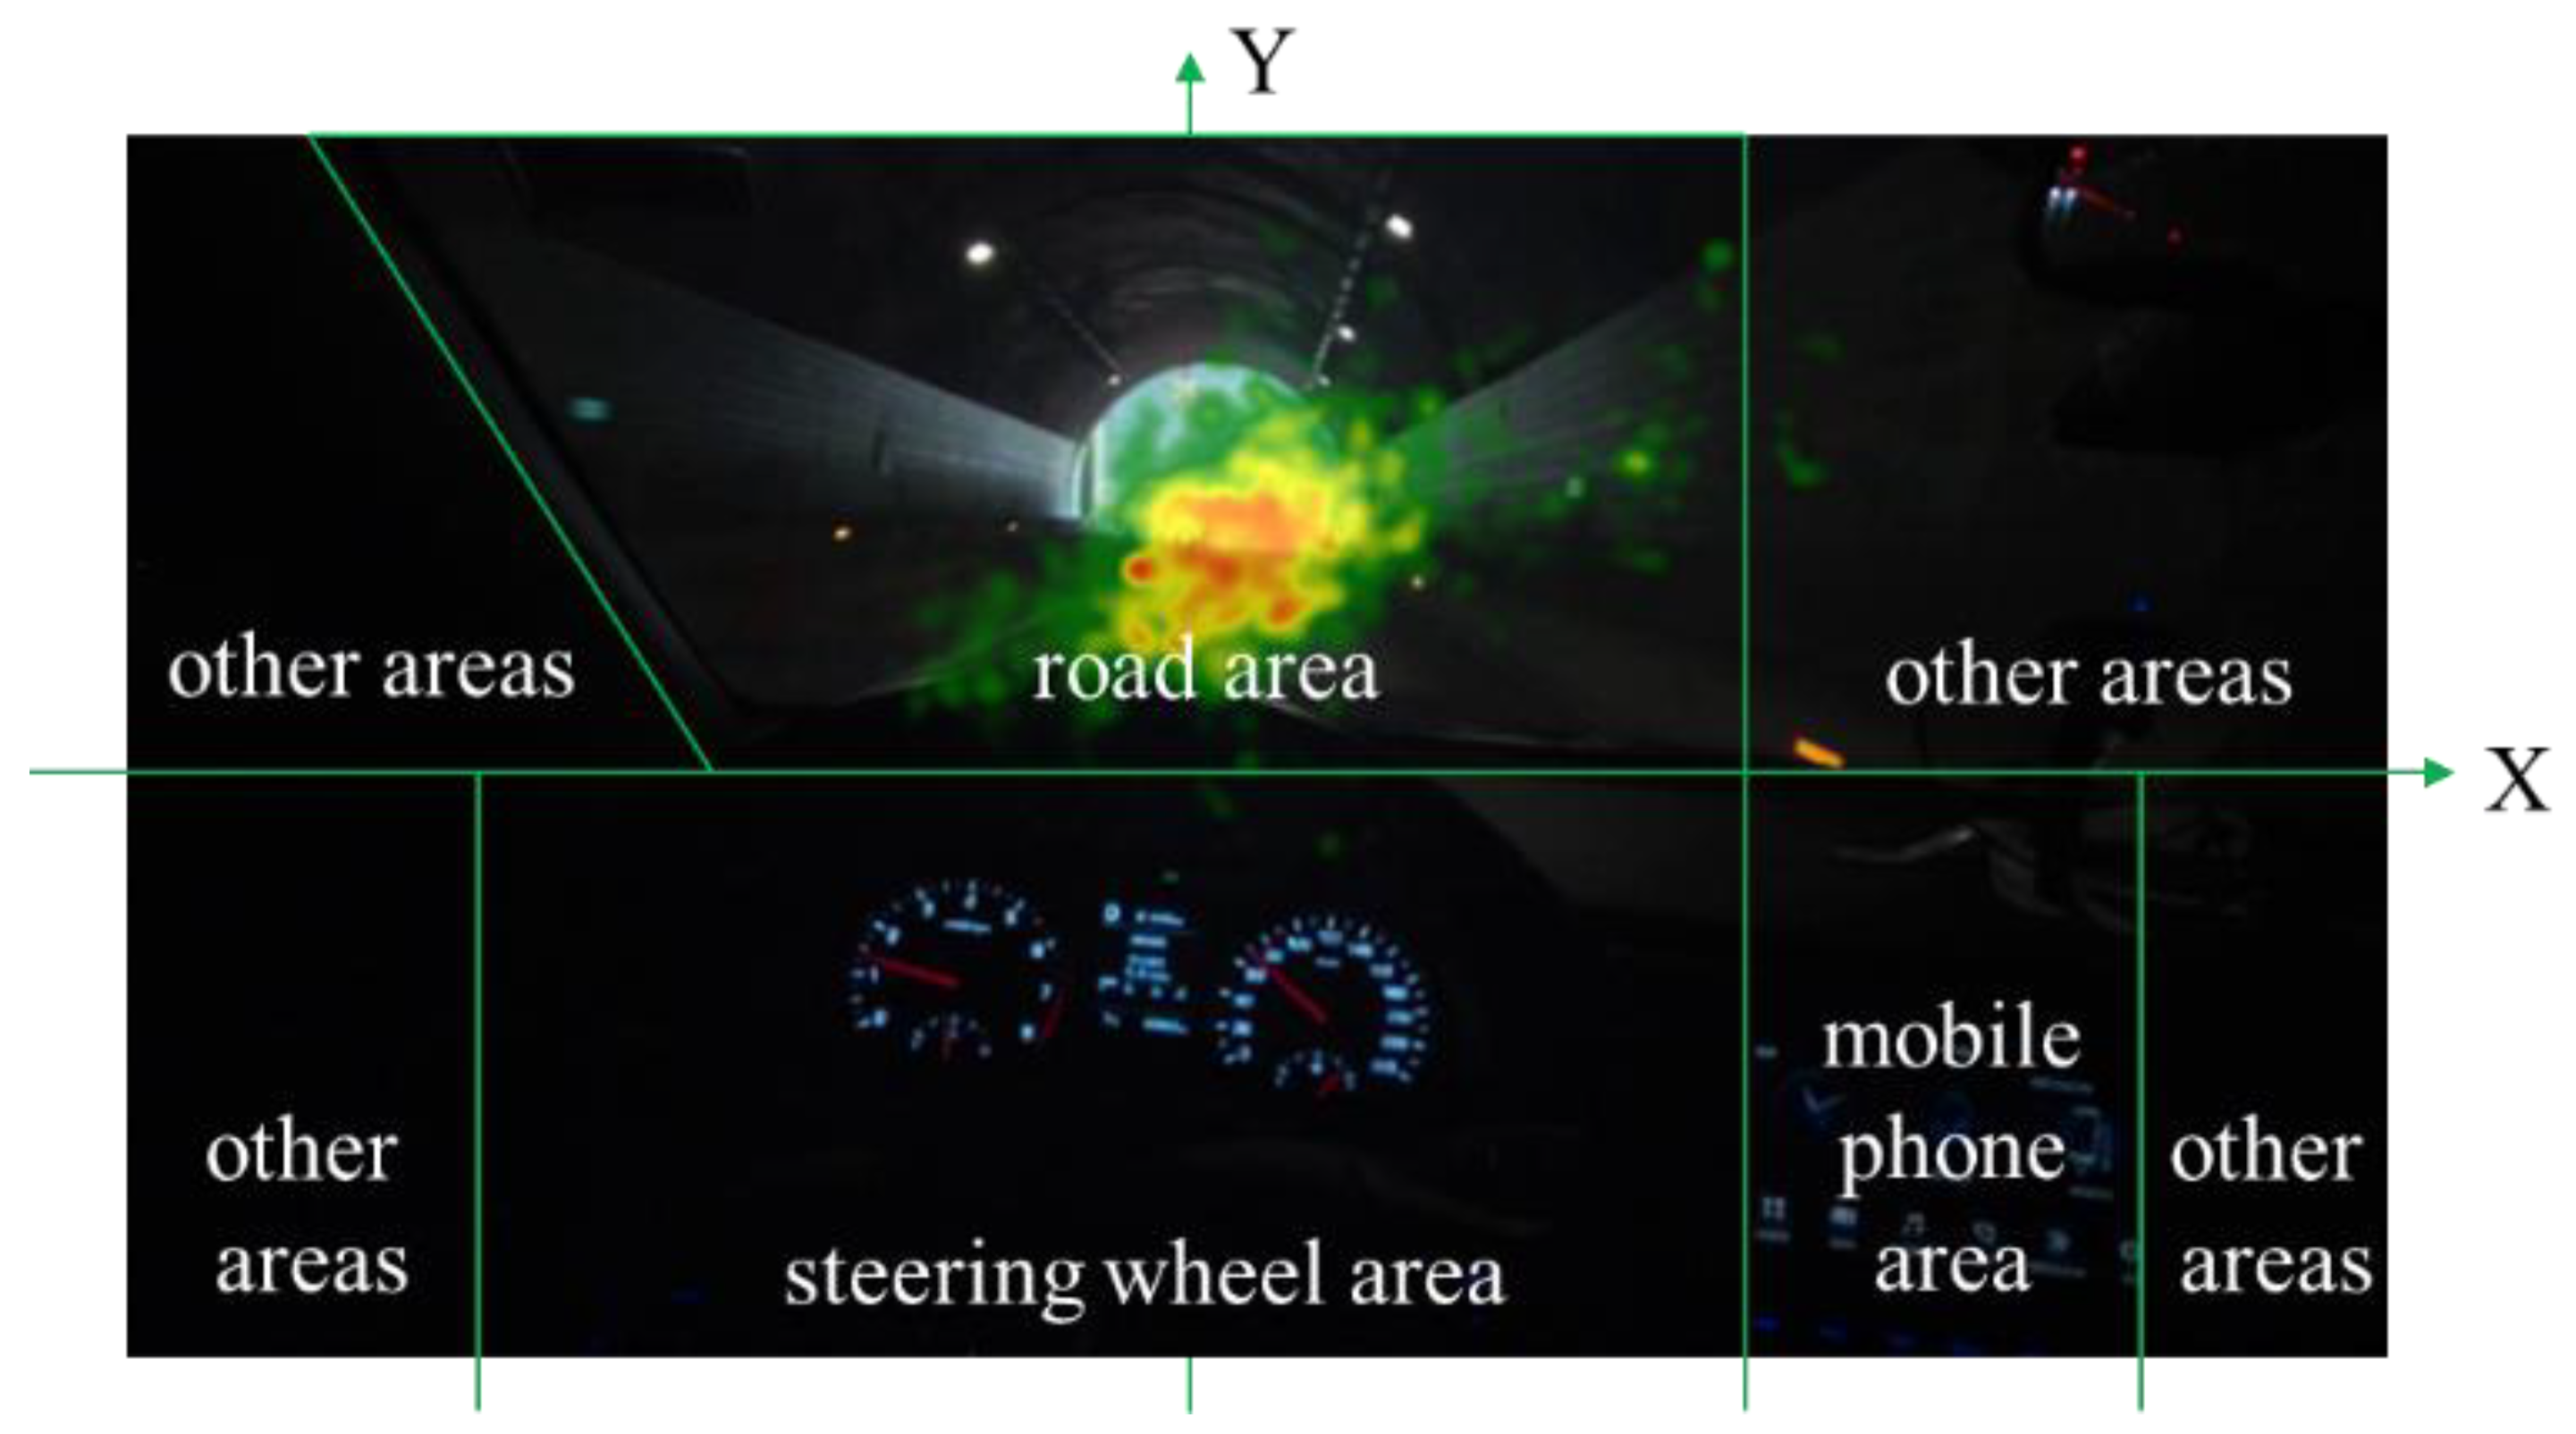
3.1. Drivers’ Fixation Area

The fixation area reflects the characteristics of drivers’ gaze behavior as they gather information about the road and target points while driving. The fixation heatmap created in this study illustrates the concentration of fixation points generated by drivers in a given time period. In the fixation heatmap, the pixel represented in red has the largest number of fixation points, yellow represents that there are half of the maximum number of fixation points, and green represents the lowest density of fixation points. Based on driving behavior and relevant research, the fixation area was divided into the road area, steering wheel area, mobile phone area, and other areas. The fixation heatmap at the exit of a short tunnel is shown in Figure 7, and the fixation heatmap at the exit of an extra-long tunnel is shown in Figure 8. It can be observed that longer tunnels correspond to a higher concentration of fixation points; while driving through tunnel-bridge groups, the drivers mainly direct their focus toward the lower right area of the road in front of them.

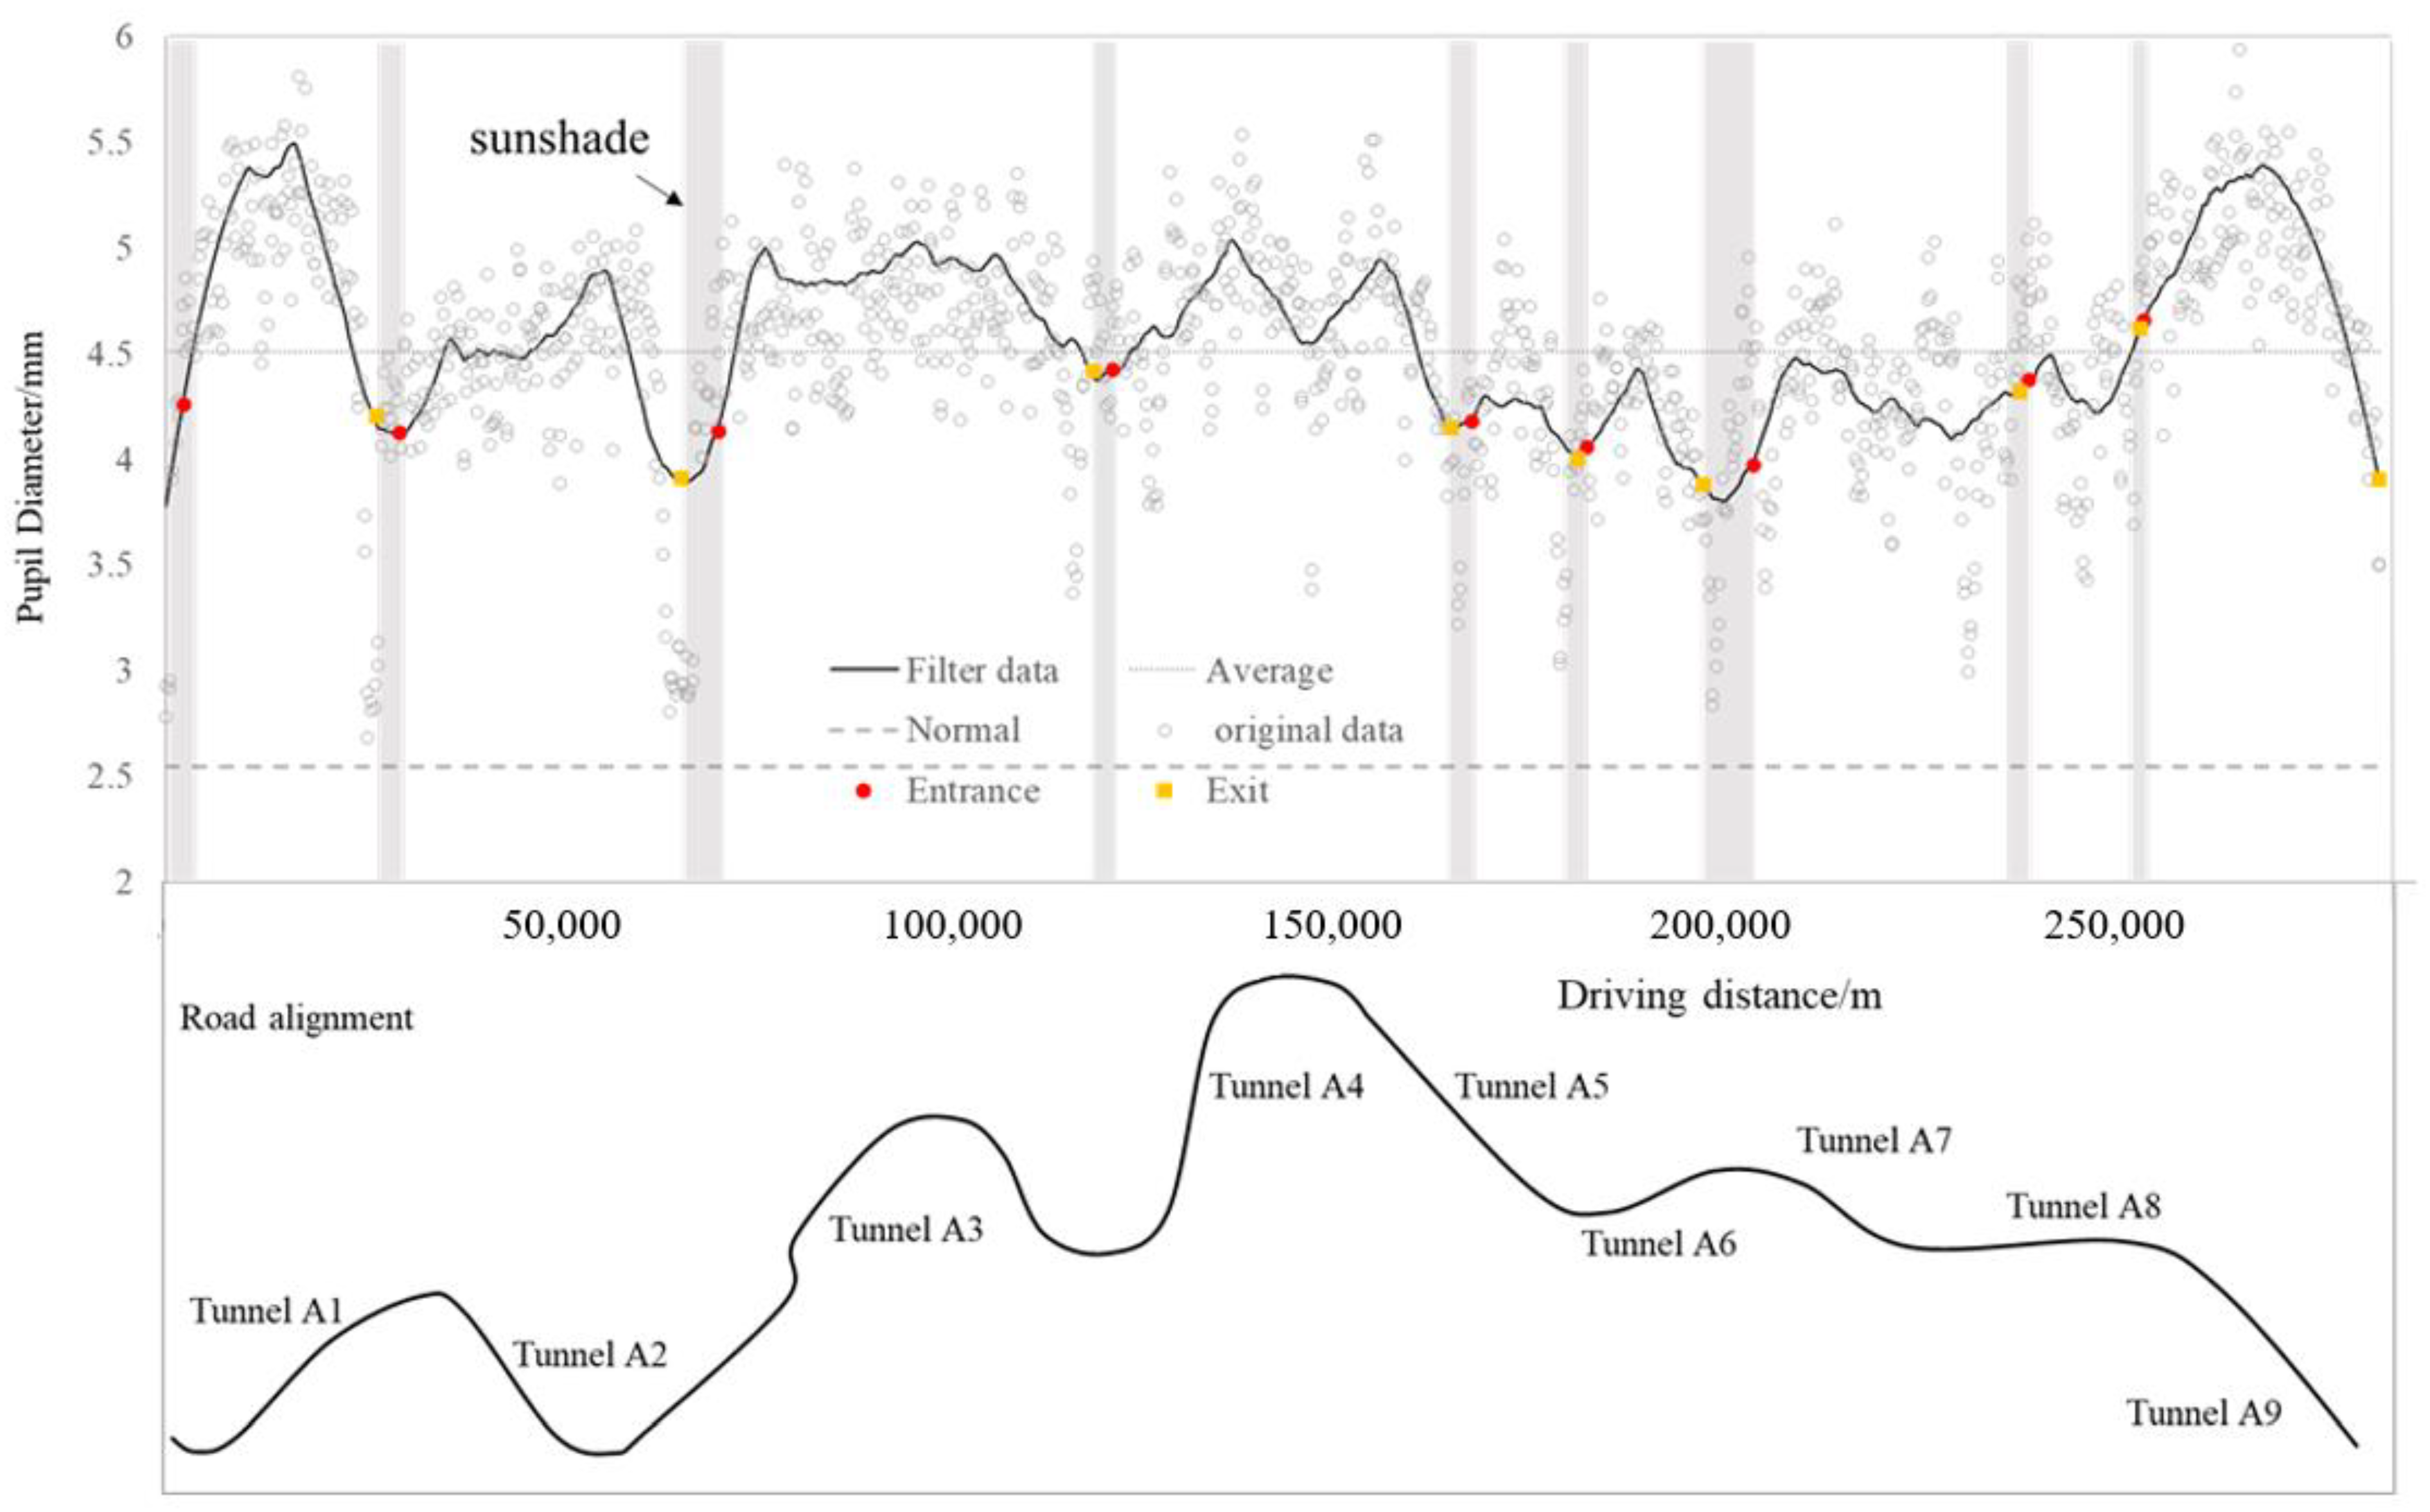
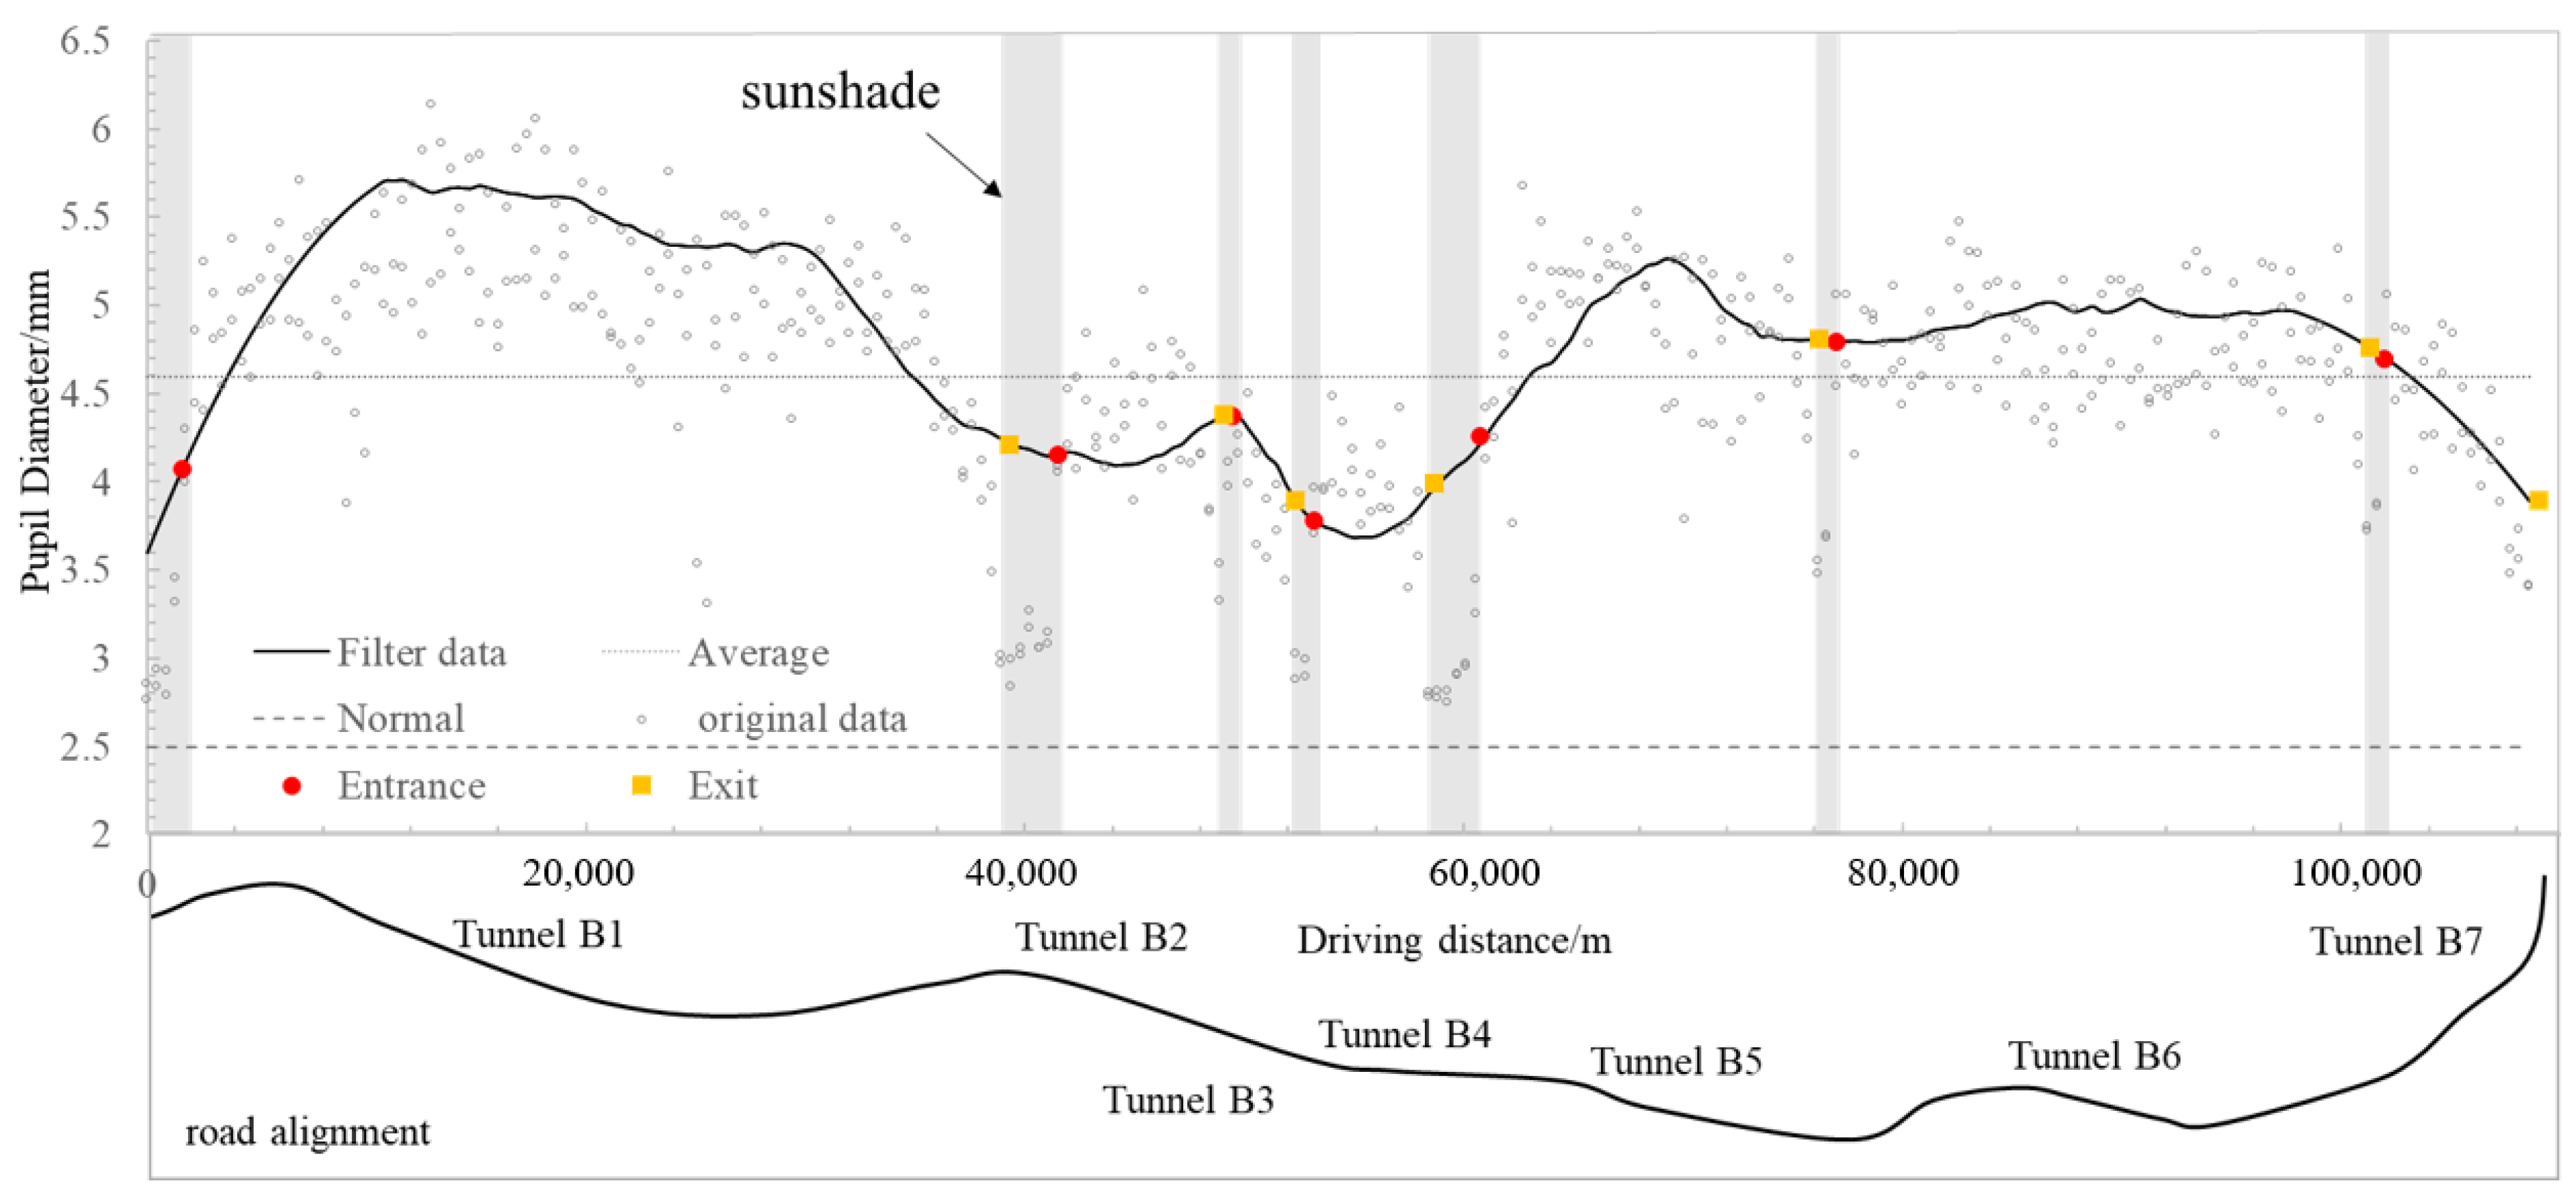
3.2. Pupil Diameter of the Drivers

The pupil is a small circular aperture located at the center of the iris in the eyes of animals and humans. It serves as the passage of light into the eyes. Pupil diameter was measured directly with an eye-tracking device and the obtained data were exported using ErgoLAB 3.0 software. Data smoothing techniques (smooth function) and digital FFT filtering were applied to avoid amplitude distortion and ensure curve smoothness. The average pupil diameter values of the left and right eyes were selected as the base data. A comprehensive plot was generated to show the variation of pupil diameter with driving distance and the geometric alignment of tunnel-bridge groups (Figure 9 and Figure 10). The results showed that while driving through the first tunnel of the tunnel-bridge groups A and B, the drivers’ pupil diameter remained at its maximum value of 5.0 to 5.5 mm. The pupil diameter within the other tunnels of the tunnel-bridge groups showed a rising trend with increasing tunnel length.

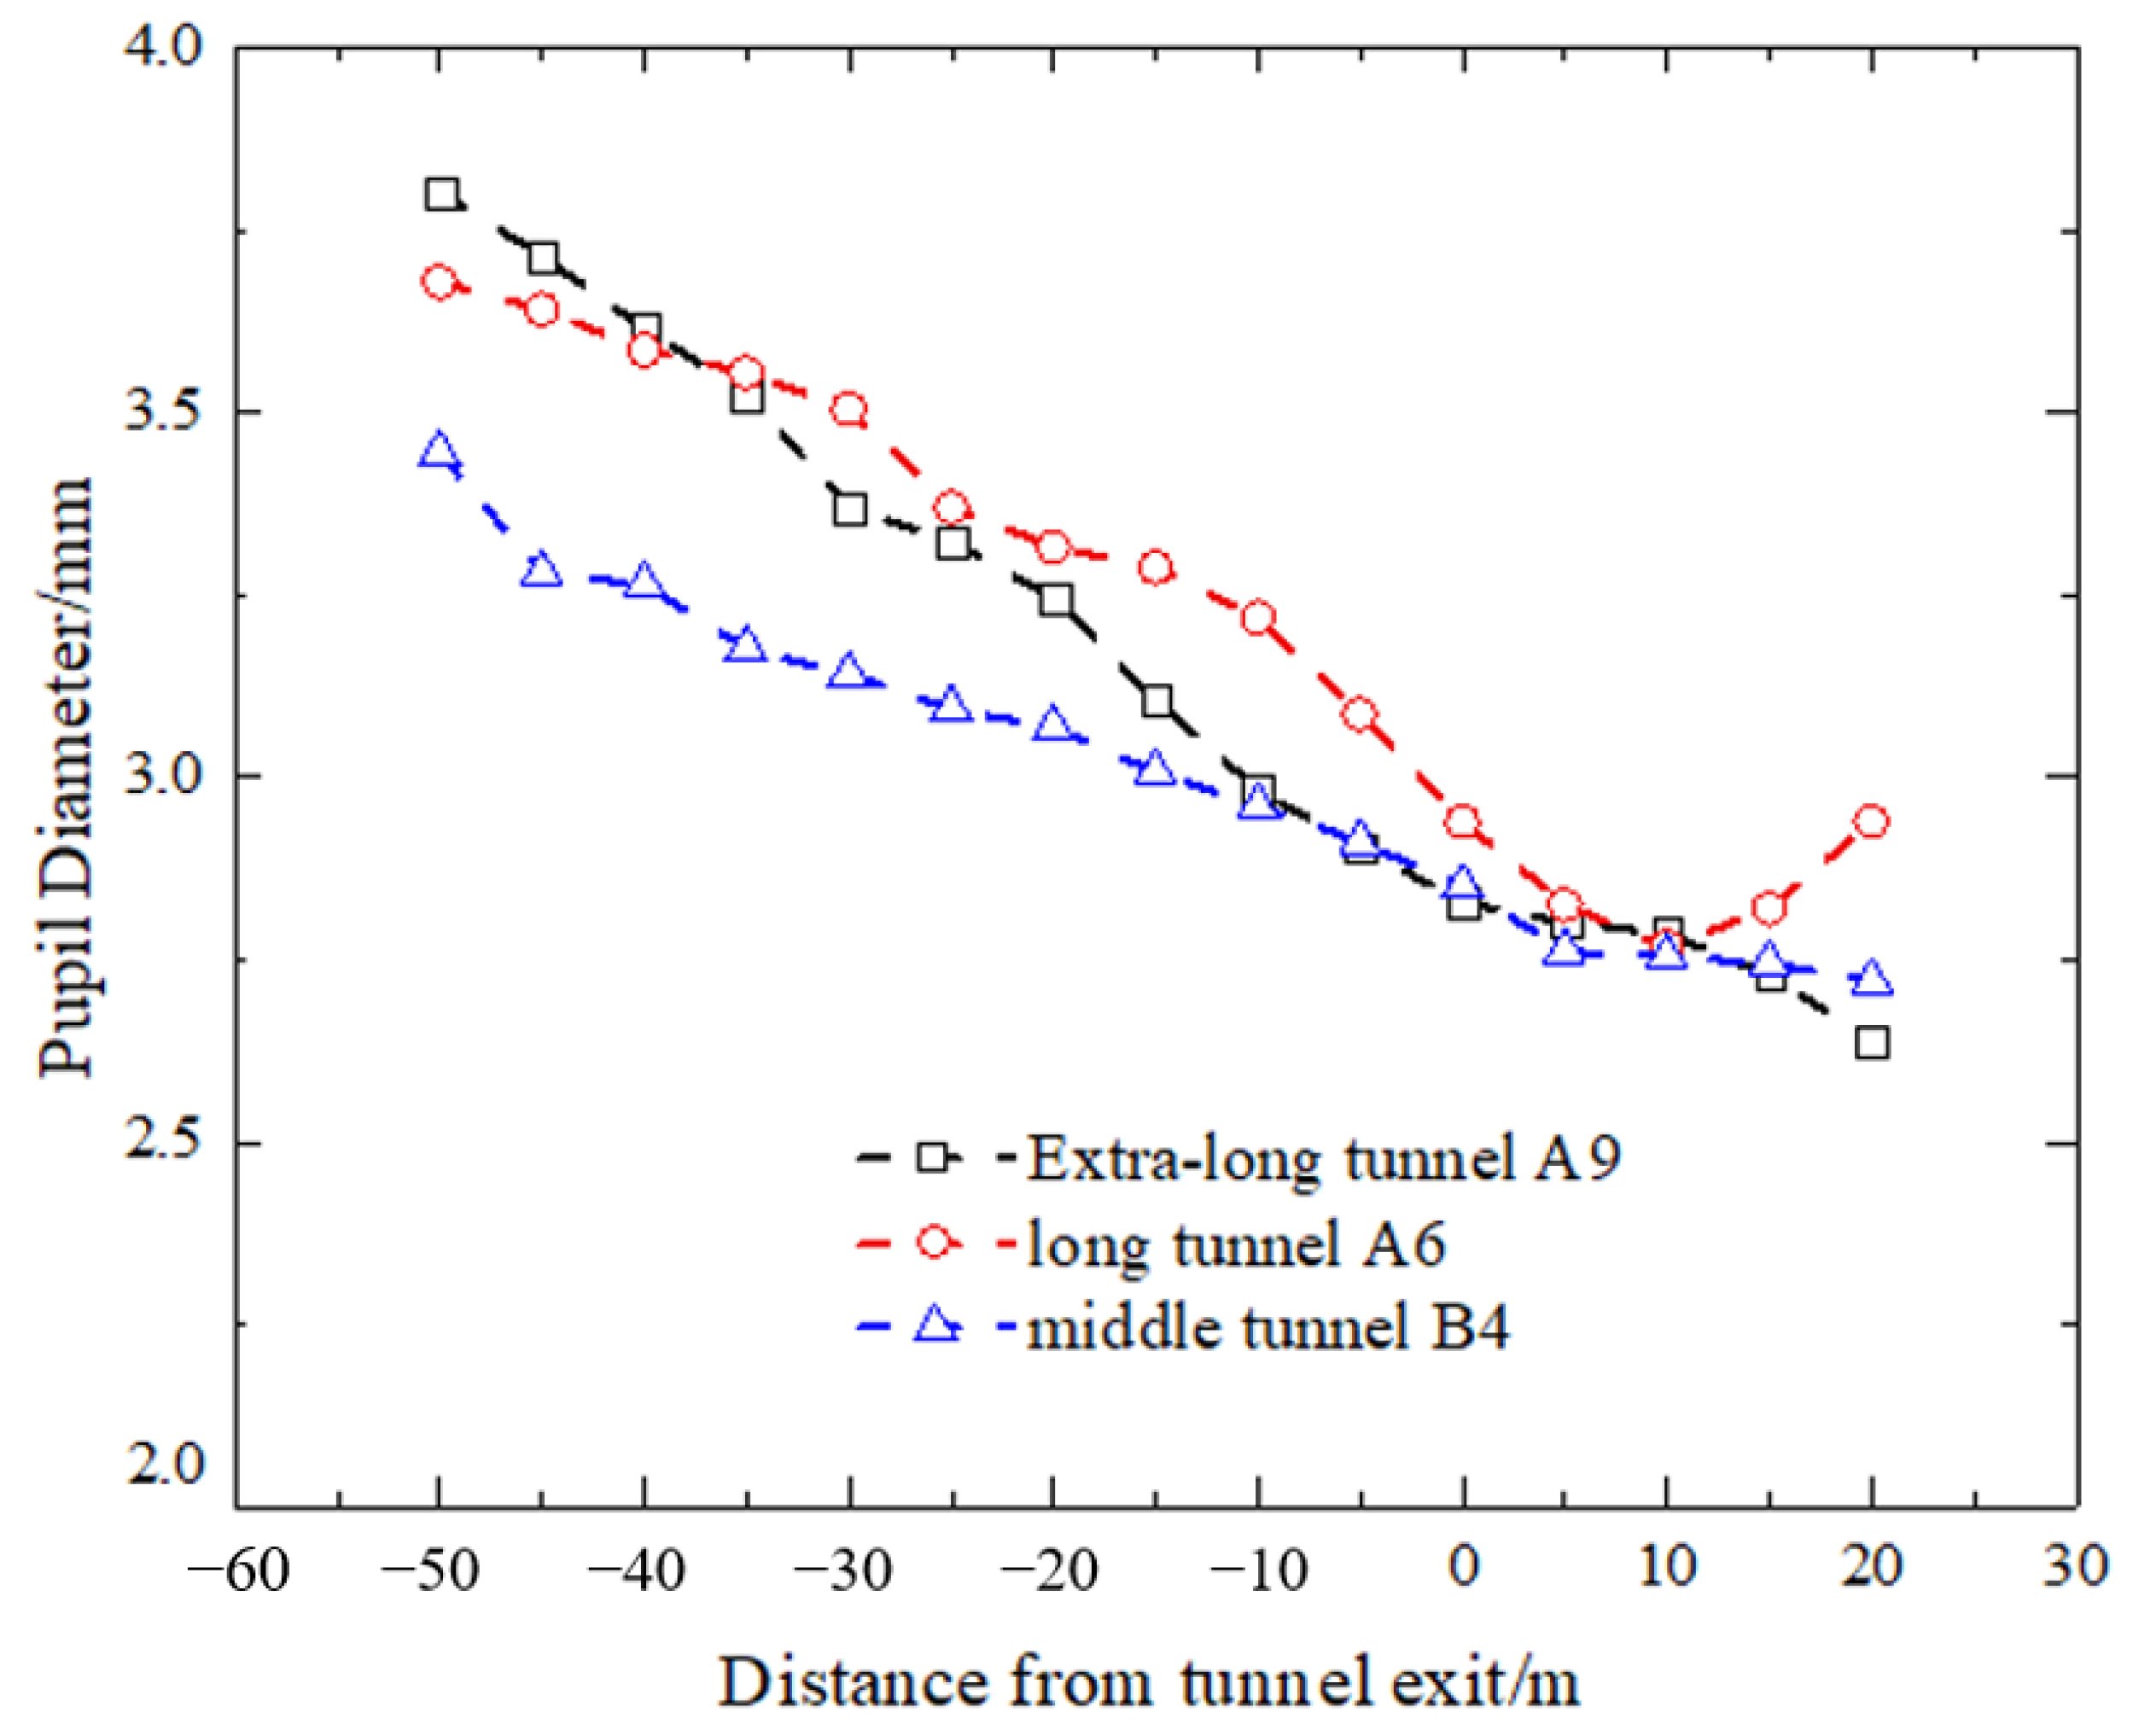
3.3. The Influence of Tunnel Length on Pupil Diameter

Three representative tunnels from the tunnel-bridge groups were selected for comparative analysis based on their lengths: extra-long tunnel A9 (3685 m), long tunnel A6 (1953 m), and medium tunnel B4 (566 m). The pupil diameter at the entrances of these tunnels is shown in Figure 11. As the tunnel length increased, the driver’s pupil diameter in the 0–50 m zone before the tunnel entrance also increased. After entering the tunnel, the pupil diameter in the extra-long tunnel exhibited significant fluctuations, yet the overall pattern remained consistent with the pre-tunnel entrance state.
The pupil diameter at the exits of the tunnels is shown in Figure 12. A greater tunnel length corresponds to a larger pupil diameter at the exit. As drivers gradually moved out of the tunnels, the pupil diameter decreased rapidly, and the reduction while exiting the extra-long tunnel was the most remarkable. Approximately 10 m after leaving the extra-long tunnel, the pupil diameter became comparable to the values corresponding to other tunnels with different lengths.

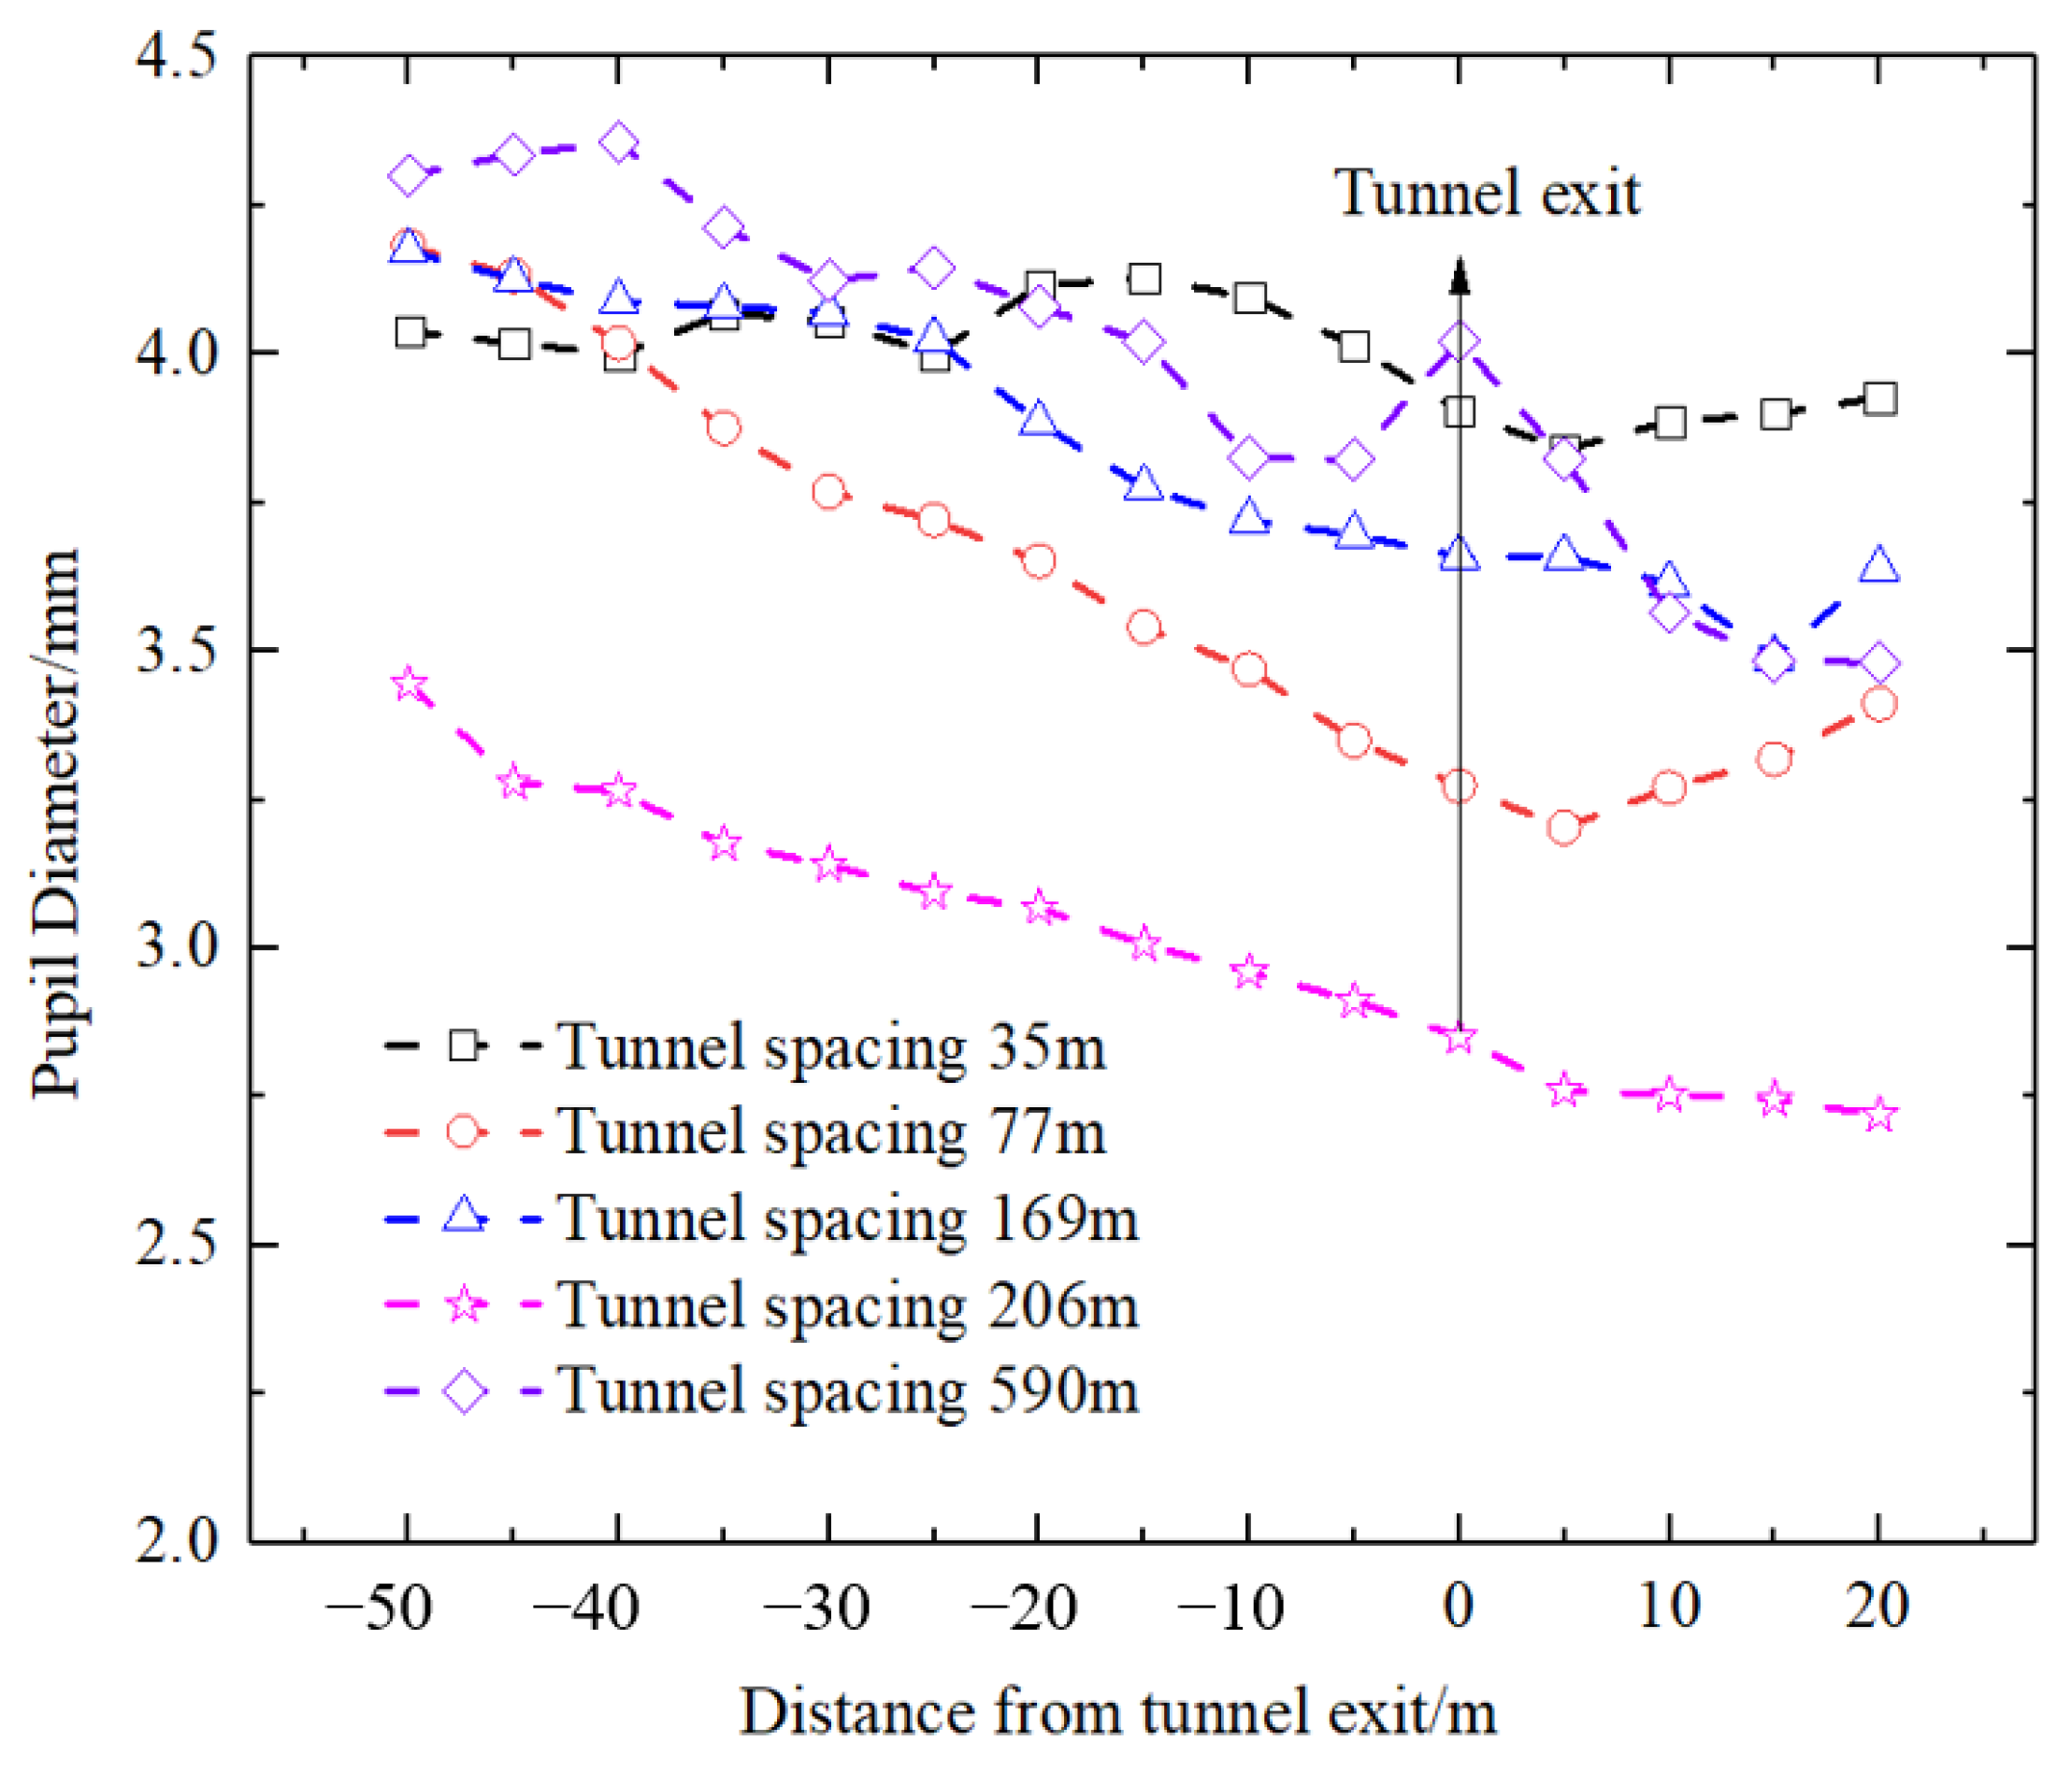
3.4. The Impact of Adjacent Tunnel Spacing on Pupil Diameter

The data of drivers’ pupil diameter at the entrances and exits corresponding to adjacent tunnel spacing of 35 m (B2), 77 m (A5), 169 m (B6), 206 m (B3), and 590 m (A4) are shown in Figure 13 and Figure 14. At the tunnel entrance, in terms of the pupil diameter, the ranking is P169 > P77 > P35 > P590 > P206. At the tunnel exit, the order is P35 > P590 > P169 > P77 > P206.

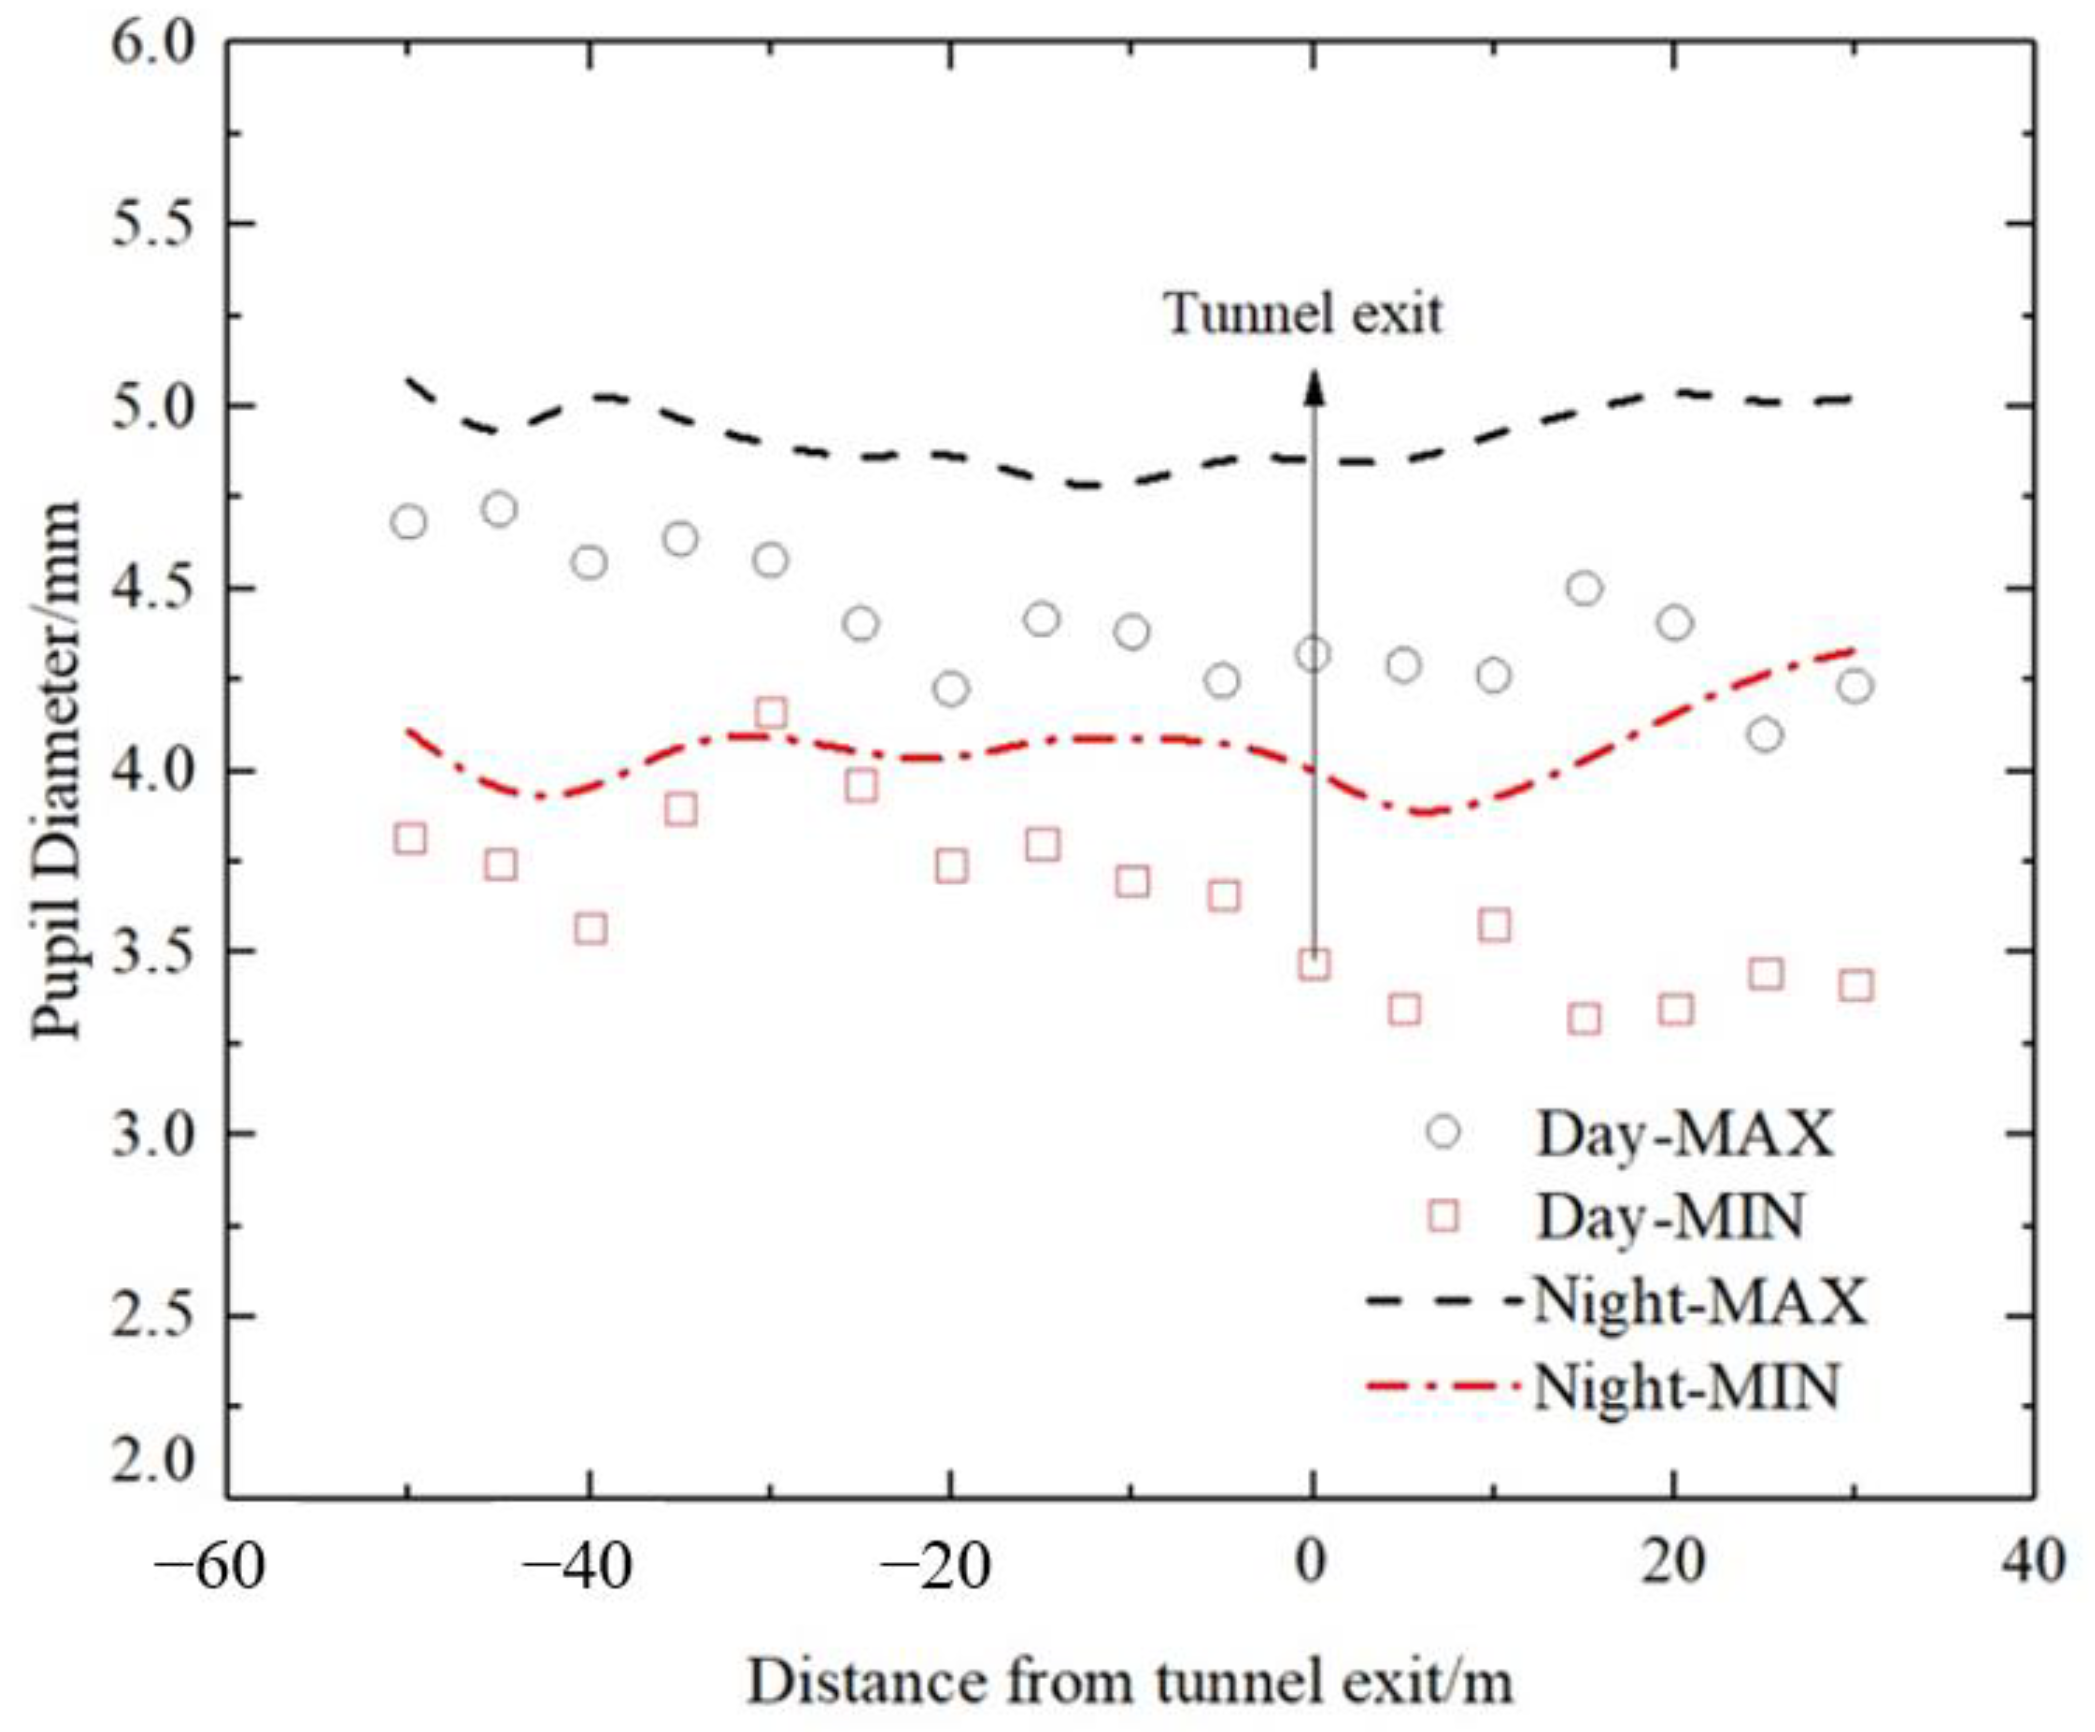
3.5. The Effect of Natural Light Conditions on Pupil Diameter

The average pupil diameters at different tunnel entrances and exits during day and night are shown in Figure 15 and Figure 16. At both tunnel entrance and exit, the pupil diameter values at night are larger than that at daytime. At daytime, the brightness outside the tunnel is higher than that inside the tunnel. At tunnel entrances, the pupil diameter of drivers tends to gradually increase until they adapt to the dark environment. In contrast, at night, the tunnel is well-lit for safety reasons. As drivers enter the tunnel, the pupil diameter gradually decreases and then stabilizes as they adapt to the brighter lighting conditions inside. The pattern was reversed at tunnel exits. Specifically, during night driving, after leaving the tunnel, the pupil diameter gradually increases to a stable value with the adaption to the dark environment outside.

3.6. Evaluation of Driver Visual Load

ISO 2631-1-1997 “Mechanical vibration and shock” [44] uses the “weighted root mean square acceleration” as a basic indicator for evaluating whole-body vibration in humans. The pupil size variation induced by the abrupt illumination changes at tunnel entrances and exits is a transient process. In this respect, this phenomenon is similar to the differential settlement-induced vehicle vibration at bridgeheads. The weighted root mean square of the pupil dilation velocity can be used to evaluate the visual workload of drivers [45]. The formula is as follows:
V ω ( t 0 ) = 1 τ t 0 τ t 0 V τ 2 ( t ) d t 1 2
where V ω ( t 0 ) represents the instantaneous pupil area changing frequency-weighted velocity amplitude; τ denotes the integration time constant; t represents time (integration variable); t 0 stands for the observation time (instantaneous). A small τ indicates transient vibration or transient shock.
M T P A refers to the maximum value of V ω ( t 0 ) . When measuring the M T P A at tunnel entrances and exits, the recommended value for τ is 1 s. The expression for M T P A is as follows:
M T P A = max V ω ( t 0 )
Relevant studies have shown that M T P A correlates with the duration of the visual oscillation. The duration of visual oscillation is defined as the period between the starting point when the pupil area increases by more than 50% compared to the previous moment, and the ending point when the pupil area decreases by more than 50% compared to the preceding moment. Due to the short duration of the visual oscillation, to achieve a quantitative assessment of the visual psychological and physiological load on the drivers, the indicator is multiplied by a conversion coefficient to obtain the converted visual oscillation duration, denoted as “ t c ”. Research suggested that visual stimuli shorter than 0.1 s do not cause adverse effects on drivers’ visual perception, and 0.2 s is the typical minimum duration of visual stimuli in psychological experiments. Du et al. found that at tunnel entrances and exits, when t c < 0.2 s, the visual oscillation may cause slight discomfort to drivers but does not affect their driving behavior. However, when t c > 1 s, which indicates a severe visual oscillation, a significant psychological and physiological load will be exerted on the driver [46]. This impairs drivers’ ability to perceive the road and relevant traffic information, such as traffic signs and the presence of vehicles ahead and behind, significantly increasing the risk of traffic accidents. With the two indicators, namely, M T P A and the converted visual oscillation duration, a visual comfort evaluation index system for tunnel-bridge groups is established (Table 3), and the evaluation results of drivers’ visual load are divided into five levels: A to E.
Based on the lighting conditions in different sections of the tunnel, this study categorizes the tunnel into seven segments: the entrance access zone, the entrance section, the entrance change-over portion, the basic segment, the exit change-over portion, the exit section and the exit access zone, as shown in Figure 17 [47]. The visual load was calculated, and the results are shown in Table 4.

4. Discussion

Previous studies on driver behavior and psychological characteristics in tunnels have mostly focused on individual tunnels, with a particular emphasis on the effects of lighting, landscapes, colors, and other factors on pupils. Research on bridge-tunnel groups primarily centered around operational safety and accident-prone sections. There has been relatively limited investigation of the mechanism of visual workload on drivers in bridge-tunnel groups with high bridge-to-tunnel ratios. In this study, two bridge-tunnel groups were selected for real vehicle tests, during which eye-tracking data from 20 drivers were collected to analyze visual characteristics and driving workload.
The driver’s fixation area is the key to determining whether the driver can obtain effective road information. As can be seen from Figure 7 and Figure 8, when driving in bridge-tunnel groups, the driver’s fixation area is mainly concentrated in the lower right of the road area ahead, and in a longer tunnel, there are more gaze points. The reason may be that the driving environment in bridge-tunnel groups is relatively simple, and the drivers must observe the highway management regulations that prohibit lane changes, in addition to contending with the restrictions imposed by lighting conditions, visual distance, and other factors. In this condition, the drivers face a large visual load and are eager to drive out of the tunnel; therefore, they prioritize the information in the area ahead of the road. In addition, when drivers enter or leave the tunnel, they will experience sudden changes in the light condition, which will reduce the field of vision and the visual distance. This requires the drivers to pay more attention to the area closer to the road. Therefore, it is suggested to streamline the setting of traffic signs on the connecting sections of tunnels and bridges to reduce the disturbance of non-essential and non-urgent traffic information. Solid lines should be drawn throughout the connecting section, and vehicles should be prohibited from lane changes.
From Figure 13 and Figure 14, it can be seen that the distance between adjacent tunnels has an effect on pupil diameter. When the tunnel spacing is 206 m, the driver’s pupil diameter at the tunnel entrance and exit is the smallest. Under the condition of adjacent tunnel spacing of 35 m, as the driver approaches the entrance section, the pupil diameter changes slowly, and after entering the section, the value rapidly increases and then gradually stabilizes with the adaptation to the dark environment; the pupil diameter in the exit section is the largest. When the distance between adjacent tunnels is 77 m or 169 m, the pupil diameter of the driver in the tunnel entrance section falls in the largest range, and the pupil diameter in the tunnel exit section is in the middle range. When the distance between adjacent tunnels is 590 m, as the drivers move close to the entrance section, the pupil diameter remains stable, and after entering the tunnel, the value increases rapidly and peaks. The pupil diameter of the driver in the exit section first decreases slowly and then fluctuates greatly. The above findings show that when the distance between adjacent tunnels is too small, the black hole effect and the white hole effect frequently alternate, exerting a great psychological load on the driver at the tunnel entrance and exit. If the distance between adjacent tunnels is excessively large, it is difficult for drivers to adjust to the environmental changes in time, resulting in a rapid increase in pupil diameter and poor dark adaptation upon entering the tunnel. Therefore, when the distance between adjacent tunnels is less than 200 m, it is recommended to set a full-coverage shading shed between tunnels. When the distance between the adjacent tunnels is greater than 200 m, the shading shed can be set up in the exit section of the upstream tunnel, and the lighting can be strengthened in the entrance section of the downstream tunnel to improve the visual adaptability and comfort of the drivers.
M T P A was used to evaluate drivers’ visual load in bridge-tunnel groups A and B (Table 4). It can be found that in the entrance access zone, the visual load evaluation grade in the B1 and A6 tunnels is C. The main reason for the discomfort is as follows. Before entering the tunnel, there are long-distance sections with low visual load. While driving through these sections, the drivers have adapted to the light conditions. However, when they enter the tunnel, the environmental conditions suddenly change, and the drivers need to accommodate these variations. In the entrance section, the visual load evaluation grade of the A9 tunnel is C, and that of the A4 and A8 tunnel is B. At the entrance change-over portion, the visual load evaluation grade of the A6, A8, and A9 tunnels is C, and the grade of the A2 tunnel is B. At the exit change-over portion, the A5 and A7 tunnels are rated C in terms of visual load, and the A8 and A9 tunnels are rated B. In the exit section, the B1, B7, and A8 tunnels are rated B for visual load assessment. In the exit access zone, only the visual load evaluation grade of the B6 tunnel is B. Section A of the bridge-tunnel groups is too long, which explains why the drivers are anxious to leave when driving in the A8 tunnel and the A9 tunnel. The A4 tunnel entrance is close to the A3 tunnel exit, and there is a shelter. In this case, the driver has to stay in a dark environment and bear a high visual load for a long time. To avoid this situation, when the tunnel is too long, it is recommended to ease the driver’s driving pressure and improve visual comfort by setting retro-reflective arch and LED matrix landscape lighting belts.
With the combination of the results in Figure 9 and Figure 10 and Table 4, it can be seen that the visual load of drivers in section B is acceptable, mainly manifested as a small fluctuation of pupil diameter, and the visual load evaluation results ( M T P A grade) are consistently good across different segments. The reason is that compared with section A, section B has fewer tunnels, shorter tunnel lengths, smaller average longitudinal slope, and curve radii, and fewer bridge-tunnel connection sections, which contributes to more comfortable driving.

5. Conclusions

The planning and construction of mountain expressway bridge-tunnel groups are mainly affected by terrain and geological conditions. The light environment in the bridge-tunnel groups is also closely related to the safe operation of the mountain expressway. The inner space of the tunnel section of bridge-tunnel groups is enclosed, features a monotonous environment, and exhibits noticeable differences from the external environment. Under the condition of high-speed driving, the driver’s visual field refresh frequency is high, and the visual distance is relatively narrow. The frequent abrupt change in lighting conditions in bridge-tunnel groups causes a great visual load on the drivers. The drivers keep shuttling between the outdoor environment and tunnels with huge differences in lighting, and their eyes keep experiencing the “black and white hole effects”. When the distance between two continuous tunnels is too short, the drivers have to adjust promptly to light changes, i.e., the “black and white hole effect”. If the drivers intend to pass through the bridge-tunnel groups composed of multiple bridges and tunnels, they have to deal with frequent and repeated light-to-dark and dark-to-light transitions. These challenges will place a heavy visual load on the drivers, seriously affect their visual function, and make the bridge-tunnel group sections prone to accidents. Therefore, it is of great significance to study the visual changes of drivers and to reveal the mechanism of load changes.
Through experiments, this study studies the visual load of drivers in mountain expressway bridge-tunnel groups based on fixation area, pupil diameter, M T P A , etc. The experimental results show that when driving in bridge-tunnel groups, the pupil diameter of the drivers in the first tunnel falls within the largest range [5.0 mm, 5.5 mm], and the driving load is also the largest. In other tunnels of bridge-tunnel groups, the pupil diameter and the number of fixation points of drivers rise with the increase of the length. For a single tunnel in a bridge-tunnel group, the driver pupil diameter at 0–50 m before the tunnel entrance and at the tunnel exit is proportional to the tunnel length. If the distance between adjacent tunnels is too large or too small, the driver will maintain a large pupil diameter, which will reduce driving comfort. The grade of the driver’s visual load was evaluated based on M T P A . The results showed that a longer total length of bridge-tunnel groups, a larger number of tunnels, and a worse geometric index will all lead to more significant visual fluctuation and greater visual load.
This study provides a reference for the analysis of driving behavior in bridge-tunnel groups and the design of tunnel lighting and shading facilities. The driving in bridge-tunnel groups is affected by many factors, which cannot be all incorporated into the current study, so there are some limitations to this study. Future improvement directions are listed below:
(1)
In order to ensure driving safety in mountain highway bridge-tunnel groups, the participants of the experiments are all experienced drivers. The sample size is small, and the distribution is uneven. This study did not consider the influence of driver type on visual characteristics, and subsequent studies can further analyze the visual characteristics of drivers in terms of their gender, age, nationality, road familiarity, and driving style.
(2)
This study only uses two indicators, namely, fixation area and pupil diameter, to study driving behaviors in bridge-tunnel groups. Relevant studies on gaze time, gaze area division, and gaze transfer characteristics can be carried out in the future. Moreover, EEG, ECG, and myoelectric data can be obtained by physiological instruments to carry out a comprehensive analysis of the driver’s driving load.
(3)
This study is mainly carried out from an overall perspective of bridge-tunnel groups and does not fully consider the impact of bridge and tunnel geometric alignment on drivers’ visual characteristics, which will be further investigated in the future.

Author Contributions

Conceptualization, B.Z. and J.B.; methodology, J.B.; software, A.Z.; validation, Z.Y.; formal analysis, J.L.; investigation, B.Z., J.B. and Z.Y.; resources, A.Z.; data curation, Z.Y. and A.Z.; writing—original draft preparation, B.Z.; writing—review and editing, B.Z. and J.L.; visualization, Z.Y.; supervision, J.L.; project administration, J.B.; funding acquisition, B.Z. All authors have read and agreed to the published version of the manuscript.

Funding

This study is supported by the National Social Science Fund of China, grant number 21CMZ010.

Institutional Review Board Statement

The study was conducted in accordance with the Declaration of Helsinki, and approved by the Ethics Committee at the School of Civil Engineering, Chongqing Jiaotong University.

Informed Consent Statement

The Ethics Committee at the School of Civil Engineering, Chongqing Jiaotong University, supported the practice of the protection of the human participants in this research. All participants were informed of the research process and provided written informed consent in accordance with the Declaration of Helsinki. The item involving humans included driving experiments. Before the experiments, all participants were explicitly informed of the experimental process and that their data would be recorded. Participation was solicited, yet strictly voluntary.

Data Availability Statement

The data that were used to support the findings of this study are included within the article.

Acknowledgments

We appreciate the feedback from the editor and reviewers. The authors would also like to thank the research group for their assistance with experimental equipment and technology.

Conflicts of Interest

The authors declare no conflict of interest.

References

  1. JTG B01-2014; Technical Standards for Highway Engineering. Ministry of Transport of the People’s Republic of China: Beijing, China, 2014.
  2. Statistics Bulletin about the Development of Transportation Industry of China; Ministry of Transport of the People’s Republic of China: Beijing, China, 2021.
  3. Sun, Z.; Liu, S.; Tang, J.; Wu, P.; Tang, B. Exploring the Impacts of Driving Environment on Crashes in Tunnel–Bridge–Tunnel Groups: An Eight-Zone Analytic Approach. Sustainability 2021, 13, 2272. [Google Scholar] [CrossRef]
  4. Bassan, S. Overview of traffic safety aspects and design in road tunnels. IATSS Res. 2016, 40, 35–46. [Google Scholar] [CrossRef]
  5. Amundsen, F.; Ranes, G. Studies on traffic accidents in Norwegian road tunnels. Tunn. Undergr. Space Technol. 2000, 15, 3–11. [Google Scholar] [CrossRef]
  6. Caliendo, C.; De Guglielmo, M.L. Accident Rates in Road Tunnels and Social Cost Evaluation. Procedia-Soc. Behav. Sci. 2012, 53, 166–177. [Google Scholar] [CrossRef]
  7. Sun, Z.; Liu, S.; Li, D.; Tang, B.; Fang, S. Crash analysis of mountainous freeways with high bridge and tunnel ratios using road scenario-based discretization. PLoS ONE 2020, 15, e0237408. [Google Scholar] [CrossRef] [PubMed]
  8. Wang, J.; Pervez, A.; Wang, Z.; Han, C.; Hu, L.; Huang, H. Crash analysis of Chinese freeway tunnel groups using a five-zone analytic approach. Tunn. Undergr. Space Technol. 2018, 82, 358–365. [Google Scholar] [CrossRef]
  9. Bai, J.; Lin, Q.; Bi, H.; Tang, B. Drivers’ Eye Movement Characteristics in a Combined Bridge-Tunnel Scenario on a Mountainous Urban Expressway: A Realistic Study. J. Adv. Transp. 2022, 2022, 6403277. [Google Scholar] [CrossRef]
  10. Lee, J.; Kirytopoulos, K.; Pervez, A.; Huang, H. Understanding drivers’ awareness, habits and intentions inside road tunnels for effective safety policies. Accid. Anal. Prev. 2022, 172, 106690. [Google Scholar] [CrossRef]
  11. JTG D20-2017; Design Specification for Highway Alignment. Ministry of Transport of the People’s Republic of China: Beijing, China, 2017.
  12. JTG 3370.1-2018; Specifications for Design of Highway Tunnel. Ministry of Transport of the People’s Republic of China: Beijing, China, 2018.
  13. JTG/T D21-2014; Guidelines for Design of Highway Grade-Separated Intersections. Ministry of Transport of the People’s Republic of China: Beijing, China, 2014.
  14. Hu, S.F. Traffic Accident Characteristics and Mechanism Analysis of Mountain Highway Tunnel Group. Highway 2016, 61, 134–138. [Google Scholar]
  15. Wen, H.; Sun, J.; Zeng, Q.; Zhang, X.; Yuan, Q. The Effects of Traffic Composition on Freeway Crash Frequency by Injury Severity: A Bayesian Multivariate Spatial Modeling Approach. J. Adv. Transp. 2018, 2018, 6964828. [Google Scholar] [CrossRef]
  16. Shang, T.; Qi, H.; Huang, A.; Liu, T. A comparative driving safety study of mountainous expressway individual tunnel and tunnel group based on eye gaze behavior. PLoS ONE 2022, 17, e0263835. [Google Scholar] [CrossRef]
  17. Bao, X.W. Traffic Safety Analysis of Bridge and Tunnel Clusters on Mountain Highways. Transp. World 2020, 35, 103–108. [Google Scholar]
  18. Wang, W.Z.; Shi, X.F.; Zhang, H.B.; He, J.P. Study on the Characteristics Analysis of Traffic Accidents on the Hangzhou Bay Bridge. Highway 2016, 61, 152–156. [Google Scholar]
  19. Zhao, X.H.; Yang, H.Y.; Yao, Y.; Guo, M.; Qi, H.; Dai, Y.B.; Su, Y.L. Traffic Safety Evaluation and Feature Analysis of Freeway Bridge Sections. J. TongJi Univ. (Nat. Sci.) 2022, 50, 1637–1646. [Google Scholar] [CrossRef]
  20. Mo, F. Discussion on the Design of Gradient Zone Expressway in the Sichuan-Tibet Plateau. Highw. Traffic Sci. Technol. (Appl. Technol. Ed.) 2019, 7, 49–52. [Google Scholar]
  21. Shaohui, C.; Mao, L.; Nale, Z. A Study on Traffic Risk Assessment of Road Section with High Rate of Bridge and Tunnel of Freeway. In Proceedings of the 8th International Conference on Intelligent Computation Technology and Automation (ICICTA), Nanchang, China, 14–15 June 2016. [Google Scholar] [CrossRef]
  22. Qiao, J.; Wang, J.; Xie, Y.D.; Chen, Y.X. Study on safety distance of bridge-tunnel transition sections considering drivers’ psychological and physiological parameters. J. Chongqing Univ. Technol. (Nat. Sci.) 2023, 37, 274–281. [Google Scholar] [CrossRef]
  23. Jing-rong, B.A.; Bo-ming, T.A.; Zong-yuan, S.U.; Hui-yun, B.I.; Tian-jun, X.I. On Driving Load of Super-long Tunnel Adjacent to Interchanges. J. Transp. Syst. Eng. Inf. Technol. 2022, 22, 301–310. [Google Scholar] [CrossRef]
  24. Moreno, A.T.; Garcia, A.; Camacho-Torregrosa, F.J.; Llorca, C. Influence of highway three-dimensional coordination on drivers’ perception of horizontal curvature and available sight distance. IET Intell. Transp. Syst. 2013, 7, 244–250. [Google Scholar] [CrossRef]
  25. Biernacki, M.P.; Lewkowicz, R. How do older drivers perceive visual information under increasing cognitive load? Significance of personality on-road safety. Accid. Anal. Prev. 2021, 157, 106186. [Google Scholar] [CrossRef]
  26. Underwood, G. Visual attention and the transition from novice to advanced driver. Ergonomics 2007, 50, 1235–1249. [Google Scholar] [CrossRef]
  27. Rayner, K. Eye movements in reading and information processing. Psychol. Bull. USA 1978, 85, 618–660. [Google Scholar] [CrossRef]
  28. Meng-meng, D.U.; Bo-ming, T.; Xu-hui, H.U.; Bai-ke, H.E.; Tang-zhi, L.I. Driver’s Visual Load at Tunnel Entrance and Exit of Sections with High Ratio of Tunnels. J. Transp. Syst. Eng. Inf. Technol. 2018, 18, 113–119. [Google Scholar] [CrossRef]
  29. Wang, S.; Du, Z.; Jiao, F.; Zheng, H.; Ni, Y. Drivers’ visual load at different time periods in entrance and exit zones of extra-long tunnel. Traffic Inj. Prev. 2020, 21, 539–544. [Google Scholar] [CrossRef] [PubMed]
  30. Xu, J.; Zhang, X.; Liu, H.; Yang, K.; Ma, F.; Li, H.; Sun, Y. Physiological indices and driving performance of drivers at tunnel entrances and exits: A simulated driving study. PLoS ONE 2020, 15, e0243931. [Google Scholar] [CrossRef]
  31. Du, Z.; Wan, H.; Wu, C.; Pan, X. Safety Evaluation of Highway Tunnel-Entrance Illuminance Transition Based on Eye-Pupil Changes. Promet-Traffic Transp. 2014, 26, 363–370. [Google Scholar] [CrossRef]
  32. Qi, W.; Shen, B.; Wang, L. Model of Driver’s Eye Movement and ECG Index under Tunnel Environment Based on Spatiotemporal Data. J. Adv. Transp. 2020, 2020, 5215479. [Google Scholar] [CrossRef]
  33. He, S.; Liang, B.; Pan, G.; Wang, F.; Cui, L. Influence of dynamic highway tunnel lighting environment on driving safety based on eye movement parameters of the driver. Tunn. Undergr. Space Technol. 2017, 67, 52–60. [Google Scholar] [CrossRef]
  34. Kening, Z.; Bo, G. Research on driver mental load in exit of super long tunnel. Technol. Econ. Areas Commun. 2017, 19, 6–9. [Google Scholar]
  35. de Winter, J.C.; Happee, R.; Martens, M.H.; Stanton, N.A. Effects of adaptive cruise control and highly automated driving on workload and situation awareness: A review of the empirical evidence. Transp. Res. Part F Traffic Psychol. Behav. 2014, 27, 196–217. [Google Scholar] [CrossRef]
  36. JTGT-D70/2-01-2014; Guidelines for Design of lighting of Highway Tunnels. Ministry of Transport of the People’s Republic of China: Beijing, China, 2014.
  37. Qi, R.G.; Jia, Z.Y.; Lv, X.S. Operating Safety Technology of Freeway Special Section; China Communications Press, Co.: Beijing, China, 2015; pp. 13–14. [Google Scholar]
  38. Zhigang, D.; Zheng, Z.; Zheng, M.; Ran, B.; Zhao, X. Drivers’ visual comfort at highway tunnel portals: A quantitative analysis based on visual oscillation. Transp. Res. Part D Transp. Environ. 2014, 31, 37–47. [Google Scholar] [CrossRef]
  39. JTG-T D71-2017; Design Specification for Traffic Engineering of Highway Tunnel. Ministry of Transport of the People’s Republic of China: Beijing, China, 2017.
  40. Zhu, W.J.; Pan, X.D. Critical Driving Speed Research on Tunnel Group Connection Segments. J. Transp. Eng. Inf. 2014, 12, 74–78. [Google Scholar] [CrossRef]
  41. Du, Z.G.; Xu, W.W.; Xiang, Y.M. Research on Light Environment Improvement Framework of Highway Tunnel Based on Visual Guidance. China J. Highw. Transp. 2018, 31, 122–129. [Google Scholar] [CrossRef]
  42. Wu, X.L.; Gedeon, T.; Xue, C.Q.; Zhang, W.W.; Wang, L.L. A comparison of the concordant effect of gaze/saccades and pupil amplitude on information feature search. J. Comput.-Aided Des. Comput. Graph. 2019, 31, 1636–1644. [Google Scholar]
  43. Guo, Z.Y. Road Safety Engineering; China Communications Press Co.: Beijing, China, 2015; pp. 210–211. [Google Scholar]
  44. ISO 2631-1:1997; Mechanical Vibration and Shock. ISO: Geneva, Switzerland, 1997.
  45. Pan, X.D.; Song, Y.C.; Yang, Z.; Zhang, G.S. Visual Environment Improving Scope at Entrance and Exit of Highway Tunnel Based on Visual Load. J. TongJi Univ. (Nat. Sci.) 2009, 37, 777–780. [Google Scholar] [CrossRef]
  46. Zhi-gang, D.U.; Xiao-dong, P.A.; Zhen, Y.A.; Xue-bin, G.U. Research on Visual Turbulence and Driving Safety of Freeway Tunnel Entrance and Exit. China J. Highw. Transp. 2007, 20, 101–105. [Google Scholar] [CrossRef]
  47. Zhuang, L.M.; Chun, F.S.; Sheng, R.Z. Characteristics of traffic accidents in Chinese freeway tunnels. Tunn. Undergr. Space Technol. Inc. Trenchless Technol. Res. 2009, 24, 350–355. [Google Scholar] [CrossRef]
Figure 1. Bridge-tunnel group entrance.
Applsci 13 10186 g001
Figure 2. Bridge-tunnel connecting section.
Applsci 13 10186 g002
Figure 3. Bridge-tunnel group exit.
Applsci 13 10186 g003
Figure 4. Test driver.
Applsci 13 10186 g004
Figure 5. Test vehicles.
Applsci 13 10186 g005
Figure 6. Operation Interface of Tobii Glasses 2.
Applsci 13 10186 g006
Figure 7. Fixation point at the exit of the short tunnel.
Applsci 13 10186 g007
Figure 8. Fixation point at the exit of the extra-long tunnel.
Applsci 13 10186 g008
Figure 9. Drivers’ pupil diameter in section A.
Applsci 13 10186 g009
Figure 10. Drivers’ pupil diameter in section B.
Applsci 13 10186 g010
Figure 11. Drivers’ pupil diameter at tunnel entrances.
Applsci 13 10186 g011
Figure 12. Drivers’ pupil diameter at tunnel exit.
Applsci 13 10186 g012
Figure 13. Drivers’ pupil diameter at adjacent tunnel entrance.
Applsci 13 10186 g013
Figure 14. Drivers’ pupil diameter at adjacent tunnel exit.
Applsci 13 10186 g014
Figure 15. Drivers’ pupil diameter at natural light environment on tunnel entrance.
Applsci 13 10186 g015
Figure 16. Drivers’ pupil diameter at natural light environment on tunnel exit.
Applsci 13 10186 g016
Figure 17. Tunnel section division.
Applsci 13 10186 g017
Table 2. Tunnel information.
DirectionsSection ALength (m)Distance (m)Longitudinal Slope
(%)
Curve Radii(m)Section BLength (m)Distance (m)Longitudinal Slope
(%)
Curve Radii(m)
LeftA125671092.4800~∞B13915922.80710~∞
right25501353796202
LeftA237692802.4~2.94710~∞B2898350.74~2.802124~∞
right374026582044
LeftA34847682.59~2.80800~∞B33372060.742500~∞
right48588233679
LeftA447305902.30~2.59834~∞B45662060.682500~∞
right4712.6587562194
LeftA51300772.30~2.93B51708511.80~2.701400~∞
right127599166174
LeftA61953662.20~2.801130~∞B612661691.80~2.82980~∞
right18861101277199
LeftA73123992.30~2.801130~1250B7621-0.50~2.80710~∞
right3126125614-
LeftA81508452.22~2.801400~∞
right148162
LeftA93685-2.22~2.751500~∞
right3676-
Table 3. The Driver Visual Load Evaluation in Tunnel Entrance and Exit [28,45].
M T P A /(mm2/s) t c / s The Driver Visual Load Evaluation Results
EntranceExitEvaluation GradeDescription
<20<30<0.1Acomfort
[20, 30)[30, 40)[0.1, 0.2)BSlight discomfort
[30, 70)[40, 85)[0.2, 1)Cdiscomfort
[70, 105)[85, 105)[1, 1.5)DVery uncomfortable
≥105≥105≥1.5Eterrible
Table 4. The driver visual load evaluation results.
Number M T P A /(mm2/s)/Evaluation Grade of Visual Load
Entrance Access ZoneEntrance SectionEntrance Change-Over PortionBasic SegmentExit Change-Over PortionExit SectionExit Access Zone
A14.11/A11.1/A17.78/A45.34/C11.83/A5.8/A3.81/A
A25.2/A6.51/A25.89/B24.36/B7.39/A2.93/A6.02/A
A33.31/A5.38/A11.27/A14.29/A7/A5.26/A3.13/A
A4-23.83/B16.04/A24.59/B11.06/A21.07/A4.49/A
A5-8.08/A8.66/A47.44/C42/C20.83/A6.44/A
A657.77/C6.01/A37.88/C13.02/A8.57/A4.9/A8.48/A
A76.19/A7.84/A8.07/A34.51/C51.81/C10.97/A15.1/A
A88.48/A21.42/B51.35/C40.51/C36.23/B31.7/B3.94/A
A9-42.4/C67.62/C50.44/C20.28/B3.69/A4.68/A
B135.1/C16.75/A19.91/A48.28/C23.17/A30.83/B10.95/A
B27.56/A7.88/A4.59/A47.85/C9.11/A23/A14.33/A
B33.97/A9.74/A11.31/A21.8/B5.39/A4.78/A10.07/A
B4-4.56/A4.05/A10.64/A9.6/A3.28/A3.55/A
B52.8/A14.59/A3.09/A5.79/A16.13/A3.33/A5.61/A
B67.96/A3.86/A5.3/A12.76/A9.08/A2.55/A32.66/B
B76.66/A5.23/A3.91/A16.89/A8.9/A30.96/B8.22/A
Disclaimer/Publisher’s Note: The statements, opinions and data contained in all publications are solely those of the individual author(s) and contributor(s) and not of MDPI and/or the editor(s). MDPI and/or the editor(s) disclaim responsibility for any injury to people or property resulting from any ideas, methods, instructions or products referred to in the content.

