Article

Integrating SAR and Geographic Information Data Revealing Land Subsidence and Geological Risks of Shanghai City

1
Key Laboratory of Mine Environmental Monitoring and Improving around Poyang Lake of Ministry of Natural Resources, East China University of Technology, Nanchang 330013, China
2
School of Surveying and Geoinformation Engineering, East China University of Technology, Nanchang 330013, China
*
Author to whom correspondence should be addressed.
Appl. Sci. 2023, 13(21), 12091; https://doi.org/10.3390/app132112091
Submission received: 17 October 2023 / Revised: 28 October 2023 / Accepted: 2 November 2023 / Published: 6 November 2023
(This article belongs to the Special Issue Advances in Geosciences: Techniques, Applications, and Challenges)

Abstract

:
As one of the most developed coastal cities, Shanghai experiences long-term ground surface settlement disasters during urban expansion periods, which has adverse effects on economic development. To date, many studies regarding Shanghai’s ground surface sedimentation have been conducted with microwave remote sensing technology. However, the systematic and timely analysis of the time series deformation results and risk evaluation is still absent. Therefore, we focused on the following aspects in this study: Firstly, revealing in detail the time series deformation characteristics during 2016–2022 with Sentinel-1A images and verifying the deformation results with different InSAR technologies and SAR data. Secondly, fully discussing the reasons for ground sedimentation from the aspects of subway construction, land use type, monthly rainfall, and human activities, and studying the correlation between surface deformation and rainfall with the singular spectrum analysis (SSA) method. Finally, conducting a risk evaluation and risk level division using the entropy method, combining the long time series deformation results and geoinformation data. Meanwhile, the following conclusions were reached: 1. There are six typical deformation areas, distributed in the Baoshan District, Minhang District, and Jinshan District of Pudong New District from 2016 to 2022. The maximum annual rate is −32.3 mm/a, and the maximum cumulative sedimentation reaches −188.6 mm. 2. Ground sedimentation is mainly due to engineering construction during city development and verifies the weak correlation between surface deformation and rainfall. 3. We obtained different levels of geological hazard risk areas, and Huangpu, Yangpu, Hongkou District, the northwest area of Pudong New Area, and the vicinity of Dishui Lake belong to higher-risk areas. The above time series deformation research results and systematic analysis of induced factors, and the higher-risk-area division, will provide valuable insights for urban risk management.

1. Introduction

Urban land subsidence is progressive or occurs due to a sudden decrease in the ground surface elevation due to the combined effects of natural factors and the impact of human activities [1,2]. Natural factors include tectonic movement [3], earthquakes [4], volcanic activity [5,6], and the natural consolidation of soil [7]. Human activity impacts mainly include the development of underground fluid resource extraction (groundwater, oil, natural gas, etc.) [8,9], solid mineral exploitation [10], and pore soil compaction and consolidation settlement induced by engineering construction in soft soil areas [11]. Recently, many cities around the world have been affected by land subsidence disasters [12,13,14,15,16,17,18,19,20]. For example, the annual land subsidence in Mexico City is about 10 to 40 cm, causing buildings to tilt and crack [9], and the ground subsidence in Tokyo has adverse effects on the construction of underground engineering projects [16]. New Orleans and San Francisco in the United States, as well as areas such as Houston and Phoenix, have also experienced severe ground subsidence due to groundwater overexploitation [18]. In particular, the coastal plains and river deltaic regions experience a high rate of subsidence, and the destruction of waterproofing systems and sea level rises bring damage to basic living facilities such as buildings and subways [15,20]. Thus, high-precision and long time series dynamic deformation monitoring is particularly important for areas with serious subsidence, and the governmental management departments should make timely decisions according to the disaster-related early warning information.
At present, deformation monitoring methods include the global navigation satellite system (GNSS), leveling, three-dimensional (3D) laser scanning, and interferometry synthetic aperture radar (InSAR) technology [21,22]. Compared with traditional measurement methods, InSAR has been a powerful monitoring method for research in many fields due to its advantages of being able to be used all day, having large-scale coverage, and having high precision [11,23]. Among the multiple data processing methods, the small baseline subset (SBAS)-InSAR is widely used due to the increase in redundant observations of interference and the atmospheric effect reduction through spatiotemporal filtering [24]. By forming a combination of multiple small baselines with short baselines for time and space, SBAS-InSAR technology can improve the quality of interferograms to a certain extent, weaken the influence of speckle noise, and increase the utilization rate of effective data. Therefore, the SBAS-InSAR technology has been and will be considered to be the most promising deformation monitoring technology [25].
The land subsidence in Shanghai city has attracted the attention of many researchers, due to the continuous and serious deformation from a hundred years ago [26,27,28,29,30,31,32,33,34,35,36,37,38,39,40,41,42]. According to the annual subsidence rate of Shanghai, it experienced the following stages: developing (1921~1948); obviously developing (1949~1956); violently developing (1957~1961); slowing down (1962~1965); rebounding (1966~1971); and slowly developing (1990~2023). Researchers first discovered the land subsidence using the leveling measurement method in 1921 [26], and the subsidence became the most serious in the 1960s due to the excessive exploitation of groundwater resources. To effectively control the land subsidence disaster, Shanghai established a groundwater-level dynamic monitoring network and adopted measures such as reducing groundwater exploitation and the artificial recharge of groundwater. Generally, the subsidence intensity was alleviated from 1966 to 2000, with a cumulative average land subsidence of 218.1 mm and an average annual land subsidence of more than 6 mm. Although Shanghai city entered the stage of microsettlement after 2000 due to the municipal government intervention [41], some local areas are still sinking as a result of large-scale engineering construction. At present, many researchers have studied the time series deformation with leveling and InSAR technology [31,32,33,34,35,36,37,38,39,40,41,42,43]. The content is roughly divided into the following aspects: Firstly, studying the railway deformation; the subsidence of Subway Line 5, Line 8, and Line 16 is relatively large, and it is positively correlated with groundwater extraction. Secondly, research on individual important areas, such as the central urban areas and the airport, revealed that the annual average settlement of Yangpu District and Hongkou District reached 16 mm/a from 2004 to 2010, Fengxian District and Minhang District reached up to 28 mm/a from 2015 to 2017, and Pudong New Area also had many settlement points. Thus, the uneven settlement in the main urban area was still obvious from 2000 to 2010 due to the large-scale infrastructure; meanwhile, the uneven settlement transited from city to suburb in its spatial distribution during 2010~2020.
In addition, land subsidence is the result of a variety of factors. Previous studies have shown that land subsidence in Shanghai is affected by factors such as groundwater extraction and building loads [44]. However, qualitative correlation analyses are not sufficient to accurately quantify the causes of land subsidence and their interrelationships. Therefore, a risk assessment model is needed to accurately predict potential hazards caused by land subsidence [45]. Risks involved are the loss of life and property caused by unavoidable factors such as natural disasters in a certain area over a period, and they also adopted the concept of “degree of risk (R) = hazard (H) × vulnerability (V)” [46]. The risk assessment literature mainly focuses on sudden geological disasters (such as landslides, debris flows, etc.) and risk assessment, so few studies pay attention to the risk assessment of geological disasters with slow urban deformation [47,48]. In this study, we will combine InSAR technology and entropy to assess urban risk levels.
Therefore, this study evaluated the surface deformation results of Shanghai through SBAS-InSAR technology with 94 scenes from C-band Sentinel-1A images (May 2016 to December 2022), verified the internal accuracy with 9 scenes of X-band descending TerraSAR-X images (2020~2021), and compared this with the results from StaMPS-PS technology. The singularity spectrum analysis (SSA) model was used to analyze the relationship between land subsidence in Shanghai and seasonal rainfall. Finally, according to the actual settlement of Shanghai, ten influencing factors were determined, including land use type, water density, land subsidence rate, and accumulation, as well as population density, GDP per unit area, road density, building density, ground elevation and green space density. The entropy method was used to evaluate the land subsidence risk in Shanghai, which provided a valuable reference for urban management to reduce the potential ground deformation hazard in Shanghai. The specific areas included Huangpu (HP), Changning (CN), Xuhui (XH), Hongkou (HK), Yangpu (YP), Jingan (JA), Putuo (PT), Minhang (MH), Baoshan (BS), Jiading (JD), Pudong (PD), Qingpu (QP), Songjiang (SJ), Jinshan (JS), and Fengxian (FX).

2. Methods

In this study, the SBAS-InSAR method was used to solve the time series deformation [49], SSA was used to analyze the relation between deformation and rainfall, and the entropy method was used to divide the risk degree.

2.1. SBAS-InSAR

Assuming j th interferogram, the two images are formed at t B   and t A moments in the azimuth with range coordinates of ( x , i ).
δ φ j ( x , i ) = φ ( t B , x , i ) φ ( t A , x , i ) 4 π λ [ d ( t B , x , i ) d ( t A , x , i ) ]
where λ is the wavelength; d t B , x , i   and   t A , x , i are the cumulative deformation of the line of sight at time t B and t A relative to the initial time t 0 , respectively; δ φ j x , i marks the differential interference phase of the jth interferogram in ( x , i ) coordinates; and φ t B , x , i and φ t A , x , i are the phase values at time t B and t A .
According to the principle of the spatiotemporal baseline, N scene data can obtain N N + 1 / 2 interference pairs in order to avoid the incoherence of interference image pairs caused by loose spatiotemporal baseline limitation, the reduction in redundant observations, and the amplification of random errors caused by a small spatiotemporal baseline limitation.
Thus, SBAS-InSAR technology can form multiple small baseline combinations of short time baselines and short spatial baselines, and the image data of the short time and space baselines are used for interference processing, which can improve the quality of the interferogram to a certain extent, reduce the influence of speckle noise, and increase the utilization rate of effective data. In SBAS technology, not only the main image and other images are registered, but also areas between other images. The independent image data caused by the long baseline are connected to form a short baseline image collection, and the image collection is processed via differential interference to obtain the coherent coefficient map, the filtered interference map, and the phase de-entanglement map. The singular value decomposition method is used to jointly solve and remove the residual terrain phase between the image collections, obtain the land surface deformation information, and improve the accuracy of land surface deformation monitoring [24].

2.2. SSA

SSA is a method for processing nonlinear time series data by decomposing and reconstructing the trajectory matrix of the time series to be studied; different component sequences (long-term trend, periodic trend, noise, etc.) in the time series deformation are extracted to analyze or remove noise [50,51]. For a centralized finite-length one-dimensional time series x i = x 1 , x 2 , x 3 , x N , the original time series is lagged to obtain a time delay matrix:
X = x 1 x 2 x N L + 1 x 2 x 3 x N L + 2 x L x L + 1 x N
where N is the length of the time sequence; the appropriate window length L is selected, which is generally not more than N /2. We obtained the lag covariance matrix D after the time empirical orthogonal function expansion of the time delay matrix X .
D = D 0 D 1 D L 1 D 1 D 0 D L 2 D L 1 D L 2 D 0
The key to the singular spectrum analysis is to solve the eigenvectors M K and eigenvalues of matrix D : λ 1 λ 2 λ L . These eigenvalues are called the singular spectrum of the time series x i . As the most important step of SSA, singular spectrum analysis demonstrates the operation of reconstructing x i , and the formula is shown as Formula (4).
x k i = 1 i j i a i j , M k , j 1 L j = 1 L a i j , M k , j 1 N i + 1 j = i N + L i a i j , M k , j

2.3. Entropy Method

The basic idea of the entropy weight method is to determine the objective weight according to the size of the index variability [52]. Generally, if the information entropy of a certain index is smaller, indicating that the degree of variation in the index is greater, more information is provided, meaning that the greater the role it can play in the comprehensive evaluation, the greater the weight. On the contrary, the greater the information entropy of an index, meaning a smaller degree of variation in the index value, the smaller the amount of information provided is, and the smaller the role played in the comprehensive evaluation and the smaller the weight is [53]. The detailed processing is as follows:
The first is to determine the risk evaluation factors, and select appropriate evaluation indicators according to the actual situation of the experimental research area. The algorithm of the mathematical model of the entropy method is as per Formula (5).
Standardized data matrix:
A i j = B i j min { B i j , , B n j } max { B i j , , B n j } min { B i j , , B n j }
where A i j is the standardized value representing the j th indicator data for the ith district and county, i = 1 , 2 , , n ; j = 1 , 2 , , m ,     and   B i j is the i th unit and the j th metric data raw value.
According to the entropy method, we can determine the weight of the factor and then compute the j th index of information entropy values E j and F j   and evaluation weight W j .
E j = 1 ln m i = 1 m A i j ln A i j F j = 1 E j W j = F j i = 1 m F i
As the evaluation factor grading standards were fuzzy, in order to reasonably describe the grading boundaries, the membership degree was adopted by establishing the fuzzy relation matrix R. Combined with the risk assessment index weight matrix W , the fuzzy comprehensive evaluation matrix C was obtained.
R = A 11 A 12 A 1 m A 21 A 22 A 2 m A n 1 A n 2 A n m
C = W × R
The risk degree is calculated using the formula, that is, “degree of risk (R) = hazard (H) × vulnerability (V)”.

3. Study Areas and Data Process

3.1. Overview of Study Areas

Shanghai is located on the leading edge of the Yangtze River Delta, to the east of the East China Sea, south of Hangzhou Bay, west of Jiangsu and Zhejiang provinces, and north of the Yangtze River estuary. The land area spans approximately 100 km from east to west and 120 km from north to south [54], and it is mainly a coastal plain formed by the gradual accumulation of estuarine dynamic sedimentation 6500 years ago. The terrain in the area is low and flat, and the average ground elevation is approximately 4 m. Meanwhile, the continuous slow tectonic subsidence has caused the Shanghai area to accumulate loose sediments with an average thickness of 200~320 m and a maximum thickness of approximately 500 m since the late Cenozoic. Furthermore, the thickness of the accumulation varies greatly, showing a trend of gradually thickening from southwest to northeast. Thus, the geological environmental system is relatively fragile due to the short land formation time, low and flat terrain, deep loose layer, shallow soft soil layer, and widely developed water-bearing sand layer [55]. Shanghai has a subtropical monsoon climate with abundant rainfall; typical plum rain weather occurs during June and July every year, and this precipitation accounts for approximately 60% of the entire year’s rainfall. There are occasional typhoons in summer, and there are often cold currents in winter. Figure 1 shows the experimental study area.

3.2. Data Introduction

In this study, 103 scenes of InSAR data were used, including 9 scenes of X-band descending orbit TerraSAR images (2020~2021) and 94 scenes of C-band Sentinel-1A images (2016~2022). The detailed parameters are shown in Table 1. During the InSAR data process, DEM and precise orbit information can improve the accuracy of the time series deformation results. Thus, the terrain phase was removed by using SRTM DEM with a resolution of 30 m provided by NASA (https://dwtkns.com/srtm30m/, accessed on 30 June 2023), and the precise orbit data released by ESA were used to refine the baseline of the data image and reduce the orbit error (https://scihub.copernicus.eu/dhus/#/home, accessed on 30 June 2023).
The land use type and water system are also useful for risk assessment. The detailed parameters of other data are described in Table 2.

3.3. Data Process

3.3.1. Land Subsidence Experiment

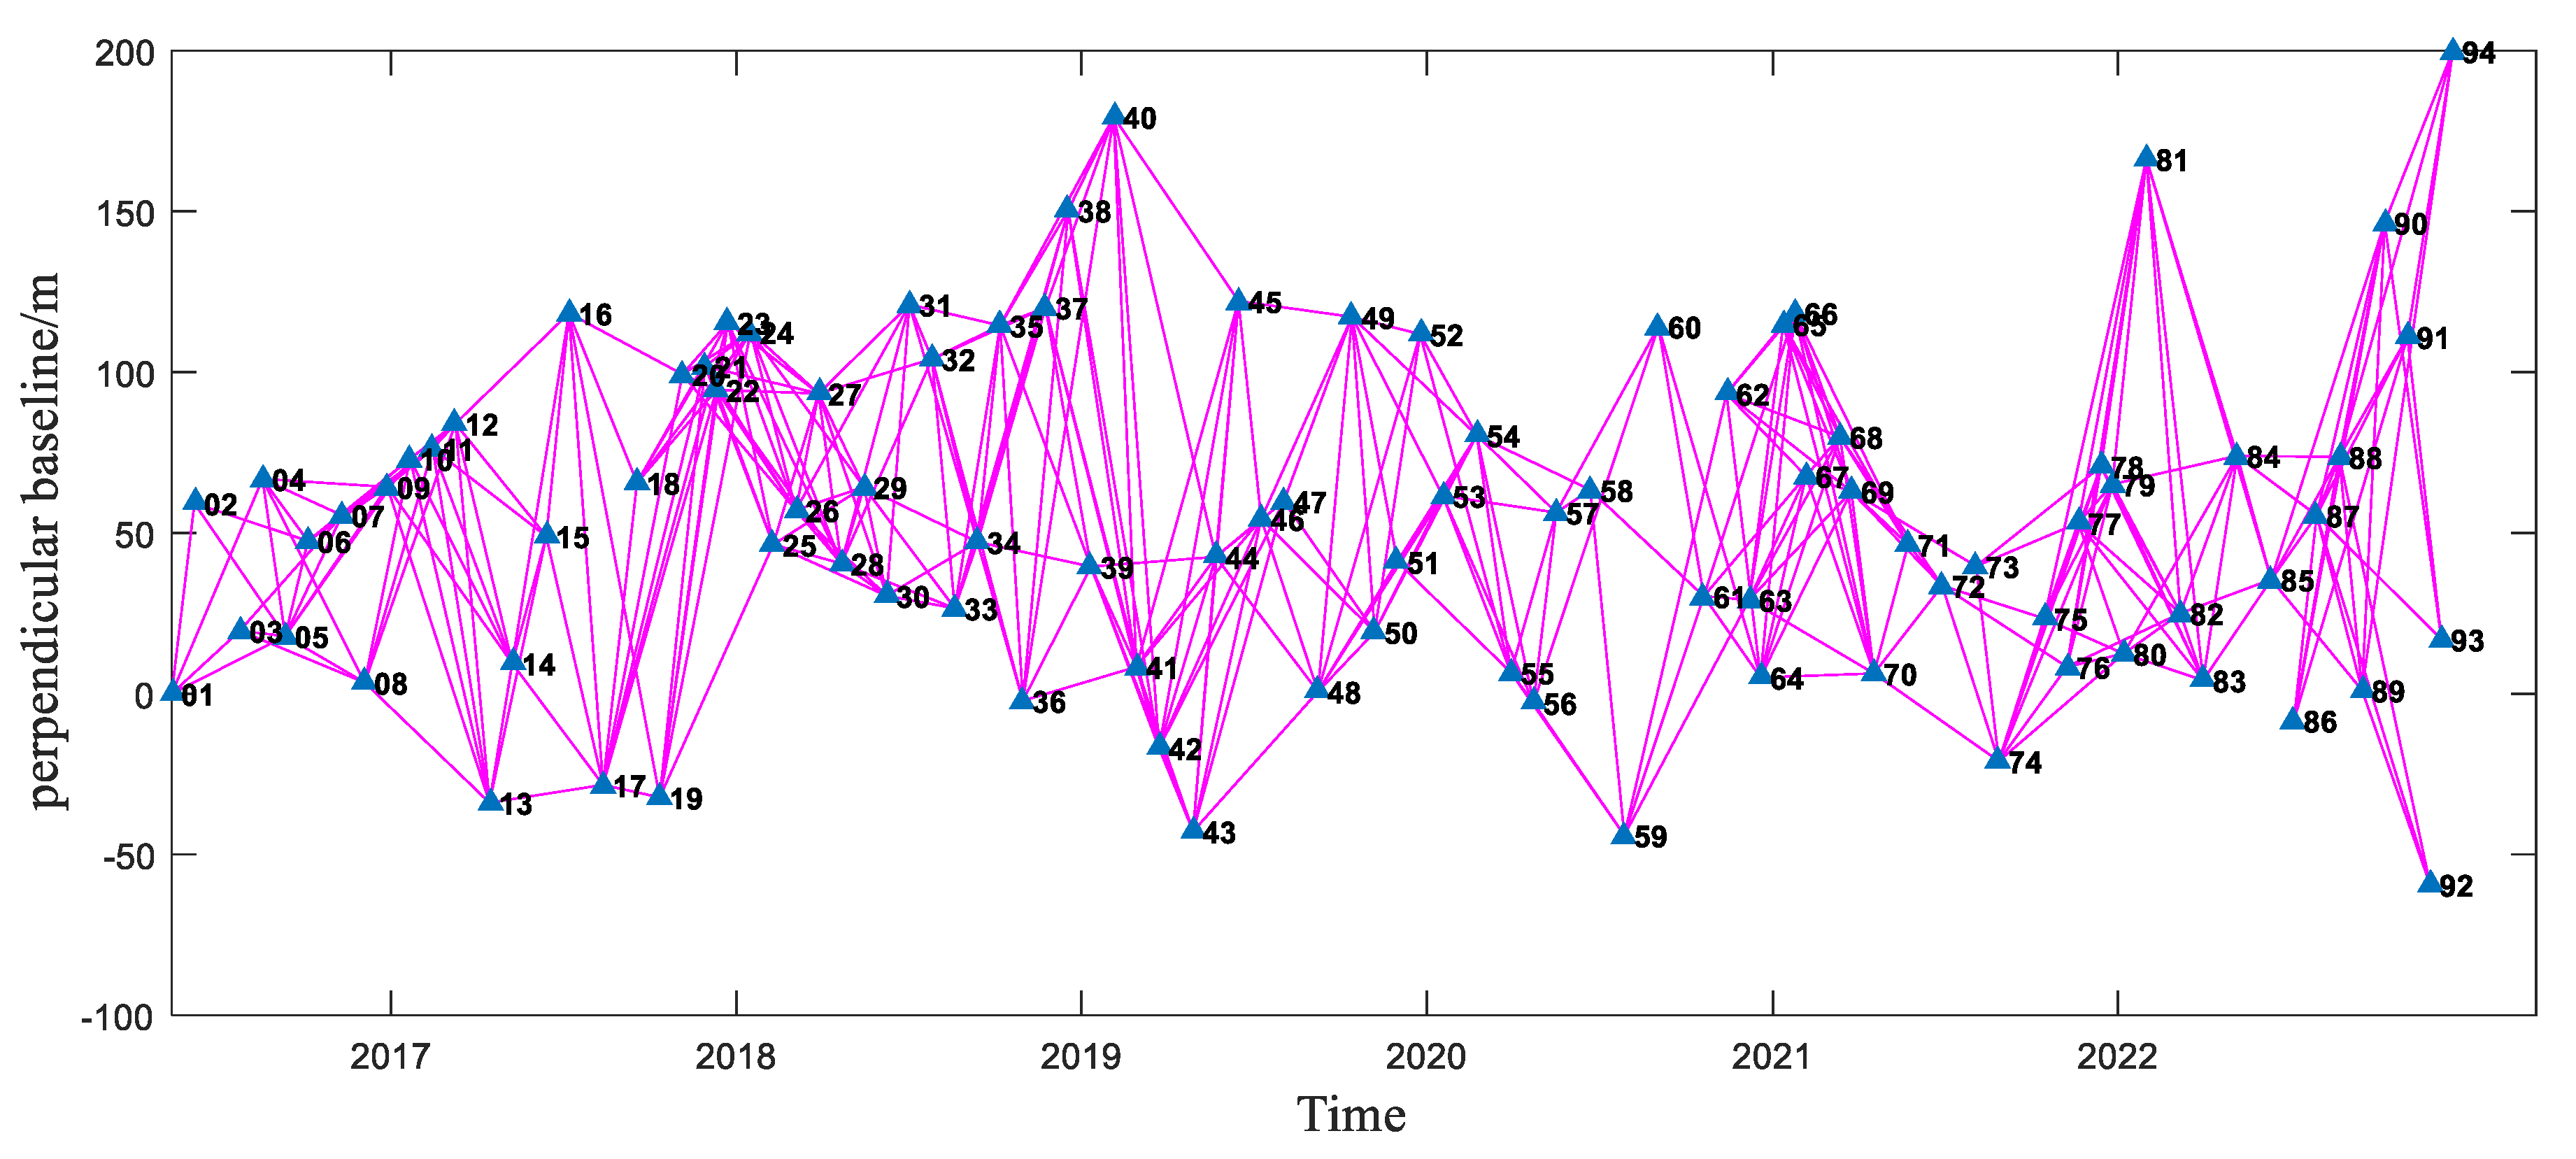
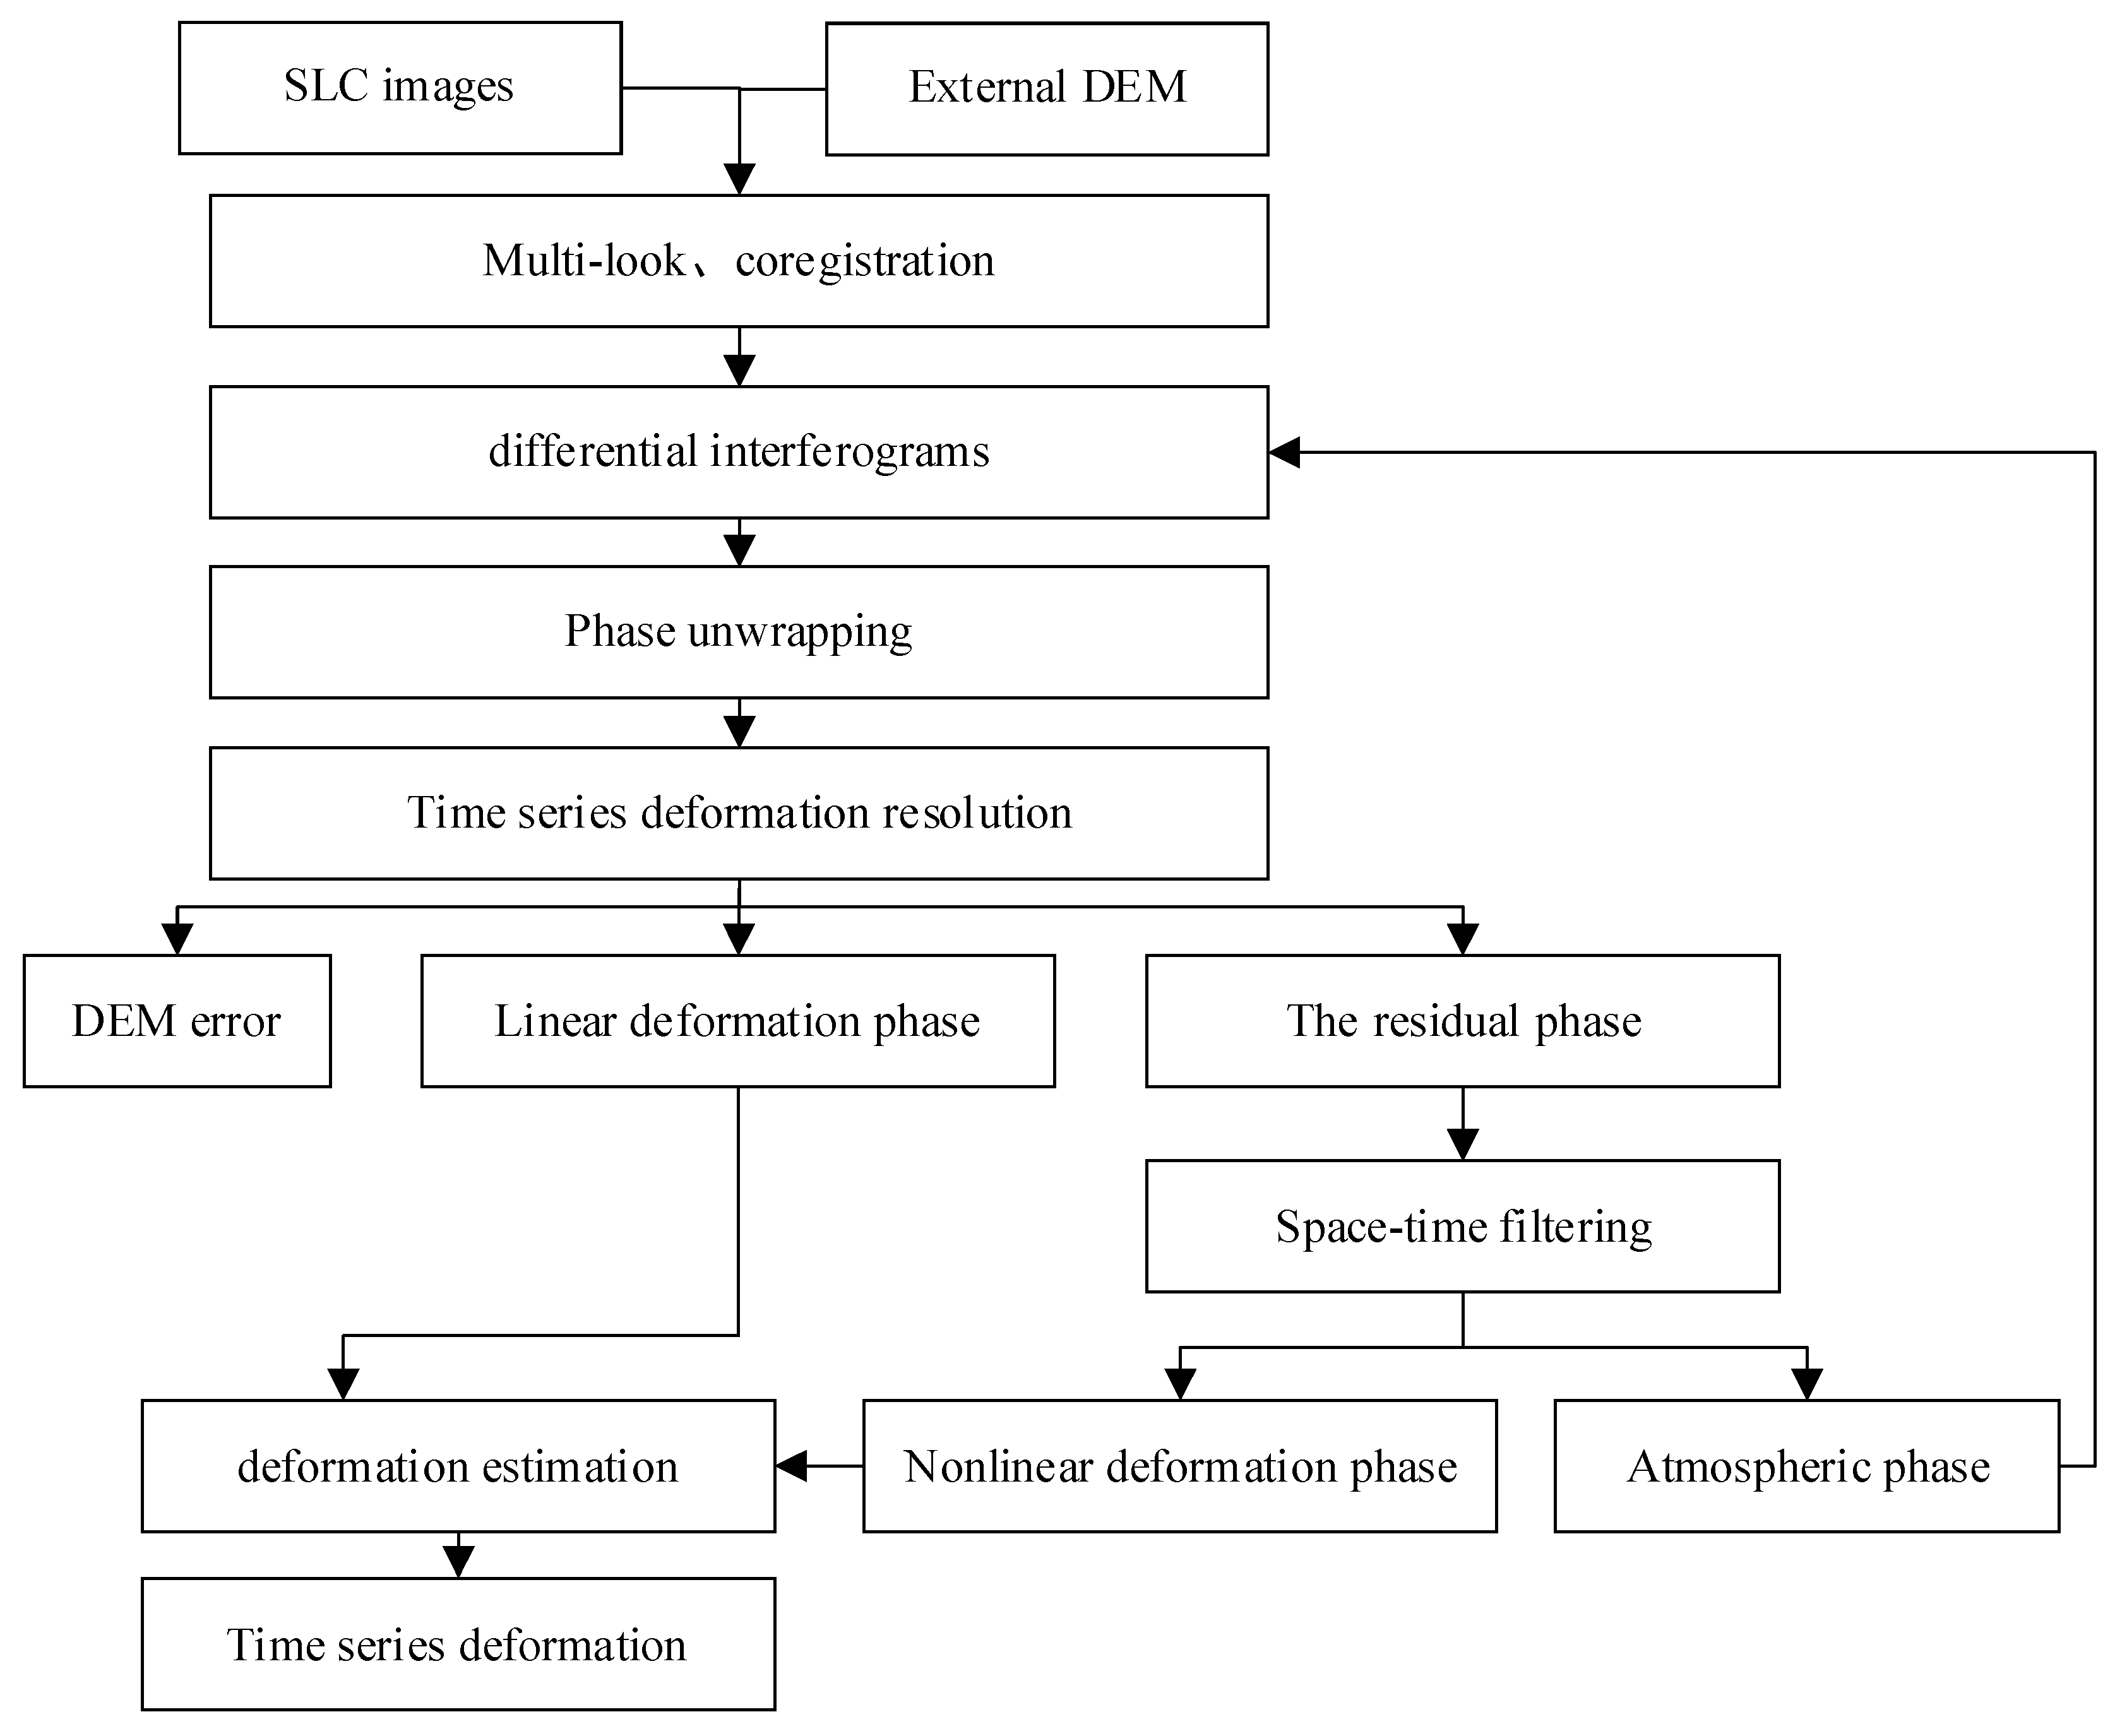
To minimize the process error, such as the Doppler error and vertical baseline error, we set a time baseline threshold of 140 days, a spatial baseline threshold of 200 m, and an average coherence threshold of 0.3. Then, we select 295 pairs of interferograms based on 94 Sentinel-1A images. The spatiotemporal baseline connection diagram of the interference image pair is shown in Figure 2. We establish a linear model under the assumption that the time series deformation of urban areas obeys the linear distribution, and the detailed flowchart is shown in Figure 3.
Finally, the result is a line-of-sight (LOS) deformation velocity chart. Since the deformation occurs mainly in the vertical direction, all results are converted from the LOS direction to the vertical deformation.

3.3.2. Risk Assessment Experiment

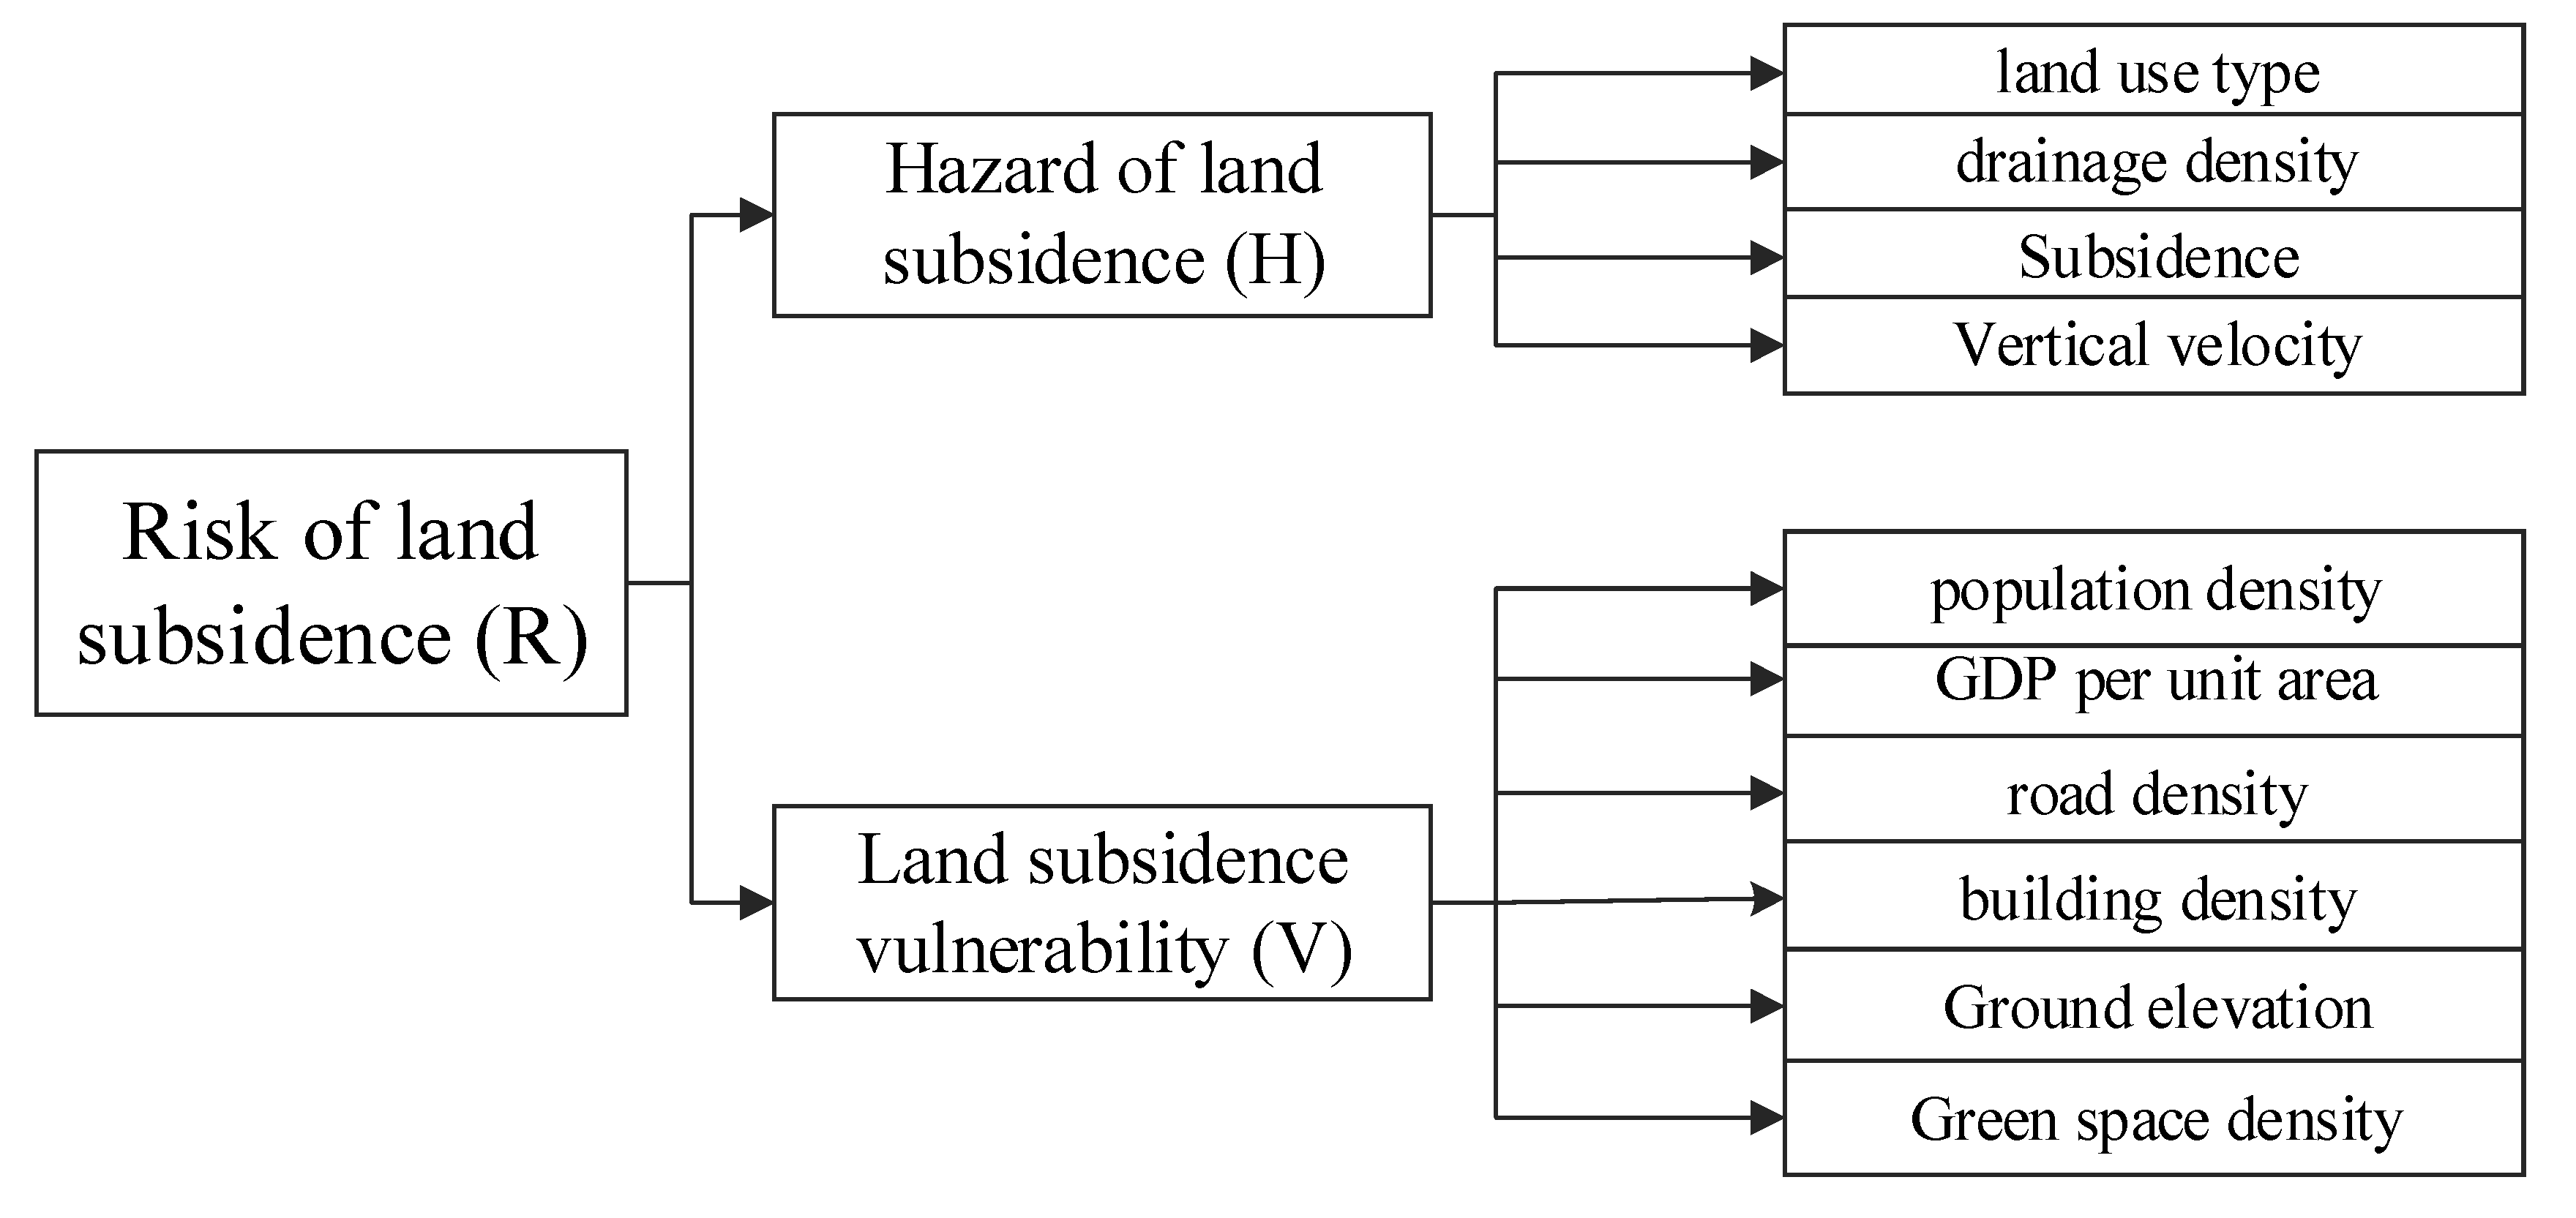
Considering the availability of data, the feasibility of practical operation, the scientific of index selection, and the specific situation of Shanghai, we select ten influencing factors, including land use type, water density, land subsidence rate, and accumulation, as well as population density, GDP per unit area, road density, building density, ground elevation, and green space density. The ten factors can be divided into four hazard evaluation factors and six vulnerability evaluation factors (Figure 4).
In the quantitative analysis, the land subsidence risk evaluation scale ranges from [0,1] and can be divided into five levels, which are Lower, Low, Medium, High, and Higher [46] (as shown in Table 3).
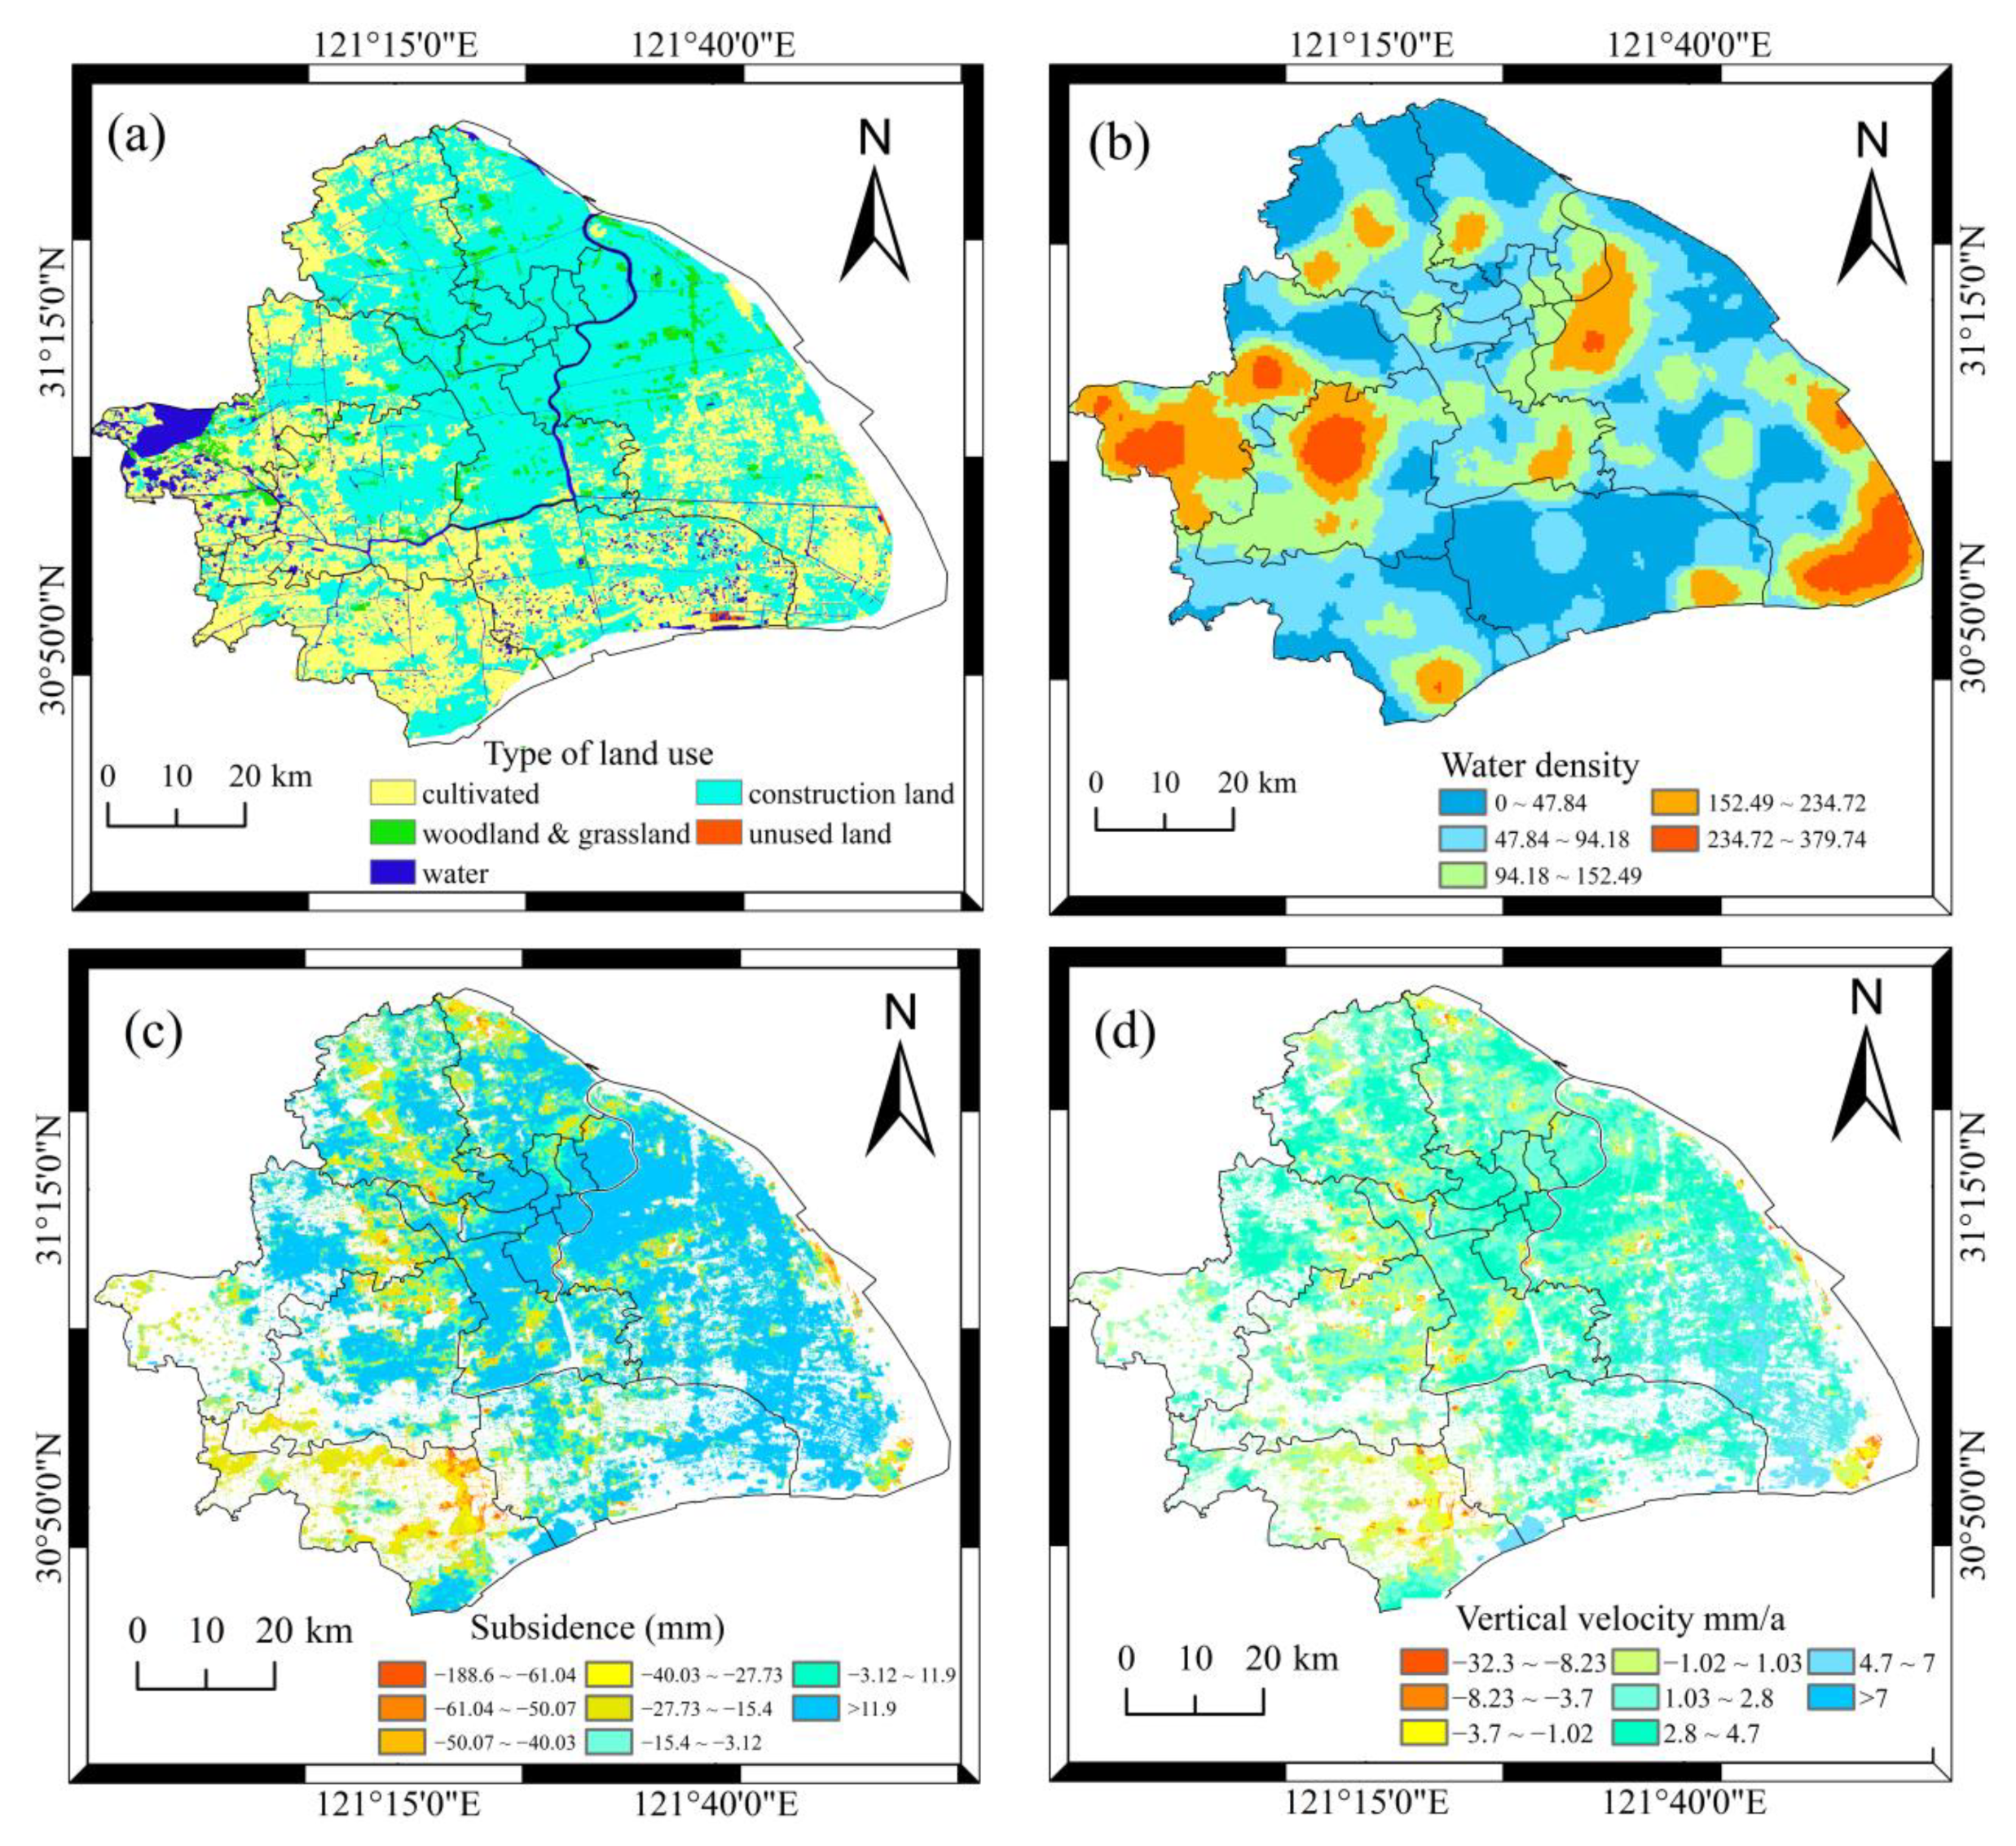
The hazard of land subsidence H includes four aspects (Figure 5). Land use types are closely related to human activities. Human demand for construction land increases during the urbanization acceleration process. Therefore, in the excavation and filling of surface soil during the construction of infrastructure, large buildings cause the load on the underground soft soil layer to exceed the bearing pressure, which can easily lead to soil compaction and surface subsidence. The extraction or perfusion of groundwater, the dense distribution of rivers, and the width and depth of rivers will change the formation stress, so that the surface height will rise and fall. The rate of land subsidence reflects the development degree of land subsidence under various external influencing factors, which is a description of the current situation of the area where land subsidence has occurred. The time series land subsidence results obtained in this study are used as an important factor index of the land subsidence risk in Shanghai [56].
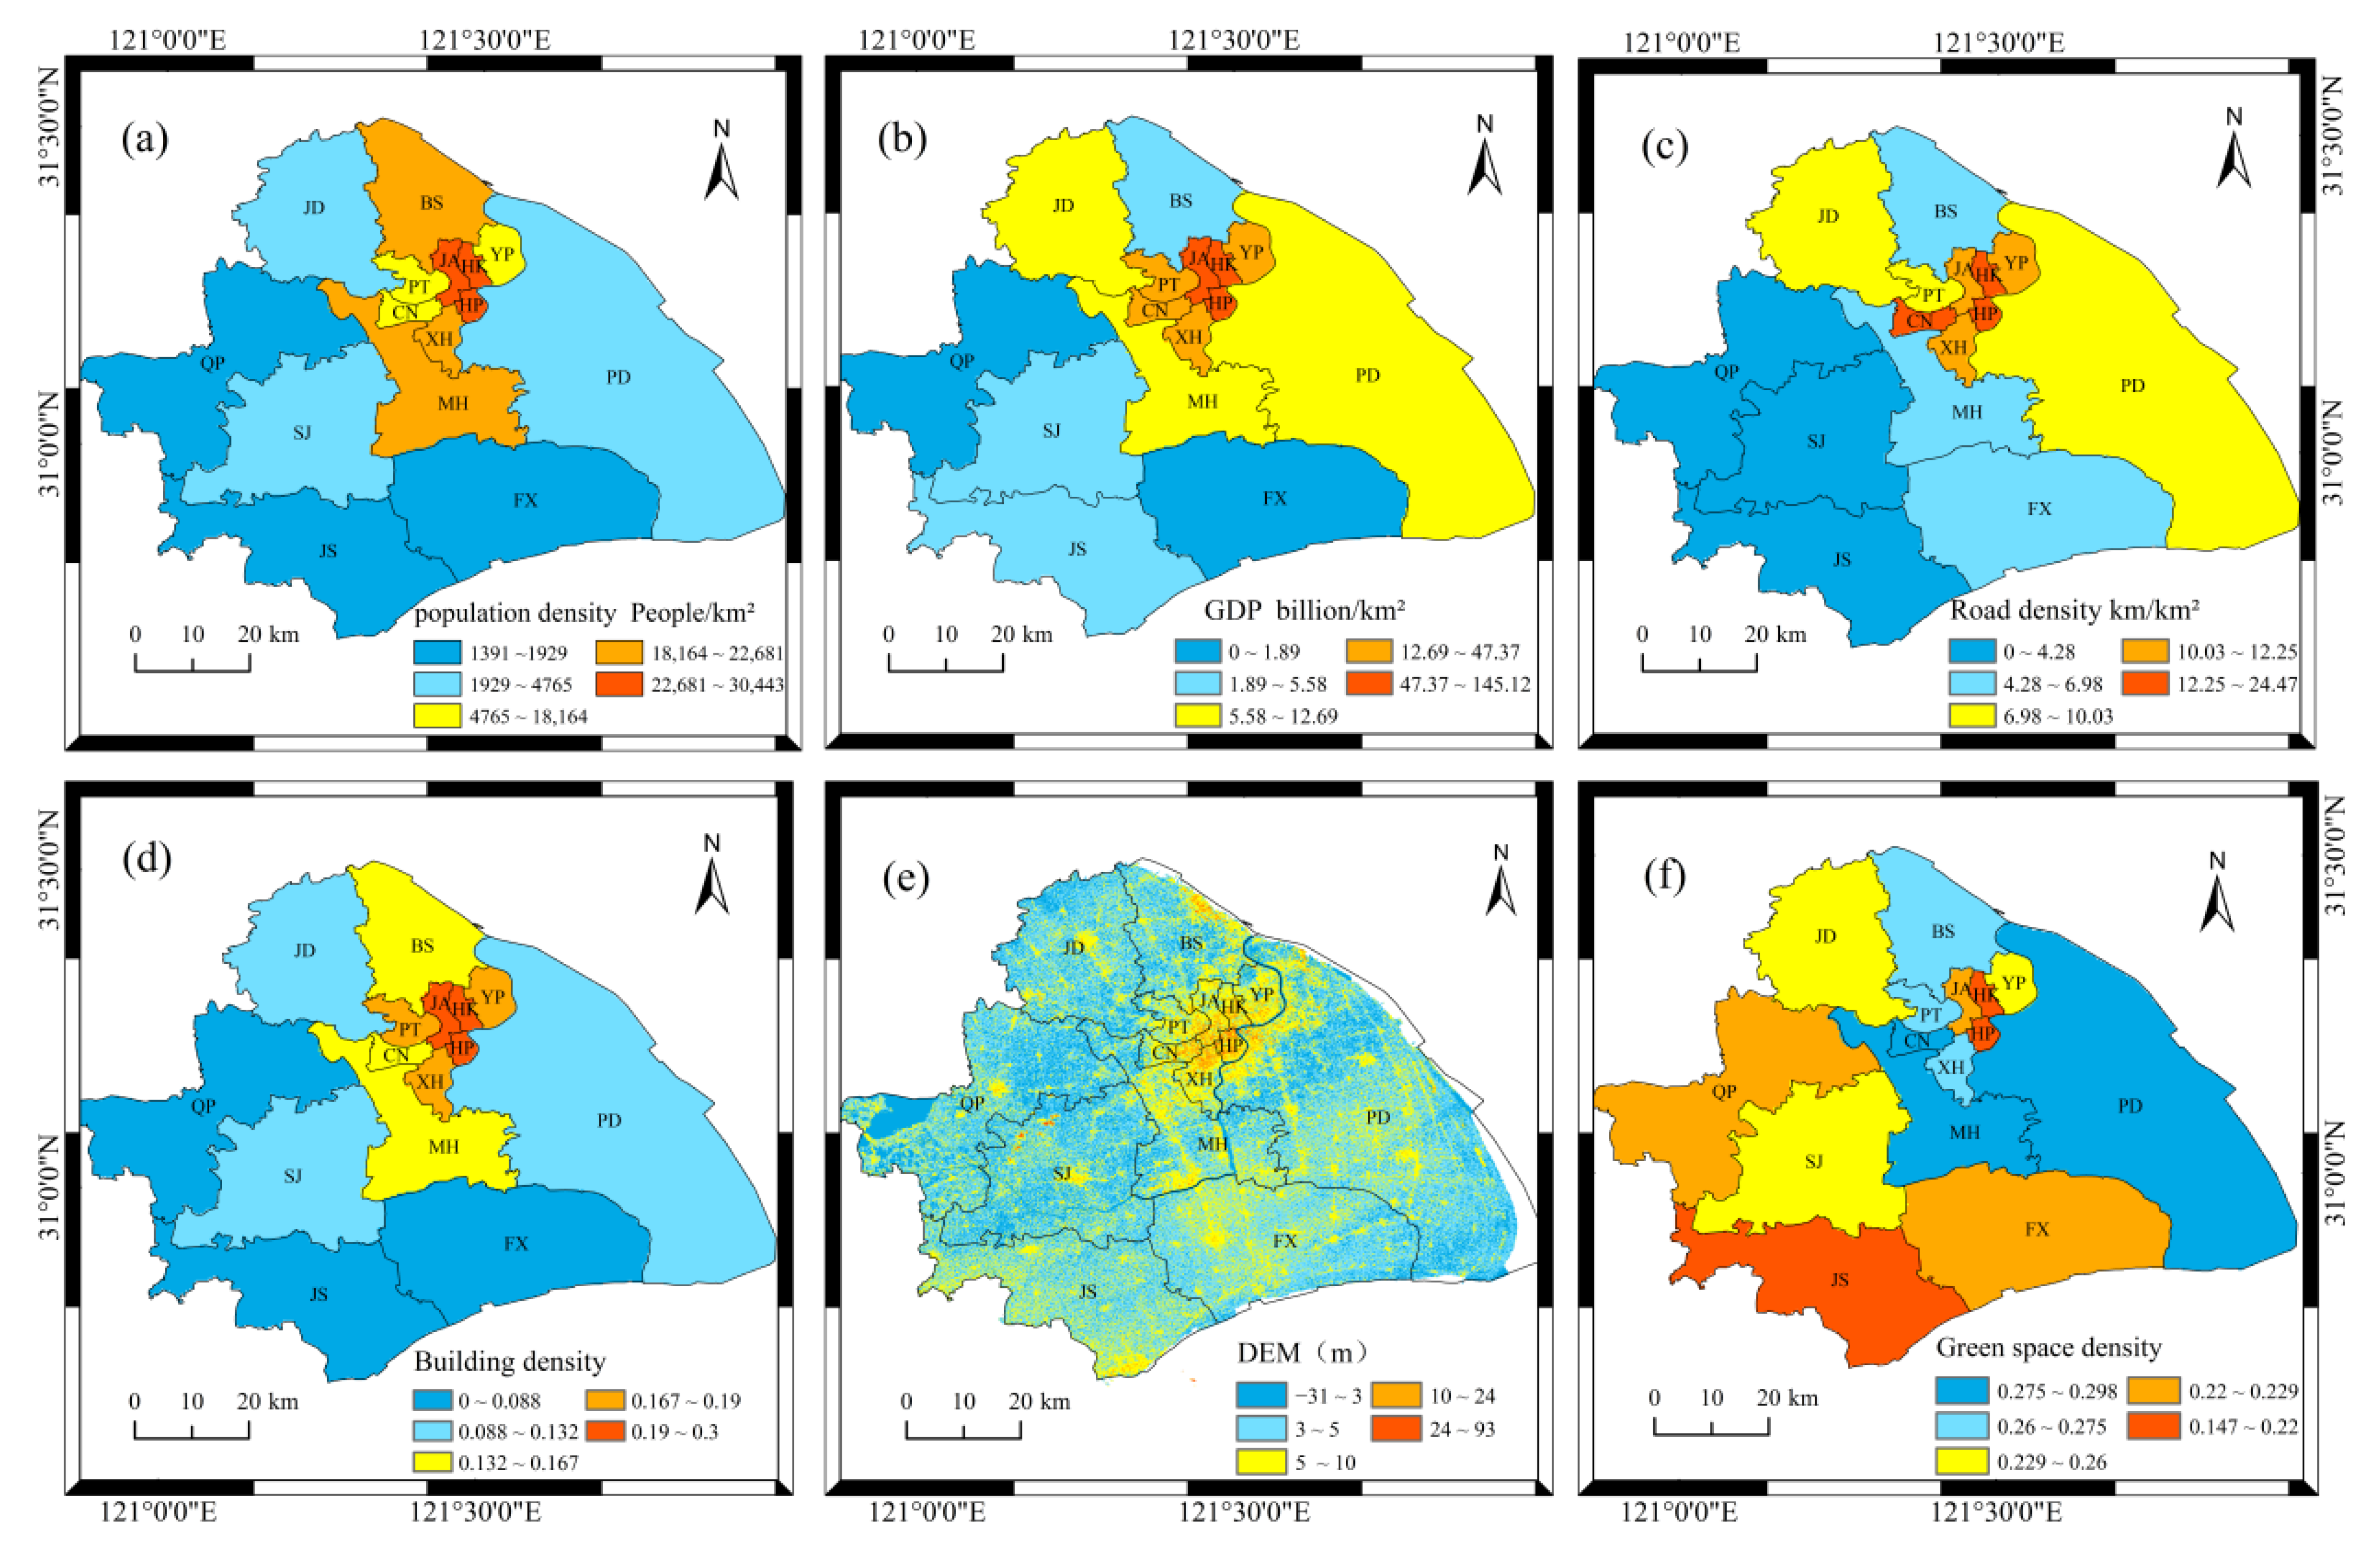
The land subsidence vulnerability V includes six aspects. Cities are the concentration centers of the population, the economy, politics, transportation, architecture, and other factors, and the vulnerability to disasters is much higher than in nonurban areas. The six indices of population density, GDP per unit area, road density, green space density, building density, and ground elevation, were selected to comprehensively evaluate the vulnerability to land subsidence in Shanghai. The distribution of vulnerability evaluation factors is shown in Figure 6. The population density reflects the degree of urbanization, and the GDP per unit of area reflects the national economic situation of the region, both of which are usually proportional to the vulnerability to land subsidence. Generally, the greater the road density, the higher the vulnerability to land subsidence. Buildings are mainly industrial, commercial, and residential high-rise buildings, and a higher building density means a greater risk of disaster vulnerability. Land subsidence causes ground elevation loss, and ground elevation is the foundation of regional political and economic activities, which seriously affect people’s lives, property safety, and production activities.
Finally, we use ArcGIS to rasterize all the collected vector data in the evaluation model and then normalize the statistical probability distribution of the samples between [0,1] (as is shown in Table 4).
The entropy weight method is used to calculate the weight of the data, and finally, the factors combined with the weight value grading are superimposed onto the raster data, and the risk evaluation results for Shanghai city are obtained.

4. Validation and Discussion of Land Subsidence Results

4.1. Land Subsidence Results

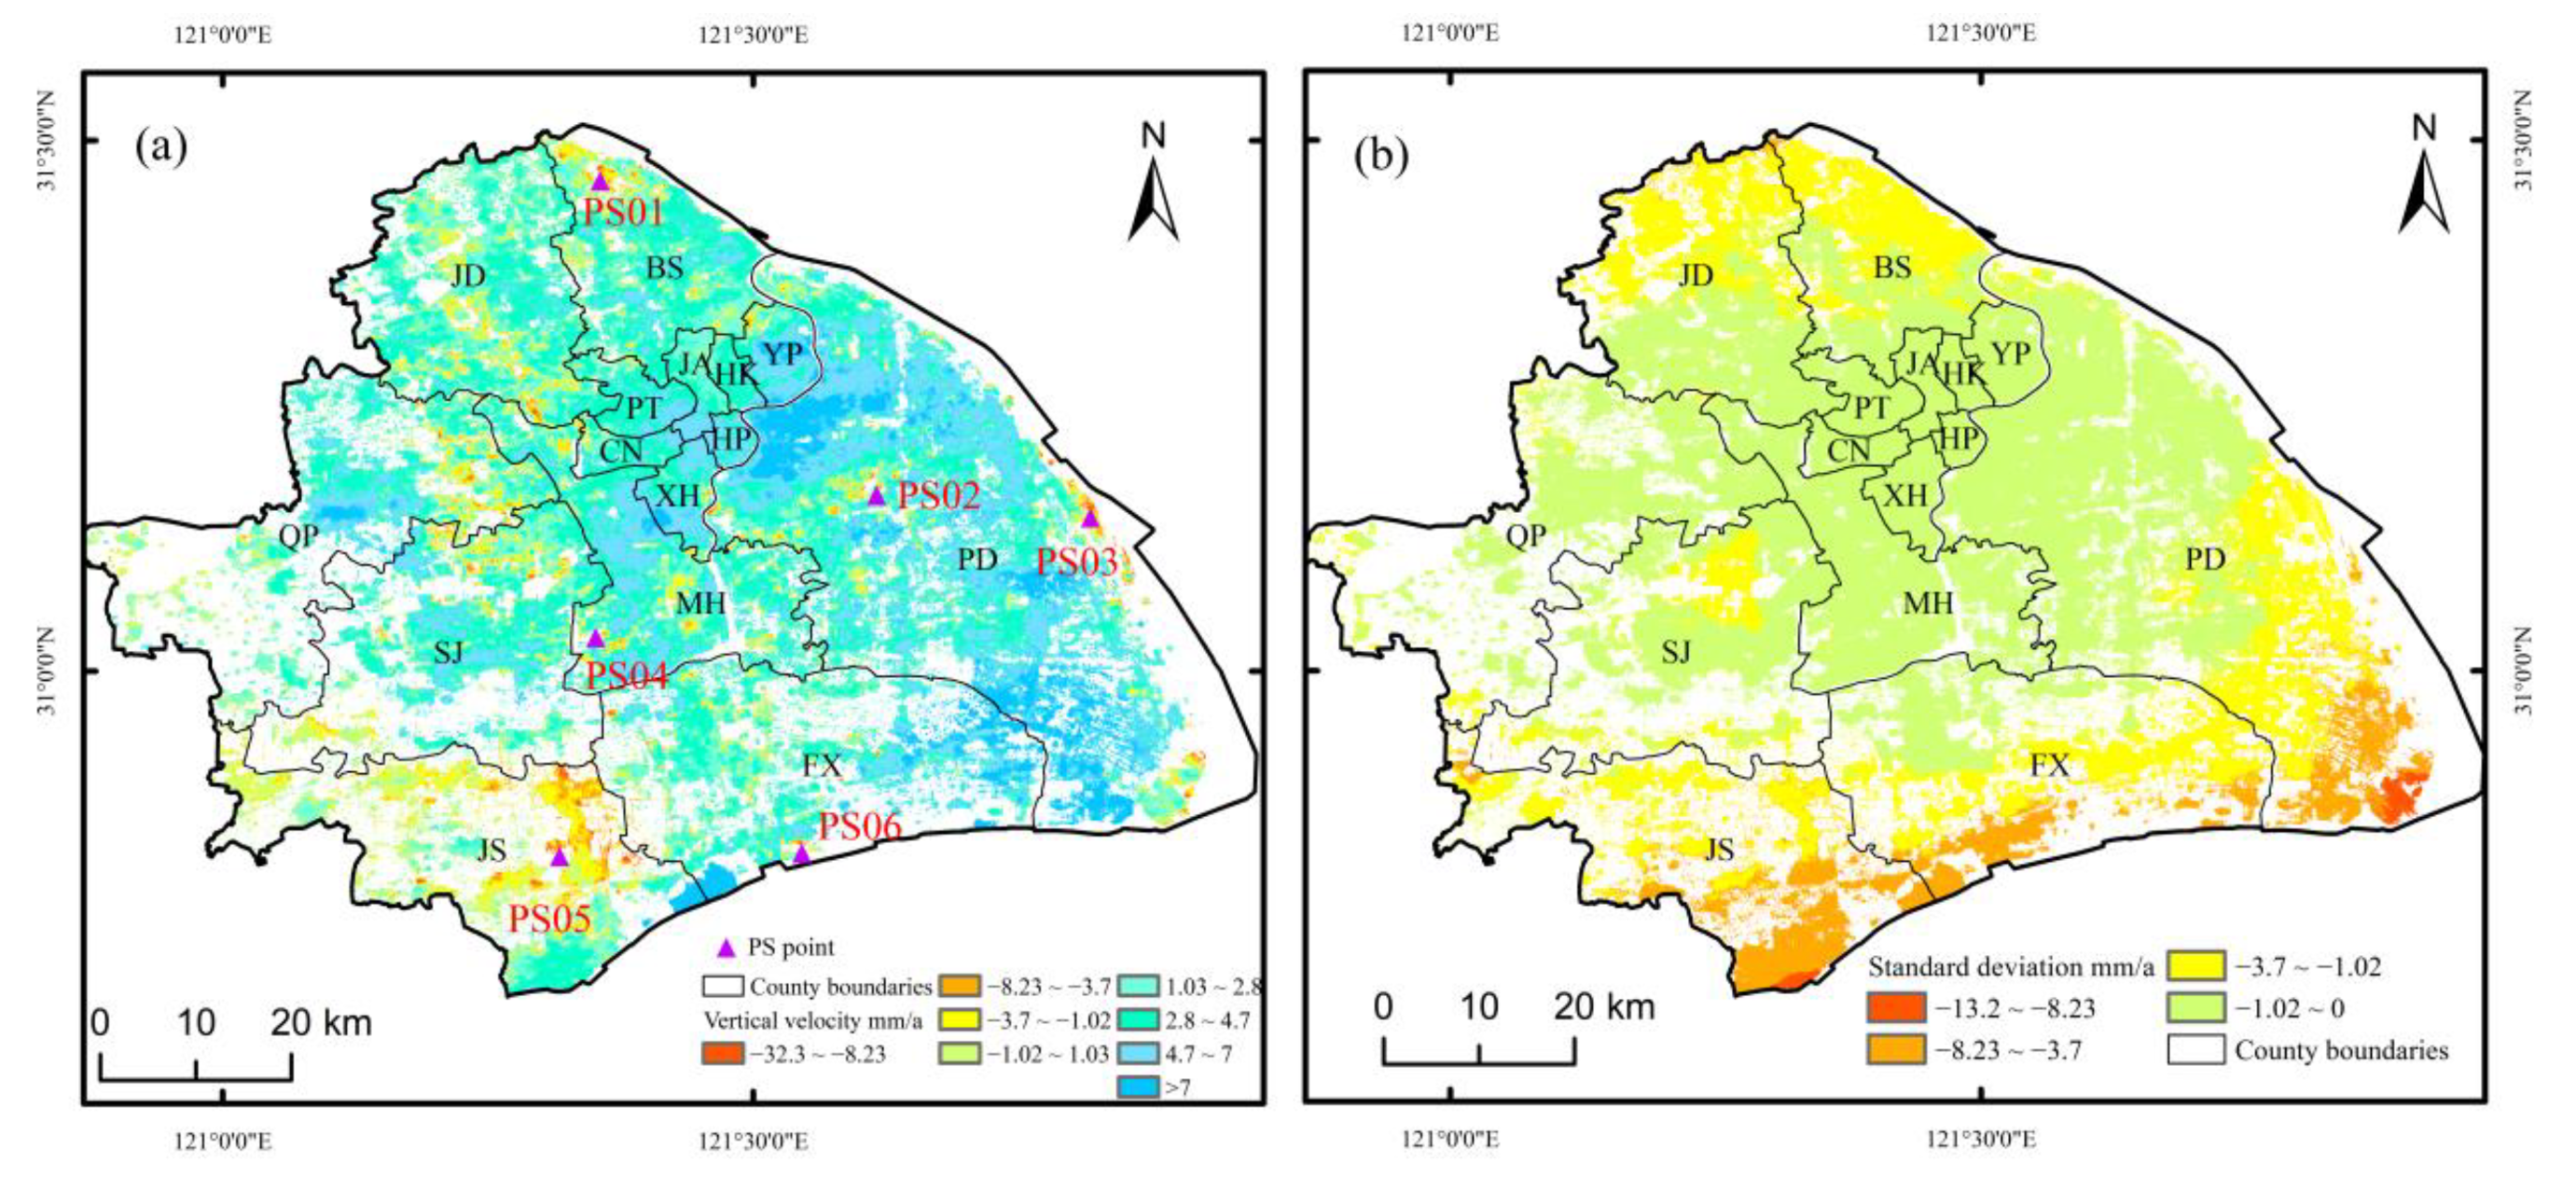
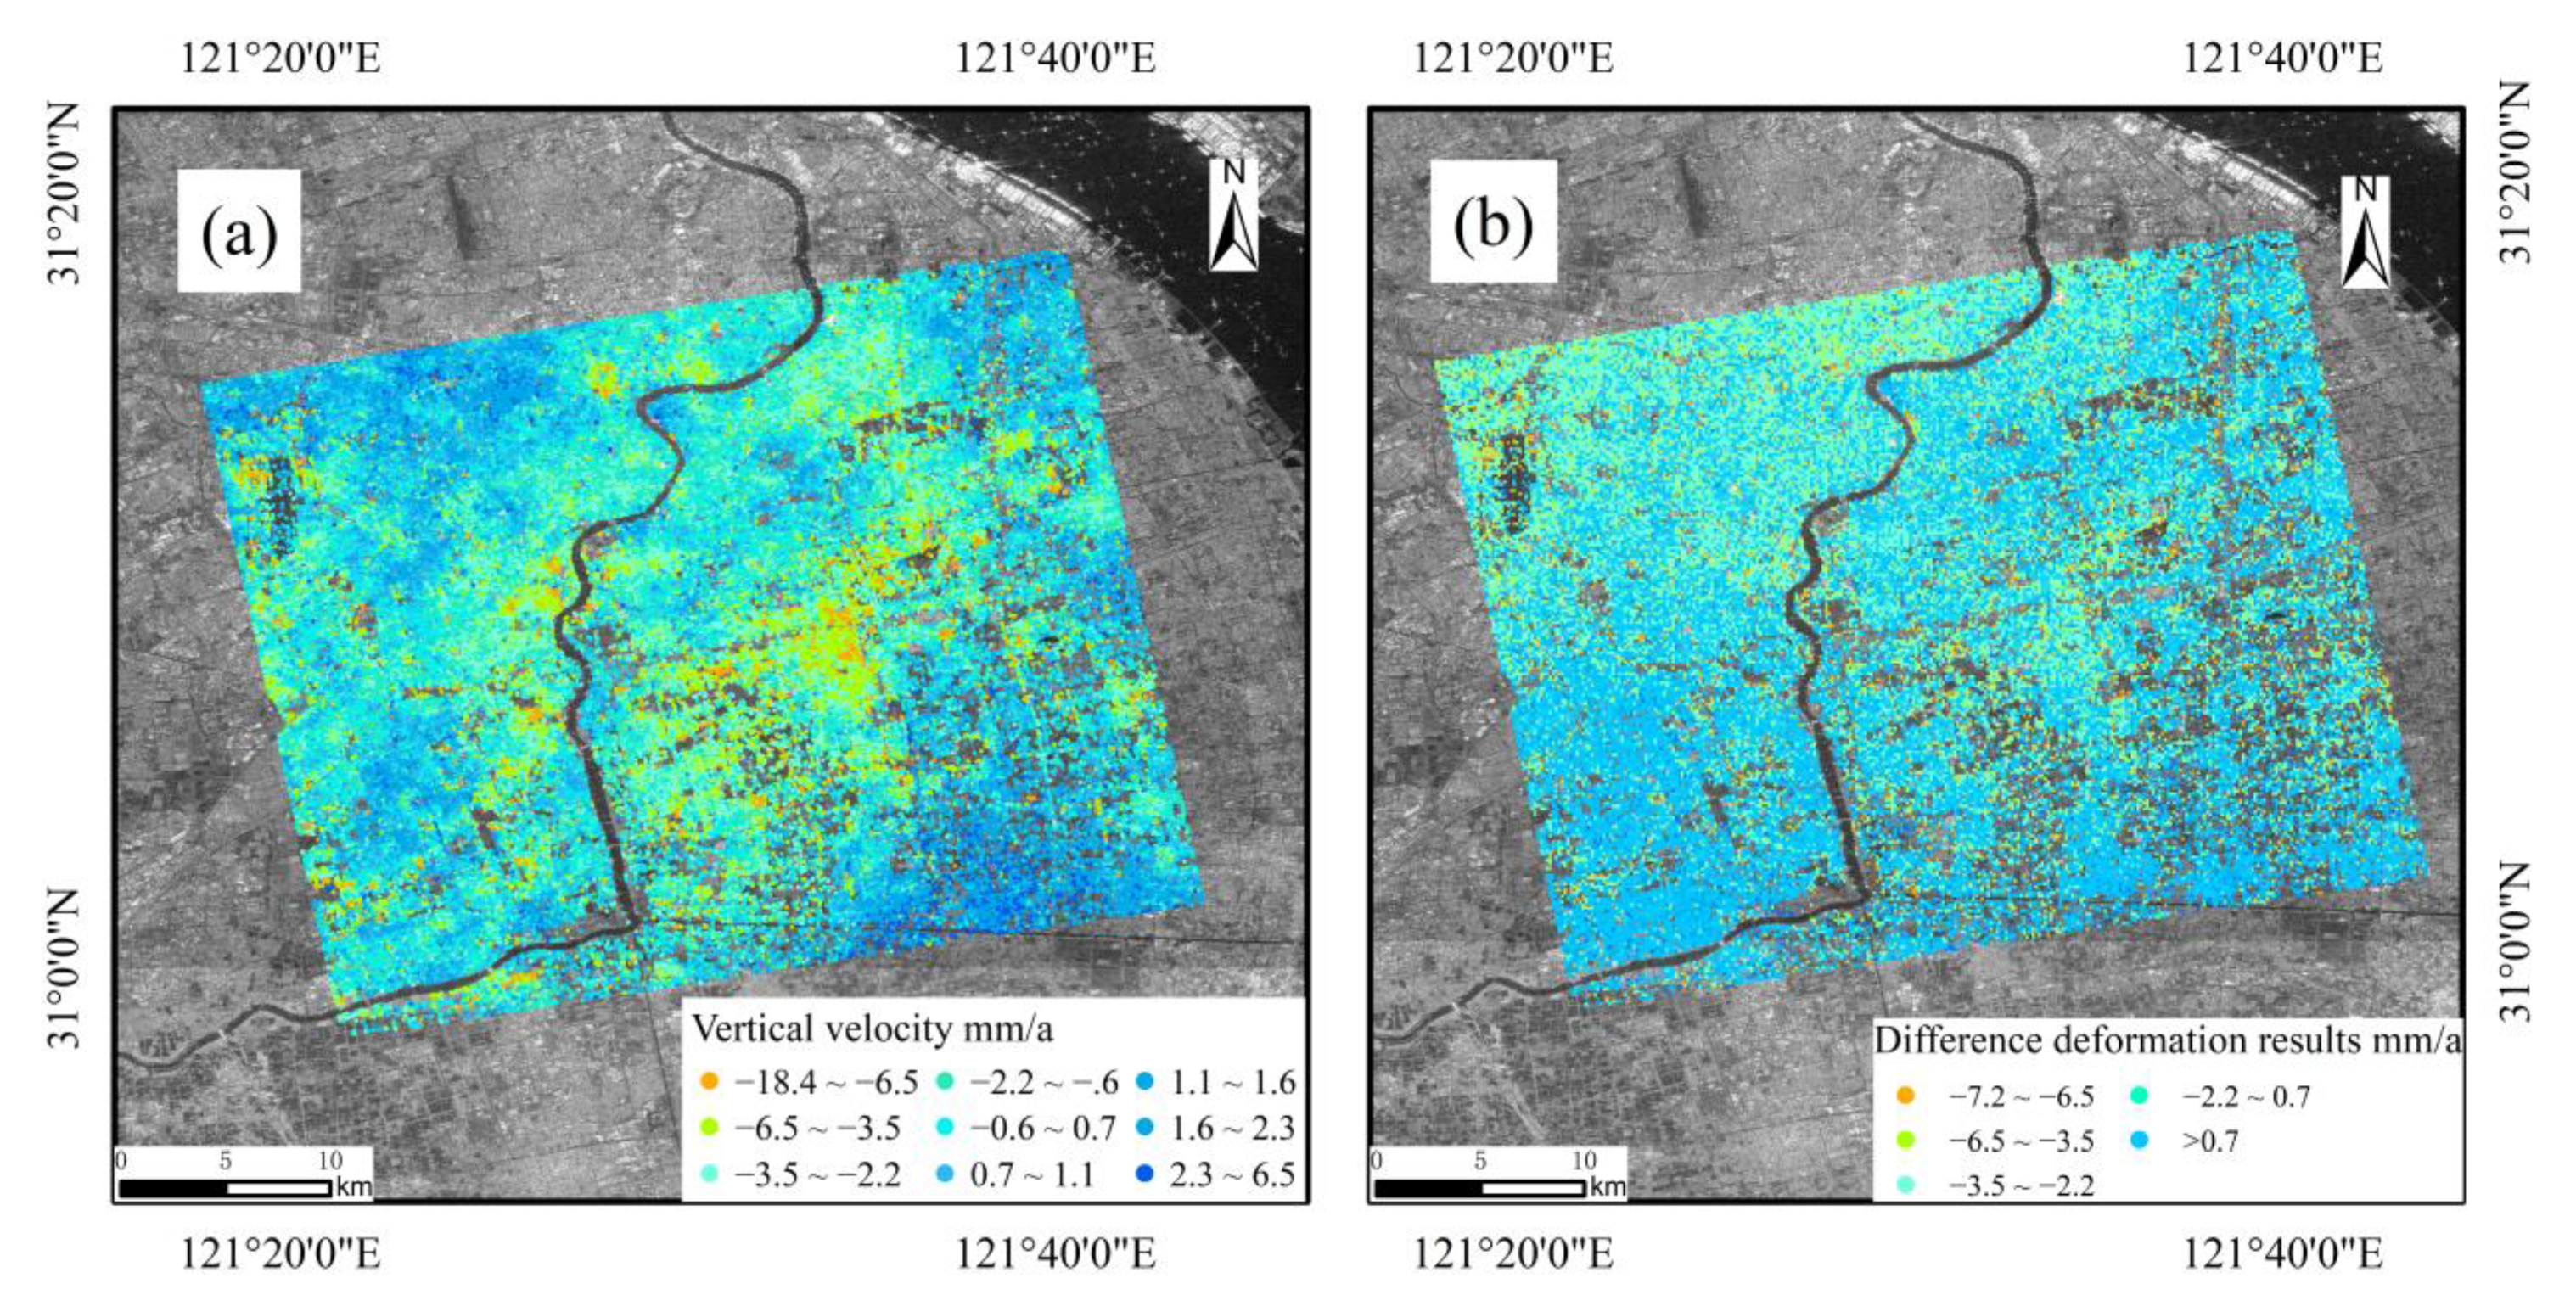
Based on the SBAS-InSAR technology, we obtained the average annual deformation rate in some areas of Shanghai from 2016 to 2022 (as is shown in Figure 7). Of the whole monitoring area, the settlement in Shanghai mainly occurred in some coastal areas of PD, BS, MH, and the JS District, showing uneven distribution characteristics, and the maximum annual average settlement rate was −32.3 mm/a. PD is one of the largest development and construction sites in Shanghai, and the occurrence of a partial settlement in the new economic construction and development zone is inevitable because of the development and construction of large-scale municipal projects. Meanwhile, the increase in population requires more resources including water resources, etc.; thus, the overexploitation of groundwater will also lead to the occurrence of land subsidence. The JS District exhibits a wide range of regional subsidence, in addition to human influences. It may be that some error points have been selected because of the low coherence. The time series deformation is shown in Figure 8.
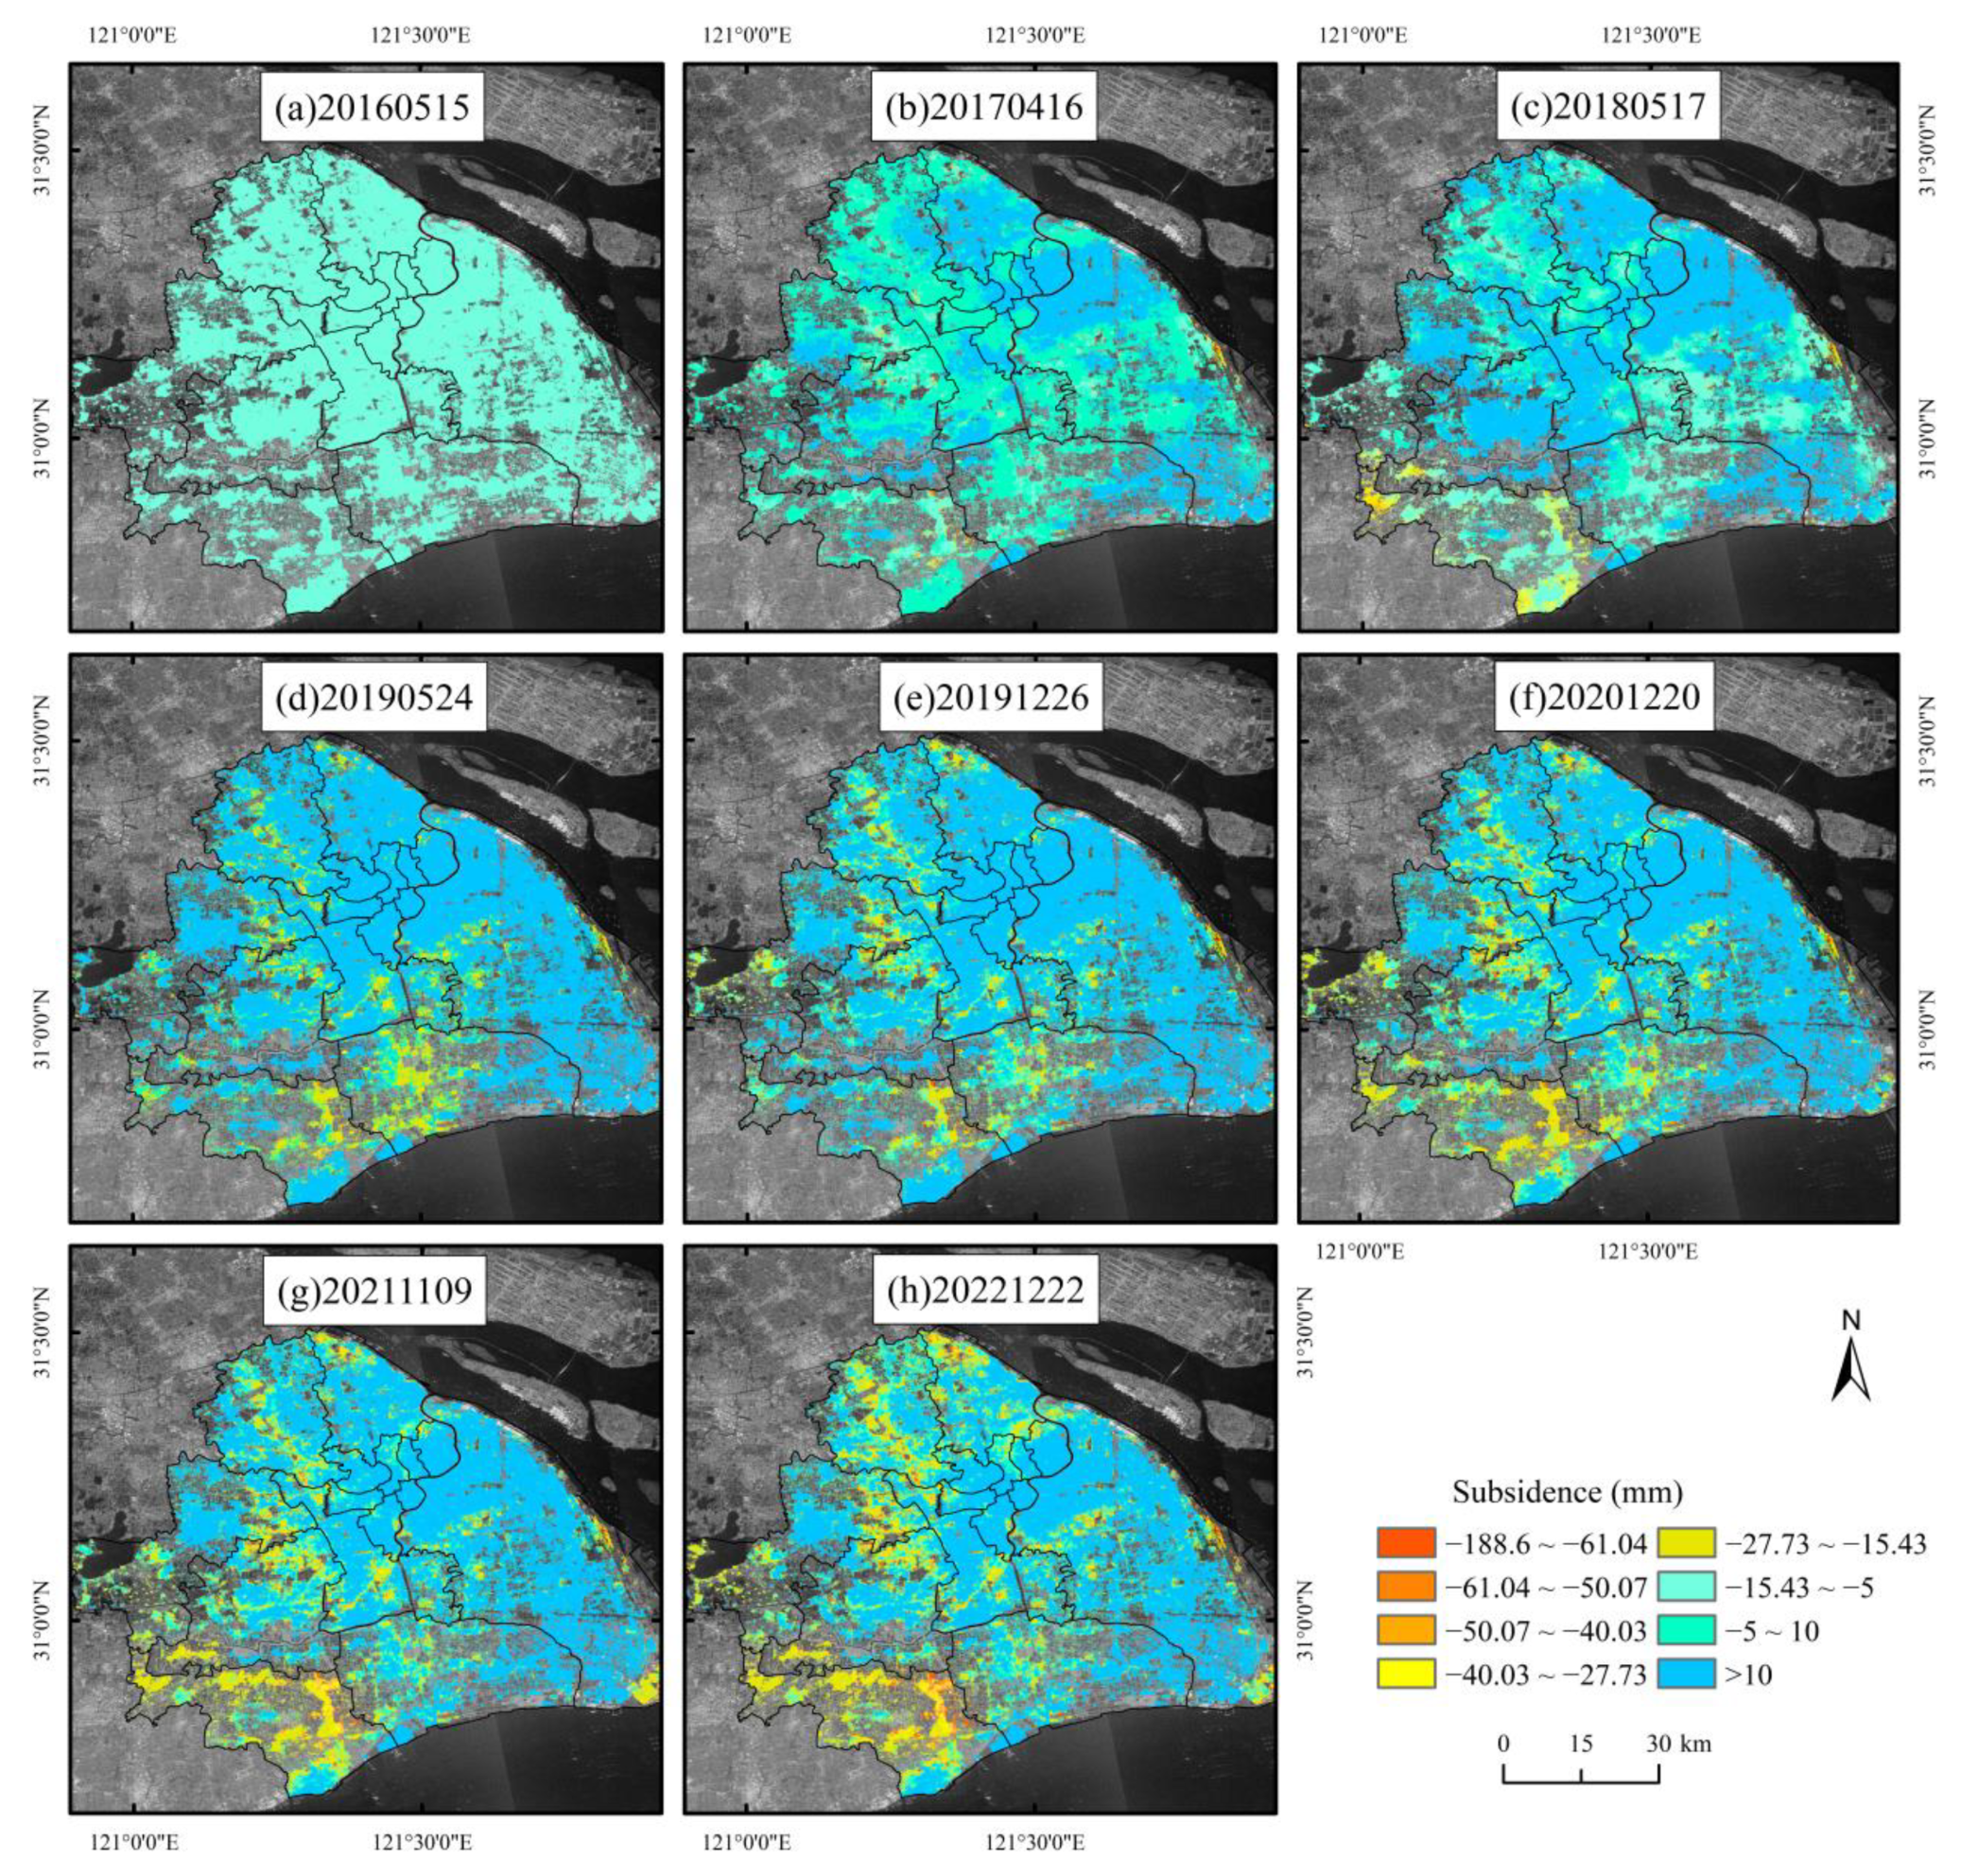
Figure 8 shows the cumulative sedimentation time series from 2016 to 2022. During the 7-year study period, the maximum cumulative settlement in Shanghai was −188.6 mm, located near Dishui Lake in the PD New Area. The settlement in the main urban area is relatively stable, with a cumulative settlement range of −40 mm to −27 mm. The sinking of southern Shanghai has been showing a downward trend. In the coastal area, the settlement near PD Airport is more serious, with a maximum cumulative settlement of −120 mm. In the cumulative time series, the settlement phenomenon in BS District and JS in the north of Shanghai was the most obvious, and the settlement amount gradually increased as the settlement area gradually expanded.
(1) It can be seen from the a–c subgraphs of Figure 8 that the settlement center was already obvious from 17 May 2018. The settlement was mainly distributed in the coastal part of the SJ District and the JS District, and the settlement center was mainly concentrated between approximately −15 and −5 mm. Moreover, the maximum cumulative amount was −50 mm, and the settlement gradually expanded from the JS District to the surroundings. The emergence of a large settlement center near PD Airport may be due to the implementation of the “Shanghai Airport Special Work Plan for Improving the Normality of Flights” under the leadership of the municipal government in September 2017. This increased passenger flow, including the improvement of various nearby transportation facilities, resulting in relatively obvious ground subsidence.
(2) It can be seen from Figure 8d–f that the settlement gradually increased on 20 December 2020. The settlement mainly occurred in the JS District and the BS District, and the settlement in and near Shanghai Disneyland in the middle of PD New Area became more obvious. The cause of this settlement was related to human activities, and the maximum cumulative amount was −100 mm. Furthermore, the settlement center was mainly concentrated between approximately −30 and −15 mm.
(3) Figure 8g–h show that the settlement area has basically not changed, and on 22 December 2022, the maximum accumulation in the JS District reached −131 mm, and the cumulative amount in the main settlement center was between approximately −40 and −25 mm. The reason for the settlement of the coastal area of PD New Area is mainly related to its own geological structure; the newly formed land is vulnerable to settlement due to the low degree of consolidation. The corresponding land settlement will be improved, while the consolidation of the land reaches a stable value after a correspondingly long time.

4.2. Deformation Result Validation

The ground displacement results are validated through three steps: 1. analyzing the standard deviation of the annual sedimentation; 2. comparing the deformation results from Sentinel-1 data and TerraSAR images; and 3. matching the results from the SBAS-InSAR and StaMPS technologies.
(1)
Standard deviation verification
Internal coincidence verification refers to the analysis of the phase model of the time series InSAR to determine the influence degree of the main error terms, that is, the theoretical accuracy evaluation that the time series InSAR can achieve. As is shown in Figure 7b, the average deformation rate of the experimental year is marked by a difference in the distribution map. It can be concluded that most of the errors range from −6.5 to −1 mm. The errors in the coastal parts of the JS District and Dishui Lake vary greatly because of the low coherence in coastal areas. In densely built-up places, the error is nearly neglected, and the experimental results are basically consistent with the actual situation.
(2)
TerraSAR displacement result comparison
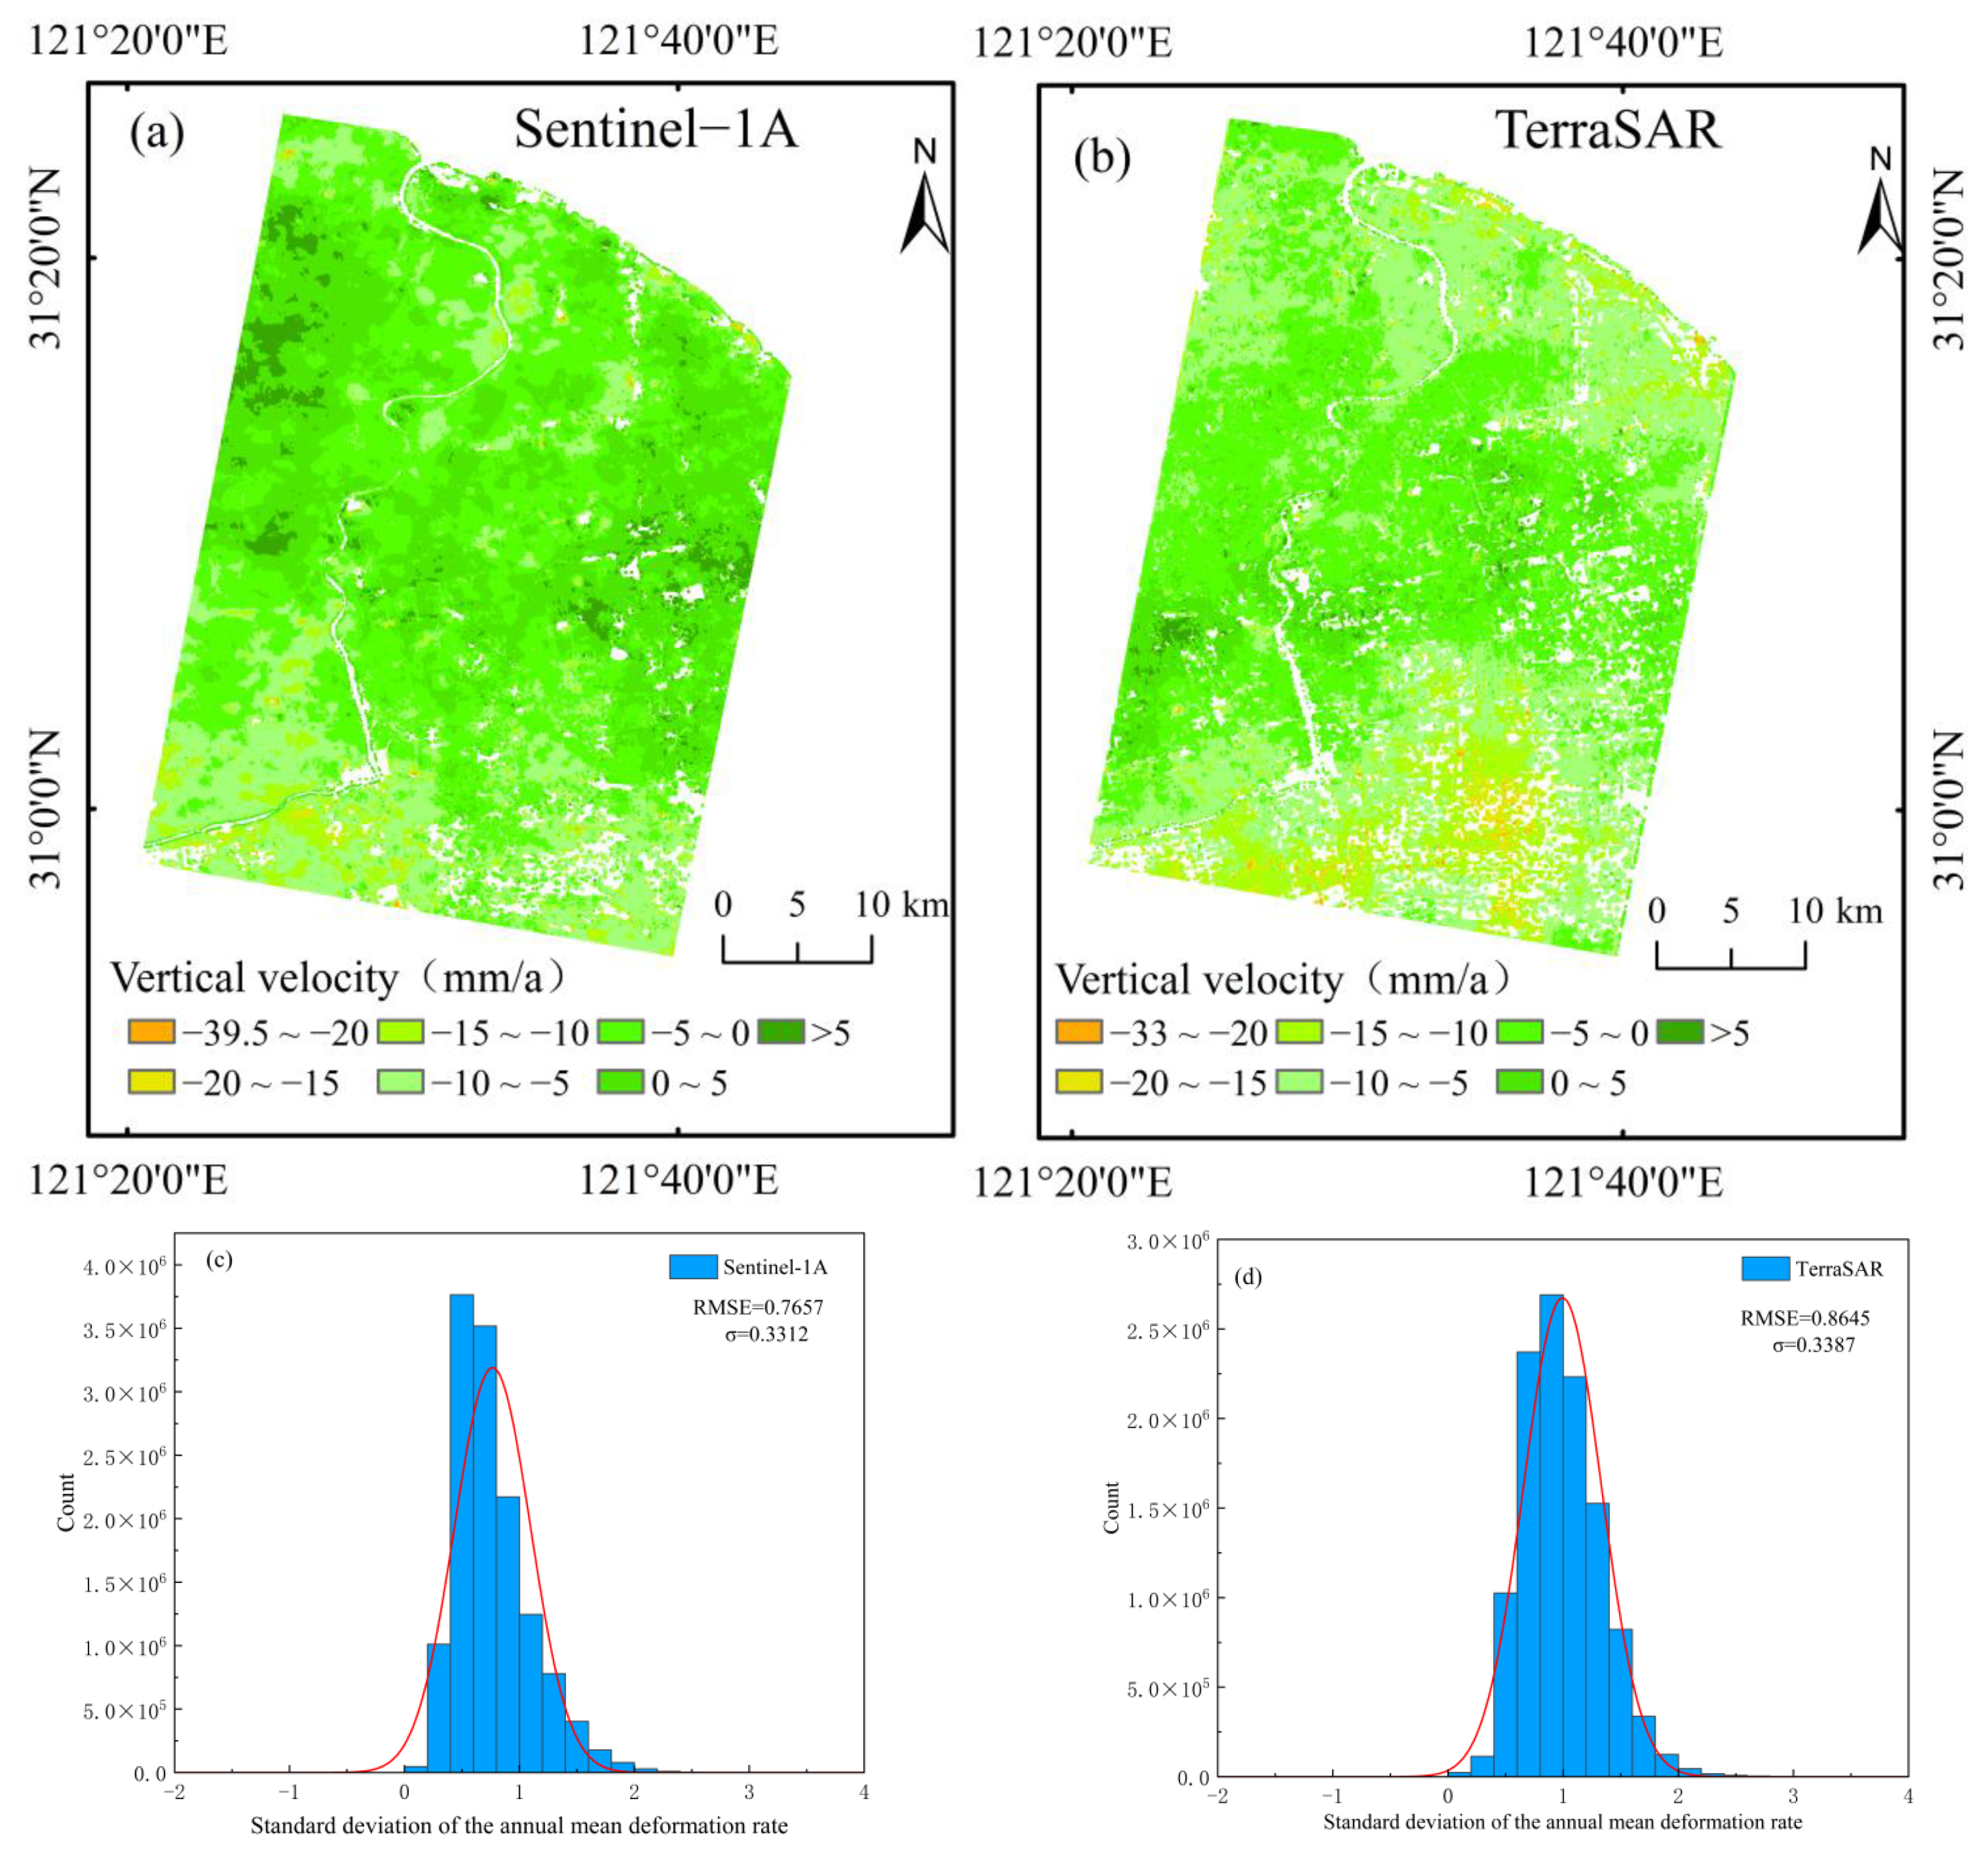
In order to further verify the feasibility of land subsidence in Shanghai using the SBAS-InSAR technology, this study monitored time series in some areas of Shanghai with nine scenes (2020~2021) from the high-resolution descending TerraSAR data using SBAS technology. Since the orbit types of the data from the two satellites are different, Sentinel-1A data are the ascending orbit data, and TerraSAR data are the descending orbit data; thus, the LOS deformation time series results obtained using the two datasets were first cropped to the public area and resampled. Figure 9 shows the annual average deformation rate of the Sentinel-1A and TerraSAR data, and the maximum annual average deformation rates were −39.5 mm/a and −33 mm/a, respectively. The subsidence mainly occurs in the MH District, the PD New Area coastal area, and the southern area. Meanwhile, it is possible to make errors in the recognition and operation of deformation points while selecting more target points in coastal areas and farmland areas of low coherence. From the results in the figure, it can be concluded that the standard deviation interval of the distribution of the annual average deformation rate was relatively consistent, and the monitoring results of the two different data sources were in good agreement at the level of deformation variables.
(3)
Results comparison with different SAR techniques
We applied two different techniques to compare the annual average deformation rate results during the same time period in the same study areas. Firstly, the annual average deformation of PS points obtained via StaMPS technology was interpolated inversely. Finally, the difference between the two technologies was obtained. As is shown in Figure 10, the displacement difference results are mostly between approximately −1.8 and 0.8 mm/a. Combined with the historical settlement data and previous research results in Shanghai, the deformation status has a high consistency, which shows the reliability of using the SBAS technology to study the time series in Shanghai.

4.3. Typical Land Subsidence Areas Discussion

The time series deformation from 2016 to 2022 shows that the land subsidence in Shanghai is unevenly distributed. The subsidence mainly occurs in some coastal areas and the JS District, and most of the subsidence areas have not shifted. The following section will analyze the settlement results from typical settlement areas, the subway, and other line projects and study the correlation between settlement and rainfall based on the SSA method and the correlation between settlements and human activities.

4.3.1. Feature Point Deformation Analysis

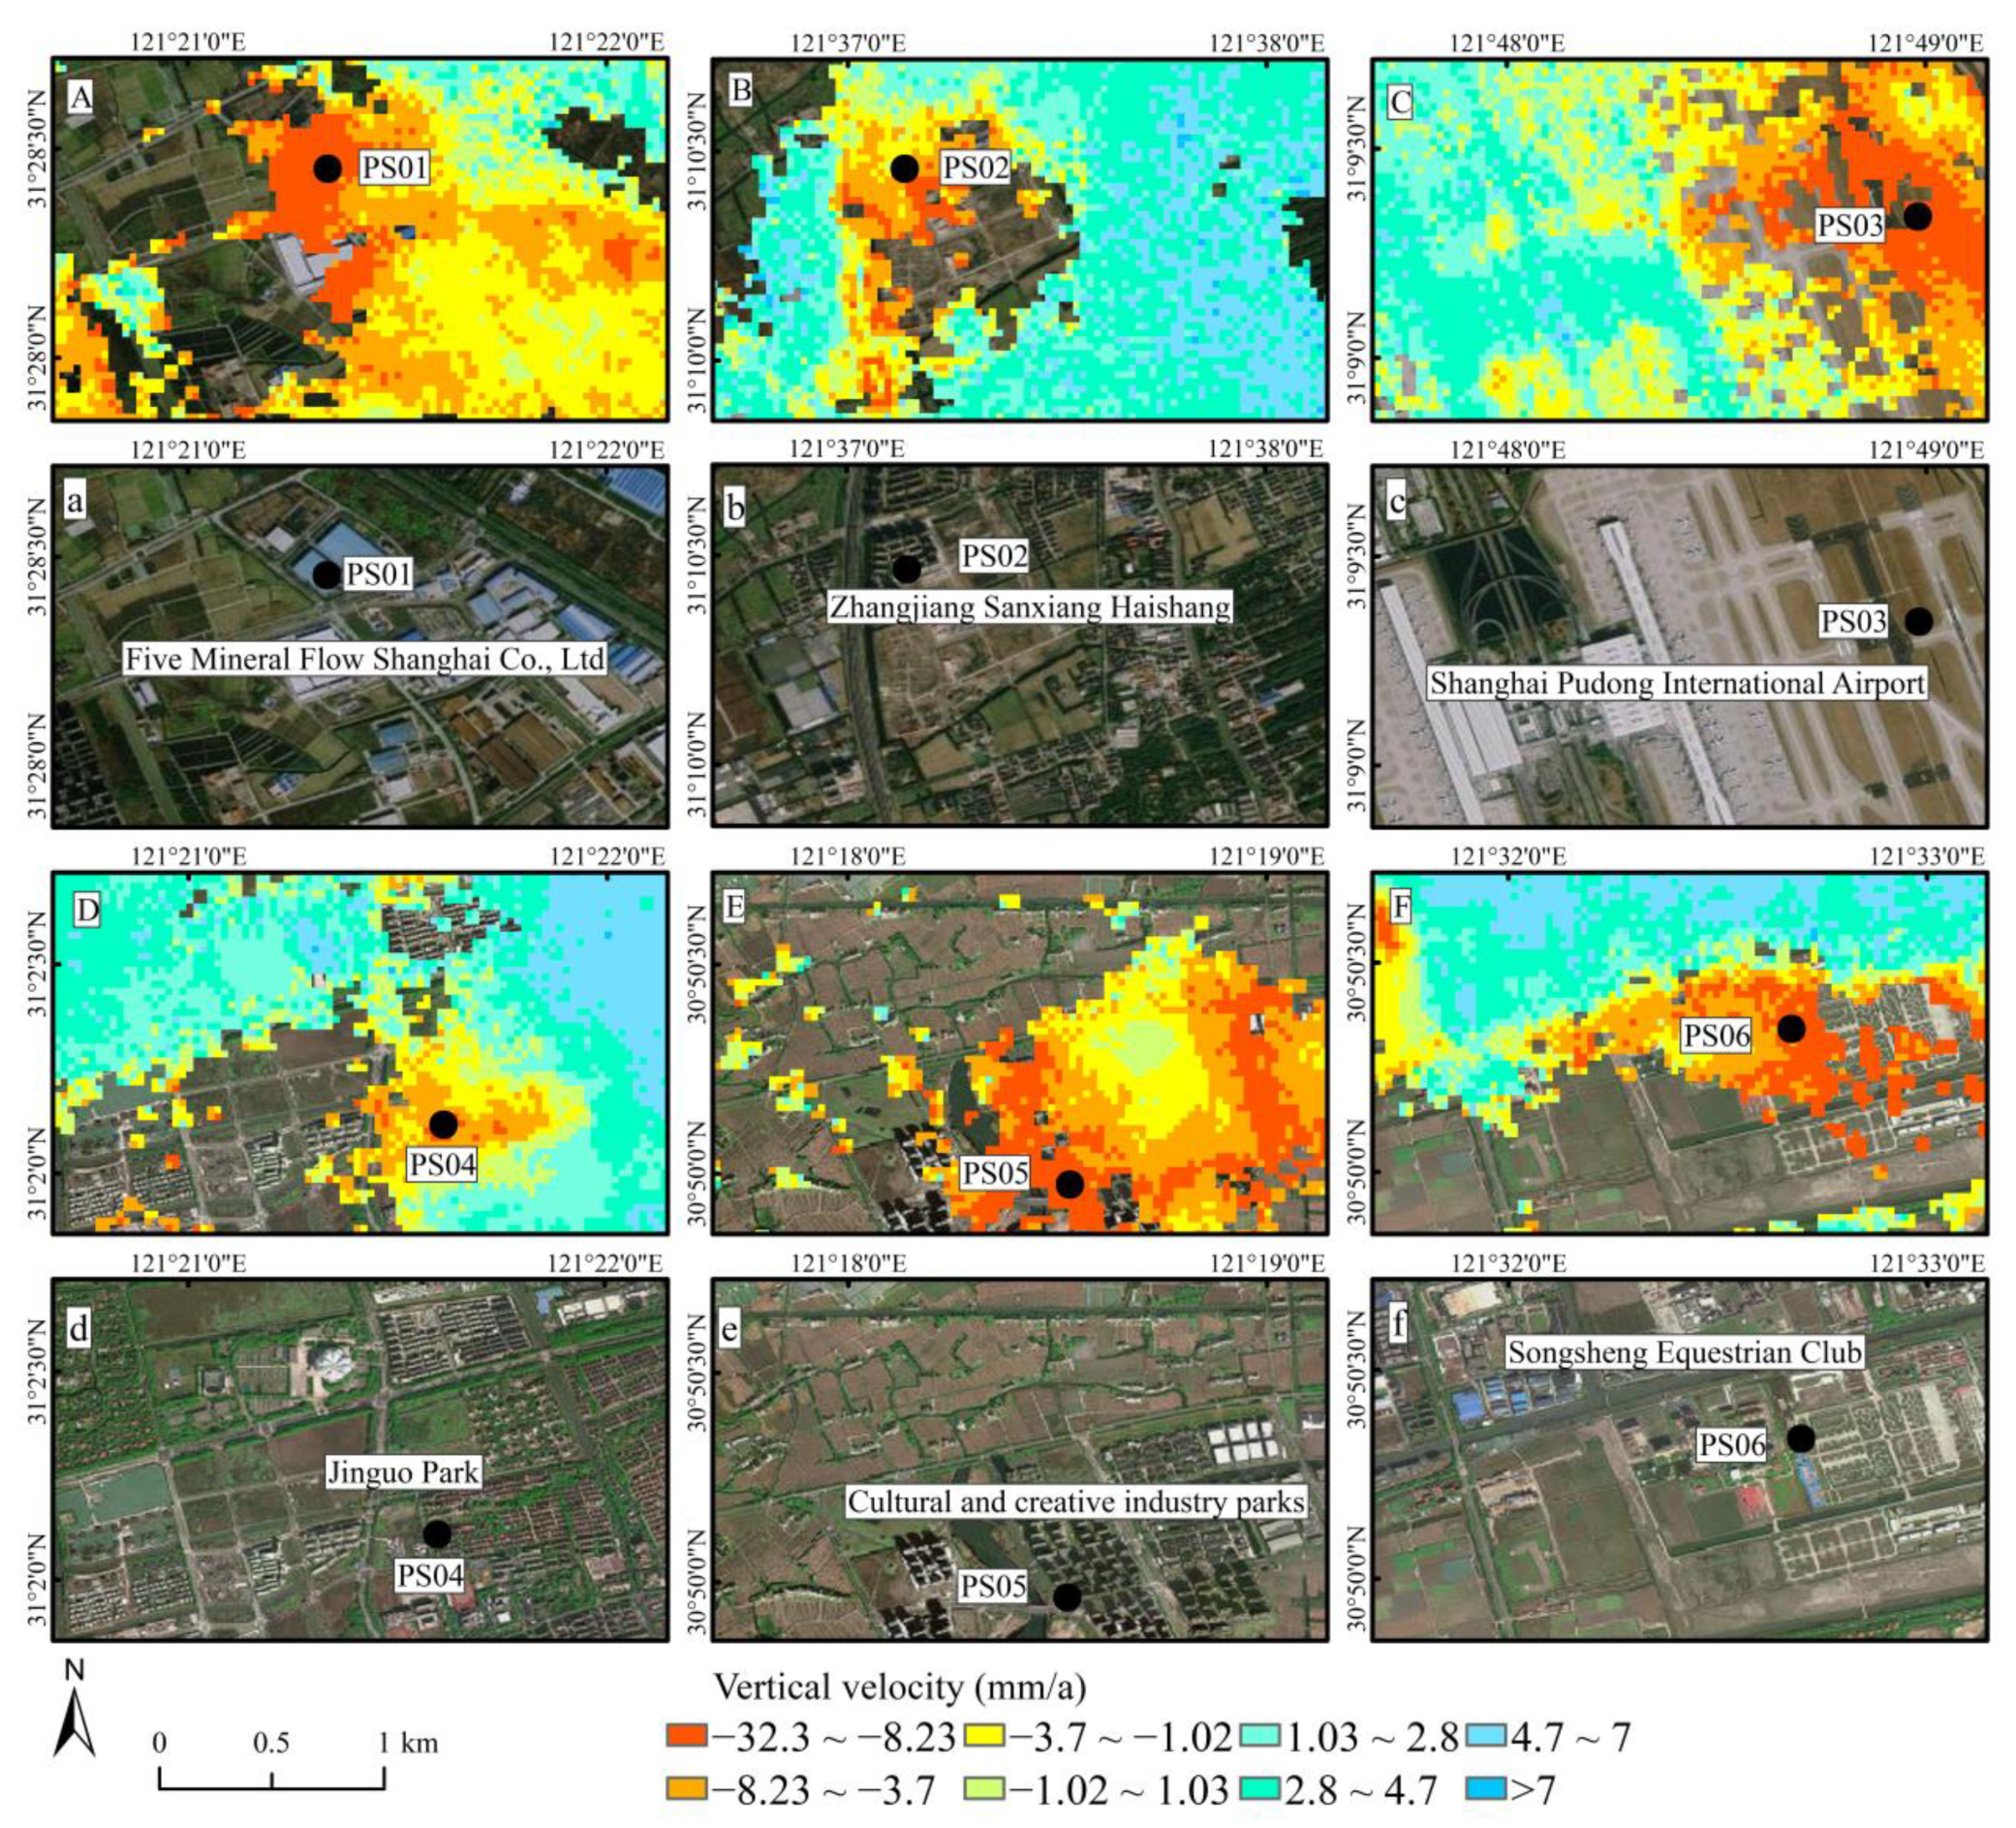
In order to better understand the spatiotemporal variation characteristics of the entire study area from 2016 to 2022, six feature points in large settlement areas were selected for the analysis of time series deformation, and the corresponding high-resolution optical image is described in Figure 11.
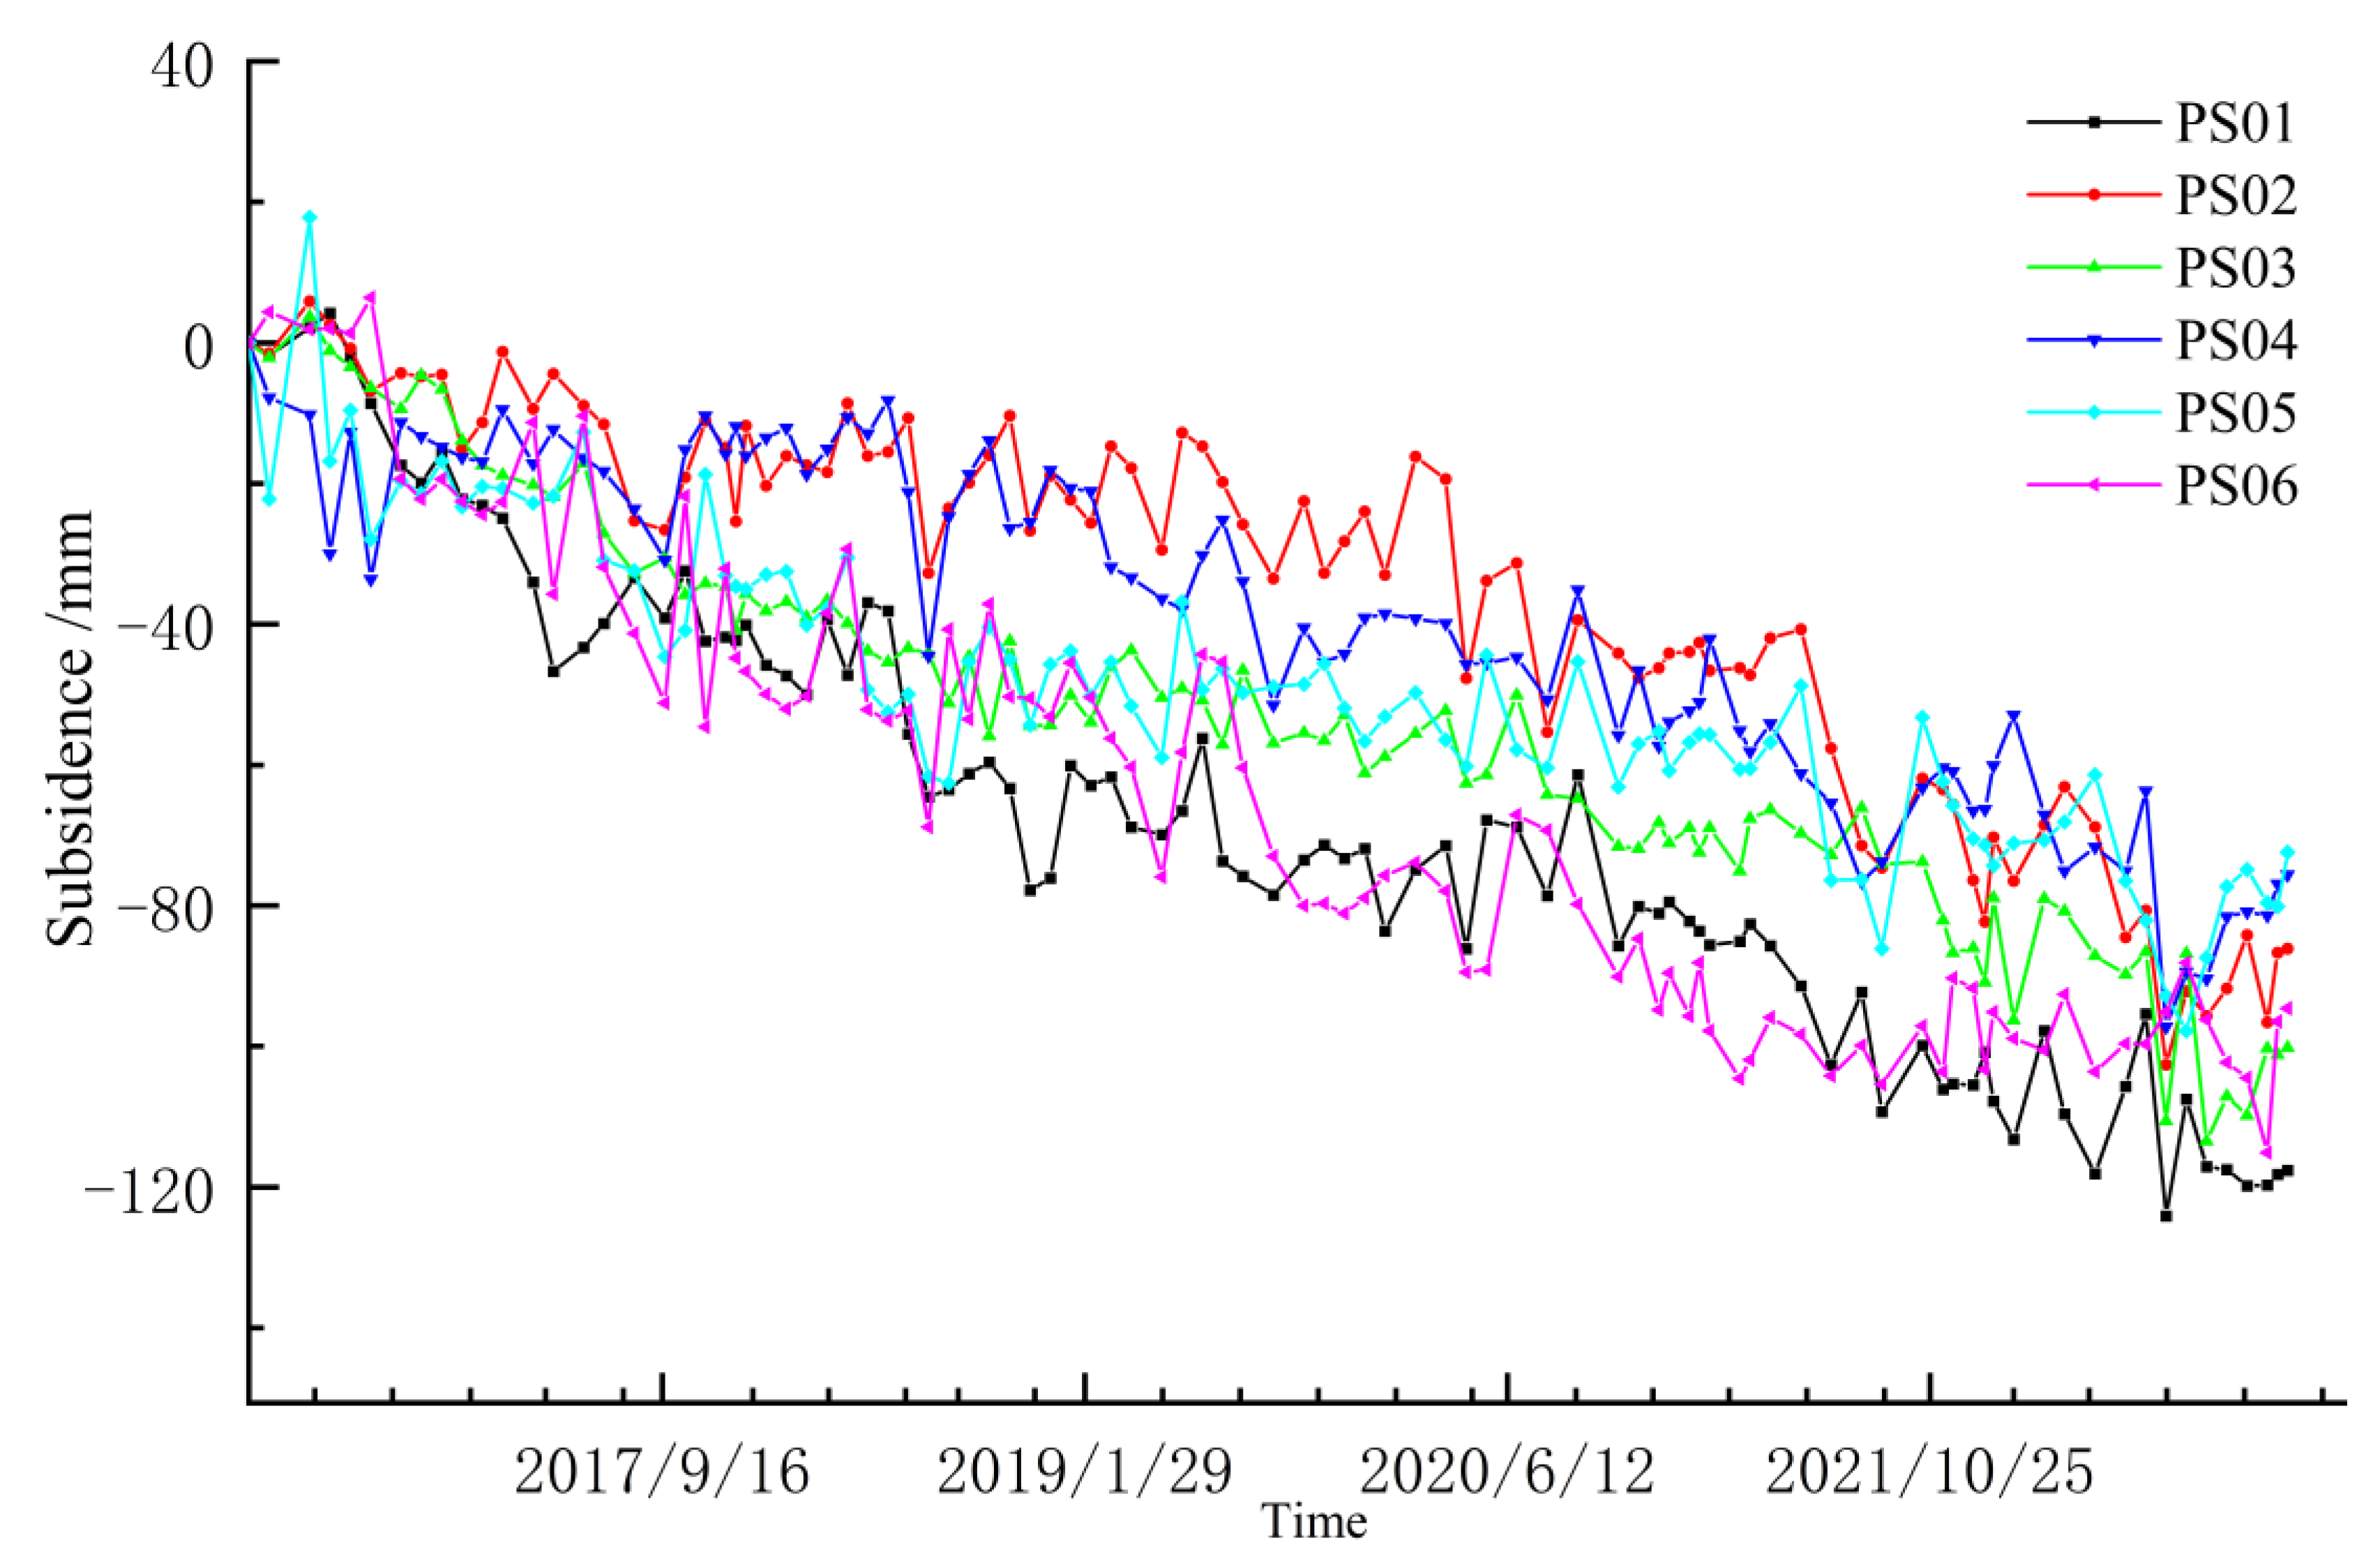
The position distribution of feature points is shown in Figure 7. In the coastal region, the PS01 characteristic point is located at BS District Five Mineral Flow Shanghai Co., Ltd., with a maximum settlement of −114.4 mm. Furthermore, PS03 is located at PD International Airport, where the settlement construction is mainly on the newly built runway, and the average annual maximum deformation was −32.4 mm/a, and the cumulative settlement was −92.5 mm during the entire study period. In the main urban area of Shanghai city, the characteristic point PS02 is located on Zhangjiang Sanxiang Haishang, PD New Area, with a maximum annual average deformation rate of −26.5 mm/a and a cumulative settlement of −100.8 mm. PS04 is located near the Maqiao Center River and Jinguo Park in the MH District, with a maximum settlement accumulation of −81.9 mm, and most of the settlement is linearly related to human activities. Point PS05 is located at the JS District Cultural and Creative Industry Park, where the surrounding area is mostly farmland, and the construction and development show an obvious linear settlement trend with the maximum cumulative settlement of −88.2 mm. Point PS06 is located near the Xinghuo Development Zone and Songsheng Equestrian Club in the FX District, which is close to the sea, and the soil is rich in water and the soil layer spacing is large; therefore, the PS06 area is susceptible to subsidence.
Figure 12 shows the cumulative ground elevation change in the selected feature points from 2016 to 2022, and the sedimentation trend increased year by year and shows a linear trend settlement. The settlement of coastal areas varies greatly compared with that of inland cities, while the coastal settlement of PS02 characteristic points is relatively stable compared with that of PS01 characteristic points. From 2016 to 2020, the overall subsidence underwent an obvious deformation, and the land subsidence remained basically stable after 2020.

4.3.2. Land Subsidence along the Subway Analysis

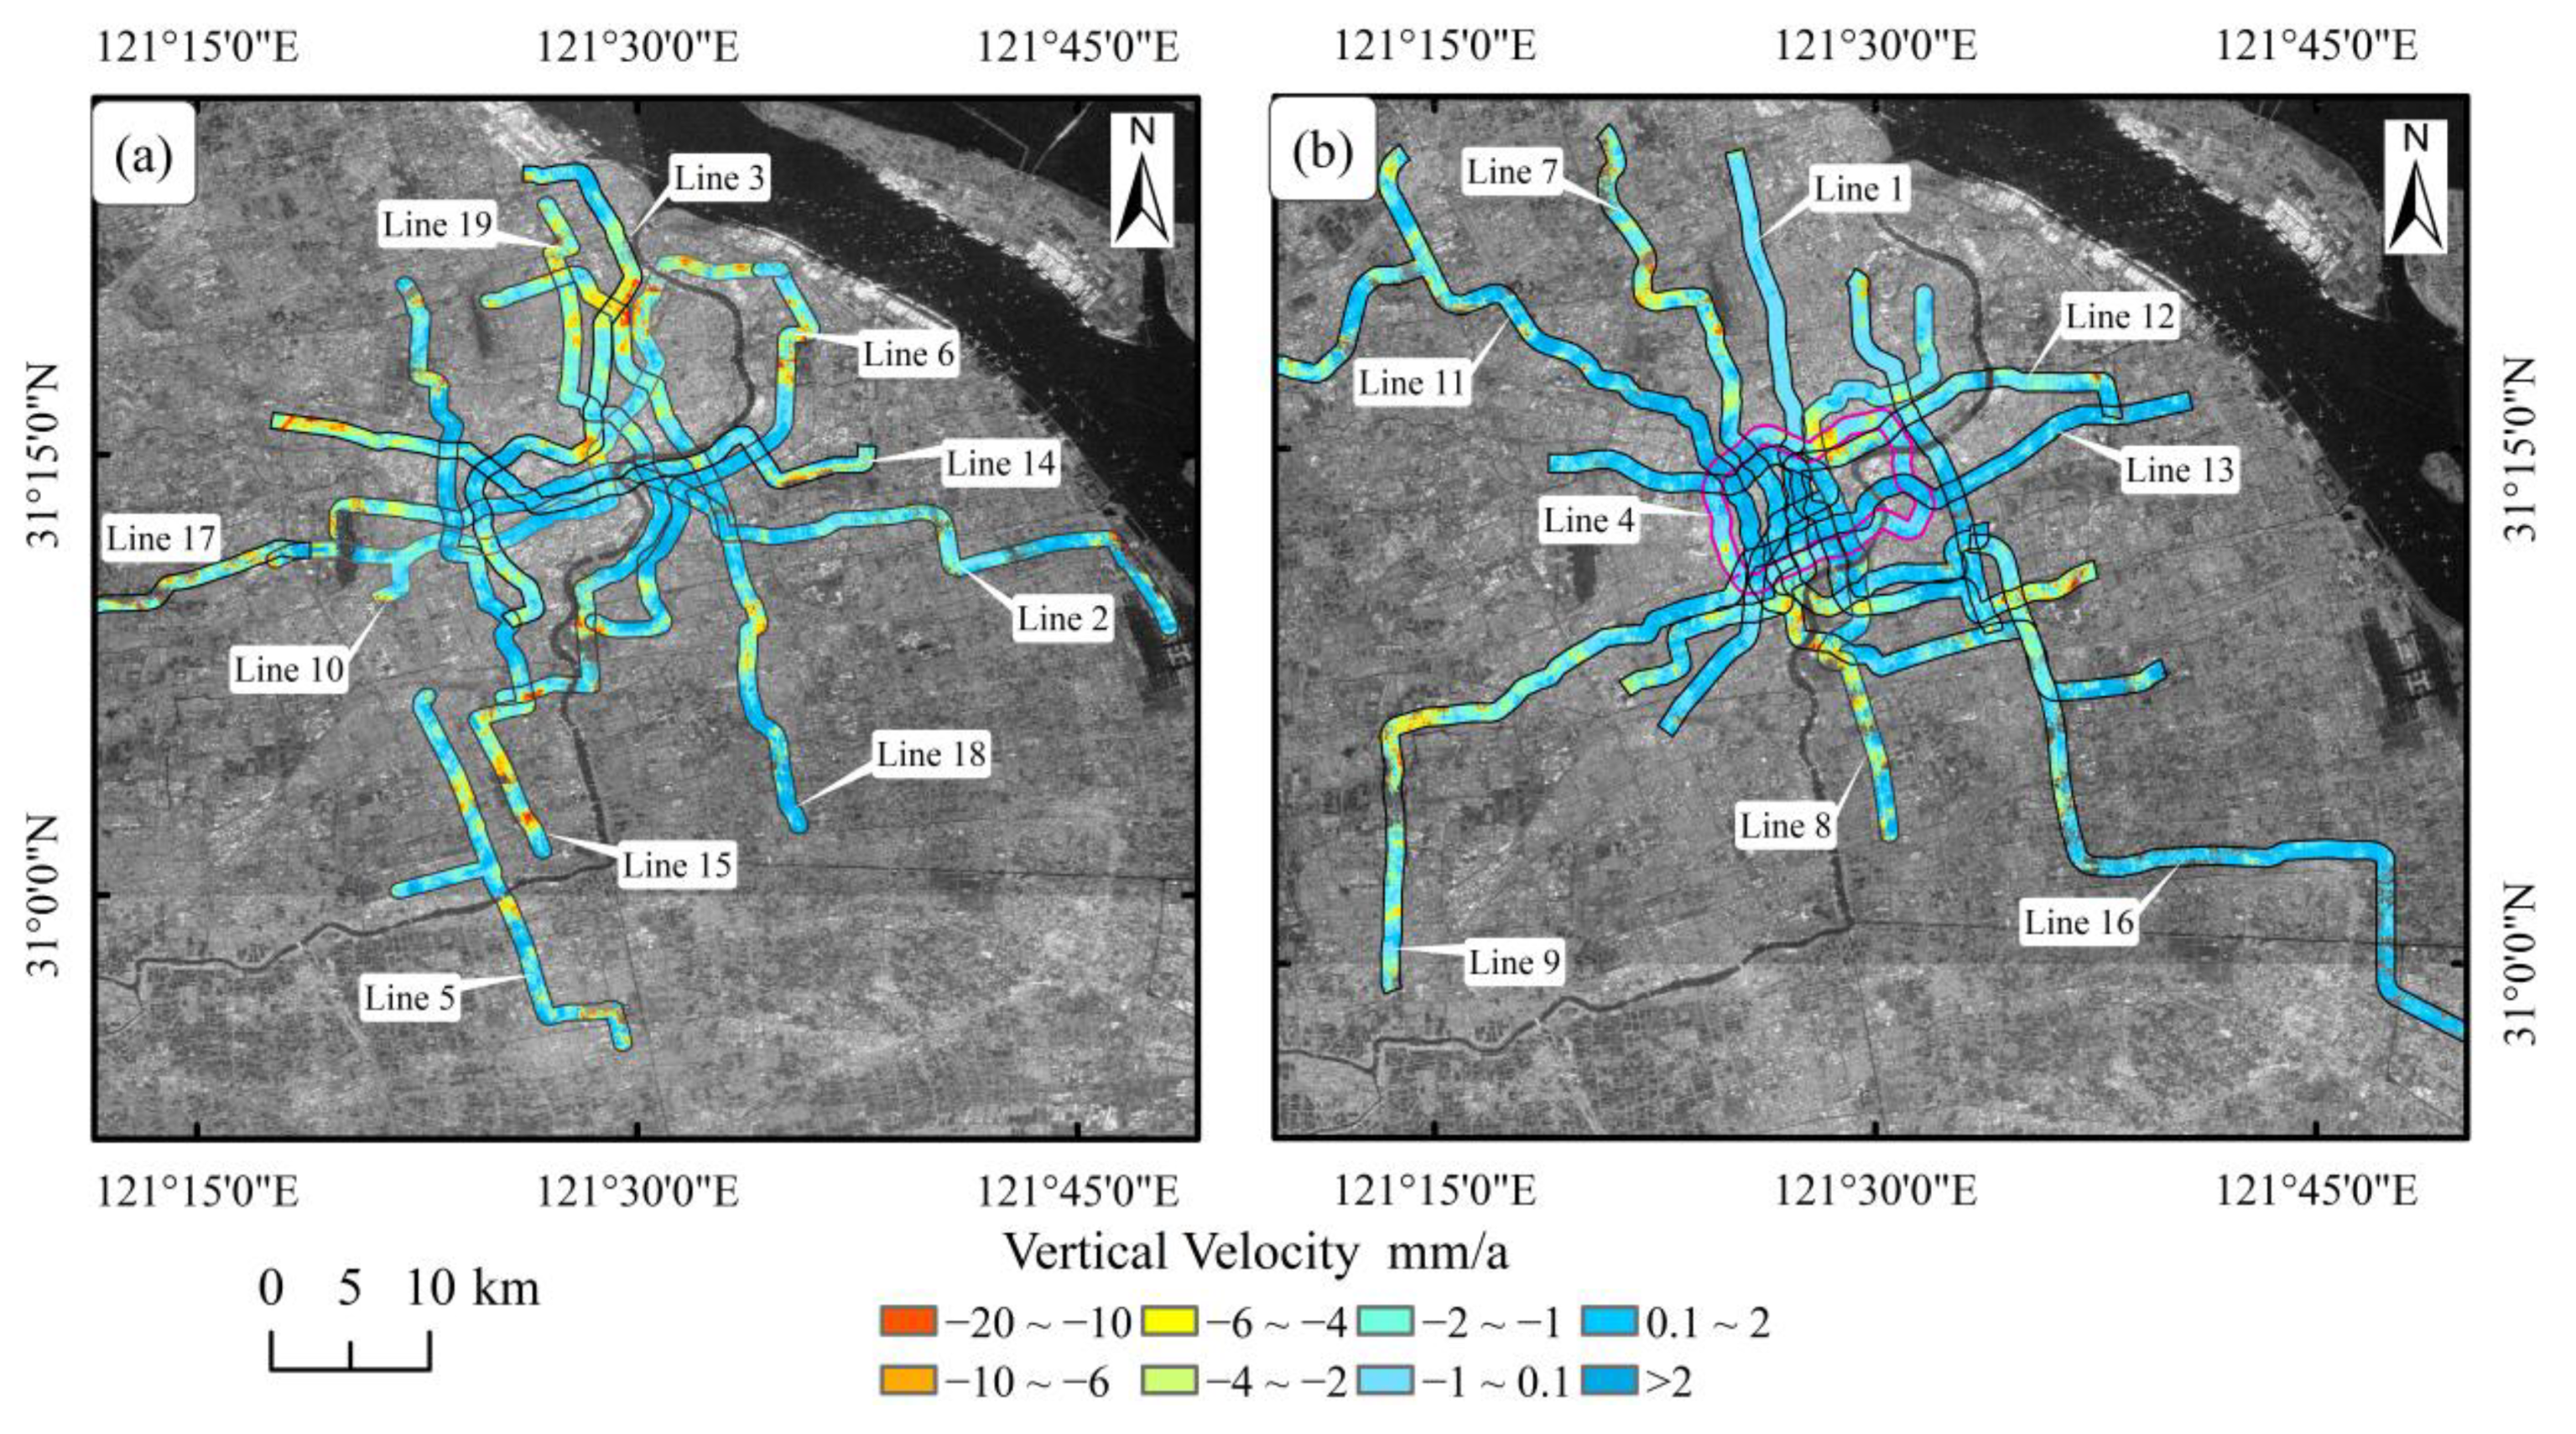
The reason for the subway deformation mainly includes an increase in construction, a change in the groundwater system, and geological conditions. These factors interact with each other, resulting in the complexity and inhomogeneity of surface settlement. Therefore, it is necessary to take scientific and reasonable measures to process and prevent surface subsidence in the process of subway construction and operation. The experimental results are consistent with the experimental results of rail transit routes in the 2021 Shanghai Geological Environment Bulletin [55]. Based on the degree of time series deformation during 2016~2022, the approximate construction time of the subway, the maximum annual average deformation rate of the railway, and the clarity of the display of the subway deformation information, we divide the subway into two parts for analysis.
Figure 13a shows the deformation state of Lines 2, 3, 5, 6, 10, 14, 15, 17, 18, and 19, among which Lines 14, 15, 17, and 18 were built in recent years. Line 14 is scheduled to be put into operation by the end of 2021. It will pass through the most densely populated area of Shanghai and become the rescue line of Line 2, which is the line with the highest passenger flow in Shanghai. Subway line 15, with a total length of 42.3 km, began operation on 23 January 2021. Line 15 is a north–south traffic line from the BS District to the MH District. Metro Line 17 began operation on 30 December 2017 and is an east–west fast transportation line between Hongqiao Railway Station and Dongfangdi. Subway line 18 is planned to pass through 26 stations, with a total length of approximately 36.1 km, going through the Yangtze River to Hangtou; the most obvious settlement occurred at Fudan University Station, with a maximum settlement rate of −18.2 mm/a, connecting the No. 12 subway line and the No. 19 maglev train. Part of the reason for the settlement of these subways is the large amount of earthwork excavation and underground structure construction in the process of city development. Meanwhile, these works affect the surrounding soil and groundwater systems, finally resulting in surface settlement. Figure 13b shows the relatively stable subways in Shanghai. One reason is that the construction time is long, all the conditions are basically stable, and the settlement is within a controllable range.

4.4. Correlation Analysis

4.4.1. Correlation Analysis between Land Subsidence and Rainfall

According to previous studies [57], there is a certain relationship between urban precipitation and urban surface subsidence. With increased rainfall, the surface rock pore water increases so that the surface is stable or slightly uplifted. Here, we selected the monthly cumulative rainfall and subsidence period deformation of the PS02 and PS06 feature points in typical subsidence areas and analyzed the correlation between the subsidence points and rainfall based on the SSA singular analysis model.
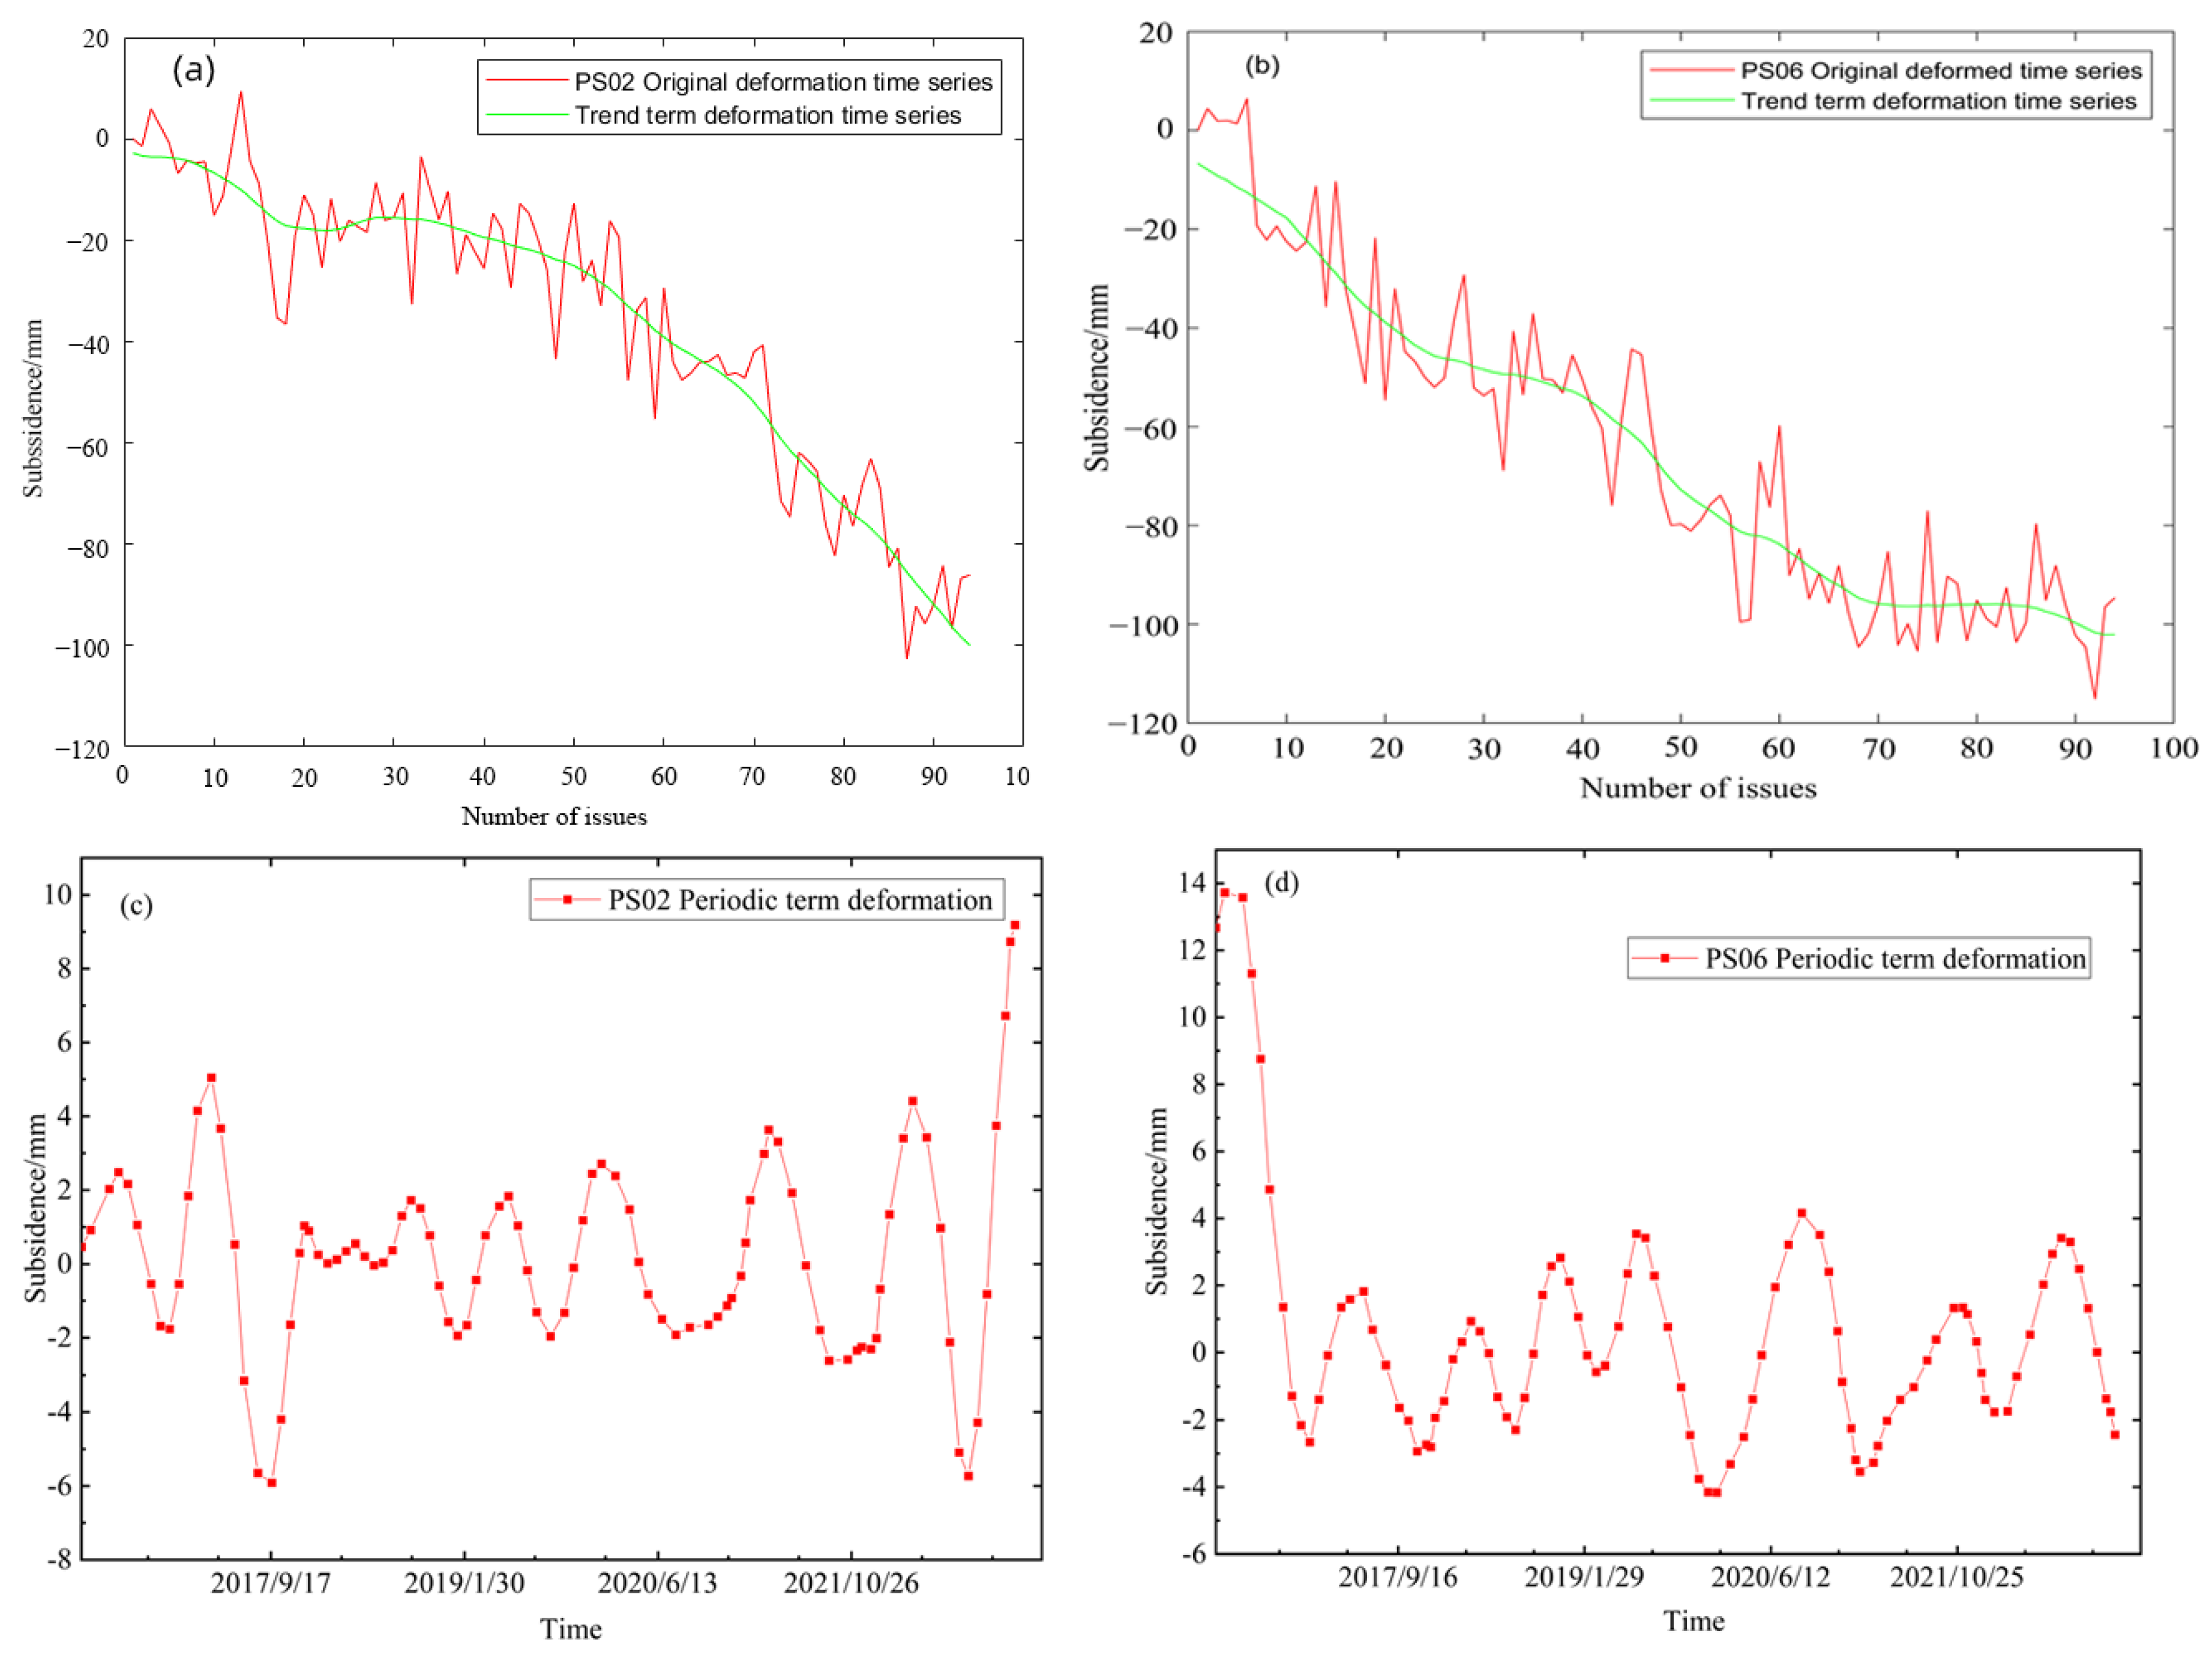
Firstly, the time delay matrix was established; then, the singular value decomposition was carried out. Then, the target signal component and other signal components were separated, and the corresponding singular values were reconstructed according to the grouping results. The singular spectrum analysis window length L of the feature point was set to 10. Figure 14 shows the original time series trend deformation and periodic term time series deformation of the two feature points. From the trend diagram, it can be concluded that the displacement shows a continuous downward trend, which is an unstable time series diagram. From February to May of each year, the surface shows an upward trend, and the settlement cycle term is unstable.
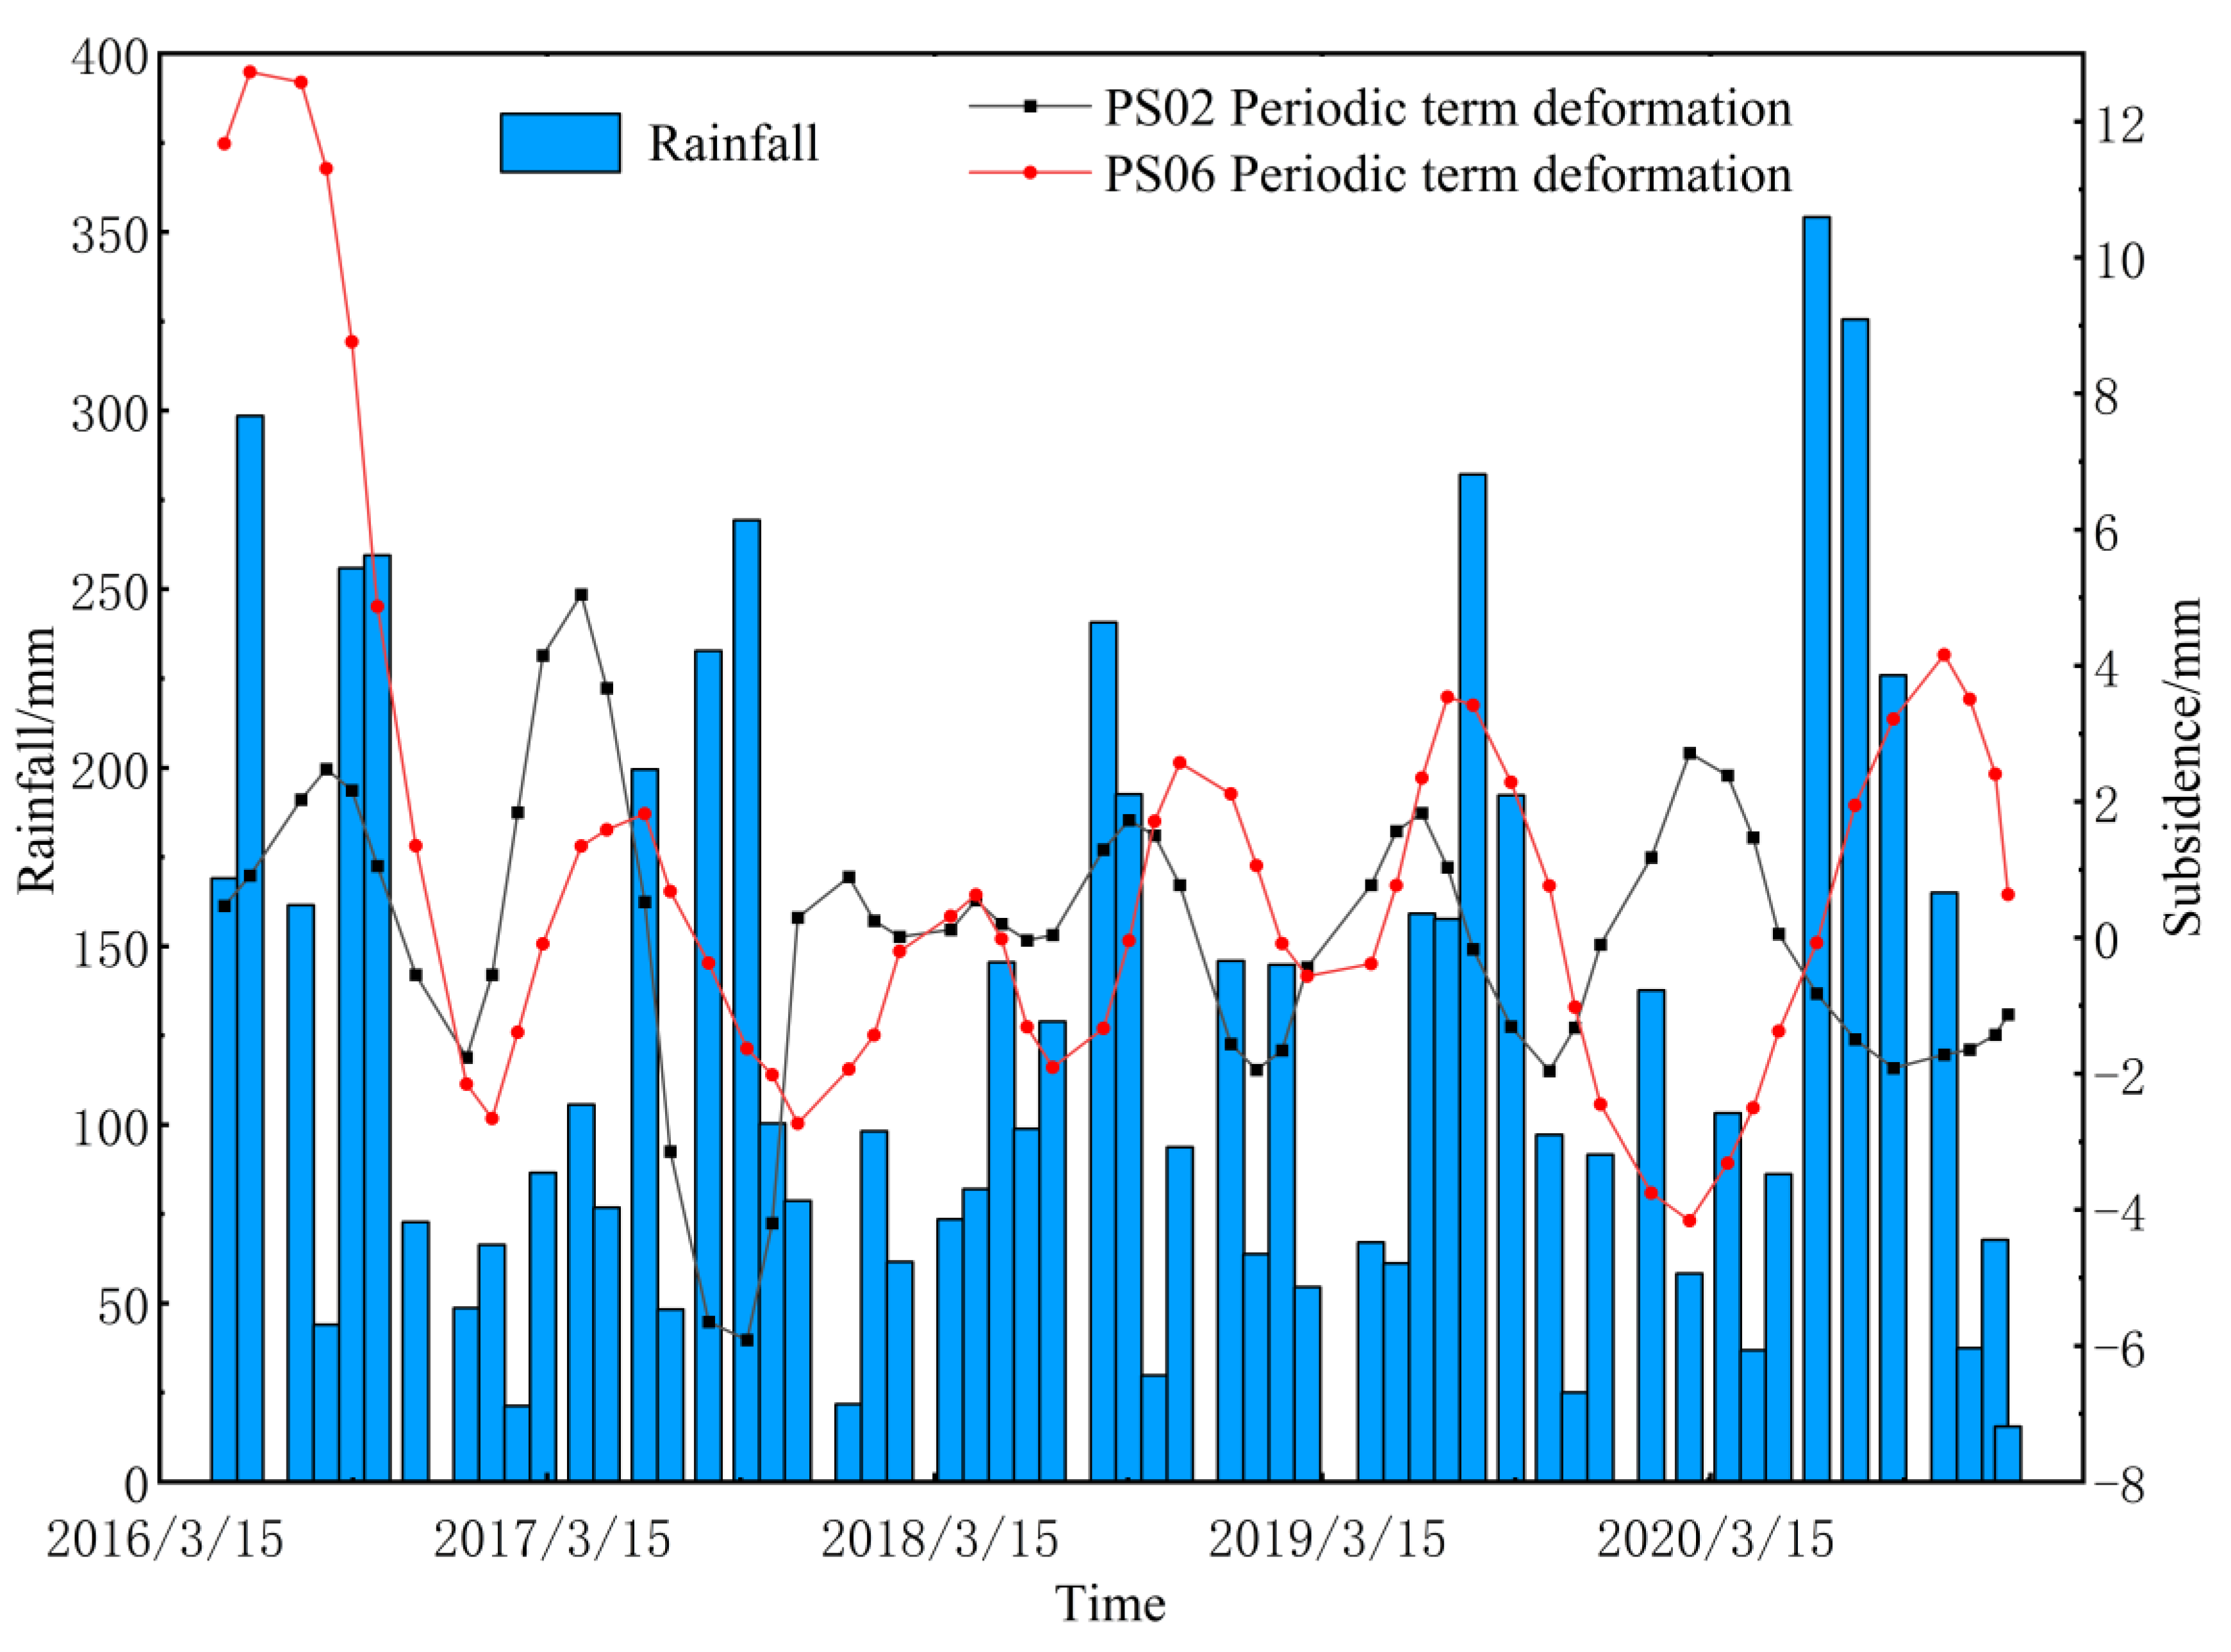
The rainfall infiltration process has a certain process, and due to the evaporation of surface runoff water and other reasons, the infiltration amount is smaller than the rainfall. Therefore, the deformation caused by rainfall has a certain lag. Figure 15 shows the relationship between the periodic deformation of the PS02 and PS06 points and the monthly average rainfall of adjacent meteorological stations. The rainfall data are seasonally distributed, and the rainfall is basically more than 250 mm from June to August every year. However, with the gradual increase in rainfall, the surface deformation shows different states: sometimes uplift, sometimes subsidence, with instability. From the above modeling process, it can be concluded that the correlation between land subsidence in Shanghai and seasonal rainfall in the region is not strong.

4.4.2. Correlation Analysis of Land Subsidence and Human Activities

The acceleration of the Shanghai urbanization process is inseparable from the large-scale construction of infrastructure implementation, and the construction of infrastructure has significantly increased the surface load, changed the land use type, and led to different degrees of surface subsidence. Therefore, the rate of land subsidence can be reflected by the change in land use type.
Based on the land use types covering Shanghai in 2000, 2010, and 2020 (Figure 16), these were divided into six land types: cultivated land, grassland, forest land, water body, construction land, and unused land, with a total area of 4648.07 square kilometers. As is shown in Table 5, the area of cultivated land continues to decrease, and the grassland, woodland, and water bodies are increasing. The proportion of construction land increased from 41.2% to 48.3%, with a total increase of 924.27 square kilometers during the past 20 years. Thus, the construction area of Shanghai is gradually developing from an urban area to a suburban area, meaning that the settlement also transforms from urban to suburban.
Comparing the land use types in 2020 with the land subsidence data from 2016 to 2022, we find that the subsidence mainly occurs in construction land areas. Using data segmentation, there are 13,019 elements in the settlement rate range of −32.0~−10.4 mm/a, accounting for 4% of the total deformation, and the settlement range mainly occurs in the construction land type. There are 2,081,685 elements in the settlement rate range of −6.8~0.9 mm/a, accounting for 69% of the total deformation, and the overall settlement is relatively stable.

5. Risk Assessment

This part describes the results, validation, and discussion of the risk assessment of Shanghai city.

5.1. Risk Assessment Results

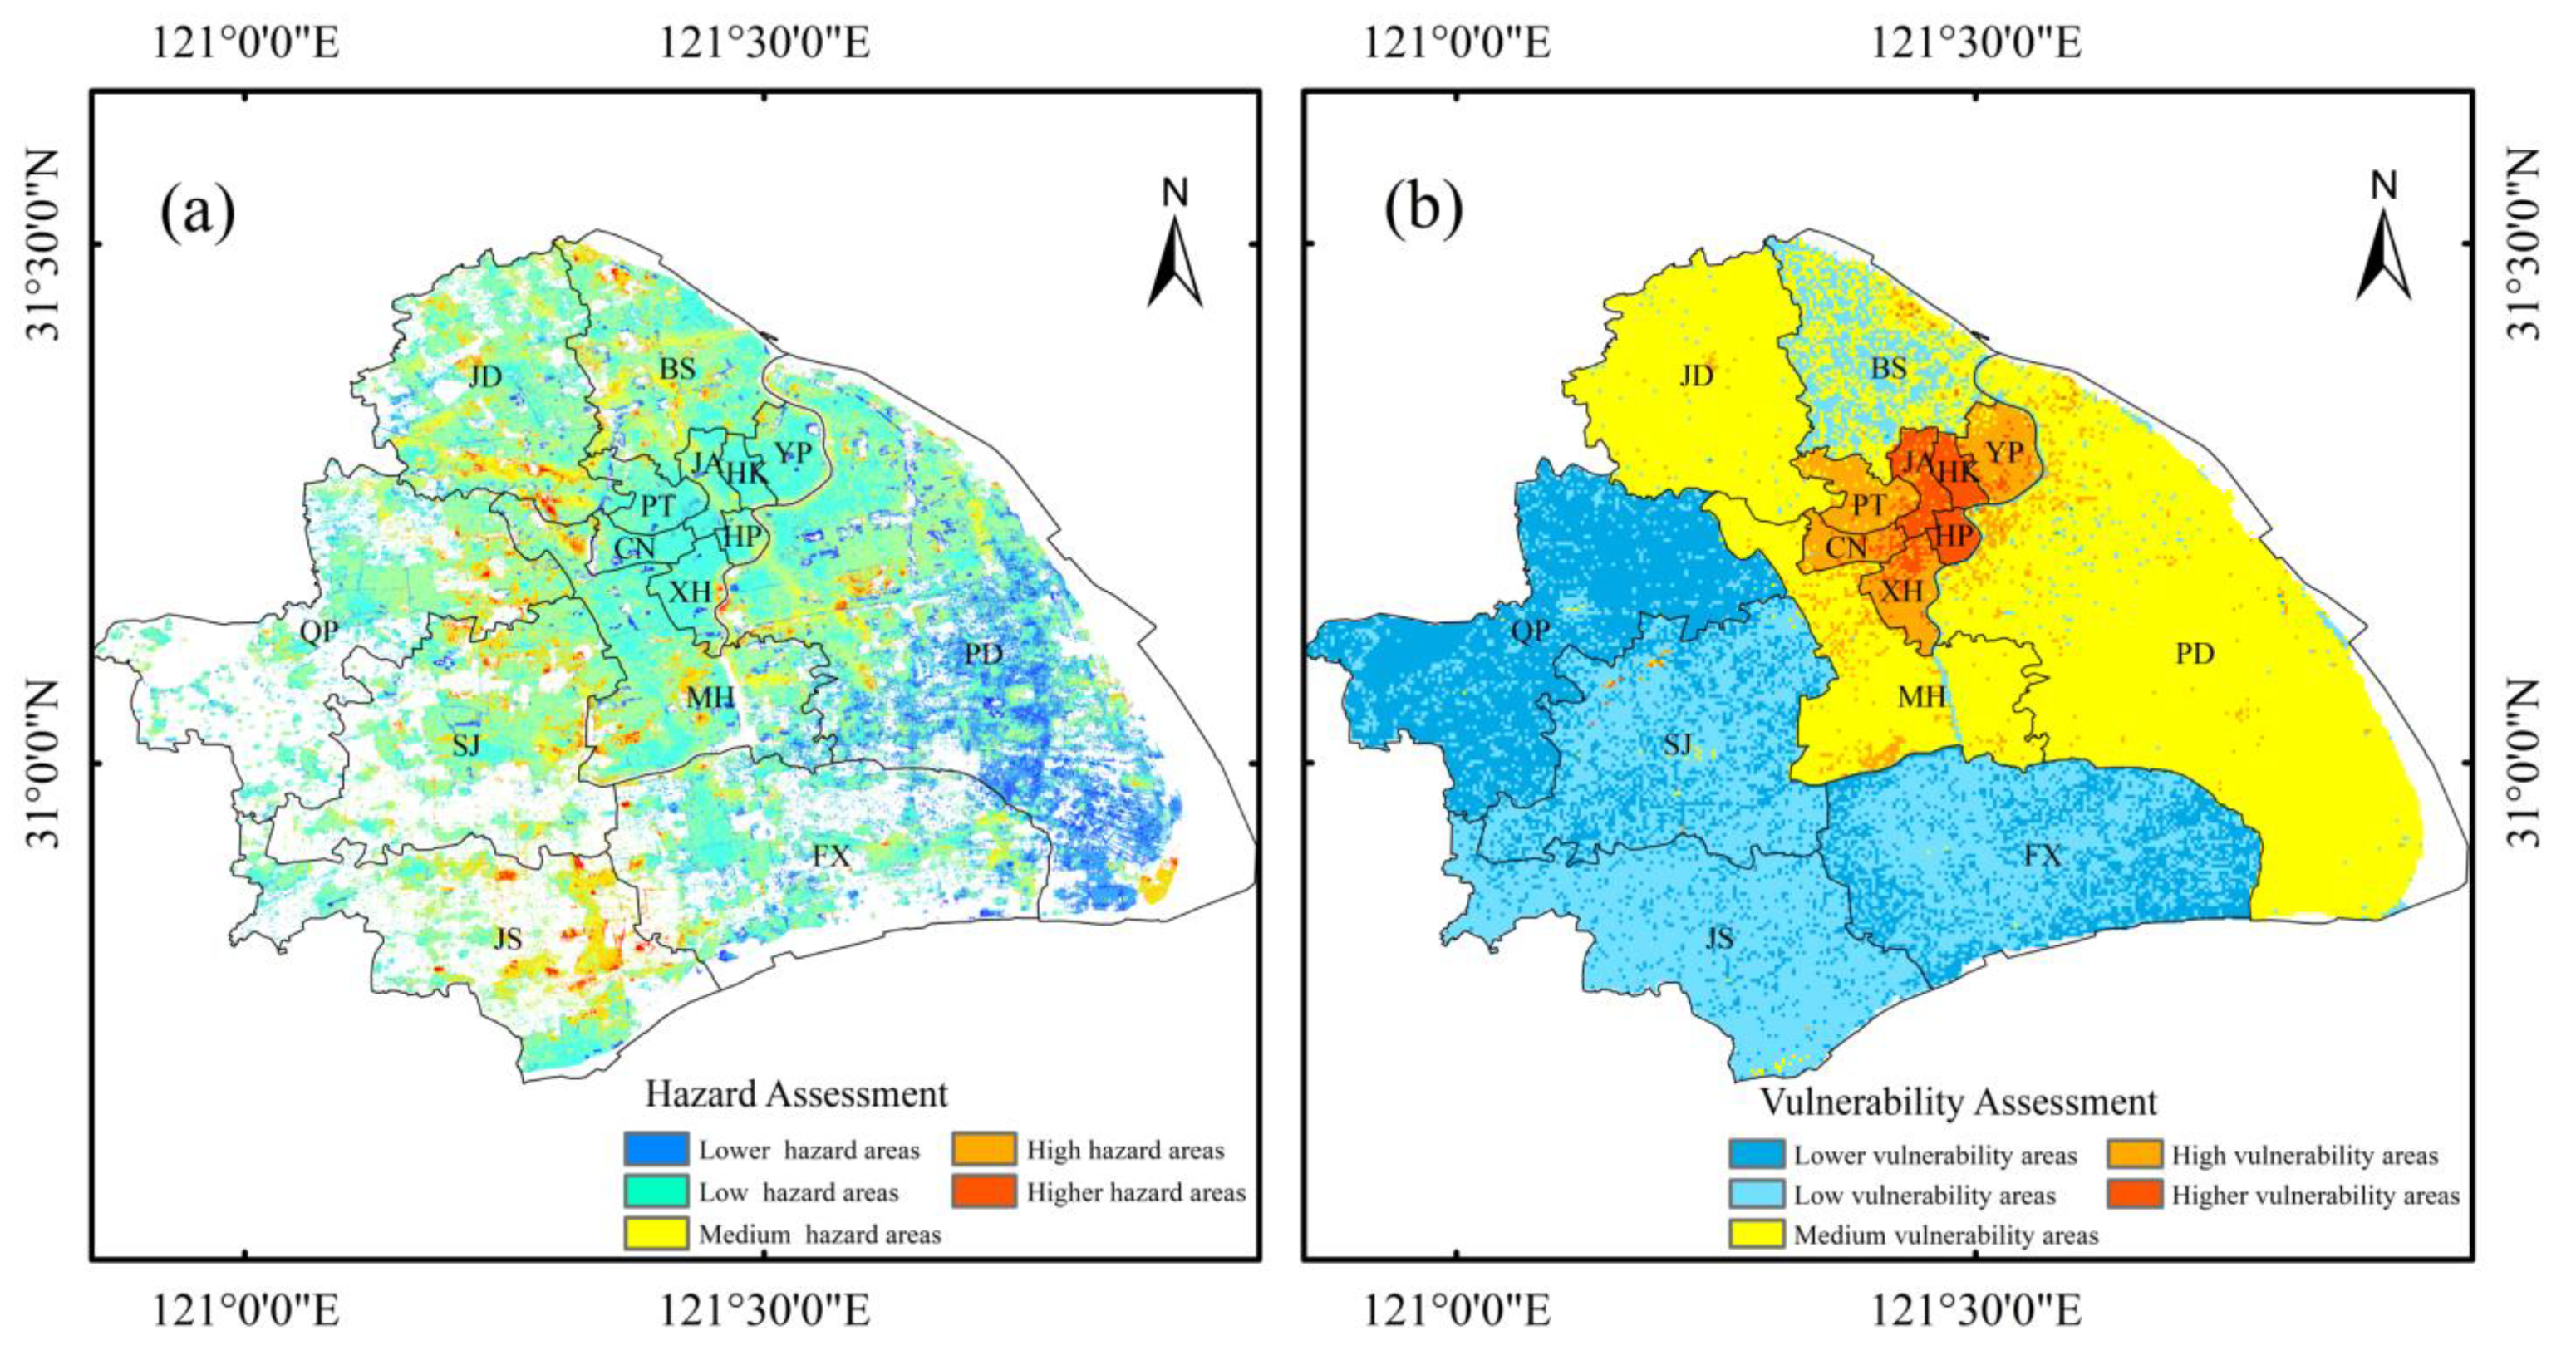
Based on the four factors’ results and corresponding weights, which are the land use type data, the density of the water system area, the land subsidence rate, and the cumulative deformation, we obtain the hazard assessment results (Figure 17a) via the weighted superposition method. Similarly, the vulnerability assessment result is computed by the weight and data of the six factors (Figure 17b).
We obtain the risk assessment results for Shanghai city based on the hazard assessment factors and the vulnerability assessment factors with the entropy method (Figure 18).

5.2. Risk Assessment Result Validation

Compared with the risk assessment results of previous studies, our results have certain similarities. For example, Wang Hanmei [58] used the statistical analysis method to evaluate the risk of land subsidence in Shanghai and concluded that the spatial characteristics of the land subsidence risk in Shanghai are as follows: in terms of the overall composition of the three-level system, that is, from the central city to the higher-risk area, some suburbs are medium-risk, and other suburbs are lower- or low-risk. There are some differences between the results of this previous study and the results of our study due to selecting different evaluation index factors. However, most of the regional levels are the same.
Meanwhile, the Shanghai Provisions on the Administration of Geological Hazard Risk Assessment, published on 29 June 2023 [59], indicated a zoning map of geological hazard risk assessment units, the results of which had obvious similarities with Figure 18, indicating that the results of this paper are reliable.

5.3. Risk Assessment Result Discussion

We discuss three kinds of results in this part, which are the risk assessment results, the hazard assessment results, and the vulnerability assessment results.
The hazard assessment results are described in Figure 17a. They show that the coastal and central areas of Shanghai are more dangerous, and the highest hazard area is located near Drip Lake of PD New Area. From the weight factor analysis in Table 4, we can see that the main reason for the high hazard classification is that the land subsidence in the coastal area is more obvious and thus accounts for a large proportion. The main urban area exhibiting a high hazard is mainly related to the land utilization rate.
The vulnerability assessment results are marked in Figure 17b, which shows that the vulnerability of the HP District is the highest. The population density, GDP per unit area, building density, and road density of the HP District in Shanghai are relatively high, which is more prominent in economic and cultural aspects, so it shows a high vulnerability. The vulnerability of central cities such as the HK District, YP District, JA District, and XH District is also relatively high. This is mainly because the urban area is the main economic development area of Shanghai. Although the economic aggregate of PD New Area in Shanghai is the highest, the vulnerability of PD New Area is lower than that of other main urban areas. The QP District, JS District, and FX District show a low level of vulnerability due to the low population density, road density, building density, and GDP per unit area.
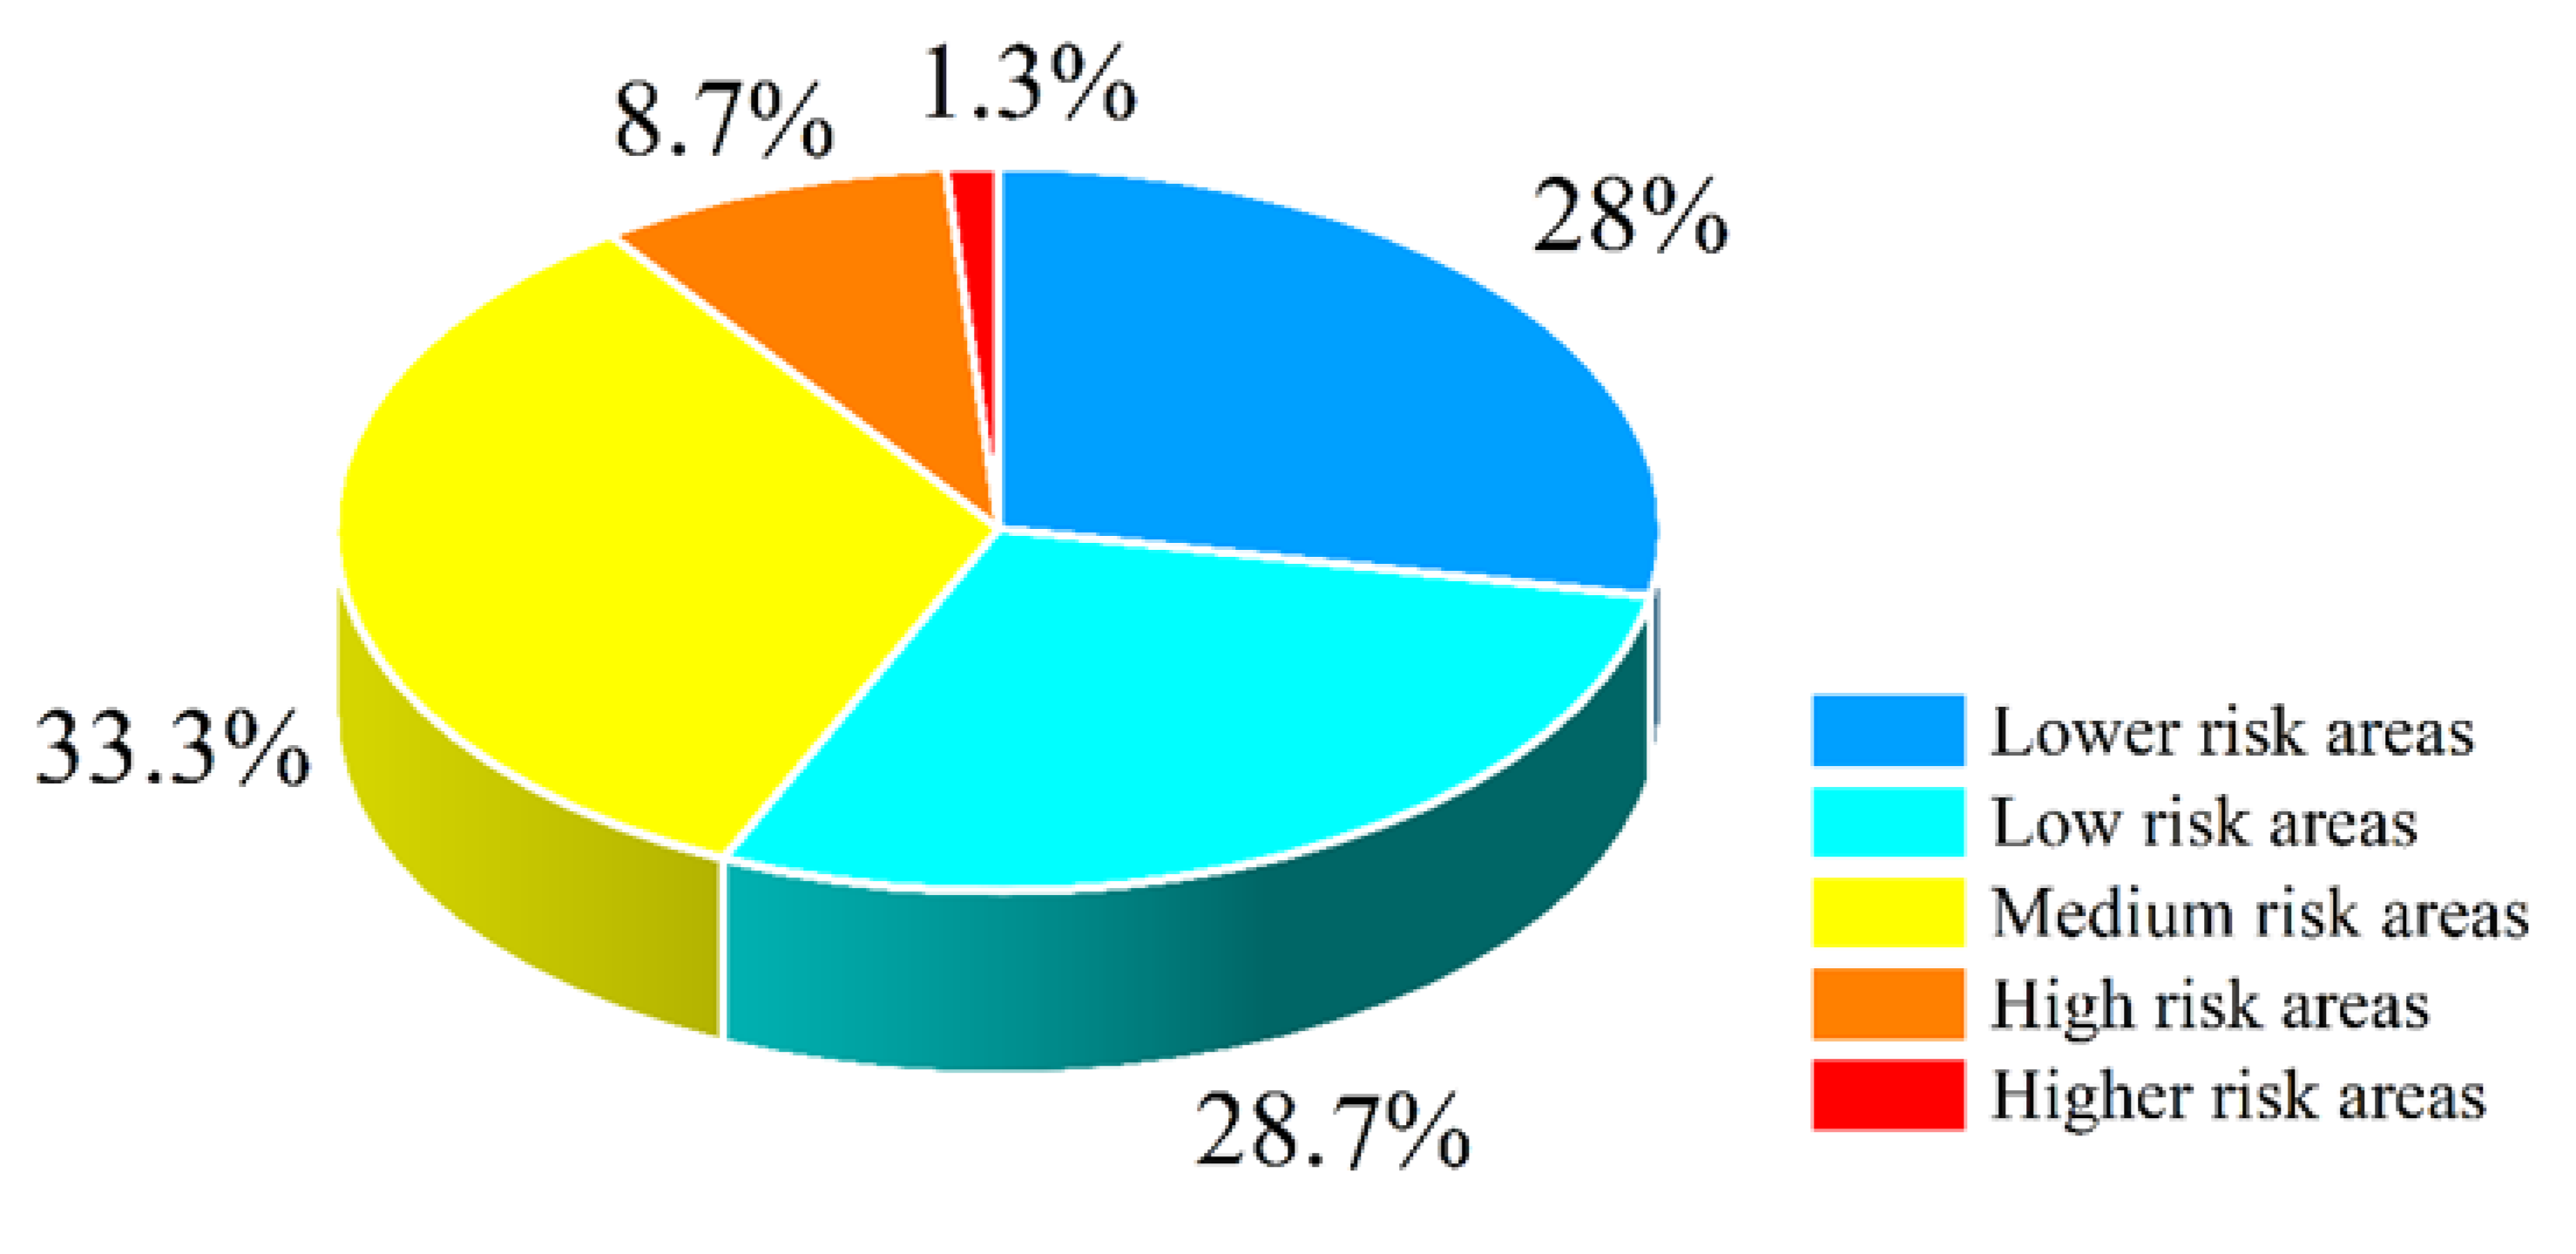
According to the above hazard and vulnerability level evaluation results (Figure 17), we obtain the risk evaluation results by multiplying and superimposing the above two evaluation results and establish the grade division according to Table 4 (which is shown in Figure 18). As is described, the northern part of HP, JA, HK and YP is a higher-risk area and covers areas of 65.47 square kilometers, accounting for 1.27% of the experimental area (Figure 19). The higher-risk areas belong to Shanghai’s economic development zones, both in terms of population density and road density. The building density is relatively high, coupled with the requirements of the main urban area for underground development space, and the infrastructure construction has an impact on the type of land use. The larger the construction area, the more obvious the settlement, and the higher the risk. Due to the terrain and geological reasons, the coastal areas exhibit reclamation phenomena, and thus, the newly formed land has a low consolidation, and it is easy for settlement to occur.

6. Conclusions

This study selects 94 scenes of Sentinel-1A and 9 scenes of TerraSAR image data to obtain the deformation rate field and time series for Shanghai from 2016 to 2022 based on time series InSAR technology. Meanwhile, we obtain the risk assessment for Shanghai city with multiple geoinformation data and time series deformation results. Specifically, the results are summarized as follows:
(1)
We obtain the land surface deformation time series for Shanghai city during the period of 2016–2022 based on Sentinel-1A data. The maximum annual average ground subsidence rate is −37.8 mm/a, and the maximum cumulative deformation is −188.6 mm. The reliability of the experiment is verified by different technologies and data. Six typical settlement area points are mainly distributed in the BS area, MH region, and JS region of PD New Zone and present a linear distribution. Most subway lines occur at different degrees to settlements, among which the Lines 14, 15, 17, and 18 show the most severe settlement with the maximum velocity of −18.2 mm/a.
(2)
The related factors of land subsidence are discussed. The subsidence mainly occurs in engineering construction areas and there is a certain correlation with the subway development. With the construction area of Shanghai gradually developing from an urban area to a suburban area, the settlement also transforms from urban to suburban. Meanwhile, the correlation between land settlement and rainfall is relatively week.
(3)
According to the risk assessment results, the low-risk areas are mainly QP, SJ, FX, PD central, and other areas, while higher-risk areas are HP, YP, HK, and BS, covering areas of 65.47 square kilometers and accounting for 1.27% of the experimental area. The influencing factors of the risk assessment results in the Shanghai area are complex. The results of the risk assessment can provide basic data and a model basis for prevention, monitoring, and early warning of geological disasters in Shanghai and provide an optimization scheme for government decision making. However, we initially discuss risk assessment using ten influencing factors, and there may be more related factors to consider in the future.

Author Contributions

All authors contributed to the manuscript and discussed the results. X.W. and Y.X. put forward the idea for this paper. Y.Y. processed and analyzed the sentinel data and contributed to the manuscript. X.W. provided criticism and revised the manuscript. S.C. modified the time series displacement figures. Y.S. modified the risk assessment of the land subsidence graph. All authors have read and agreed to the published version of the manuscript.

Funding

This research was supported by the Natural Science Foundation of China (42064002, 42374040), the Research Fund for the Doctoral Program of East China University of Technology (No. DHBK2019187), the Science and Technology Research Project of Jiangxi Provincial Department of Education in 2021 (GJJ210722), and the East China University of Technology Graduate Innovation Fund Project (DHYC-202323).

Institutional Review Board Statement

Not applicable.

Informed Consent Statement

Not applicable.

Data Availability Statement

The Sentinl-1data can been download from the website: https://scihub.copernicus.eu/dhus/#/home; the DEM: https://dwtkns.com/srtm30m/; Global land cover data official website and Water system density: http://www.global-landcover.com/; the population density and GDP per unit area: https://tjj.sh.gov.cn/tjnj/20230206/804acea250d44d2187f2e37d2e5d36ba.html; the road density and building density are achieved in https://www.open-streetmap.org/.

Acknowledgments

The authors would like to give thanks for the Sentinel-1A image and satellite precise orbit data provided by ESA, the SRTM DEM data provided by USGS, the rainfall data provided by China National Meteorological Science Data Center, the groundwater-level data provided by the Shanghai Geological Data Information Sharing Platform, and the NPP-VIIRS data provided by NOAA. The authors would also like to thank the anonymous reviewers of Applied Sciences for their thorough review and their instructive comments and suggestions. Finally, thanks go to Huawen Huang for sharing the TerraSAR-X data covering the Shanghai area.

Conflicts of Interest

The authors declare no conflict of interest.

References

  1. Ortega-Guerrero, M.A.; Carrillo-Rivera, J.J. Land Subsidence in Urban Environment; Springer: New York, NY, USA, 2012. [Google Scholar]
  2. Solarski, M.; Machowski, R.; Rzetala, M.; Rzetala, M.A. Hypsometric changes in urban areas resulting from multiple years of mining activity. Sci. Rep. 2022, 12, 2982. [Google Scholar] [CrossRef] [PubMed]
  3. Roland, B.; Hilley, G.; Ferretti, A.; Novali, F. Resolving vertical tectonics in the San Francisco Bay area from Permanent Scatterer InSAR and GPS analysis. Geology 2006, 34, 221–224. [Google Scholar]
  4. Ziyadin, C.; Chabalier, J.; Armijo, R. Coseismic and early post-seismic slip associated with the 1999 Izmit earthquake (Turkey), from SAR interferometry and tectonic field observations. Geophys. J. R. Astron. Soc. 2010, 155, 93–110. [Google Scholar]
  5. Xin, J.; Xiao, G.; Yu, F. The characteristics of surface vertical deformation before the Wenchuan MS 8. 0 earthquake from InSAR. Chin. J. Geophys. 2009, 52, 2739–2745. [Google Scholar]
  6. Hooper, A. A new method for measuring deformation on volcanoes and other natural terrains using InSAR persistent scatterers. Geophys. Res. Lett. 2004, 31. [Google Scholar] [CrossRef]
  7. Bell, J.; Amelung, F.; Ferretti, A.; Bianchi, M.; Novali, F. Permanent scatterer InSAR reveals seasonal and long-term aquifer-system response to groundwater pumping and artificial recharge. Water Resour. Res. 2008, 44. [Google Scholar] [CrossRef]
  8. Chaussard, E.; Amelung, F.; Abidin, H.; Hong, S.H. Sinking Cities in Indonesia: ALOS-PALSAR detects rapid subsidence due to groundwater and gas extraction. Remote Sens. Environ. 2013, 128, 150–161. [Google Scholar] [CrossRef]
  9. Wang, X.; Zhang, Q.; Zhao, C. A Novel Method of generating time-series deformation using InSAR and its Application in Mexico City. Remote Sens. 2018, 10, 1741. [Google Scholar] [CrossRef]
  10. Yang, C.; Zhang, Q.; Zhao, C.; Ji, L.; Zhu, W. Monitoring mine collapse by D-InSAR. Min. Sci. Technol. 2010, 20, 696–700. [Google Scholar] [CrossRef]
  11. Amelung, F.; Galloway, D.L.; Bell, J.W.; Zebker, H.A.; Laczniak, R.J. Sensing the ups and downs of Las Vegas: InSAR reveals structural control of land subsidence and aquifer-system deformation. Geology 1999, 27, 483–486. [Google Scholar] [CrossRef]
  12. Parcharidis, I. Spatio-Temporal Assessment of Land Deformation as a Factor Contributing to Relative Sea Level Rise in Coastal Urban and Natural Protected Areas Using Multi-Source Earth Observation Data. Remote Sens. 2020, 12, 2296. [Google Scholar]
  13. Harnischmacher, S.; Zepp, H. Mining and its impact on the earth surface in the Ruhr District (Germany). Z. Fur Geomorphol. 2014, 58 (Suppl. S3), 3–22. [Google Scholar] [CrossRef]
  14. Liu, J.P.; Li, A.C.; Xu, K.H.; Velozzi, D.M.; Yang, Z.S.; Milliman, J.D.; DeMaster, D.J. Sedimentary features of the yangtze river-derived along-shelf clinoform deposit in the east China sea. Cont. Shelf Res. 2006, 26, 2141–2156. [Google Scholar] [CrossRef]
  15. Wu, P.-C.; Wei, M.M.; D’Hondt, S. Subsidence in Coastal Cities Throughout the World Observed by InSAR. Geophys. Res. Lett. 2022, 49, e2022GL098477. [Google Scholar] [CrossRef]
  16. Cao, A.; Esteban, M.; Valenzuela, V.P.B.; Onuki, M.; Takagi, H.; Thao, N.D.; Tsuchiya, N. Future of Asian Deltaic Megacities under sea level rise and land subsidence: Current adaptation pathways for Tokyo, Jakarta, Manila, and Ho Chi Minh City—ScienceDirect. Curr. Opin. Environ. Sustain. 2021, 50, 87–97. [Google Scholar] [CrossRef]
  17. Dixon, T.H.; Amelung, F.; Ferretti, A.; Novali, F.; Rocca, F.; Dokka, R.; Sella, G.; Kim, S.W.; Wdowinski, S.; Whitman, D. Subsidence and flooding in New Orleans. Nature 2006, 441, 587–588. [Google Scholar] [CrossRef] [PubMed]
  18. Galloway, D.; Jones, R.; Ingebritsen, S. Land Subsidence in the United States; US Geological Survey: Reston, VI, USA, 1999; p. 1182. [Google Scholar]
  19. Herrera-García, G.; Ezquerro, P.; Tomás, R.; Béjar-Pizarro, M.; López-Vinielles, J.; Rossi, M.; Mateos, R.M.; Carreón-Freyre, D.; Lambert, J.; Teatini, P.; et al. Mapping the global threat of land subsidence. Science 2021, 371, 34–36. [Google Scholar] [CrossRef]
  20. Bagheri-Gavkosh, M.; Hosseini, S.M.; Ataie-Ashtiani, B.; Sohani, Y.; Ebrahimian, H.; Morovat, F.; Ashrafi, S. Land subsidence: A global challenge. Sci. Total Environ. 2021, 778, 146–193. [Google Scholar] [CrossRef] [PubMed]
  21. Yang, Y.; Zheng, Y.; Yu, W.; Chen, W.; Weng, D. Deformation monitoring using GNSS-R technology. Adv. Space Res. 2019, 63, 3303–3314. [Google Scholar] [CrossRef]
  22. Babic, L.; Apo, A.; Pribievi, B. Application of 3D Laser Scanning for Deformation Measurement on Industrial Objects. In Proceedings of the FIG Congress 2014, Kuala Lumpur, Malaysia, 16–21 June 2014. [Google Scholar]
  23. Ferretti, A.; Monti-Guarnieri, A.; Prati, C.; Rocca, F.; Massonet, D. Insar Principles-Guidelines for SAR Interferometry Processing and Interpretation. 2007. Available online: https://ui.adsabs.harvard.edu/abs/2007ESATM..19.....F/abstract (accessed on 30 June 2023).
  24. Berardino, P.; Fornaro, G.; Lanari, R. A New Algorithm for Surface Deformation Monitoring Based on Small Baseline Differential SAR Interferograms. IEEE Trans. Geosci. Remote Sens. 2002, 40, 2375–2383. [Google Scholar] [CrossRef]
  25. Nádudvari, Á. Using radar interferometry and SBAS technique to detect surface subsidence relating to coal mining in Upper Silesia from 1993–2000 and 2003–2010. Environ. Socio-Econ. Stud. 2016, 4, 24–34. [Google Scholar] [CrossRef]
  26. Yan, L. Shanghai Land Subsidence History Retrospective: A Discussion on the Understanding of “Water in Use, Earth Must Sink”. Shanghai Geol. 1980, 1, 43–53. [Google Scholar]
  27. Monjoie, A.; Paepe, R.; Yuan, S. Land subsidence in Shanghai (P.R. of China). Bull. Eng. Geol. Environ. 1992, 46, 5–7. [Google Scholar] [CrossRef]
  28. Perissin, D.; Teng, W. Time-series InSAR applications over urban areas in China. IEEE J. Sel. Top. Appl. Earth Obs. Remote Sens. 2001, 4, 92–100. [Google Scholar] [CrossRef]
  29. Chai, J.; Shen, S.; Zhu, H.; Zhang, X. Land subsidence due to groundwater drawdown in Shanghai. Geotechnique 2004, 54, 143–147. [Google Scholar] [CrossRef]
  30. Wei, Z.; Wang, H.; Wu, J. Shanghai Land subsidence and its impact on urban safety. Shanghai Geol. 2009, 109, 34–39. [Google Scholar]
  31. Dai, L. Preventing and Controlling Land Subsidence in Shanghai—Towards More Integrated and Effective Land Use and Ground Water Governance in the Yangtze Delta. Available online: https://ui.adsabs.harvard.edu/abs/2016EGUGA..1816451D/abstract (accessed on 30 June 2023).
  32. Wang, G.; Kang, J.; Yan, G. System Analysis and Numerical Simulation of Land Subsidence in Shanghai. Appl. Mech. Mater. 2013, 241–244, 2578–2582. [Google Scholar] [CrossRef]
  33. Liao, M.; Wang, T. Time-Series InSAR Technology and Application; Science Press: Beijing, China, 2014. [Google Scholar]
  34. Qin, X.; Yang, T. Health diagnosis of major transportation infrastructures in Shanghai Metropolis using High-Resolution persistent scatterer interferometry. Sensors 2017, 17, 2770–2794. [Google Scholar] [CrossRef]
  35. Wang, R.; Yang, T.; Yang, M. Settlement monitoring and attribution analysis of PS-InSAR technology on Shanghai elevated road. J. Wuhan Univ. 2018, 43, 2050–2205. [Google Scholar]
  36. Wang, R.; Yang, T.; Yang, M.; Liao, M.; Lin, J. A safety analysis of elevated highways in Shanghai linked to dynamic load using long-term time-series of InSAR stacks. Remote Sens. 2019, 10, 1133–1142. [Google Scholar] [CrossRef]
  37. Jin, Y.; Zi, H.B. Explorations and Practices of Rail Transit Multi-level network Integration Planning in Shanghai. Transp. Eng. 2020, 5, 7–13. [Google Scholar]
  38. Li, J.; Zhou, L.; Zhu, Z.; Qin, J.; Xian, L.; Zhang, D.; Huang, L. Surface Deformation Mechanism Analysis in Shanghai on TS-InSAR Technology. Remote Sens. 2022, 14, 4368. [Google Scholar] [CrossRef]
  39. Yang, M.; Wang, R.; Liu, M. A PSI targets characterization approach to interpreting surface displacement signals: A case study of the Shanghai metro tunnels. Remote Sens. Environ. 2022, 280, 113–150. [Google Scholar] [CrossRef]
  40. Chen, Y.; Liao, M.; Wu, J.; Li, X.; Xiong, F.; Liu, S.; Feng, Y.; Wang, X. Elastic, and Inelastic Ground Deformation in Shanghai Lingang Area Revealed by Sentinel-1, Leveling, and Groundwater Level Data. Remote Sens. 2022, 14, 2693. [Google Scholar] [CrossRef]
  41. Zhang, J.; Ke, C.; Shen, X.; Lin, J.; Wang, R. Monitoring Land Subsidence along the Subways in Shanghai on the Basis of Time-Series InSAR. Remote Sens. 2023, 15, 908. [Google Scholar] [CrossRef]
  42. Zhang, Z.; Hu, C.; Wu, Z.; Zhang, Z.; Yang, S.; Yang, W. Monitoring and analysis of ground subsidence in Shanghai based on PS-InSAR and SBAS-InSAR technologies. Sci. Rep. 2023, 13, 8031. [Google Scholar] [CrossRef] [PubMed]
  43. The Implementation Plan of Shanghai Urban Geology and Mineral Resources Master Plan (2021–2025). Available online: https://www.shanghai.gov.cn/gwk/search/content/89f0095a3e5c4234b27c252d75274b32 (accessed on 30 June 2023).
  44. Shi, Y.S.; Shi, D.H.; Cao, X.Y. Impacting factors and temporal and spatial differentiation of land subsidence in shanghai. Sustainability 2018, 10, 3146. [Google Scholar] [CrossRef]
  45. Zhang, Y.; Liu, Y.; Liu, Y.; Liu, Y.; Chen, Y.; Wang, Z. Spatial-temproal variation characteristics and geographic detection mechanism of land subsidence in Wuhan city from 2007 to 2019. Geomat. Info. Sci. Wuhan Univ 2021, 47, 1486–1497. [Google Scholar]
  46. Chong, M.; Jie, F. Study on Flood Control Risk Management for Reservoir Earth Dam. In Proceedings of the 2009 1st International Conference on Information Science and Engineering (ICISE 2009), Nanjing, China, 26–28 December 2009; pp. 4518–4521. [Google Scholar]
  47. Zhang, X. Study on the risk assessment of land subsidence in Beijing plain based on 3D modeling. S.N. Water Transf. Water Sci. Tech. 2017, 15, 126–130. [Google Scholar]
  48. Nikhil, S.; Danumah, J.H.; Saha, S.; Prasad, M.K.; Rajaneesh, A.; Mammen, P.C.; Ajin, R.S.; Kuriakose, S.L. Correction to: Application of GIS and AHP method in forest fire risk zone mapping: A study of the Parambikulam Tiger Reserve, Kerala, India. J. Geovis. Spat. Anal. 2021, 5, 15. [Google Scholar] [CrossRef]
  49. Li, S.; Xu, W.; Li, Z. Review of the SBAS InSAR Time-series algorithms, applications, and challenges. Geod. Geodyn. 2022, 13, 114–126. [Google Scholar] [CrossRef]
  50. Chen, Q.; Dam, T.V.; Sneeuw, N.; Collilieux, X.; Weigelt, M.; Rebischung, P. Singular spectrum analysis for modeling seasonal signals from GPS time series. J. Geodyn. 2013, 72, 25–35. [Google Scholar] [CrossRef]
  51. Zhu, W.; Dou, H.; Yin, N.; Cheng, Y.; Zhang, S.; Zhang, Q. Deformation characteristics analysis of the expansive soil slope by integrating of InSAR and SSA techniques: A case study of the South-to-North Water Diversion Project. Acta Geod. Cartogr. Sin. 2022, 51, 2083–2092. [Google Scholar]
  52. Chen, W.; Gong, H.; Chen, B.; Liu, K. Spatioevolution of land subsidence around a subway using InSAR time-series and the entropy method. J. GISci. Remote Sens. 2016, 54, 78–94. [Google Scholar] [CrossRef]
  53. Xie, J.R.; Gong, H.; Chen, B.; Zhu, F.; Duan, G. Stability Analysis of Land Subsidence Based on PSInSAR Technology and Cloud Model. Geogr. Geo-Inform. Sci. 2015, 31, 49–53. (In Chinese) [Google Scholar]
  54. Wei, Z.; Zhai, G.; Yan, X. Shanghai Urban Geology; Geology Press: Beijing, China, 2010; p. 37. [Google Scholar]
  55. Environmental Impact Report of Shanghai Urban Geology and Mineral Resources Master Plan (2021–2025). Available online: https://ghzyj.sh.gov.cn/dczj/20220119/b0777f8ddd9c452e87b302954abc4996.html (accessed on 30 June 2023).
  56. Zhang, Z.; Zhang, S.; Hu, C. Hazard assessment model of ground subsidence coupling AHP, RS and GIS—A case study of Shanghai. Gondwana Res. 2023, 117, 344–362. [Google Scholar] [CrossRef]
  57. Rateb, A.; Hermas, E. The 2018 long rainy season in Kenya: Hydrological changes and correlated land subsidence. Remote Sens. 2020, 12, 1390. [Google Scholar] [CrossRef]
  58. Wang, H.; Wang, Y.; Jiao, X.; Qian, G. Risk management of land subsidence in Shanghai. Desalination Water Treat. 2014, 52, 1122–1129. [Google Scholar] [CrossRef]
  59. Shanghai Provisions on the Administration of Geological Hazard Risk Assessment. 2023. Available online: http://law168.com.cn/doc/view?id=182351 (accessed on 30 June 2023).
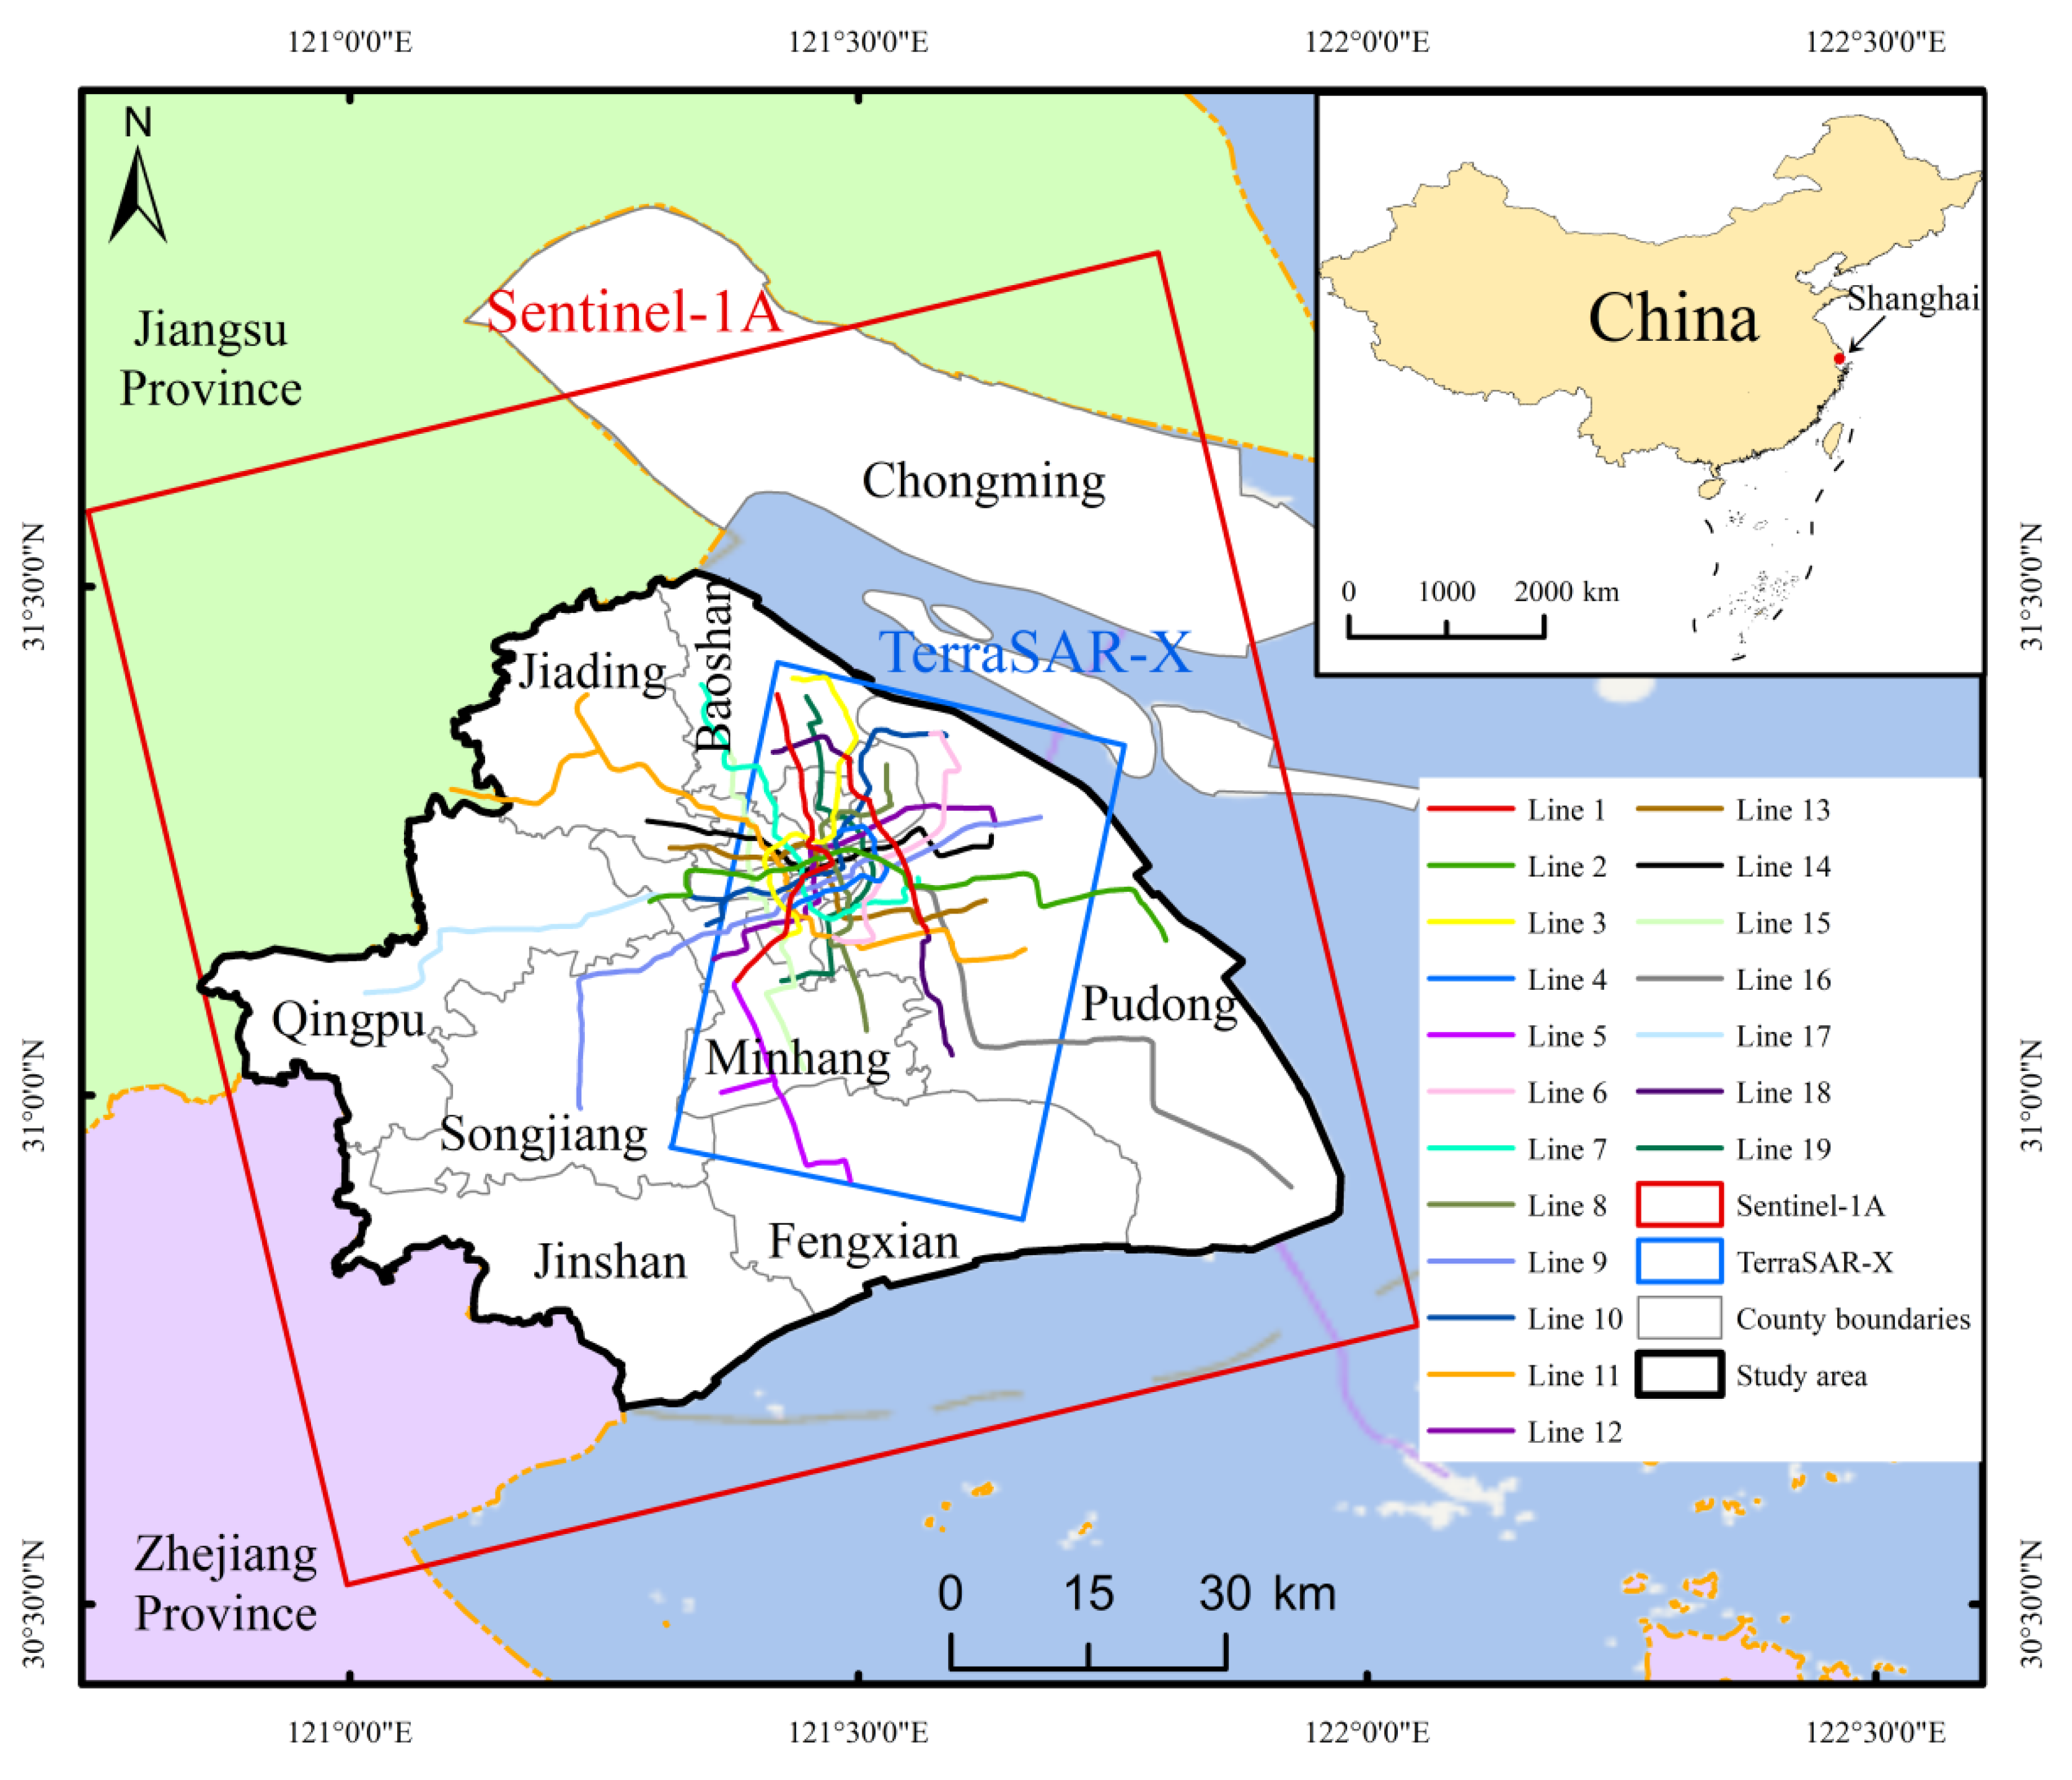
Figure 1. The scope and data of the experimental study. The experimental data cover 15 districts of Shanghai city.
Applsci 13 12091 g001
Figure 2. The spatiotemporal baseline map of Sentinel-1A spanning between 2016 and 2022.
Applsci 13 12091 g002
Figure 3. SBAS-InSAR data processing process.
Applsci 13 12091 g003
Figure 4. Factors related to risk assessment of land subsidence.
Applsci 13 12091 g004
Figure 5. Distribution of hazard factors of land subsidence in Shanghai city: (a) is the land use type of the study area; (b) describes the water density; (c) represents the total subsidence during previous 7 years; and (d) marks the vertical velocity.
Applsci 13 12091 g005
Figure 6. Distribution of land subsidence vulnerability factors in Shanghai city: (a) is the population density; (b) shows the GDP; (c) describes road density with unit of km2; (d) shows the building density of administrative areas; (e) marks the digital elevation model; and (f) represents the green space density.
Applsci 13 12091 g006
Figure 7. The average annual ground displacement (a) and the standard error (b). The purple triangles in the left graph represent selected marked points in the main subsidence areas.
Applsci 13 12091 g007
Figure 8. The time series accumulative displacement of the study area between 15 May 2016 and 22 December 2022 (unit: millimeter).
Applsci 13 12091 g008
Figure 9. The average annual displacement (a) and standard deviation for Sentinel-1A and TerraSAR data during the year 2020~2021 (b); the standard deviation of the annual mean deformation rate is respectively shown in (c,d) for Sentinel-1 and TerraSAR data. The red curves mark the fitted gaussian curves.
Applsci 13 12091 g009
Figure 10. (a) StaMPS annual average deformation rate; (b) the difference between annual deformation results obtained via StaMPS and SBAS-InSAR technologies.
Applsci 13 12091 g010
Figure 11. The position and accumulation displacement of characteristic points (the position of points is shown in Figure 7). The graphs marked by (A)–(F) represent the deformation condition of PS01~PS06, the graphs marked by (a)–(f) is the corresponding optical images.
Applsci 13 12091 g011
Figure 12. The accumulative displacement of characteristic points (the position of points is shown in Figure 7).
Applsci 13 12091 g012
Figure 13. Distribution of annual vertical settlement along metro lines in Shanghai; (a) shows the subway distribution through significant settlement areas, and (b) is the relatively stable subway distribution.
Applsci 13 12091 g013
Figure 14. The time series deformation decomposition and reconstruction of PS02 and PS03 with the SSA method; (a,b) are the time series deformation and fitting trend term of PS02 and PS06, respectively, and (c,d) are the periodic term deformation of PS02 and PS06, respectively.
Applsci 13 12091 g014
Figure 15. The relationship between periodic displacement and monthly average rainfall of PS02 and PS06.
Applsci 13 12091 g015
Figure 16. Distribution of land use types in Shanghai city during the past 20 years; (ac) are the land types in 2000, 2010, and 2020, respectively.
Applsci 13 12091 g016
Figure 17. Distribution map of hazard (a) and vulnerability assessment (b) of land subsidence in Shanghai city.
Applsci 13 12091 g017
Figure 18. The distribution map of land subsidence risk in Shanghai.
Applsci 13 12091 g018
Figure 19. Proportion of land subsidence risk level.
Applsci 13 12091 g019
Table 1. Characteristics of the InSAR data.
ParametersSentinel-1ATerraSAR-X
WavelengthCX
Polarization modeVVVV
Orbit directionAscendingDescending
Incidence39.28°42.8°
Image number949
Table 2. Other data sources.
Hazard IndicatorsData SourcesVulnerability IndicatorsData Sources
Type of land useGlobal land cover data official website (http://www.globallandcover.com/, accessed on 30 June 2023)Population densityShanghai Statistical Yearbook 2022
Water system densityGDP per unit area
Vertical velocitySBAS-InSAR resultsGreen space density
Road densityOpenStreet’s official website (https://www.openstreetmap.org/, accessed on 30 June 2023)
SubsidenceBuilding density
Table 3. Grade division table.
Type0–0.20.21–0.40.41–0.60.61–0.80.81–1
Risk levelLowerLowMediumHighHigher
Table 4. Entropy weight of risk assessment index.
First-Grade IndexSecond-Grade IndexSecondary Index WeightComprehensive Weight
HazardLand use type0.23810.1071
Drainage density0.19190.0854
Subsidence0.34260.2188
Vertical velocity0.22740.1424
VulnerabilityPopulation density0.22030.0651
GDP per unit0.20590.0781
Road density0.12730.092
Building density0.15820.1302
Green space density0.13010.0379
Ground elevation0.15820.043
Table 5. Land use change area/km2. The up arrow in column of “change” represents increase and the down arrow marks decrease.
Land Type200020102020Change
Cultivated land3118.522456.502032.91
Grassland1.676.1769.24
Forest land13.6813.9672.23
Water body192.49189.96222.54
Construction land1320.901981.312245.17
Unused land0.810.185.99
Disclaimer/Publisher’s Note: The statements, opinions and data contained in all publications are solely those of the individual author(s) and contributor(s) and not of MDPI and/or the editor(s). MDPI and/or the editor(s) disclaim responsibility for any injury to people or property resulting from any ideas, methods, instructions or products referred to in the content.