Article

Deformation and Stress Analysis of Pile-Supported Immersed Tunnels under Seismic Loads

1
School of Civil, Architecture and Environment, Hubei University of Technology, Wuhan 430068, China
2
Key Laboratory of Concrete and Prestressed Concrete Structures of Ministry of Education, School of Civil Engineering, Southeast University, Nanjing 210096, China
*
Author to whom correspondence should be addressed.
Appl. Sci. 2023, 13(22), 12092; https://doi.org/10.3390/app132212092
Submission received: 14 September 2023 / Revised: 25 October 2023 / Accepted: 2 November 2023 / Published: 7 November 2023

Abstract

:
The stress and deformation of pile-supported immersed tunnels under seismic loads is a critical issue in tunnel design. This paper utilizes ABAQUS (version 2020) finite element software to analyze the seismic load response of the sand compaction pile-immersed tunnel–seawater pressure (SIS) system, which is verified by a physical model. The study shows that the suppression effect of the seawater on the vertical frequency of the tunnel increases with depth. When the replacement rate of the piled foundation reaches 50%, the deformation of the tunnel “H-shaped” structures increases, which also changes the vertical frequency of the tunnel. However, the presence of the suppression effect causes resonance injury at the far end of the tunnel from the earthquake source, resulting in a shift of the peak stress point. It was also found that seawater pressure affects the resistance–deflection (p-y) at the tip of the pile more than at the end of the pile. The slenderness ratio (γ) of the pile affects the p-y value at the end of the pile more than at the tip of the pile. The connection between the piled foundation and the tunnel is most stable when γ is in the range of 9.25 to 15.

1. Introduction

Immersed tunneling is an engineering technology used to construct tunnels underwater. There have been numerous cases of the application of immersed tunnels for water resources development and energy transportation [1,2,3]. Horizontal and vertical loads acting on the tunnel structure by seismic waves cause deformation, stress concentration, and possible injury to the tunnel structure. It is important to analyze the fundamental frequency of the tunnel structure and the interaction with the frequency of seismic waves when analyzing the structural response of immersed tunnels [4,5], the nature of the undersea foundation geological layer, and the seismic wave load characteristics. Therefore, great attention should be paid to the dynamic response to earthquakes under tunnel foundation–seawater interaction [6,7].
When seismic waves are transmitted to the seabed and seawater, the effect of the presence of seawater on the propagation of seismic waves and energy absorption leads to a change in the vertical frequency of the structure, which attenuates the amplitude of seismic waves during propagation [8,9]. The ability of the seabed to enhance the seismic defenses of tunnels has been demonstrated when seismic SV waves are incident at different angles on the multilayered seabed [10], and the single-layered seabed [11],. The ambient temperature of seawater affects the tunnel stresses during earthquakes [12]. This shows the extent of the seismic response of immersed tunnel-piled foundations is related to seawater. The effect of seawater changing the vertical frequency of the tunnel on the stress and deformation needs to be further investigated.
Sand compaction pile (SCP) can effectively improve the rigidity and densification of the seabed and increase the bearing capacity and stability, which is well evidenced in existing studies [13,14,15,16,17,18]. Kiani et al. [19], Hossain et al. [20], and Heo et al. [21] showed the relationship between the SCP arrangement and the deformation of the foundation. Moreover, the piles can significantly improve the lateral bearing capacity of the foundation and effectively increase the foundation densification and the effective stress of the soil around the piles [22,23,24,25]. A large number of analysis methods show that the pile–soil interaction under dynamic loads is similar to that of Euler–Bernoulli beams and Pasternak foundations [26,27,28,29,30,31]. However, the relationship between the injury at the piled foundation–tunnel connection and the replacement rate and slenderness ratio of the piled foundation in seismic analysis is not clear.
In this paper, seismic effects are simulated by time history analysis within a sand compaction pile-immersed tunnel–seawater pressure (SIS) system. Numerical simulations (ABAQUS version 2020) were conducted to investigate pile-soil interaction, the connection between foundation piles and the tunnel, as well as the stress and deformation of the tunnel wall. Furthermore, the numerical simulations are validated by the established physical model experiment of the SIS system. The key influencing factors of seawater pressure, direction of the tunnel, replacement rate of the piled foundation, and slenderness ratio of the pile are parametrically analyzed. The optimum replacement rate and range of the slenderness ratio of the pile are determined. The positive and negative effects of seawater pressure on the seismic performance of the tunnel are evaluated. A more detailed basis for the seismic design of pile-supported immersed tube tunnels is provided.

2. Methodology

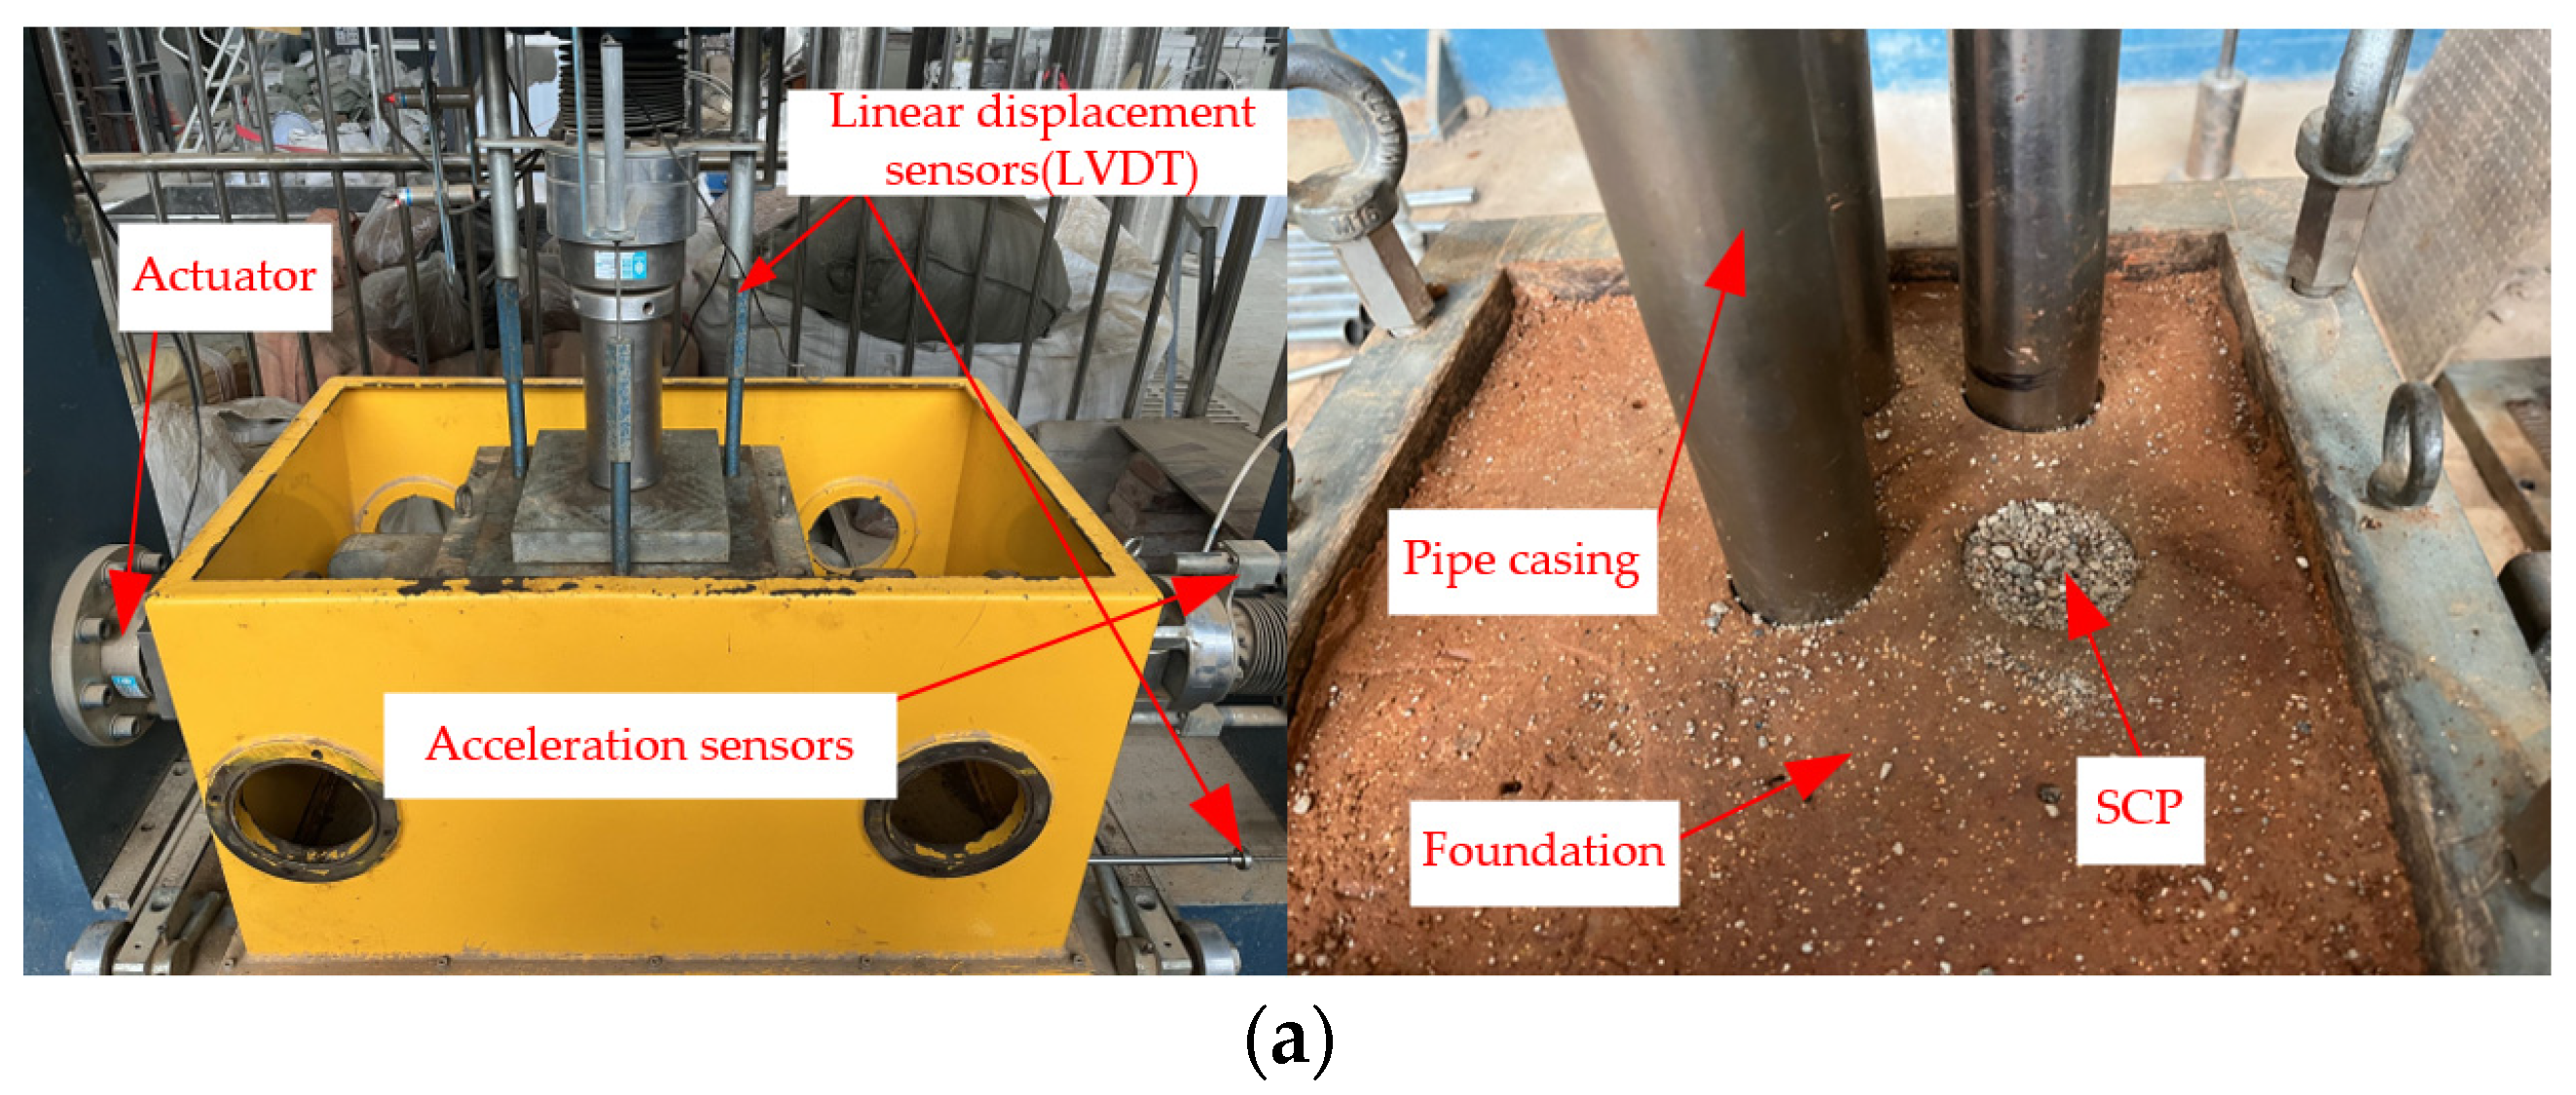
2.1. Physical Modelling Overview

The size of the physical model was 0.3 × 0.3 × 0.5 m to restore the change of pore pressure and deformation characteristics of the seabed. The physical experimental soil samples were soft clay mixtures with polystyrene (EPS) particles with a particle size of 0.3 mm under optimal water content conditions [32]. Based on the volume ratio, three types of proportioning were carried out: 1/9, 1/8, and 1/7. Figure 1a gradation curves show the results of sieve experiments of dry soil and EPS mixtures at three volume ratios, with the most uniform gradation curve at the 1/8 volume ratio. Based on Figure 1b,c, the 1/8 volume ratio mixture did not show multiple injury paths or penetrating injury paths and had the largest deformation modulus. The volume ratio of EPS and soft soil was determined to be 1/8.

2.1.1. Materials and Similarity Principle

To determine the sensitivity of different replacement rates and sand pile arrangement to the seismic effects on the seabed. The pipe diameters of 48 mm, 32 mm, and 20 mm casing were used to be divided into six layers of compaction. The dimensions of the experimental equipment and sensors are shown in Figure 2a. The model experiment scaling is shown in Table 1, and all parameters satisfy the similarity principle except time and frequency. The maximum pile spacing of the three arrangements of SCP are 0.1 m, 0.077 m, and 0.1 m, and the depth of burial is 0.3 m. The outer edge of the outermost pile is 0.1 m from the boundary of the foundation. The angles of the pile arrangements are 90°, 45°, and 60°, respectively, which are shown in Figure 2b.

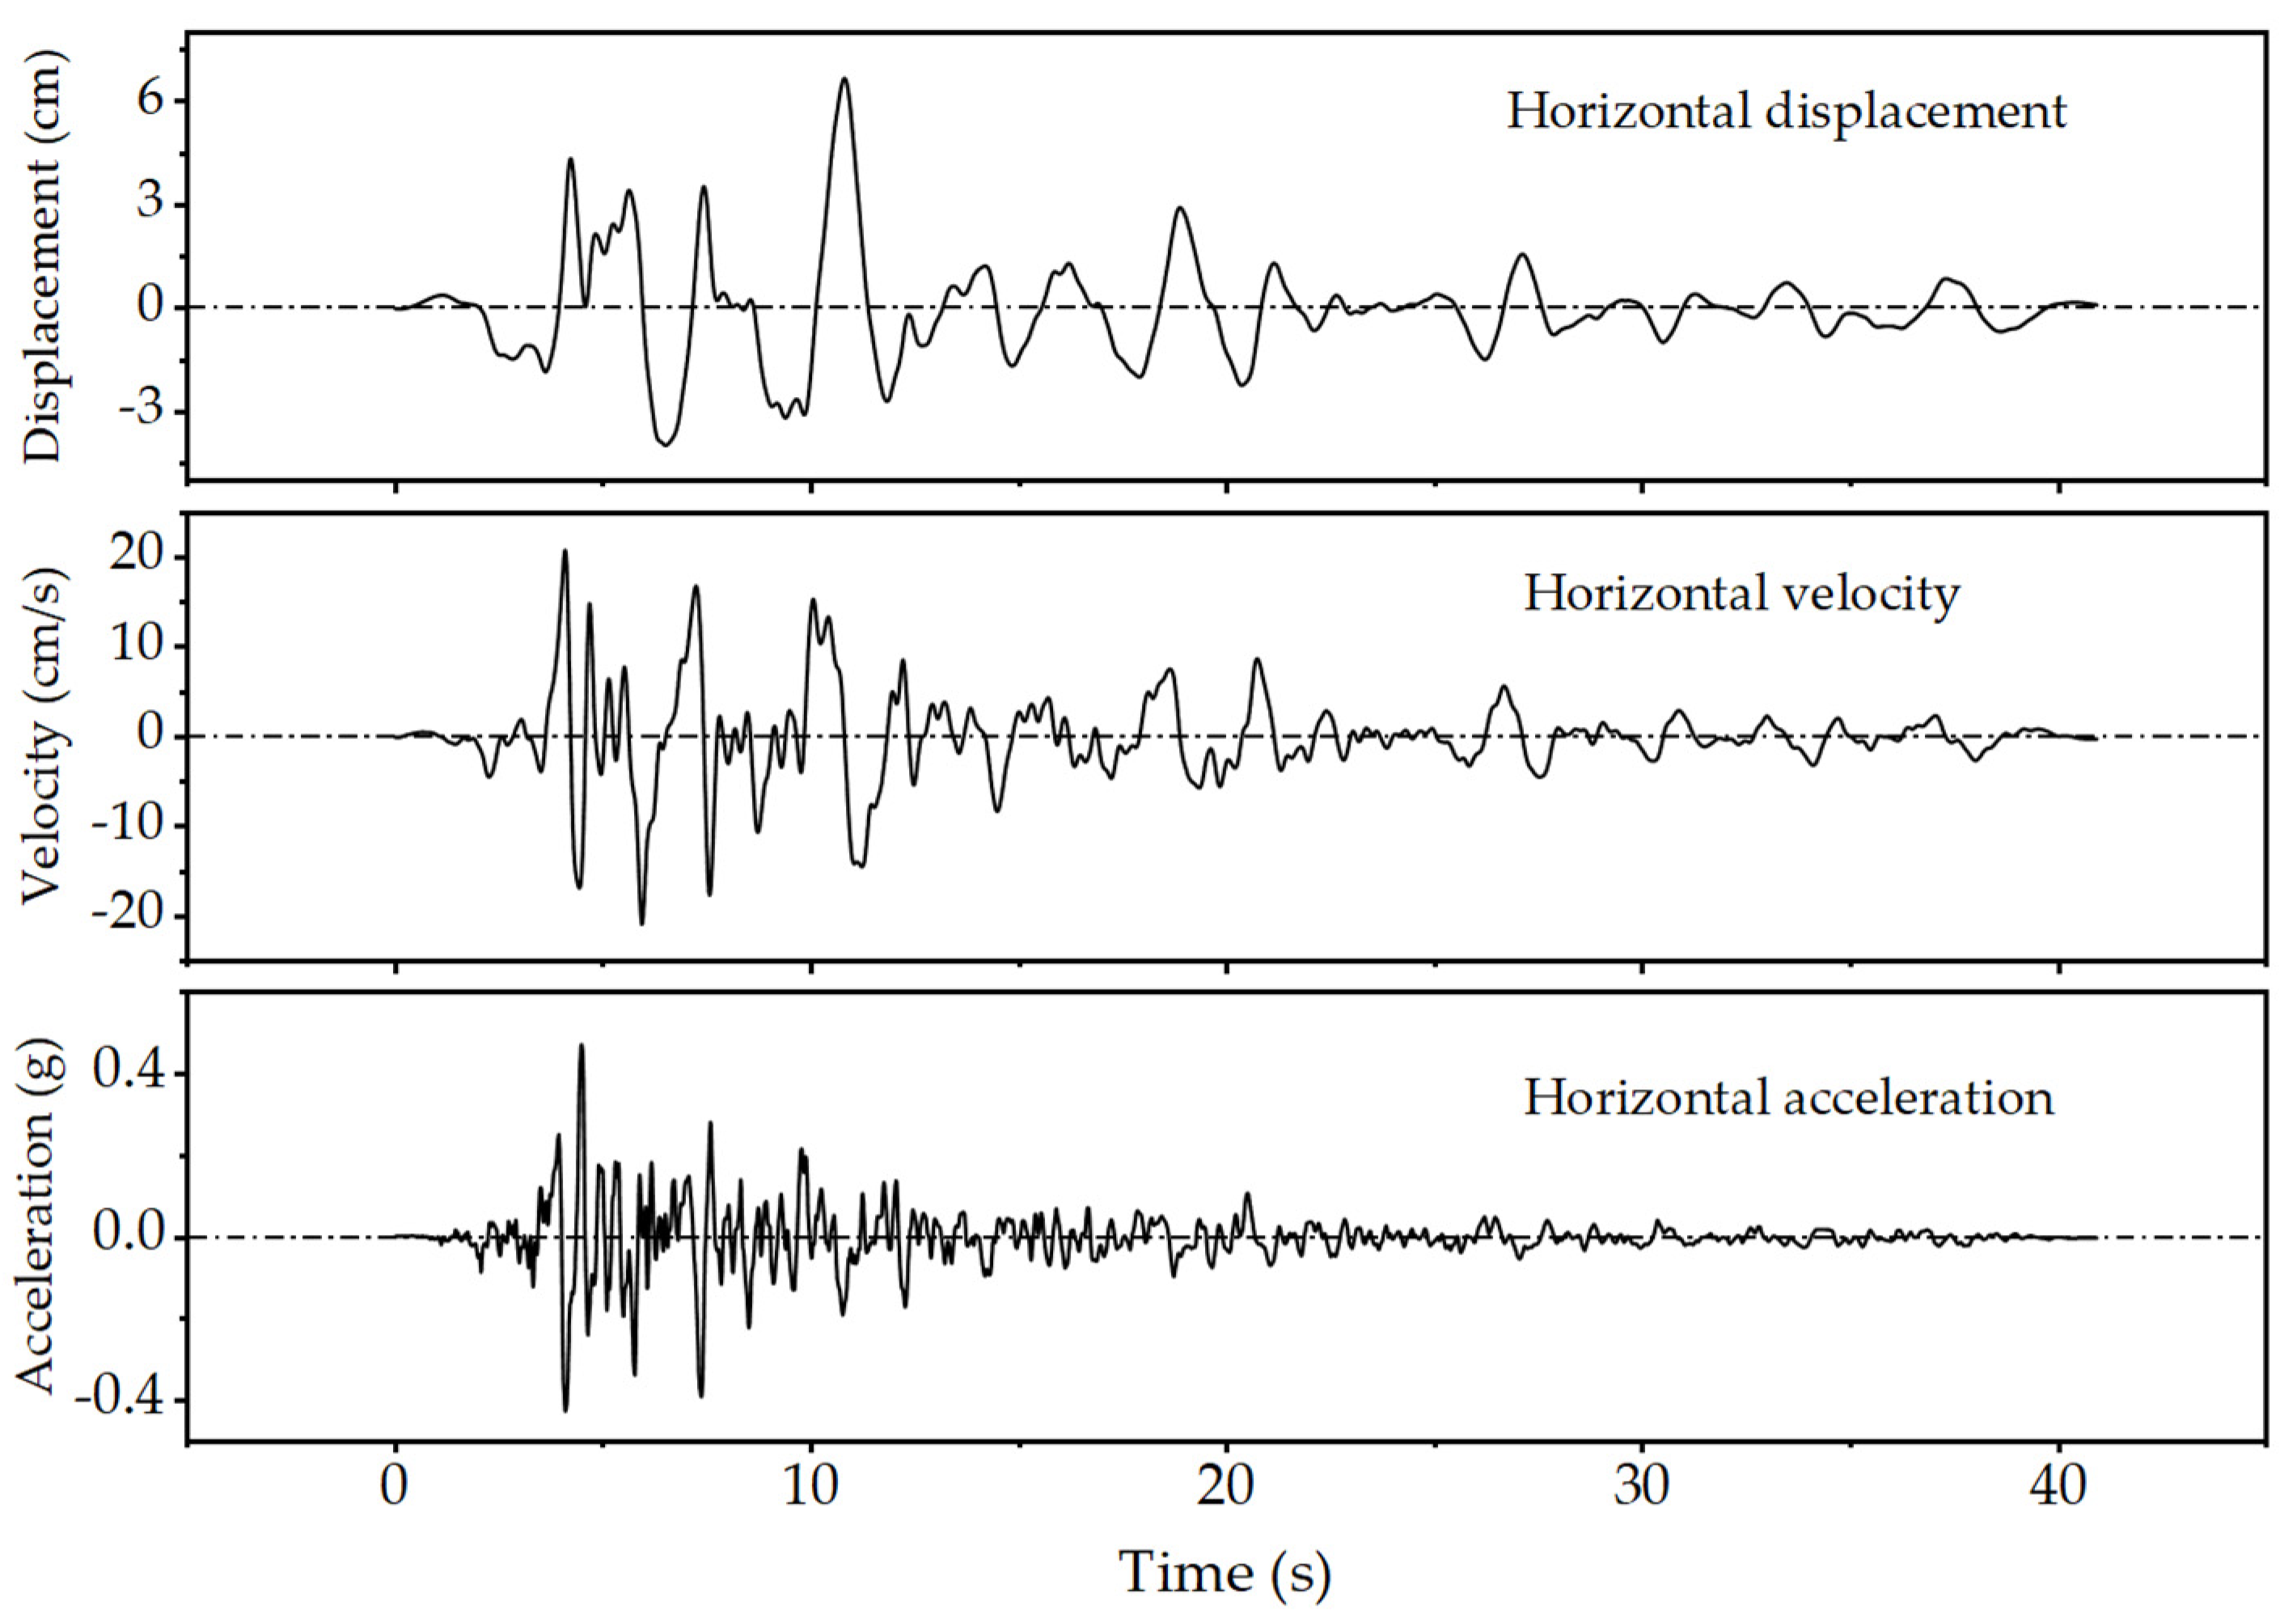
2.1.2. Overburden and Seismic Waves

The extent of seismic influence on the SIS system is greater when SV waves are incident vertically in the supercritical angle case. The maximum vertical acceleration of the seismic wave increases at this time. The motion of the foundation surface is essentially the same regardless of the presence or absence of the overlying fluid. The influence of sea waves on the seismic response results is very small [11]. Therefore, the effect of seawater on seismic waves is not considered in this study, and seawater is equivalent to the overlying pressure.
It is assumed that the tunnel is in a straight line when it is subjected to upward movement by buoyancy, and the frictional fs resisting the uplift of the overburden and the tunnel is provided by the lateral earth pressure. The safety coefficient of the immersed tunnel ω = (W + f + G)/Ffloat ≥ 1.1 meets the design requirements, then the minimum thickness of the backfill layer is h = f (Ffloat, G, W, fs), where W is the gravity in the overburden layer, G is the gravity of the immersed tunnel, and Ffloat is the buoyancy of the structure.
The physical model seismic waves were selected from PEER Ground Motion Database-NGA west2, and data from the Keslin Seismic Observatory in Greece were analyzed in the time history. The seismic intensity of 7.5, characteristic period of 0.40 s, damping ratio of 0.05, and peak acceleration of 0.05 g are shown in Figure 3.

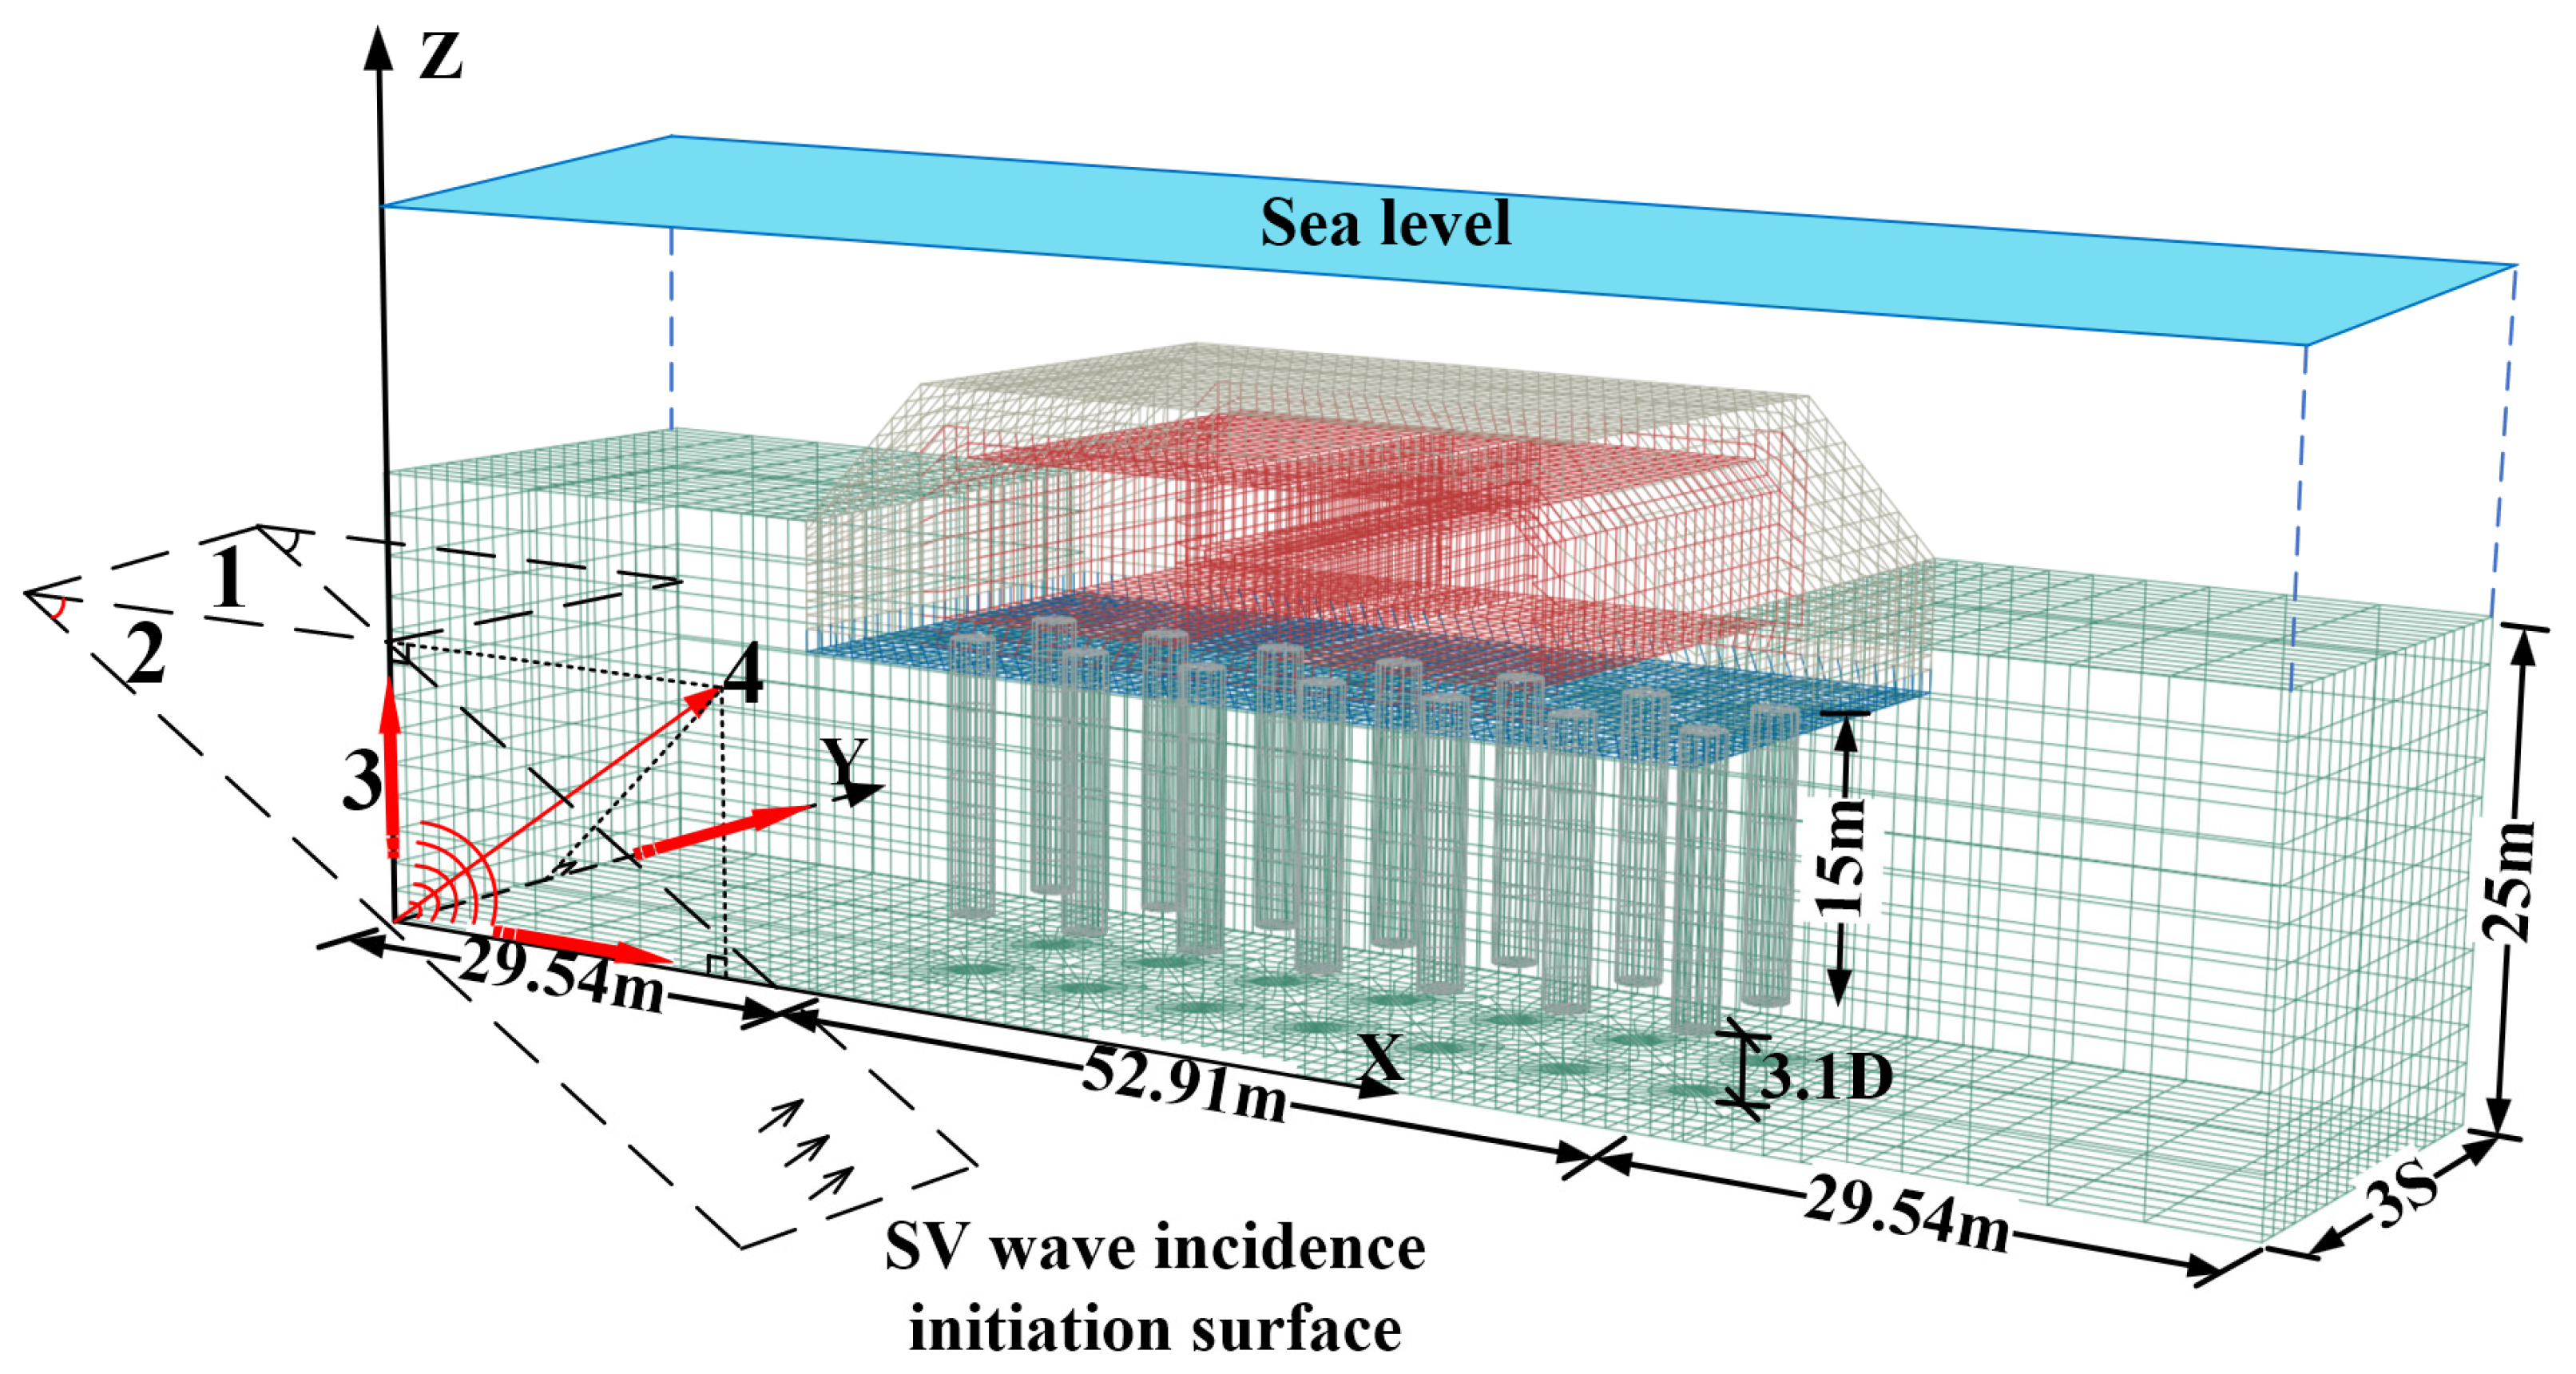
2.2. Numerical Model

Figure 4 shows the schematic diagram of the numerical model. The model consists of subsea, immersed tunnel, SCP pile group, gravel cushion and backfill. The interaction between the structures in the SIS system due to the inertial effect is applied through foundation vibration and structural mass distribution [33,34]. The numerical modeling analysis process is divided into four phases. The first is consolidation by drainage for 60 days after installation of the SCP in the seabed. The immersed tunnel is again consolidated by drainage for 60 days after construction. Then seawater pressure is applied, at which time the seabed is in an undrained consolidation state. Finally, seismic loads and viscoelastic boundaries are imported into the numerical model for seismic analysis using Matlab. When the sand compaction pile (pile penetrating through multiple soil layers) interacts with the foundation, frictional and lateral earth pressure are set for the pile–soil contact surface. Different materials are set for different soil layers to analyze the interaction between different soil layers and piles. Due to the large thickness of seabed sedimentary soil, engineering generally uses floating sand compaction piles to improve the first layer of seabed sedimentary soil. The burial depth of the pile does not reach the holding soil layer, and the settlement is mainly concentrated in the soft soil layer. Therefore, the displacement of other soil layers below the soft soil layer is assumed to be zero.

2.2.1. FEM Mesh and Boundary Conditions

C3D8P elements are considered for piled consolidation drainage, while C3D8R elements with reduced integration and hourglass control were used for tunnels, gravel cushions, and backfill. Mesh sizes are smaller near piled foundations and tunnels, while foundations away from piled foundations and tunnels are gradually increased in size, and the maximum element size is less than 5 m [35]. This is done to ensure computational efficiency and accuracy. The dimensions of the seabed are 112 m in the X-direction, the model width is 3 S in the Y-direction (S is the pile spacing), the SCP depth is 15 m in the Z-direction, and the bottom boundary of the model is 3.1 D from the end of the piles (D is the diameter of the piles) [32].
Tip of the pile restraint is considered to play a vital role in dynamic load analysis. Byrne et al. [36] stated that the lateral deflection of the pile at the ground surface can be reduced by about 50% due to pile fixed restraint. The fixed tip of the pile restraint also reduces the maximum bending moment of the pile and produces a bending moment at the tip of the pile in the opposite direction to the piled foundation [37,38]. During the actual seabed improvement technology, the surface of the SCP composite foundation does not slide relative to the gravel cushion and can be considered as a fixed contact in the finite element analysis. The contact surface of the pile soil is face-to-face contact. That is, the tangential direction is frictional contact, the normal direction is hard contact, and the strength discount factor is 0.8. The model is constrained around the normal direction displacement, and the bottom surface is constrained for X, Y, and Z direction displacement.
Finite element analysis can only simulate finite space, and the seabed is surrounded by half-infinite space bodies Kou and Yang [33]. Seismic waves lack reflection and damping effects at the boundaries, which are inconsistent with the actual wave field in the half-space [39]. Therefore, viscoelastic boundaries are set up in addition to the constrained displacements for realizing the reflection and damping of seismic waves. The restraining effect of neighboring soil materials is simulated. This is described in detail in Section 2.2.3.

2.2.2. Material Properties

Parameters M, e0, e1, λ, Kr, and ν are common to the Cam–Clay model (MCC) for marine soil. In the MCC model, the slope of the critical line (CSL) in the p-q coordinate system is M = 6 sinφ/(3 − sinφ); the slope of the normal consolidation line (NCL) in the e-lnp coordinate system is λ = Cc/2.3 and the slope of the swelling line in the e-lnp coordinate system Kr = (0.2~0.5) λ; and the relationship between the soil void ratio and the consolidation ratio (OCR) at a given location is e1 = e0 + λlnp0 + Krln(OCR) [40].
During consolidation, the void ratio of the seabed decreases as pore water is drained, leading to subsidence of the seabed and the marine structures above it. The hydrostatic pressure of the seabed foundation will change significantly under large deformations. Accordingly, in finite element calculations, the Darcy permeability coefficient k in the soil is related to the change in the void ratio e during soil deformation. In the calculation, the permeability of the seabed soil is ki = Cf e3/(1 + e), where Cf = k0(1 + e0)/e03 is the empirical coefficient [41], and e0 and k0 are the initial void ratio and permeability, respectively.
SCP produces hardening behavior under the action of seismic waves, and the DP hardening model is coupled with a porous elastic material (Proelastic) to form a sand pile drainage channel used to reduce the exceeded porous water pressure in the subsea foundations. The immersed tunnel, gravel cushion, and backfill are practically designed with impermeable and rigid materials. Therefore, they are modeled with linear elastic (elastic) materials with the parameters given in Table 2.

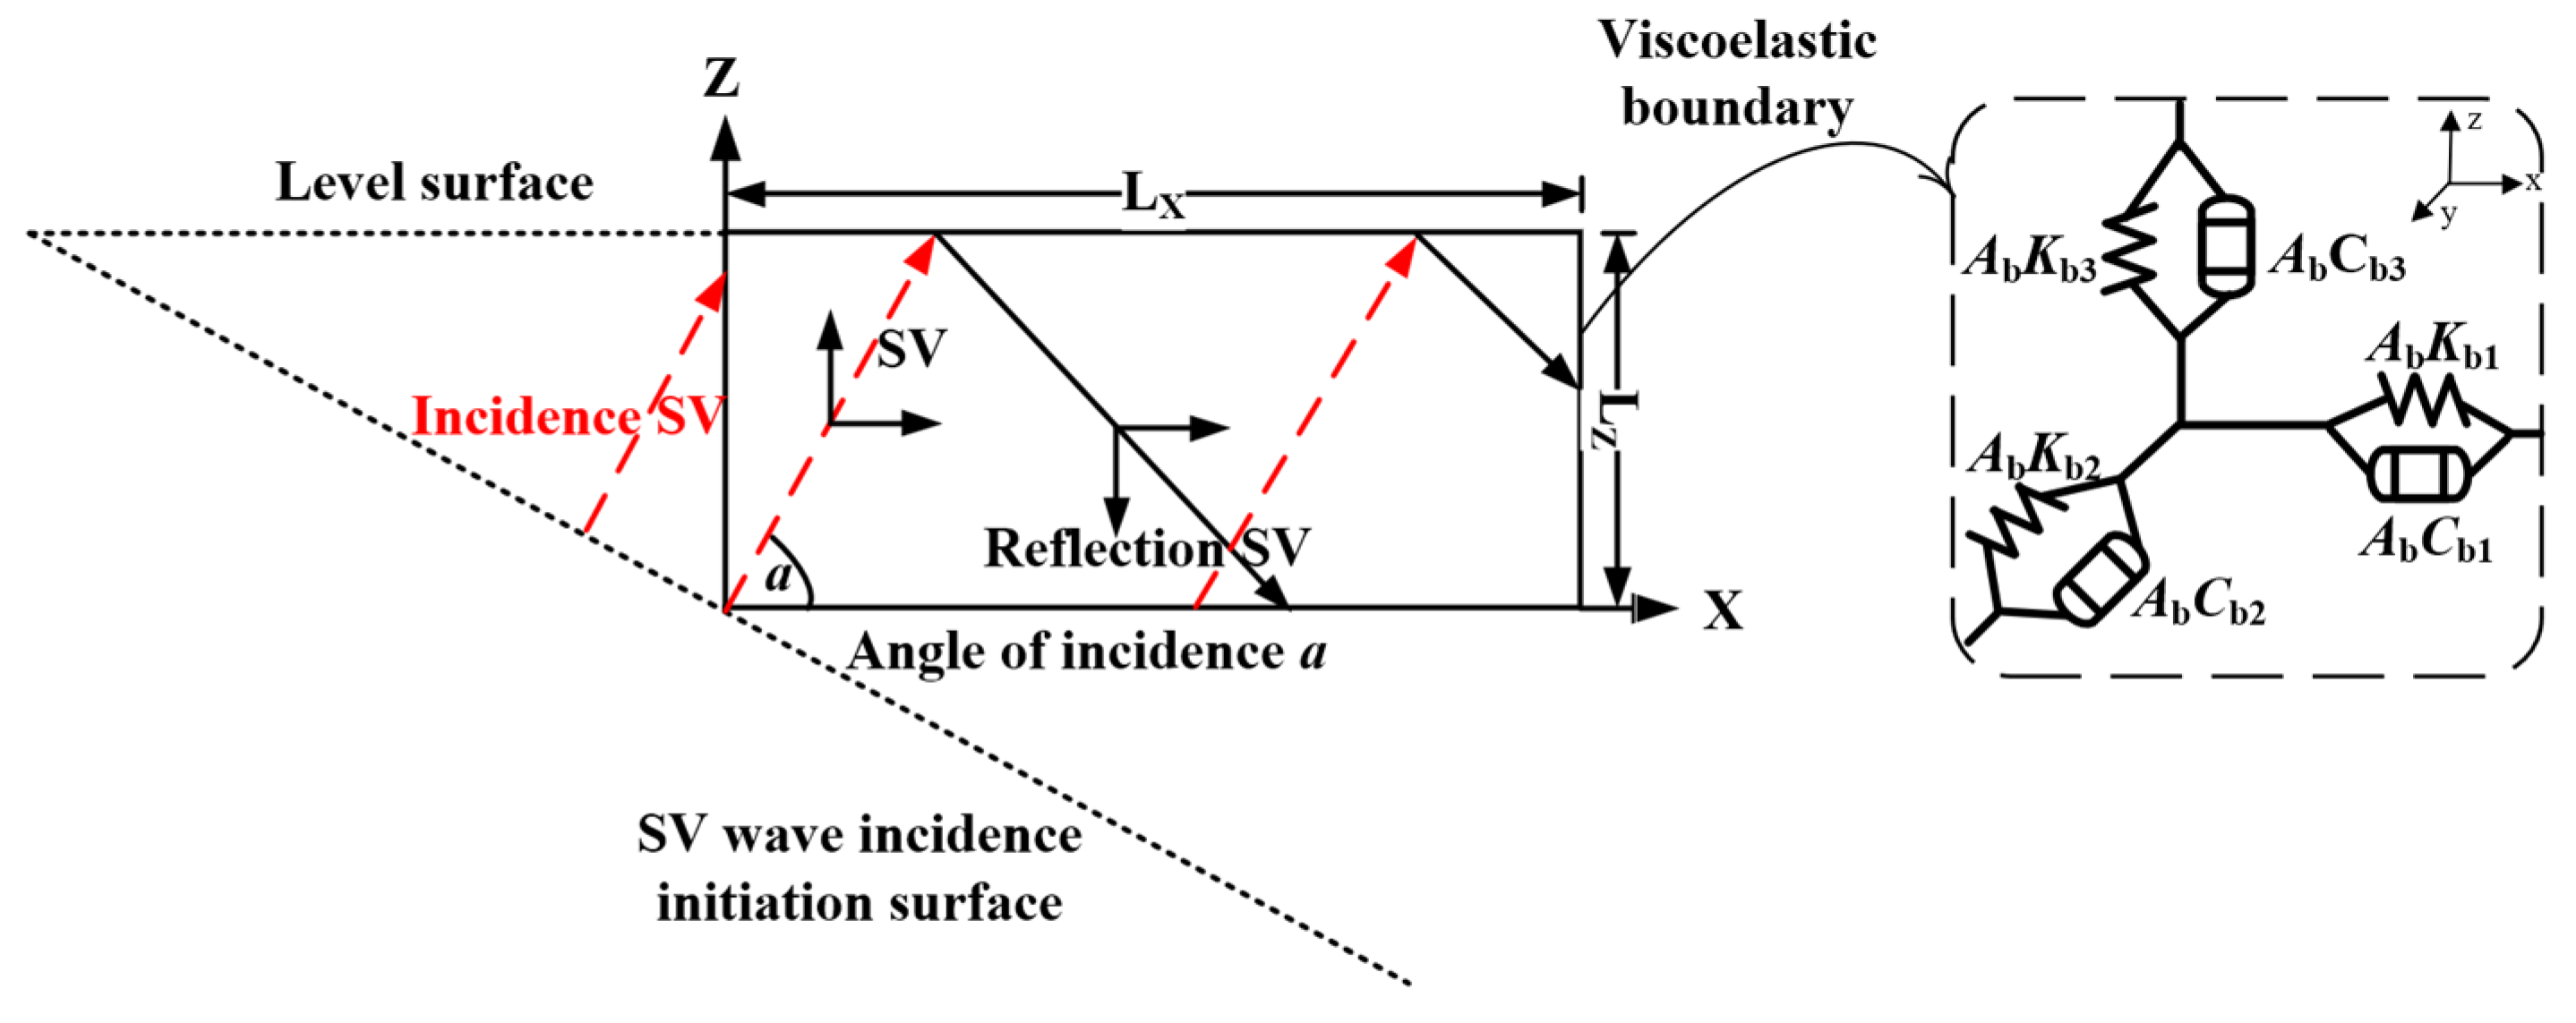
2.2.3. Viscoelastic Boundary and Seismic Loads

As shown in Figure 5, the viscoelastic boundary is actually a continuous distribution of springs and dampers around the perimeter and bottom of the model, except for the free top surface. The spring stiffness and damping coefficients of the nodes are the product of the linear stiffness and damping and the control area of the nodes. The mechanical parameters of the boundary springs and dampers are determined by the mechanical properties of the surrounding rock. The stiffness K and damping coefficient C of the spring are shown in Equations (1) and (2).
K bT = A b α T G s R C bT = A b ρ C S
K bN = A b α N G s R C bT = A b ρ C S
where Gs and ρ are the shear modulus and density of the medium, respectively; R is the distance from the wave source to the artificial boundary (straight distance from the boundary point of the finite element model to the source of the earthquake.); Ab is the control area of the node b on the boundary; αN and αT are the correction coefficients for the normal and tangential directions, respectively; and CS and CP are the shear and longitudinal wave velocities of the medium and the Lamey constants β and δ, respectively [40].
Neural networks and artificial intelligence effectively analyze the sensitivity of various factors in complex engineering [43,44,45,46,47,48]. The effect of seismic loads on piled foundations is assumed as the dynamic load transfer process in Euler–Bernoulli beams with Winkler foundations in Kiani et al. [49,50] and Selim and Liu [51]. In this study, the seismic wave input is realized by transforming the earthquake into a wave source problem and then acting on the boundary as a concentrated force. There is an equilibrium relationship between the equivalent force Fb, the normal stress σbffn and the force f(t) generated by the spring damper on any boundary point b(xb, yb, zb) of the model He et al. [52]. The conversion of seismic waves into equivalent seismic loads within the control area (Ab) of point b on an artificial viscoelastic boundary as in Liu et al. [39]. The applied equivalent load is shown in Equation (3).
F b = K b u b f f + C b v b f f + σ b f f n A b
where Kbubff is the additional stress generated by the spring unit due to the overcoming displacement; Cbvbff is the additional stress generated by the damper due to the overcoming velocity; σbffn is the stress tensor generated by the free field vibration in the direction normal to the boundary; ubff is the displacement vector of the incident wave; vbff is the velocity vector of the incident wave; and Ab is the area of the boundary node control.

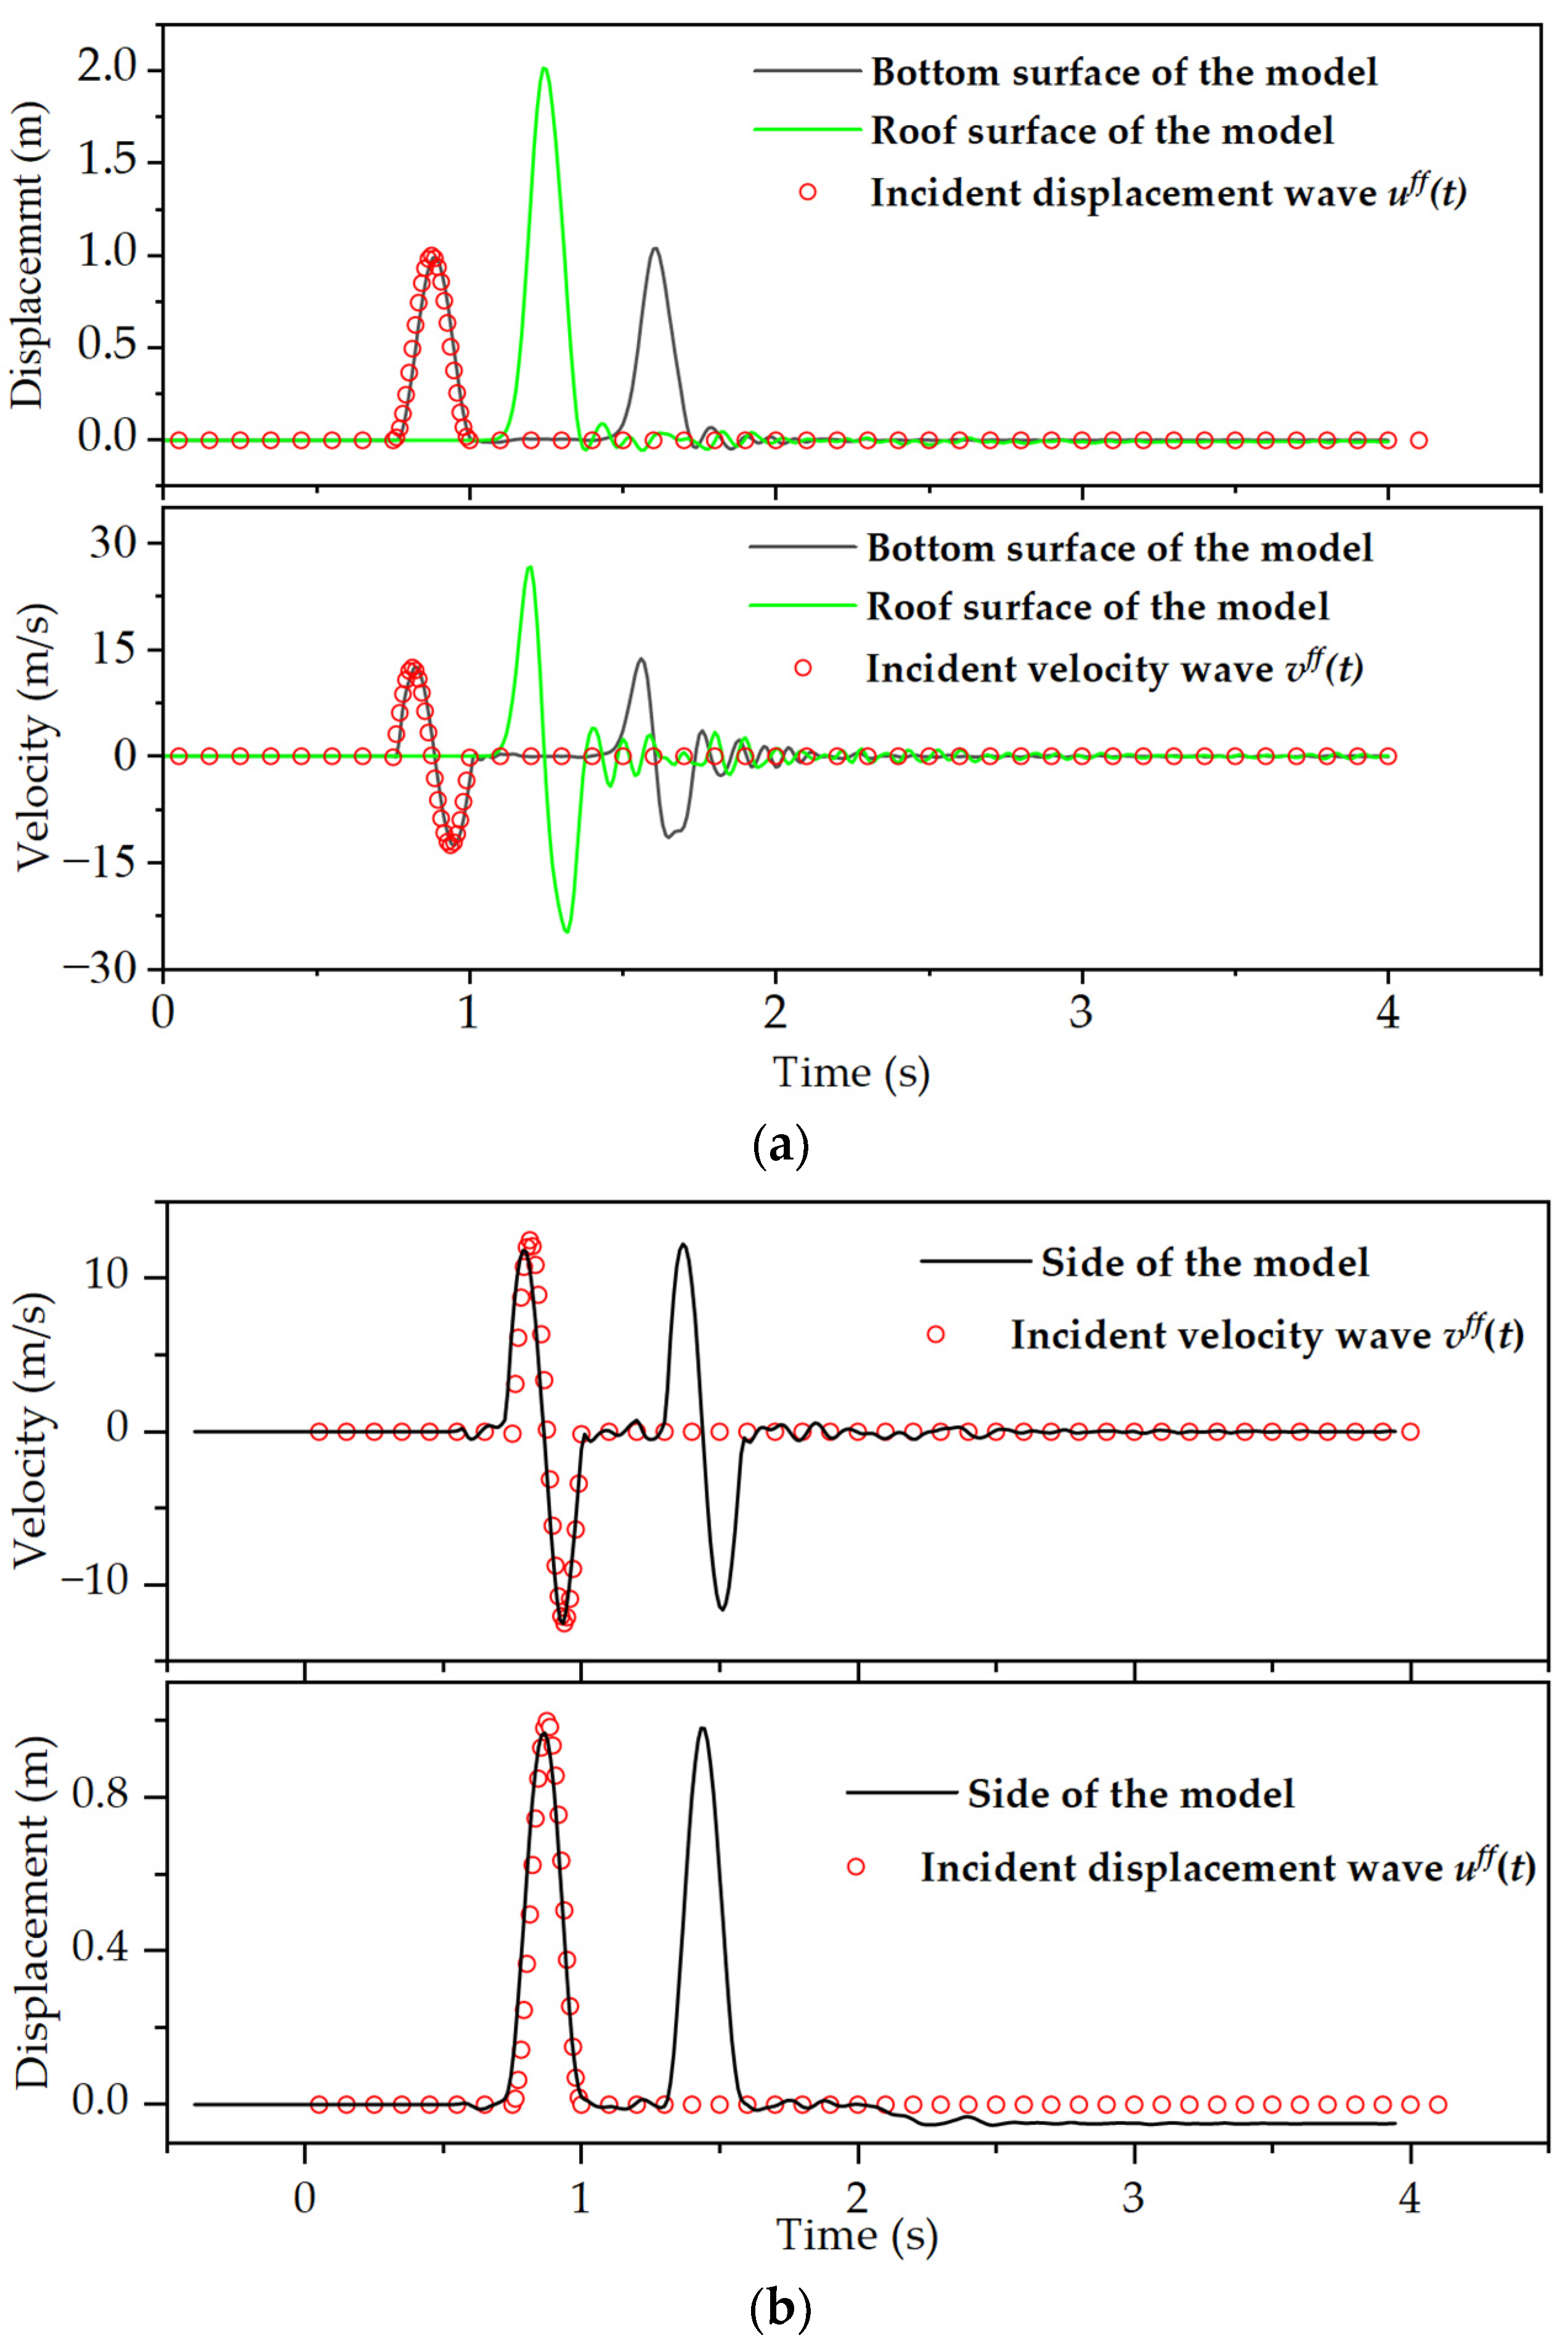
3. Verification of Numerical Model

3.1. Convergence Analysis of Numerical Model

Equations (4) and (5) for a single pulse wave at a time step of 0.001 s, and a cutoff frequency of 50 Hz. Density of 2000 kg/m3, Poisson’s ratio of 0.22, an elasticity modulus of 4.88 × 10⁹ GPa and an amplitude of 1 m for the displacement of the incident SV wave are used.
u f f t = 1 2 [ 1 cos 8 π t ] , 0.75 t 1 u f f t = 0 , 0 t < 0.75 , 1 < t
v f f t = 12.5 sin 8 π t , ( 0.75 t 1 ) v f f t = 0 , ( 0 t < 0.75 , 1 < t )
Figure 6 shows the normal velocity and displacement time history curves for the numerically modeled surface. It can be seen that the analytical and numerical solutions are consistent. The seismic wave transmitting to the top surface of the model will be reflected, and the velocity and displacement will increase because there is no surrounding constraint limitation on the top surface. The bottom surface produces two wave peaks due to the reflected wave, and the time gap is exactly one reflection period. Due to the presence of a viscoelastic boundary at the bottom surface, the reflected wave is absorbed, as is the case with the transfer of waves from the side of the model. Therefore, the viscoelastic boundary has better accuracy and can effectively represent infinite foundations.

3.2. Verification of the Results

The applicability of the numerical model was examined in terms of both settlement and acceleration. Figure 7a–c show the settlement curves of the piled foundation. It can be seen that the settlement produces a fluctuation process similar to the seismic frequency, but the settlement eventually stabilizes. The settlement fluctuation is due to the fact that the amplitude and propagation direction of the seismic wave in the numerical model will produce changes at different locations. This variation leads to an uneven response of the foundation, which results in fluctuations in the settlement curve. Whereas the whole physical model vibrates at the same acceleration, the foundation gradually densifies under this nondifferentiated vibration, which leads to a smooth settlement curve. The settlement results of the experiment can better describe the final value and trend of the numerical results. It can also be seen that under the same conditions, the settlement of the diagonal piled foundation (37% replacement rate) is 0.81 times that of the rectangular piled foundation (50% replacement rate). However, the settlement of the plum-piled foundation (62% replacement rate), which has a higher replacement rate, is rather smaller than that of the rectangular-piled foundation. This indicates that the piled foundation settlement is the most stabilized when the replacement rate reaches about 50%.
Figure 7d shows the magnitude acceleration of the tunnel in the numerical model and the acceleration reaction spectra in Ground Motion Database - NGA west2. It can be seen that the acceleration response spectra used in the physical model describe the numerical results trend better. It is worth noting that the numerical results show hysteresis. This is due to the fact that the transfer of seismic loads in the numerical model is assumed to be a wave source problem subjected to damping that is uniform in action. The actual foundation damping is inhomogeneous, and hence, deviation and reduction in the monitoring results can occur.

4. Parametric Analysis

4.1. Effects of the Seawater Depth

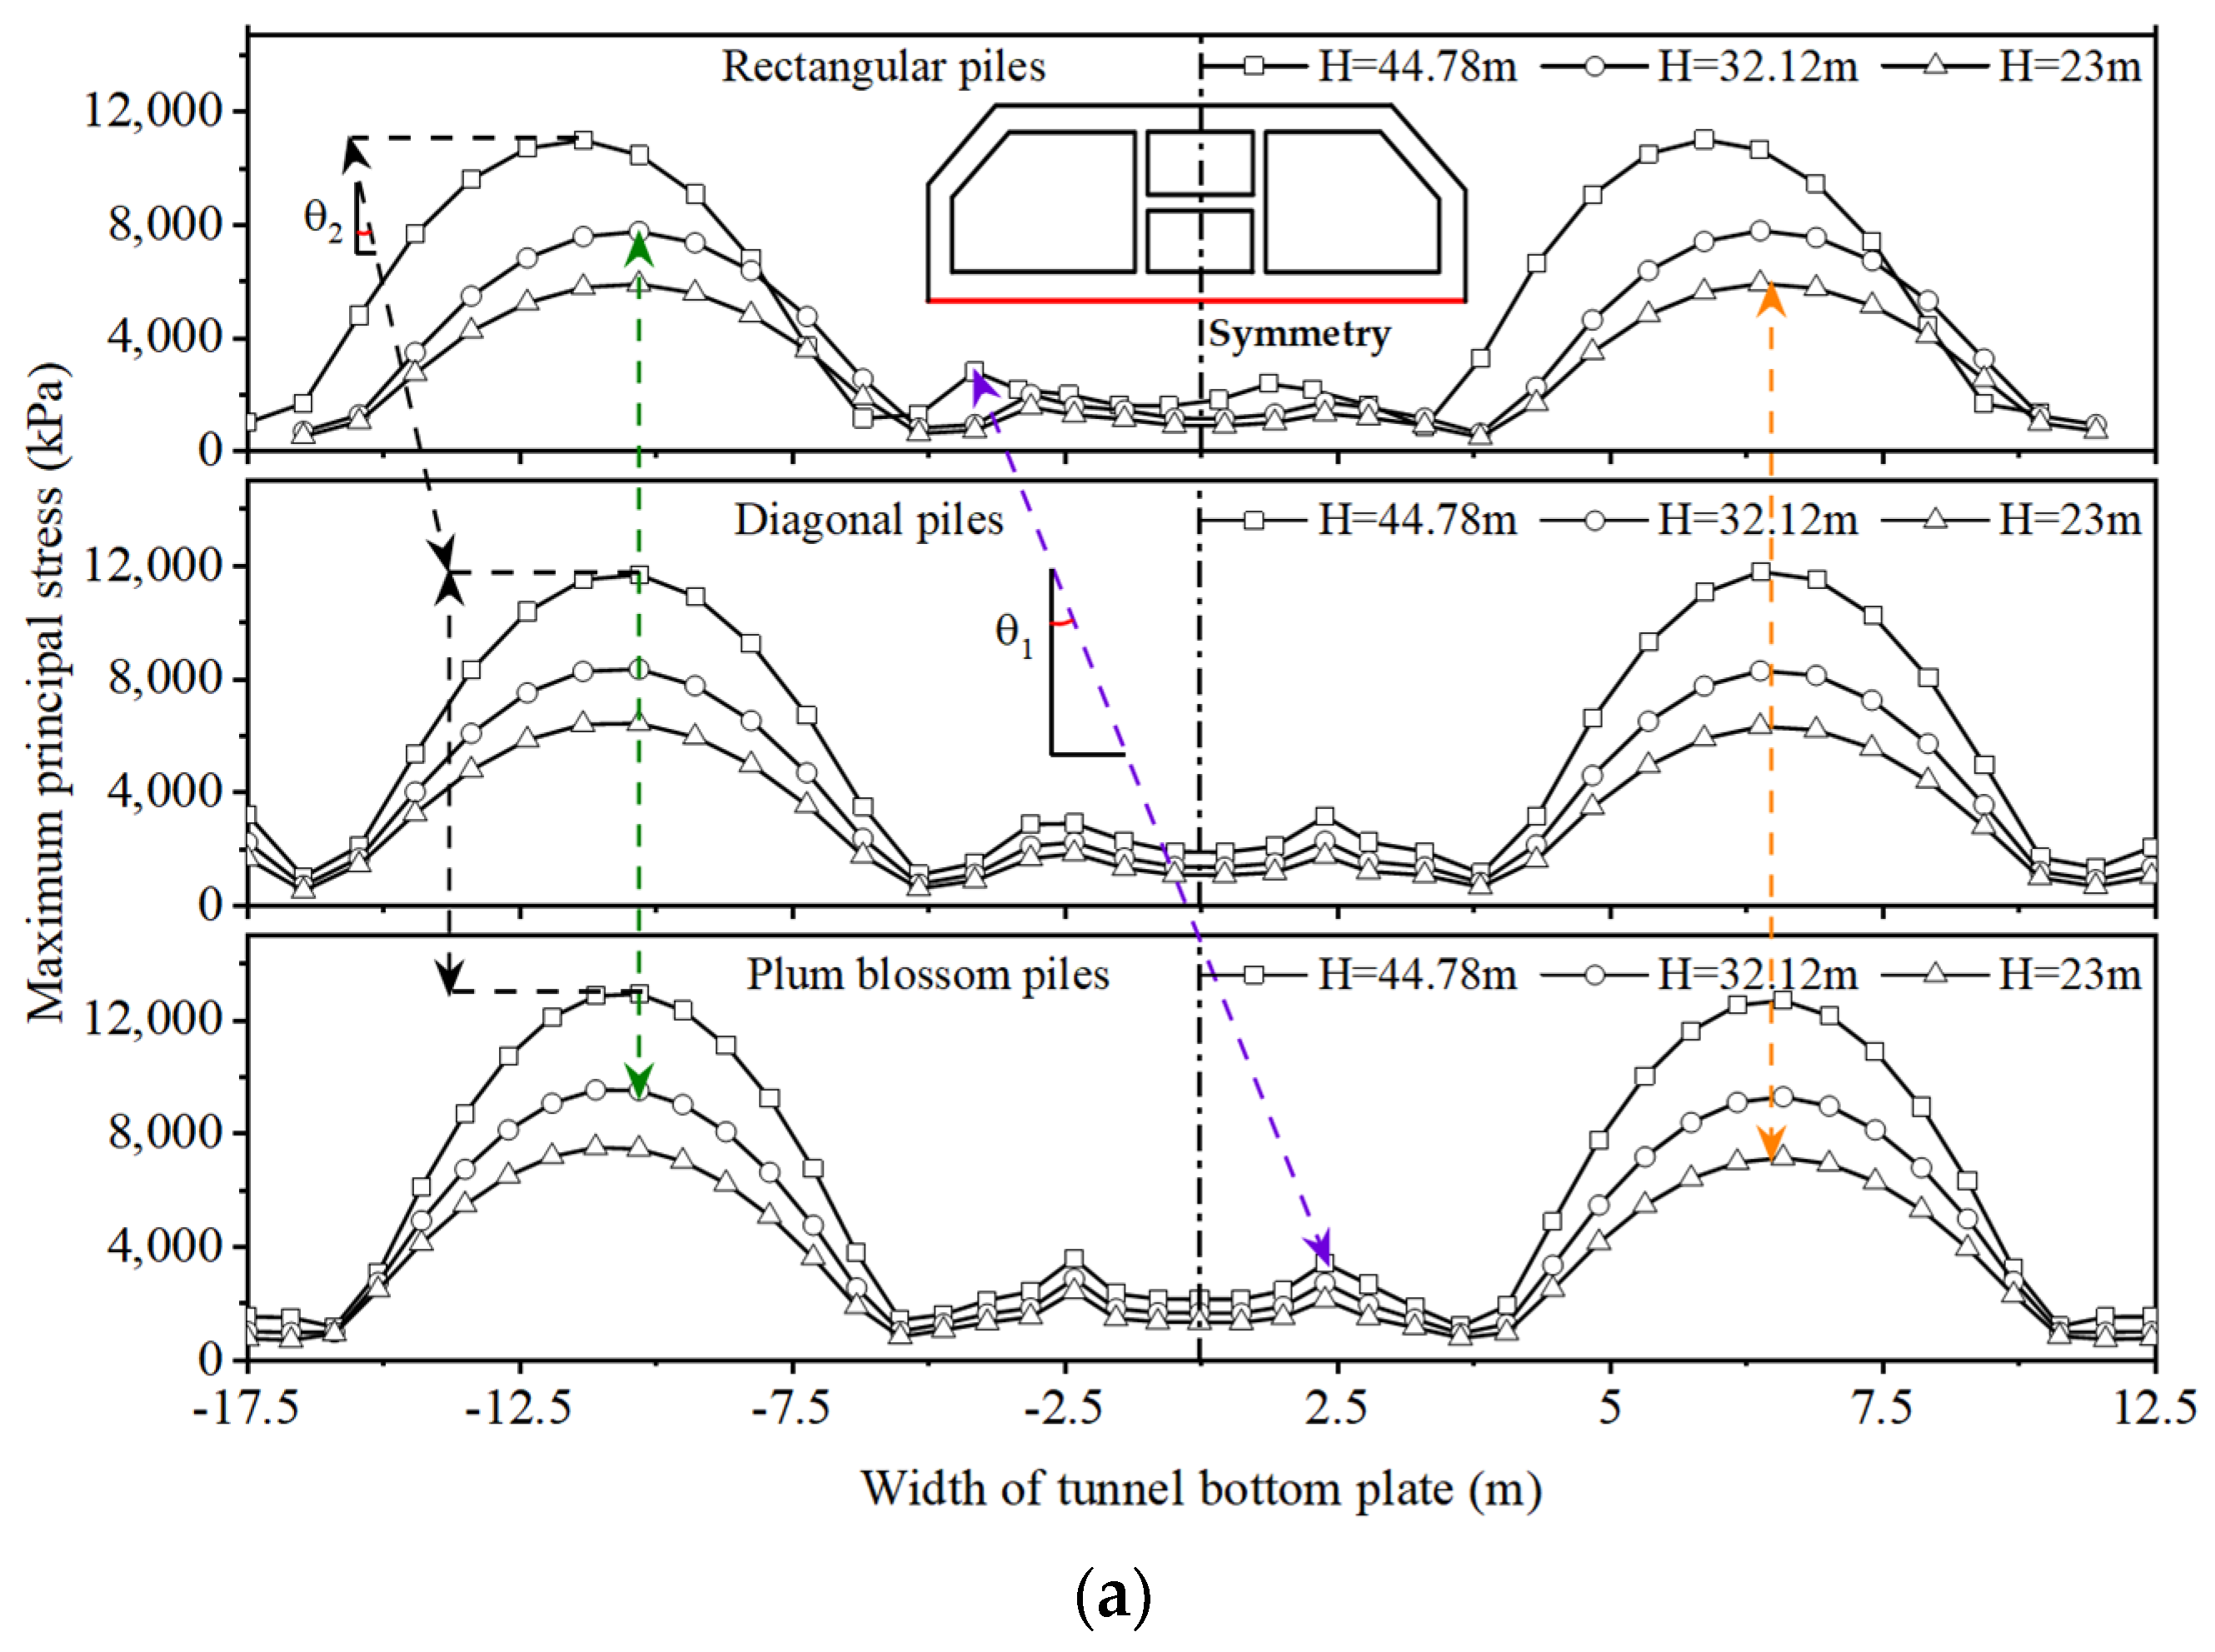
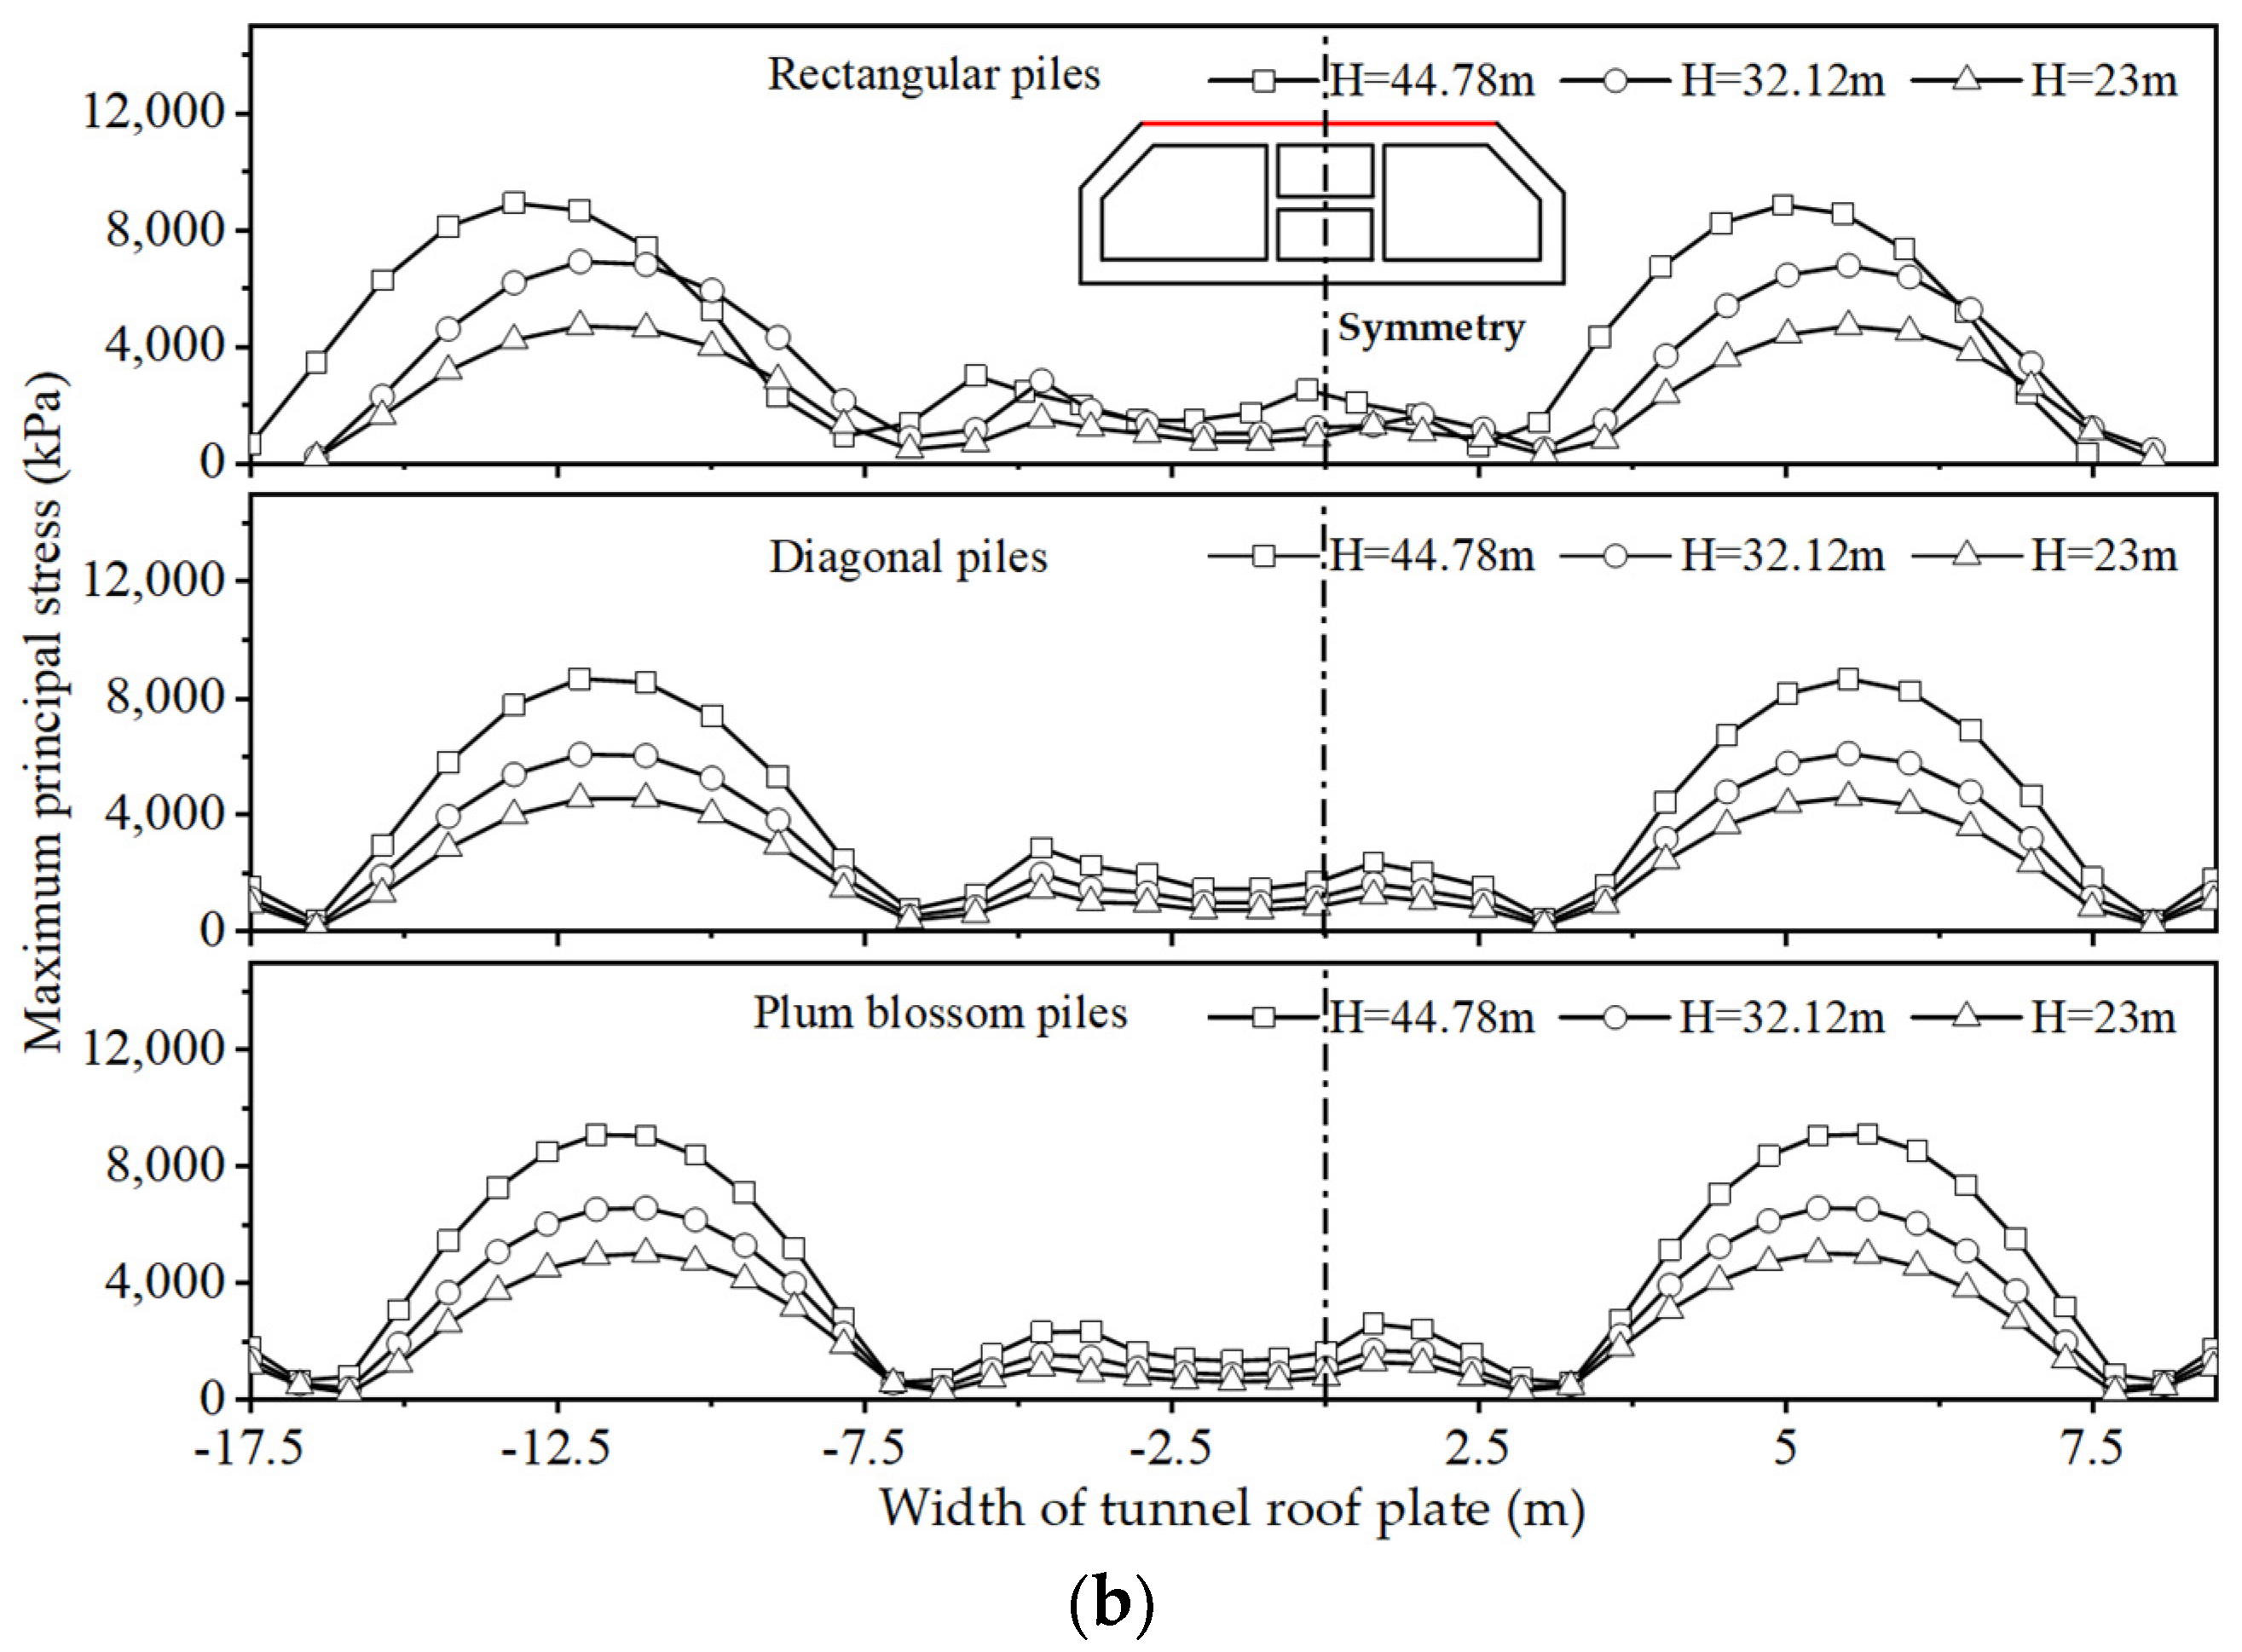
4.1.1. Peak Stresses in the Top and Bottom Plates of the Tunnel

The stress changes after an earthquake are very important for immersed tunnel design. Figure 8 shows the maximum principal stress distribution of the tunnel bottom plate (a) and top plate (b) under seismic loads. Under seawater pressure and seismic loads, the stress curves of the top plate and bottom plate are saddle-shaped. From Figure 8, it can be seen that stress concentration occurs on both sides of the top and bottom plates of the tunnel. With the increase in seawater depth, the maximum principal stresses of the tunnel bottom and top plates show an increasing trend of decreasing growth rate. This indicates that the seawater depth has a suppression effect on the vertical frequency of the tunnel [53]. With the increase in the replacement rate of the piled foundation, the stress peaks of the top and bottom plates are shifted toward the wave source direction, and the shift angle in the middle is about twice the shift angle of the left and right sides (θ1 = 2θ2), as shown in Figure 8a.
The maximum principal stresses in the top plate of the tunnel are always greater than those in the bottom plate. It can be seen that the effect of seismic loads on the bottom plate is greater than on the top plate. The difference between the two maximum principal stresses is due to the damping effect of the “H-shaped” structure of the tunnel. In addition, the maximum principal stresses in the top and bottom plates at a 50% replacement rate are smaller than the maximum principal stresses at 37% and 62% replacement rates.

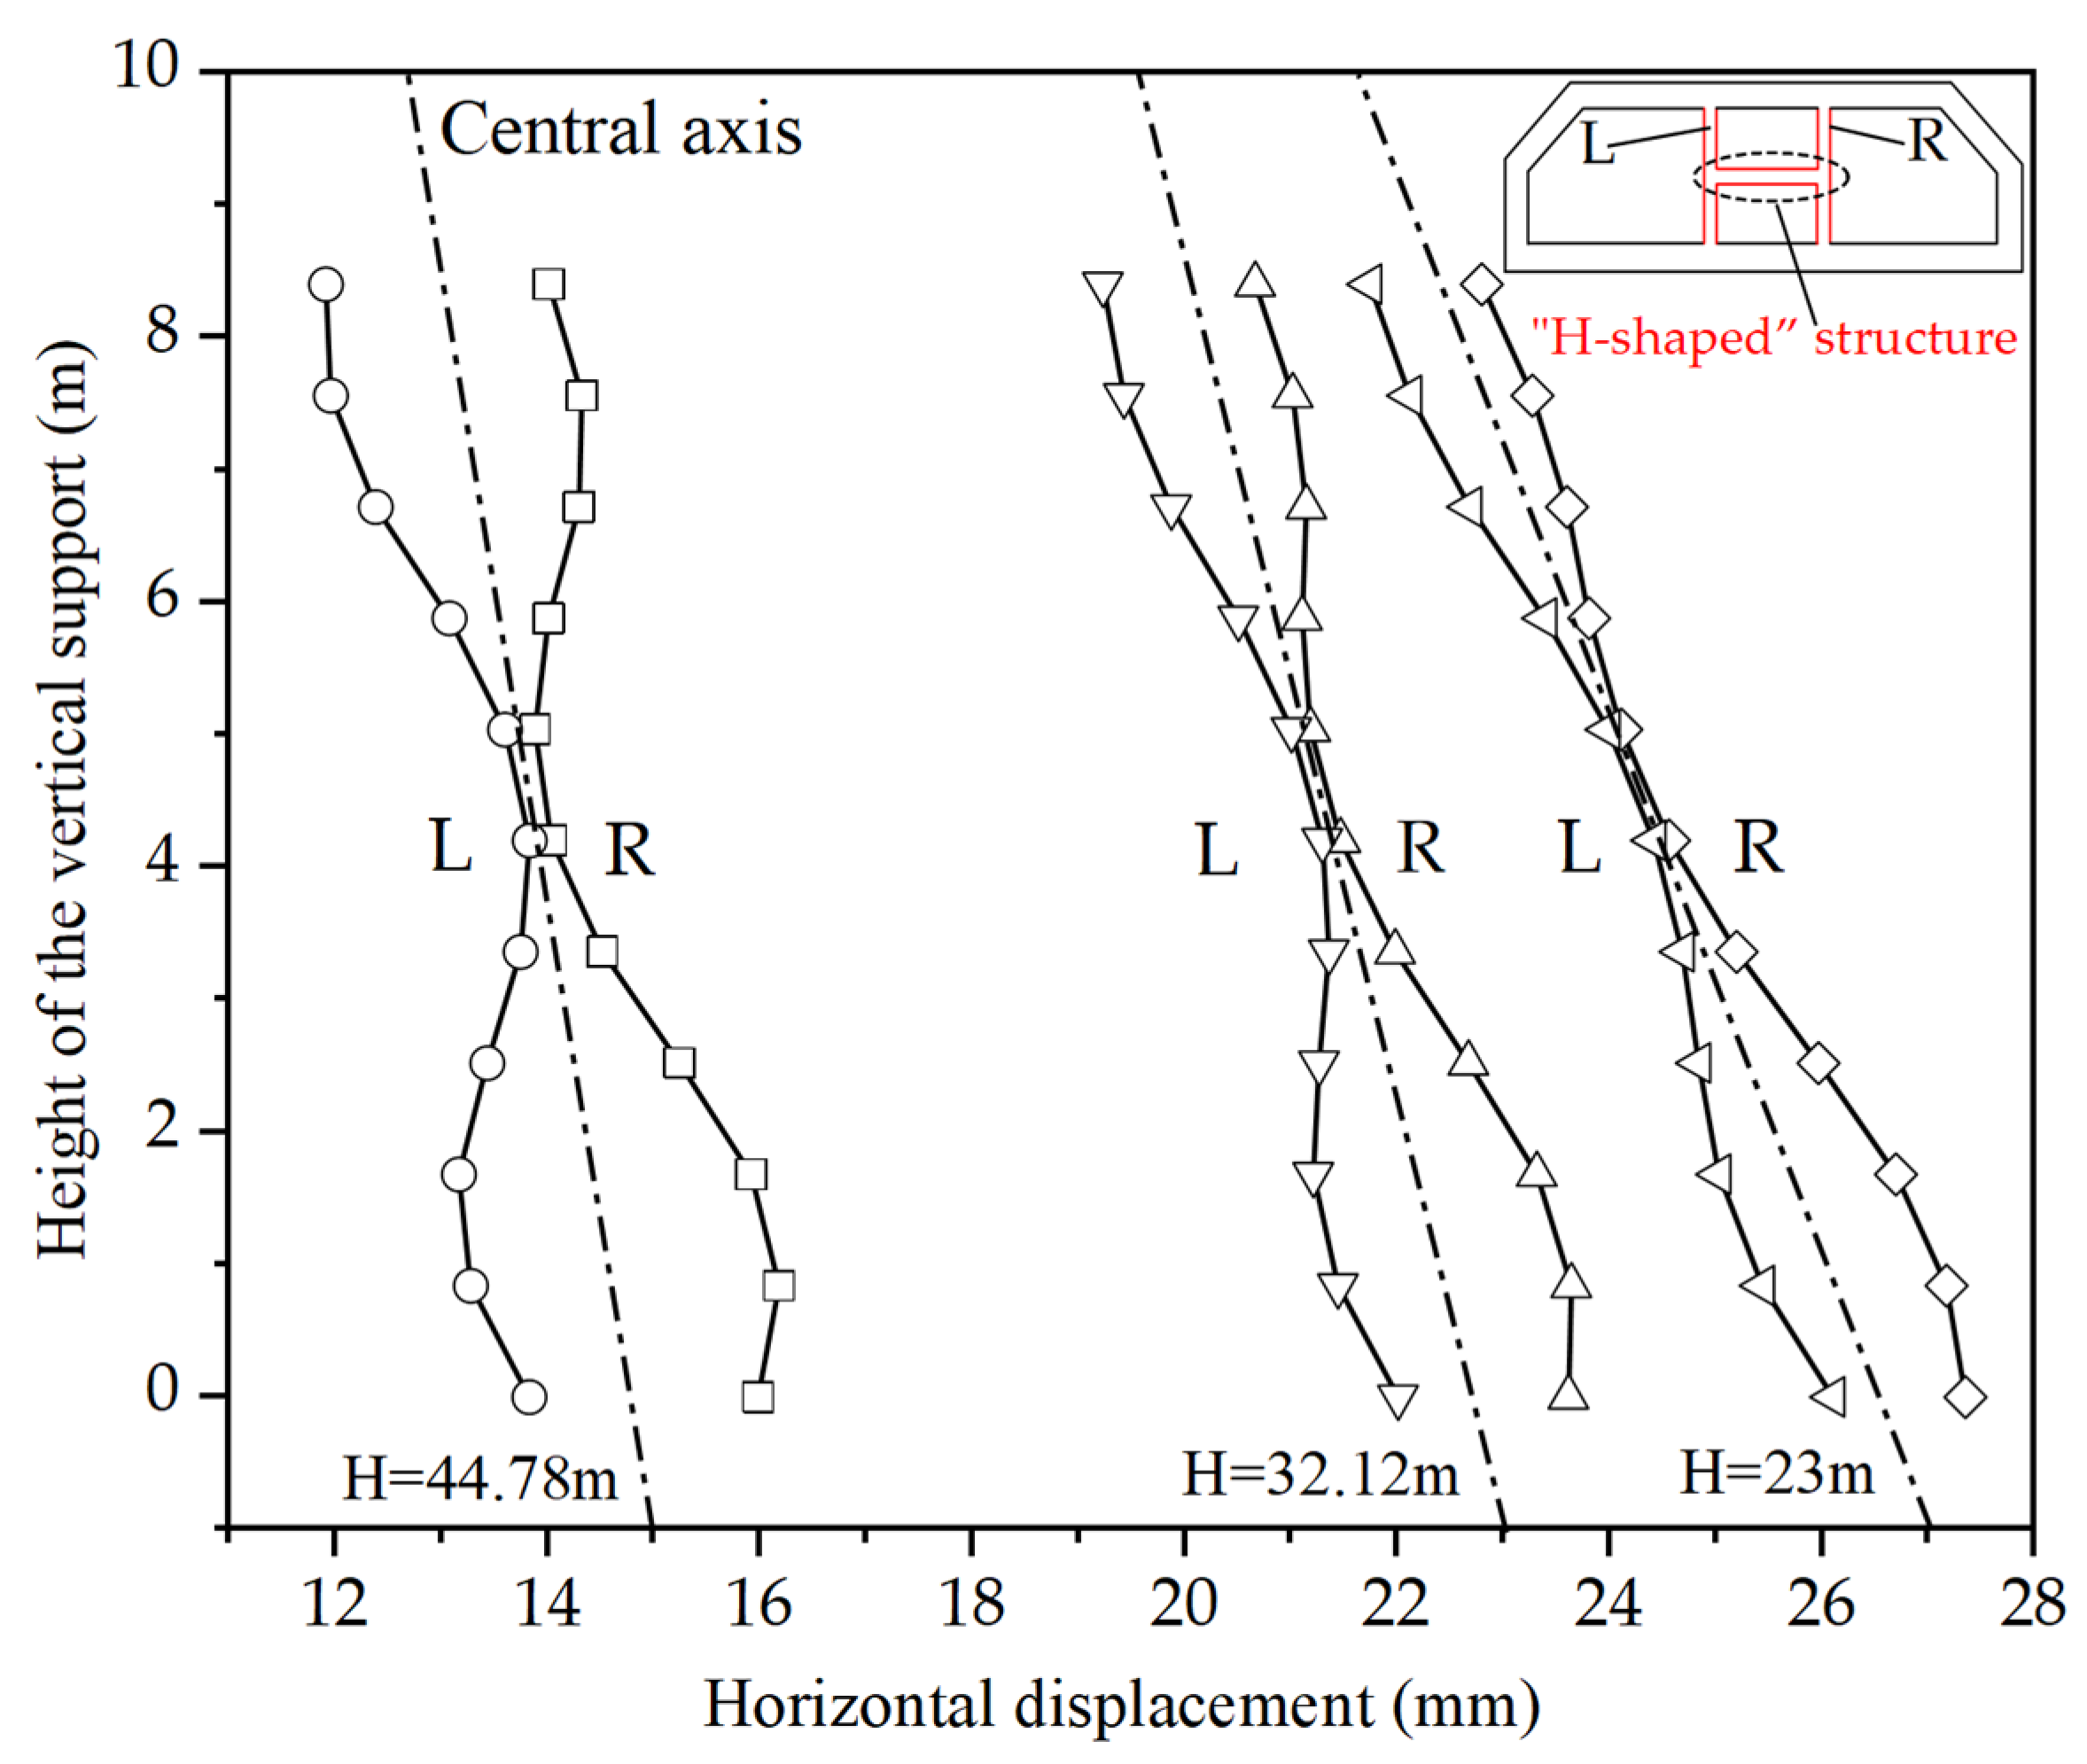
4.1.2. Displacement of the “H-Shaped” Structures

Figure 9 shows that the horizontal displacements of the left vertical support and the right vertical support in the “H-shaped” structures of the tunnel are in the shape of “X”. The depth of seawater increases from H = 23 m to H = 44.78 m, and the reduction rate of left and right horizontal displacements is 13.63% and 36.84%, respectively; this is due to the fact that the seawater absorbs part of the seismic wave energy, and the suppression effect of seawater on the vertical frequency of the tunnel increases with the increase in the depth of the water, which can effectively increase the seismic performance of the structure [54,55].
However, when the overall horizontal displacement of the “H-shaped” structures decreases, the difference in horizontal displacement between the left and right vertical supports tends to increase. The rate of increase in horizontal displacement in the lower part of the “H-shaped” structures is higher than that in the upper part (Figure 9 neutral axis rotated 7° counterclockwise). Seismic loading causes the tunnel to vibrate. This vibration amplifies the response of the tunnel to the loads and may result in injury to the weak areas of the structural design. The tunnel will dissipate the seismic energy through the deformation of the “H-shaped” structures and stress transfer in the walls to dampen itself and reduce the vibration amplitude. Secondly, this deformation and stress transfer will also change the fundamental frequency of the tunnel [56], preventing resonance injury and increasing seismic performance. This is consistent with the stress transfer mechanism of the top and bottom plates of immersed tunnels in Section 4.1.1.

4.2. Structural Response in Different Directions

4.2.1. Settlement of Gravel Cushion

Figure 10a shows the settlement deformation at the bottom of the gravel cushion under the three SCP arrangements of the piled foundation. It can be seen that the settlement of the gravel cushion differs greatly at different seawater depths. The maximum settlement change rates of rectangular, diagonal, and plum blossom piles are η1 = 4.4, η2 = 2.5, and η3 = 14.5, respectively. Seawater suppressed the tunnel significantly more at the end close to the seismic source than at the far end, and the maximum location of gravel cushion settlement is located at the far end. However, due to the damping effect of the foundation and the immersed tunnel, the far end of the cushion from the seismic source is subjected to smaller seismic loads relative to the close end, and the settlement difference is instead magnified. This is due to the seawater suppression that causes the vertical frequency of the overburden structure and the seismic frequency to resonate at the far end, resulting in additional seismic injury. The seismic time history response is sensitive to changes in the fundamental frequency of the overburden structure. It is necessary to increase the restraint force of the pile foundation on the far end of the structure to offset the resonance injury.
Figure 10b shows the settlement of the gravel cushion along the length direction. It can be seen that the settlement at the bottom of the cushion is symmetrically distributed. This is due to the fact that the immersed tunnel is similar to an infinitely long cavity in the longitudinal direction, and the neighboring structure produces a strong restraining effect. The neighboring constraint force can offset the longitudinal destructive force of the tunnel. Therefore, there is no gravel cushion in the settlement amplification phenomenon.

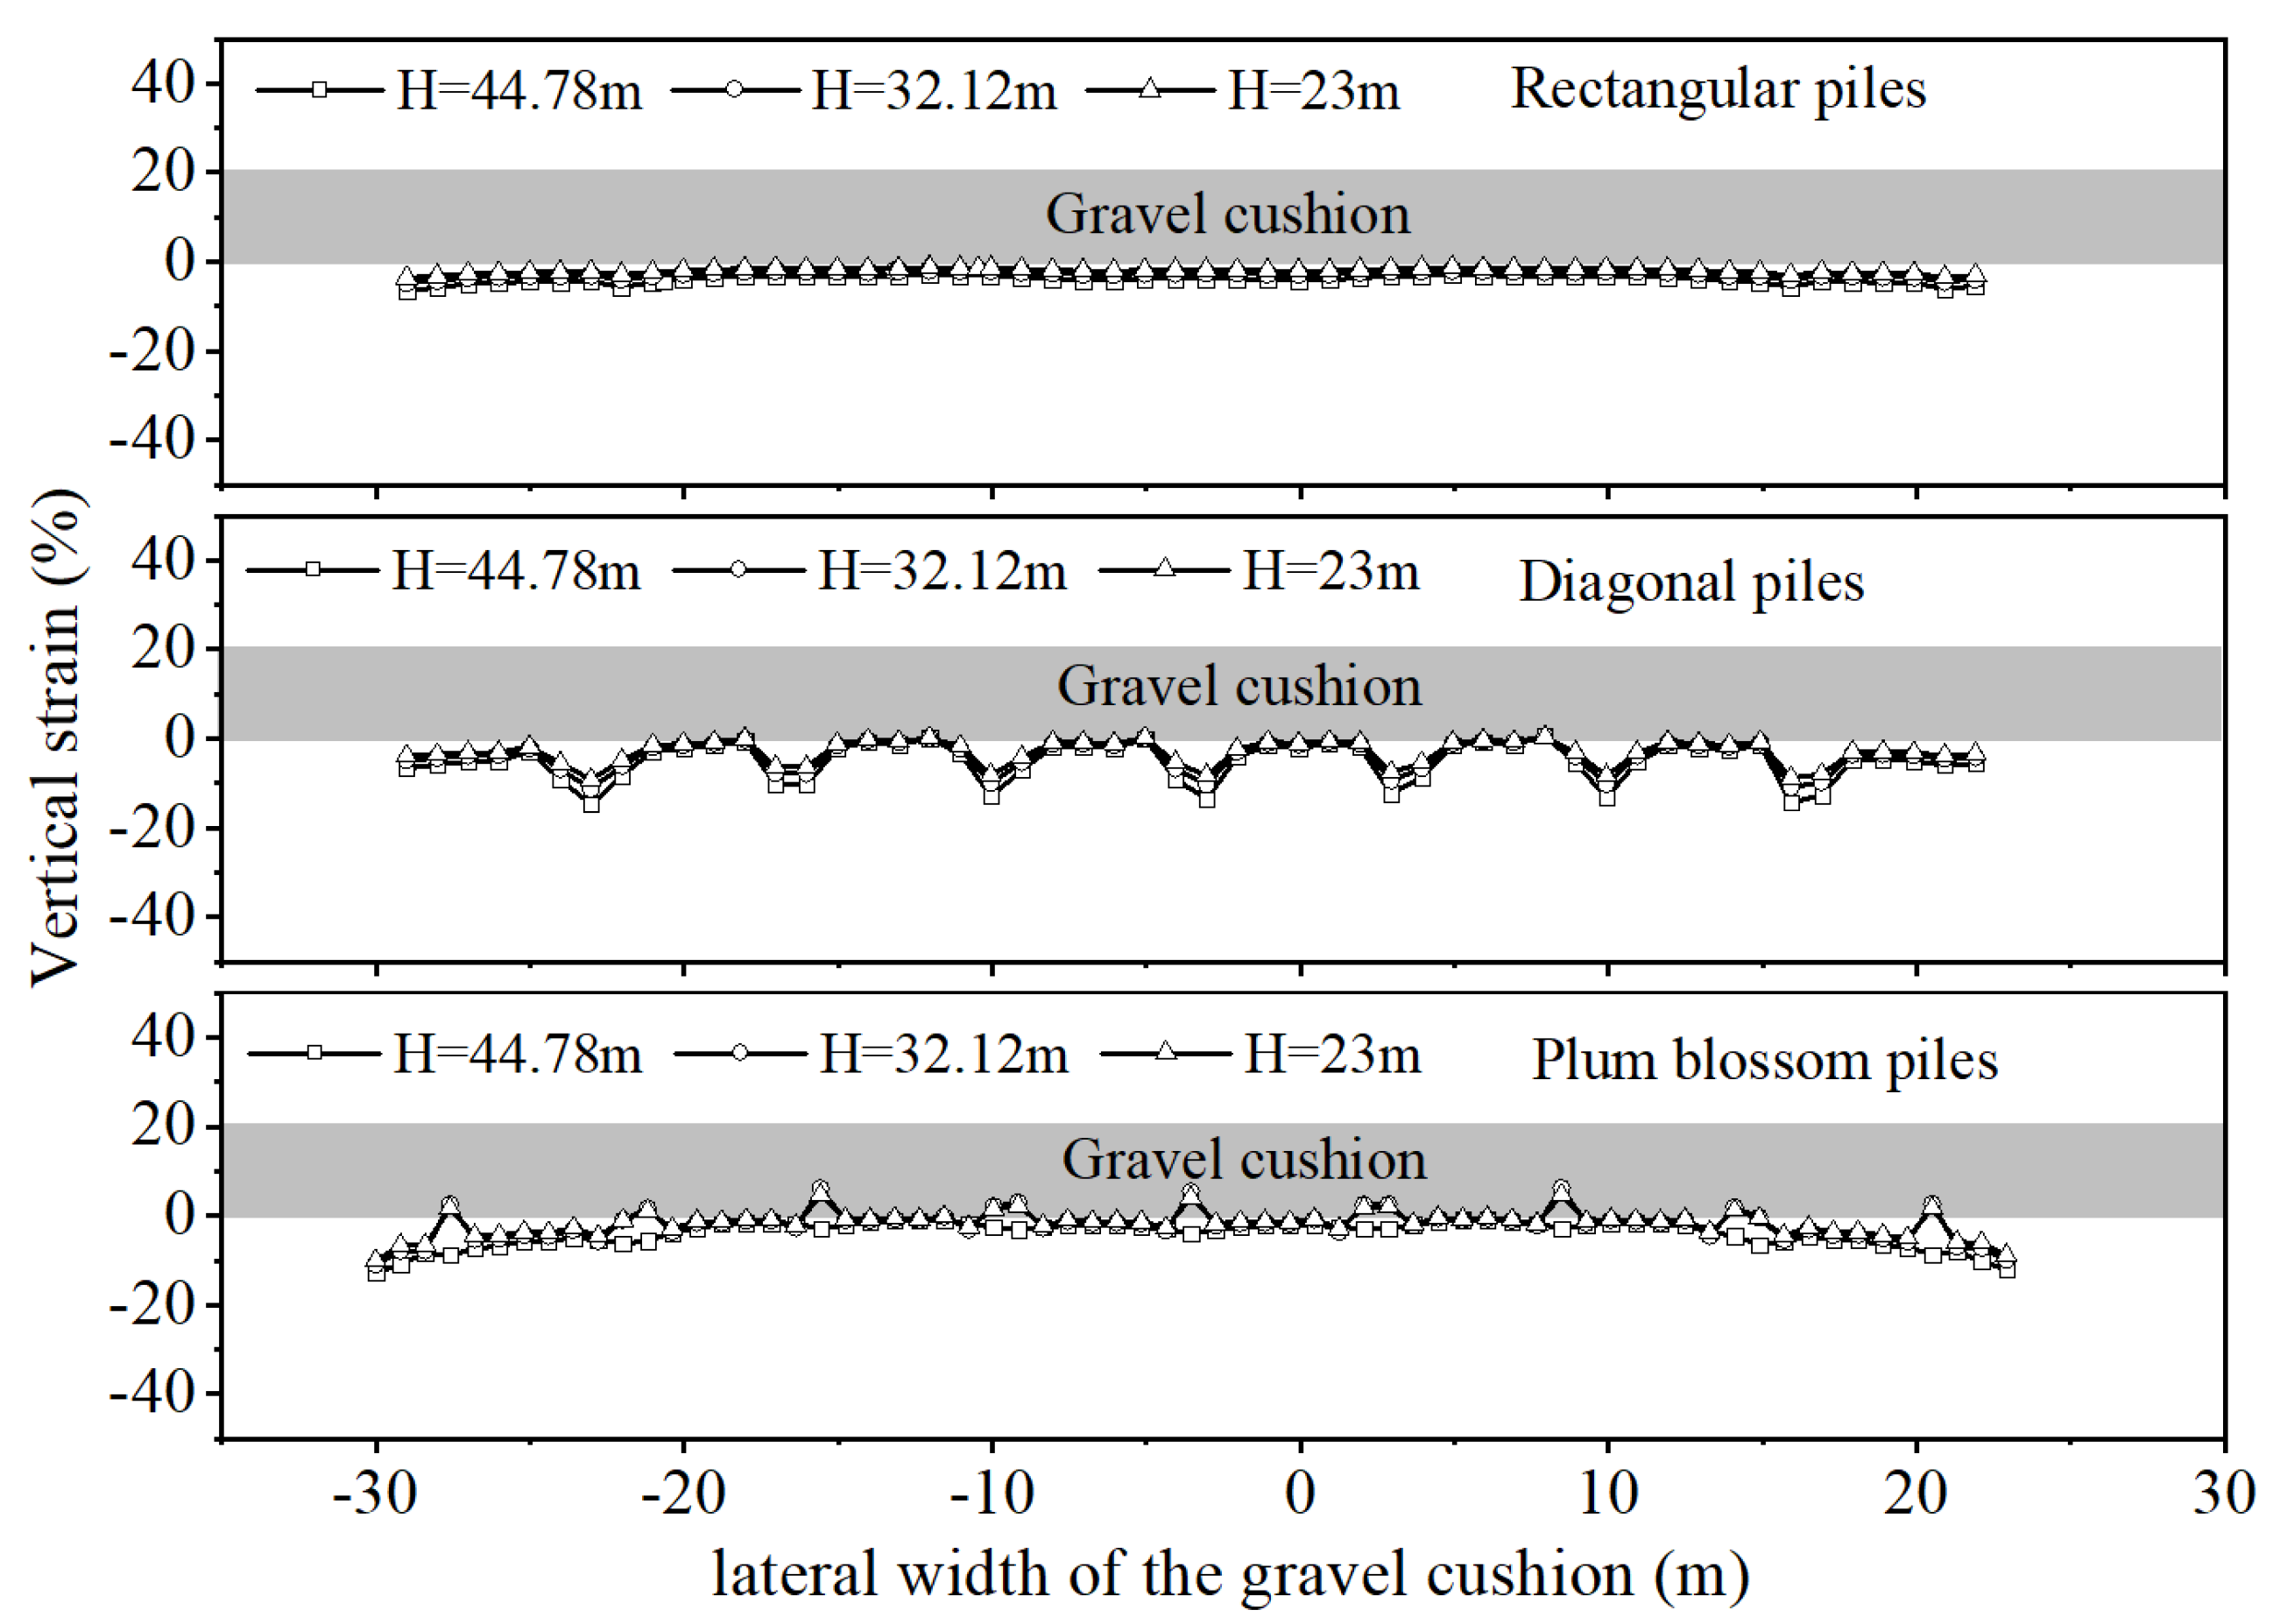
4.2.2. Vertical Strain of the Gravel Cushion

The strain in the gravel cushion after the earthquake can effectively reflect the superiority of the piled foundation design scheme. Figure 11 shows the vertical strain along the bottom of the gravel cushion along the length direction. When the seawater depth changes, the vertical strain curve is wavy at a 37% replacement rate, and the bottom of the gravel cushion appears to be in tension. This phenomenon is due to the pile settlement under the seismic loads, and the tip of the pile and the gravel cushion are in a fixed constraint state. The tip of the pile settlement produces downward tensile stress, and the soil between the pile settlement is less than the tip of the pile settlement due to the friction of the piles and the soil arch effect. Therefore, a wave-like strain curve appears. The vertical strain of the gravel cushion tends to be consistent at a 50% replacement rate, and the strain is small. When the replacement rate reaches 62%, the bottom of the cushion is pierced, at which time obvious tensile strains appear at both ends of the gravel cushion.

4.3. Effects of the Slenderness Ratio

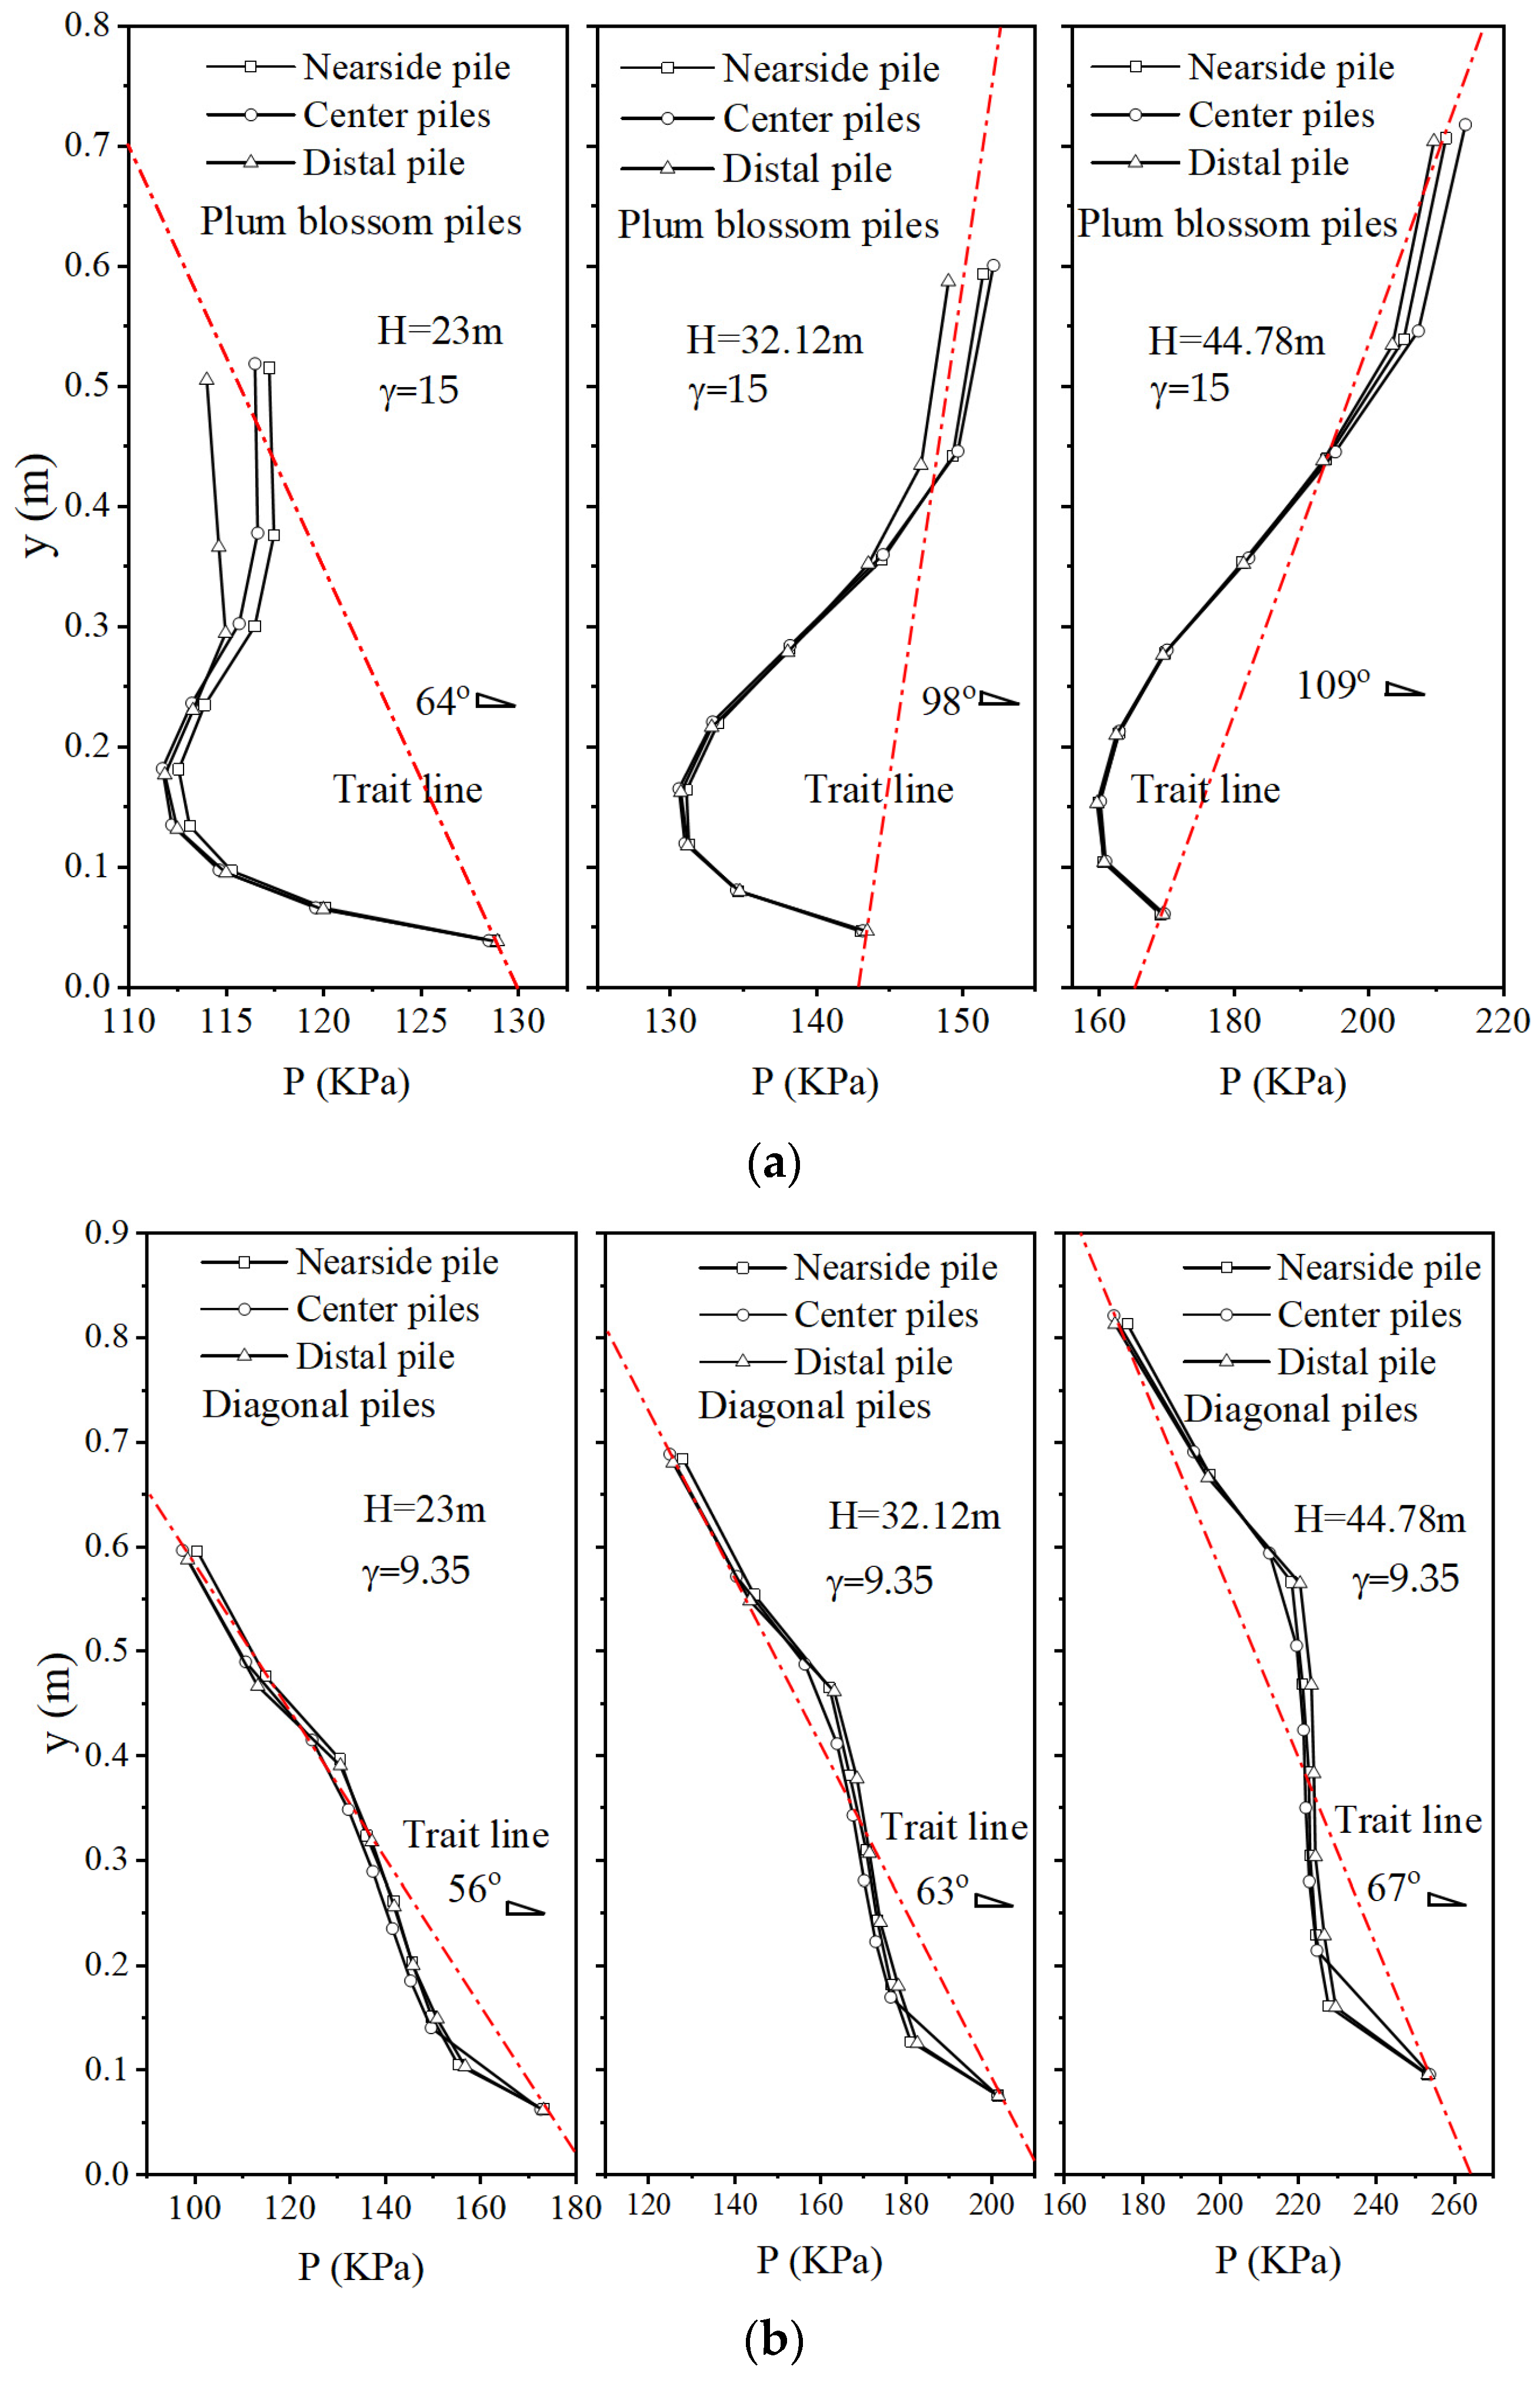
4.3.1. p-y Curve of the Piles

Figure 12a–c show the resistances-deflection (p-y) curves along the depth direction for piles with Υ = 15 (plum piles), Υ = 9.37 (diagonal piles), and Υ = 6.25 (rectangular piles), respectively. The characteristic lines at two points, the tip of the pile and the end of the pile are used to reflect the change in the p-y relationship of the pile. As the seawater depth H increases, the characteristic lines of SCP under all three Υ are rotated clockwise, which coincides with the results of Lu et al. [57], who found that the p-y curves of piles under compression conditions are steeper. At this time, the deflections at the tip of the pile varied more by 0.23 m, 0.23, and 0.2 m, respectively, while the difference in deflection variation at the end of the pile was not significant. The stiffness represented by the slope of the curve increases with depth, and similar results were obtained by Klinkvort and Hededal [58] and Zhu et al. [59] from centrifuge modeling tests of monopiles and jacketed piles. At Υ = 15, the characteristic line is rotated clockwise by 45°, and the resistances at the tip of the pile are increased by 95 KPa, and that at the end of the pile is increased by 43 KPa. At Υ = 9.37, the angle of rotation of the characteristic line is 11°, the resistances at the tip of the pile increase by 70 KPa, and the resistances at the end of the pile increase by 70 KPa. At Υ = 6.25, the angle of rotation of the characteristic line is 10°, the resistances at the tip of the pile increase by 105 KPa, and the resistances at the end of the pile increase by 140 KPa. The above data indicate that the seawater pressure has an effect on the lateral behavior of the piled foundations. The effect of seawater pressure on the lateral behavior of the pile foundation is through increasing the degree of soil densification and increasing the axial force to generate additional bending moment, as in Lu and Zhang [60]. It can be seen that the change in seawater depth affects the p-y value at the tip of the pile more than the end of the pile, while the change of Υ affects the p-y value at the end of the pile more than the tip of the pile. The combined consideration of seawater pressure and the slenderness ratio of the pile can prevent localized injury to the pile.
The injury to the SIS system by seawater depth is significantly less than the direct effect of seismic transverse waves, indicating that the damping of seismic waves by the structure and the suppression frequency of seawater are favorable for seismic design. It is clearly observed that the equilibrium that occurs in the pile roof and pile end resistances when γ from 15 to 9.35. It confirms the existence of an optimum slenderness ratio for the SCP-reinforced marine foundation in Section 3.

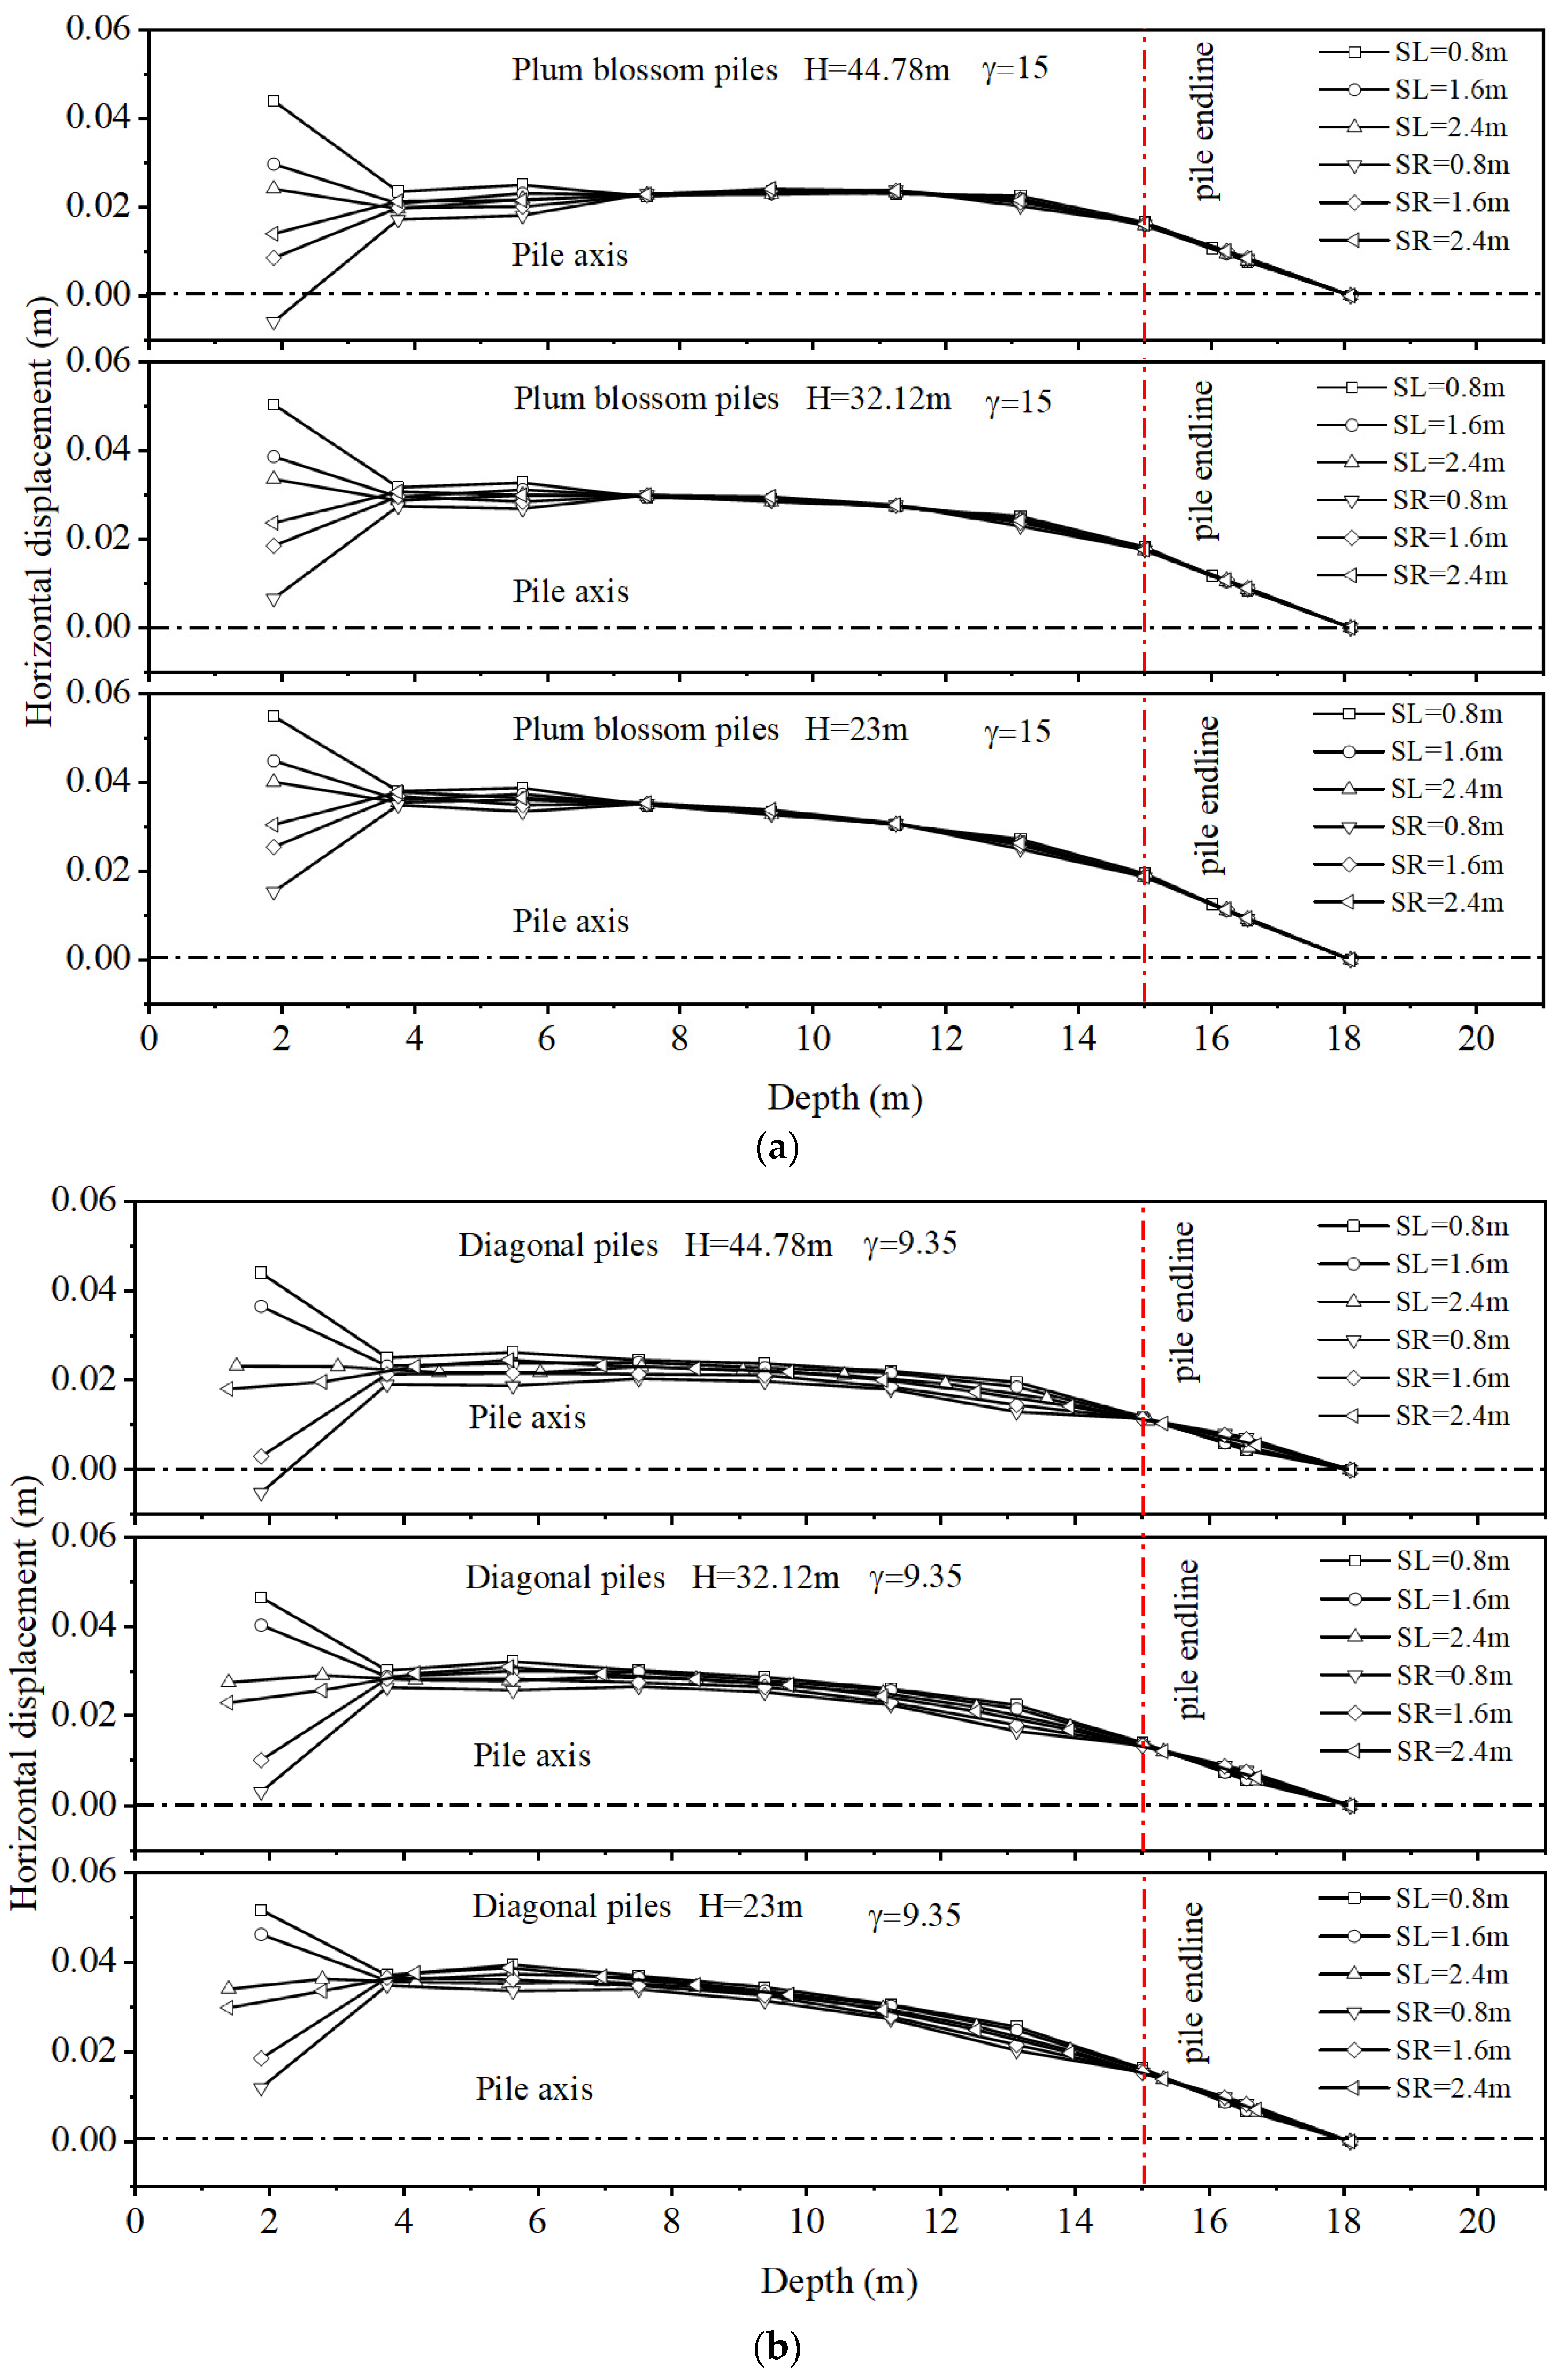
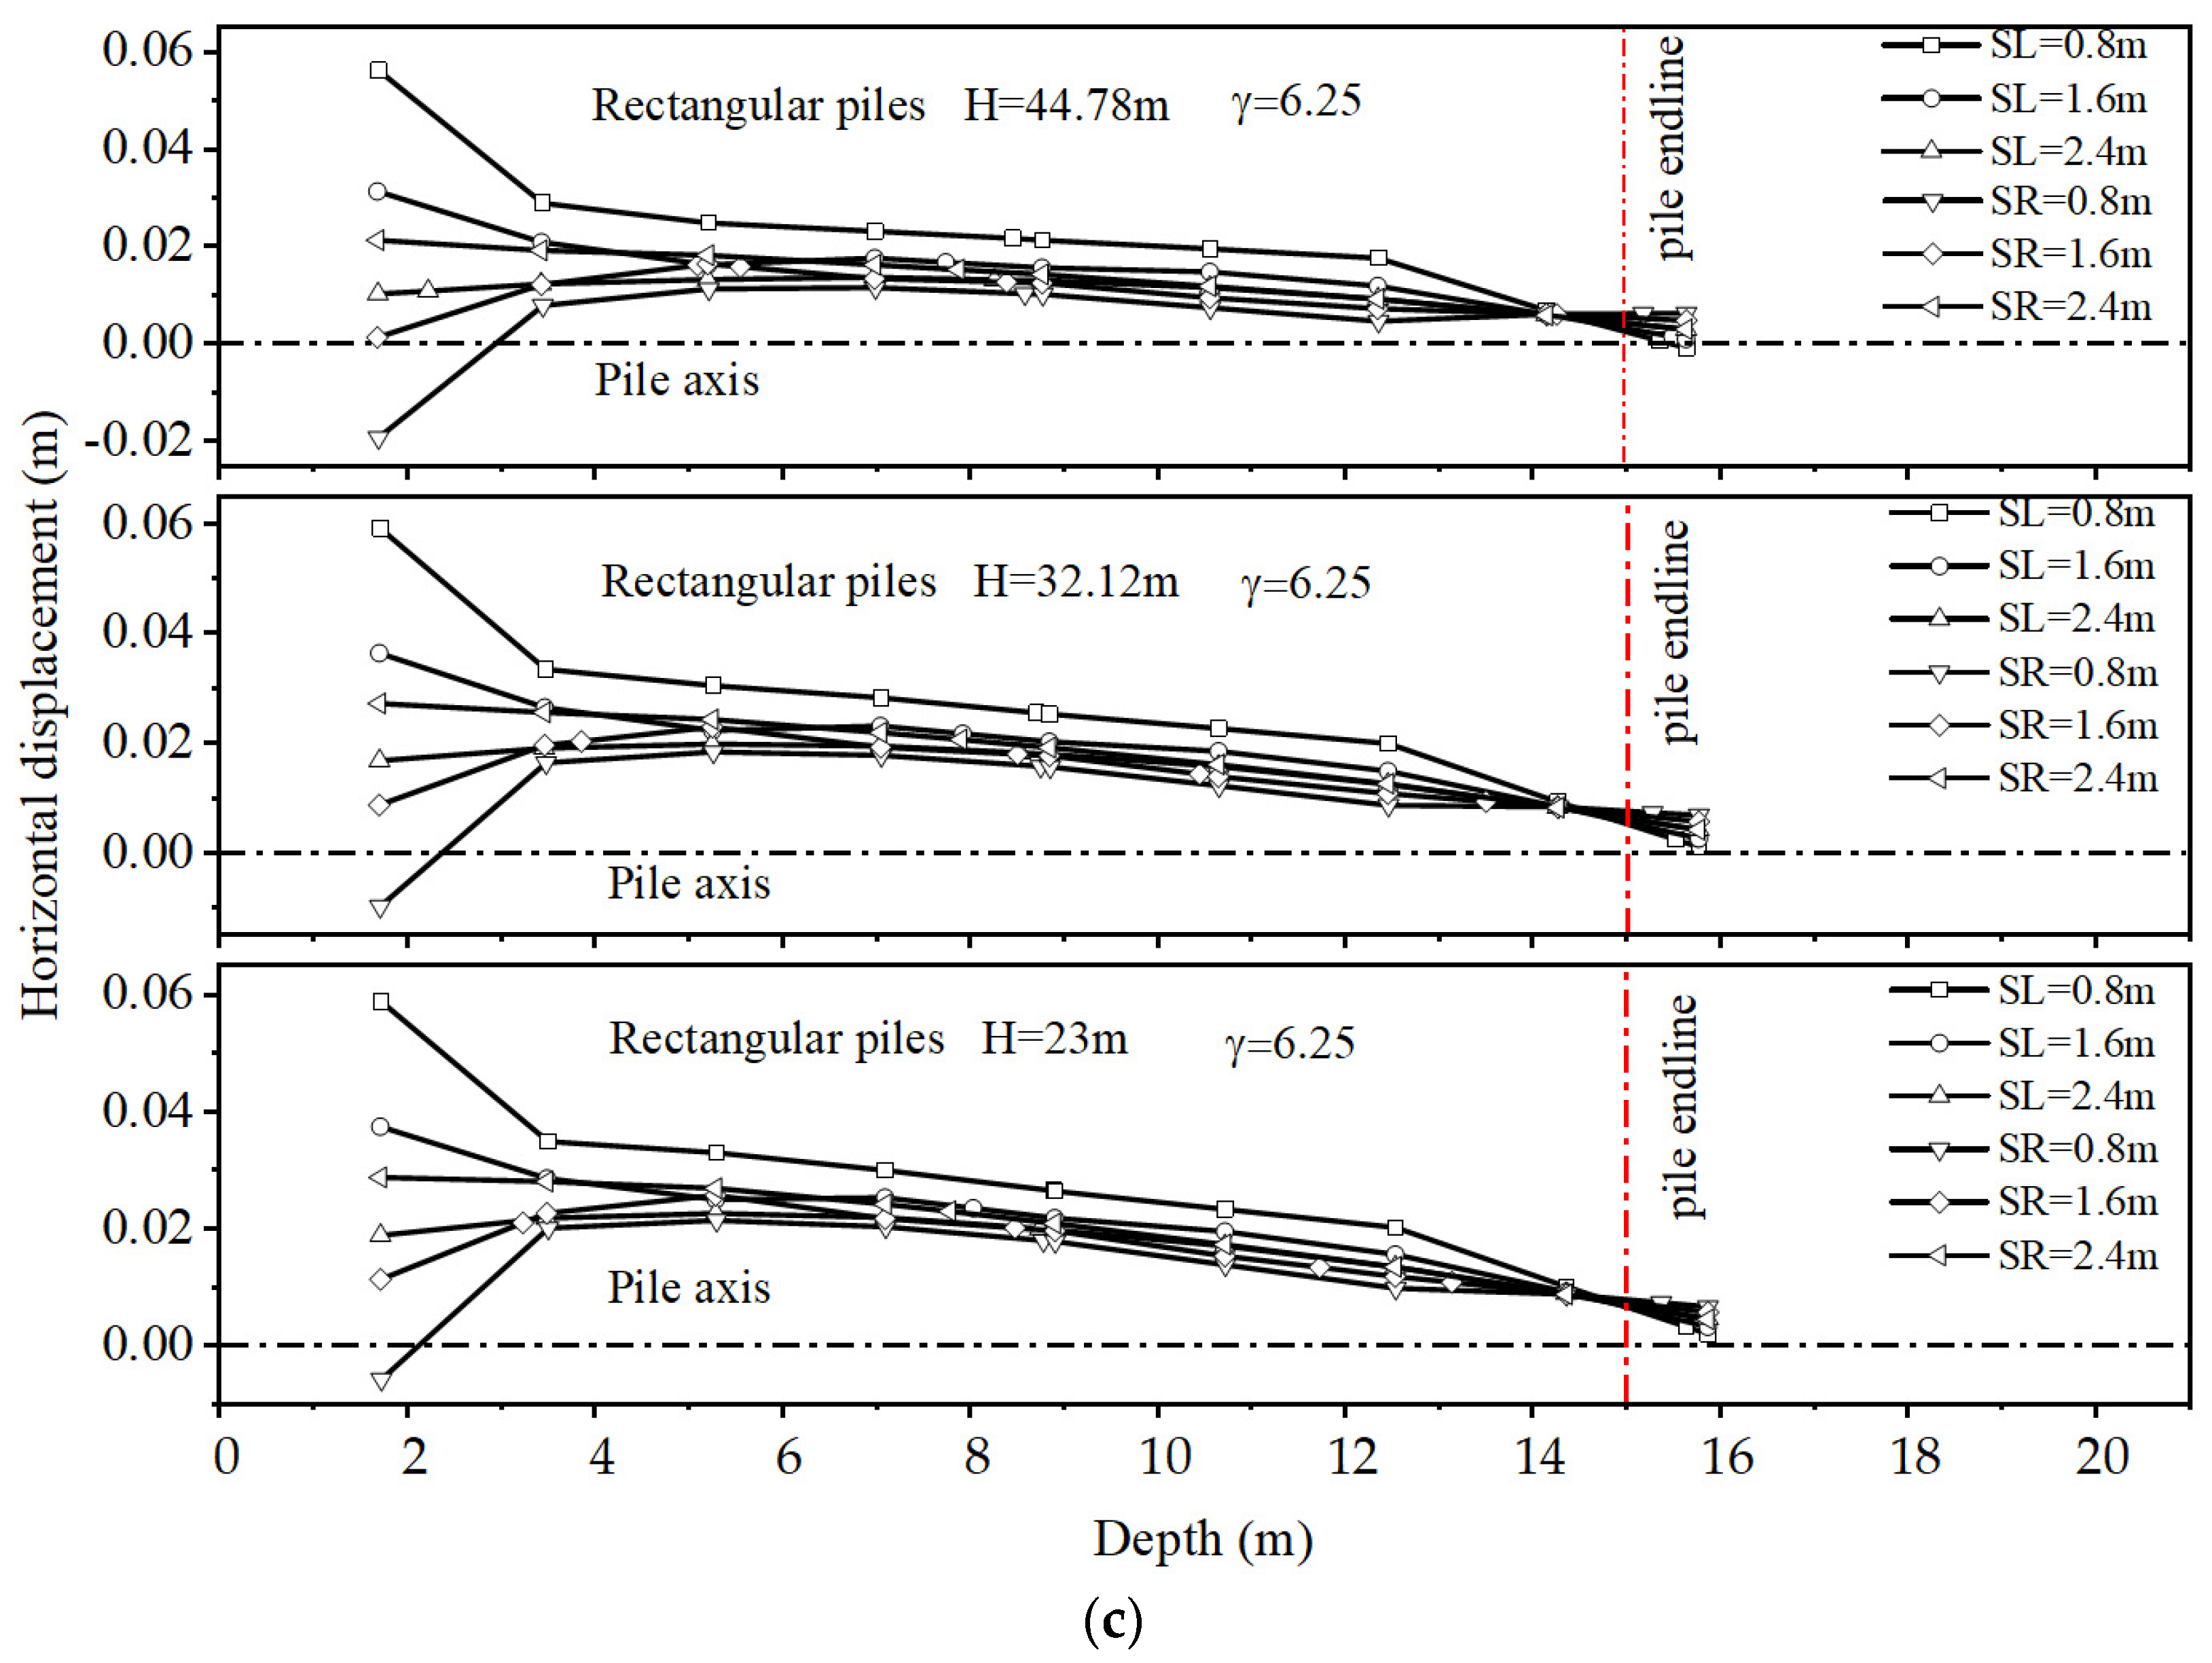
4.3.2. Soil Displacement around the Pile

The values of the slenderness ratio (γ) studied in this section are 15, 9.35, and 6.25, and the values of seawater depth variation are H = 44.78 m, H = 32.12 m, and H = 23 m, while other parameters are kept constant. Figure 13 shows the horizontal displacement of the foundation on the left and right sides of the center pile for the nine conditions of γ and H. The immersed tunnel has a high density and large mass. Fixed contact is used between the sand compaction pile, gravel cushion, and tunnel in the numerical model, thus forming a top-heavy and bottom-light structure with SCP. Seismic injury mainly produces acceleration differences in the structure, which is then subjected to shear. The mass distribution of top-heavy and bottom-light will enlarge this acceleration difference, which makes the shear near the connection between the SCP and the tunnel larger, and thus, a larger displacement occurs at a depth of 2 m. The pile embedment depth below 2 m depth is large, and the soil densification degree is high enough to resist the lateral load, so the displacement below 2 m gradually decreases.
In the case of the same seawater depth, when the embedment depth L decreases from 15 D to 6.25 D, the horizontal displacement difference between the two sides of the pile increases. The area of the difference extends from 7 m below the top of the pile to the end of the pile. It can be seen that when using SCP to strengthen the lateral deformation resistance of the foundation, it should be avoided that the embedding depth is too deep, leading to the destruction of the tip of the pile, and the embedding is too shallow, leading to the instability of the end of the pile.
In the case of the same embedding depth L, when the seawater depth H increases from 23.12 m to 44.78 m, the horizontal displacements of the foundations on the left and right sides of the pile are shifted to the right, forming a transformation process from curved parabola to flat parabola. The piled foundation produces a horizontal displacement away from the direction of the earthquake source, which is related to the resonance of the structure away from the source end. At this time, the horizontal displacement of the foundation on both sides of the pile shifted to the right as a whole without any significant change in the difference. It is worth noting that the maximum depth of foundation horizontal displacement that exists below the end of the pile is within 1 m.

5. Conclusions

In this paper, the stresses and deformations of pile-supported immersed tunnels under seismic loads are investigated by using a numerical model developed in ABAQUS. The numerical model results are verified by the physical model experiment of the SIS system. The mechanical behaviors of the immersed tunnel and pile–soil interaction under different loads and SCP arrangement were parametrically analyzed. The conclusions are as follows:
(1)
Increased seawater pressure suppresses the vertical frequency of the tunnel. The suppression is enhanced by the deformation of the tunnel’s “H-shaped” structures and stress transfer in the tunnel wall when the pile replacement rate reaches 50%.
(2)
The vertical frequency at the far end of the immersed tunnel from the source is similar to the seismic excitation frequency along the width of the tunnel, resulting in resonance. The seismic injury at the distal end is amplified.
(3)
The soil densification is higher at the end of the pile when the seawater pressure increases and the lateral earth pressure increases, resulting in a large change in the slope of the p-y curve at the tip of the pile. The increase in pile slenderness ratio (γ) will increase the axial force of the pile to produce an additional bending moment, resulting in large changes in the slope of the p-y curve at the end of the pile with larger axial force. When the slenderness ratio is in the range of 9.25 to 15, it can reduce the injury at the connection between piled foundations and tunnels.

Author Contributions

Conceptualization, H.F. and Y.Z.; methodology, H.F.; software, S.H.; validation, H.F., Y.Z. and Z.C.; formal analysis, S.H.; investigation, Z.C.; resources, Y.Z.; data curation, H.F.; writing—original draft preparation, H.F.; writing—review and editing, S.H.; visualization, Z.C.; supervision, S.H.; project administration, Z.C.; funding acquisition, Y.Z. All authors have read and agreed to the published version of the manuscript.

Funding

The financial support of the National Natural Science Foundation for General Program of China (Grant No. 52178316), and the National Science Foundation for Excellent Young Scholars of China (Grant No. 51922029) is acknowledged.

Institutional Review Board Statement

Not applicable.

Informed Consent Statement

Not applicable.

Data Availability Statement

The data presented in this study are available on request from the corresponding author.

Conflicts of Interest

The authors declare no conflict of interest.

References

  1. Olsen, T.; Kasper, T.; de Wit, J. Immersed tunnels in soft soil conditions experience from the last 20 years. Tunn. Undergr. Space Technol. 2022, 121, 104315. [Google Scholar] [CrossRef]
  2. Fu, B.-Y.; Chen, W.-L.; Xu, G.-P.; Song, S.-Y.; Xia, F.-Y. Summary of the Development of New Technologies for Submarine Immersed Tunnel Foundation Reinforcement and Settlement Control. IOP Conf. Ser. Mater. Sci. Eng. 2020, 741, 012052. [Google Scholar] [CrossRef]
  3. Grantz, W.C. Steel-Shell Immersed Tunnels-Forty Years of Experience. Tunn. Undergr. Space Technol. 1997, 12, 23–31. [Google Scholar] [CrossRef]
  4. Yu, H.; Yuan, Y.; Xu, G.; Su, Q.; Yan, X.; Li, C. Multi-point shaking table test for long tunnels subjected to non-uniform seismic loadings—Part II: Application to the HZM immersed tunnel. Soil Dyn. Earthq. Eng. 2018, 108, 187–195. [Google Scholar] [CrossRef]
  5. Lin, K.C.; Hung, H.H.; Yang, J.P.; Yang, Y.B. Seismic analysis of underground tunnels by the 2.5D finite/infinite element approach. Soil Dyn. Earthq. Eng. 2016, 85, 31–43. [Google Scholar] [CrossRef]
  6. Abate, G.; Massimino, M.R. Parametric analysis of the seismic response of coupled tunnel–soil–aboveground building systems by numerical modelling. Bull. Earthq. Eng. 2016, 15, 443–467. [Google Scholar] [CrossRef]
  7. Zhang, G.; Wang, P.; Zhao, M.; Du, X.; Zhao, X. Seismic structure-water-sediment-rock interaction model and its application to immersed tunnel analysis under obliquely incident earthquake. Tunn. Undergr. Space Technol. 2021, 109, 103758. [Google Scholar] [CrossRef]
  8. Wang, Z.Z.; Jiang, L.; Gao, Y. Shaking table test of seismic response of immersed tunnels under effect of water. Soil Dyn. Earthq. Eng. 2019, 116, 436–445. [Google Scholar] [CrossRef]
  9. Zhao, K.; Zhu, S.; Bai, X.; Wang, Q.; Chen, S.; Zhuang, H.; Chen, G. Seismic response of immersed tunnel in liquefiable seabed considering ocean environmental loads. Tunn. Undergr. Space Technol. 2021, 115, 104066. [Google Scholar] [CrossRef]
  10. Zhao, W.; Gao, H.; Chen, W.; Xie, P. Analytical study on seismic response of subsea tunnels in a multi-layered seabed subjected to P- and SV-waves. Tunn. Undergr. Space Technol. 2023, 134, 105015. [Google Scholar] [CrossRef]
  11. Yang, Y.B.; Zhou, Z.Y. Seabed seismic analysis using exact responses of solid-liquid free field for 2D oblique incident waves by finite/infinite element method. Ocean. Eng. 2023, 285, 115171. [Google Scholar] [CrossRef]
  12. Zhang, S.; Yuan, Y.; Li, C.; Chen, H.; Chen, Z. Seismic responses of long segmental immersed tunnel under unfavorable loads combination. Transp. Geotech. 2021, 30, 100621. [Google Scholar] [CrossRef]
  13. Aarthi, N.; Dodagoudar, G.R. Three-Dimensional Finite-Element Analysis of Pressure–Settlement Response of Sand Compaction Pile-Treated Cohesionless Deposits. Int. J. Geomech. 2021, 21, 04021019. [Google Scholar] [CrossRef]
  14. Padmanabhan, G.; Shanmugam, G.K. Liquefaction and reliquefaction resistance of saturated sand deposits treated with sand compaction piles. Bull. Earthq. Eng. 2021, 19, 4235–4259. [Google Scholar] [CrossRef]
  15. Su, D.; Wu, Z.; Lei, G.; Zhu, M. Numerical study on the installation effect of a jacked pile in sands on the pile vertical bearing capacities. Comput. Geotech. 2022, 145, 104690. [Google Scholar] [CrossRef]
  16. Hongtao, H.; Li, J.; Lin, Y. A large-scale field test on sand compaction piles including three-dimensional numerical analysis. Int. J. Comput. Appl. Technol. 2020, 6, 296–306. [Google Scholar] [CrossRef]
  17. Yadav, S.K.; Ye, G.-L.; Khalid, U.; Fukuda, M. Numerical and centrifugal physical modelling on soft clay improved with floating and fixed sand compaction piles. Comput. Geotech. 2019, 115, 103160. [Google Scholar] [CrossRef]
  18. He, H.; Lin, Y.; Li, J.; Zhang, N. Immersed tunnel foundation on marine clay improved by sand compaction piles. Mar. Georesour. Geotechnol. 2017, 36, 218–226. [Google Scholar] [CrossRef]
  19. Kiani, K. A nonlocal meshless solution for flexural vibrations of double-walled carbon nanotubes. Appl. Math. Comput. 2014, 234, 557–578. [Google Scholar] [CrossRef]
  20. Hossain, M.Z.; Abedin, M.Z.; Rahman, M.R.; Haque, M.N.; Jadid, R. Effectiveness of sand compaction piles in improving loose cohesionless soil. Transp. Geotech. 2021, 26, 100451. [Google Scholar] [CrossRef]
  21. Heo, Y.; Jeong, G.C.; Bae, W.S. Evaluation of the Effect of Penetration Ratios on Composite Grounds Improved with Sand Compaction Piles. Mar. Georesour. Geotechnol. 2014, 33, 253–263. [Google Scholar] [CrossRef]
  22. OuYang, H.; Dai, G.; Gao, L.; Wang, A.; Gong, W. Lateral response of monopile reinforced by cement-improved soil in clay to monotonic and cyclic loadings: Laboratory model test and theoretical investigation. Mar. Struct. 2023, 89, 103403. [Google Scholar] [CrossRef]
  23. Askarinejad, A.; Wang, H.; Chortis, G.; Gavin, K. Influence of scour protection layers on the lateral response of monopile in dense sand. Ocean. Eng. 2022, 244, 110377. [Google Scholar] [CrossRef]
  24. Spyridis, M.; Lopez-Querol, S. Numerical investigation of displacement pile installation in silica sand. Comput. Geotech. 2023, 161, 105591. [Google Scholar] [CrossRef]
  25. Trojnar, K. Experimental and Numerical Investigation of Lateral Loaded Flexible Hybrid Piles in Sand. Int. J. Civ. Eng. 2022, 21, 1–18. [Google Scholar] [CrossRef]
  26. Kiani, K. Axial buckling analysis of vertically aligned ensembles of single-walled carbon nanotubes using nonlocal discrete and continuous models. Acta Mech. 2014, 225, 3569–3589. [Google Scholar] [CrossRef]
  27. Chen, B.; Lin, B.; Zhao, X.; Zhu, W.; Yang, Y.; Li, Y. Closed-form solutions for forced vibrations of a cracked double-beam system interconnected by a viscoelastic layer resting on Winkler–Pasternak elastic foundation. Thin-Walled Struct. 2021, 163, 107688. [Google Scholar] [CrossRef]
  28. Chen, L.; Xu, D.; Du, J.; Zhong, C. Flexural Vibration Analysis of Nonuniform Double-Beam System with General Boundary and Coupling Conditions. Shock. Vib. 2018, 2018, 5103174. [Google Scholar] [CrossRef]
  29. Kiani, K. In- and out-of-plane dynamic flexural behaviors of two-dimensional ensembles of vertically aligned single-walled carbon nanotubes. Phys. B Condens. Matter 2014, 449, 164–180. [Google Scholar] [CrossRef]
  30. Kiani, K. Nonlocal free dynamic analysis of periodic arrays of single-walled carbon nanotubes in the presence of longitudinal thermal and magnetic fields. Comput. Math. Appl. 2018, 75, 3849–3872. [Google Scholar] [CrossRef]
  31. Kiani, K.; Pakdaman, H. Nonlocal vibrations and potential instability of monolayers from double-walled carbon nanotubes subjected to temperature gradients. Int. J. Mech. Sci. 2018, 144, 576–599. [Google Scholar] [CrossRef]
  32. Niu, Y.; Xie, Y.; Zhang, H.; Yue, X.; Han, Y.; Hu, Z. Study on bearing characteristics of marine subsoil for semi-rigid immersed tunnel. Mar. Georesour. Geotechnol. 2021, 40, 1171–1183. [Google Scholar] [CrossRef]
  33. Kou, K.P.; Yang, Y. A meshfree boundary-domain integral equation method for free vibration analysis of the functionally graded beams with open edged cracks. Compos. Part B Eng. 2019, 156, 303–309. [Google Scholar] [CrossRef]
  34. Ma, X.; Roshan, M.; Kiani, K.; Nikkhoo, A. Dynamic Response of an Elastic Tube-like Nanostructure Embedded in a Vibrating Medium and under the Action of Moving Nano-Objects. Symmetry 2023, 15, 1827. [Google Scholar] [CrossRef]
  35. Su, C.; Wang, P.; Zhao, M.; Zhang, G.; Bao, X. Dynamic interaction analysis of structure-water-soil-rock systems under obliquely incident seismic waves for layered soils. Ocean. Eng. 2022, 244, 110256. [Google Scholar] [CrossRef]
  36. Li Yan, P.M.B. Lateral pile response to monotonic pile head loading. Can. Geotec. J. 1992, 29, 955–970. [Google Scholar] [CrossRef]
  37. Ashford, S.A.; Juirnarongrit, T.; Sugano, T.; Hamada, M. Soil–Pile Response to Blast-Induced Lateral Spreading. I: Field Test. ASCE 2006, 132, 152–162. [Google Scholar] [CrossRef]
  38. Dyson, G.J.; Randolph, M.F. Monotonic lateral loading of piles in calcareous sand. J. Geotech. Geoenviron. Eng. 2001, 127, 346–352. [Google Scholar] [CrossRef]
  39. Liu, J.; Du, Y.; Du, X.; Wang, Z.; Wu, J. 3D viscous-spring artificial boundary in time domain. Eearthquake Eng. Eng. Vib. 2006, 5, 90–102. [Google Scholar] [CrossRef]
  40. Ye, J.; He, K.; Zhou, L. Subsidence prediction of a rubble mound breakwater at Yantai port: A application of FSSI-CAS 2D. Ocean. Eng. 2021, 219, 108349. [Google Scholar] [CrossRef]
  41. Miyamoto, J.; Sassa, S.; Sekiguchi, H. Progressive solidification of a liquefied sand layer during continued wave loading. Geotechnique 2004, 54, 617–629. [Google Scholar] [CrossRef]
  42. Wen, K.; Wu, X.; Zhu, B. Numerical investigation on the lateral loading behaviour of tetrapod piled jacket foundations in medium dense sand. Appl. Ocean. Res. 2020, 100, 102193. [Google Scholar] [CrossRef]
  43. Deng, Y.; Zeng, Z.; Jha, K.; Huang, D. Problem-Based Cybersecurity Lab with Knowledge Graph as Guidance. J. Artif. Intell. Technol. 2022, 2, 55–61. [Google Scholar] [CrossRef]
  44. Hu, X.; Kuang, Q.; Cai, Q.; Xue, Y.; Zhou, W.; Li, Y. A Coherent Pattern Mining Algorithm Based on All Contiguous Column Bicluster. J. Artif. Intell. Technol. 2022, 2, 80–92. [Google Scholar] [CrossRef]
  45. Jia, Z.; Wang, W.; Zhang, J. Contact High Temperature Strain Automatic Calibration and Precision Compensation Technology. J. Artif. Intell. Technol. 2022, 2, 69–76. [Google Scholar] [CrossRef]
  46. Jiang, T.; Yang, X.; Yang, Y.; Chen, X.; Bi, M.; Chen, J. Wavelet method optimised by ant colony algorithm used for extracting stable and unstable signals in intelligent substations. CAAI Trans. Intell. Technol. 2021, 7, 292–300. [Google Scholar] [CrossRef]
  47. Khan, J.; Lee, E.; Kim, K. A higher prediction accuracy–based alpha–beta filter algorithm using the feedforward artificial neural network. CAAI Trans. Intell. Technol. 2022. early preview. [Google Scholar] [CrossRef]
  48. Wang, H.; Yue, W.; Wen, S.; Xu, X.; Haasis, H.D.; Su, M.; Liu, P.; Zhang, S.; Du, P. An improved bearing fault detection strategy based on artificial bee colony algorithm. CAAI Trans. Intell. Technol. 2022, 7, 570–581. [Google Scholar] [CrossRef]
  49. Kiani, K. Elastic wave propagation in magnetically affected double-walled carbon nanotubes. Meccanica 2014, 50, 1003–1026. [Google Scholar] [CrossRef]
  50. Kiani, K. Free vibrations of elastically embedded stocky single-walled carbon nanotubes acted upon by a longitudinally varying magnetic field. Meccanica 2015, 50, 3041–3067. [Google Scholar] [CrossRef]
  51. Selim, B.A.; Liu, Z. Impact analysis of functionally-graded graphene nanoplatelets-reinforced composite plates laying on Winkler-Pasternak elastic foundations applying a meshless approach. Eng. Struct. 2021, 241, 112453. [Google Scholar] [CrossRef]
  52. He, C.; Xu, G.; Zhang, Z.; Li, W. Seismic Response of Immersed Tunnel Subject to Oblique Incidence of SV Wave. Appl. Sci. 2022, 12, 10440. [Google Scholar] [CrossRef]
  53. Kowalczyk, P.; Gajo, A. Influence of pore pressure on natural frequency wandering of structures under earthquake conditions. Soil Dyn. Earthq. Eng. 2021, 142, 106534. [Google Scholar] [CrossRef]
  54. Aknouche, H.; Airouche, A.; Bechtoula, H. Influence of Earthquake Frequency Nonstationarity on Seismic Structural Response. Iran. J. Sci. Technol. Trans. Civ. Eng. 2020, 44, 603–614. [Google Scholar] [CrossRef]
  55. Saleh Asheghabadi, M.; Rahgozar, M.A. Finite Element Seismic Analysis of Soil–Tunnel Interactions in Clay Soils. Iran. J. Sci. Technol. Trans. Civ. Eng. 2018, 43, 835–849. [Google Scholar] [CrossRef]
  56. Wang, S.; Xu, T.-J.; Dong, G.-H.; Wang, T.-Y. Numerical simulation of damping effect of ballast water system on motion response of immersed tunnel element. Ocean. Eng. 2023, 281, 114795. [Google Scholar] [CrossRef]
  57. Lu, W.; Kaynia, A.M.; Zhang, G. Centrifuge study ofp–ycurves for vertical–horizontal static loading of piles in sand. Int. J. Phys. Model. Geotech. 2021, 21, 275–294. [Google Scholar] [CrossRef]
  58. Klinkvort, R.T.; Hededal, O. Effect of load eccentricity and stress level on monopile support for offshore wind turbines. Can. Geotech. J. 2014, 51, 966–974. [Google Scholar] [CrossRef]
  59. Zhu, S.; Chen, R.-P.; Kang, X. Centrifuge modelling of a tetrapod jacket foundation under lateral cyclic and monotonic loading in soft soil. Can. Geotech. J. 2021, 58, 637–649. [Google Scholar] [CrossRef]
  60. Lu, W.; Zhang, G. Influence mechanism of vertical-horizontal combined loads on the response of a single pile in sand. Soils Found. 2018, 58, 1228–1239. [Google Scholar] [CrossRef]
Figure 1. Physical properties of EPS and clay with different volume ratios: (a) Grading curves, (b) Specimen injury paths, (c) Deformation modulus.
Applsci 13 12092 g001aApplsci 13 12092 g001b
Figure 2. (a) Experimental equipment and SCP installation process, (b) Model size (θ is the angle of the pile arrangement).
Applsci 13 12092 g002aApplsci 13 12092 g002b
Figure 3. Time history curve of the seismic wave.
Applsci 13 12092 g003
Figure 4. Schematic of the numerical model. 1—Level surface; 2—Angle of incidence; 3—Seismic waves in X, Y, Z directions; 4—Incident wave.
Applsci 13 12092 g004
Figure 5. Viscoelastic boundary and seismic wave reflection.
Applsci 13 12092 g005
Figure 6. Normal velocity and normal displacement time history curves on the surface of the numerical model: (a) bottom surface, (b) side surface.
Applsci 13 12092 g006
Figure 7. (ac) settlement of the piled foundation, (d) acceleration amplitude of the tunnel.
Applsci 13 12092 g007
Figure 8. Maximum principal stresses of the tunnel: (a) bottom plate, (b) top plate.
Applsci 13 12092 g008aApplsci 13 12092 g008b
Figure 9. Horizontal displacement of the “H-shaped” structure.
Applsci 13 12092 g009
Figure 10. Settlement of the gravel cushion: (a) along the width direction, (b) along the length direction.
Applsci 13 12092 g010
Figure 11. Vertical strain at the bottom of the gravel cushion.
Applsci 13 12092 g011
Figure 12. p-y curves of the piles with different seawater depths: (a) plum blossom piles, (b) diagonal piles, (c) rectangular piles.
Applsci 13 12092 g012aApplsci 13 12092 g012b
Figure 13. Horizontal displacements of foundations at 0.8 m, 1.6 m, and 2.4 m to the left and right of the center pile: (a) plum blossom piles, (b) diagonal piles, (c) rectangular piles.
Applsci 13 12092 g013aApplsci 13 12092 g013b
Table 1. Dimensions of piled foundations in model experiments.
Modeling TypeComponentPropertiesM1M2M3
Numerical modelSCPOuter diameter [m]2.41.61
Number × Length [m]14 × 1523 × 1525 × 15
FoundationSurface area [m2]52.91 × 3 S (Pile spacing)
Deformation modulus ES [kPa]ES = ES*
Physical modelSCPOuter diameter [mm]483220
Number×Length [m]4 × 0.55 × 0.57 × 0.5
FoundationSurface area [m2]0.09
Deformation modulus ES* [kPa]ES* = ES
Note: M1, M2, and M3 represent the three SCP arrangements.
Table 2. Material constants for modeling.
ParametersMarine ClaySCPImmersedGravel CushionBackfill
Consolidation index, λ0.1130.023
Swelling index, Kr0.050580.0103
Critical state parameter, M0.6681.2
Poisson’s ratio, ν0.360.30.170.450.37
Density, ρ (g/m3)1.8511.7652.450.92
Buoyant density, ρw (g/m3)0.8010.7151.40.850.95
Cohesion, C (KPa)7.40.5
Friction angle φ (°)1530
Young’s modulus, E (KPa)2821.83E*30,00020,000150,000
Permeability, κ (m/s)1.8 × 10−83 × 10−5
Coefficient of lateral pressure0.5770.5
Initial void ratio, e01.0590.72
Degree of saturation11
Note: E* = 0.6σat(σm/σat)λ, where “σat” is the stress of atmospheric and “σm” is the current average principal stress in the soil unit under consideration [42].
Disclaimer/Publisher’s Note: The statements, opinions and data contained in all publications are solely those of the individual author(s) and contributor(s) and not of MDPI and/or the editor(s). MDPI and/or the editor(s) disclaim responsibility for any injury to people or property resulting from any ideas, methods, instructions or products referred to in the content.

