
Integrating SAR and Geographic Information Data Revealing Land Subsidence and Geological Risks of Shanghai City
Abstract
:1. Introduction
2. Methods
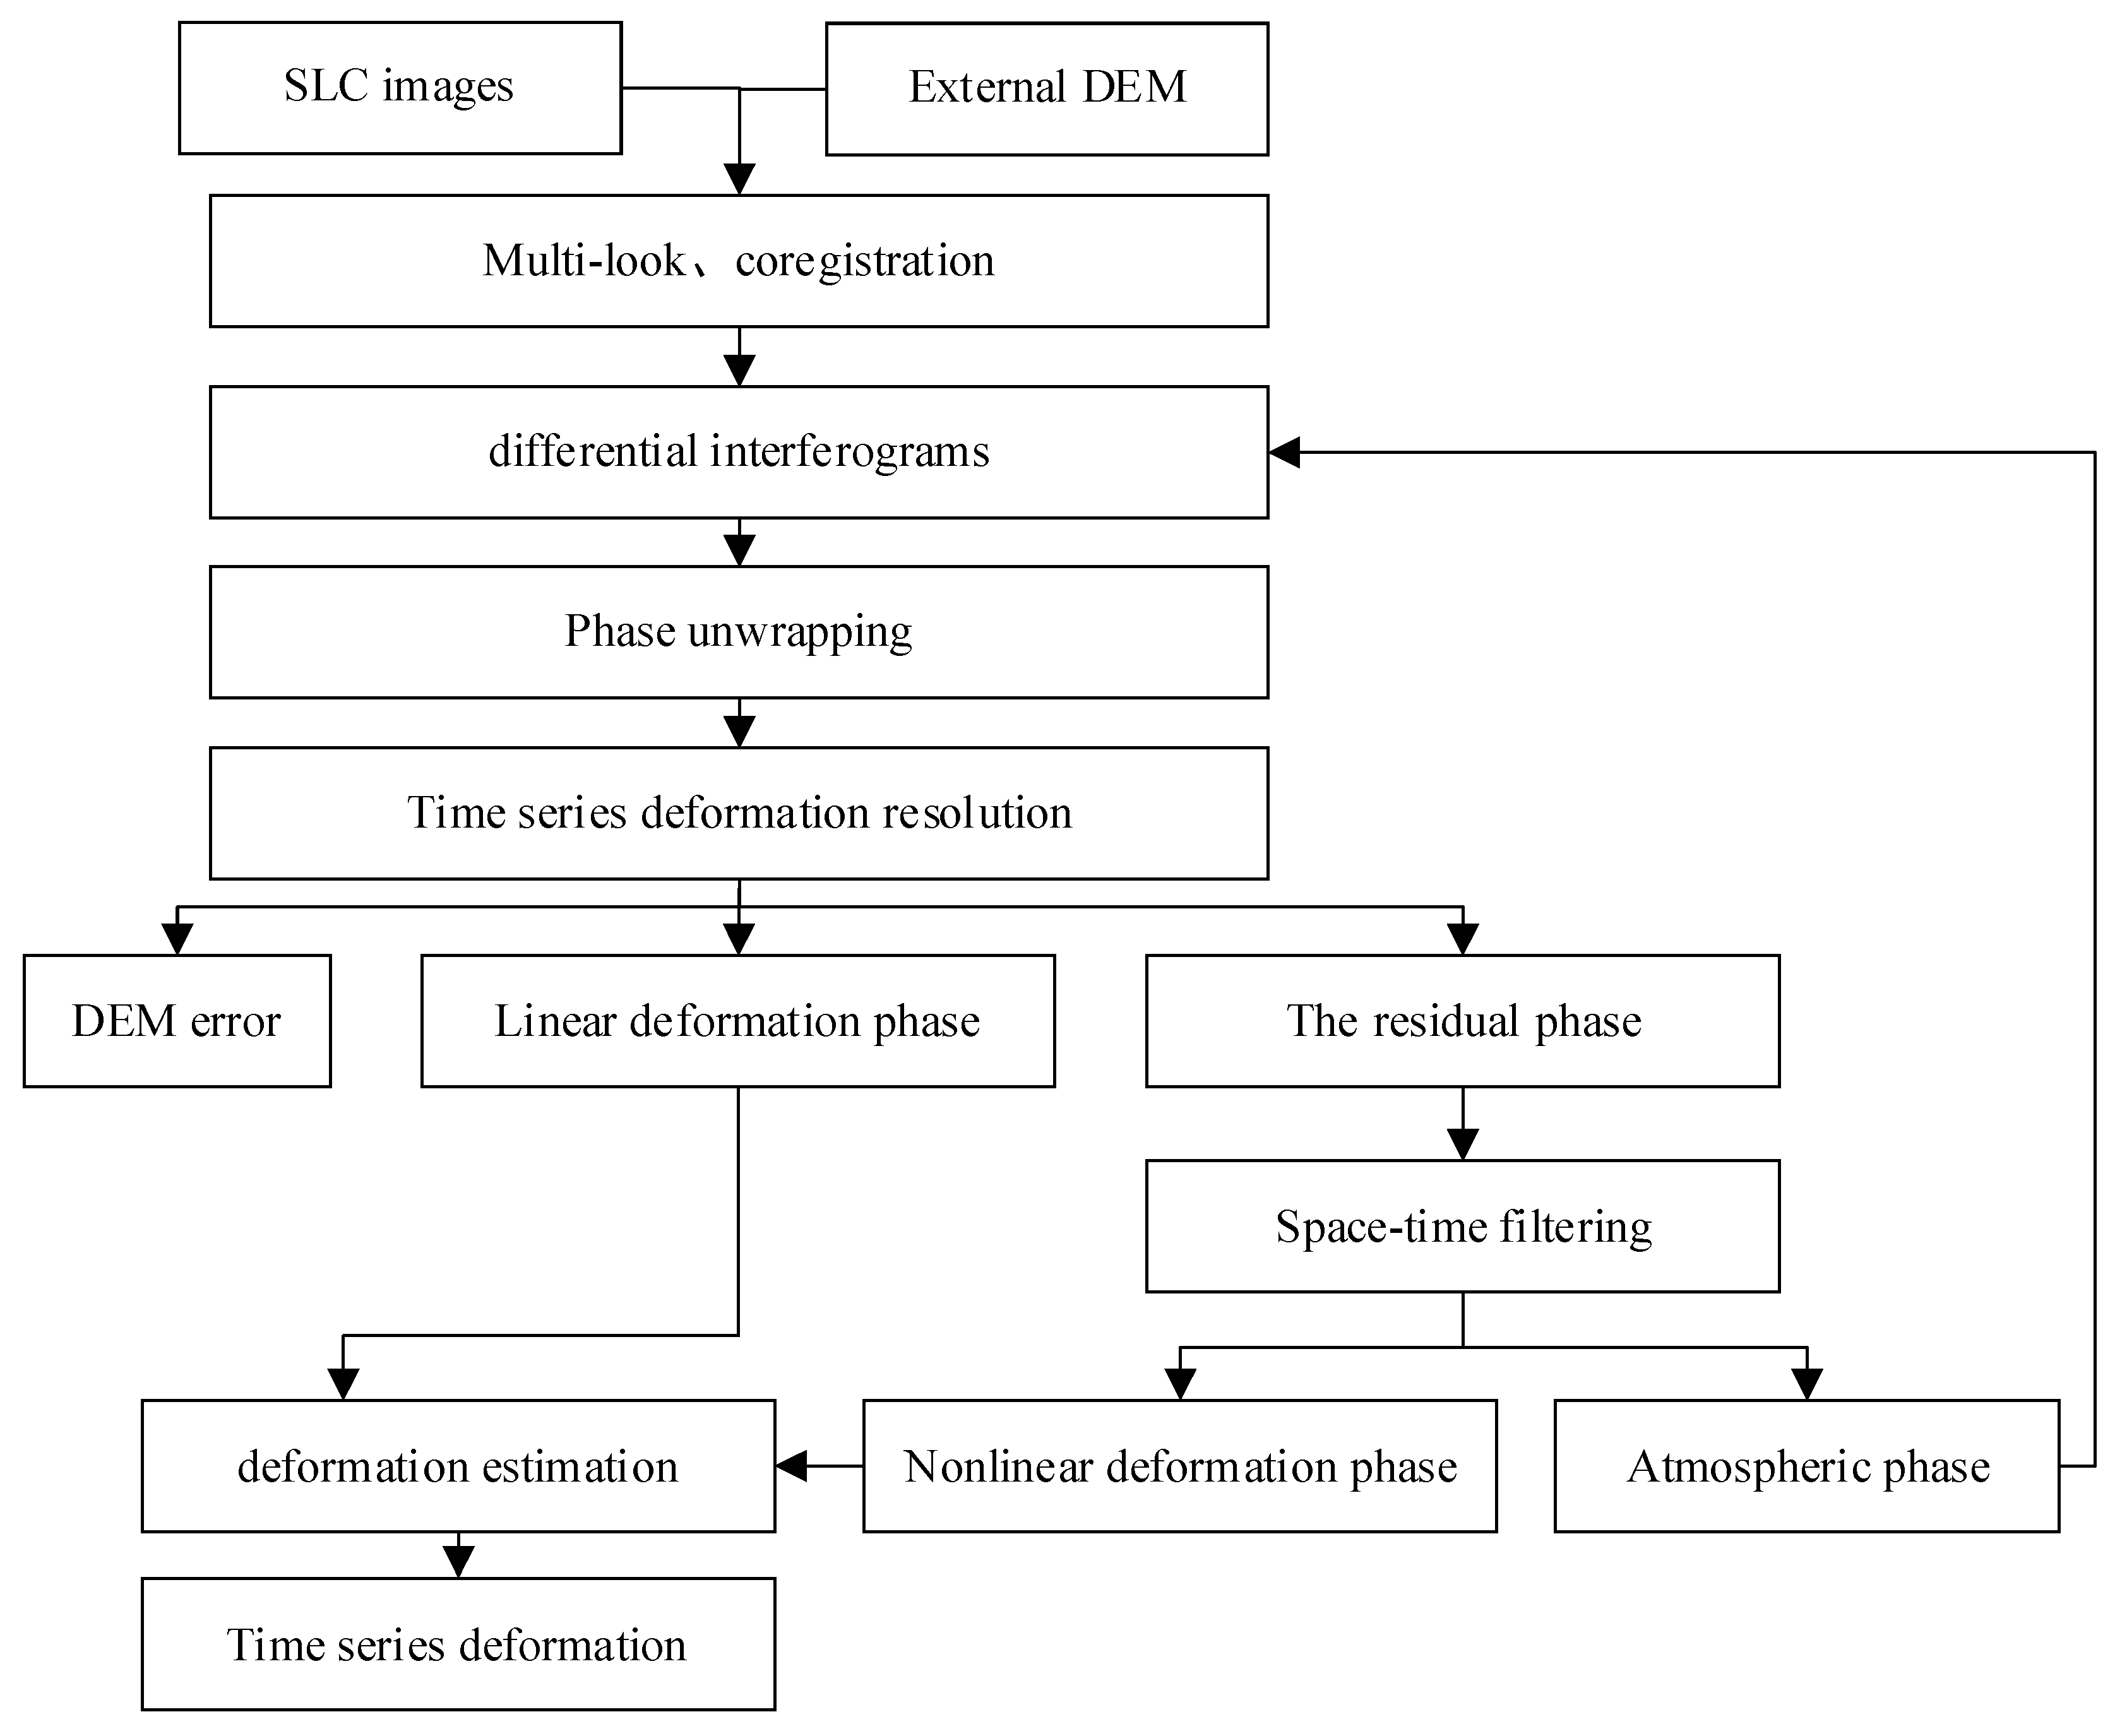
2.1. SBAS-InSAR
2.2. SSA
2.3. Entropy Method
3. Study Areas and Data Process
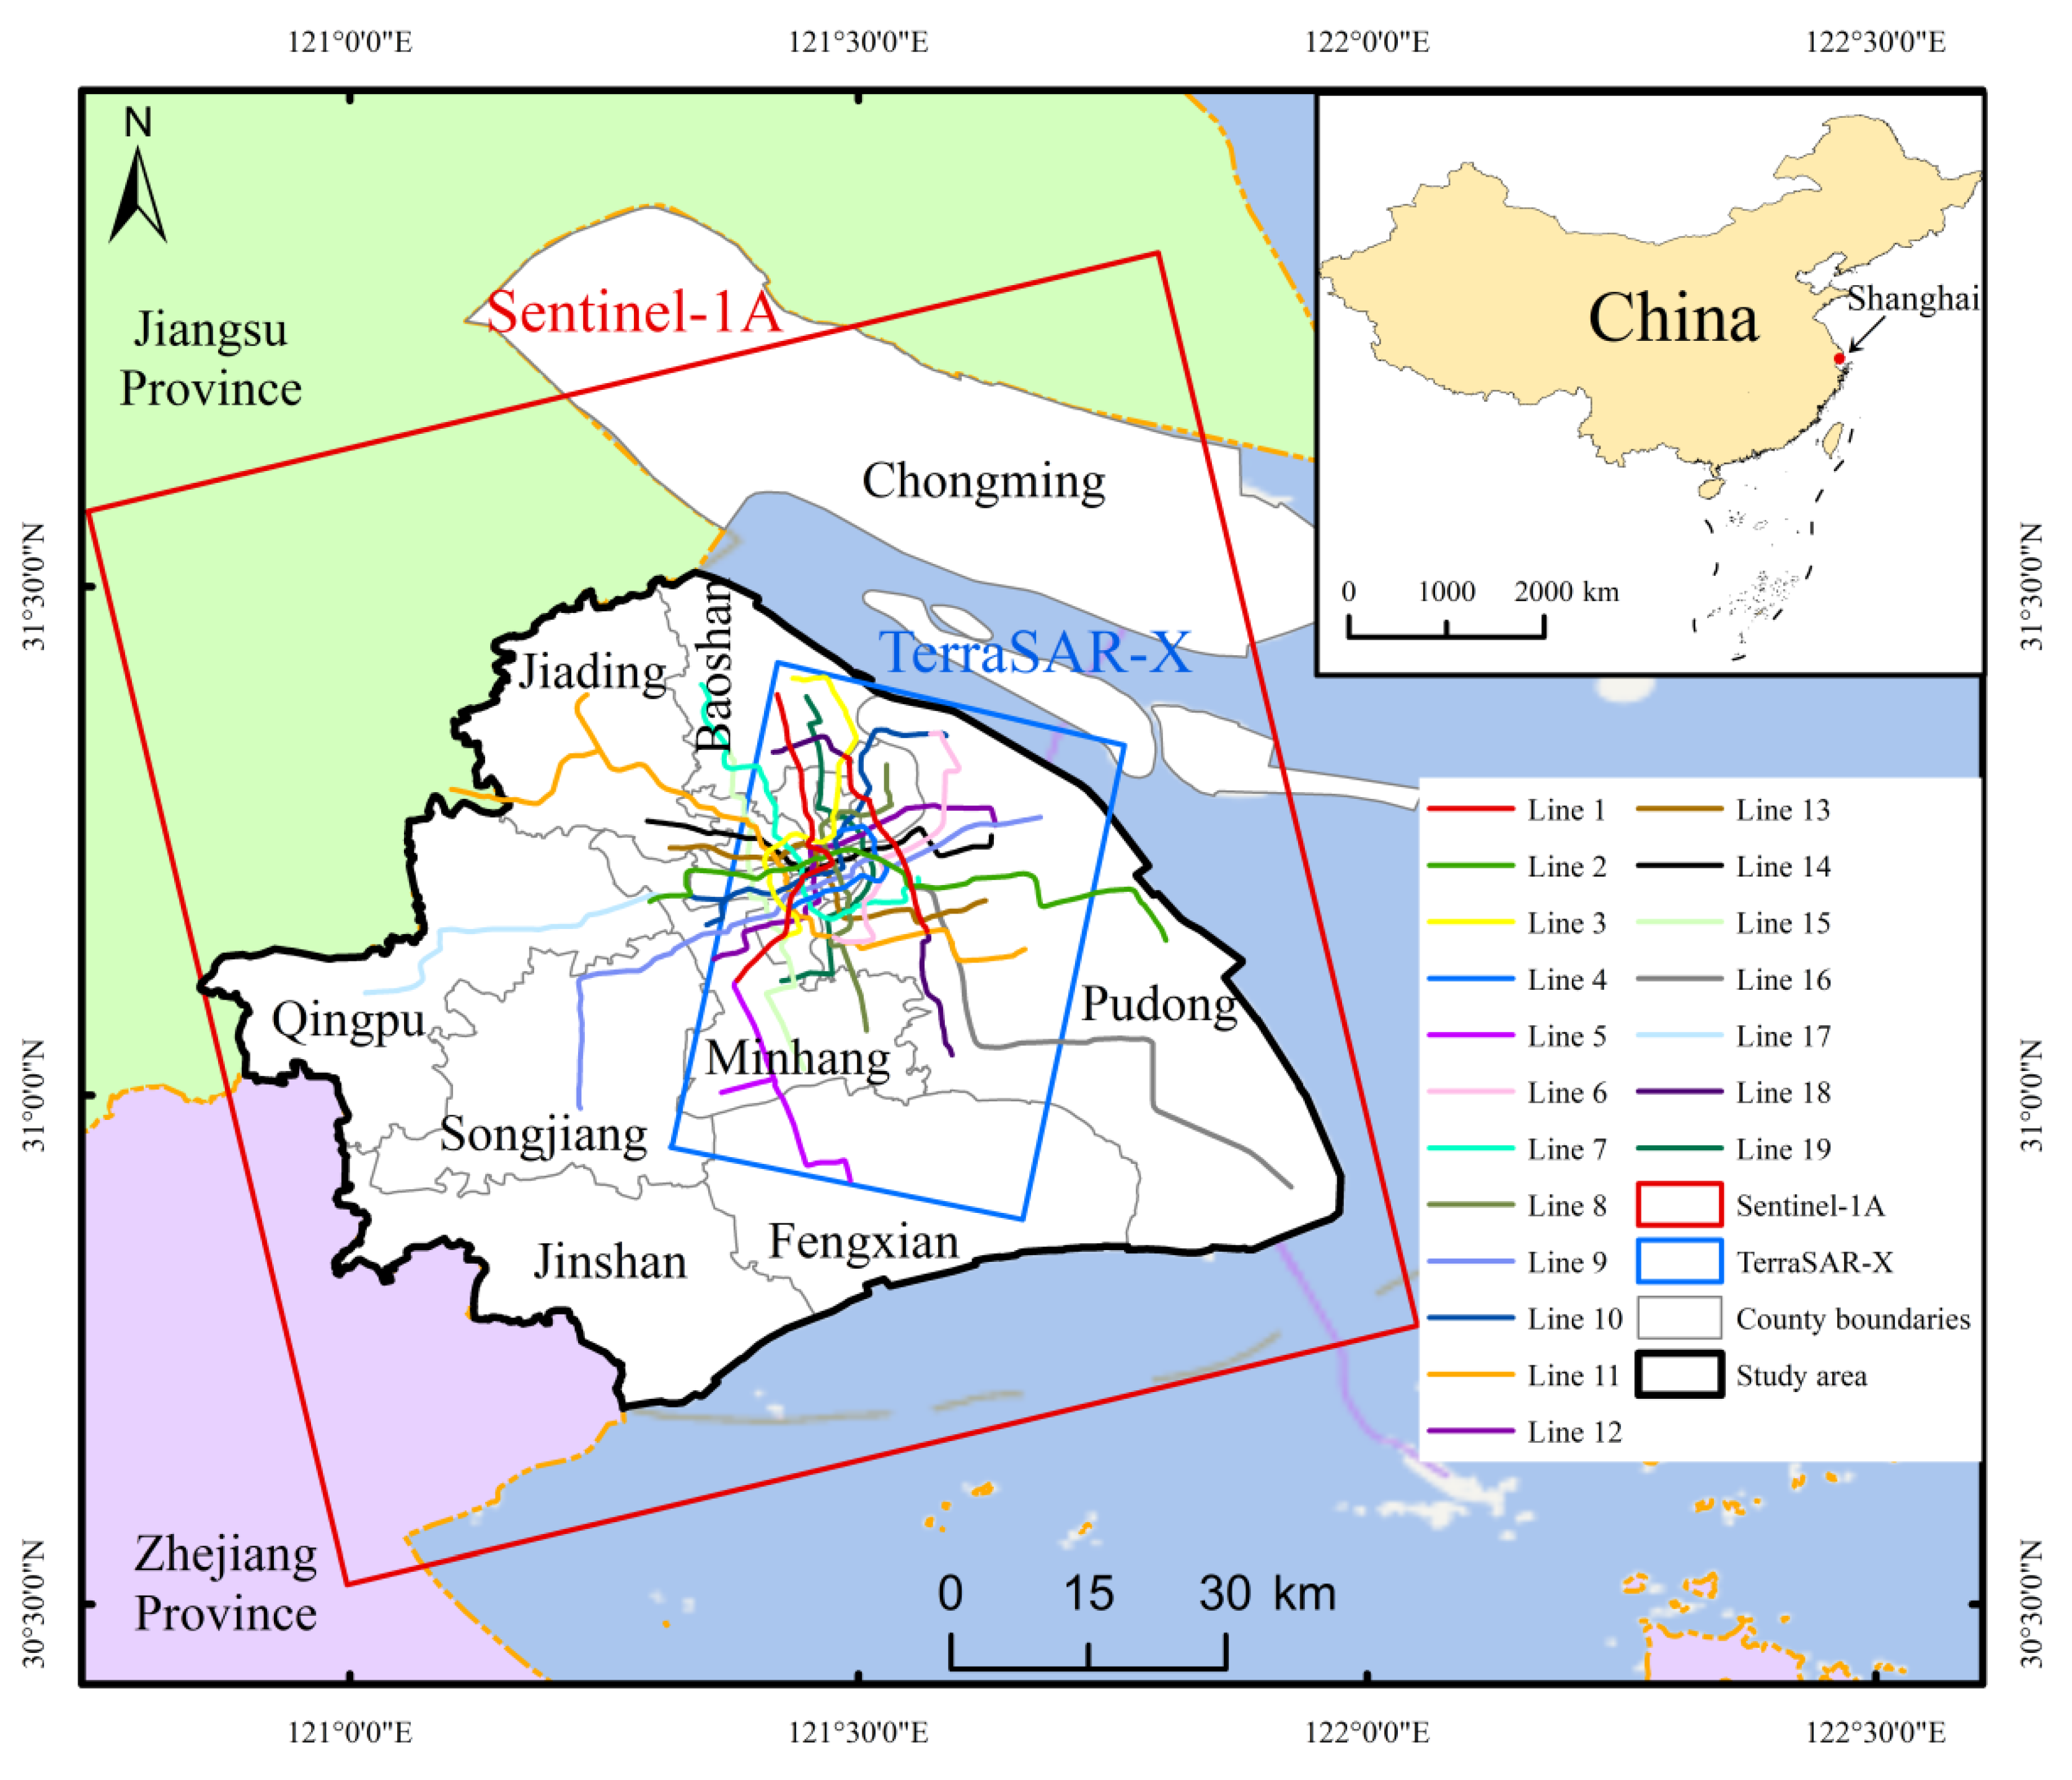
3.1. Overview of Study Areas
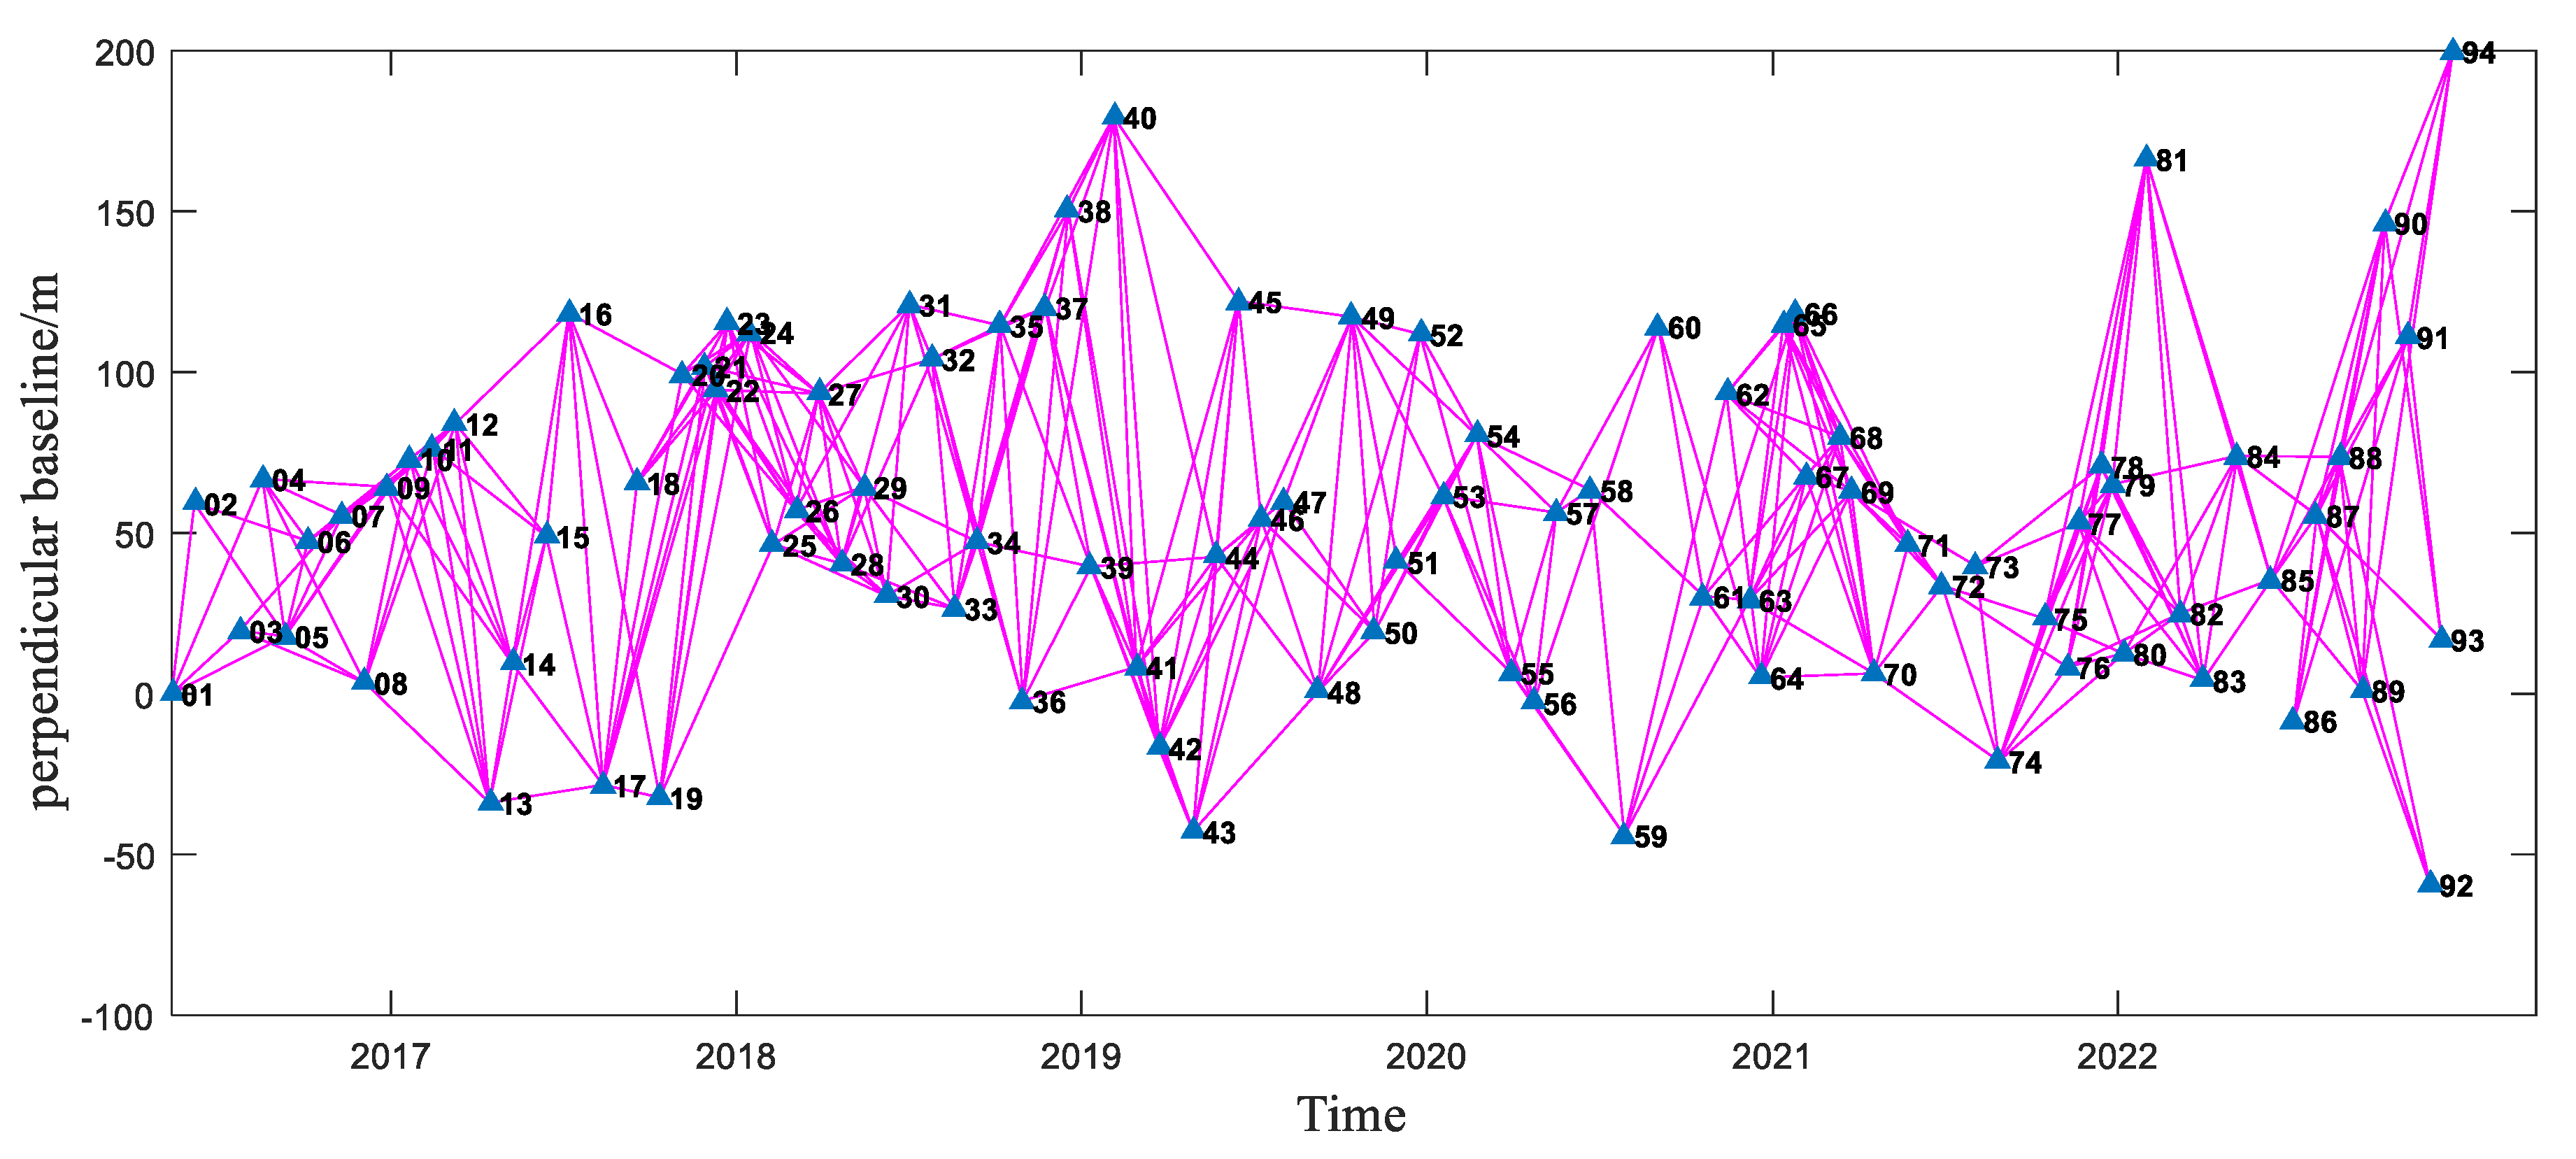
3.2. Data Introduction
3.3. Data Process
3.3.1. Land Subsidence Experiment
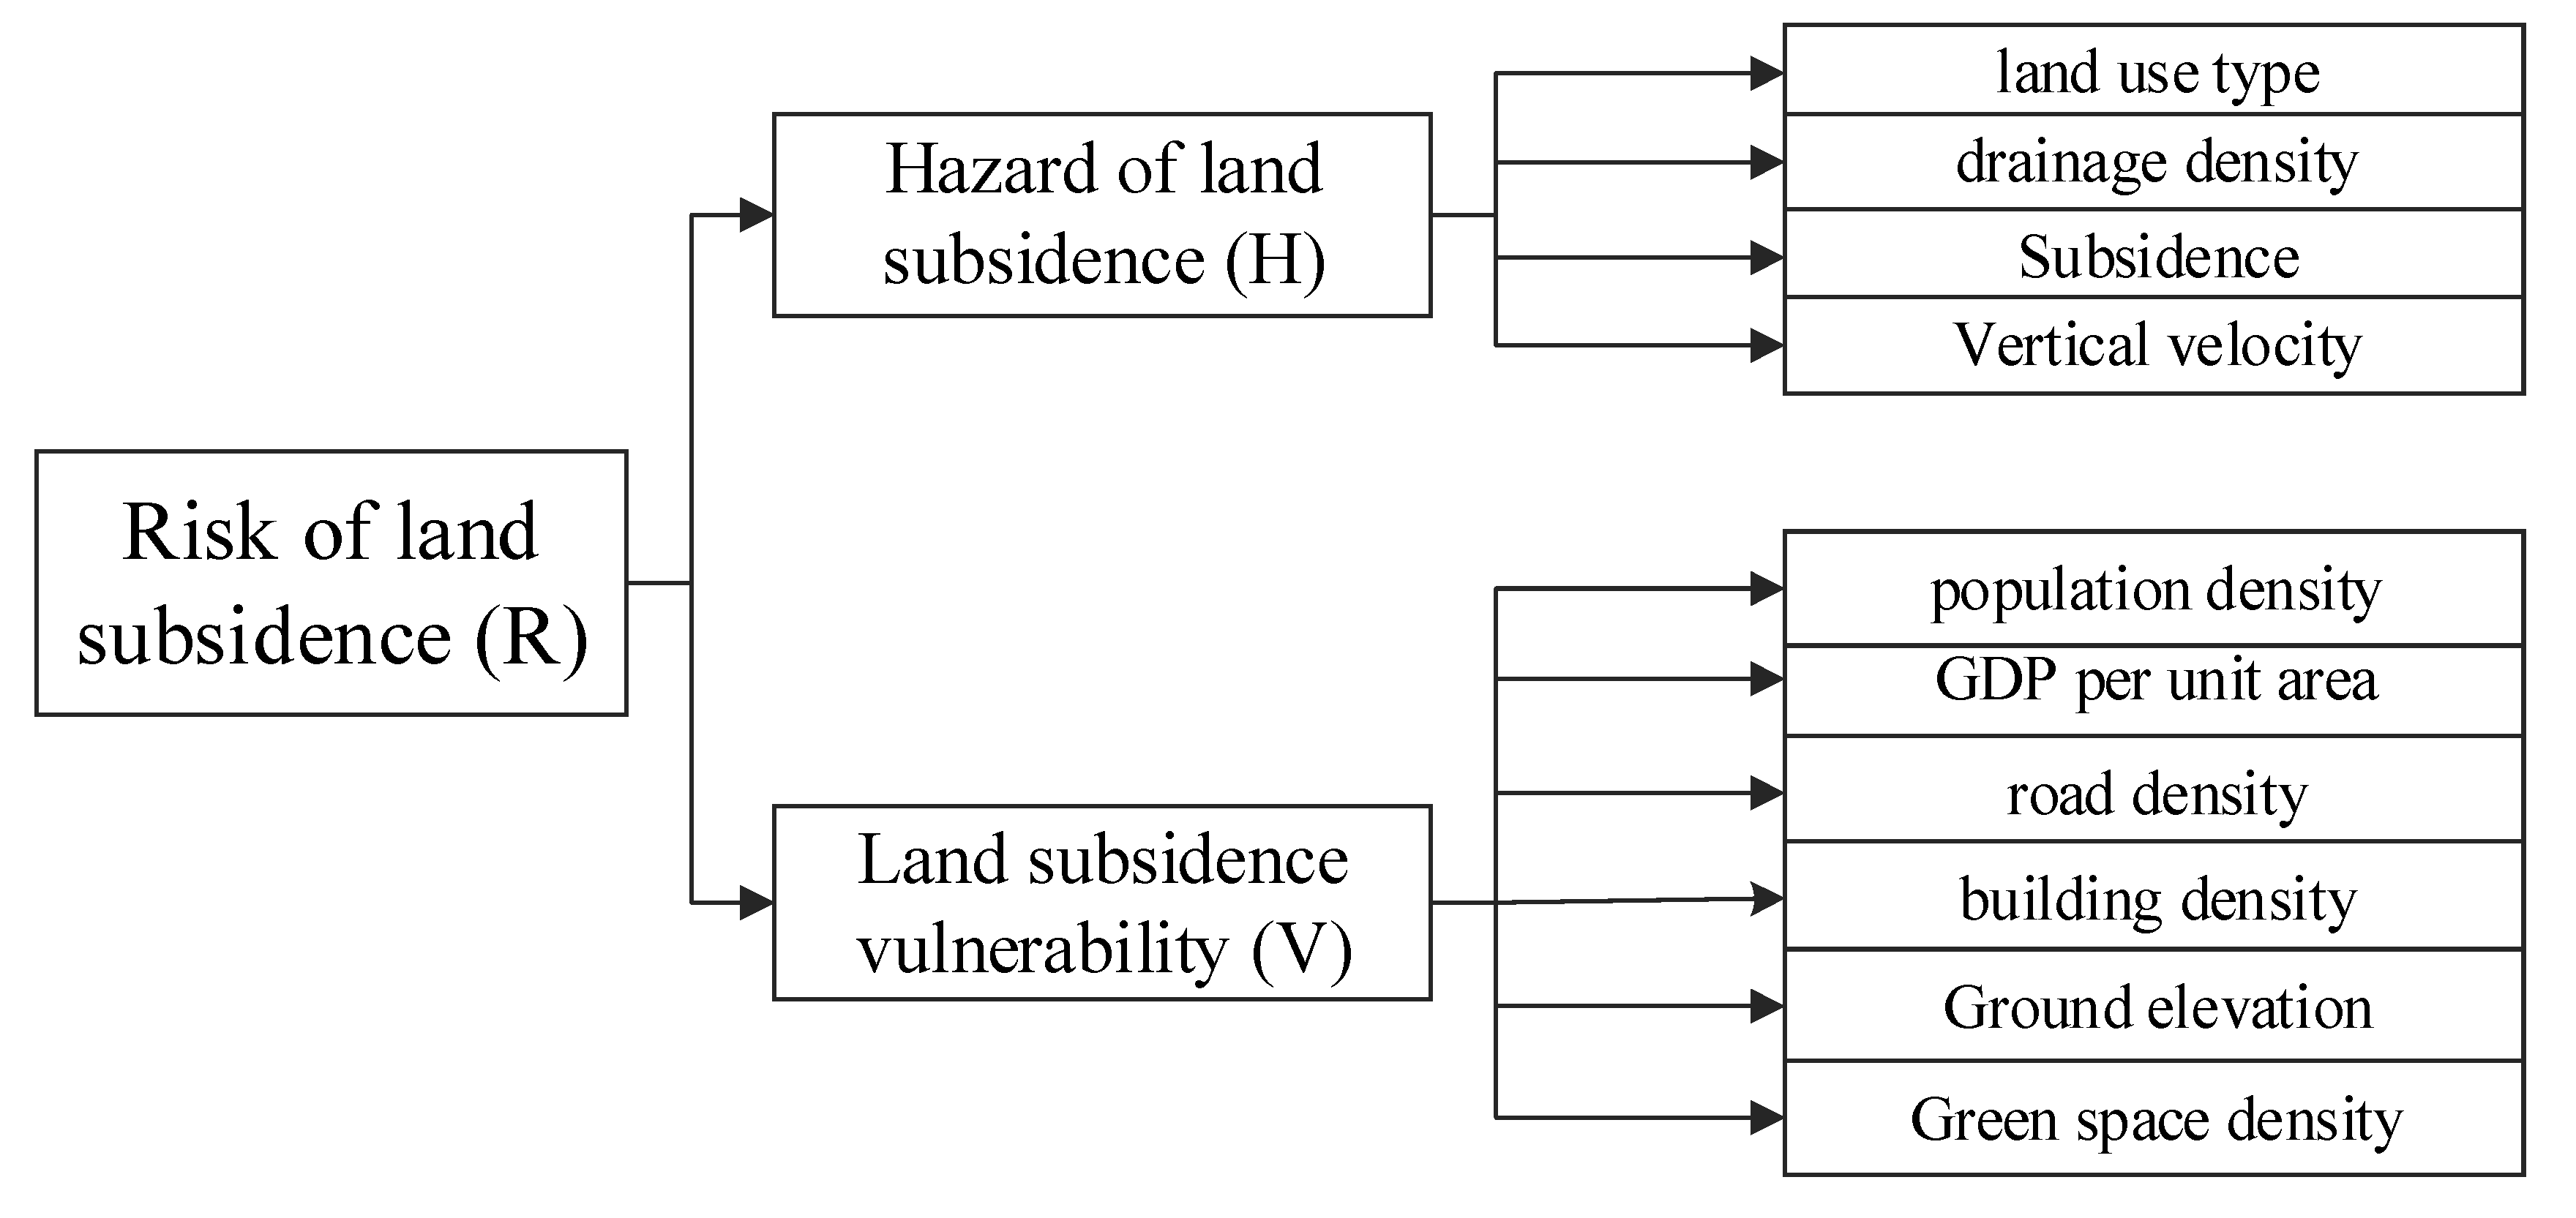
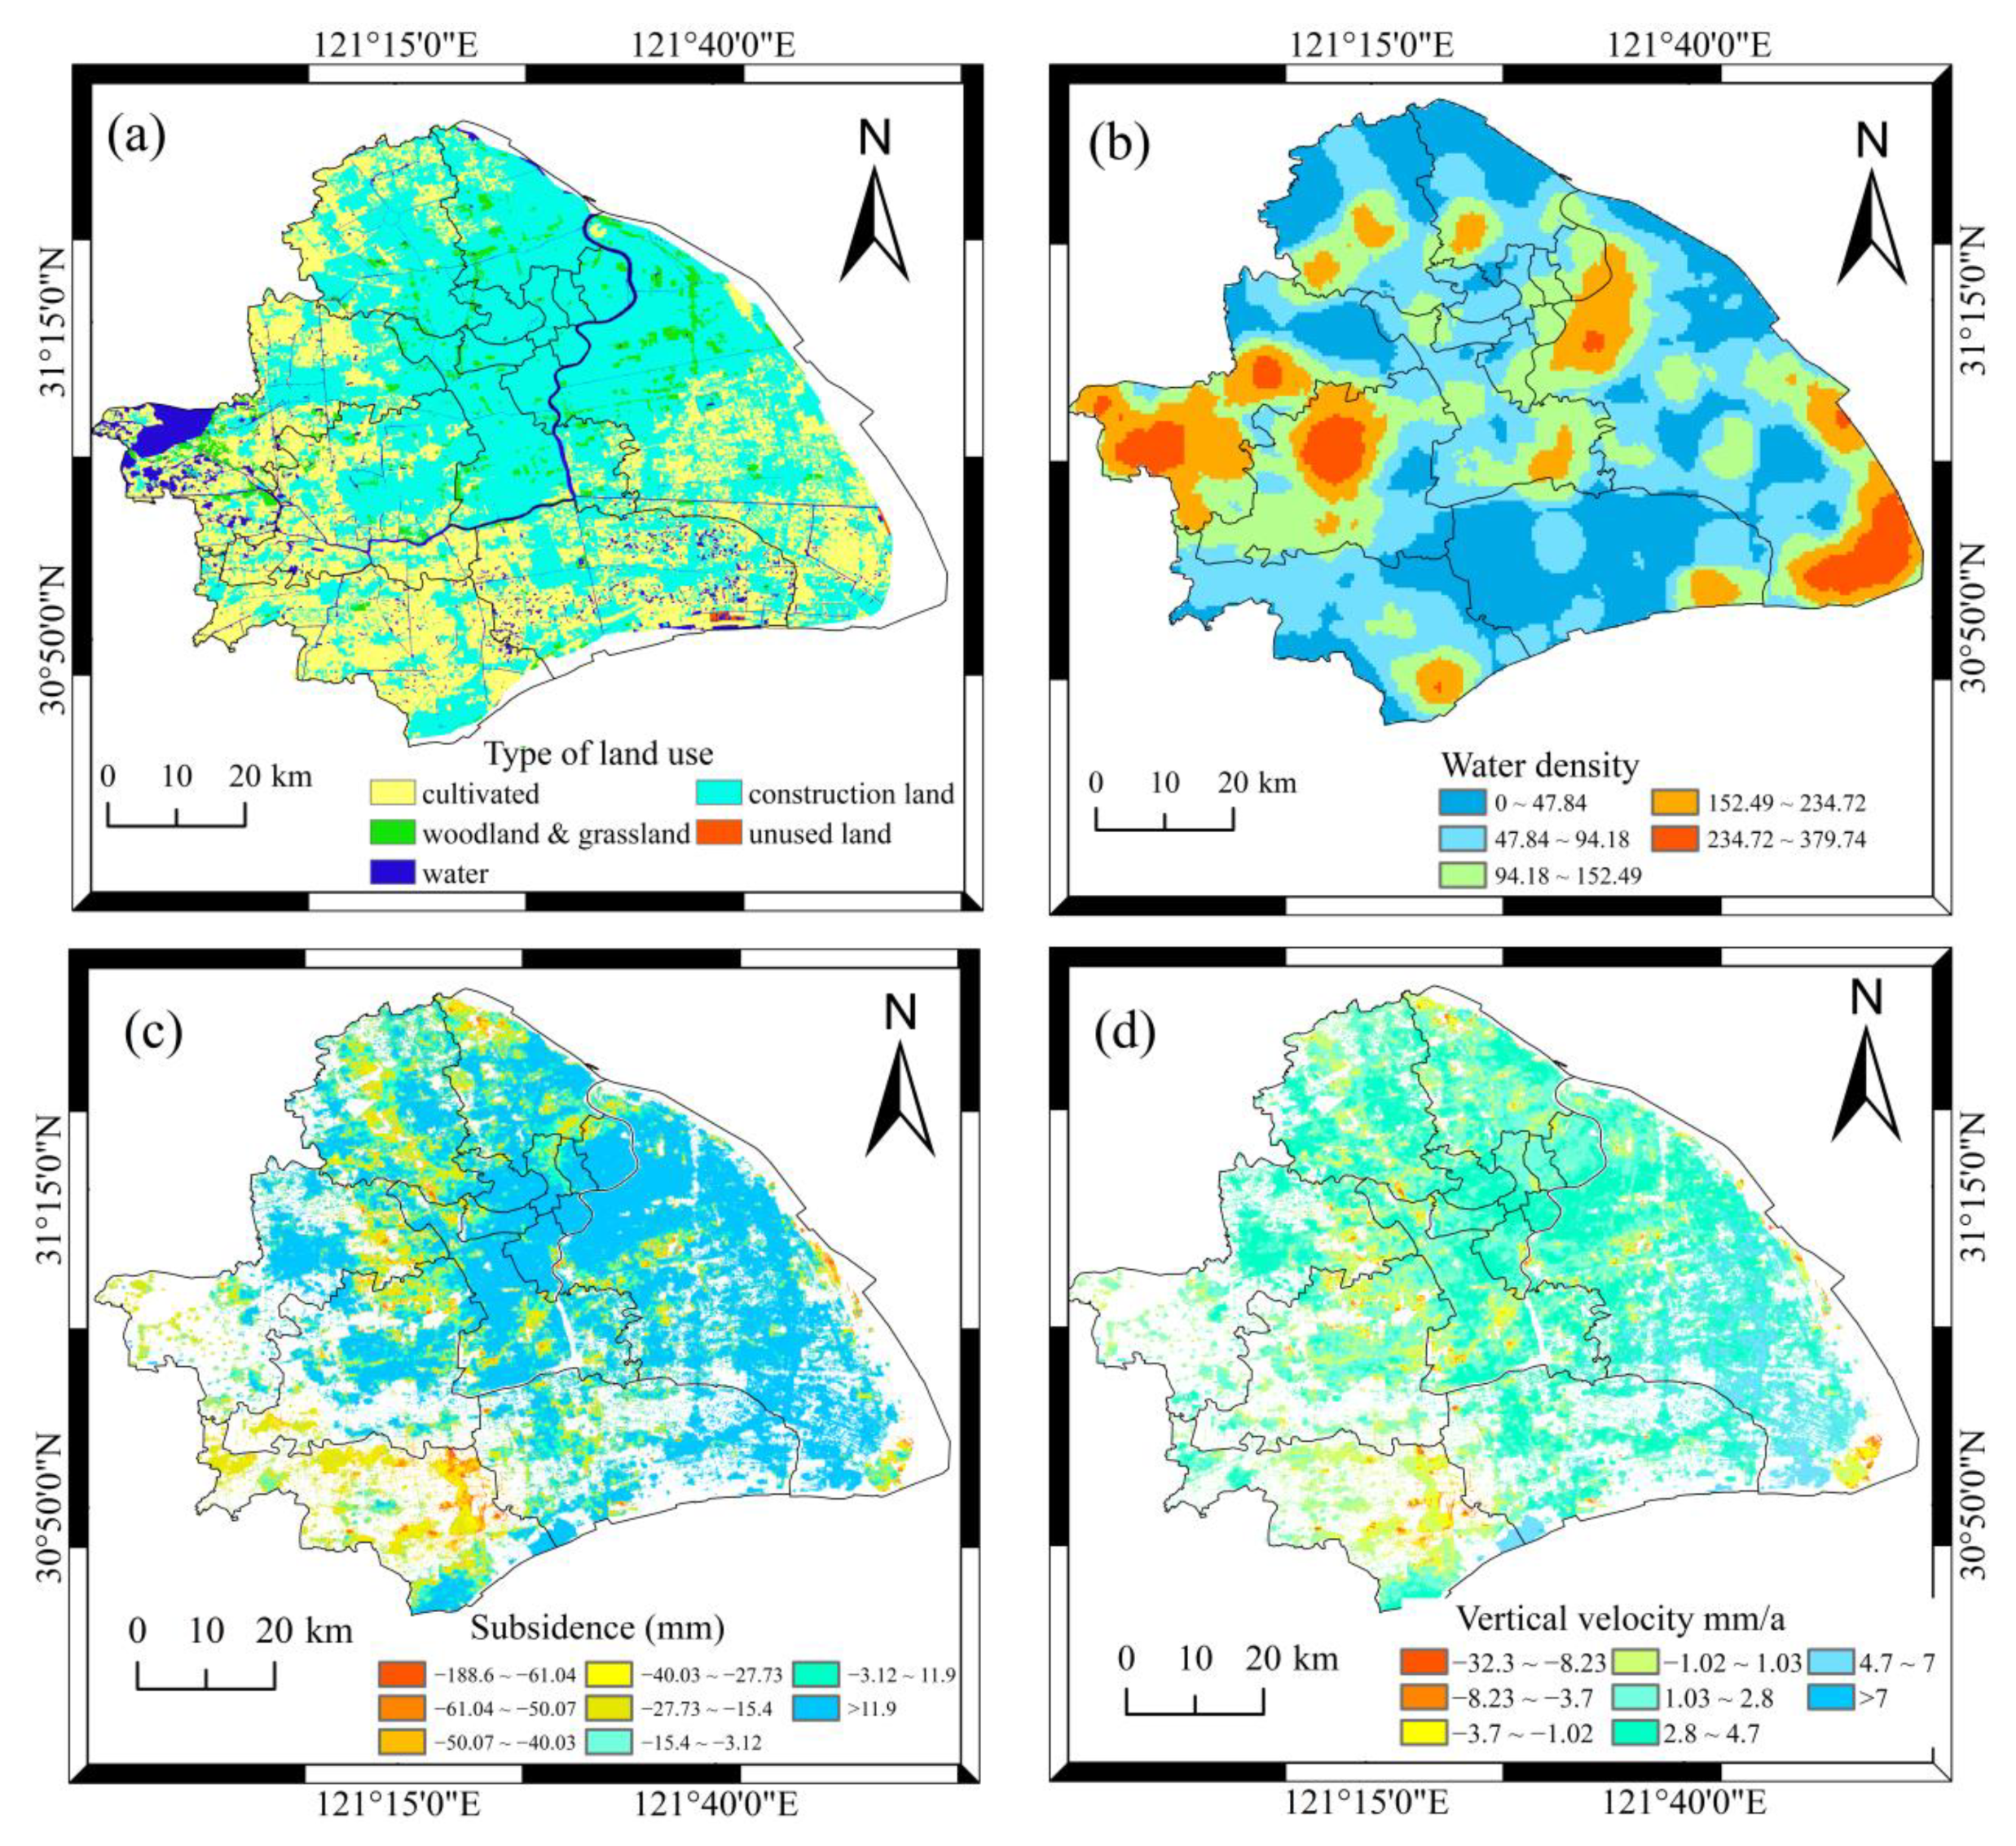
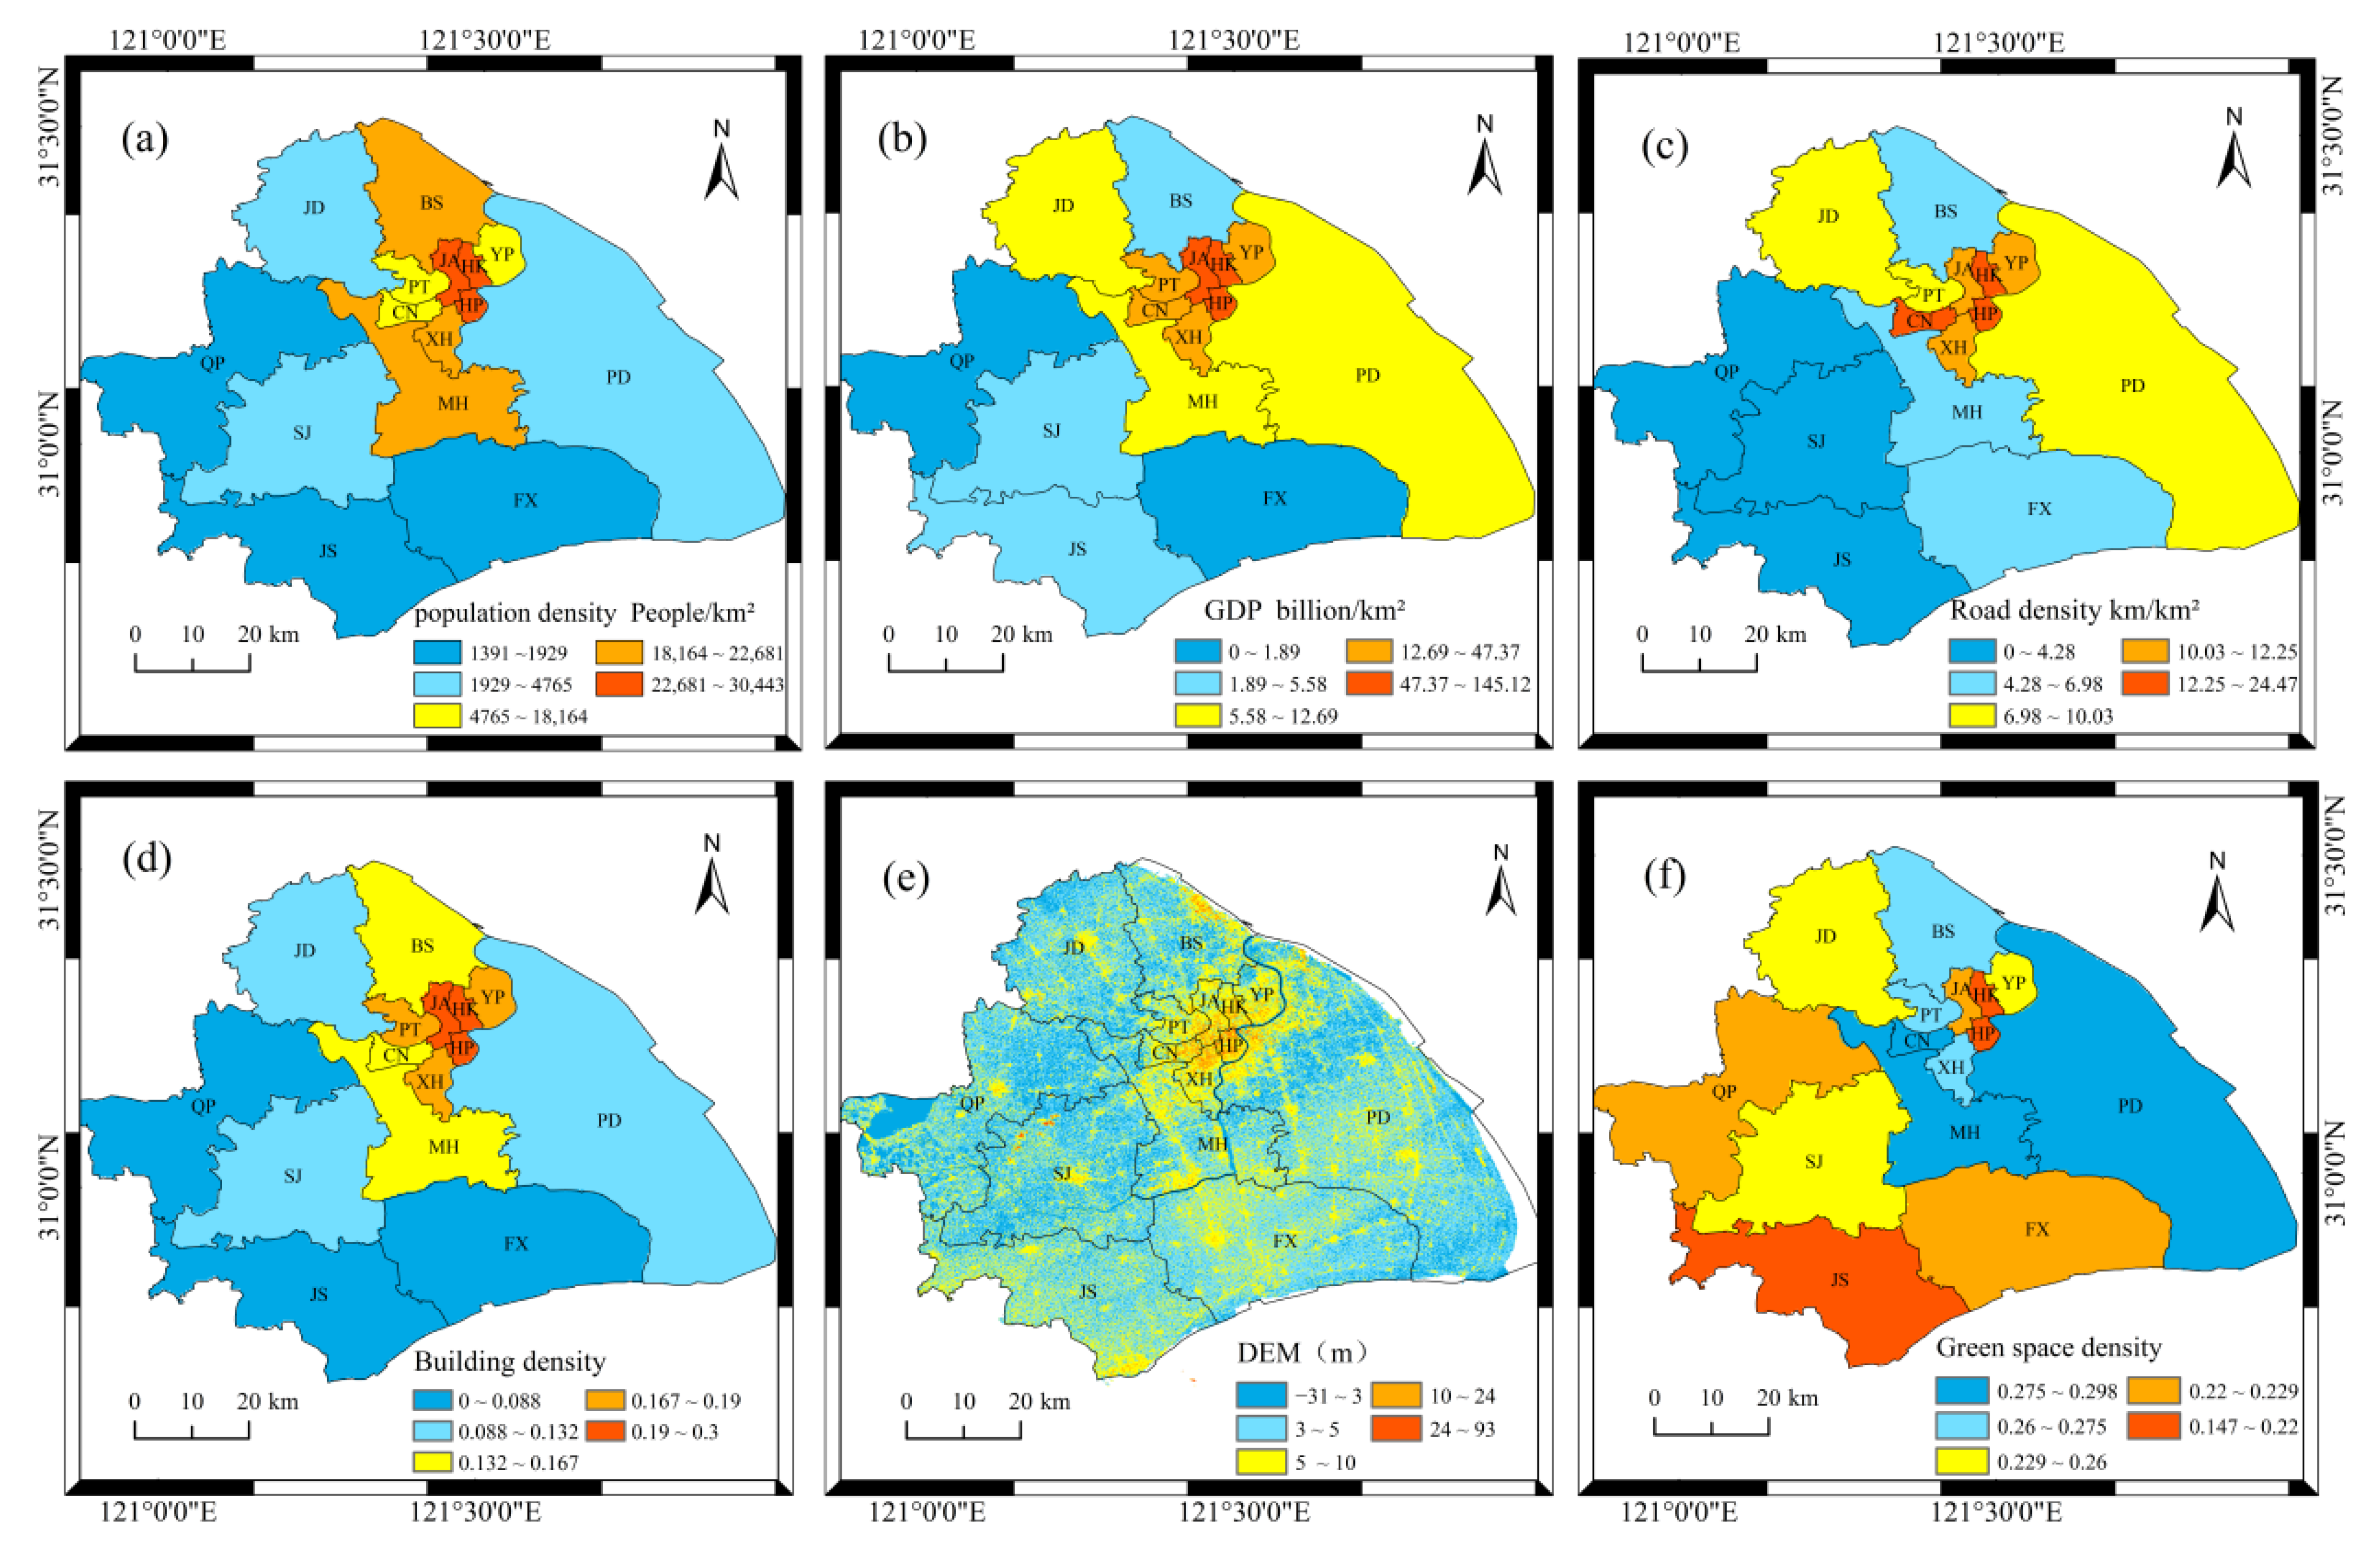
3.3.2. Risk Assessment Experiment
4. Validation and Discussion of Land Subsidence Results
4.1. Land Subsidence Results
4.2. Deformation Result Validation
- (1)
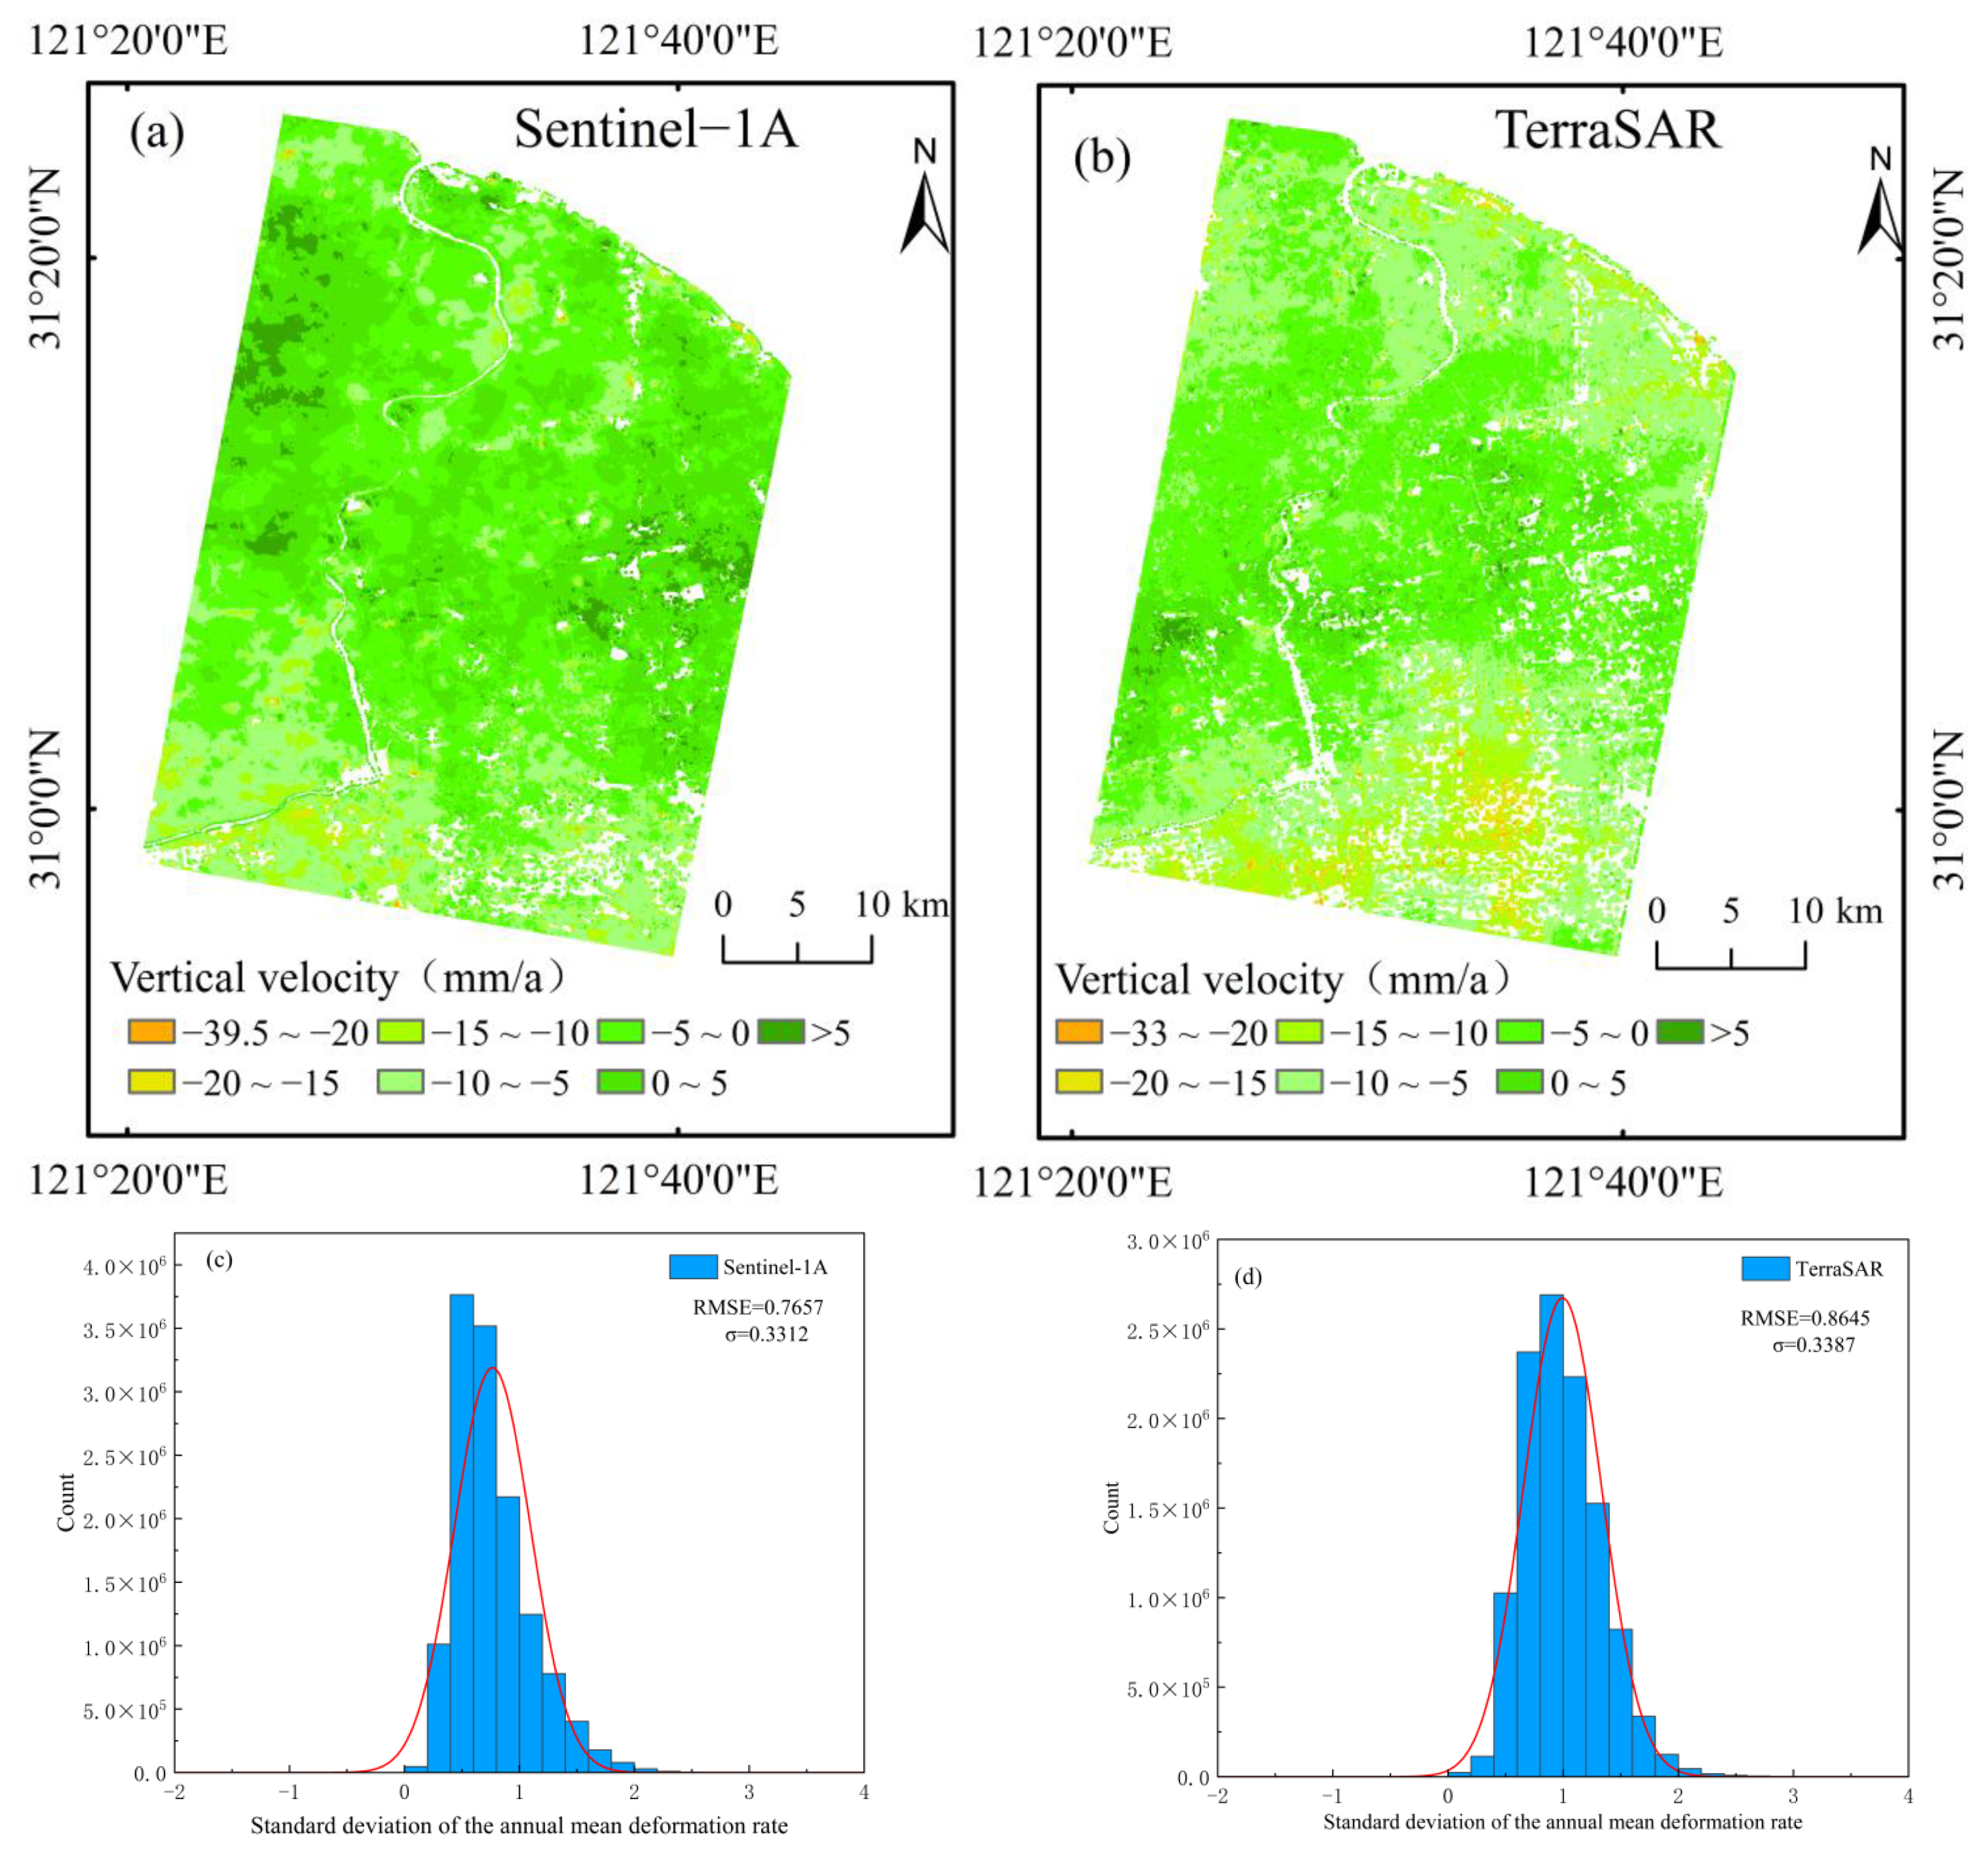
- Standard deviation verification
- (2)
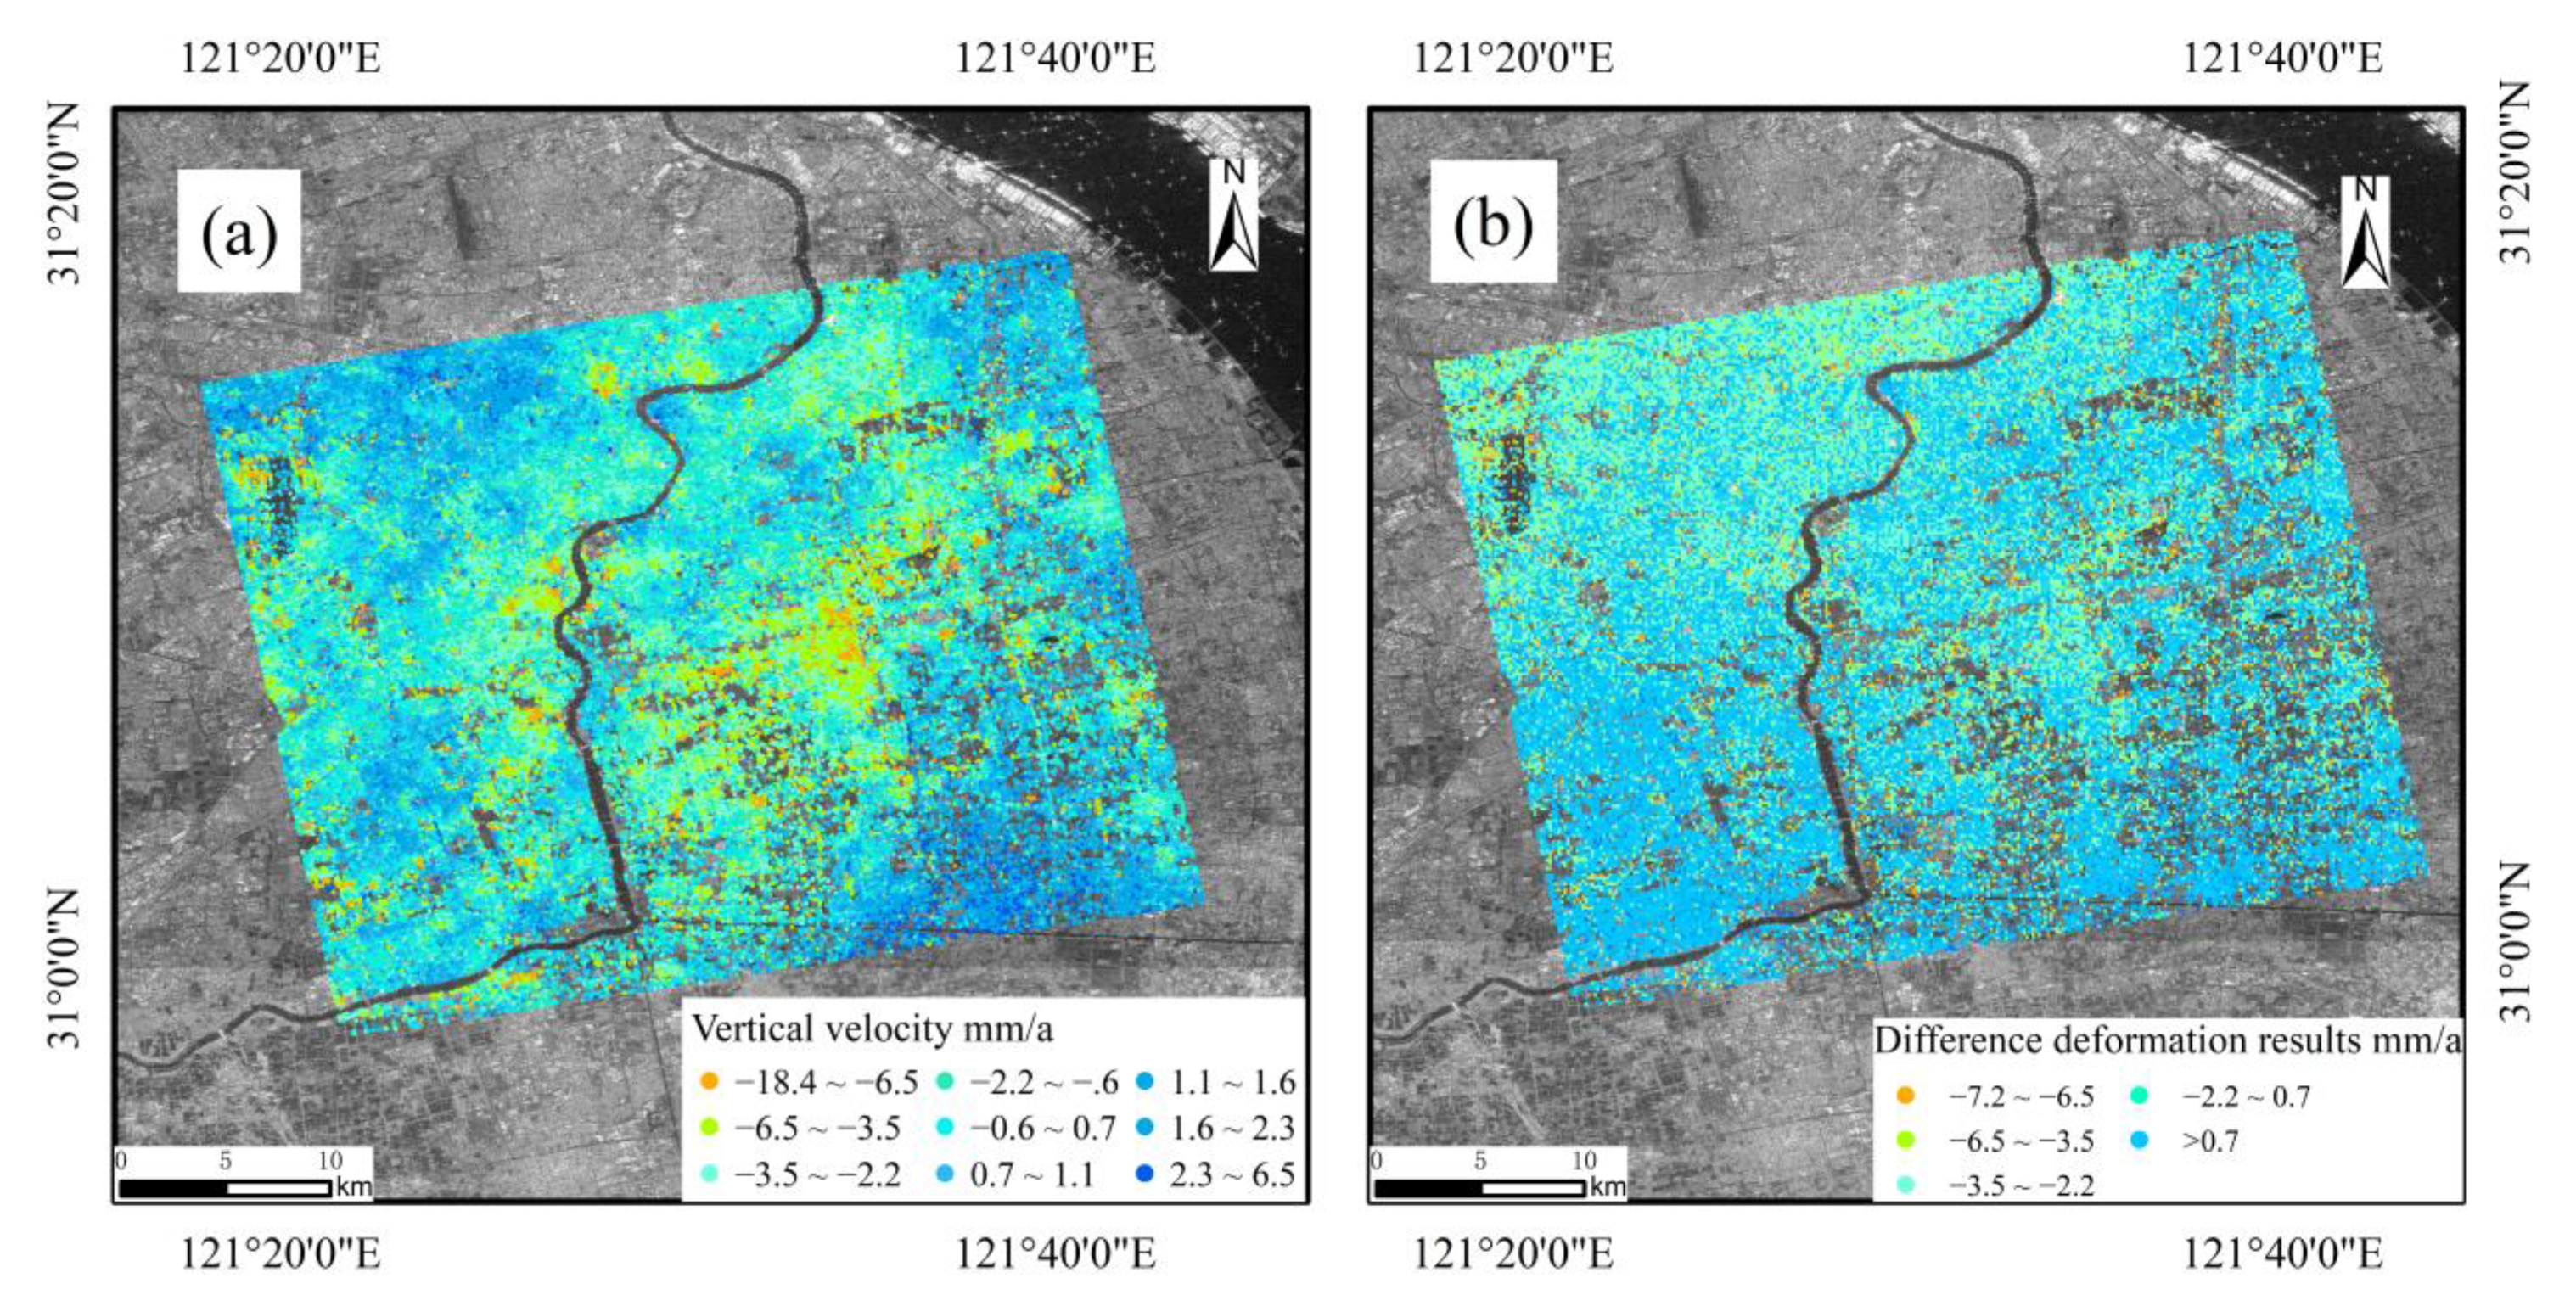
- TerraSAR displacement result comparison
- (3)
- Results comparison with different SAR techniques
4.3. Typical Land Subsidence Areas Discussion
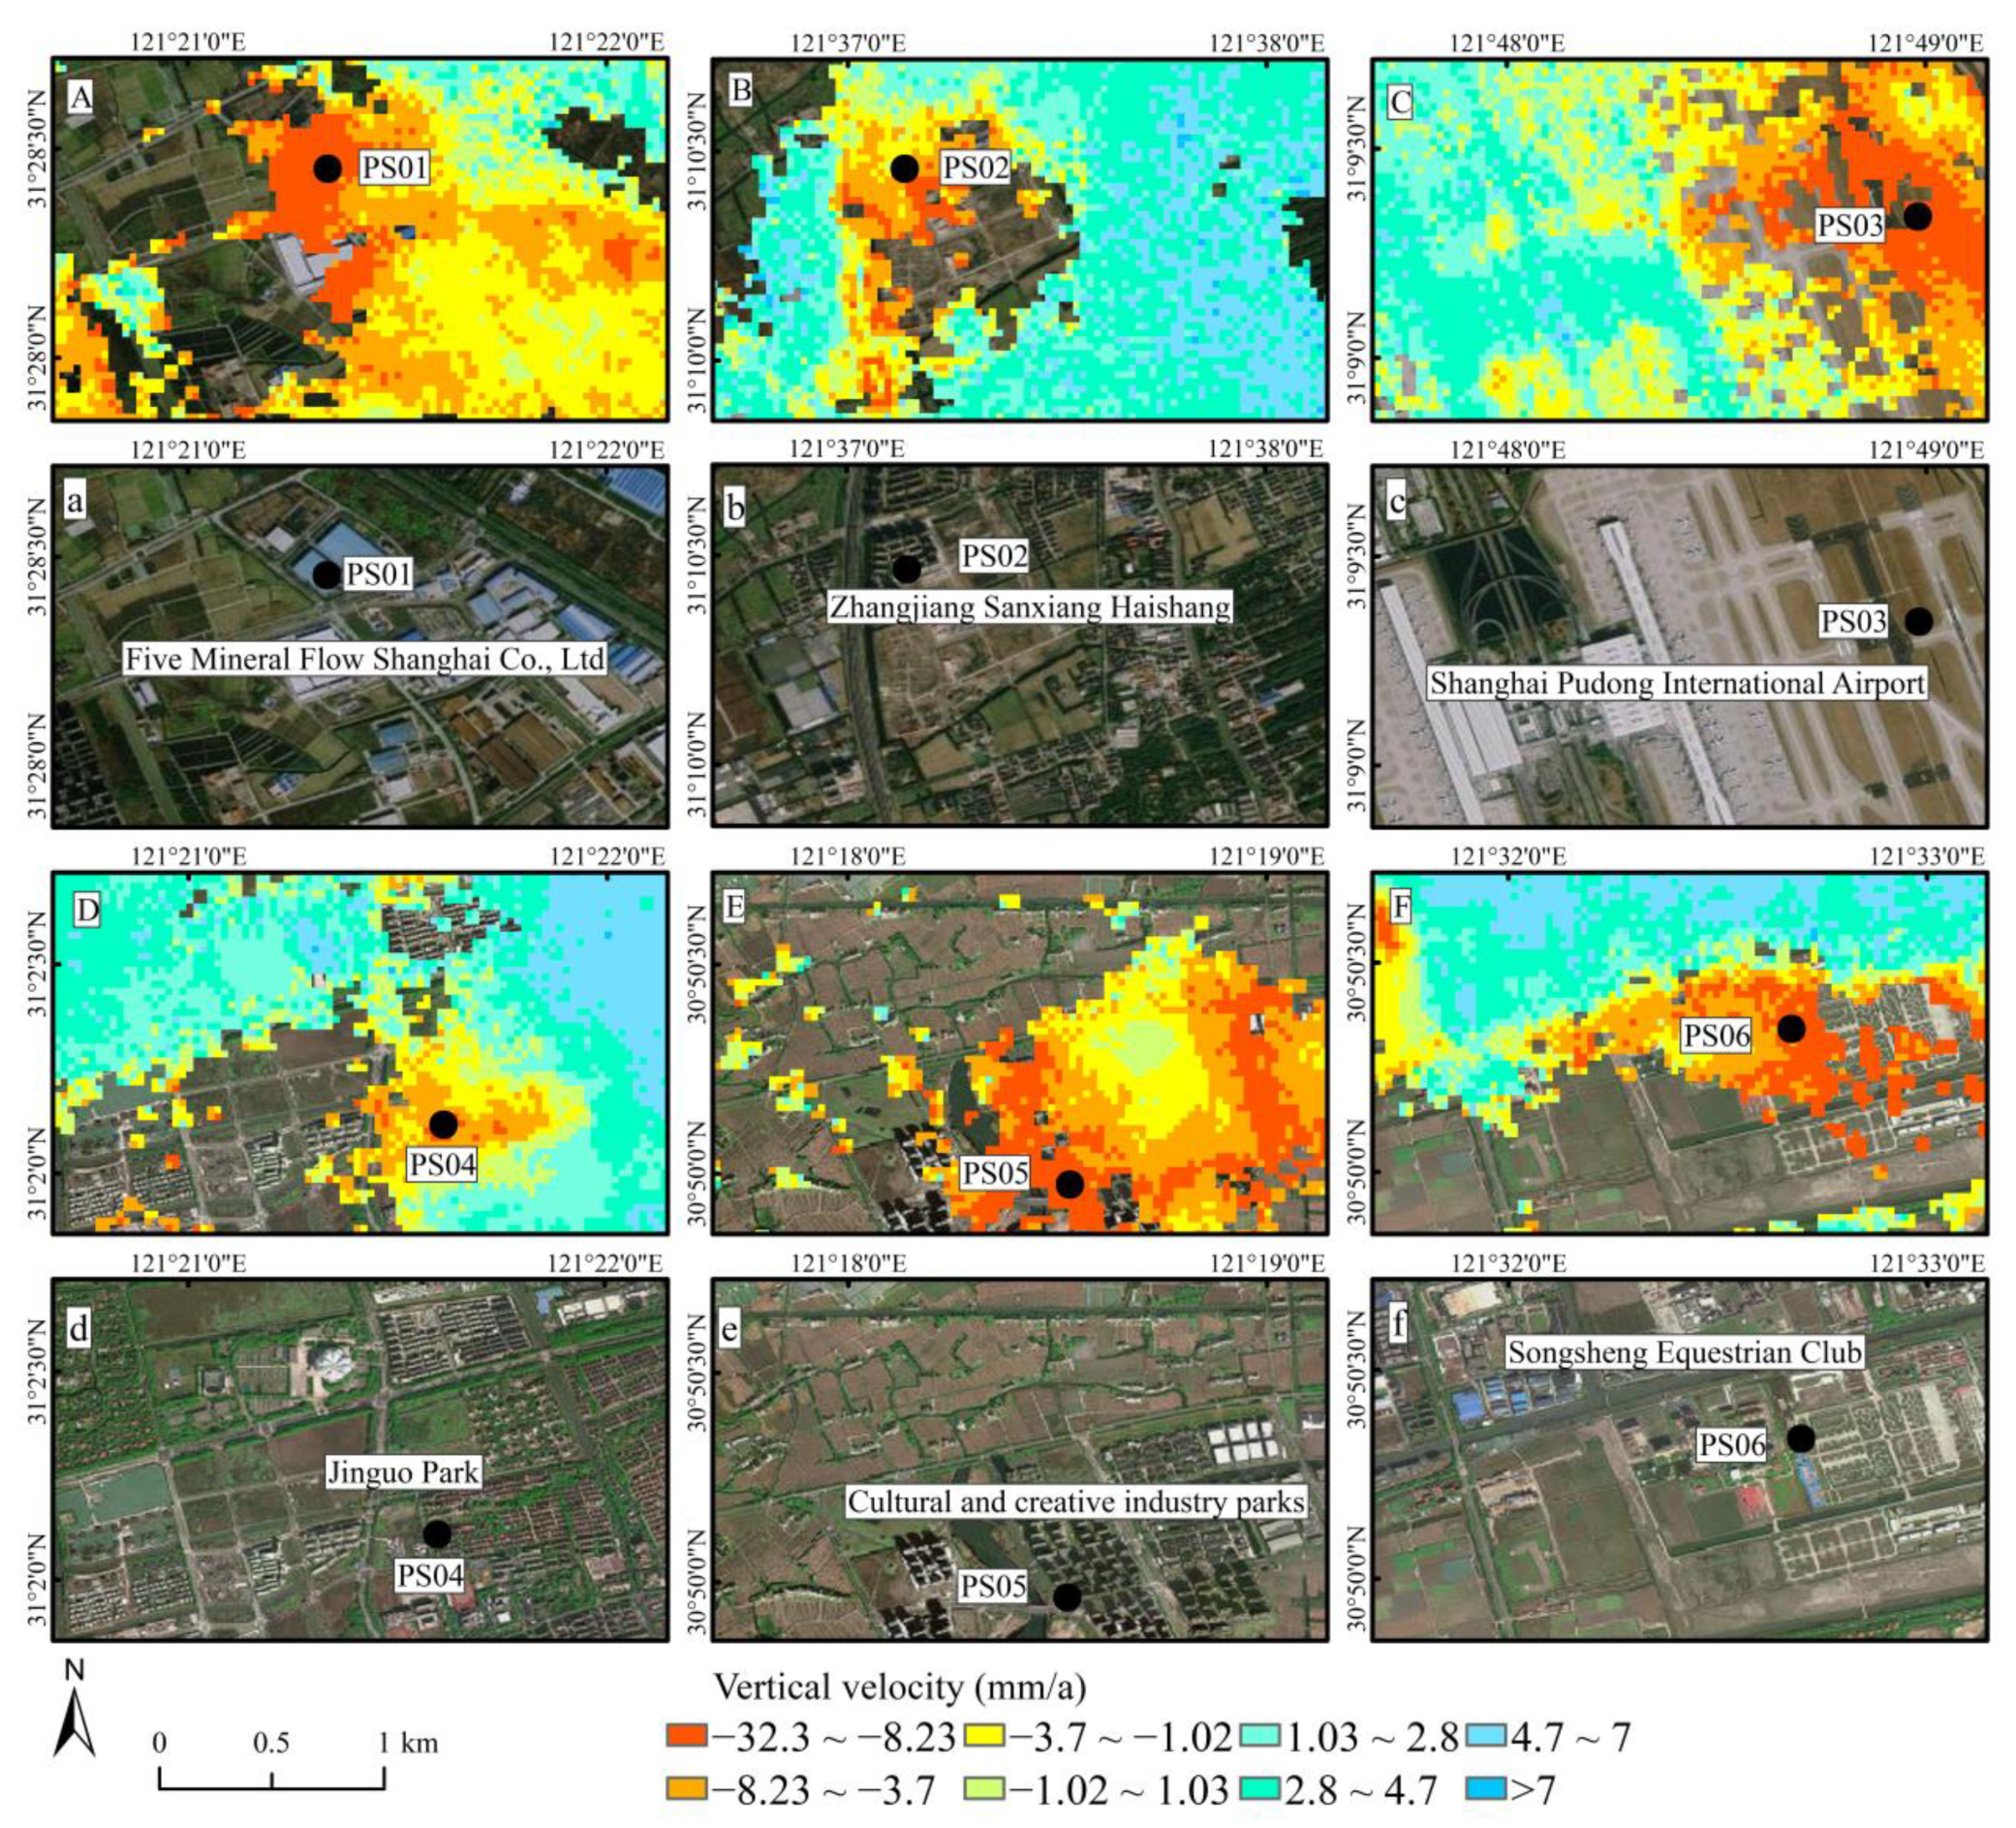
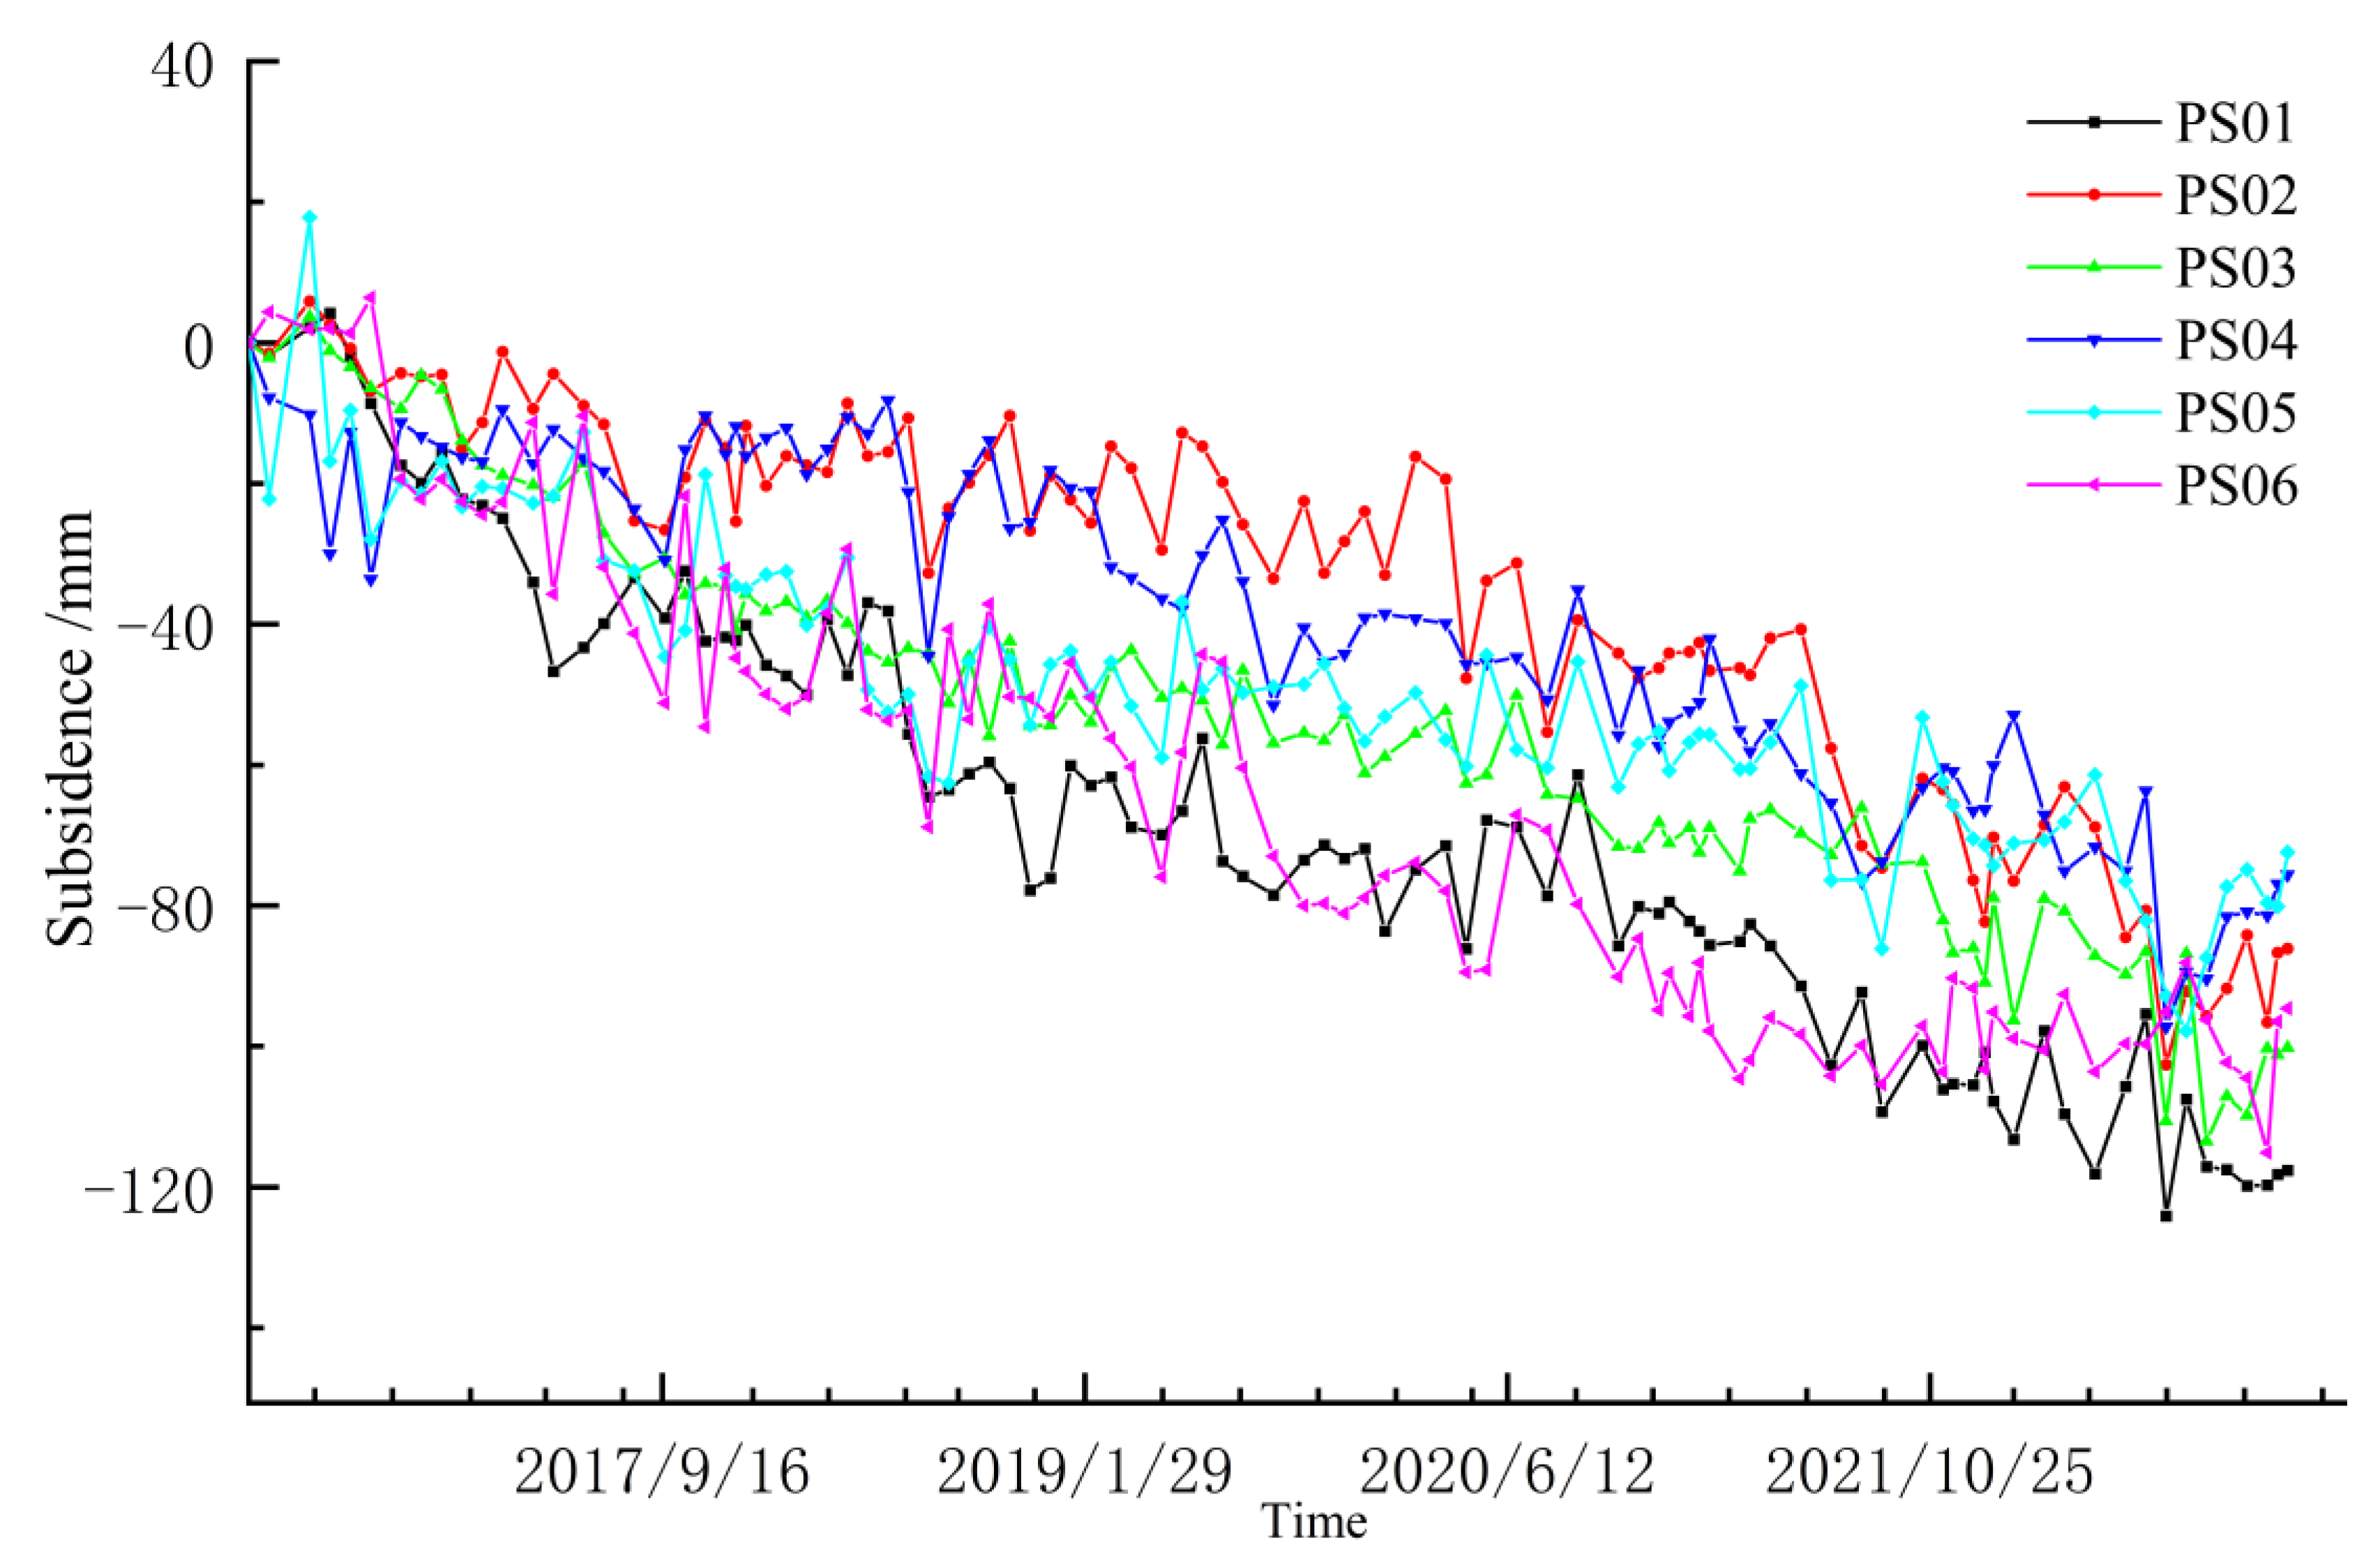
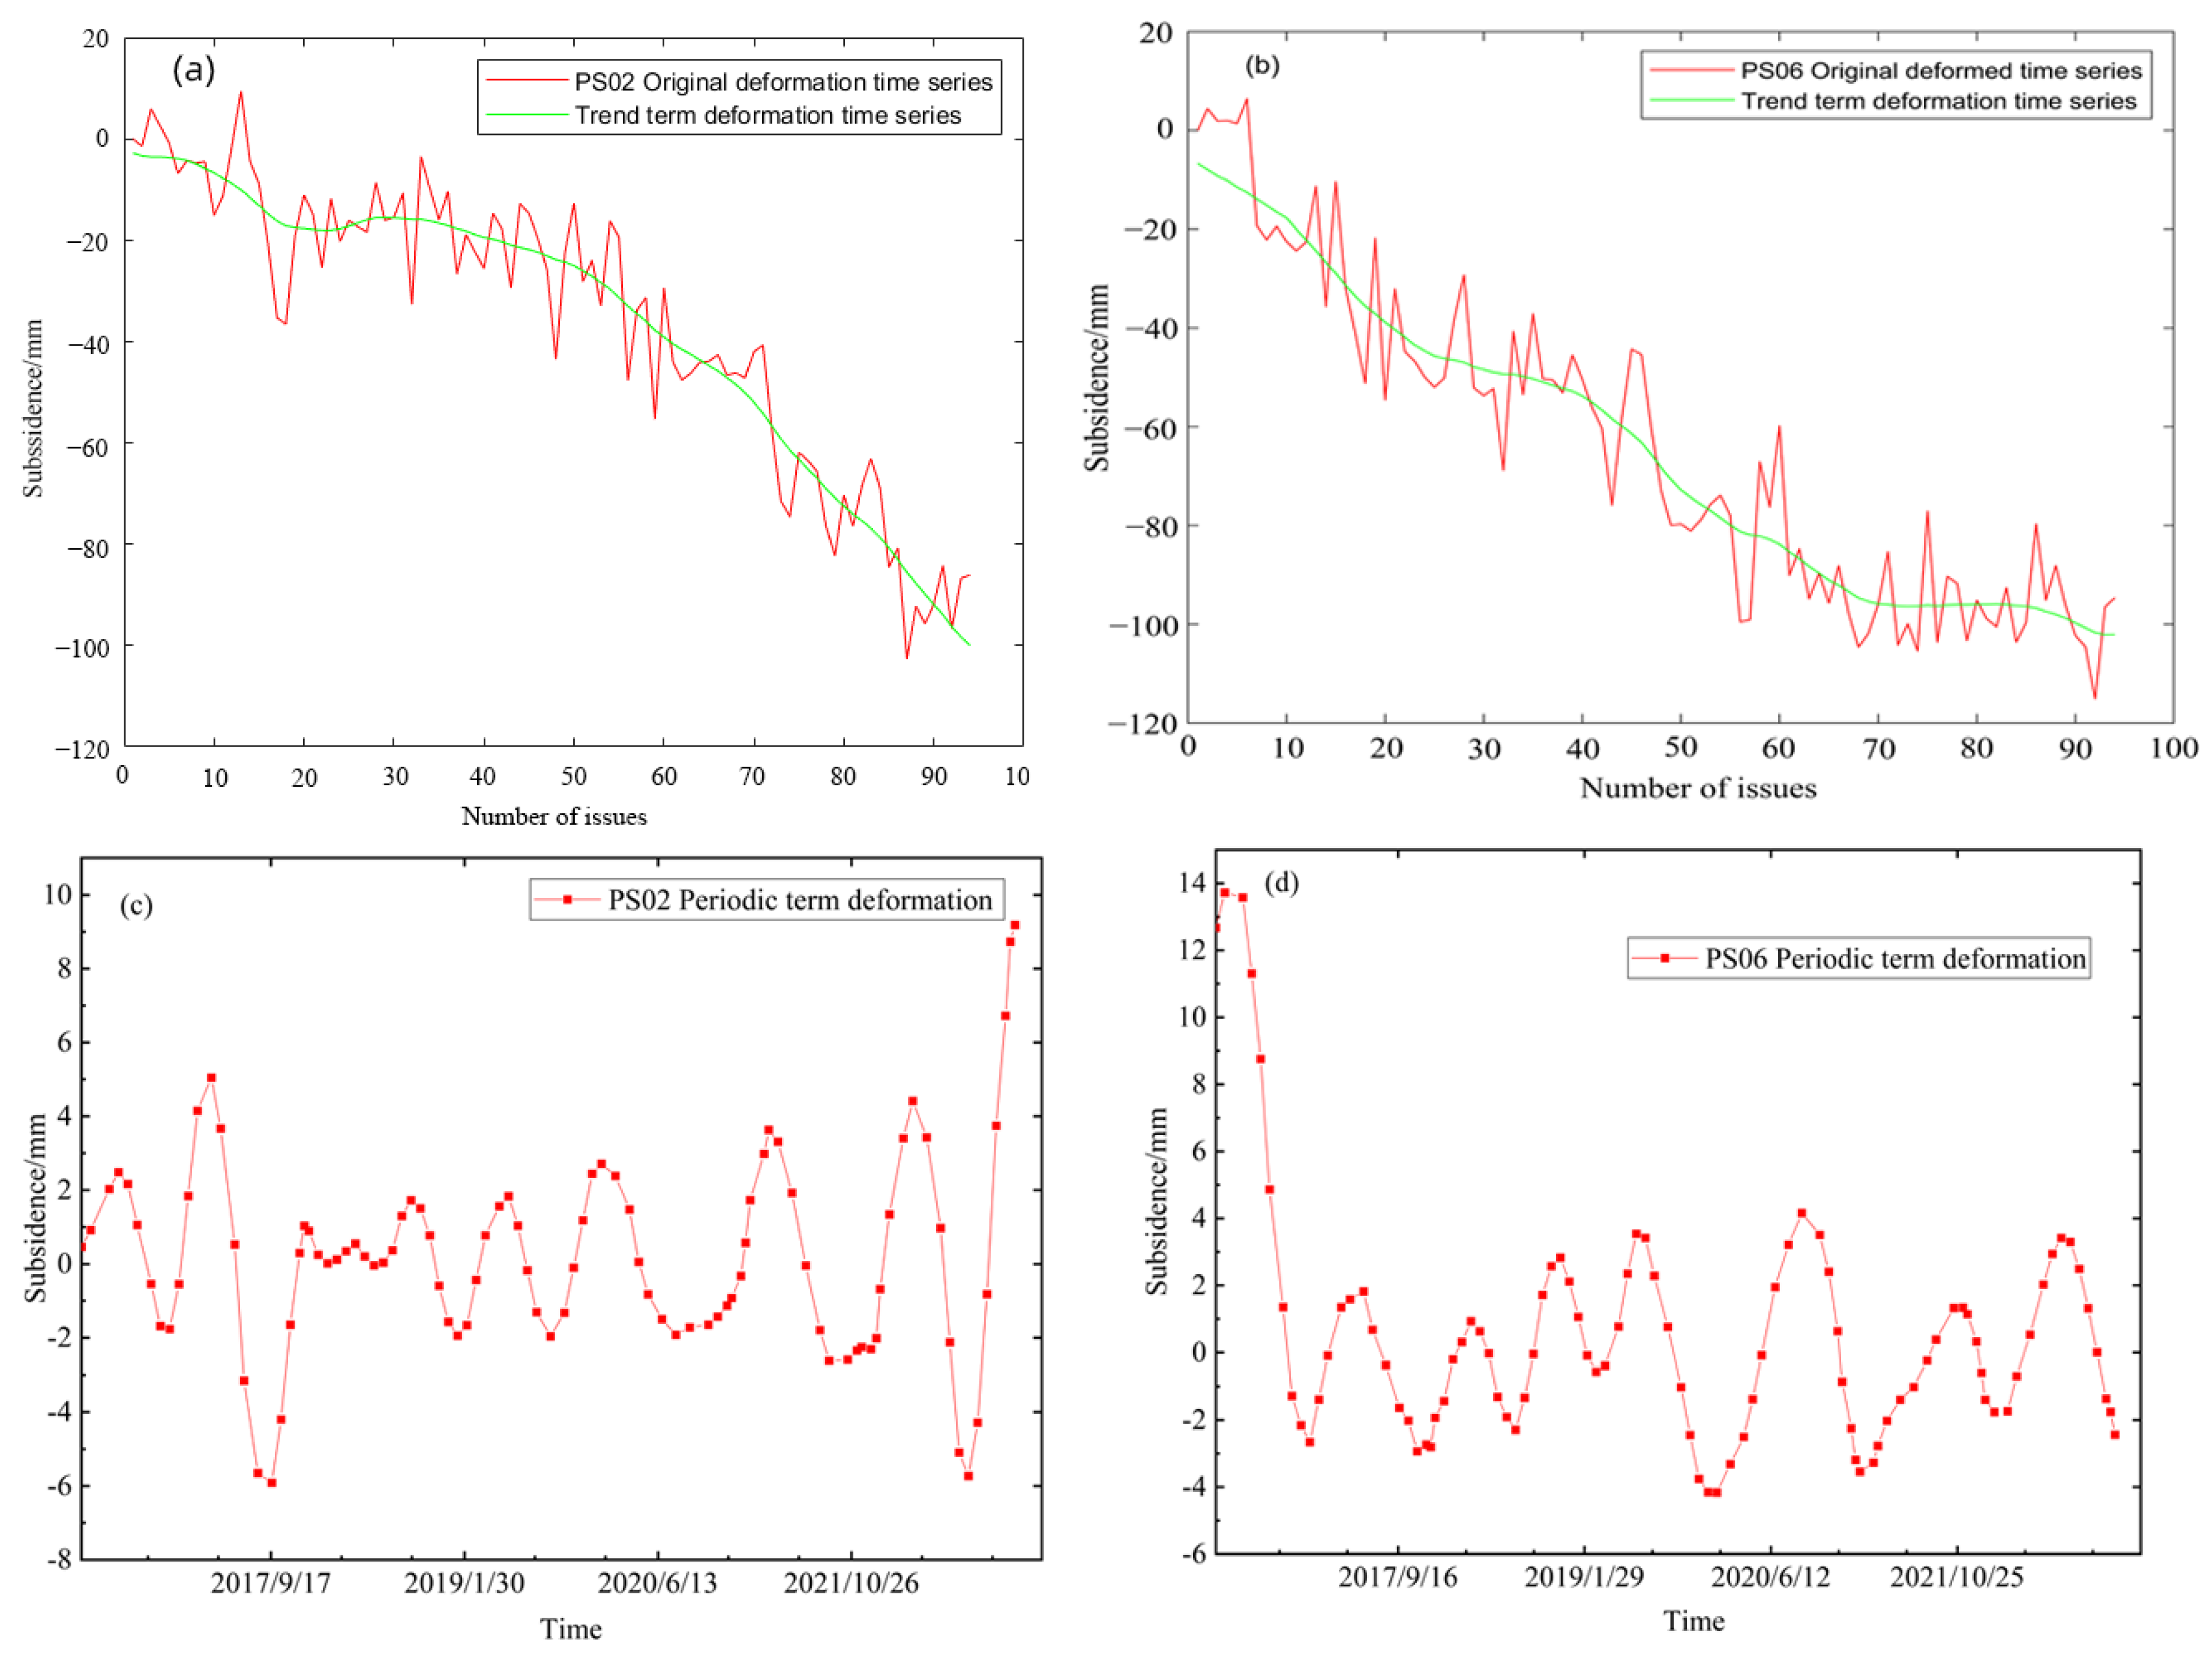
4.3.1. Feature Point Deformation Analysis
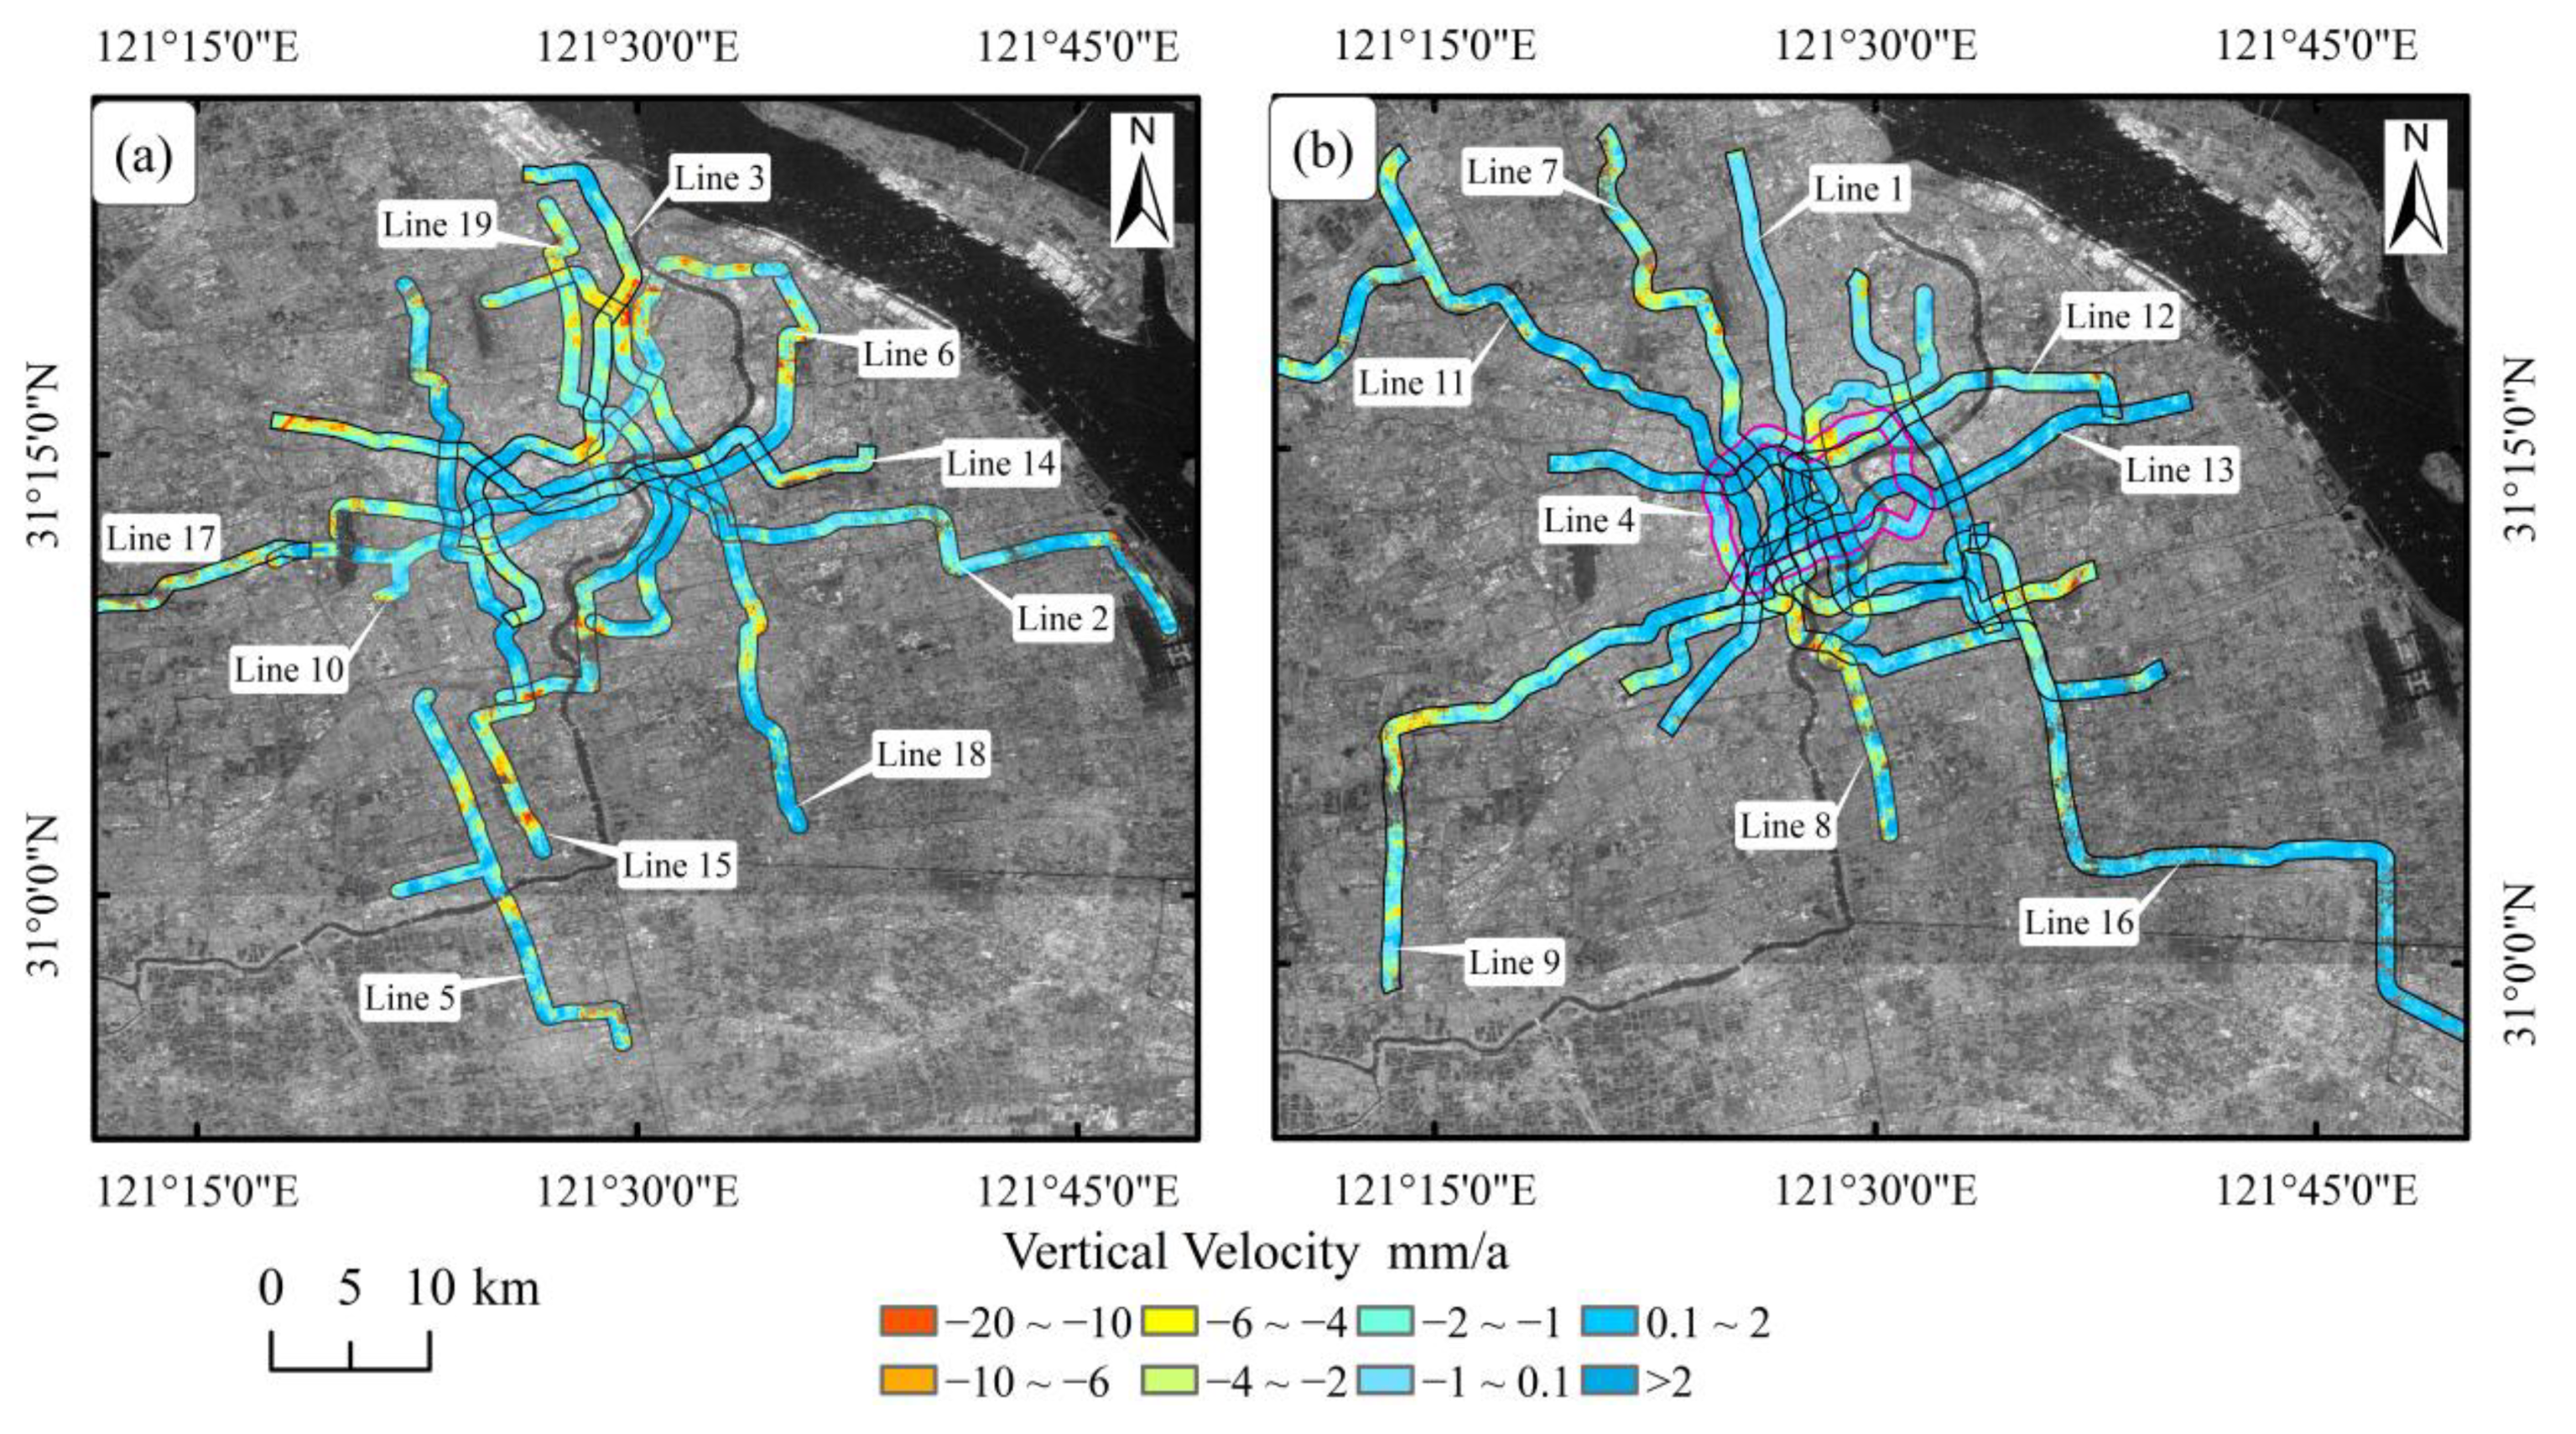
4.3.2. Land Subsidence along the Subway Analysis
4.4. Correlation Analysis
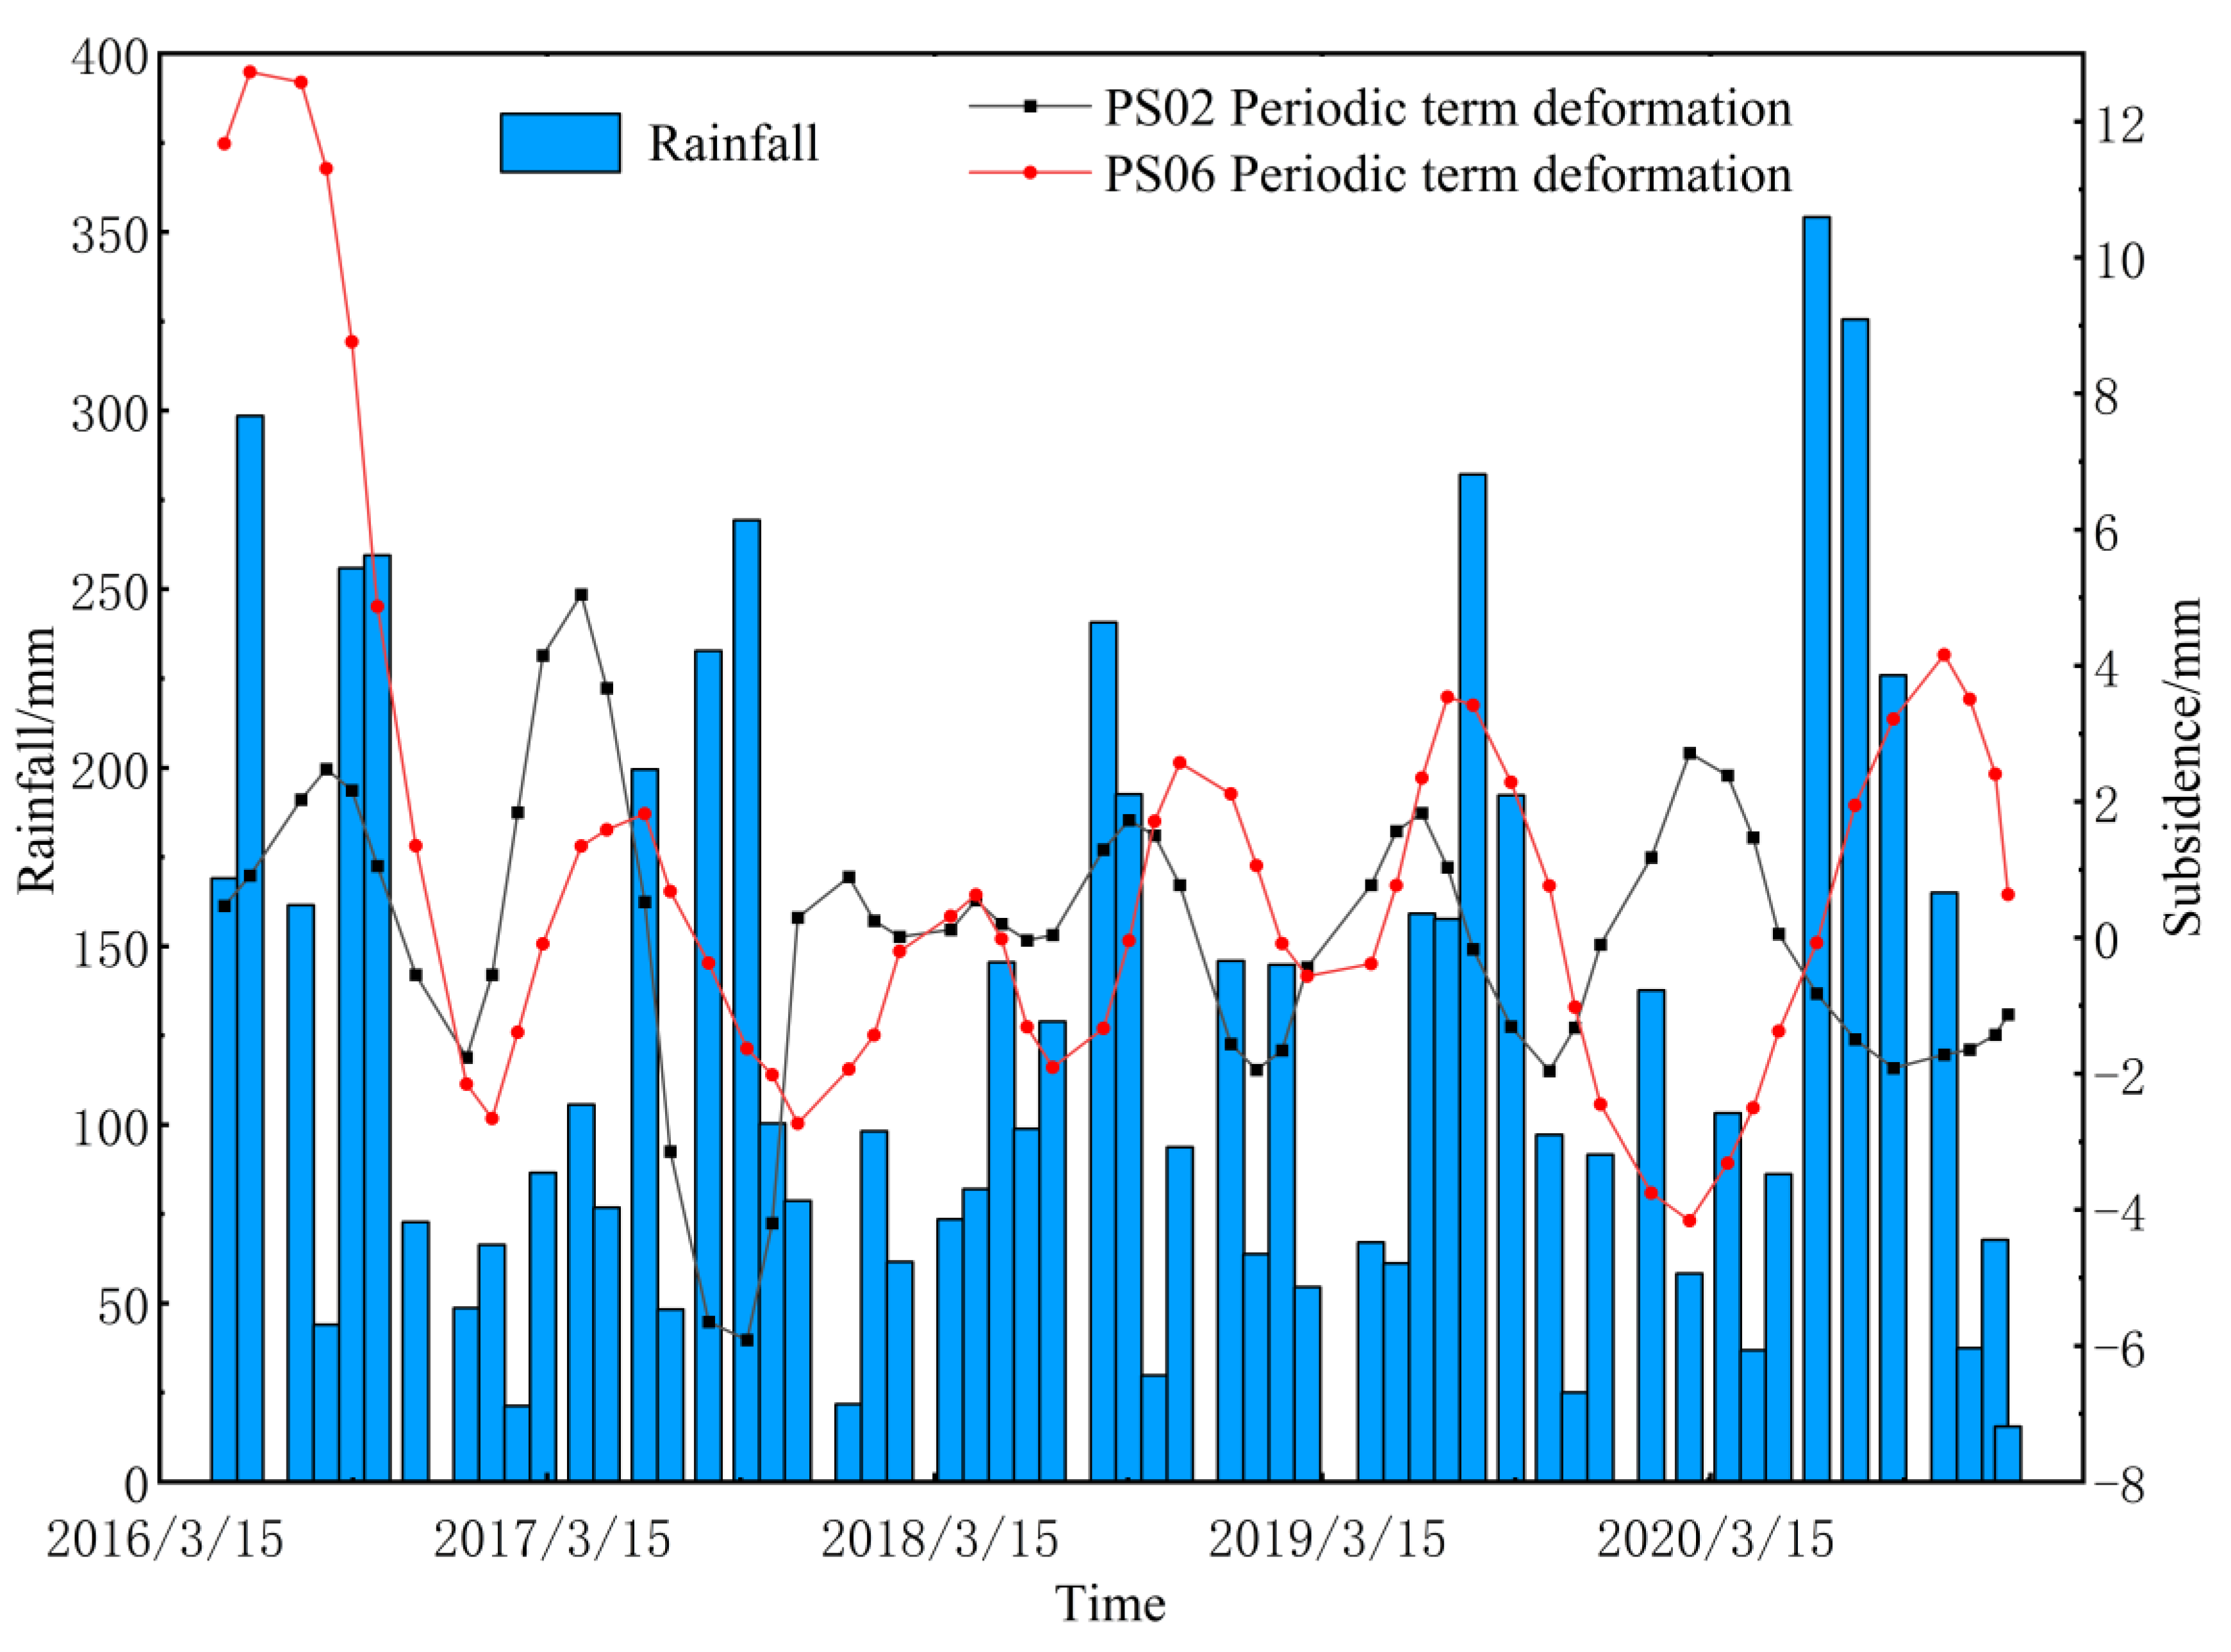
4.4.1. Correlation Analysis between Land Subsidence and Rainfall
4.4.2. Correlation Analysis of Land Subsidence and Human Activities
5. Risk Assessment
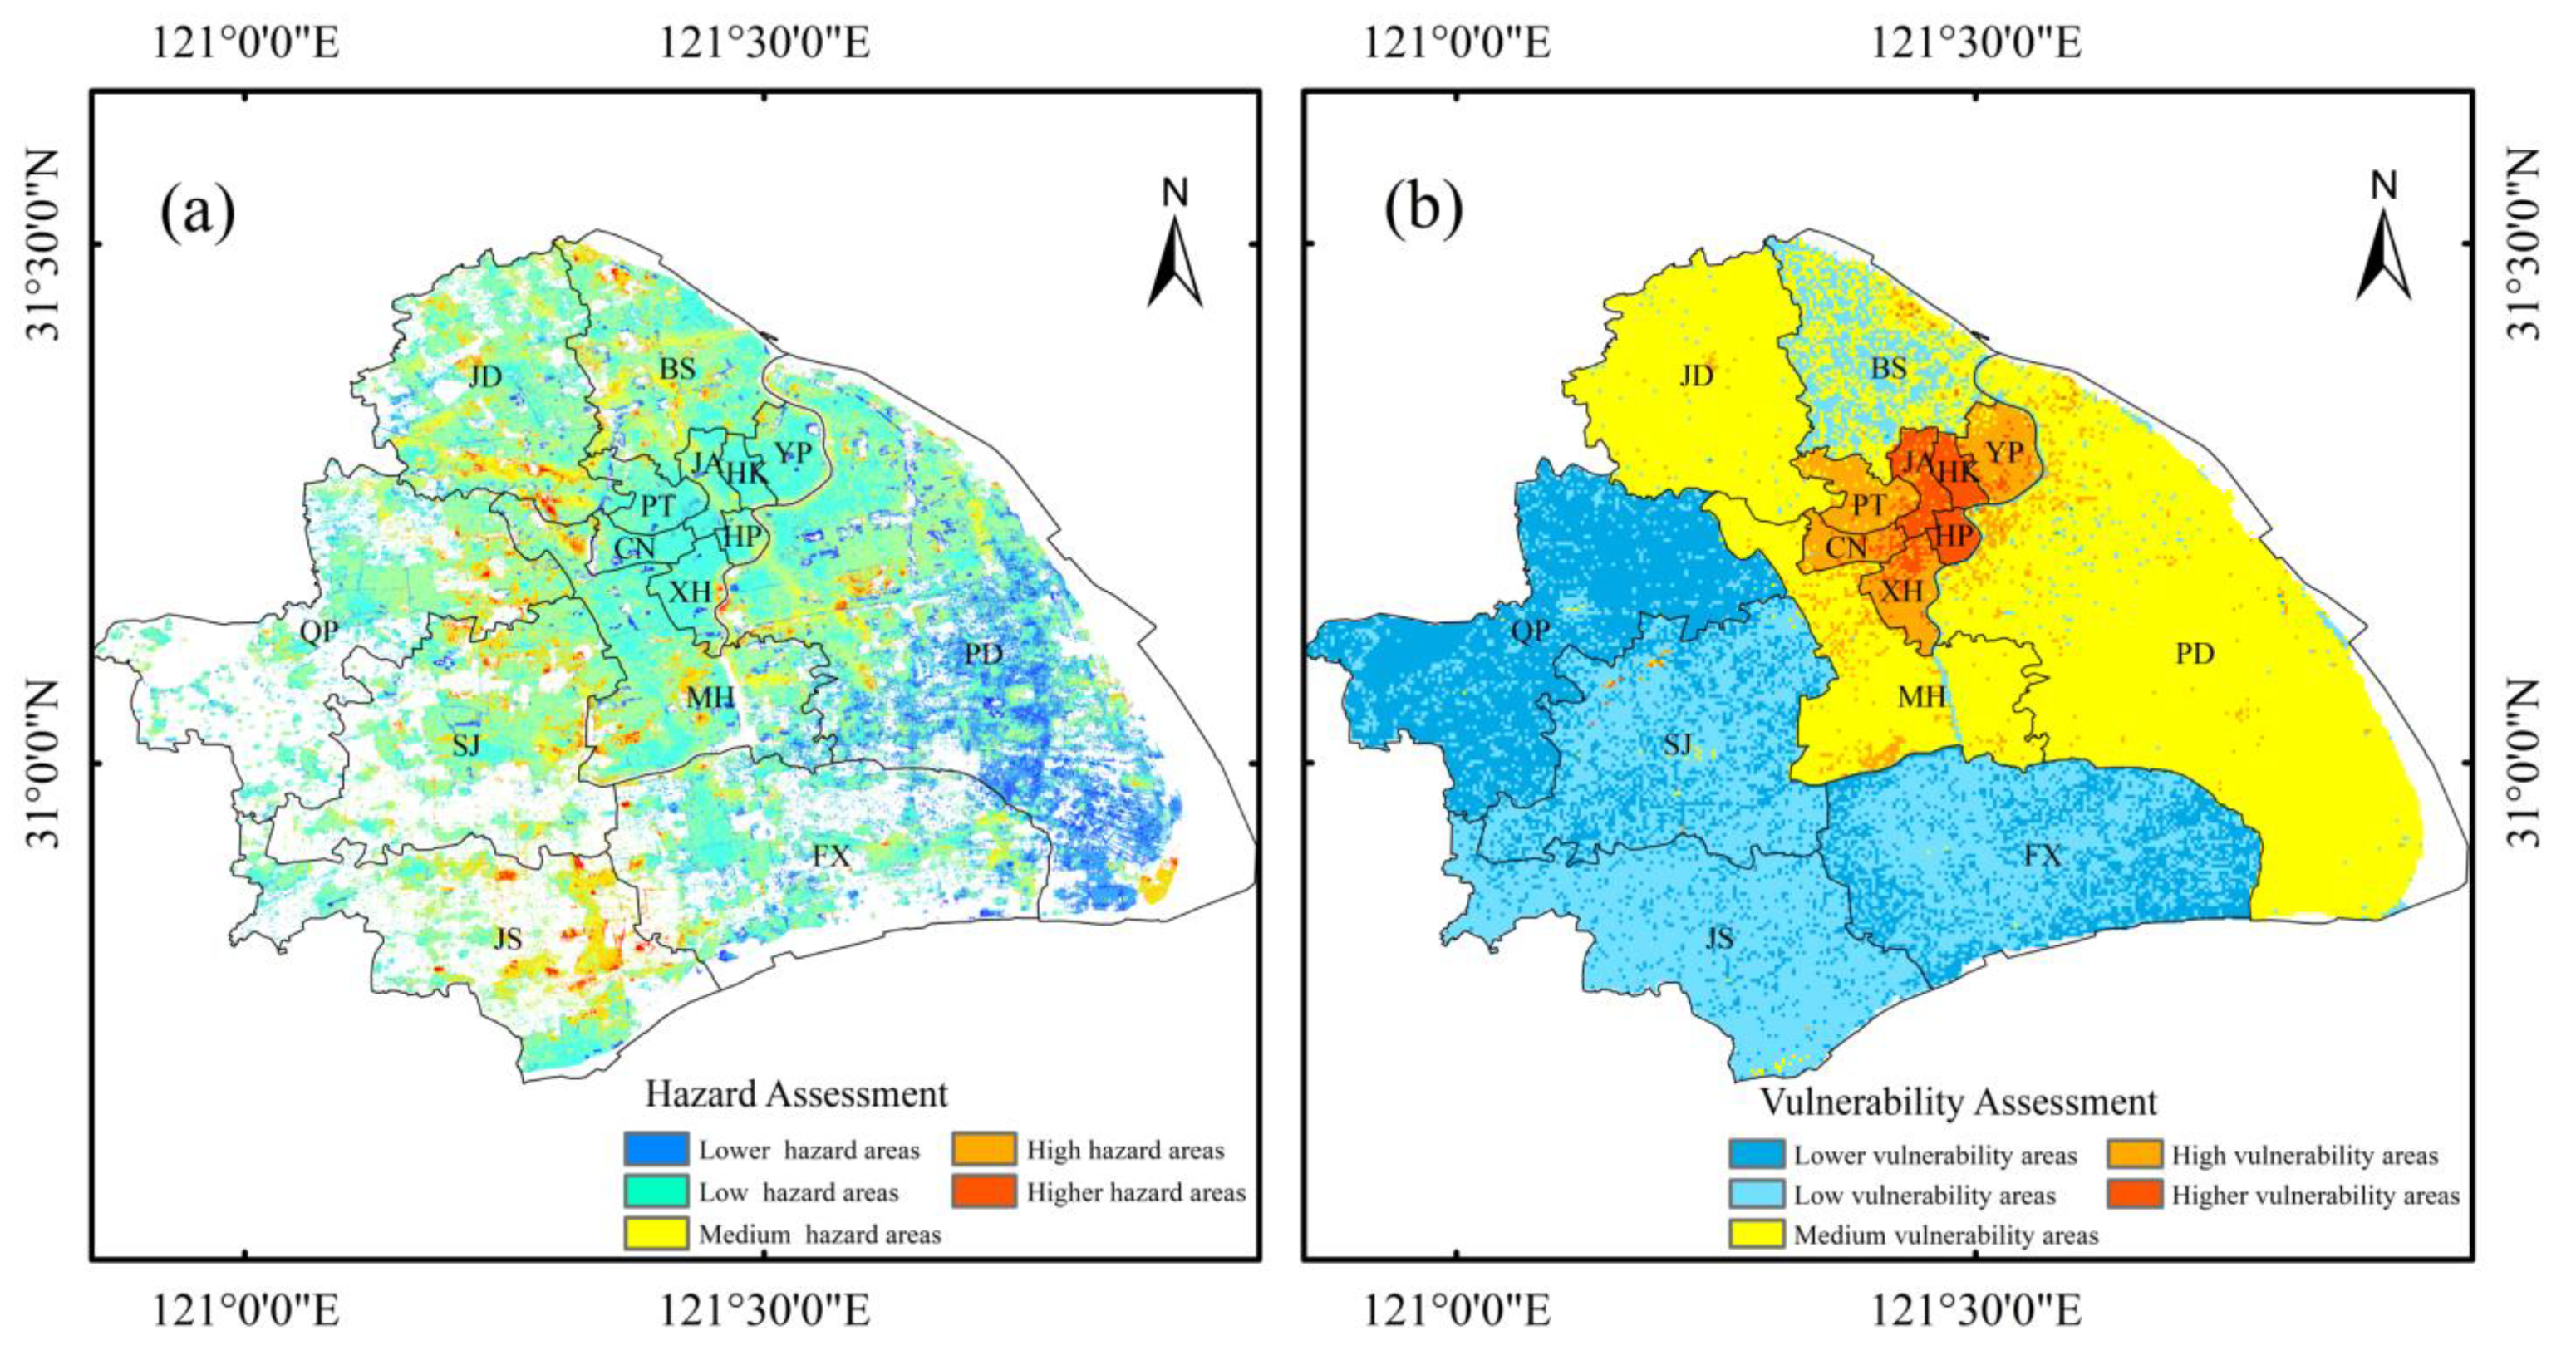
5.1. Risk Assessment Results
5.2. Risk Assessment Result Validation
5.3. Risk Assessment Result Discussion
6. Conclusions
- (1)
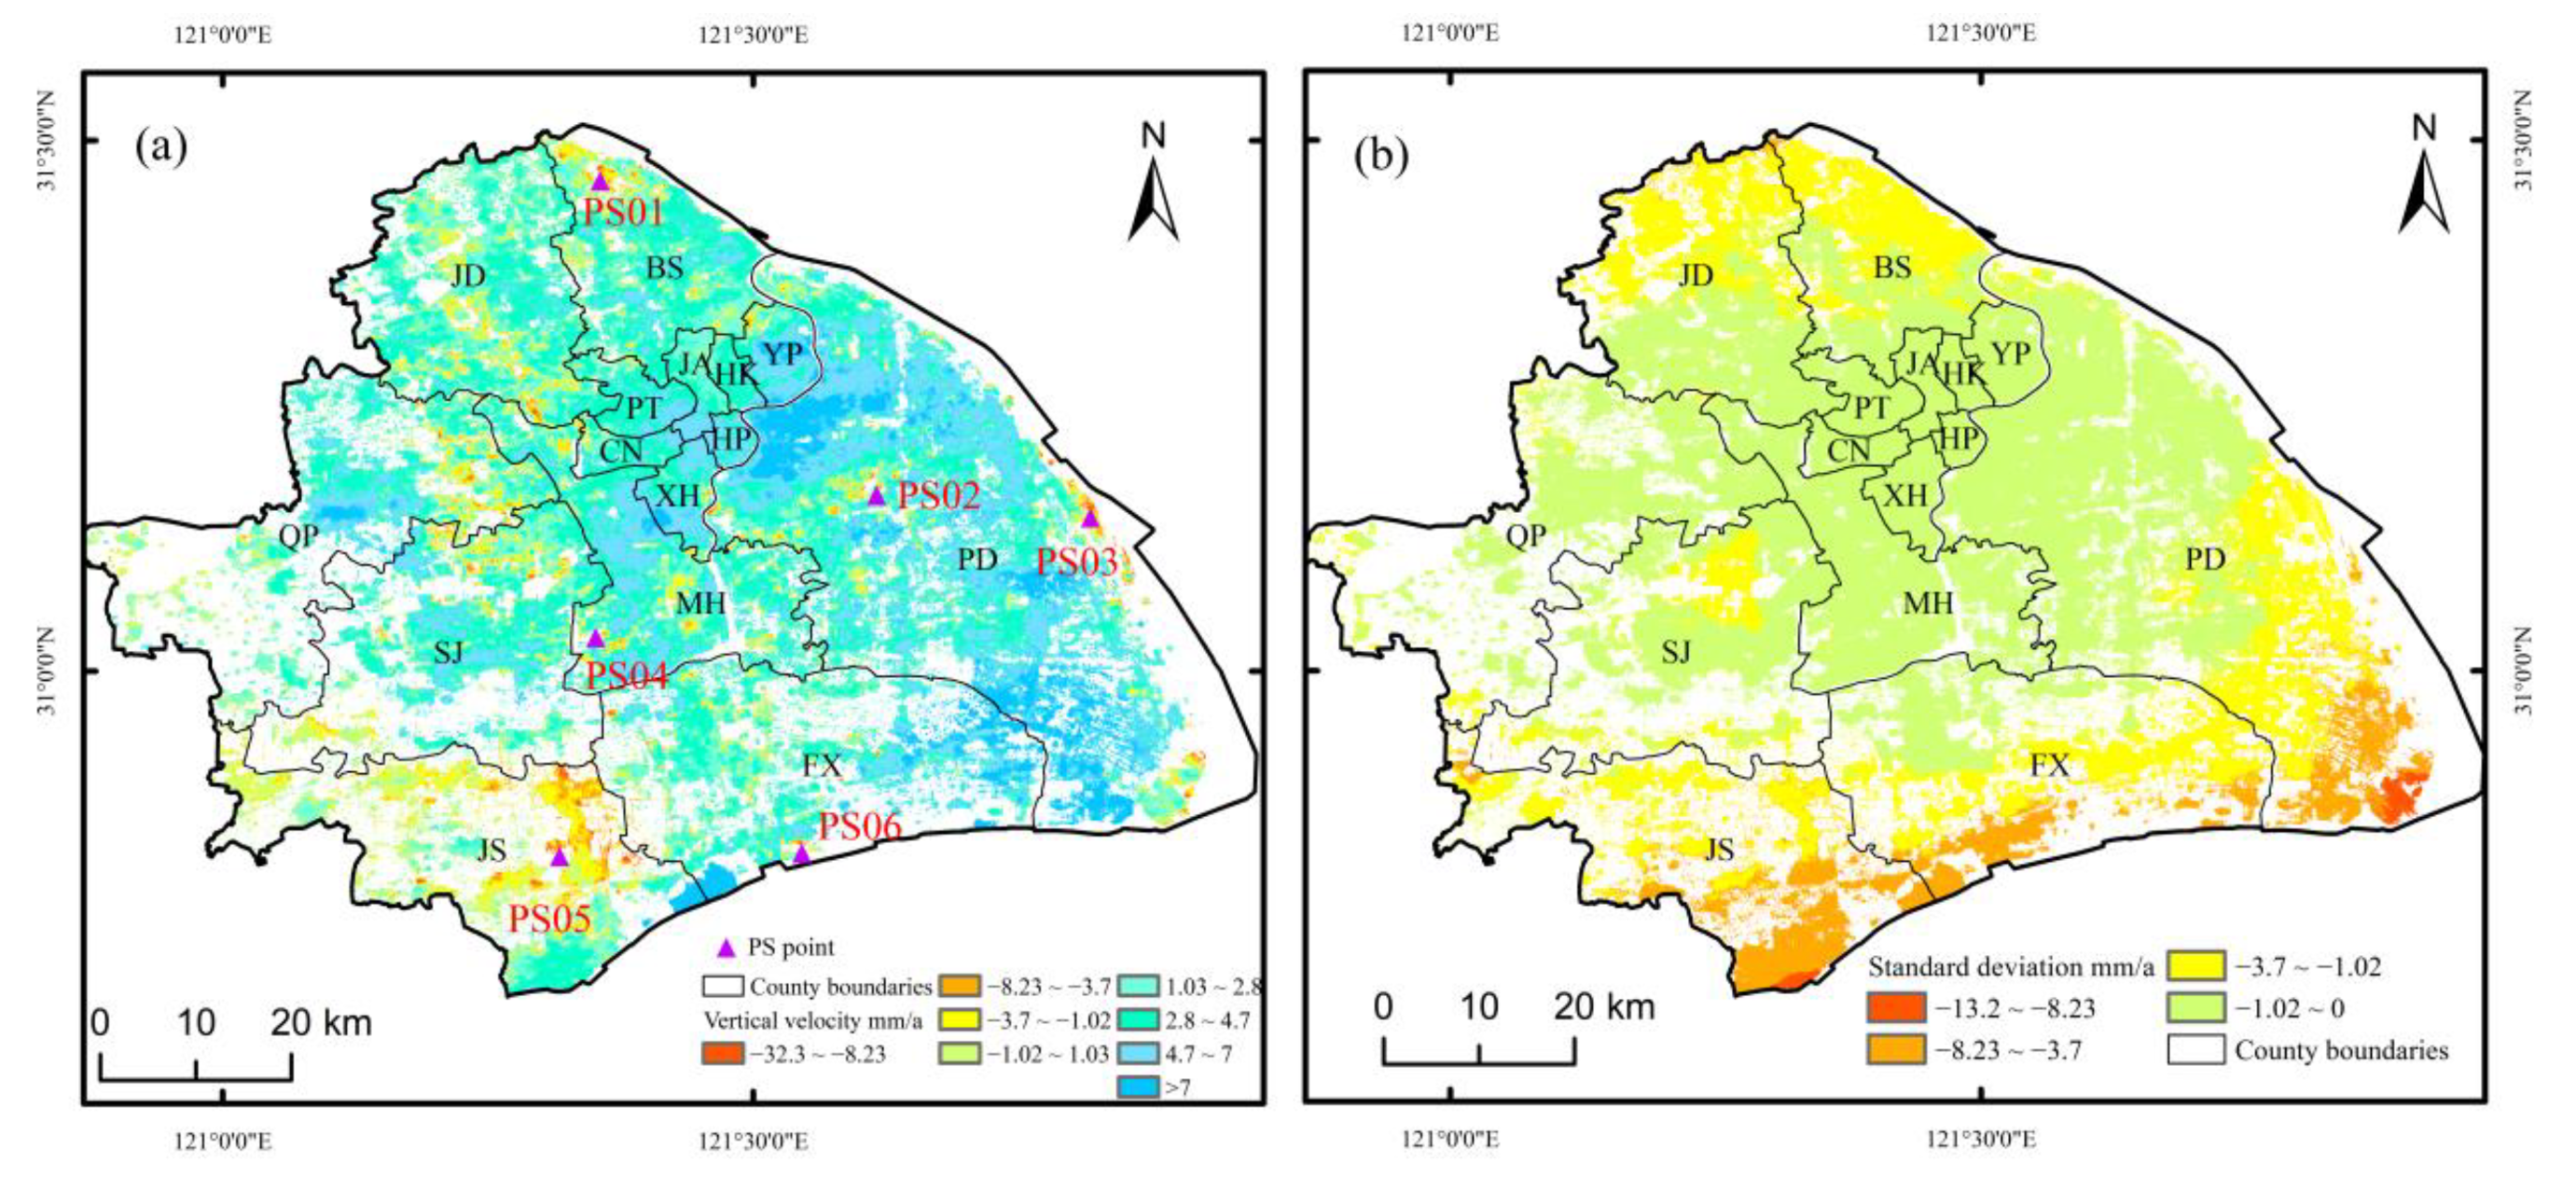
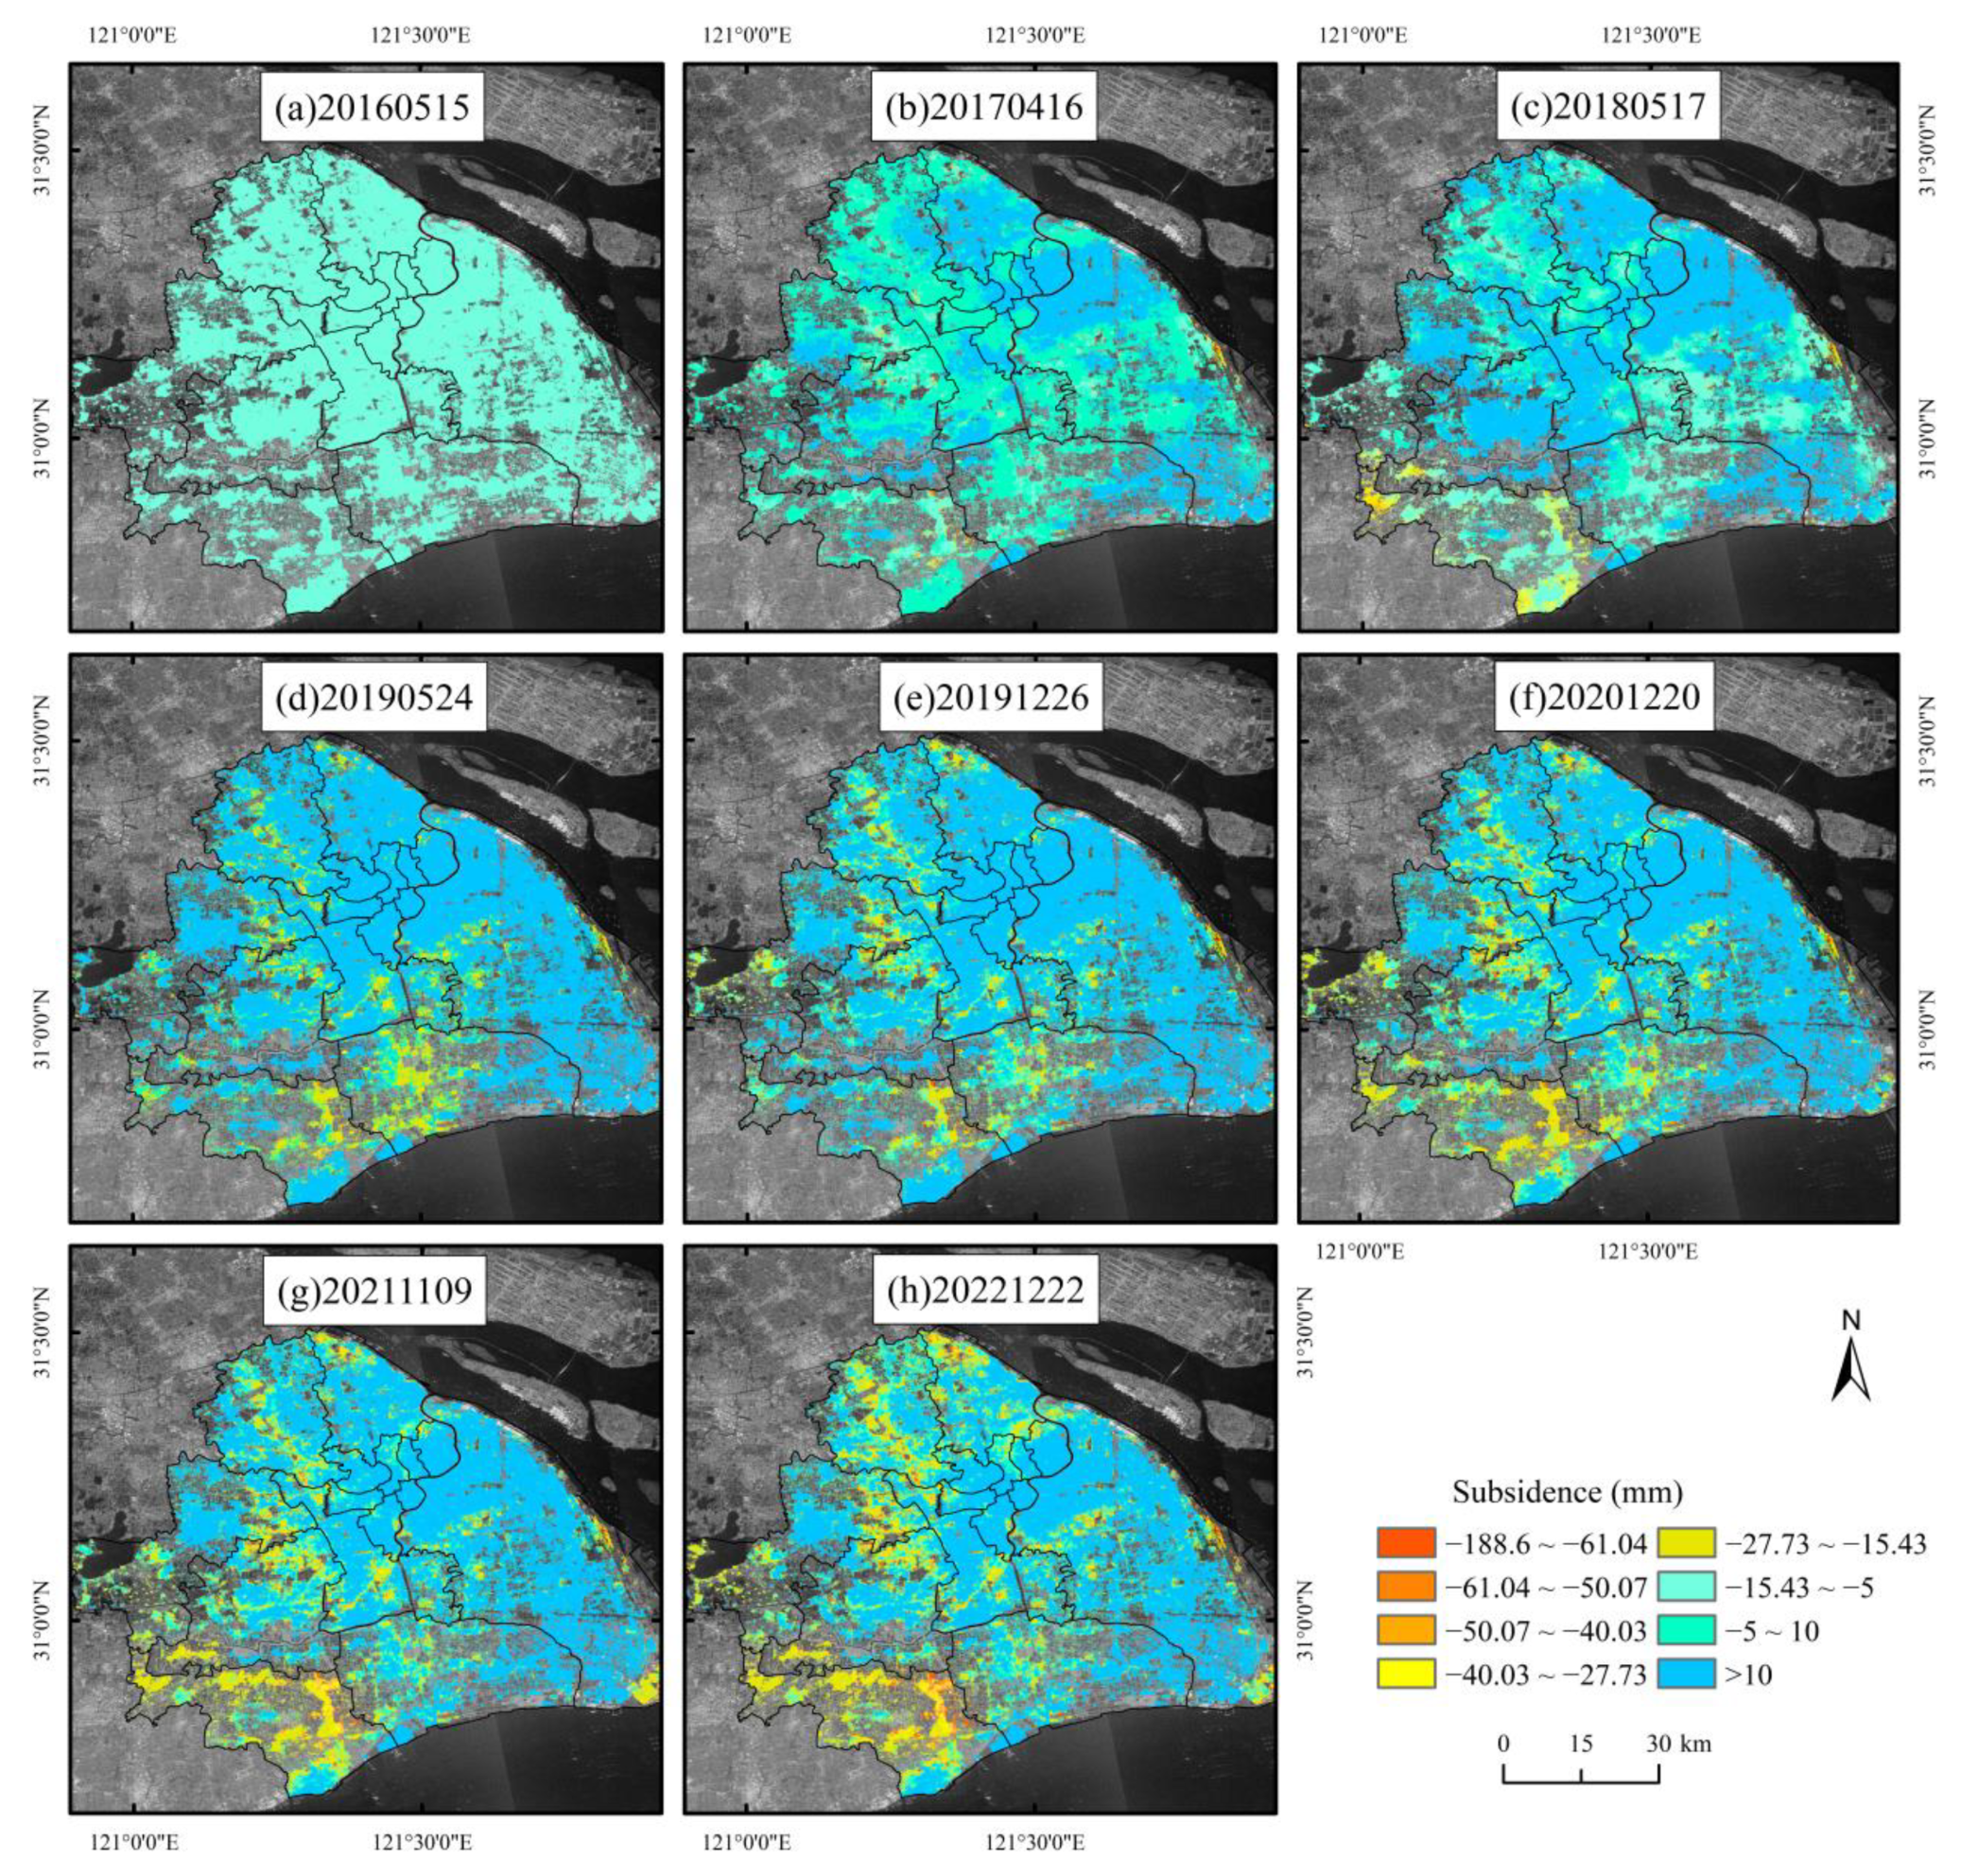
- We obtain the land surface deformation time series for Shanghai city during the period of 2016–2022 based on Sentinel-1A data. The maximum annual average ground subsidence rate is −37.8 mm/a, and the maximum cumulative deformation is −188.6 mm. The reliability of the experiment is verified by different technologies and data. Six typical settlement area points are mainly distributed in the BS area, MH region, and JS region of PD New Zone and present a linear distribution. Most subway lines occur at different degrees to settlements, among which the Lines 14, 15, 17, and 18 show the most severe settlement with the maximum velocity of −18.2 mm/a.
- (2)
- The related factors of land subsidence are discussed. The subsidence mainly occurs in engineering construction areas and there is a certain correlation with the subway development. With the construction area of Shanghai gradually developing from an urban area to a suburban area, the settlement also transforms from urban to suburban. Meanwhile, the correlation between land settlement and rainfall is relatively week.
- (3)
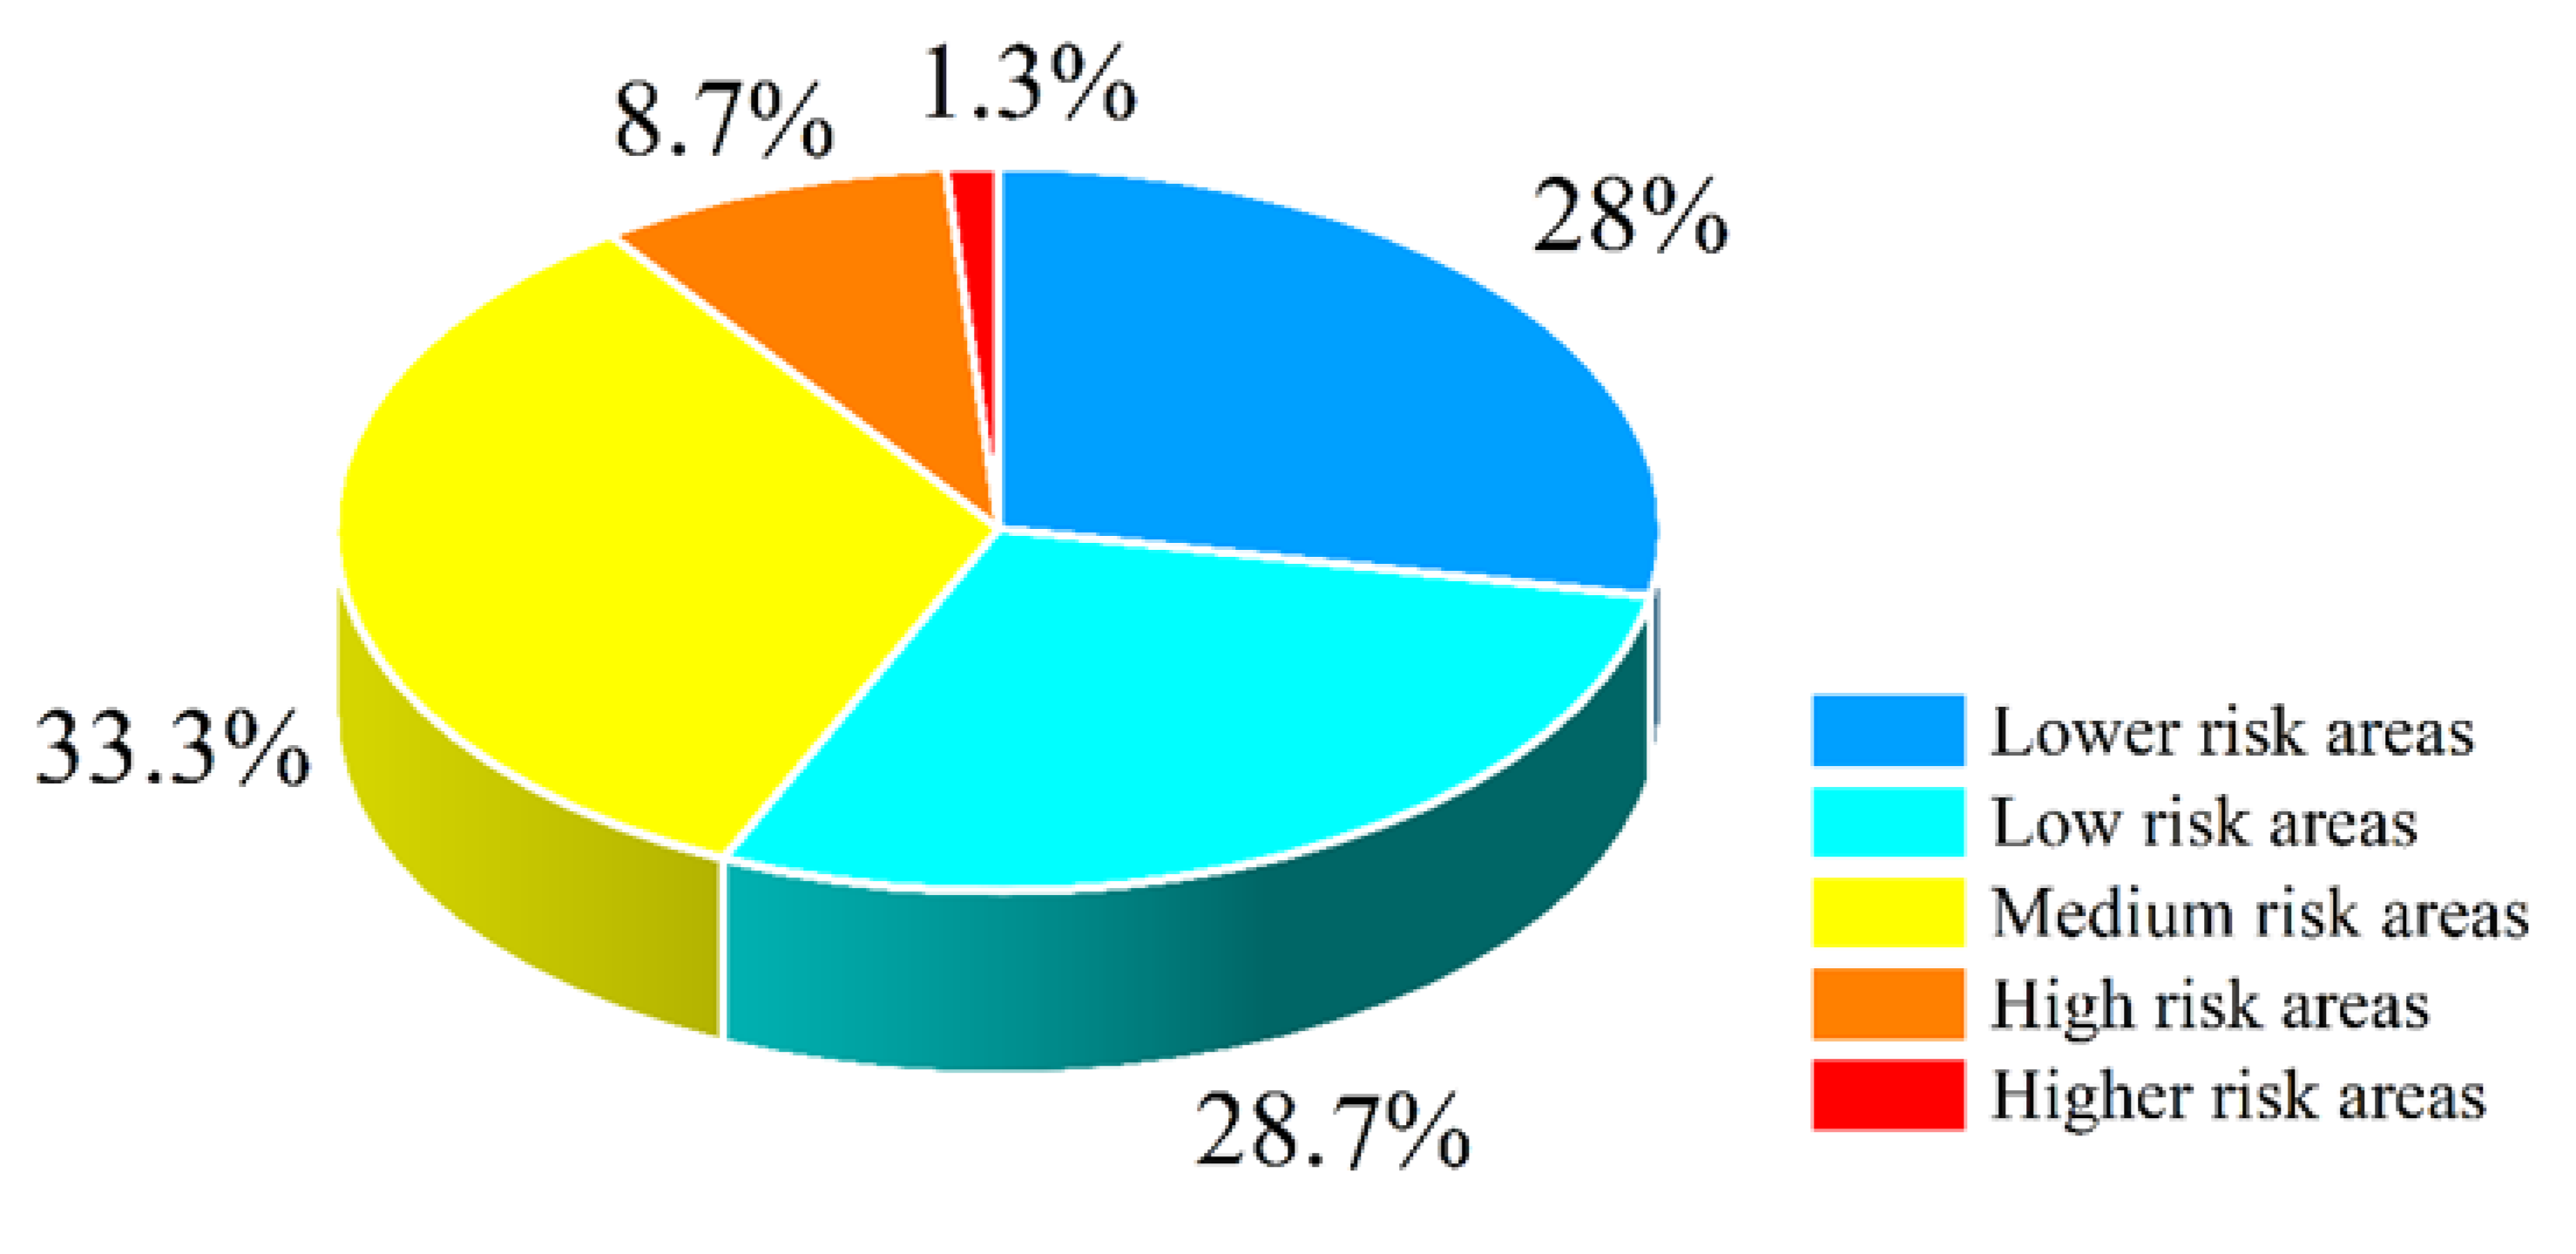
- According to the risk assessment results, the low-risk areas are mainly QP, SJ, FX, PD central, and other areas, while higher-risk areas are HP, YP, HK, and BS, covering areas of 65.47 square kilometers and accounting for 1.27% of the experimental area. The influencing factors of the risk assessment results in the Shanghai area are complex. The results of the risk assessment can provide basic data and a model basis for prevention, monitoring, and early warning of geological disasters in Shanghai and provide an optimization scheme for government decision making. However, we initially discuss risk assessment using ten influencing factors, and there may be more related factors to consider in the future.
Author Contributions
Funding
Institutional Review Board Statement
Informed Consent Statement
Data Availability Statement
Acknowledgments
Conflicts of Interest
References
- Ortega-Guerrero, M.A.; Carrillo-Rivera, J.J. Land Subsidence in Urban Environment; Springer: New York, NY, USA, 2012. [Google Scholar]
- Solarski, M.; Machowski, R.; Rzetala, M.; Rzetala, M.A. Hypsometric changes in urban areas resulting from multiple years of mining activity. Sci. Rep. 2022, 12, 2982. [Google Scholar] [CrossRef] [PubMed]
- Roland, B.; Hilley, G.; Ferretti, A.; Novali, F. Resolving vertical tectonics in the San Francisco Bay area from Permanent Scatterer InSAR and GPS analysis. Geology 2006, 34, 221–224. [Google Scholar]
- Ziyadin, C.; Chabalier, J.; Armijo, R. Coseismic and early post-seismic slip associated with the 1999 Izmit earthquake (Turkey), from SAR interferometry and tectonic field observations. Geophys. J. R. Astron. Soc. 2010, 155, 93–110. [Google Scholar]
- Xin, J.; Xiao, G.; Yu, F. The characteristics of surface vertical deformation before the Wenchuan MS 8. 0 earthquake from InSAR. Chin. J. Geophys. 2009, 52, 2739–2745. [Google Scholar]
- Hooper, A. A new method for measuring deformation on volcanoes and other natural terrains using InSAR persistent scatterers. Geophys. Res. Lett. 2004, 31. [Google Scholar] [CrossRef]
- Bell, J.; Amelung, F.; Ferretti, A.; Bianchi, M.; Novali, F. Permanent scatterer InSAR reveals seasonal and long-term aquifer-system response to groundwater pumping and artificial recharge. Water Resour. Res. 2008, 44. [Google Scholar] [CrossRef]
- Chaussard, E.; Amelung, F.; Abidin, H.; Hong, S.H. Sinking Cities in Indonesia: ALOS-PALSAR detects rapid subsidence due to groundwater and gas extraction. Remote Sens. Environ. 2013, 128, 150–161. [Google Scholar] [CrossRef]
- Wang, X.; Zhang, Q.; Zhao, C. A Novel Method of generating time-series deformation using InSAR and its Application in Mexico City. Remote Sens. 2018, 10, 1741. [Google Scholar] [CrossRef]
- Yang, C.; Zhang, Q.; Zhao, C.; Ji, L.; Zhu, W. Monitoring mine collapse by D-InSAR. Min. Sci. Technol. 2010, 20, 696–700. [Google Scholar] [CrossRef]
- Amelung, F.; Galloway, D.L.; Bell, J.W.; Zebker, H.A.; Laczniak, R.J. Sensing the ups and downs of Las Vegas: InSAR reveals structural control of land subsidence and aquifer-system deformation. Geology 1999, 27, 483–486. [Google Scholar] [CrossRef]
- Parcharidis, I. Spatio-Temporal Assessment of Land Deformation as a Factor Contributing to Relative Sea Level Rise in Coastal Urban and Natural Protected Areas Using Multi-Source Earth Observation Data. Remote Sens. 2020, 12, 2296. [Google Scholar]
- Harnischmacher, S.; Zepp, H. Mining and its impact on the earth surface in the Ruhr District (Germany). Z. Fur Geomorphol. 2014, 58 (Suppl. S3), 3–22. [Google Scholar] [CrossRef]
- Liu, J.P.; Li, A.C.; Xu, K.H.; Velozzi, D.M.; Yang, Z.S.; Milliman, J.D.; DeMaster, D.J. Sedimentary features of the yangtze river-derived along-shelf clinoform deposit in the east China sea. Cont. Shelf Res. 2006, 26, 2141–2156. [Google Scholar] [CrossRef]
- Wu, P.-C.; Wei, M.M.; D’Hondt, S. Subsidence in Coastal Cities Throughout the World Observed by InSAR. Geophys. Res. Lett. 2022, 49, e2022GL098477. [Google Scholar] [CrossRef]
- Cao, A.; Esteban, M.; Valenzuela, V.P.B.; Onuki, M.; Takagi, H.; Thao, N.D.; Tsuchiya, N. Future of Asian Deltaic Megacities under sea level rise and land subsidence: Current adaptation pathways for Tokyo, Jakarta, Manila, and Ho Chi Minh City—ScienceDirect. Curr. Opin. Environ. Sustain. 2021, 50, 87–97. [Google Scholar] [CrossRef]
- Dixon, T.H.; Amelung, F.; Ferretti, A.; Novali, F.; Rocca, F.; Dokka, R.; Sella, G.; Kim, S.W.; Wdowinski, S.; Whitman, D. Subsidence and flooding in New Orleans. Nature 2006, 441, 587–588. [Google Scholar] [CrossRef] [PubMed]
- Galloway, D.; Jones, R.; Ingebritsen, S. Land Subsidence in the United States; US Geological Survey: Reston, VI, USA, 1999; p. 1182. [Google Scholar]
- Herrera-García, G.; Ezquerro, P.; Tomás, R.; Béjar-Pizarro, M.; López-Vinielles, J.; Rossi, M.; Mateos, R.M.; Carreón-Freyre, D.; Lambert, J.; Teatini, P.; et al. Mapping the global threat of land subsidence. Science 2021, 371, 34–36. [Google Scholar] [CrossRef]
- Bagheri-Gavkosh, M.; Hosseini, S.M.; Ataie-Ashtiani, B.; Sohani, Y.; Ebrahimian, H.; Morovat, F.; Ashrafi, S. Land subsidence: A global challenge. Sci. Total Environ. 2021, 778, 146–193. [Google Scholar] [CrossRef] [PubMed]
- Yang, Y.; Zheng, Y.; Yu, W.; Chen, W.; Weng, D. Deformation monitoring using GNSS-R technology. Adv. Space Res. 2019, 63, 3303–3314. [Google Scholar] [CrossRef]
- Babic, L.; Apo, A.; Pribievi, B. Application of 3D Laser Scanning for Deformation Measurement on Industrial Objects. In Proceedings of the FIG Congress 2014, Kuala Lumpur, Malaysia, 16–21 June 2014. [Google Scholar]
- Ferretti, A.; Monti-Guarnieri, A.; Prati, C.; Rocca, F.; Massonet, D. Insar Principles-Guidelines for SAR Interferometry Processing and Interpretation. 2007. Available online: https://ui.adsabs.harvard.edu/abs/2007ESATM..19.....F/abstract (accessed on 30 June 2023).
- Berardino, P.; Fornaro, G.; Lanari, R. A New Algorithm for Surface Deformation Monitoring Based on Small Baseline Differential SAR Interferograms. IEEE Trans. Geosci. Remote Sens. 2002, 40, 2375–2383. [Google Scholar] [CrossRef]
- Nádudvari, Á. Using radar interferometry and SBAS technique to detect surface subsidence relating to coal mining in Upper Silesia from 1993–2000 and 2003–2010. Environ. Socio-Econ. Stud. 2016, 4, 24–34. [Google Scholar] [CrossRef]
- Yan, L. Shanghai Land Subsidence History Retrospective: A Discussion on the Understanding of “Water in Use, Earth Must Sink”. Shanghai Geol. 1980, 1, 43–53. [Google Scholar]
- Monjoie, A.; Paepe, R.; Yuan, S. Land subsidence in Shanghai (P.R. of China). Bull. Eng. Geol. Environ. 1992, 46, 5–7. [Google Scholar] [CrossRef]
- Perissin, D.; Teng, W. Time-series InSAR applications over urban areas in China. IEEE J. Sel. Top. Appl. Earth Obs. Remote Sens. 2001, 4, 92–100. [Google Scholar] [CrossRef]
- Chai, J.; Shen, S.; Zhu, H.; Zhang, X. Land subsidence due to groundwater drawdown in Shanghai. Geotechnique 2004, 54, 143–147. [Google Scholar] [CrossRef]
- Wei, Z.; Wang, H.; Wu, J. Shanghai Land subsidence and its impact on urban safety. Shanghai Geol. 2009, 109, 34–39. [Google Scholar]
- Dai, L. Preventing and Controlling Land Subsidence in Shanghai—Towards More Integrated and Effective Land Use and Ground Water Governance in the Yangtze Delta. Available online: https://ui.adsabs.harvard.edu/abs/2016EGUGA..1816451D/abstract (accessed on 30 June 2023).
- Wang, G.; Kang, J.; Yan, G. System Analysis and Numerical Simulation of Land Subsidence in Shanghai. Appl. Mech. Mater. 2013, 241–244, 2578–2582. [Google Scholar] [CrossRef]
- Liao, M.; Wang, T. Time-Series InSAR Technology and Application; Science Press: Beijing, China, 2014. [Google Scholar]
- Qin, X.; Yang, T. Health diagnosis of major transportation infrastructures in Shanghai Metropolis using High-Resolution persistent scatterer interferometry. Sensors 2017, 17, 2770–2794. [Google Scholar] [CrossRef]
- Wang, R.; Yang, T.; Yang, M. Settlement monitoring and attribution analysis of PS-InSAR technology on Shanghai elevated road. J. Wuhan Univ. 2018, 43, 2050–2205. [Google Scholar]
- Wang, R.; Yang, T.; Yang, M.; Liao, M.; Lin, J. A safety analysis of elevated highways in Shanghai linked to dynamic load using long-term time-series of InSAR stacks. Remote Sens. 2019, 10, 1133–1142. [Google Scholar] [CrossRef]
- Jin, Y.; Zi, H.B. Explorations and Practices of Rail Transit Multi-level network Integration Planning in Shanghai. Transp. Eng. 2020, 5, 7–13. [Google Scholar]
- Li, J.; Zhou, L.; Zhu, Z.; Qin, J.; Xian, L.; Zhang, D.; Huang, L. Surface Deformation Mechanism Analysis in Shanghai on TS-InSAR Technology. Remote Sens. 2022, 14, 4368. [Google Scholar] [CrossRef]
- Yang, M.; Wang, R.; Liu, M. A PSI targets characterization approach to interpreting surface displacement signals: A case study of the Shanghai metro tunnels. Remote Sens. Environ. 2022, 280, 113–150. [Google Scholar] [CrossRef]
- Chen, Y.; Liao, M.; Wu, J.; Li, X.; Xiong, F.; Liu, S.; Feng, Y.; Wang, X. Elastic, and Inelastic Ground Deformation in Shanghai Lingang Area Revealed by Sentinel-1, Leveling, and Groundwater Level Data. Remote Sens. 2022, 14, 2693. [Google Scholar] [CrossRef]
- Zhang, J.; Ke, C.; Shen, X.; Lin, J.; Wang, R. Monitoring Land Subsidence along the Subways in Shanghai on the Basis of Time-Series InSAR. Remote Sens. 2023, 15, 908. [Google Scholar] [CrossRef]
- Zhang, Z.; Hu, C.; Wu, Z.; Zhang, Z.; Yang, S.; Yang, W. Monitoring and analysis of ground subsidence in Shanghai based on PS-InSAR and SBAS-InSAR technologies. Sci. Rep. 2023, 13, 8031. [Google Scholar] [CrossRef] [PubMed]
- The Implementation Plan of Shanghai Urban Geology and Mineral Resources Master Plan (2021–2025). Available online: https://www.shanghai.gov.cn/gwk/search/content/89f0095a3e5c4234b27c252d75274b32 (accessed on 30 June 2023).
- Shi, Y.S.; Shi, D.H.; Cao, X.Y. Impacting factors and temporal and spatial differentiation of land subsidence in shanghai. Sustainability 2018, 10, 3146. [Google Scholar] [CrossRef]
- Zhang, Y.; Liu, Y.; Liu, Y.; Liu, Y.; Chen, Y.; Wang, Z. Spatial-temproal variation characteristics and geographic detection mechanism of land subsidence in Wuhan city from 2007 to 2019. Geomat. Info. Sci. Wuhan Univ 2021, 47, 1486–1497. [Google Scholar]
- Chong, M.; Jie, F. Study on Flood Control Risk Management for Reservoir Earth Dam. In Proceedings of the 2009 1st International Conference on Information Science and Engineering (ICISE 2009), Nanjing, China, 26–28 December 2009; pp. 4518–4521. [Google Scholar]
- Zhang, X. Study on the risk assessment of land subsidence in Beijing plain based on 3D modeling. S.N. Water Transf. Water Sci. Tech. 2017, 15, 126–130. [Google Scholar]
- Nikhil, S.; Danumah, J.H.; Saha, S.; Prasad, M.K.; Rajaneesh, A.; Mammen, P.C.; Ajin, R.S.; Kuriakose, S.L. Correction to: Application of GIS and AHP method in forest fire risk zone mapping: A study of the Parambikulam Tiger Reserve, Kerala, India. J. Geovis. Spat. Anal. 2021, 5, 15. [Google Scholar] [CrossRef]
- Li, S.; Xu, W.; Li, Z. Review of the SBAS InSAR Time-series algorithms, applications, and challenges. Geod. Geodyn. 2022, 13, 114–126. [Google Scholar] [CrossRef]
- Chen, Q.; Dam, T.V.; Sneeuw, N.; Collilieux, X.; Weigelt, M.; Rebischung, P. Singular spectrum analysis for modeling seasonal signals from GPS time series. J. Geodyn. 2013, 72, 25–35. [Google Scholar] [CrossRef]
- Zhu, W.; Dou, H.; Yin, N.; Cheng, Y.; Zhang, S.; Zhang, Q. Deformation characteristics analysis of the expansive soil slope by integrating of InSAR and SSA techniques: A case study of the South-to-North Water Diversion Project. Acta Geod. Cartogr. Sin. 2022, 51, 2083–2092. [Google Scholar]
- Chen, W.; Gong, H.; Chen, B.; Liu, K. Spatioevolution of land subsidence around a subway using InSAR time-series and the entropy method. J. GISci. Remote Sens. 2016, 54, 78–94. [Google Scholar] [CrossRef]
- Xie, J.R.; Gong, H.; Chen, B.; Zhu, F.; Duan, G. Stability Analysis of Land Subsidence Based on PSInSAR Technology and Cloud Model. Geogr. Geo-Inform. Sci. 2015, 31, 49–53. (In Chinese) [Google Scholar]
- Wei, Z.; Zhai, G.; Yan, X. Shanghai Urban Geology; Geology Press: Beijing, China, 2010; p. 37. [Google Scholar]
- Environmental Impact Report of Shanghai Urban Geology and Mineral Resources Master Plan (2021–2025). Available online: https://ghzyj.sh.gov.cn/dczj/20220119/b0777f8ddd9c452e87b302954abc4996.html (accessed on 30 June 2023).
- Zhang, Z.; Zhang, S.; Hu, C. Hazard assessment model of ground subsidence coupling AHP, RS and GIS—A case study of Shanghai. Gondwana Res. 2023, 117, 344–362. [Google Scholar] [CrossRef]
- Rateb, A.; Hermas, E. The 2018 long rainy season in Kenya: Hydrological changes and correlated land subsidence. Remote Sens. 2020, 12, 1390. [Google Scholar] [CrossRef]
- Wang, H.; Wang, Y.; Jiao, X.; Qian, G. Risk management of land subsidence in Shanghai. Desalination Water Treat. 2014, 52, 1122–1129. [Google Scholar] [CrossRef]
- Shanghai Provisions on the Administration of Geological Hazard Risk Assessment. 2023. Available online: http://law168.com.cn/doc/view?id=182351 (accessed on 30 June 2023).


| Parameters | Sentinel-1A | TerraSAR-X |
|---|---|---|
| Wavelength | C | X |
| Polarization mode | VV | VV |
| Orbit direction | Ascending | Descending |
| Incidence | 39.28° | 42.8° |
| Image number | 94 | 9 |
| Hazard Indicators | Data Sources | Vulnerability Indicators | Data Sources |
|---|---|---|---|
| Type of land use | Global land cover data official website (http://www.globallandcover.com/, accessed on 30 June 2023) | Population density | Shanghai Statistical Yearbook 2022 |
| Water system density | GDP per unit area | ||
| Vertical velocity | SBAS-InSAR results | Green space density | |
| Road density | OpenStreet’s official website (https://www.openstreetmap.org/, accessed on 30 June 2023) | ||
| Subsidence | Building density |
| Type | 0–0.2 | 0.21–0.4 | 0.41–0.6 | 0.61–0.8 | 0.81–1 |
|---|---|---|---|---|---|
| Risk level | Lower | Low | Medium | High | Higher |
| First-Grade Index | Second-Grade Index | Secondary Index Weight | Comprehensive Weight |
|---|---|---|---|
| Hazard | Land use type | 0.2381 | 0.1071 |
| Drainage density | 0.1919 | 0.0854 | |
| Subsidence | 0.3426 | 0.2188 | |
| Vertical velocity | 0.2274 | 0.1424 | |
| Vulnerability | Population density | 0.2203 | 0.0651 |
| GDP per unit | 0.2059 | 0.0781 | |
| Road density | 0.1273 | 0.092 | |
| Building density | 0.1582 | 0.1302 | |
| Green space density | 0.1301 | 0.0379 | |
| Ground elevation | 0.1582 | 0.043 |
| Land Type | 2000 | 2010 | 2020 | Change |
|---|---|---|---|---|
| Cultivated land | 3118.52 | 2456.50 | 2032.91 | ↓ |
| Grassland | 1.67 | 6.17 | 69.24 | ↑ |
| Forest land | 13.68 | 13.96 | 72.23 | ↑ |
| Water body | 192.49 | 189.96 | 222.54 | ↑ |
| Construction land | 1320.90 | 1981.31 | 2245.17 | ↑ |
| Unused land | 0.81 | 0.18 | 5.99 | ↑ |
Disclaimer/Publisher’s Note: The statements, opinions and data contained in all publications are solely those of the individual author(s) and contributor(s) and not of MDPI and/or the editor(s). MDPI and/or the editor(s) disclaim responsibility for any injury to people or property resulting from any ideas, methods, instructions or products referred to in the content. |
© 2023 by the authors. Licensee MDPI, Basel, Switzerland. This article is an open access article distributed under the terms and conditions of the Creative Commons Attribution (CC BY) license (https://creativecommons.org/licenses/by/4.0/).
Share and Cite
Wang, X.; Yang, Y.; Xia, Y.; Chen, S.; She, Y. Integrating SAR and Geographic Information Data Revealing Land Subsidence and Geological Risks of Shanghai City. Appl. Sci. 2023, 13, 12091. https://doi.org/10.3390/app132112091
Wang X, Yang Y, Xia Y, Chen S, She Y. Integrating SAR and Geographic Information Data Revealing Land Subsidence and Geological Risks of Shanghai City. Applied Sciences. 2023; 13(21):12091. https://doi.org/10.3390/app132112091
Chicago/Turabian StyleWang, Xiaying, Yumei Yang, Yuanping Xia, Shuaiqiang Chen, and Yulin She. 2023. "Integrating SAR and Geographic Information Data Revealing Land Subsidence and Geological Risks of Shanghai City" Applied Sciences 13, no. 21: 12091. https://doi.org/10.3390/app132112091
APA StyleWang, X., Yang, Y., Xia, Y., Chen, S., & She, Y. (2023). Integrating SAR and Geographic Information Data Revealing Land Subsidence and Geological Risks of Shanghai City. Applied Sciences, 13(21), 12091. https://doi.org/10.3390/app132112091