Article

Engagement Recognition Using a Multi-Domain Feature Extraction Method Based on Correlation-Based Common Spatial Patterns

1
Shanghai Advanced Research Institute, Chinese Academy of Sciences, Shanghai 201210, China
2
University of Chinese Academy of Sciences, Beijing 100049, China
3
School of Microelectronics, Shanghai University, Shanghai 201800, China
*
Author to whom correspondence should be addressed.
Appl. Sci. 2023, 13(21), 11924; https://doi.org/10.3390/app132111924
Submission received: 29 August 2023 / Revised: 10 October 2023 / Accepted: 19 October 2023 / Published: 31 October 2023
(This article belongs to the Special Issue Electroencephalography (EEG) in Assessment of Engagement and Workload)

Abstract

:
Engagement ability plays a fundamental role in allocating attentional resources and helps us perform daily tasks efficiently. Therefore, it is of great importance to recognize engagement level. Electroencephalography is frequently employed to recognize engagement for its objective and harmless nature. To fully exploit the information contained in EEG signals, an engagement recognition method integrating multi-domain information is proposed. The proposed method extracts frequency information by a filter bank. In order to utilize spatial information, the correlation-based common spatial patterns method is introduced and extended into three versions by replacing different correlation coefficients. In addition, the Hilbert transform helps to obtain both amplitude and phase information. Finally, features in three domains are combined and fed into a support vector machine to realize engagement recognition. The proposed method is experimentally validated on an open dataset composed of 29 subjects. In the comparison with six existing methods, it achieves the best accuracy of 87.74 ± 5.98 % in binary engagement recognition with an improvement of 4.03 % , which proves its efficiency in the engagement recognition field.

1. Introduction

Engagement is the ability to spend attentional resources on task-related stimuli and ignore external interference [1]. As a fundamental aspect of cognition, engagement ability plays a crucially important role in the operational environment [2]. Engagement helps us to ignore interference and focus our awareness, which is necessary for learning, working, and building normal relationships [3,4,5]. Being a participant in numerous and heterogeneous daily tasks, everyone endeavors to improve their efficiency with high engagement [6,7,8]. In highly professional scenarios in particular, such as clinical operations [9], aircraft piloting [10] and aerial work [11], engagement level monitoring is very important and related to life safety [12]. The disability of being engaged in current tasks and dealing with mental workload may lead to severe accidents [13]. Moreover, measuring engagement is of great clinical application. For example, measuring engagement can help to diagnose psychological diseases, such as attention deficit hyperactivity disorder (ADHD), which is a common disease in children [14]. Furthermore, engagement level influences the reliability of psychological tests [15]. Monitoring the engagement level can measure the credibility of psychological tests and therefore serves as an auxiliary means in other psychological treatments. In this way, it becomes more and more significant to recognize and measure engagement level [16,17].
Psychologists have made attempts to design various self-reporting questionnaires and scales in order to reflect the engagement level of subjects more accurately [18,19,20,21]. However, these subjective tools are delayed and sometimes uncertain due to indistinct memory and dishonesty. Unlike subjective tools, physiological signals can be collected simultaneously with the execution of the current task and can reflect the engagement level more accurately without subjective interference [22,23]. Therefore, researchers have started to recognize engagement level and workload through physiological signals. In [24], physiological signals, including electrocardiogram (ECG), skin conductivity (SC), and respiration (RESP) signals, are collected and combined with the Self-Assessment Manikin to detect the cognitive load. Belle et al. [25] decomposed ECG signals using an S-transform algorithm to detect engagement and attention state. Zennifa et al. [22] introduced the implementation of a low-density hybrid system for engagement recognition, in which wireless electroencephalography (EEG), ECG, electrooculogram (EOG), and near-infrared spectroscopy (NIRS) are utilized.
This study focuses on EEG-based engagement recognition. Existing studies in neuropsychology have revealed the direct correlation between EEG signals and a variety of cognitive behaviors, including engagement level [26,27,28], and established EEG-based engagement recognition. The key to decoding engagement level using EEG signals is to extract the most representative features to realize engagement level classification. The most widely used feature in engagement level classification is spectral power. Booth et al. [29] predicted engagement utilizing power spectral density (PSD) features. The PSD features in δ (1–4 Hz), θ (4–8 Hz), α (8–13 Hz), and β (13–30 Hz) were extracted as features to feed into classifiers to predict engagement level. Similarly, 1 Hz bin PSD features were utilized by Li et al. and fed into deep models for engagement assessment [23]. Relative band power of δ , θ , α , and β bands were calculated, and P β / ( P α + P θ ) was taken as an EEG index by Rabbi et al. [30]. The four features were analyzed under different tasks. Researchers in [31] extracted relative PSDs from differential EEG channels and fed them into a linear DFA to realize binary engagement classification for subjects who ranged from 67 to 93 years old. Researchers in [22] extracted multi-modal physiological signals, including EEG, ECG, and NIRS signals, in which the maximum power, the power density integral power, and the relative power of δ , θ , α , and β bands were extracted as features. Then, the features were selected using a correlation-based feature selection (CFS) method and classified with the k-nearest neighbor (KNN) method. However, only information in the frequency domain is utilized in these methods, which fails to exploit the underlying information related to engagement level in EEG signals. Therefore, it is significant to improve the engagement recognition accuracy by integrating information from different domains and extracting representative features to realize classification.
For the spatial domain, the common spatial pattern (CSP) [32] method is one of the most popular and powerful spatial filtering methods in the motor imaginary (MI)-based brain–computer interface (BCI). The purpose of the CSP is to find spatial filters so that the variance of the filtered data is maximized for one class and minimized for the other class. However, due to the sensitivity of the CSP to noise, many extensions of CSP-based methods have emerged to improve its effectiveness. In [33], an L1 norm-based CSP is introduced, in which the L1 norm is in place of the L2 norm to figure out the spatial filter estimation in order to improve the robustness of the CSP. Lotte et al. [34] proposed an integrated theoretical framework of a regularized CSP (RCSP) and specifically designed four RCSP algorithms, among which the optimal RCSPs are a CSP with Tikhonov regularization and weighted Tikhonov regularization. Recently, a correlation-based CSP (CCSP) based on temporal correlation was designed to improve the performance of the CSP [35]. In this study, the CCSP algorithm was adopted to extract spatial features. For the frequency domain, the combination of a filter bank and a CSP is a simple way to combine the information in the frequency domain with that in the spatial domain [36]. A set of filter banks was designed, and their effectiveness was compared to select the optimal filter bank. In addition, for the phase domain, both amplitude and phase information were considered to utilize the potential information embedded in the EEG signals. Therefore, this paper proposes an engagement recognition using a multi-domain feature extraction method based on correlation-based common spatial patterns (MDCCSPs), which presents three contributions:
  • Firstly, an engagement recognition method based on a correlation-based CSP is proposed, in which the temporal correlation is utilized as a prior to improve the effectiveness. Specifically, the original CCSP is extended into three versions by replacing various correlation coefficients (Pearson’s linear correlation coefficient, Kendall’s correlation coefficient [37], and Spearman’s correlation coefficient).
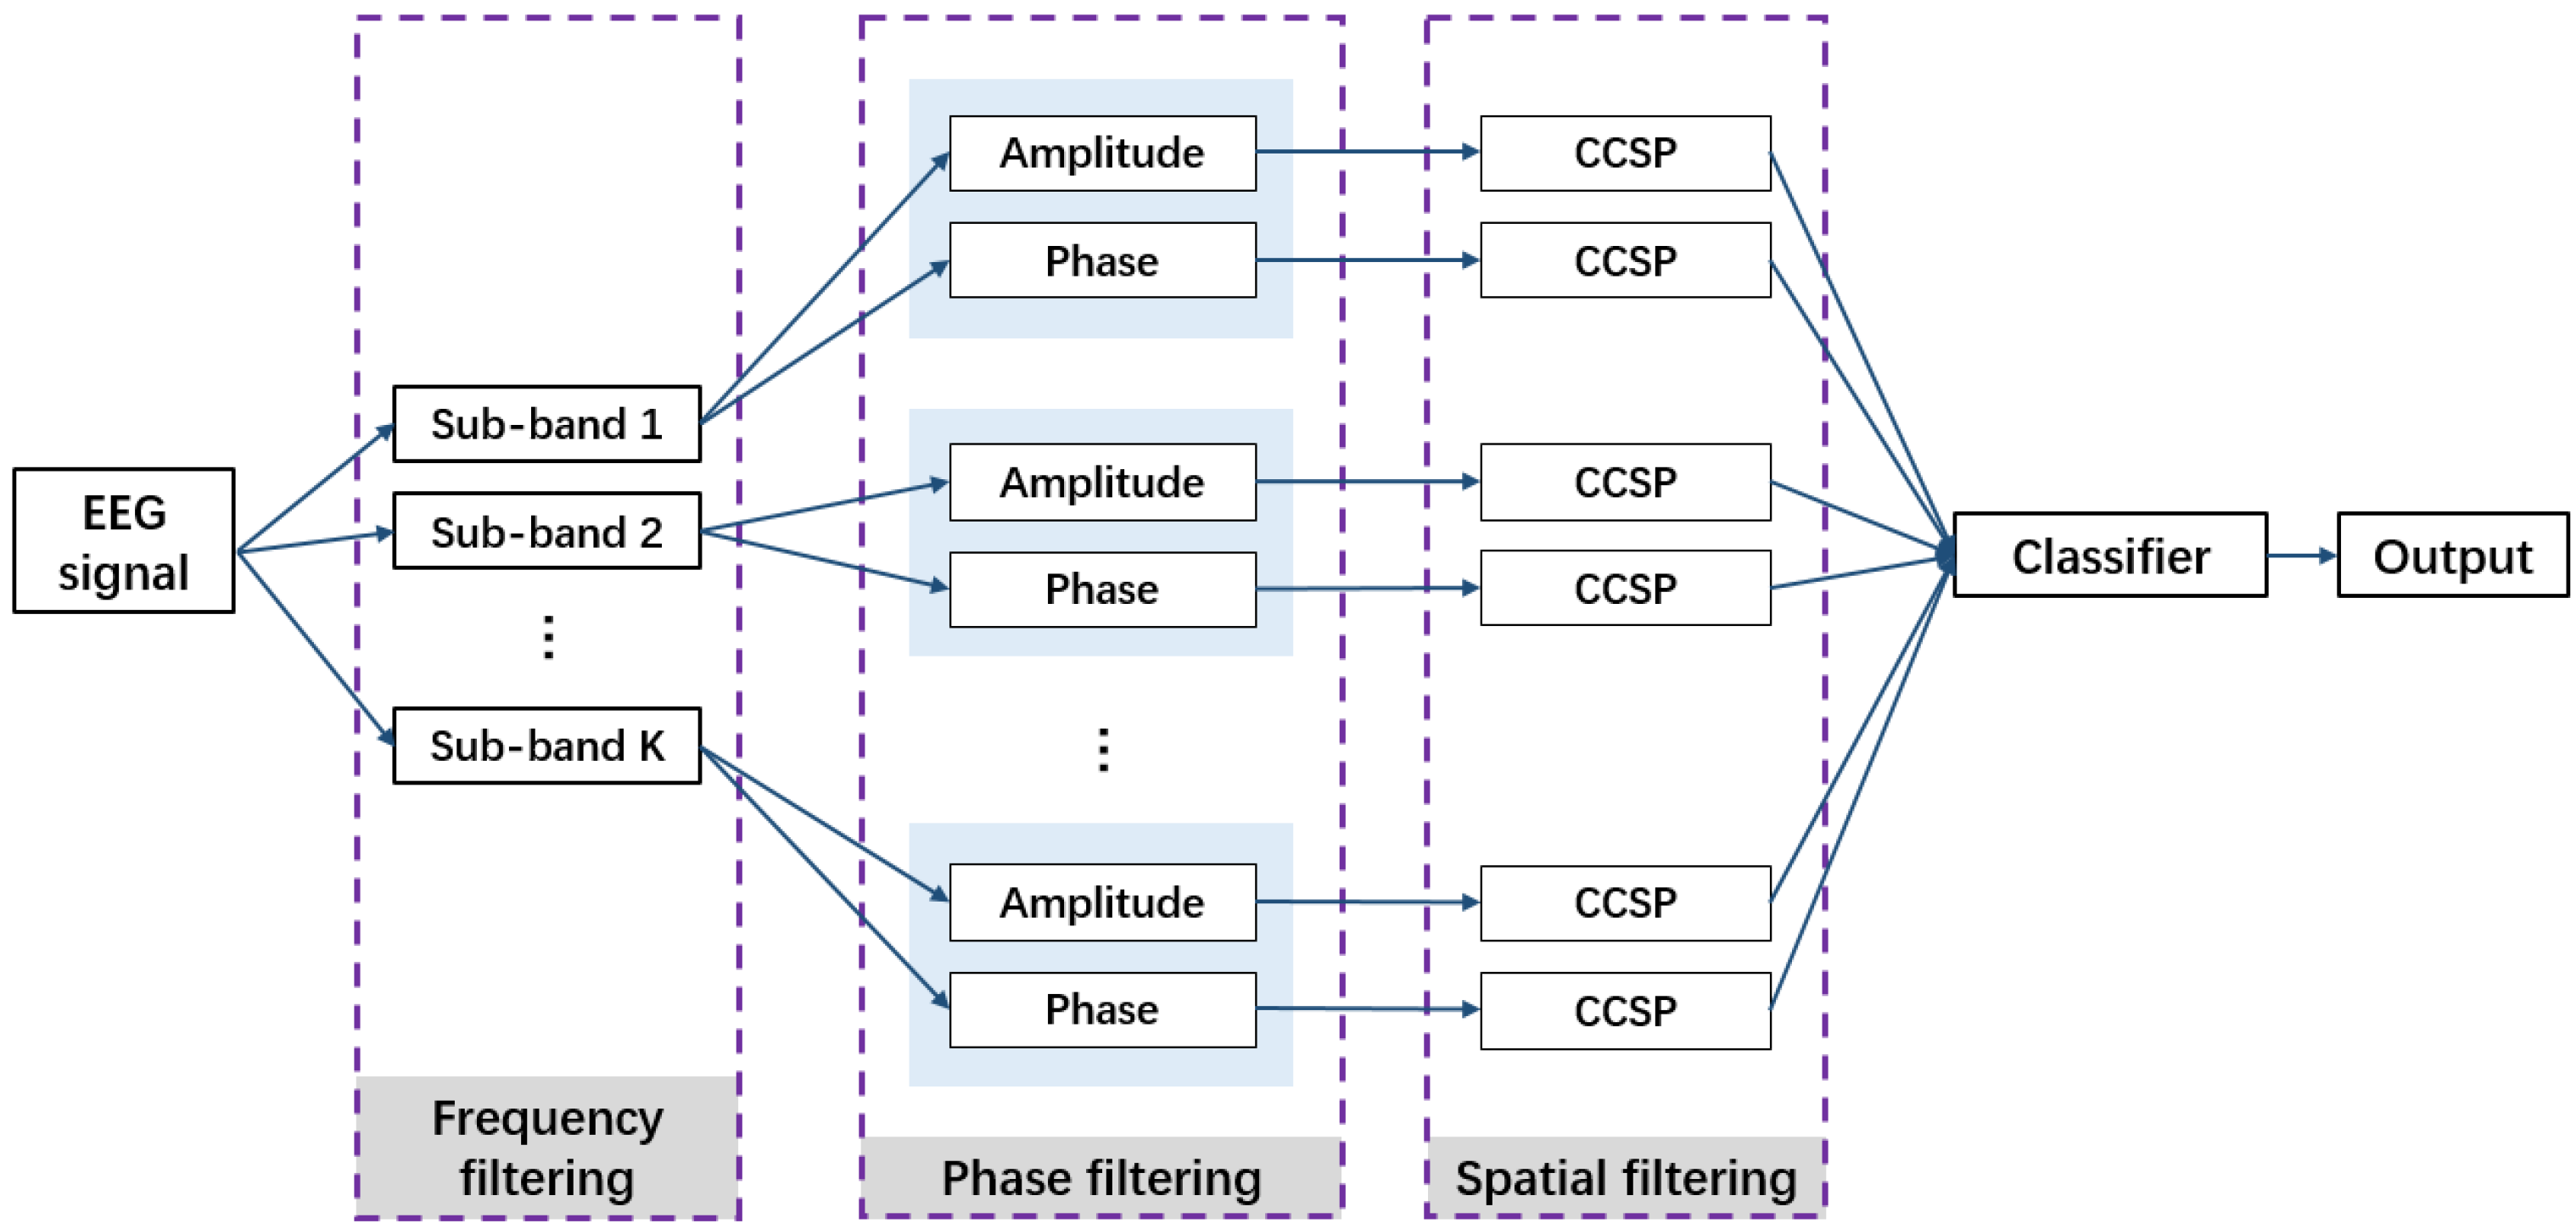
  • Secondly, this study integrates information from spatial, frequency, and phase domains to fully exploit the potential of EEG data. A filter bank is combined with the original CCSP to extract features in the frequency domain and the spatial domain. Besides, the Hilbert transform is applied to obtain the amplitude and phase angle of EEG signals. Multi-domain features are integrated and fed into an SVM to realize engagement recognition.
  • Thirdly, the proposed method is validated and compared with existing methods on an open dataset composed of 29 subjects. Experimental results show that it offers an efficient way to recognize the level of engagement, which is validated by its outperformance.
The rest of the article is arranged as follows. The proposed engagement recognition method using the multi-domain feature extraction method based on correlation-based common spatial patterns is described in detail in Section 2. In Section 3, the experimental setups are presented, and the results are analyzed. Then, a discussion is provided in Section 4. Finally, Section 5 summarizes the whole article.

2. Materials and Methods

2.1. CSP-Based Methods

2.1.1. Common Spatial Patterns

In BCI systems, especially MI-based BCI systems, the CSP is widely used to extract spatial features and achieves good performance. Considering X i R T × C is the EEG signal from class i, i = 1 , 2 , where T and C, respectively, denote the number of time samples and the number of channels, the target spatial filters in the CSP algorithm can be found by maximizing the objective function
J ( w ) = w T X 1 T X 1 w w T X 2 T X 2 w = w T V 1 w w T V 2 w ,
where V i R C × C , i = 1 , 2 represents the spatial covariance matrix of X i , and w represents the spatial filter. It should be noted that T is the transpose operation for the matrix. This constrained optimization problem can be solved by using a Lagrange multiplier method:
L ( λ , w ) = w T V 1 w λ ( w T V 2 w 1 ) ,
where λ stands for the Lagrange multiplier. The target spatial filter w maximizes L; thus the derivative of L with respect to w should be equal to zero:
L w = 2 w T V 1 2 λ w T V 2 = 0 V 1 w = λ V 2 w V 2 1 V 1 w = λ w .
Next, the spatial filter w can be figured out by solving an eigenvalue problem. It can be obtained as the largest and smallest eigenvalues of matrix M = V 2 1 V 1 .

2.1.2. Correlation-Based Common Spatial Patterns

In order to overcome the shortcomings of sensitivity to noise, instability, and overfitting of the original CSP, CCSPs are proposed in [35] to impose the temporal correlation between signals as a penalty term to obtain a regularization CSP. Therefore, the objective function becomes
J 1 ( w ) = w T V 1 w w T V 2 w + α P 1 ( w ) ,
where α stands for the regularization parameter ( α > 0), and P 1 ( w ) is the penalty term in J 1 ( w ) based on the correlation coefficient
P 1 ( w ) = w T D 1 w
where D 1 is a diagonal matrix in which the diagonal elements are correlations between the average signal X i ¯ , i = 1 , 2 in two classes
X i ¯ = l = 1 L X i l L , i = 1 , 2 ,
where L is the number of trials in each class. The correlation matrix R R C × C is then constructed as
R = r 11 r 12 r 1 C r 21 r 22 r 2 C r C 1 r C 2 r C C .
In the correlation matrix R , each element is defined as
r m , n = c o r r ( x 1 m ¯ , x 2 n ¯ ) , m , n = 1 , 2 , , C
where x 1 m ¯ and x 2 n ¯ are the m-th and the n-th columns of the matrices X 1 ¯ and X 2 ¯ . Given the correlation matrix, D 1 is formed as
D 1 = a 1 a 2 a C ,
where the diagonal element a m is calculated as
a m = n = 1 C | r m n | C , m , n = 1 , 2 , , C .
It should be noted that | | is the absolute operation. Next, D 2 is calculated as
D 2 = b 1 b 2 b C ,
where b n is obtained following
b n = m = 1 C | r m n | C , m , n = 1 , 2 , , C .
Therefore, the Lagrange multiplier method is adopted to solve Equation (4):
L 1 ( λ , w ) = w T V 1 w λ [ w T ( V 2 + α D 1 ) w 1 ] .
Similar to Equation (3), the derivative in the following equation is equal to 0:
L 1 w = 2 w T V 1 2 λ w T ( V 2 + α D 1 ) = 0 V 1 w = λ ( V 2 + α D 1 ) w ( V 2 + α D 1 ) 1 V 1 w = λ w .
The target filters are the eigenvectors corresponding to the largest eigenvalues of matrix M 1 = ( V 2 + α D 1 ) 1 V 1 . For the objective function
J 2 ( w ) = w T V 2 w w T V 1 w + α P 2 ( w ) ,
where
P 2 ( w ) = w T D 2 w ,
the spatial filters are solved following a similar process. Finally, the filters are the eigenvectors corresponding to the largest eigenvalues of matrix M 2 = ( V 1 + α D 2 ) 1 V 2 .
In this study, the original CCSP is extended into 3 versions using different correlation coefficients, including Pearson’s linear correlation coefficient (P-CC), Kendall’s correlation coefficient (K-CC), and Spearman’s correlation coefficient (S-CC). And the effectiveness of the 3 proposed CCSPs is compared.

2.2. Amplitude and Phase Feature Extraction

To fully exploit the information in EEG signals, the features in the phase domain are integrated to improve engagement recognition accuracy. To extract the phase angle of EEG signals, the Hilbert transform [38] is employed to an EEG signal X ( t ) = [ x 1 ( t ) , x 2 ( t ) , , x C ( t ) ] , in which C is the number of channels:
x ^ ( t ) = H [ x ( t ) ] = 1 π + x ( τ ) τ t d τ .
The analytic signal is then formed as
Θ ( t ) = x ( t ) + i · x ^ ( t ) = A ( t ) · e i · θ ( t ) ,
where i denotes the imaginary unit. A ( t ) and θ ( t ) stand for the amplitude and phase (AP), respectively:
A ( t ) = x 2 ( t ) + x ^ 2 ( t ) , θ ( t ) = arctan x ^ ( t ) x ( t ) .

2.3. Multi-Domain Feature Extraction Method Based on Correlation-Based Common Spatial Patterns

In this study, an engagement recognition using the multi-domain information extraction method based on correlation-based common spatial patterns (MDCCSP) is proposed. The framework of the MDCCSP is shown in Figure 1.
As shown, one trial of a multi-channel EEG signal X ( t ) = [ x 1 ( t ) , x 2 ( t ) , , x C ( t ) ] R T × C is first input into the filter bank. The filter bank filters the EEG signal into several sub-bands to process the signal in each sub-band independently in order to extract frequency domain features from frequency bands. Therefore, the signals in the sub-bands are obtained as
{ X 1 ( t ) , X 2 ( t ) , , X K ( t ) } R T × C ,
where K denotes the number of filters in the filter bank. Then, the Hilbert transform described before is conducted to the EEG signal in each frequency band to extract both pieces of AP information. Supposing X k , k = 1 , 2 , , K is the sub-band EEG signal filtered by the k-th filter, the AP information of X k is extracted as
{ X k A ( t ) , X k P ( t ) } R T × C , k = 1 , 2 , , K ,
where X k A ( t ) and X k P ( t ) represent the EEG signal containing the amplitude information and the EEG signal containing the phase information, respectively. In all, the number of signals for all sub-bands is 2 × K . For each sub-band, two CCSPs are applied to extract both AP features:
{ F e a t u r e k A , F e a t u r e k P } R N , k = 1 , 2 , , K ,
where N is the number of features produced by a CCSP. F e a t u r e k A and F e a t u r e k P stand for the features obtained from X k A ( t ) and X k P ( t ) . Furthermore, 2 × K × N features are obtained in all. Finally, all the features are fed into a classifier to realize the output of the results. In this study, the classification is binary, and the results are either low engagement or high engagement.

2.4. Support Vector Machine

Support vector machine (SVM) is widely applied as a supervised classification model in BCI systems for its effectiveness [39]. It achieves binary classification with a main strategy to find a hyperplane that can separate the negative and positive samples in the training set to the utmost extent. Specifically, the hyperplane that maximizes the distances between the hyperplane and the closest data samples in two classes is found in the training stage. In the test stage, unlabeled test data are classified into one class by the relative position to the hyperplane obtained in the training stage.
In practice, the concept of soft margin is introduced to solve the problem that there is barely linearly separable data in reality. Given a set of training data and labels T = { ( t 1 , y 1 ) , ( t 2 , y 2 ) , ⋯, ( t H , y H ) } , the process to find the hyperplane y = w · t + d can be formed as an optimization problem:
min ω , b , ξ i 1 2 ω 2 + c i = 1 H ξ i ,
s . t . y i ( ω · t i + d ) 1 ξ i , ξ i 0 ,
where ξ i = max [ 0 , 1 y i ( w · t i + d ) ] , i = 1 , 2 , , H , which is a hinge loss function, and c is the penalty parameter. In this study, a c-SVC model is utilized and a radial basis function (RBF) kernel is implemented in experiments. The penalty parameter c is set to 2.

3. Results

3.1. Dataset

In the experiments, an open dataset [40] is used to validate the effectiveness of the proposed MDCCSP method. It is a multi-modal dataset comprising NIRs and EEG data from 29 subjects, from which the EEG data are merely used in this study. Therefore, the EEG dataset is introduced in the following paragraph. The information (age and gender) of the subjects is represented in Table 1.
The EEG signals in the dataset are acquired using a BrainAmp EEG amplifier, which is produced by a German company named Brain Products GmbH. During data acquisition, the electrodes are placed according to the 10-5 international standard, and 30-channel EEG signals are recorded with a sampling rate of 1000 Hz. Subjects who participated in the experiments are ensured healthy conditions. They are instructed to complete two tasks, which are baseline tasks and mental arithmetic (MA) tasks. In the baseline tasks, subjects are supposed to be relaxed without thinking, while in the MA tasks, subjects need to carry on MA following the instructions on the screen. The EEG signals from baseline tasks and from MA tasks are labeled as low engagement data and high engagement data, respectively. The detailed process of experiments is represented in Figure 2.
In both tasks, subjects first take a 60 s pre-test rest and then receive an instruction on the screen. The instruction is either a cross or a subtraction formula such as “514 − 9”. After 2 s, the instruction disappears. A beep prompts the beginning of the task. In the baseline task, subjects only need to stare at the cross, while in the MA task, subjects need to repeatedly subtract the same value from the result of the last time in mind. For instance, “514 − 9 = 505, 505 − 9 = 496, 496 − 9 = 487, ⋯”. Each task period lasts for 10 s, and each subject takes both tasks 20 times. There is a rest with a random length from 15 s to 17 s between every two tasks. During the whole experiment, subjects are required to keep still to avoid motion artifacts to the utmost extent.

3.2. Data Pre-Processing

The original EEG data are first common average re-referenced and then band-pass filtered with a passband from 0.5 Hz to 50 Hz using a fourth-order Chebyshev II filter. The filtered data are downsampled to 200 Hz. A toolbox is used to remove the EOG artifacts automatically. The 10 s EEG data recorded during the tasks are segmented into 2 s pieces for the next steps, which is shown in Figure 2. The data from baseline tasks is labeled as low engagement, while that from MA tasks is labeled as high engagement. The whole experiment is carried out under the environment of MATLAB 2020b. Results are obtained using a 10-fold cross-validation.

3.3. Effect of Filter Banks

In this study, a filter bank is utilized to extract frequency-domain information to improve the accuracy of the proposed MDCCSP method. Here, a set of filter banks are designed with various bandwidths and various sizes of overlapping to find an optimal set of filter banks for experiments. The principle of the design of filter banks is to fully cover all the frequency range of 4–32 Hz that is considered. Therefore, the designs of filter banks are shown in Table 2.
The number of filters included in the eight sets of filter banks is between 3 and 14. The effects of the filter bank combining traditional EEG rhythms (theta, alpha, and beta bands) are also compared in the experiments. In this experiment, x ( t ) and Θ ( t ) are extracted to obtain AP information, and the S-CC is used in the proposed MDCCSP method. The regularization parameter in the MDCCSP is set to α = 0.001 . The number of features generated by each CCSP N is set as two. The engagement recognition results using different sets of filter banks in Table 2 are shown in Figure 3. And the recognition accuracies are shown in Table 3.
As shown, the second filter bank achieves the highest recognition accuracy of 87.74 ± 5.98 % at the significance level of 5 % . In the following experiments, the second filter bank with 13 filters is adopted.

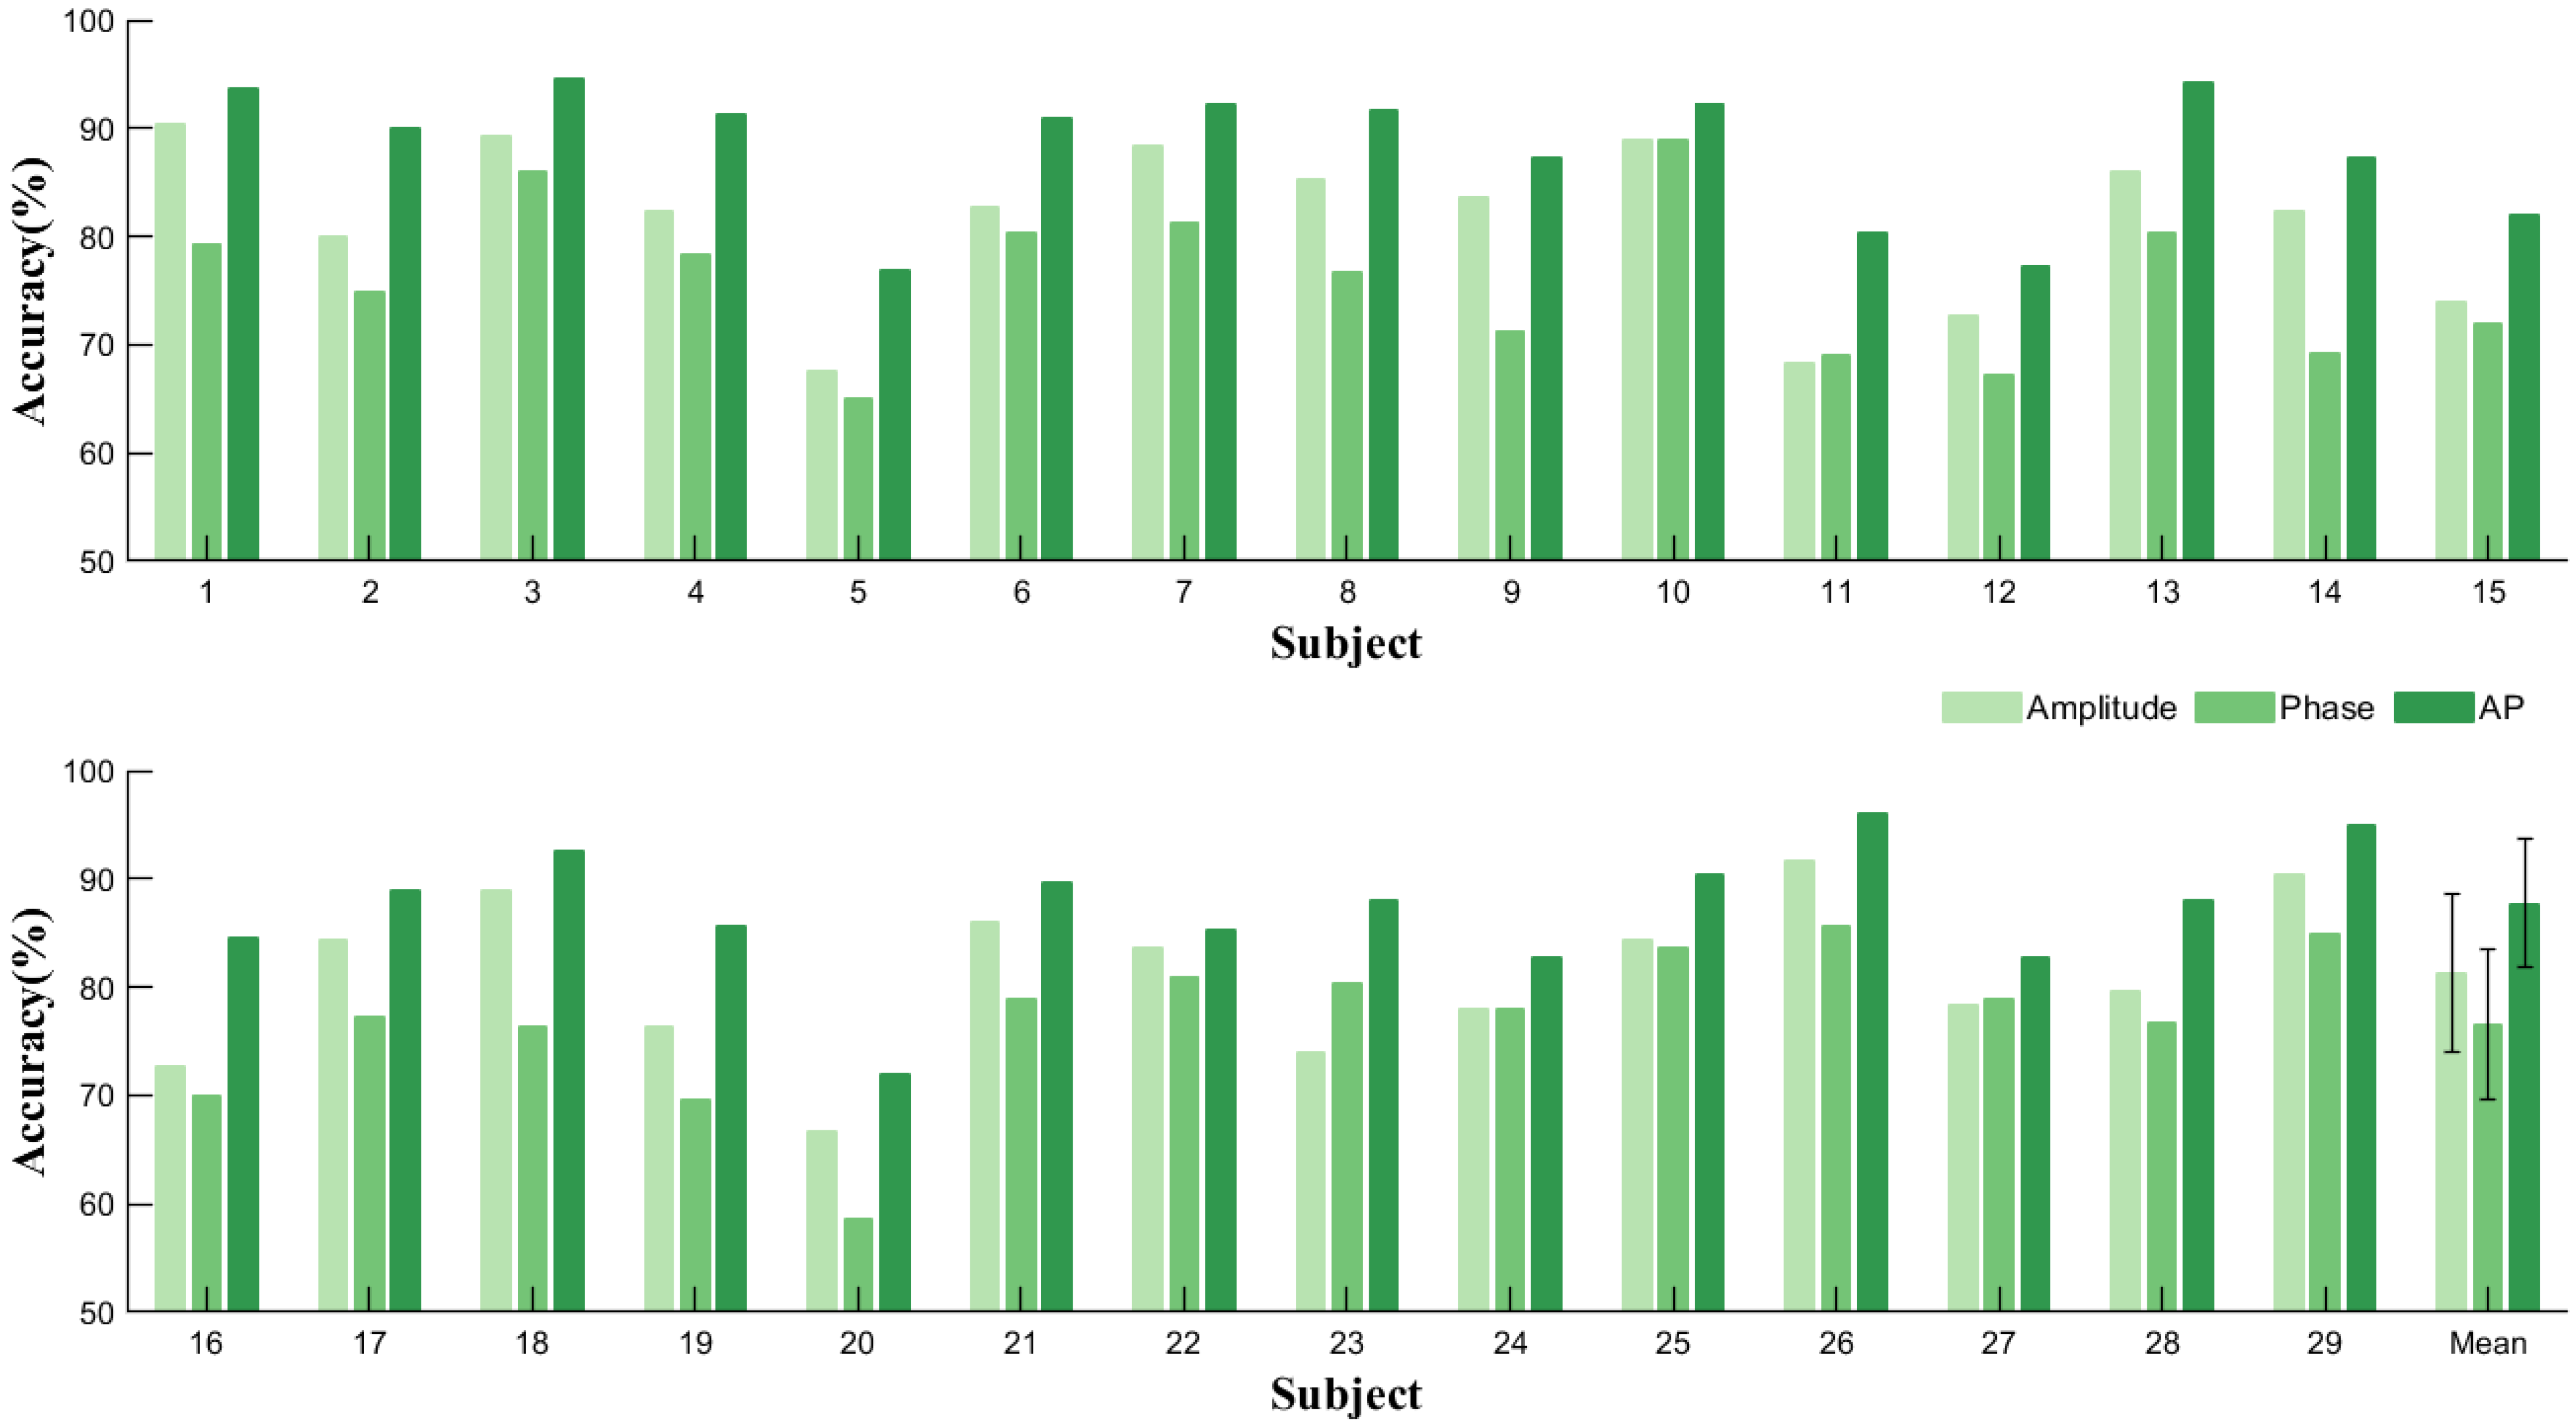
3.4. Effects of Phase Information

Phase-domain information is utilized to enhance the proposed MDCCSP method. Thus it is supposed to validate the effects of phase information in engagement recognition. To extract phase information, the Hilbert transform [38] is employed following Equation (17). And therefore, the analytic signal is obtained in Equation (18). It should be noted that AP features are extracted from x ( t ) and Θ ( t ) in the experiments. The optimal filter bank with 13 filters in Table 2 is adopted. And the S-CC is used in the proposed MDCCSP method. The regularization parameter in the MDCCSP is set to α = 0.001 . The effects of extracting only amplitude information, extracting only phase information, and extracting both amplitude and phase information are compared. The results are shown in Figure 4 and Table 4, from which it can be observed that for all the subjects, the MDCCSP extracting only phase information achieves an average accuracy of 76.57 ± 6.94 % , which is much higher than the chance level 50 % ( p < 0.001 ). These results prove that only phase information still matters in engagement recognition. Moreover, the MDCCSP extracting both pieces of AP information achieves the best performance 87.74 ± 5.98 % ( p < 0.001 ), which demonstrates that the phase information can enhance the effectiveness of the proposed engagement recognition method.

3.5. Effects of Correlation Coefficients

The correlation coefficient used in the original CCSP is P-CC. This study proposes the K-CCSP and the S-CCSP and applies them to the proposed MDCCSP recognition method. To determine the optimal CC, the recognition results of the MDCCSP utilizing the P-CC, K-CC, and S-CC are compared. It should be mentioned that the various CCs are only adopted in extracting features from x ( t ) signals because Θ ( t ) is a complex signal to which the K-CC and the S-CC are not applicable. The optimal filter bank is used, and AP features are extracted in this experiment, and the regularization parameter in the MDCCSP is set to α = 0.001 . The experimental results using the P-MDCCSP, K-MDCCSP, and S-MDCCSP are shown in Table 5.
As shown in Table 5, there are no significant differences between the accuracies of the P-MDCCSP and K-MDCCSP methods, and between the accuracies of the P-MDCCSP and S-MDCCSP methods. In the following experiments, the P-MDCCSP is utilized.

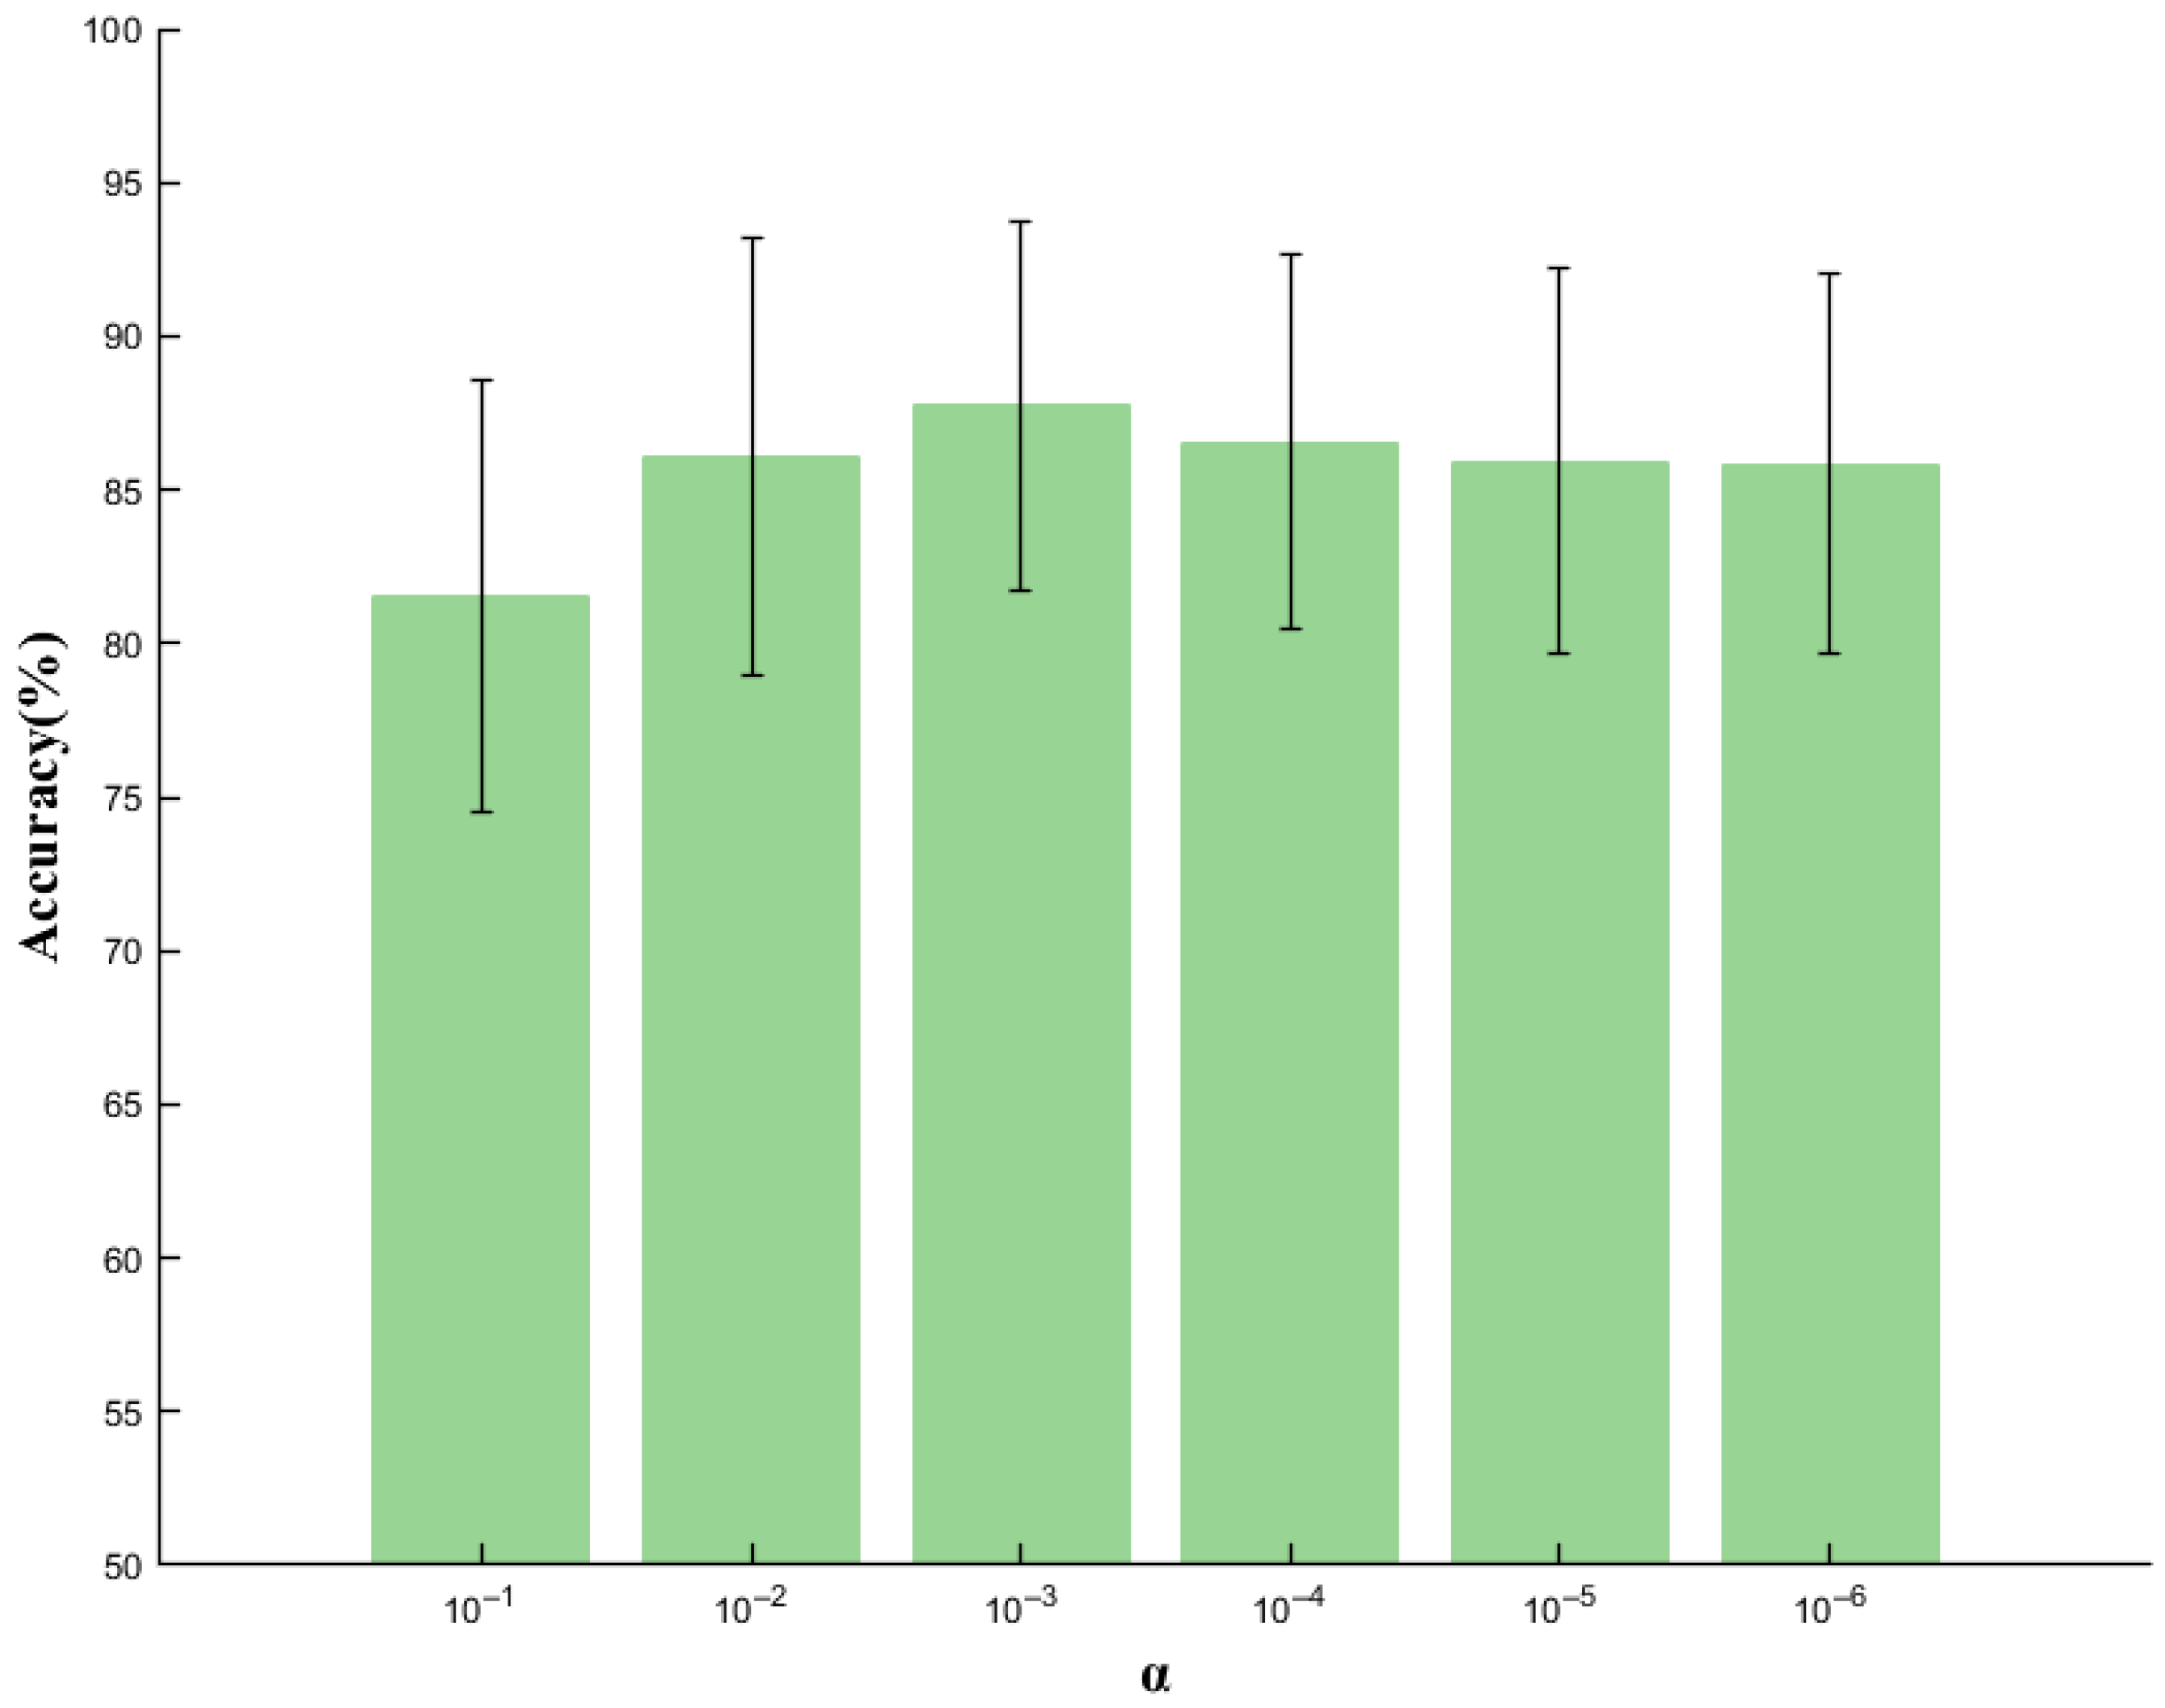
3.6. Effects of Regularization Parameter α

In order to improve the accuracy of the proposed engagement recognition method, we seek the optimal regularization parameter α used in Equations (4) and (15). The optimal filter bank is used and AP features are extracted in this experiment, and the S-CC is used in the MDCCSP. The results of the proposed MDCCSP using different regularization parameter α in { 10 1 , 10 2 , 10 3 , 10 4 , 10 5 , 10 6 } are compared, which are presented in Figure 5. As shown, it achieves the best average accuracy when α = 10 3 ; therefore, the regularization parameter α defaults to 10 3 in the following experiments to obtain the best recognition results.

3.7. Experimental Comparison

The CSP is the most popular method in BCI systems, and all CSP-based methods are on the basis of the CSP method. The proposed MDCCSP is based on the original CSP method. Therefore, it is first supposed to compare the results with CSP-based methods. The CSP [32], CCSP [35], and FBCSP [36] methods are chosen to validate the improvements of the proposed method. To compare with the CCSP and the FBCSP, the effectiveness of the main idea of the MDCCSP is validated, that is, integrating multi-domain information, including frequency information, spatial information, and phase information. The filter bank used in the FBCSP in the experiments is the second filter bank in Table 3. In addition, the proposed method is also compared with Barachant’s minimum distance to the Riemannian mean method (MDMR) [41], Shin’s method [40], and She’s method [42] to validate the effectiveness of the MDCCSP. Barachant et al. projected data onto the Riemannian space and extracted features in the space to realize classification. Shin et al. employed a shrinkage linear discriminant analysis to classify the features extracted by the CSP. An extreme learning machine was utilized to extract high-level features in She’s method. The recognition accuracies are presented in Table 6. It can be observed that the proposed MDCCSP method achieves the best performance compared with existing methods, with an average accuracy of 87.74 ± 5.98 % , which provides a 4.03 % improvement on the second-best method. In detail, for 24 out of 29 subjects, the MDCCSP achieves the best accuracy, which validates the effectiveness of the proposed method.

4. Discussion

This article attempts to improve the effectiveness of engagement recognition by integrating multi-domain information and exploiting the potentiality of original EEG signals. An engagement recognition method using AP feature extraction based on filter bank correlation-based common spatial patterns (MDCCSPs) is proposed to realize more accurate engagement recognition. By integrating frequency, spatial, and phase information, the proposed method utilizes EEG signals more sufficiently and therefore improves the recognition accuracy, which is validated in experiments compared with existing methods.
The filter bank is used to extract features in different frequency sub-bands to exploit frequency-domain information. Therefore, it is supposed to validate the effectiveness of various filter banks and find the optimal set to improve the performance of the proposed methods. A total of 7 filter banks including 3 to 14 filters are validated and compared. The results show that the second filter bank in Table 3 including 13 filters achieves the best performance. Except for frequency-domain information, phase-domain information is also adopted. To validate its effect, the recognition results of extracting only amplitude, only phase, and both AP are compared. Only phase information reaches 76.57 ± 6.94 % accuracy, which is far higher than the chance opportunity. By integrating both pieces of AP information, an accuracy improvement of 6.46 % is achieved over the accuracy of using only amplitude information. The CCSP is introduced to the engagement recognition field to extract spatial features. In addition, the optimal settings for the CCSP are decided. The CCSP method is extended into three versions by replacing various correlation coefficients, and the results of these three methods are compared. As shown in Table 5, three methods achieve similar results, and there is no significant difference among them. Another setting is the regularization parameter, different settings of α are employed to seek the optimal value. After validation, α is set to 10 3 to obtain the best accuracy.
In addition, the effectiveness of the proposed method is analyzed by comparing it with the existing methods. Six methods, including the CSP, FBCSP, CSP+shrinkage LDA, CCSP, HSS-ELM, and MDMR, are compared with the proposed MDCCSP in engagement recognition. Results show that the proposed method outperforms existing methods with an accuracy of 87.74 ± 5.98 % , which achieves an improvement of 4.03 % over the second-best method. The positive predictive value and negative predictive value are, respectively, 88.41 ± 5.90 % and 88.29 ± 5.60 % . These satisfactory experimental results prove the effectiveness of the proposed method.
However, there are still some limitations in this study. First, although the proposed method integrates multi-domain information, including frequency information, spatial information, and phase information, and achieves satisfactory improvements, temporal information is not considered. In the future, integrating temporal-domain information should be further discussed in order to enhance the efficiency of engagement recognition. Second, the proposed method can only resolve binary engagement recognition. However, the realistic situation is often more complex, and multi-class recognition is more practical. Further study should focus on extending the engagement recognition method into a multi-class recognition method.

5. Conclusions

In this study, an engagement recognition method MDCCSP is proposed. In order to overcome the inadequate utilization of EEG signals, information from multi-domains is integrated, including frequency domain, spatial domain, and phase domain. Specifically, a filter bank is used to extract information from various frequency sub-bands. Phase features are acquired through the Hilbert transform, and spatial information is extracted by a correlation-based CSP. In addition, an SVM is utilized to obtain the results of binary engagement recognition. In comparison with existing methods, the proposed MDCCSP achieves the best performance of 87.74 ± 5.98 % with an improvement of 4.03 % .

Author Contributions

Conceptualization, G.X. and H.H.; methodology, G.X. and Z.W.; software, G.X. and T.X.; validation, G.X., Z.W. and T.Z.; investigation, G.X. and H.H.; writing—original draft preparation, G.X.; writing—review and editing, Z.W. and H.H. All authors have read and agreed to the published version of the manuscript.

Funding

This research was funded by the Shanghai Pilot Program for Basic Research—Chinese Academy of Sciences, Shanghai Branch (No. JCYJ-SHFY-2022-0xx), the Science and Technology Commission Foundation of Shanghai (Nos. 21142200300 and 22xtcx00400), and the Shanghai Industrial Collaborative Innovation Project (No. XTCX-KJ-2023-05).

Institutional Review Board Statement

Not applicable.

Informed Consent Statement

Not applicable.

Data Availability Statement

Not applicable.

Conflicts of Interest

The authors declare no conflict of interest.

References

  1. Händel, M.; Bedenlier, S.; Kopp, B.; Gläser-Zikuda, M.; Kammerl, R.; Ziegler, A. The webcam and student engagement in synchronous online learning: Visually or verbally? Educ. Inf. Technol. 2022, 27, 10405–10428. [Google Scholar] [CrossRef] [PubMed]
  2. Glaman, R.; Chen, Q. Measurement invariance of a classroom engagement measure among academically at-risk students. Front. Psychol. 2018, 8, 2345. [Google Scholar] [CrossRef] [PubMed]
  3. Doo, M.Y.; Bonk, C.J. The effects of self-efficacy, self-regulation and social presence on learning engagement in a large university class using flipped Learning. J. Comput. Assist. Learn. 2020, 36, 997–1010. [Google Scholar] [CrossRef]
  4. Meng, F.; Xu, Y.; Liu, Y.; Zhang, G.; Tong, Y.; Lin, R. Linkages between transformational leadership, work meaningfulness and work engagement: A multilevel cross sectional study. Psychol. Res. Behav. Manag. 2022, 15, 367–380. [Google Scholar] [CrossRef] [PubMed]
  5. Mahalingham, T.; Howell, J.; Clarke, P.J. Attention control moderates the relationship between social media use and psychological distress. J. Affect. Disord. 2022, 297, 536–541. [Google Scholar] [CrossRef]
  6. Mahon, C.E.; Hendershot, B.D.; Gaskins, C.; Hatfield, B.D.; Shaw, E.P.; Gentili, R.J. A mental workload and biomechanical assessment during split-belt locomotor adaptation with and without optic flow. Exp. Brain Res. 2023, 241, 1945–1958. [Google Scholar] [CrossRef]
  7. Bacigalupo, F.; Luck, S.J. Alpha-band EEG suppression as a neural marker of sustained attentional engagement to conditioned threat stimuli. Soc. Cogn. Affect. Neurosci. 2022, 17, 1101–1117. [Google Scholar] [CrossRef]
  8. Toy, S.; Ozsoy, S.; Shafiei, S.; Antonenko, P.; Schwengel, D. Using electroencephalography to explore neurocognitive correlates of procedural proficiency: A pilot study to compare experts and novices during simulated endotracheal intubation. Brain Cogn. 2023, 165, 105938. [Google Scholar] [CrossRef]
  9. Cai, Y.; Li, Q.; Cao, T.; Wan, Q. Nurses’ work engagement: The influences of ambidextrous leadership, clinical nurse leadership and workload. J. Adv. Nurs. 2023, 79, 1152–1161. [Google Scholar] [CrossRef]
  10. Li, Y.; Liu, Z.; Lan, J.; Ji, M.; Li, Y.; Yang, S.; You, X. The influence of self-efficacy on human error in airline pilots: The mediating effect of work engagement and the moderating effect of flight experience. Curr. Psychol. 2021, 40, 81–92. [Google Scholar] [CrossRef]
  11. Eiris, R.; Jain, A.; Gheisari, M.; Wehle, A. Safety immersive storytelling using narrated 360-degree panoramas: A fall hazard training within the electrical trade context. Saf. Sci. 2020, 127, 104703. [Google Scholar] [CrossRef]
  12. Bernhardt, K.A.; Poltavski, D.; Petros, T.; Ferraro, F.R.; Jorgenson, T.; Carlson, C.; Drechsel, P.; Iseminger, C. The effects of dynamic workload and experience on commercially available EEG cognitive state metrics in a high-fidelity air traffic control environment. Appl. Ergon. 2019, 77, 83–91. [Google Scholar] [CrossRef] [PubMed]
  13. Bustos-López, M.; Cruz-Ramírez, N.; Guerra-Hernández, A.; Sánchez-Morales, L.N.; Cruz-Ramos, N.A.; Alor-Hernández, G. Wearables for Engagement Detection in Learning Environments: A Review. Biosensors 2022, 12, 509. [Google Scholar] [CrossRef] [PubMed]
  14. Loo, S.K.; Makeig, S. Clinical utility of EEG in attention-deficit/hyperactivity disorder: A research update. Neurotherapeutics 2012, 9, 569–587. [Google Scholar] [CrossRef] [PubMed]
  15. Brown, K.W.; Ryan, R.M. The benefits of being present: Mindfulness and its role in psychological well-being. J. Personal. Soc. Psychol. 2003, 84, 822. [Google Scholar] [CrossRef]
  16. Park, W.; Kwon, G.H.; Kim, D.H.; Kim, Y.H.; Kim, S.P.; Kim, L. Assessment of cognitive engagement in stroke patients from single-trial EEG during motor rehabilitation. IEEE Trans. Neural Syst. Rehabil. Eng. 2014, 23, 351–362. [Google Scholar] [CrossRef]
  17. Li, G.; Zhou, S.; Kong, Z.; Guo, M. Closed-loop attention restoration theory for virtual reality-based attentional engagement enhancement. Sensors 2020, 20, 2208. [Google Scholar] [CrossRef]
  18. Ni, Y.X.; Wen, Y.; Xu, Y.; He, L.; You, G.Y. The relationship between work practice environment and work engagement among nurses: The multiple mediation of basic psychological needs and organizational commitment a cross sectional survey. Front. Public Health 2023, 11, 1123580. [Google Scholar] [CrossRef]
  19. Son, S.H.C.; Baroody, A.E.; Opatz, M.O. Measuring preschool children’s engagement behaviors during classroom shared reading: Construct and concurrent validity of the shared reading engagement rating scale. Early Child. Res. Q. 2023, 64, 47–60. [Google Scholar] [CrossRef]
  20. Dowell, K.A.; Nielsen, S.J. Caregiver engagement in youth partial hospitalization treatment. Clin. Child Psychol. Psychiatry 2021, 26, 355–366. [Google Scholar] [CrossRef]
  21. Goštautaitė, B.; Bučiūnienė, I. Work engagement during life span: The role of interaction outside the organization and task significance. J. Vocat. Behav. 2015, 89, 109–119. [Google Scholar] [CrossRef]
  22. Zennifa, F.; Ageno, S.; Hatano, S.; Iramina, K. Hybrid system for engagement recognition during cognitive tasks using a CFS+ KNN algorithm. Sensors 2018, 18, 3691. [Google Scholar] [CrossRef]
  23. Li, F.; Zhang, G.; Wang, W.; Xu, R.; Schnell, T.; Wen, J.; McKenzie, F.; Li, J. Deep models for engagement assessment with scarce label information. IEEE Trans. Hum.-Mach. Syst. 2016, 47, 598–605. [Google Scholar] [CrossRef]
  24. Hussain, M.S.; Calvo, R.A.; Chen, F. Automatic cognitive load detection from face, physiology, task performance and fusion during affective interference. Interact. Comput. 2014, 26, 256–268. [Google Scholar] [CrossRef]
  25. Belle, A.; Hargraves, R.H.; Najarian, K. An automated optimal engagement and attention detection system using electrocardiogram. Comput. Math. Methods Med. 2012, 2012, 528781. [Google Scholar] [CrossRef] [PubMed]
  26. Apicella, A.; Arpaia, P.; Frosolone, M.; Improta, G.; Moccaldi, N.; Pollastro, A. EEG-based measurement system for monitoring student engagement in learning 4.0. Sci. Rep. 2022, 12, 5857. [Google Scholar] [CrossRef] [PubMed]
  27. Welke, D.; Vessel, E.A. Naturalistic viewing conditions can increase task engagement and aesthetic preference but have only minimal impact on EEG quality. NeuroImage 2022, 256, 119218. [Google Scholar] [CrossRef]
  28. Jao, P.K.; Chavarriaga, R.; Dell’Agnola, F.; Arza, A.; Atienza, D.; Millán, J.d.R. EEG correlates of difficulty levels in dynamical transitions of simulated flying and mapping tasks. IEEE Trans. Hum.-Mach. Syst. 2020, 51, 99–108. [Google Scholar] [CrossRef]
  29. Booth, B.M.; Seamans, T.J.; Narayanan, S.S. An evaluation of EEG-based metrics for engagement assessment of distance learners. In Proceedings of the 2018 40th Annual International Conference of the IEEE Engineering in Medicine and Biology Society (EMBC), Honolulu, HI, USA, 17–21 July 2018; pp. 307–310. [Google Scholar]
  30. Rabbi, A.F.; Zony, A.; de Leon, P.; Fazel-Rezai, R. Mental workload and task engagement evaluation based on changes in electroencephalogram. Biomed. Eng. Lett. 2012, 2, 139–146. [Google Scholar] [CrossRef]
  31. Ruthig, J.C.; Poltavski, D.P.; Petros, T. Examining positivity effect and working memory in young-old and very old adults using EEG-derived cognitive state metrics. Res. Aging 2019, 41, 1014–1035. [Google Scholar] [CrossRef]
  32. Blankertz, B.; Tomioka, R.; Lemm, S.; Kawanabe, M.; Muller, K.R. Optimizing spatial filters for robust EEG single-trial analysis. IEEE Signal Process. Mag. 2007, 25, 41–56. [Google Scholar] [CrossRef]
  33. Li, P.; Xu, P.; Zhang, R.; Guo, L.; Yao, D. L1 norm based common spatial patterns decomposition for scalp EEG BCI. Biomed. Eng. Online 2013, 12, 77. [Google Scholar] [CrossRef] [PubMed]
  34. Lotte, F.; Guan, C. Regularizing common spatial patterns to improve BCI designs: Unified theory and new algorithms. IEEE Trans. Biomed. Eng. 2010, 58, 355–362. [Google Scholar] [CrossRef] [PubMed]
  35. Ghanbar, K.D.; Rezaii, T.Y.; Farzamnia, A.; Saad, I. Correlation-based common spatial pattern (CCSP): A novel extension of CSP for classification of motor imagery signal. PLoS ONE 2021, 16, e0248511. [Google Scholar]
  36. Ang, K.K.; Chin, Z.Y.; Zhang, H.; Guan, C. Filter bank common spatial pattern (FBCSP) in brain-computer interface. In Proceedings of the 2008 IEEE International Joint Conference on Neural Networks (IEEE World Congress on Computational Intelligence), Hong Kong, China, 1–8 June 2008; pp. 2390–2397. [Google Scholar]
  37. Kendall, M.G. A new measure of rank correlation. Biometrika 1938, 30, 81–93. [Google Scholar] [CrossRef]
  38. Chakraborty, B.; Ghosh, L.; Konar, A. Designing phase sensitive common spatial pattern filter to improve brain-computer interfacing. IEEE Trans. Biomed. Eng. 2019, 67, 2064–2072. [Google Scholar] [CrossRef]
  39. Li, Y.; Wang, D.; Liu, F. The auto-correlation function aided sparse support matrix machine for eeg-based fatigue detection. IEEE Trans. Circuits Syst. II Express Briefs 2022, 70, 836–840. [Google Scholar] [CrossRef]
  40. Shin, J.; von Lühmann, A.; Blankertz, B.; Kim, D.W.; Jeong, J.; Hwang, H.J.; Müller, K.R. Open access dataset for EEG+ NIRS single-trial classification. IEEE Trans. Neural Syst. Rehabil. Eng. 2016, 25, 1735–1745. [Google Scholar] [CrossRef]
  41. Barachant, A.; Bonnet, S.; Congedo, M.; Jutten, C. Multiclass brain–computer interface classification by Riemannian geometry. IEEE Trans. Biomed. Eng. 2011, 59, 920–928. [Google Scholar] [CrossRef]
  42. She, Q.; Hu, B.; Luo, Z.; Nguyen, T.; Zhang, Y. A hierarchical semi supervised extreme learning machine method for EEG recognition. Med. Biol. Eng. Comput. 2019, 57, 147–157. [Google Scholar] [CrossRef]
Figure 1. Architecture of the proposed MDCCSP.
Applsci 13 11924 g001
Figure 2. EEG data acquisition process of the dataset and the segmented strategy of the original data.
Applsci 13 11924 g002
Figure 3. The engagement recognition results of the MDCCSP using different filter banks. The gray fold lines stand for the results of each subject in the dataset, while the red fold line with error bars denotes the average and the standard error accuracy of the 29 subjects.
Applsci 13 11924 g003
Figure 4. The engagement recognition results of MDCCSP extracting different AP information.
Applsci 13 11924 g004
Figure 5. The average engagement recognition results of MDCCSP using different regularization parameters α .
Applsci 13 11924 g005
Table 1. Information of subjects in the dataset where “M” and “F” stands for “male” and “female”.
Subject123456789101112131415
Age282526232734282927323129332725
GenderFFMFMMMFFMFMMFF
Subject1617181920212223242526272829
Age3239263228242327272627273626
GenderMFFFFMFMMFFMFM
Table 2. Filter banks validated in the experiments.
Filter Bank
Index12345678
Frequency
Range
(4–32 Hz)
4–64–84–84–124–164–204–244–8 (theta)
6–86–108–128–168–208–248–288–13 (alpha)
8–108–1212–1612–2012–2412–2812–3213–32 (beta)
10–1210–1416–2016–2416–2816–32
12–1412–1620–2420–2820–32
14–1614–1824–2824–32
28–32
30–3228–32
Number of filters1413765433
Table 3. Engagement recognition accuracy using MDCCSP with different filter banks where the best results are marked bold.
Filter Bank
Index12345678
Accuracy (%)90.3393.6793.3392.0092.0093.6792.0093.67
87.6790.0089.6788.0085.0083.0081.6783.33
94.0094.6795.6795.0094.3392.0091.6796.00
90.0091.3389.3391.6791.3389.3386.0091.33
75.0077.0076.6777.3375.0075.0073.6776.00
86.0091.0088.3389.0083.6782.3383.0084.33
94.0092.3393.0092.6791.6791.6792.6793.33
89.6791.6791.0090.6788.6788.0088.6788.67
86.3387.3386.3385.6785.0085.3386.0087.67
92.0092.3394.0094.3390.3390.0090.3394.67
76.6780.3379.0076.6775.3372.6774.3376.00
80.0077.3378.3379.3377.0080.0077.0075.67
93.0094.3392.6793.3392.0090.3390.6790.33
88.0087.3387.6786.0085.6786.0085.0083.00
80.6782.0082.0080.0075.6774.0070.6770.67
83.0084.6781.6784.3381.0079.3379.3380.67
87.3389.0086.6785.3384.0083.3378.0082.00
91.3392.6792.6792.0092.0089.6790.0089.00
79.6785.6786.0082.3378.6778.3379.3379.67
65.6772.0070.3369.3370.0066.6769.0066.00
87.0089.6790.3389.6789.0085.6788.6787.67
86.3385.3386.0085.3387.0084.0085.0086.67
82.0088.0087.3387.3383.3382.3382.0082.67
83.6782.6783.6780.0080.0077.6779.6782.00
89.0090.3389.3392.3394.0091.0090.3390.33
96.6796.0096.0095.3395.3395.6796.0094.67
79.3382.6782.3381.6780.6783.3377.6781.33
83.3388.0085.0086.3382.0079.0076.0080.00
93.3395.0094.6792.3393.6792.0090.6792.00
Mean ± std85.90 ± 6.7787.74 ± 5.9887.21 ± 6.1786.74 ± 6.4085.29 ± 6.8884.18 ± 7.0283.62 ± 7.2284.80 ± 7.50
p-value<0.01/<0.05<0.01<0.01<0.01<0.01<0.01
Table 4. The average engagement recognition results of MDCCSP extracting AP information, where the best result is marked in bold.
AmplitudePhaseAP
Mean ± std81.28 ± 7.25%76.57 ± 6.94%87.74 ± 5.98%
p-value<0.001<0.001/
Table 5. The average engagement recognition results of MDCCSP using different CCSPs where the best result is marked bold.
P-CCK-CCS-CC
Mean ± std87.74 ± 5.98%87.68 ± 6.40%87.61 ± 6.52%
p-value/>0.1>0.1
Table 6. Engagement recognition accuracies of several existing methods compared with the proposed method where the best results are marked bold.
Comparison Results
LiteratureBlankertz [32]Ang [36]Shin [40]Ghanbar [35]She [42]Barachant [41]Ours
MethodsCSPFBCSPCSP + ShrinkageLDACCSPHSS-ELMMDMRMDCCSP
Accuracy (%)88.3389.3384.3387.6788.6778.3393.67
70.3384.0067.3369.3380.6774.0090.00
82.3388.6782.6784.3386.6794.0094.67
82.0091.0078.3384.3382.0080.0091.33
71.6773.6767.3374.3376.0075.3377.00
77.0080.3372.0077.3384.6781.6791.00
88.6793.3386.3390.0089.0093.0092.33
81.6788.6780.6784.6778.6780.0091.67
79.3382.3376.3379.0078.0073.6787.33
87.3388.0087.0088.0085.3387.3392.33
64.6780.6768.6768.6775.0072.3380.33
75.0073.3373.3376.6779.6762.0077.33
81.0087.3374.3383.0086.6784.3394.33
80.6784.0078.6780.0077.0074.3387.33
71.6775.3368.0071.6765.0065.3382.00
74.3382.6768.0074.6775.0063.6784.67
74.0081.3360.3377.0083.6783.3389.00
85.3390.3385.6788.3390.6783.3392.67
74.6782.0071.6776.3381.6778.0085.67
66.6770.3365.0064.3372.6762.6772.00
84.6786.0076.0081.6779.6784.6789.67
79.6783.3379.0083.6784.0085.6785.33
75.6784.3374.0077.3384.6776.0088.00
79.0078.0080.6777.3385.0078.6782.67
83.0086.3385.0090.0088.3377.3390.33
94.3394.6792.0093.6792.3394.6796.00
68.6773.6771.0068.6772.0071.0082.67
68.3383.3364.3372.3376.6770.0088.00
78.0091.3371.3378.6788.3391.0095.00
Mean ± std78.21 ± 7.0783.71 ± 6.2075.49 ± 7.9379.41 ± 7.3681.64 ± 6.3878.47 ± 9.0587.74 ± 5.98
p-value<0.001<0.001<0.001<0.001<0.001<0.001/
Disclaimer/Publisher’s Note: The statements, opinions and data contained in all publications are solely those of the individual author(s) and contributor(s) and not of MDPI and/or the editor(s). MDPI and/or the editor(s) disclaim responsibility for any injury to people or property resulting from any ideas, methods, instructions or products referred to in the content.

