1. Introduction
Epilepsy, a neurological disorder impacting approximately 50 million people worldwide, witnesses the addition of 2.4 million new cases each year; in addition, two-thirds of new patients are from developing countries [
1]. As the global population ages and the prevalence of mental and neurological disorders rises, epilepsy and similar conditions are anticipated to emerge as major public health concerns. Consequently, the development of tools such as computer-assisted diagnosis systems becomes crucial in supporting neurologists and psychiatrists in accurate epilepsy diagnosis. Furthermore, epilepsy can be classified based on various factors including etiology, type of seizure, or syndrome. The World Health Organization reports that 20% of patients have primary epilepsy, while the remaining 80% experience focal epilepsy [
2]. Factors affecting seizures and epilepsy include stroke diseases related to blood vessels, as well as the use of certain drugs that affect brain function. These diseases lead to brain damage, and in most cases, they cause tension. These brain diseases, especially infection, can lead to problems in the brain, and as a result, this is one of the effective factors in epilepsy. Factors affecting seizures in epilepsy include lack of sleep, alcohol, pressure, sinus infection, and even influenza.
Epilepsy, characterized by brain seizures, can be categorized as either focal or non-focal. Focal seizures originate from abnormal brain cells, whereas non-focal seizures arise from normal brain cells. To detect epilepsy accurately, specialized signal processing techniques have been developed to differentiate between focal and non-focal seizures. Additionally, careful analysis of focal signals is crucial, particularly for patients being considered for surgery. This ensures comprehensive evaluation and informed decision-making regarding surgical intervention. The severity of epilepsy can be classified as “early” or “progressive”, with patients in the latter category requiring surgery. Decomposing the electroencephalogram (EEG) signal can help clinicians and neurophysiologists to identify focal signals by extracting characteristics from each sub-band layer [
3]. Automatic identification and detection of epilepsy or brain-related disorders is a major concern for neurologists and researchers. Neurologists and brain surgeons often rely on the interpretation of EEG signals to diagnose epilepsy. Therefore, it is essential to develop a reliable and automated technique for detecting epilepsy attacks. There are various neuroimaging techniques for measuring brain activity, such as electroencephalography (EEG), magnetoencephalography (MEG), functional magnetic resonance imaging (fMRI), and functional near-infrared spectroscopy (fNIRS). EEG and FMRI are two completely non-invasive methods and are used to investigate the function and neural mechanisms of the brain. In the diagnosis of epilepsy, EEG and FMRI techniques can be introduced as complementary to each other. EEG signal can display the function of the brain in different frequency bands, and fMRI shows the neural activity of the brain. By using these two techniques, a complete mapping of the brain can be obtained, which plays an important role in the investigation of epilepsy. One of the main abnormalities in patients with epilepsy is interictal epileptic discharges, which are easily identified using these two techniques. EEG is commonly used to capture brain activity through sensors called electrodes, as neurons communicate through electrical signals that reach the surface of the brain [
4,
5]. Researchers from various interdisciplinary fields, including engineering, neurology, microelectronics, bioengineering, and neurophysiology, are using EEG-based signal processing technology for a variety of applications, such as controlling external devices, communication, and medical diagnosis. This technology is particularly useful for diagnosing and monitoring neurological brain disorders because it allows for the non-invasive detection of electrical activity in the brain. One common application of EEG is in the diagnosis of epilepsy [
6].
Epilepsy is defined as a condition characterized by recurrent seizures that are sometimes caused by external stimuli. According to research, about 4% of people worldwide will experience epilepsy seizure at some point in their lives, with 1% developing the condition. Epilepsy is a neurological disorder characterized by abnormal brain activity in the central nervous system (CNS) that can occur in one part or throughout the entire brain [
7]. The result of this irregular activity is seizures, loss of consciousness, exaggerated emotions, and abnormal behavior. Epilepsy can affect anyone regardless of gender, age, or ethnicity. The main symptoms of epilepsy include staring, confusion, uncontrollable shaking, loss of consciousness, and psychological symptoms such as fear [
8].
Epileptic seizures are classified based on the part of the brain where abnormal brain activity begins. According to the International League Against Epilepsy (ILAE), a diagnosis of epilepsy requires at least one seizure without a known trigger, or a risk of recurrent seizures or an epilepsy syndrome. Pediatric epilepsy can be particularly complex due to the diverse expressions of syndromes that require diagnosis, evaluation, and specific treatment. Children with epilepsy may differ from adults with the condition, particularly in the expression of age-specific epileptic syndromes. This requires careful consideration of factors such as diagnosis, classification of epilepsy, evaluation to determine the pathology, and decision-making for treatment. A thorough understanding of these factors can help researchers make an accurate diagnosis of epilepsy and guide appropriate testing and treatment decisions [
9].
Epilepsy is a serious disorder characterized by recurrent seizures due to sudden dysfunction in the brain. These seizures can disrupt normal brain function and may cause other side effects such as amnesia, depression, and other mental disorders. Early identification of epilepsy is important in order to take appropriate action to prevent potential consequences and ensure the patient’s health. In recent decades, there has been active research on the automatic detection of seizures and the use of EEG signals for the detection of epilepsy [
9,
10]. As it mentioned before, EEG is a non-invasive method which is commonly used in the clinical diagnosis of epilepsy. However, it can be tedious and time-consuming for neurologists to manually identify seizures from EEG recordings. As a result, there is a need for the development of a reliable automatic epilepsy detection system that can significantly improve the quality of treatment for patients with epilepsy [
11,
12].
Epilepsy encompasses various categories determined by the nature of symptoms and the level of brain involvement, including etiology, type of seizure, and syndrome. Generalized epilepsy is characterized by epileptic waves that span the entire brain and cause widespread effects, whereas focal epilepsy is associated with epileptic waves that impact a specific region of the brain. However, it is important to note that the term “epileptic waves” is not well-defined and requires further clarification [
13]. In addition, there is a parameter called SL which is used to detect linear and non-linear dependencies between brain signals, especially in theta wave. In this study, the performance of epilepsy predictors will be evaluated in terms of metrics such as sensitivity, specificity, and accuracy using two methods: one that employs wavelet transform and one without wavelet transform. Then, a new method will be developed to detect epilepsy using EEG signals. The predictors will be evaluated separately using both methods.
Similar nearest neighbors (SNN) is one of the new clustering methods used in epilepsy diagnosis. This method can check the clusters with high accuracy; nowadays, much attention is paid to this method. Similar nearest neighbors has a high similarity to human brain function and hence can provide accurate results for epilepsy.
People with epilepsy may have general seizures which affect the entire surface of the brain and may affect all areas of the body. Generalized-onset seizures are surges of abnormal nerve discharges throughout the cortex of the brain. The most common cause of generalized seizures is an imbalance in the inhibitory circuits and excitatory circuits of electrical activity in the brain.
This study will follow these steps: first, a review of previous studies will be provided. Then, the data sets used in the study will be described. The proposed method, including preprocessing, signal processing, feature extraction, and classification, will be explained. In conclusion, a comparative analysis will be conducted to evaluate the effectiveness of the proposed method in relation to other approaches. The proposed method employed two distinct classifiers, Multilayer Perceptron (MLP) and Support Vector Machine (SVM), to accurately classify and differentiate between healthy subjects and patients. The obtained results will shed light on the performance and potential advantages of this approach compared to alternative methods. We also determined the predictor values by using the confusion matrix. Predictive values mean parameters of sensitivity, specificity, positive value, and negative value. In order to evaluate the predicted value, four sub-bands of the EEG signal and the extracted features have been used.
2. Related Studies
This article highlights several noteworthy studies in the field of epileptic seizures, focusing on their significance and relevance. Tzimourta et al. [
14] have proposed a method for automatic seizure detection in EEG recordings using the discrete wavelet transform (DWT) and support vector machines (SVM). The method consisted of four steps: segmentation, wavelet analysis, feature extraction, and classification. In the first step, the long-term EEG recording was divided into 2 s windows. Then, five-level wavelet transform was applied to each window, dividing the signal into several frequency sub-bands. In the next step, five features were extracted from each sub-band and used to train an SVM classifier. The classifier was then used to classify the sub-bands as either seizure or non-seizure activity. In the study by Jaiswal and Banka et al. [
15], two techniques using SVM were employed to classify EEG signals as convulsive or non-convulsive. The first technique, called sub-pattern-based principal component analysis (SpPCA), involved dividing the input patterns into subsets and extracting features from each subset using principal component analysis (PCA). The extracted features were then combined according to the pattern partition sequence to form the final feature vectors. The second technique involved performing PCA on the features extracted in the first step to further reduce the dimensionality and extract overall features. In the study by Shoeb et al. [
16], they used SVM to diagnose epileptic seizures using EEG data. Their approach achieved an accuracy of 96% when tested on experimental data.
Sharma et al. [
17] used a third-order cumulant function to automatically detect focal EEG signals. They extracted features from the EEG signals using locality sensitive discriminant analysis (LSDA) and then SVM to classify these features. The authors obtained a maximum classification accuracy of 99% using the Bern-Barcelona EEG data set.
Siddharth et al. [
18] proposed a method to distinguish between focal and non-focal EEG signals using sliding mode singular spectrum analysis. The authors calculated features from the reconstructed component of the EEG signal and used a radial basis function neural network to classify them. When tested on the Barcelona EEG data set, the method achieved an average accuracy of 99.11%, average sensitivity of 98.52%, and average specificity of 99.7%.
Sharma et al. [
19] proposed a method to extract 25 features of the EEG signal using the LSDA method. These features were then classified using an SVM classification approach. The authors tested the method using the cross-validation approach on the Barcelona EEG data set, achieving a classification accuracy of 96.2%.
Nigam et al. [
20] proposed an EEG-based computer diagnostic method for epilepsy using a combination of nonlinear filters and an artificial neuron network (ANN). The proposed method achieved an accuracy of 97.2%.
Kannathal et al. [
21] compared various entropy algorithms and found that entropy values could be used to distinguish between normal and epileptic EEG. They used an adaptive neuro-fuzzy inference system (ANFIS) for classification and achieved 92.2% precision.
Sadati et al. [
22] used an adaptive neural fuzzy network and the energy of discrete wavelet transform (DWT) sub-bands for epilepsy diagnosis. However, their proposed method had a low accuracy of approximately 85.9%.
Dalal et al. [
23] studied the use of the flexible analytic wavelet transform (FAWT) to decompose EEG signals. This non-stationary transform generated fractal dimension features at each scale level. The proposed method was tested using the Kruskal–Wallis statistical test, and the classification accuracy was 89.1% on the Barcelona EEG data set.
Deivasigamani et al. [
24] analyzed a soft computing-based adaptive neuro-fuzzy inference system (ANFIS) classification method and used the feature values to distinguish between focal and non-focal signals. Out of 700 EEG signals, their method correctly classified 694 signals, resulting in a detection rate of 99.1%.
Abhinaya et al. [
25] developed a method to extract features based on the entropy of the EEG signal and optimized them using a selection method. They applied a linear regression model with an SVM classifier to the optimized features to distinguish between focal and non-focal signals and achieved a classification rate of 92.8% using an open-access EEG data set.
Ibrahim et al. [
26] used a wavelet and Shannon-entropy-based method to recognize epilepsy seizures and applied SVM, LDA, artificial neural networks, and k-nearest neighbor as classifiers for their proposed system.
Gruszczyńska et al. [
27] proposed a recurrence quantification analysis approach to classify EEG signals. The results of the study were visualized using principal component analysis and classified using an SVM classifier.
Anuragi et al. developed a machine-learning-based approach using wavelet transform to classify individuals with alcohol use disorder. The study used SVM and Naïve Bayes methods [
28].
Mutlu et al. [
29] proposed a method using decomposition of Hilbert–Huang epileptic vibration and used the minimum SVM classifier to distinguish between normal and epileptic EEG signals.
Al-Salman et al. [
30] used a wavelet Fourier analysis to detect sleep signals in EEG and applied a least-square SVM classifier.
Zarei et al. [
31] used discrete wavelet transform (DWT) and orthogonal matching pursuit (OMP) techniques to extract coefficients from EEG signals, then calculated nonlinear features and statistical features using these coefficients. They evaluated the performance of the proposed techniques using three commonly used EEG data sets.
Yavuz et al. [
32] proposed the use of Mel frequency cepstral coefficients (MFCCs) and generalized regression neural networks to distinguish normal and seizure EEG recordings.
Zahedi et al. [
33] used discrete wavelet transform (DWT) to divide EEG signals into sub-bands and extract features. They also used genetic algorithms to select effective features and applied artificial neural network (ANN) and vector support machine (SVM) classifiers to the data. The simulation results showed that the proposed method had higher accuracy in detecting epilepsy attacks compared to other similar approaches.
3. Methods and Materials
3.1. Data and Materials
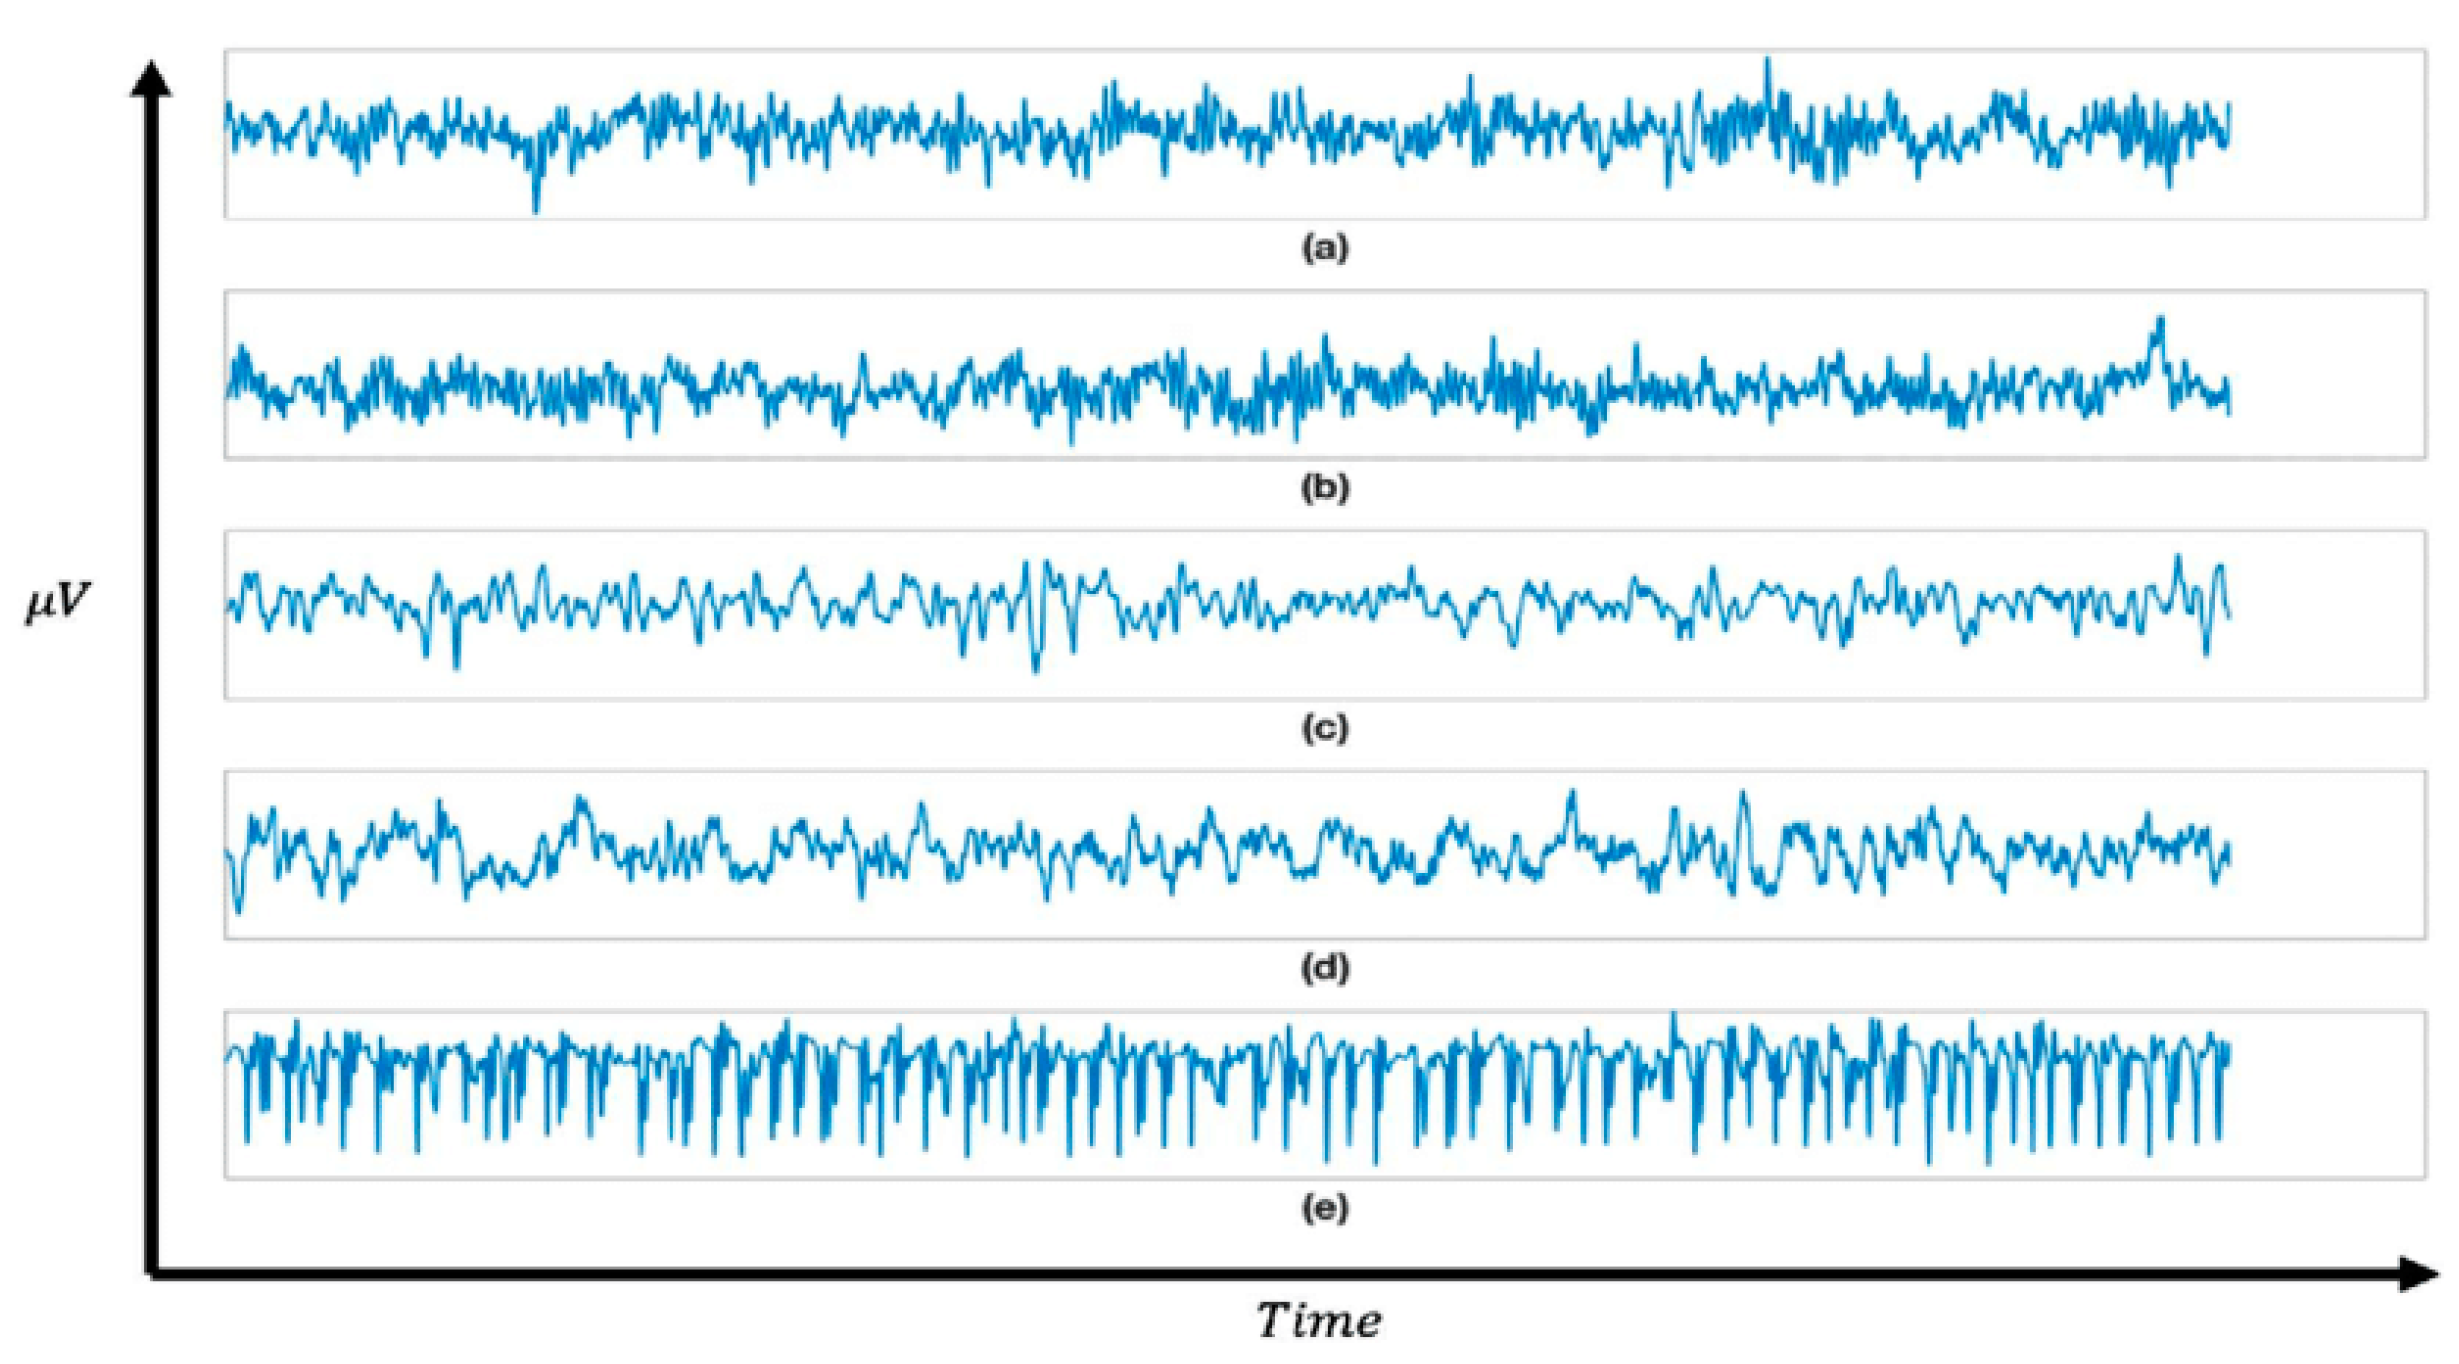
To test the proposed method in this study, epilepsy data from the Bonn University database was used. This database includes 5 different recording models, each one with 500 pieces of 100 points as shown in
Figure 1 (a) non-epileptic recording with open eyes, (b) non-epileptic recording with closed eyes, (c) recordings of EEG from the hippocampal formation in the hemisphere opposite the epileptogenic zone, (d) EEG recordings of the epileptogenic zone, and finally (e) a collection of epileptic seizure activity recorded from the hippocampal focus [
34].
The length of each recording is 23.6 s and the sampling frequency is 173.6 Hz. In this study, models B and D were used both with and without wavelet transform decomposition at a level of 8. The details of the database are summarized in
Table 1. The database is open-access and available on the website of Bonn University.
3.2. Proposed Method
Interictal spikes are brief, morphologically defined events observed in the EEGs of patients predisposed to spontaneous seizures of focal onset and this is the beginning of the attack in people. The spikes are generated by the synchronous discharges of a group of neurons in a region referred to as the epileptic focus. In this study, we have used the graphical, an element of epileptiform Spike.
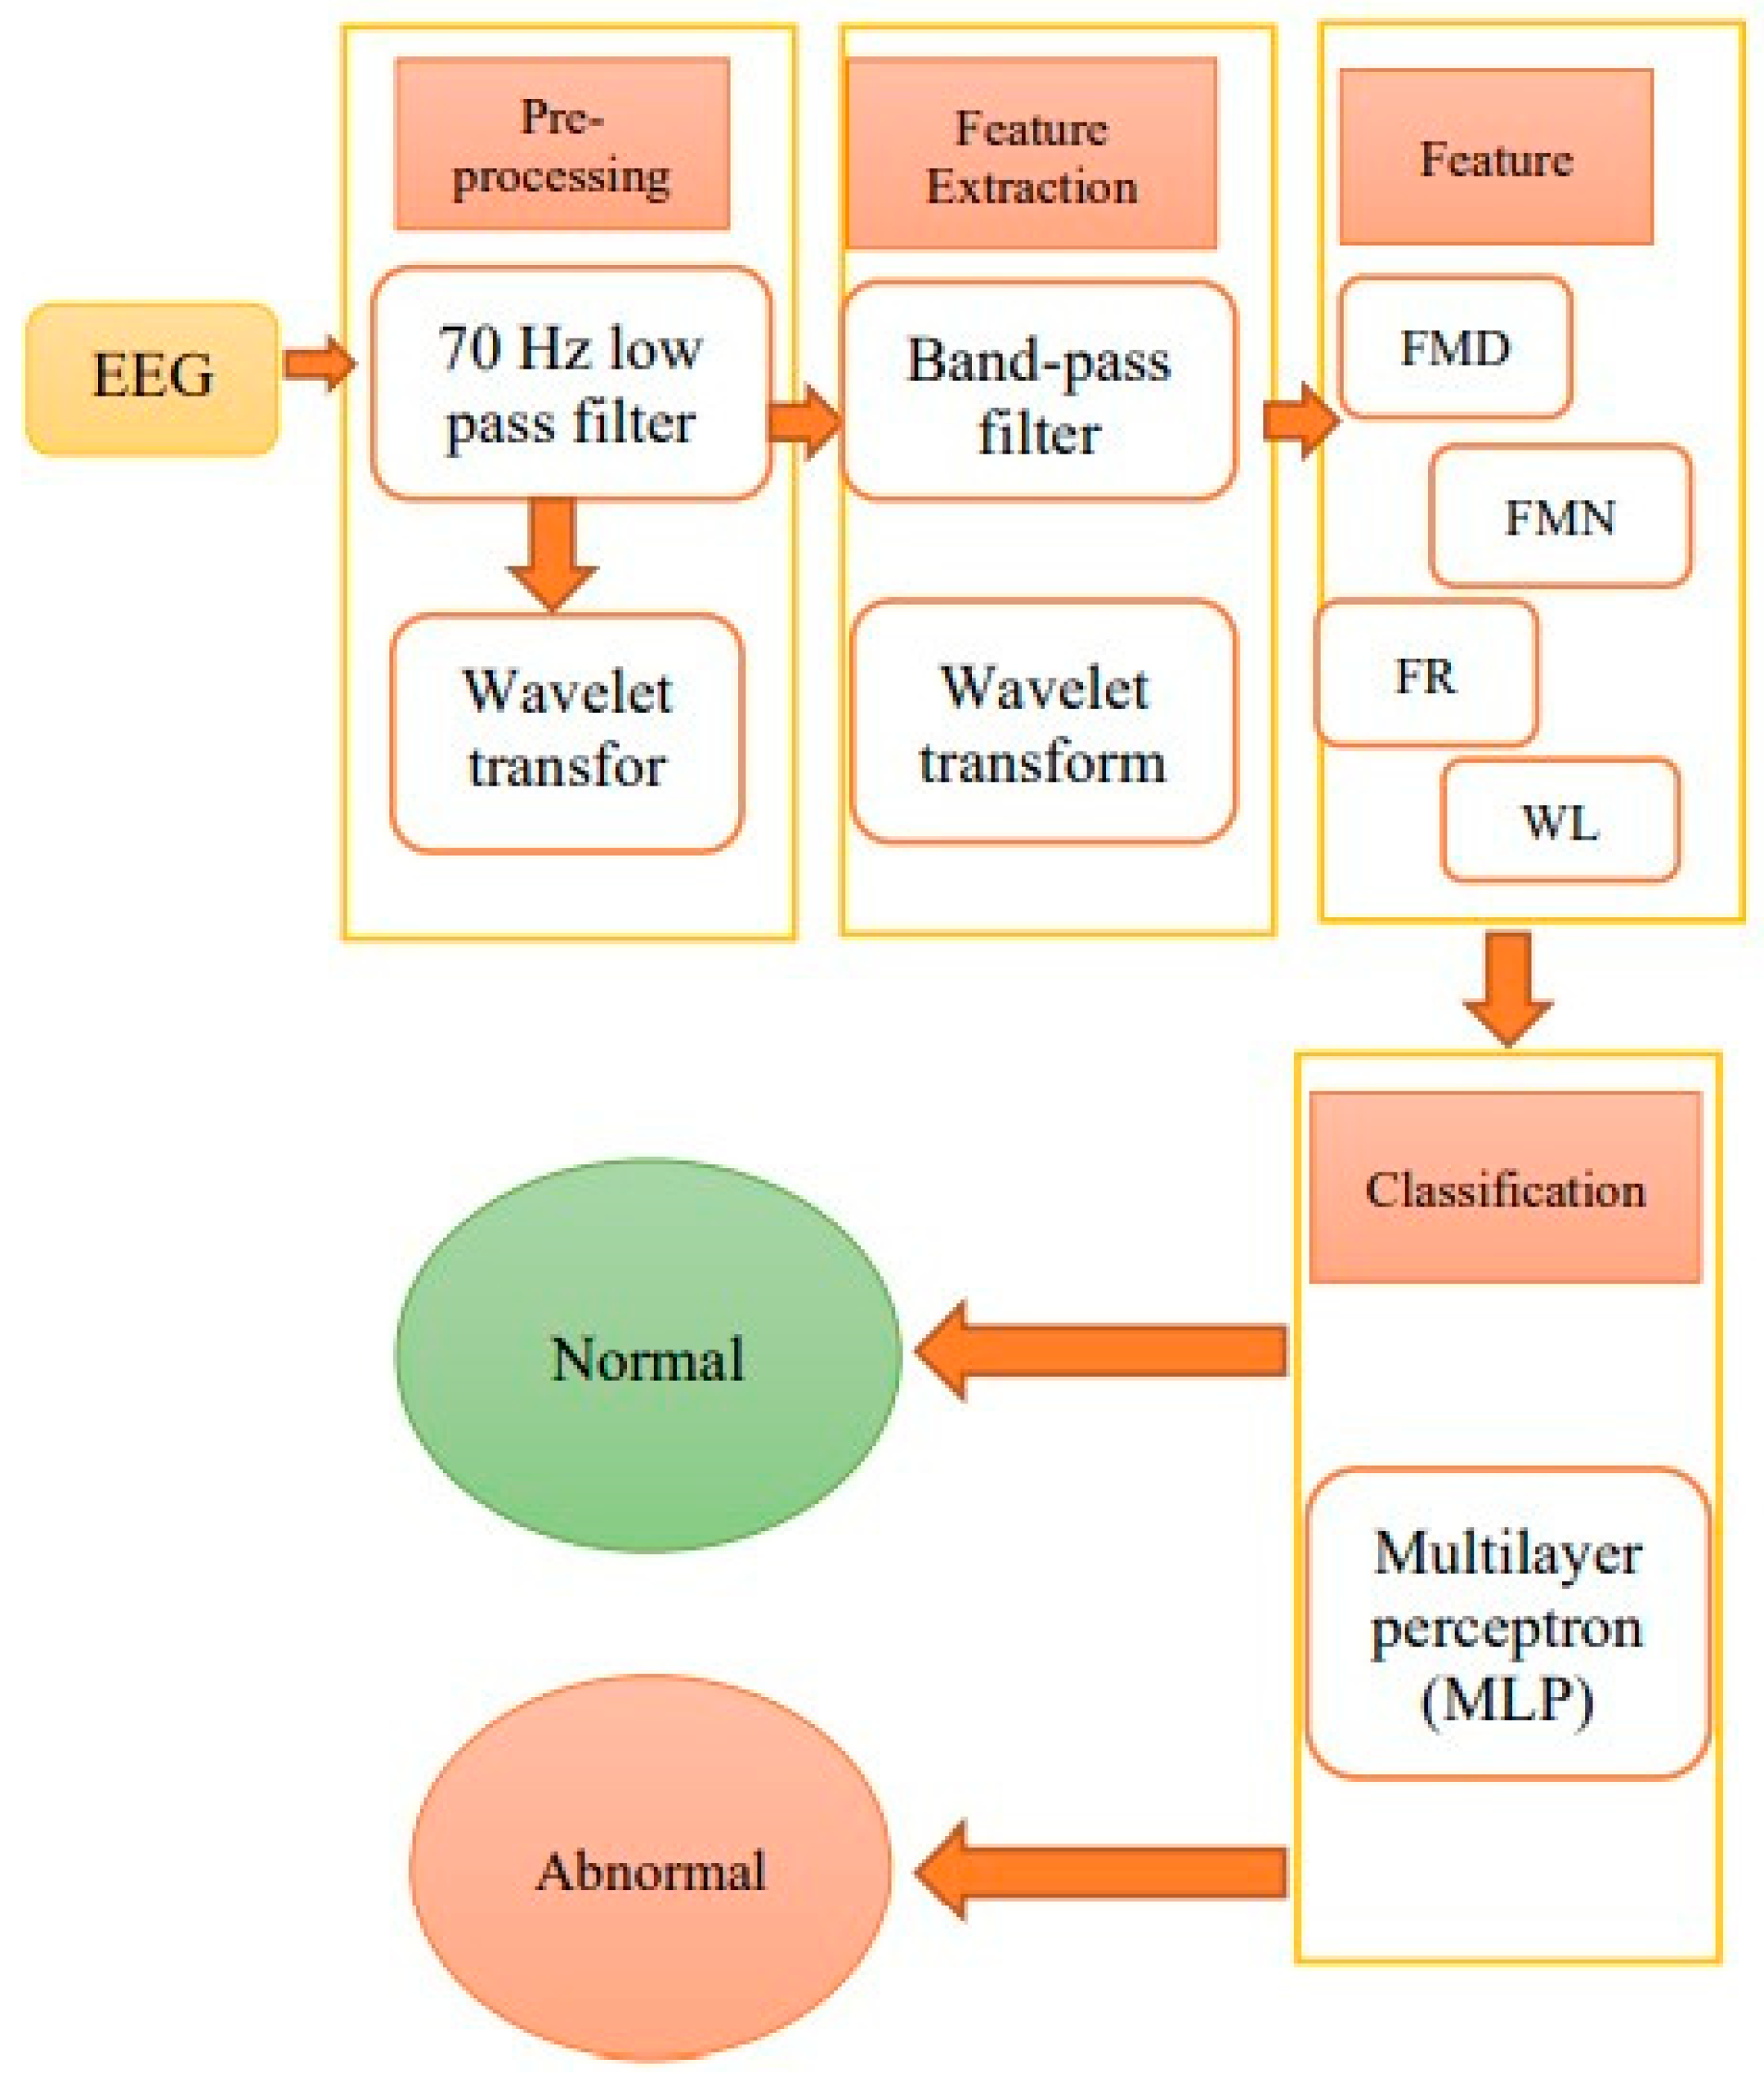
After obtaining the data from the mentioned database, data preprocessing was started. A 70 Hz low-pass filter was applied to both methods. Then, the alpha, beta, and gamma frequency bands were extracted using separate mid-pass filters. In the feature extraction step, the frequency median (FMD), frequency mean (FMN), frequency ratio (FR), and waveform length (WL) features were extracted [
35,
36,
37]. Finally, a multilayer perceptron neural network (MLP) classifier was designed and applied to the data. After obtaining satisfactory results with this classifier, the wavelet transform method was applied separately. The diagram of the proposed method is shown in
Figure 2.
3.3. Wavelet Transform
The wavelet transform is a mathematical transformation widely used in various scientific fields, and can be represented by the following general equation:
The properties of a wavelet function (Ψx) include the following:
(A) being appropriately limited in time
(B) having a mean of zero:
(C) has a non-zero state:
3.4. Signal Preprocessing
In the preprocessing step, a 70 Hz low-pass filter was applied to the raw EEG signal collected in both stages, with and without the use of wavelet transform. The FDATOOL toolbox was used to design the filter, and the wave menu tool in the MATLAB 2020 software was used for wavelet transform. To remove noise using wavelet transform, the de-noise section of the wavelet transform toolbox was used. This section allows the wavelet to independently identify noise by comparing the daughter signal (EEG signal) to the mother signal (wavelet signal). If they do not match, the details from the lower levels are removed while preserving the generalities.
3.5. Signal Processing
In this step, a band-pass filter with Fpass1 = 25 Hz, Fstop2 = 71 Hz, Fstop1 = 24 Hz was applied to the alpha, gamma, and beta bands, and a separate band-pass filter with minimum order values of Fpass2 = 70 Hz and Fstop = 71 Hz was applied to the gamma band. The passband and stopband ripple were set to 0.1 and 0.01, respectively. To process the signal using wavelet transform, the filter coefficients, including approximation and detail, were obtained and the detail and general coefficients at different levels were calculated separately for the alpha-beta and gamma bands. The output signal for these coefficients was calculated using the ‘wrcoef’ command in the time domain in MATLAB 2020a.
3.6. Feature Extraction
Feature extraction is an essential step for detecting epilepsy attacks. It is used to establish epilepsy data using standard and collected epilepsy data. The wavelet transform is often used to decompose a signal into scaled and translated versions of a mother wavelet and a scaling function. The discrete wavelet transform (DWT) has been frequently used in epileptic seizure detection with promising results. Enhancing the precision of epilepsy detection heavily relies on improving the accuracy of feature extraction. The power spectrum, which represents the relative magnitude of frequency components comprising a signal, plays a vital role in this process. It is essential that the data utilized to determine the power spectrum adequately capture the signal’s excitation levels to ensure reliable results. In this study, four important frequency and time features were extracted separately for epileptic and non-epileptic data in the alpha, gamma, and beta frequency bands: FMD, FMN, FR, and WL. These features were extracted from EEG recordings of stimulation with open and closed eyes. The extracted features are listed in
Table 2.
In individuals with epilepsy, the median and mean frequency increase due to higher brain frequency and the frequency ratio decreases. The waveform length feature measures changes and calculates the absolute value of the next sample minus the previous sample. If the signal is smooth with little change, this property becomes zero. Therefore, in epilepsy, where the disorder entropy is low and brain oscillations are consistent, the waveform length decreases. Shannon entropy is used to calculate the entropy of wavelet transform which can measure the entropy of changes. Shannon’s entropy can be defined as the average rate of information generation by a random source. The higher the Shannon entropy value, the greater and more information is given by a new value in the process. Shannon entropy is also used to estimate information. This criterion can be introduced as an important parameter for the distribution of the signal power spectrum which is used in epilepsy diagnosis.
3.7. Classification
Two different classifiers were used in this study: the Multilayer Perceptron (MLP) and Support Vector Machine (SVM), to classify and differentiate between healthy subjects and patients. A ten-fold cross-validation method was used to evaluate the performance of the classifiers. The EEG signals were classified into ten parts with equal numbers of signals, except for two groups. One part was used for testing and the other nine parts were used for training the classifier. This process was repeated ten times for each different test part, and the average performance for accuracy, sensitivity, and specificity was calculated and reported. Each of the ten processes was repeated fifteen times to improve the accuracy.
3.7.1. Multilayer Perceptron (MLP)
The Multilayer Perceptron neural network was trained using the backpropagation algorithm and a variable learning rate to diagnose the disease. The input layer had the same number of nodes as the length of the input vector for each time interval, and the output layer had one node, which represented the possibility of only two classes being classified. The number of neurons in the hidden layer was selected to achieve an optimal architecture. It is important to note that the training process was only performed on the training data to ensure that the network did not use the testing data when selecting the optimal structure, which allowed for effective generalization of the network. The network was tested using the testing data once the training error reached a minimum. A linear transfer and a sigmoid function were used as the output node and the hidden layer, respectively. The network training continued until the mean value was much less than 0.01 or the range of training iterations reached 1000.
3.7.2. Support Vector Machine
Support vector machine (SVM) is a popular supervised learning method that maps data from an N-dimensional input space to an M-dimensional feature space (M > N) in order to linearly separate classes. Based on statistical learning theory, SVM is considered an extension of the generalized portrait algorithm, which analyzes data for classification and regression. In this article, the SVM classifier was employed due to its widespread usage in data classification, pattern recognition, and regression analysis. SVM is a supervised classifier known for its effectiveness in these domains. The purpose of regression is to determine the best version out of a set of models, known as estimating functions, to accurately approximate target values. The standard support vector regression estimating function is as follows:
where w ⊂ R
n, b ⊂ R and Φ are a nonlinear function that maps
x into a higher dimensional space. W and b are the weight vector and bias, respectively. The weight vector (w) can be expressed as follows:
By substituting Equation (2) into Equation (3), the generic equation can be rewritten as follows:
In Equation (5), the function k (
xi.
x) = (Φ(
xi). Φ(
x)) is replaced with the dot product and is referred to as the kernel function and ∝ = (∝
1, ∝
2, …, ∝
l) consists of nonnegative Lagrange multipliers. The selection of kernel functions and kernel parameters depends largely on the specific application. Some commonly used kernel functions include radial basis functions (RBFs) and polynomial kernel functions. The formulas for these kernel functions are shown below, respectively:
where, “σ” represents the kernel width and “d” represents the order, which were experimentally determined to produce the best classification results. In this work, RBFs and polynomial kernel functions were used with various values of sigma (σ = 0.8, 1, 1.2) and orders (d = 1, 2, 3), respectively.
3.8. Evaluation
To assess the effectiveness of the proposed method for diagnosing epilepsy, we use common performance measures such as accuracy (AC), sensitivity (SN), specificity (SP), and precision (P). In Equations (8)–(11) below, TP refers to true positives (correctly diagnosed epilepsy), TN refers to true negatives (correctly diagnosed non-epilepsy), FN refers to false negatives (incorrectly diagnosed as non-epilepsy), and FP refers to false positives (incorrectly diagnosed as epilepsy).
4. Results
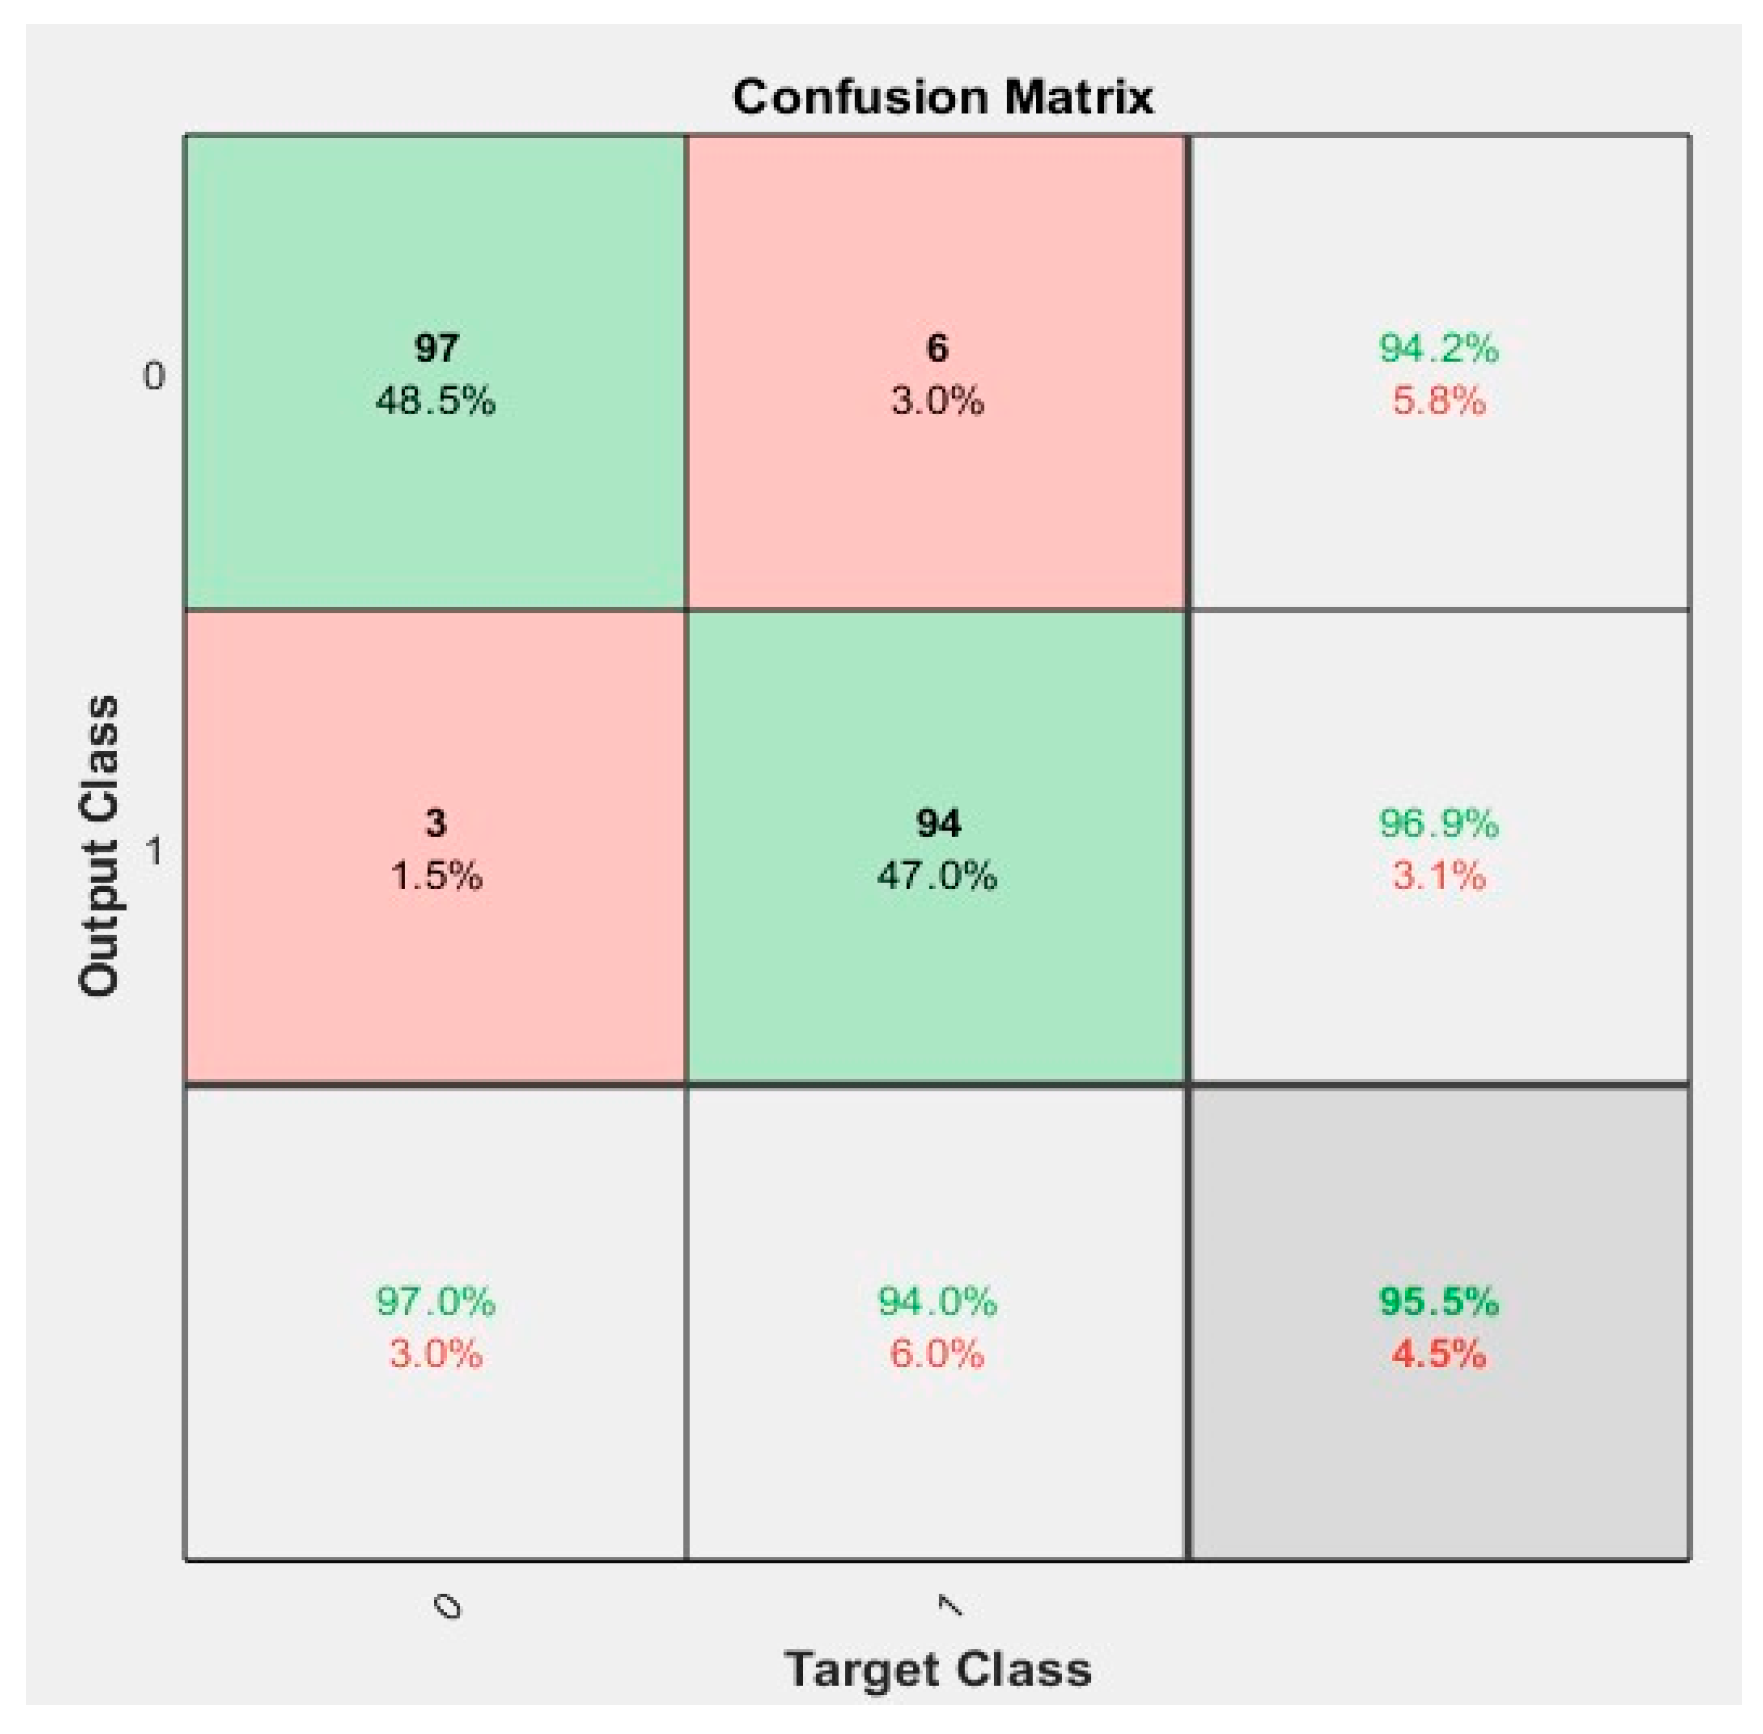
As you can see in
Figure 3, the clutter matrix summarizes the obtained results. This matrix is used to explain the accuracy of the classification and each house expresses a specific value of perceptron multilayer neural network. In order from the right, each house represents sensitivity, specificity, and accuracy. The results of the validation of the 10-layer neural network used to classify the signal with 95.5% accuracy are shown in
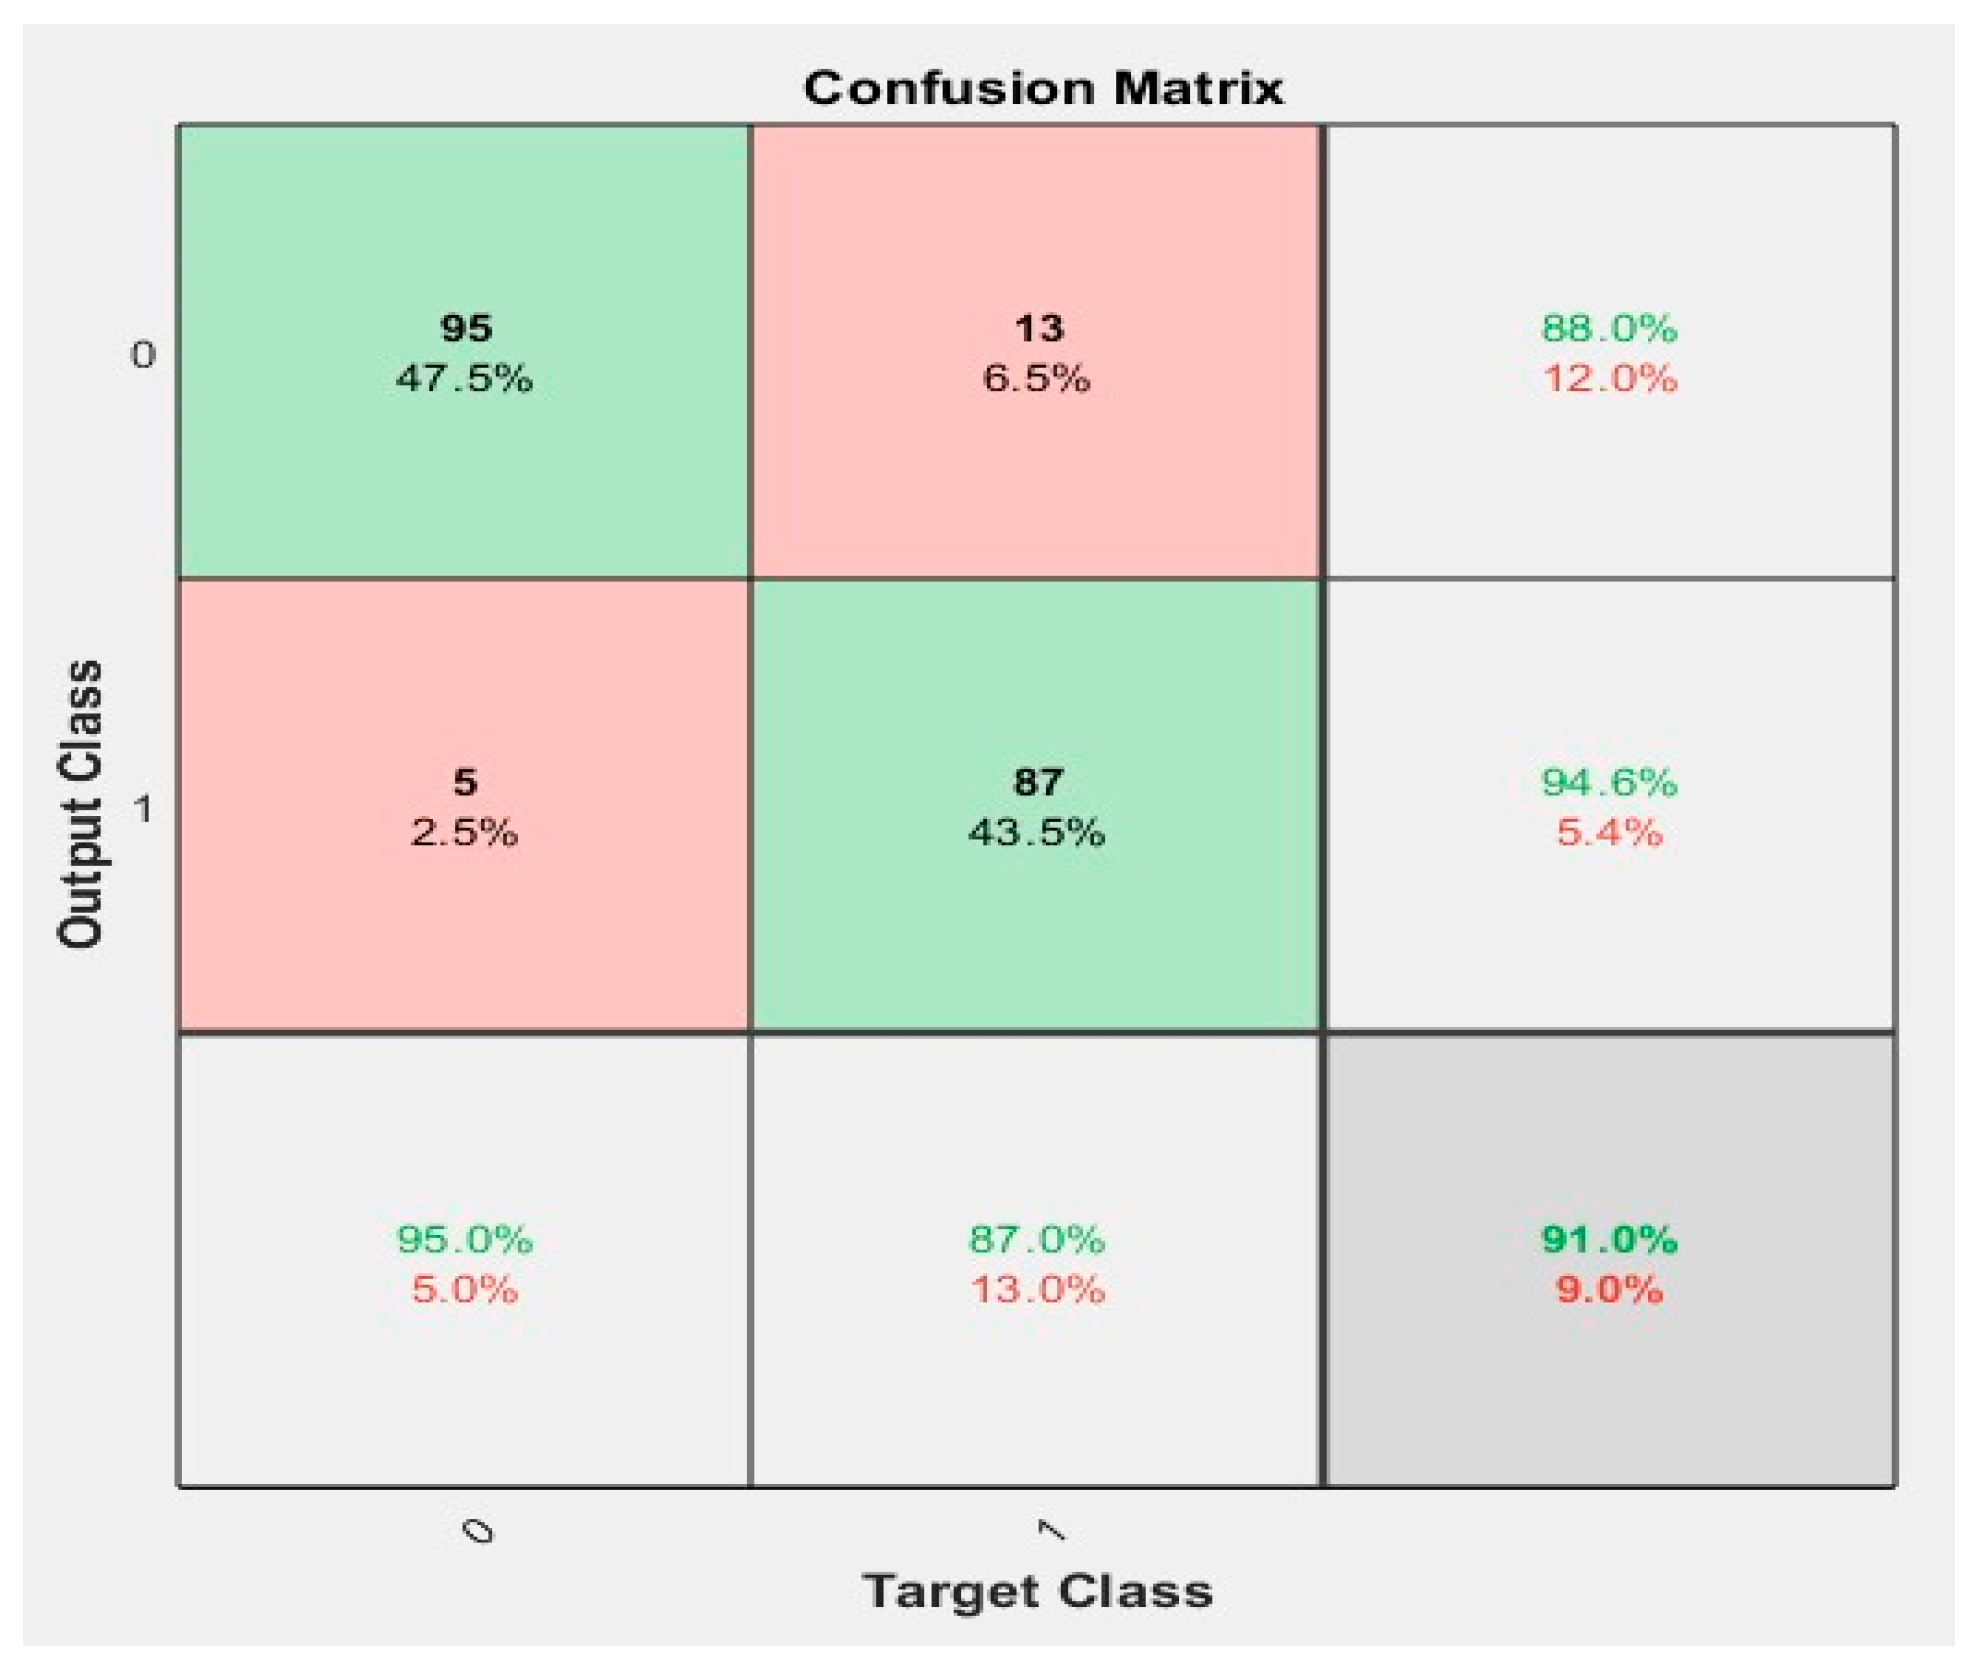
Figure 3. Next, wavelet transform with level 8 and decomposition level 4, along with Shannon entropy, were used to diagnose epilepsy with 91% accuracy. Decomposition level 4 in wavelet transform represents dividing the EEG signal frequency by two four times and then calculated Shannon entropy on the decomposed signal. In addition, the validation value and accuracy after wavelet transform conversion are shown in
Figure 4. This paper applied the proposed method to differentiate patients from normal subjects by building two individual classifiers using features extracted from the EEG signals. The first classifier is a Support Vector Machine (SVM) implemented with a linear kernel. The results obtained using SVM led to 95.5% accuracy, 98.78% specificity, and 82.60% sensitivity. The second classifier is a Multilayer Perceptron (MLP) classifier, trained on 90% of the EEG data and tested on the remaining 10%. As you can see in
Figure 4, the accuracy, sensitivity, and specificity parameters for MLP classification are equal to 91%, 95%, and 87%. The statistical measures for validation by the SVM and MLP classifiers are shown in
Table 2, and the results for each classifier are summarized in
Table 3. In addition,
Table 3 summarizes the results obtained in the two confusion matrices of the SVM and MLP classification. These results demonstrate the effectiveness of the proposed method in classifying the two classes using the mentioned classifiers. While more research is required to identify the advantages of these fuses method over the SNN, this applied method shows accurate results with less complexity, which could be a suitable method to use. As the SNN classifier acts like a brain for robots which prepares robotic perception and action to mimic the behaviors captured in nature, this method is a kind of fused method that combines two prevalent classifiers with satisfied and accurate results. In
Table 4, a comparison has been made between the results obtained using the wavelet transform method, SVM classifier, and neural network classifier, and it confirms the results of
Table 3.
Table 5 presents a comprehensive comparison of various studies to validate and reinforce the proposed method. It serves to support the stability and reliability of the proposed approach by highlighting its performance in relation to other relevant studies.
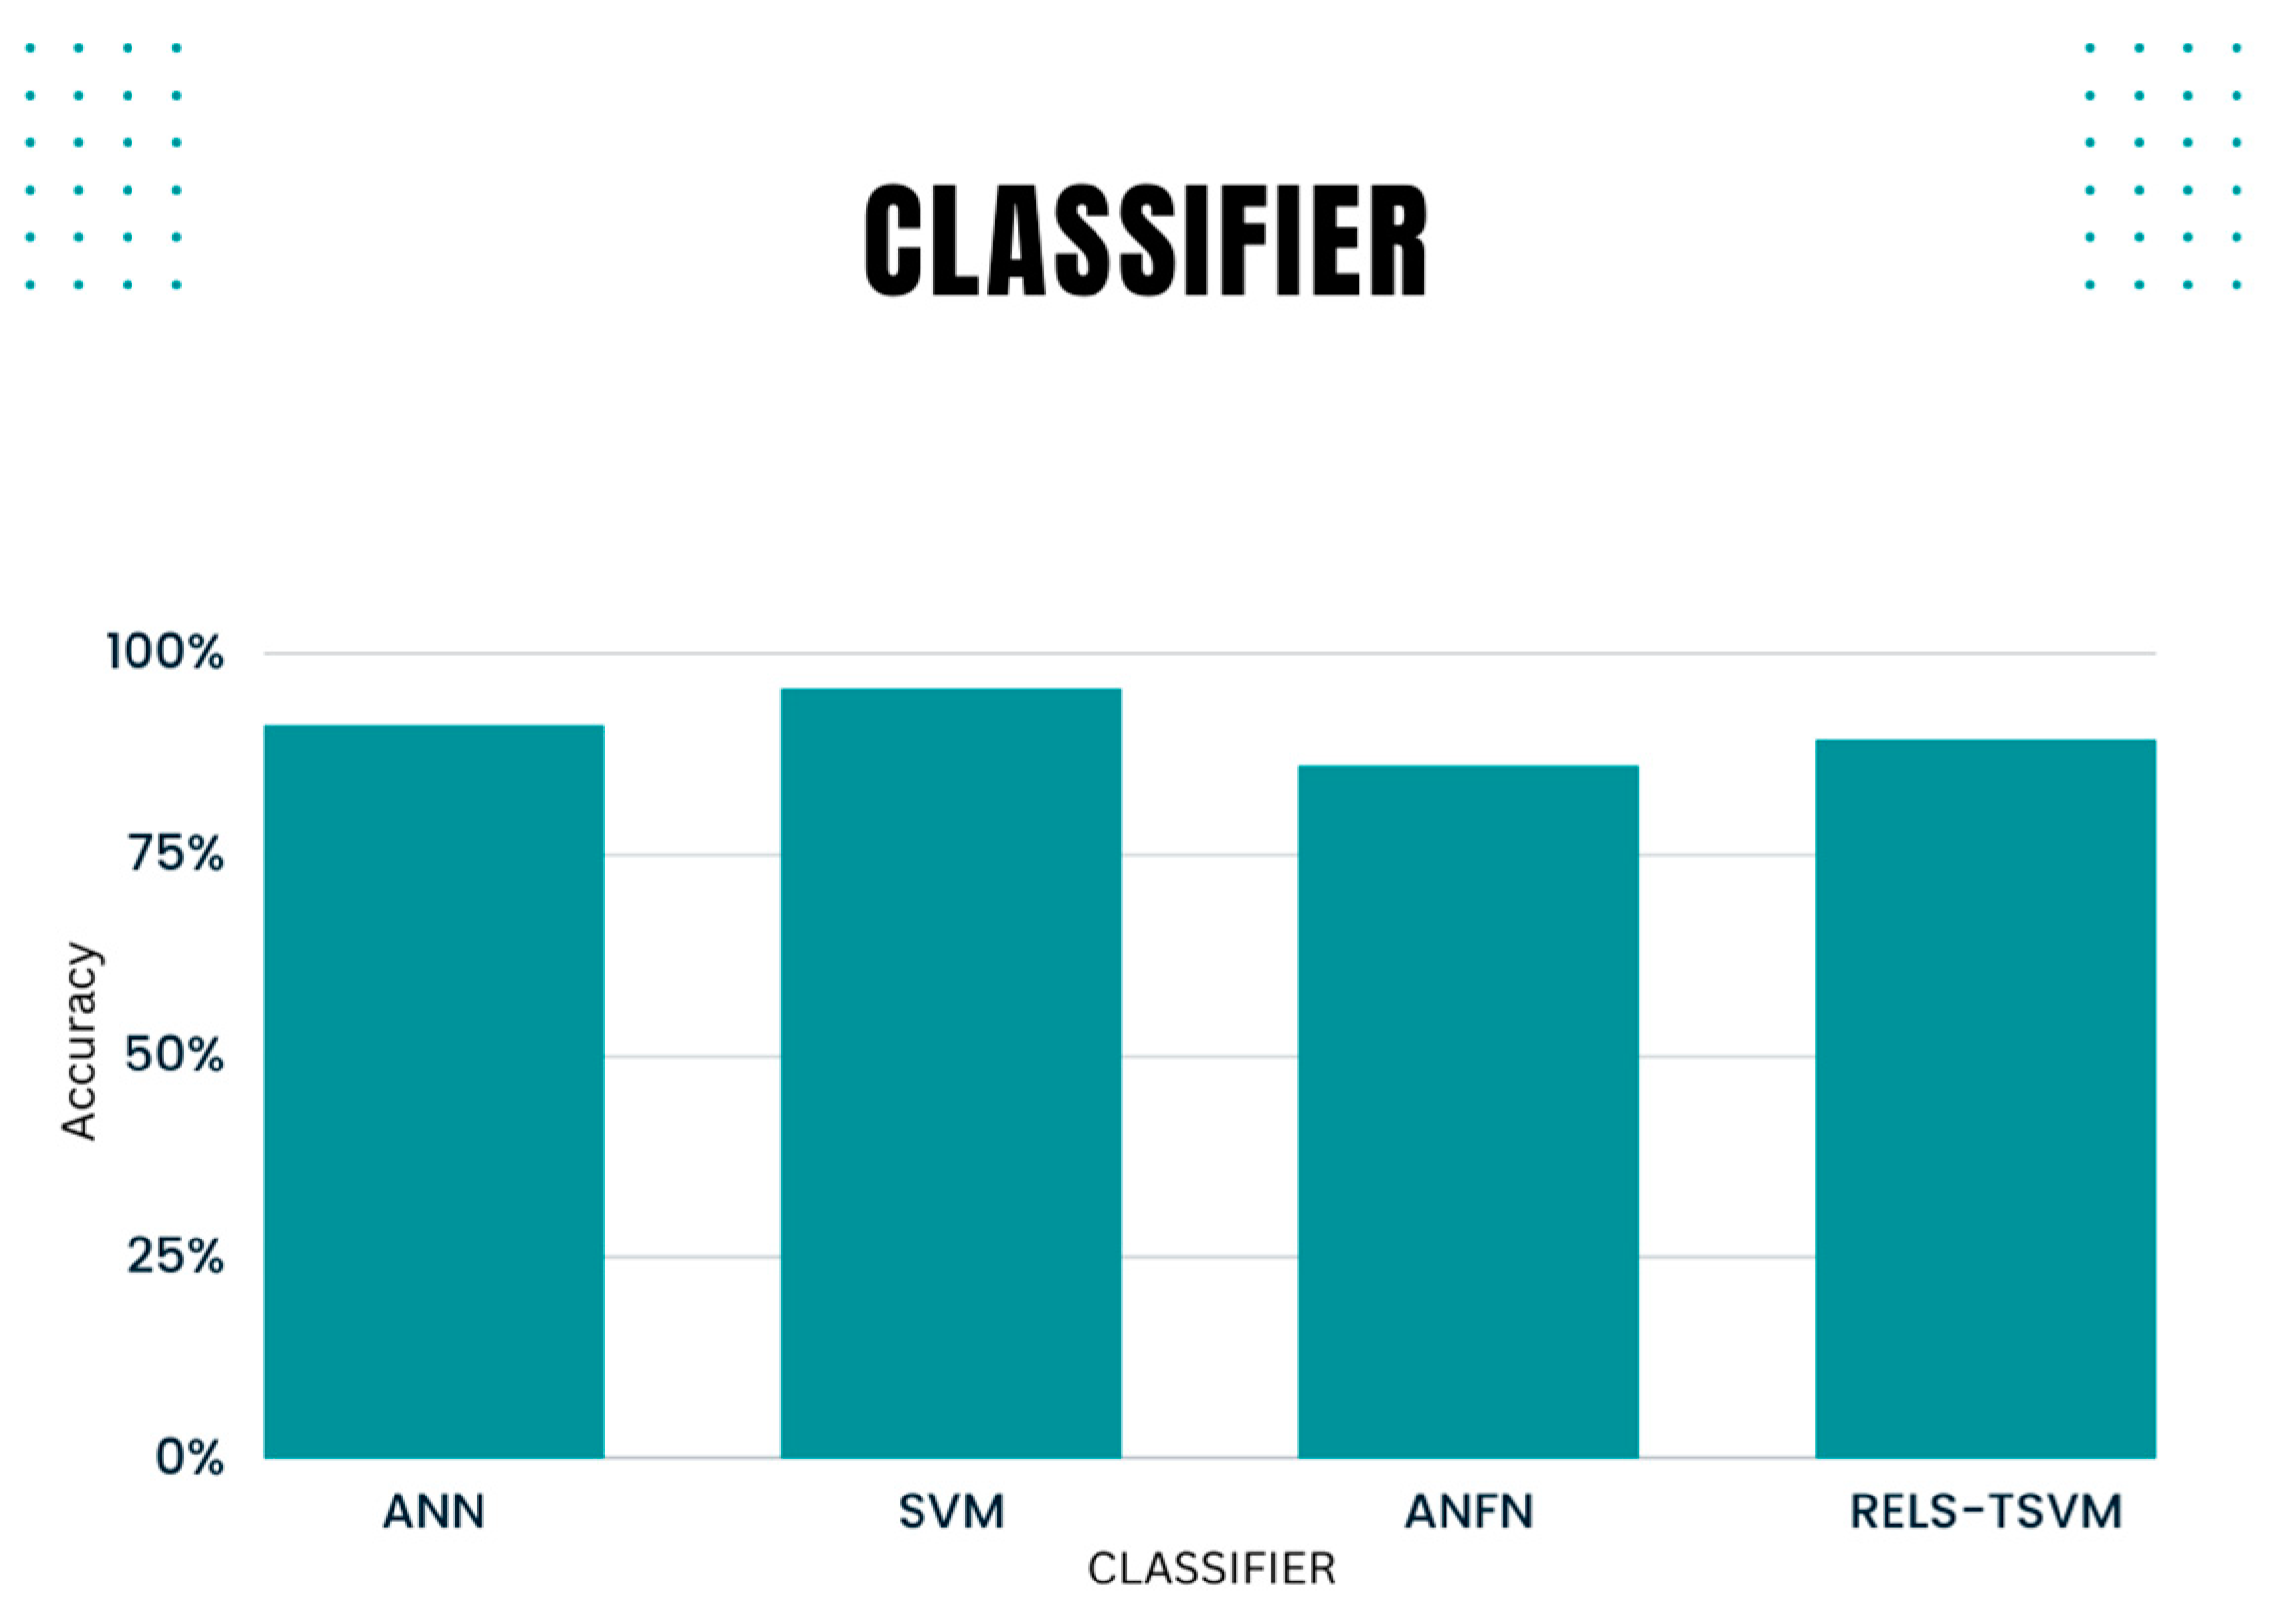
As you can see in
Table 5, the classifiers used in this study are compared with three ANFIS, FAWT, and DWT methods. The results obtained by using two classifiers SVM and ANN show higher accuracy as shown in
Figure 5.
To optimize the learning cost and diagnosis performance, it is important to carefully choose the SVM classifier parameters and kernel width. To do this, we divided the training data into train and validation sets and selected the optimum values of the parameters such that the smallest error on the validation data set is achieved. The optimum value of the parameter delta was found to be 1.5.
5. Discussion
As previously mentioned, the causes of epileptic seizures include epidemiology, etiology, acute stroke, brain infection, and the adverse effects of certain medications. In previous studies, some researchers have used a combination of EEG signals with FMRI to detect physiological values [
9,
10]. In recent years, advanced methods focusing on functional dynamics have been proposed in studies to assist people with epilepsy. For example, the SL parameter in the theta frequency band has been studied in various studies of individuals with epilepsy and has been shown to classify epilepsy with a sensitivity of 62% and a specificity of 76%. As previously noticed, the SL parameter is used to detect linear and non-linear dependencies between brain signals, especially in theta wave. In addition, this parameter can determine sudden attacks in epilepsy and is therefore very important. The techniques for analyzing brain signals have been improved in recent years as they can reflect brain activity but we still need more improved techniques to obtain more accurate results. The aim of this study was to demonstrate the predictive value of physiological signals measured using EEG, which was conducted in two different experimental stages. By testing on the Bonn data sets, as can be seen in
Figure 1 and according to the explanation in the
Section 3, each recording data composed of the following: (a) non-epileptic recording with open eyes, (b) non-epileptic recording with closed eyes, (c) recordings of EEG from the hippocampal formation in the hemisphere opposite the epileptogenic zone, (d) comprised EEG recordings of the epileptogenic zone, and finally (e) a collection of epileptic seizure activity recorded from the hippocampal focus. This study demonstrated the effectiveness of the proposed method compared to recent studies and highlighted how a predictive model based on EEG characteristics can significantly improve clinical diagnosis and contribute to diagnosis of epileptic symptoms in the EEG signal.
As you can see in
Table 5, the results obtained using the proposed methods have been more accurate compared to other methods. The use of deep learning methods as well as wavelet transform techniques and the use of four levels of decomposition have led to improved results in this study. This study has shown that the use of these methods of wavelet transform and Shannon entropy in the diagnosis of epilepsy can be very effective and lead to an easier diagnosis of the disease and its control by neuroscientists.
In the first step, using a multilayer perceptron neural network (MLP) classifier, epilepsy and control signals in the alpha, beta, and gamma frequency bands were analyzed separately and accuracy equal to 95% was achieved in detecting the epileptic signal. Then, using a wavelet transform function, the signal in the alpha, beta, and gamma frequency bands was re-examined and accuracy equal to 91% was achieved in detecting the epileptic signal. This study has succeeded in developing a simpler method for assessing epilepsy from EEG signals and also achieved satisfactory parameters, such as accuracy, compared to other studies.
6. Conclusions
Visual examining long-term EEG recordings to detect epileptic seizures is a costly and time-consuming method. This study proposed a new seizure detection algorithm using EEG signals to address these issues. The main strength of this study is the analysis of the available samples using both a multilayer perceptron neural network classifier and a wavelet transform function.
Future studies with larger sample sizes are needed to confirm and expand upon these findings. In this study, the diagnostic value of physiological signals measured using EEG was evaluated, and features such as FMD, FMN, FR, and WL were extracted. FMD and FMN, which are the median and mean frequencies, were obtained through the Fourier transform of the desired signal. In individuals with epilepsy, these two characteristics increase due to higher brain frequency and were compared to normal individuals. FR, or frequency rate, refers to the high-to-low frequency ratio of the brain, and in individuals with epilepsy, the frequency rate decreases due to higher brain frequency compared to normal individuals. WL, or waveform length, is a temporal feature that measures the changes and complexity of the signal by subtracting the absolute magnitude of subsequent samples from the previous samples and adding them together. In individuals with epilepsy, WL is reduced due to decreased entropy and similar fluctuations in the brain. Calculating these features provides useful information for physicians to diagnose and treat patients with epilepsy.
According to the studies conducted in this paper, there is not a significant difference between the two methods used, but the experiment using the multilayer perceptron neural network (MLP) achieved slightly higher accuracy than the experiment using the wavelet transform function, as shown in
Table 3. In recent years, new methods for automatic epilepsy detection have been emerging. Improving the speed and accuracy of epilepsy detection models will contribute to the development of clinical diagnosis techniques and portable, integrated epilepsy detection equipment. Therefore, a concise and efficient epilepsy detection model will be a necessary trend in the future.


