Article

Predicting the Composition and Mechanical Properties of Seaweed Bioplastics from the Scientific Literature: A Machine Learning Approach for Modeling Sparse Data

by
Davor Ibarra-Pérez
1,*,
Simón Faba
2,
Valentina Hernández-Muñoz
3,
Charlene Smith
4,
María José Galotto
2 and
Alysia Garmulewicz
5,*
1
Department of Mechanical Engineering, University of Santiago of Chile (USACH), Avenida Libertador Bernardo O’Higgins 3363, Santiago 9170022, Chile
2
Packaging Innovation Center (LABEN-CHILE), Department of Food Science and Technology, Faculty of Technology, Center for the Development of Nanoscience and Nanotechnology (CEDENNA), University of Santiago de Chile (USACH), Santiago 9170201, Chile
3
Department of Industrial Engineering, University of Santiago of Chile (USACH), Avenida Libertador Bernardo O’Higgins 3363, Santiago 9170022, Chile
4
Materiom C.I.C, Royal College of Art, London E8 4QS, UK
5
Faculty of Economics and Management, Department of Management, University of Santiago of Chile (USACH), Avenida Libertador Bernardo O’Higgins 3363, Santiago 9170022, Chile
*
Authors to whom correspondence should be addressed.
Appl. Sci. 2023, 13(21), 11841; https://doi.org/10.3390/app132111841
Submission received: 20 September 2023 / Revised: 2 October 2023 / Accepted: 8 October 2023 / Published: 30 October 2023
(This article belongs to the Special Issue Studies on Mechanical Characterization of Biopolymers)

Abstract

:
The design of biodegradable polymeric materials is of increasing scientific interest due to accelerating levels of plastics pollution. One area of increasing interest is the design of biodegradable polymer films based on seaweed as a raw material. The goal of the study is to explore whether machine learning techniques can be used to predict the properties of unknown compositions based on existing data from the literature. Clustering algorithms are used, which show how some ingredients components at certain concentration levels alter the mechanical properties of the films. Robust regression algorithms with three popular models, namely decision tree, random forest, and gradient boosting. Their predictive capabilities are compared, resulting in the random forest algorithm being the most stable with the greatest predictive capacity. These analyses offer a decision support system for biomaterials manufacturing and experimentation. The results and conclusions of the study indicate that bioplastics made from seaweed have promising potential as a sustainable alternative to traditional plastics, discovering interesting additives to improve the performance of biopolymers. In addition, the machine learning approaches used provide effective tools for analyzing and predicting the properties of these materials in structured but highly sparse data.

1. Introduction

The increase in plastics pollution levels across all major ecosystems on the planet has prompted a large number of countries around the world to change or improve their public policies for the management of polymer waste generated by human production [1,2]. Experts indicate that one of the main recommendations is to avoid single-use materials, especially those that are not recyclable [3,4]. Plastic films that are used as bags for food packaging have proven to be one of the most difficult to recycle given their low recovery rate that does not even allow a minimum or constant stock for reprocessing, as well as their high compositional heterogeneity in the market (low-density polyethylene, high-density polyethylene, polypropylene, polystyrene, and some other mixtures in multilayer format) [5]. Therefore, the manufacture of biodegradable or compostable films has become increasingly relevant, and the sustained growth in the last decade of scientific publications in this area is in line with the need to improve their performance so that they can replace traditional polymer films in the various applications in which they are used [6,7].
Biopolymers can be structurally understood as long chains of molecules linked to each other, where their shape, distribution, and types of bonds between molecular components determine the properties that they can achieve and therefore the applications in which they are used [8]. Among the biopolymeric structures that can be found [9], the manufacture of films based on polysaccharides extracted from seaweed is of high interest since the process of manufacturing seaweed-based films is relatively low cost [10,11], and the use of seaweed as a biomass feedstock does not compete with arable land for food or feed compared to starch polysaccharides extracted from various vegetable sources, such as potatoes, corn, and soy [12,13,14].
Among the most common polysaccharide macromolecules extracted from seaweed are agar, alginate, and carrageenan, components that can be extracted in different proportions and concentrations depending on the species of seaweed used [15,16]. These biopolymers are commonly available in powder form for applications in the food and cosmetics industries. Seaweed biopolymers have also been extracted using low-cost techniques for the manufacturing of films at a laboratory scale [17,18,19,20]. Studies show that these types of biopolymers have good potential for film development, although they are far from demonstrating high functional capabilities comparable to petrochemical polymer films on certain performance dimensions. Therefore, experimentation with the inclusion of other additives or variations in the processes are important to improve the performance of seaweed biopolymer films for a range of application-specific performance specifications [21,22,23,24].
In the field of materials science, the use of artificial intelligence (AI) and machine learning (ML) has been growing in importance, redefining the way scientists approach the design and discovery of polymeric materials. These technologies have revolutionized research by enabling the exploration and analysis of large datasets in a systematic and efficient manner [25]. The intersection between machine learning and polymer chemistry has proven to be especially fruitful, enabling property prediction and the design of polymers with specific characteristics [26]. ML algorithms have overcome the limitations of traditional approaches by identifying patterns and relationships in material property data, enabling more informed decision making [27,28]. This transformative impact is not limited to the field of polymers. Materials science research has successfully adopted these tools in the design and development of advanced materials. ML-assisted simulation and experimental automation have optimized the discovery process, enabling efficient exploration of various combinations of materials and conditions [27,29]. In addition, machine learning has been applied to predict properties in other contexts, such as process optimization and synthesis of materials with specific properties [30]. This expansive trend highlights the versatility of ML across diverse scientific disciplines, cementing its pivotal role in accelerating discovery and innovation [25,28]. This synergy between artificial intelligence and materials science promises to continue to challenge the boundaries of knowledge and innovation. As ML algorithms are refined and datasets continue to grow, materials prediction and design are expected to continue to improve levels of accuracy and efficiency [31].
In this study, we seek to provide a framework to enhance the development of seaweed-based biopolymer films by modeling a dispersed and highly sparse dataset (over 90% sparsity coefficient) using machine learning techniques of unsupervised and supervised algorithms. The main objective of the present study is the development of a methodological tool that supports decision making for biopolymeric film developers. We offer a useful visual tool for the exploration of compositional ranges and new fabrications, quantifying the level of importance of the material components with respect to reported properties. All formulations extracted in this work use casting as a manufacturing process. The relationship between the film manufacturing process and film performance is an area of future research.

2. Materials and Methods

2.1. Data Selection

The bibliographic citation and abstract database Scopus was used to access peer-reviewed journals in order to obtain the metadata of 2000 articles containing biopolymeric data pertaining to seaweed precursors, products, and byproducts. The search and classification of these journals included a string of keyword inputs associated with seaweed biopolymers and their corresponding properties. The following query was conducted: “alginate OR agar OR carrageenan OR seaweed OR macroalgae” and “bioplastic OR bio-plastic OR biopolymer film OR film OR plastic bag OR packaging OR biocomposites OR bio-composite”. Then, the following exclusion criteria was applied: only publications from the last 10 years (minus the present year); publications without abstracts; review papers; and conference papers. The dataset used a total of 1522 publications.
Initially, forty scientific papers were randomly selected that met the specific criterion that the biopolymer under study should be manufactured through a casting process. After meticulous evaluation of these papers, 405 distinct biopolymeric material systems were identified, along with 146 physicochemical properties categorized into various classes. This variability represents a major obstacle to systematic comparison and consistent interpretation of data between different biopolymeric material systems. Therefore, the study focused exclusively on mechanical properties, which were reported in a more uniform and standardized manner in the works consulted. As a result of this recalibration in the approach, the data set was reduced to twenty scientific papers for a more rigorous and specific analysis.

2.2. Data Extraction

Information was extracted from two sections of each scientific article, namely the methodology and the results. The validation criteria used for the extraction reviewed in the articles are as follows:
  • Criterion 1: The concentrations of the components as a percentage of the total mass or volume of the manufacture.
  • Criterion 2: The existence of no more than 5 components for manufacturing.
  • Criterion 3: Method of manufacturing biopolymer films.
In the case of the results, the criteria are as follows:
  • Criterion 1: Relevant property report.
  • Criterion 2: Values of the results in tabular form and not in graphs.
These criteria are exclusive, so if a criterion is not met, the article should be discarded. Once the criteria for each section are validated, the information is extracted in tabular form, documenting in linear form each of the formulations and results obtained, with their respective units and identification fields. Characterization of the material systems included an outline of the ingredient precursors, the concentrations and the mechanical properties as tensile strength and elongation at break (the most commonly reported properties and in a standardized manner). The characterization of each material system was scripted in a manner so that the units of each data value was also represented in a separate field (see Table S1). It should be noted that measurement errors (commonly separated by +/−) are not considered in the extraction.

2.3. Data Preprocessing

The extraction of properties reported in scientific publications composes a high-dimensional space. Certain formulations have extremely sparse data, adding considerable noise to the final prediction matrix. In response, new exclusion criteria were defined to allow the analysis of the relationships between the components by selecting a dataset with at least one complete response variable, i.e., without gaps. Standardization of ingredient concentrations for these formulations was further required, transforming stated units into mass/mass or volume/volume. The total masses or volumes of the solutions were calculated and the concentrations of each of the components were adjusted accordingly. This step is essential for models that are sensitive to the scale of the variables, allowing a more accurate and consistent comparison between different formulations (note that those formulations lacking information needed for their transformation were excluded). The application of this criteria resulted in a final dataset of 115 seaweed-based biopolymer formulations and associated mechanical properties. Finally, the extraction table was transformed into a matrix of dependent variables X of size nxm. Let n = columns correspond to each of the identified ingredients and m = rows correspond to the extracted formulations. Therefore, the values of each of the positions of the matrix correspond to the concentration of that component in a given material system.

2.4. Data Analysis

The following provides a methodology for the evaluation of a material design space with a high degree of dispersion. In general, machine learning algorithms are divided into three large families of models: unsupervised algorithms that are usually used for the clustering and classification of data, supervised algorithms that are generally used for regression models and data prediction, and finally reinforcement learning algorithms that are used for modeling dynamic problems. In this study, we focus on the first two families of models, aiming to test predictive capabilities.

2.4.1. Unsupervised Algorithms

Unsupervised algorithms play a key role in the analysis of complex and unlabeled data, as they allow the discovery of hidden patterns and relevant relationships without the need for labels or prior information [32]. These algorithms are especially useful in the context of highly sparse datasets, where a lack of structure or the presence of rare features make traditional analysis difficult [33]. By applying clustering techniques, such as the K-means algorithm or hierarchical clustering, natural clusters and dense regions in the data can be identified, providing deep insights into intrinsic relationships and underlying structure. In addition, unsupervised algorithms, such as dimensionality reduction and anomaly detection, help reduce data complexity and identify unusual patterns or outlier points, which is essential for sparse and scarce data exploration. In summary, unsupervised algorithms provide a powerful tool for revealing valuable information in challenging datasets, enabling deeper understanding and decision making based on intrinsic relationships and meaningful features present in sparse and scarce data [34,35].

Clustering Algorithm

The K-means algorithm is a widely used method in the field of unsupervised machine learning to identify patterns and clusters in datasets. First, a number K of desired clusters are selected, and K centroids are randomly initialized in the feature space of the dataset. Next, each point in the dataset is assigned to the cluster represented by the nearest centroid, using distance measures such as the Euclidean distance. After the initial assignment, centroids are updated by recalculating the average of the features of the points assigned to each cluster. This process of centroid assignment and updating is repeated iteratively until a converged state is reached. The K-means algorithm is based on minimizing the sum of the squared distances between each point and the corresponding centroid. This can be expressed as an objective function  J  (Equation (1)) that seeks to minimize the intra-cluster variance. Optimization is performed using the heuristic optimization technique known as expectation–maximization. For the selection of K clusters, the Jambu elbow criterion is used to determine the optimal number of K clusters. The sum of the squared distances from each point to the centroid of its assigned cluster is calculated and these values are plotted as a function of the number of clusters. The inflection point in the graph, which resembles an “elbow”, indicates the number of clusters in which increasing the number of clusters no longer provides a significant improvement in the explained variability [36,37,38]. In this case, the aim is to identify the different levels existing in the response variables. Before applying the clustering algorithm, the concentrations are coded with a 1 if there is a value and with a 0 if there is no value. The results of the clustering algorithm are visualized over the principal components vector to observe and interpret the data’s distribution patterns, gaining valuable insights into the underlying structures and relationships within the dataset [39]. This dimensionality-reduction technique transforms the original variables into a new set of variables called principal components. These components are orthogonal to each other and reflect the maximum variance of the data. Mathematically, the algorithm searches for the eigenvectors  e i  and eigenvalues  λ i  of the covariance matrix   of the data (Equation (2)). Then, the  e  eigenvectors corresponding to the  e  largest eigenvalues are selected (in this case,  e = 2 ) to transform the original data  X  into a new lower-dimensional subspace  Y  (Equation (3)).
J = i = 1 n K = 1 K w i k x i c K 2
e i = λ i e i
Y = X e i
such that  x i  represents each data point,  c K  is the centroid of the group  K , and  w i k  is an indicator variable that is equal to 1 if data point  x i  belongs to the group  K , or 0 otherwise.

2.4.2. Supervised Algorithms

For the analysis of the data, a decision tree model is used, which compares performances with its more robust variants of random forest and gradient boosting for the prediction of each of the variables alone and together. The data are randomly split into training (80%) and test (20%) data for the model, and these are optimized by “hyper-parameters tuning” and “cross validation” techniques. First, the model parameters are adjusted, looking for the range where they reach the lowest errors (based on the root-mean-square error), and then, through an experimental design “GridSearchCV”, a set of simulations is created where the model parameters are permuted with different random splits of the data, selecting the best model by weighted ranking of the models obtained in each training set. Finally, multiple metrics are used to evaluate and compare regression models in the fit on both training and test data, using the coefficient of determination ( R 2 ). With respect to the model errors, the mean square error ( M S E ), root-mean-square error ( R M S E ), mean absolute error ( M A E ), median absolute error ( M e d A E ), and root-mean-square logarithmic error ( R M S L E ) are used as evaluation indicators (see Equations (4)–(9)). Both the  R M S E  and  M S E  were selected because these quadratic errors are sensitive to outliers and penalize larger errors more. Since the data analyzed are sparse data, the presence of outliers or large errors can be especially significant. In addition,  R M S E  and  M S E  are standard metrics in the machine learning literature, which facilitates comparison of our results with other studies. Unlike quadratic errors,  M A E  and  M e d A E  are robust metrics that are not strongly influenced by outliers. This is crucial when dealing with sparse data, where a single outlier can have a significant impact on model performance.  M e d A E , being the median of absolute errors, offers an even more robust and focused perspective than  M A E . As for  R M S L E  specifically used to address the variable scale of the data, it is useful when errors in prediction are not penalized uniformly across the scale of the target variable, which is relevant in datasets with a wide range of values, such as those under analysis. The combination of these metrics allows us to address both the magnitude and distribution of prediction errors, thus providing a more complete picture of model performance. Each metric was selected to evaluate a specific aspect of the prediction error, which is critical for a robust and complete assessment.
R 2 = 1 i = 1 n ( y i ^ y i ¯ ) 2 i = 1 n ( y i y i ¯ ) 2
M S E = i = 1 n ( y i y i ^ ) 2 n
R M S E = M S E = i = 1 n ( y i y i ^ ) 2 n
M A E = i = 1 n | y i y i ^ | n
M e d A E = M e d i a n y 1 y 1 ^ , y 2 y 2 ^ , , | y n y n ^ |
R M S L E = 1 n i = 1 n ( log ( y i + 1 ) log ( y i ^ + 1 ) ) 2
such that  y  represents the actual value,  y ^  represents the predicted value,  y ¯  represents the mean value of the dependent variable, and  n  represents the number of observations.

Decision Tree Regression

The decision tree is a machine learning algorithm used to make decisions based on multiple conditions or characteristics. It is based on the idea of dividing a dataset into smaller, homogeneous subsets according to certain criteria. The algorithm starts with a single root node that represents the entire dataset. Then, a feature is selected to divide the set into two subsets, maximizing the homogeneity of the data within each subset. This process is repeated recursively for each subset until some stopping criterion is met, such as reaching a maximum depth level or being unable to perform further splits. The decision tree formulation involves finding the best feature and cutoff point to split the dataset at each node. This is achieved by applying impurity metrics, such as information gain or Gini impurity. These metrics evaluate how well the classes or categories are separated into the generated subsets [40,41]. The tree is built from top to bottom, each time dividing the dataset into more homogeneous subsets. In the context of regression, a decision tree seeks to partition the feature space such that the sum of squared errors within each terminal node is minimized (Equation (10)).
H ( X , f ) = j = 1 X y j f ( X j ) 2
such that  X  represents the dataset,  X  represents the number of terminal nodes,  y j  represents the values observed at the terminal node  j , and  f ( X j )  signifies the model’s prediction for the data at that node.

Random Forest Regression

Random forest is a machine learning algorithm that combines multiple decision trees to make decisions. Each tree  T  in the forest is trained on a random sample of the data (Equation (11)), and then the predictions of all trees are averaged to obtain a more robust and accurate final prediction (Equation (12)). The random forest algorithm starts by randomly selecting a sample of the training data. Then, a decision tree is constructed using this sample, but at each node, only a random subset of features is considered. This process is repeated several times to create multiple decision trees. To make predictions, the majority of votes from all trees are taken. This involves combining individual decision trees using the averaging or voting technique. In each tree, techniques such as information gain or Gini impurity are used to determine the optimal splits at the nodes [41,42].
H T ( X , f ) = j = 1 X T y j f T ( X j ) 2
f R F ( X ) = 1 N i = 1 N f T i ( X )
such that  X  represents the dataset,  X T  represents the number of terminal nodes in the tree  T y j  represents the values observed at the terminal node  j f T ( X j )  represents the model’s prediction of tree  T  for the data at that node,  N  represents the total number of trees in the forest, and  i  is used to iterate through each of the  N  trees in the forest. Thus,  f T i ( X )  is the prediction of the i-th tree for the dataset  X .

Gradient Boosting Regression

Gradient boosting is a machine learning algorithm that combines multiple weak learning models to create a stronger and more accurate model. Unlike random forest, gradient boosting focuses on iteratively improving the errors of the previous model rather than working with different data samples. The gradient boosting algorithm builds an initial model, such as a simple decision tree, and then focuses on iteratively improving the model predictions. At each iteration, new models are fitted to the residual of the previous model’s errors, attempting to reduce the overall error. The models are combined by weighted summation to obtain a final prediction. The gradient boosting formulation involves fitting these new models using the downward gradient. The gradient represents the direction and magnitude of the largest error growth, so the objective is to reduce it at each iteration by means of the mean square error or cross-entropy [43]. As with the previous methods, the objective is to minimize a loss function  G  (Equation (13)); therefore,  g ( y i , F ( X i ) )  is called the individual loss function, and this is the difference between the true labels  y i  and the predictions of the model  F ( X i )  for each sample  i . In this case,  F X  represents the sum of the predictions of all trees  h m X  up to that stage  m  (Equation (14)).
G ( y , F ( X ) ) = i = 1 n g y i , F ( X i )
F X = F m 1 X + ρ m h m X
such that  ρ m  is the learning rate that controls the impact of each tree on the final model.

3. Results

Machine learning techniques provide a comprehensive framework for the discovery of relationships between all types of data. For this analysis, we obtained a matrix ( X ) with 44 components (columns) and 115 combinations of them (rows) with which the tensile strength and elongation at break are predicted ( Y ) from twenty-one articles [44,45,46,47,48,49,50,51,52,53,54,55,56,57,58,59,60,61,62,63,64]. It is interesting for the scientific field to identify the components that favor certain material properties; for this, the Pearson correlation can be used for level identification of proportionality respect to property (see Table S2 to observe the table of Pearson correlations of the raw data), but given the high presence of combinations and few variations, results are not completely valid due to the high noise, making it difficult to select materials. In fact, if the distribution and sparsity of the data are evaluated numerically, i.e., the difference of one with the amount of non-zero data divided by the data size, a coefficient of 91.4% is obtained. In addition, they can lead to model bias, as certain groups or characteristics may be underrepresented or absent (Figure S1 shows the number of values for each of the components (a) with their respective standard deviation (b)). The problem with the analysis of this type of data is that it becomes complex to measure the relationship of each of the variables in terms of the observed properties.
Given the above, below are developed some classical techniques of ML for the identification of the relationships between data and the development of models that complement the course and knowledge for the development of scientific research with small datasets and high level of sparsity.

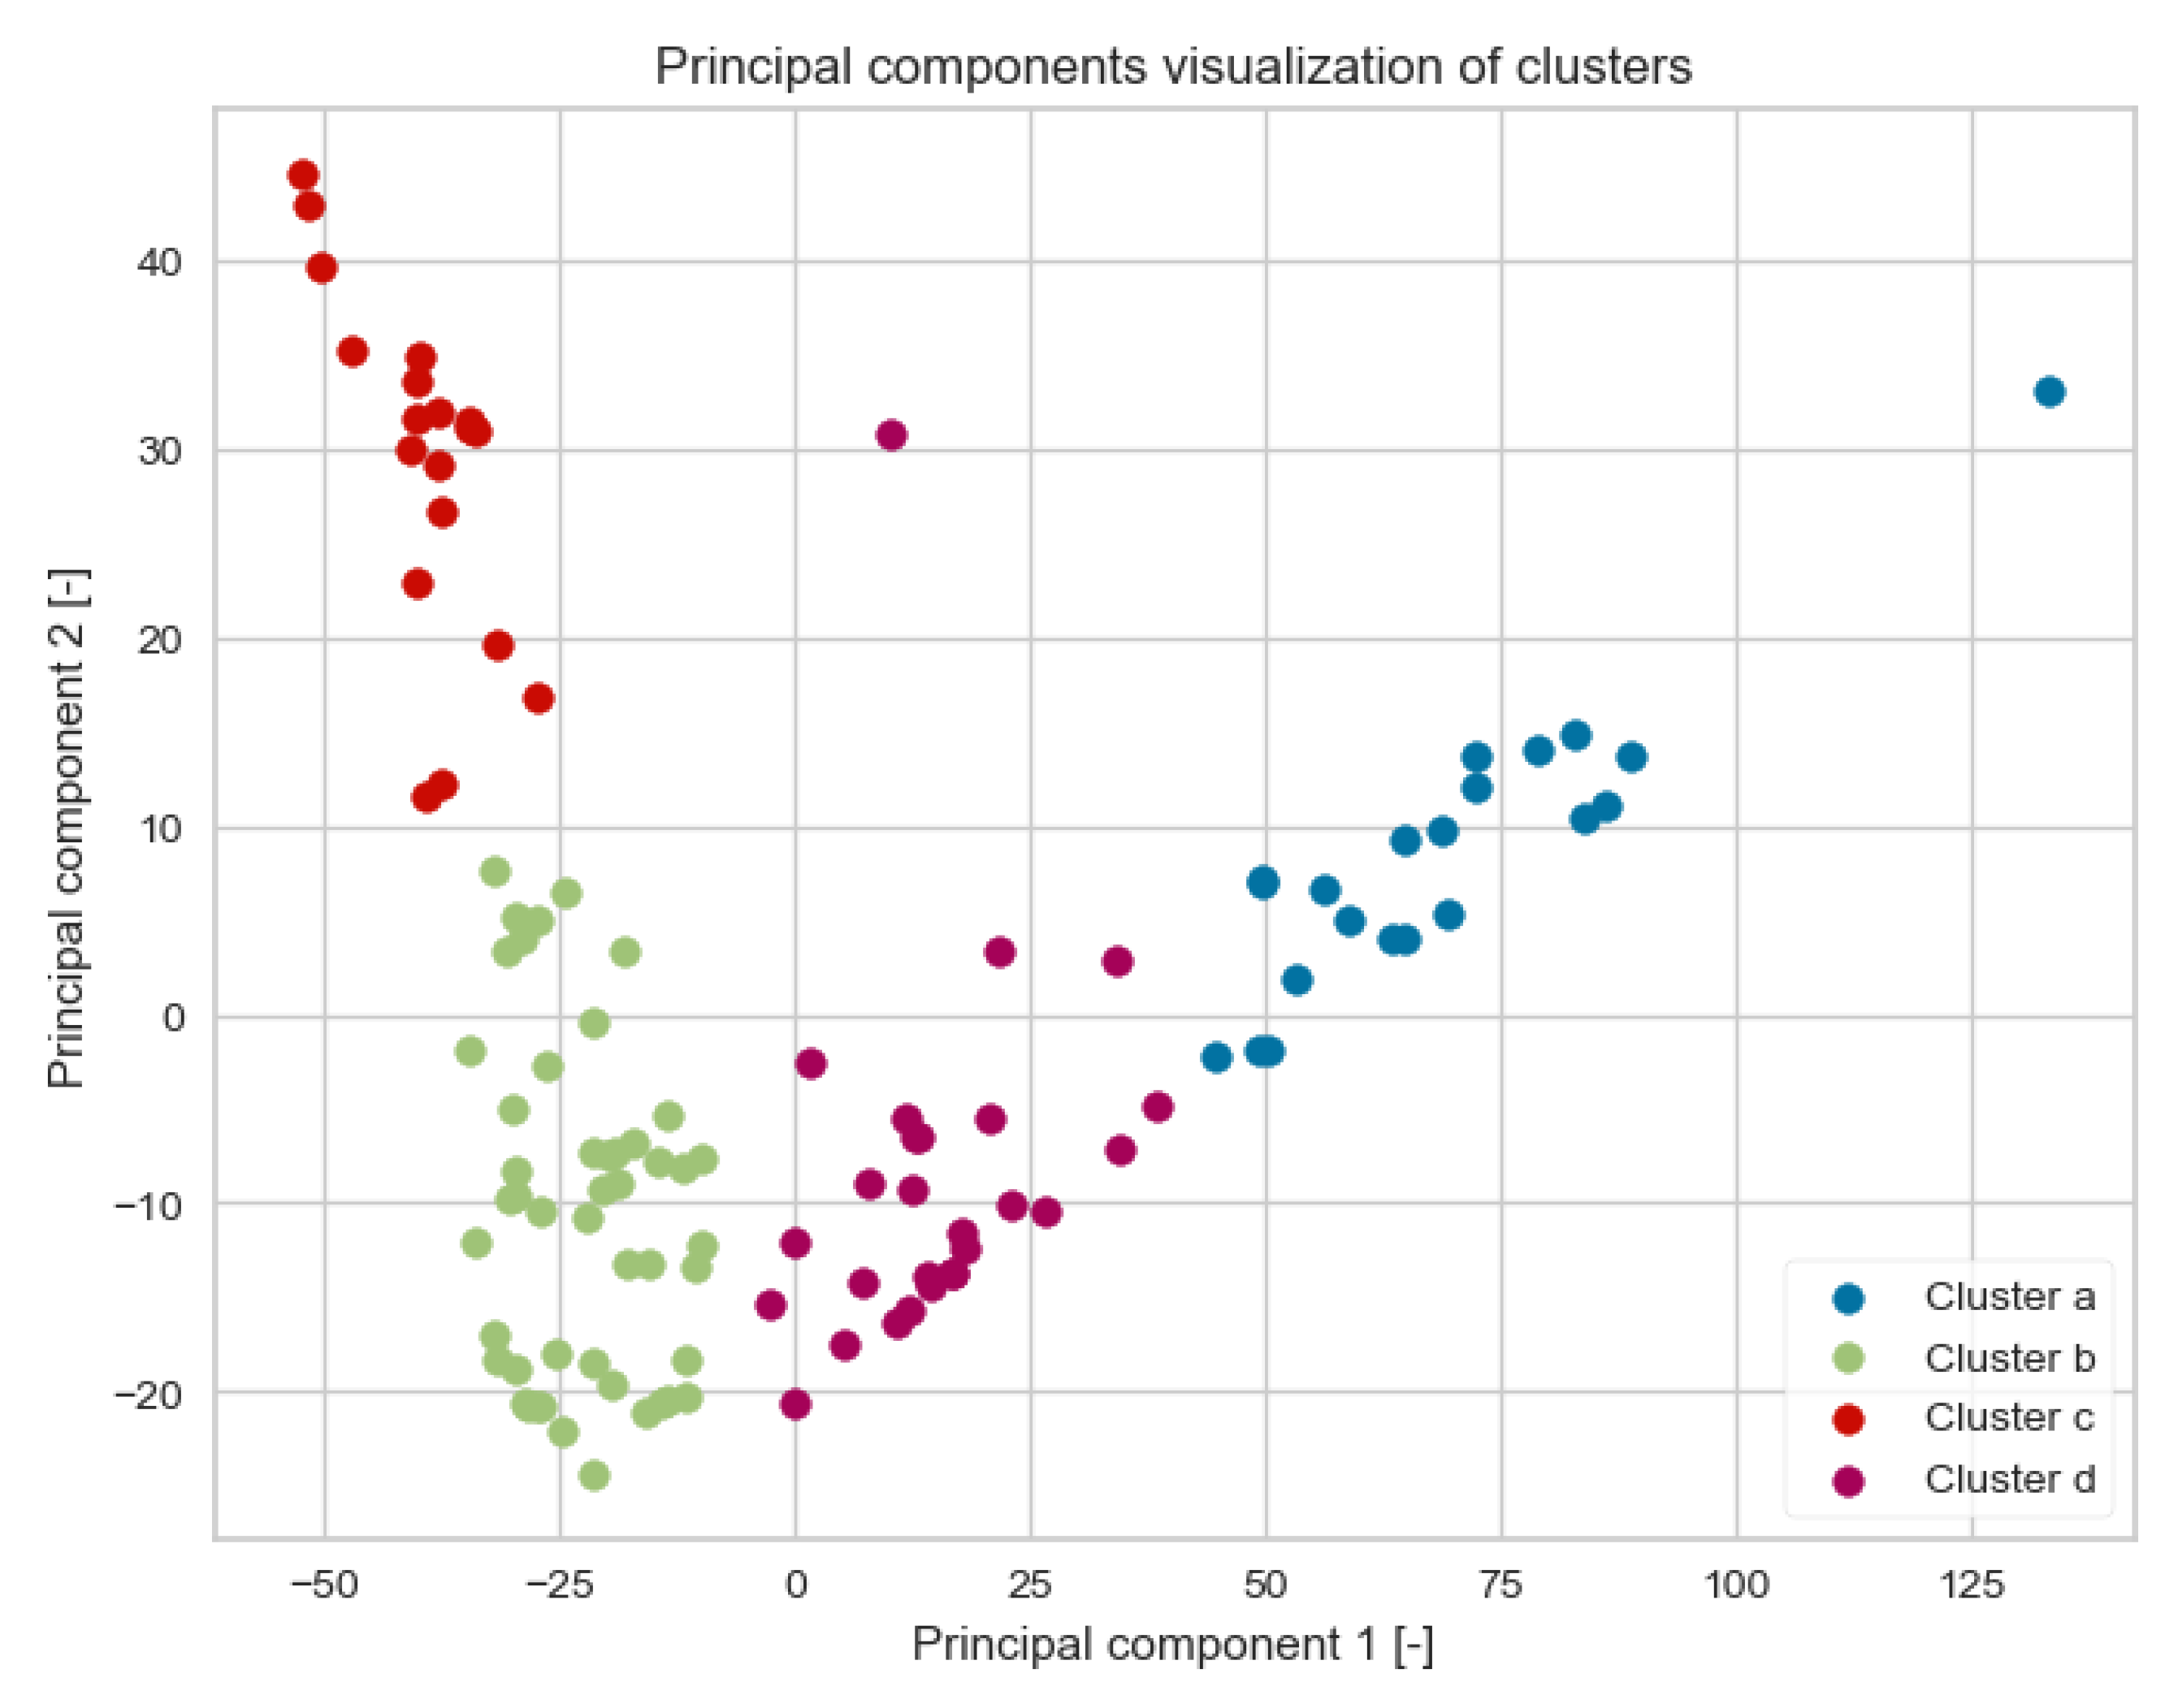
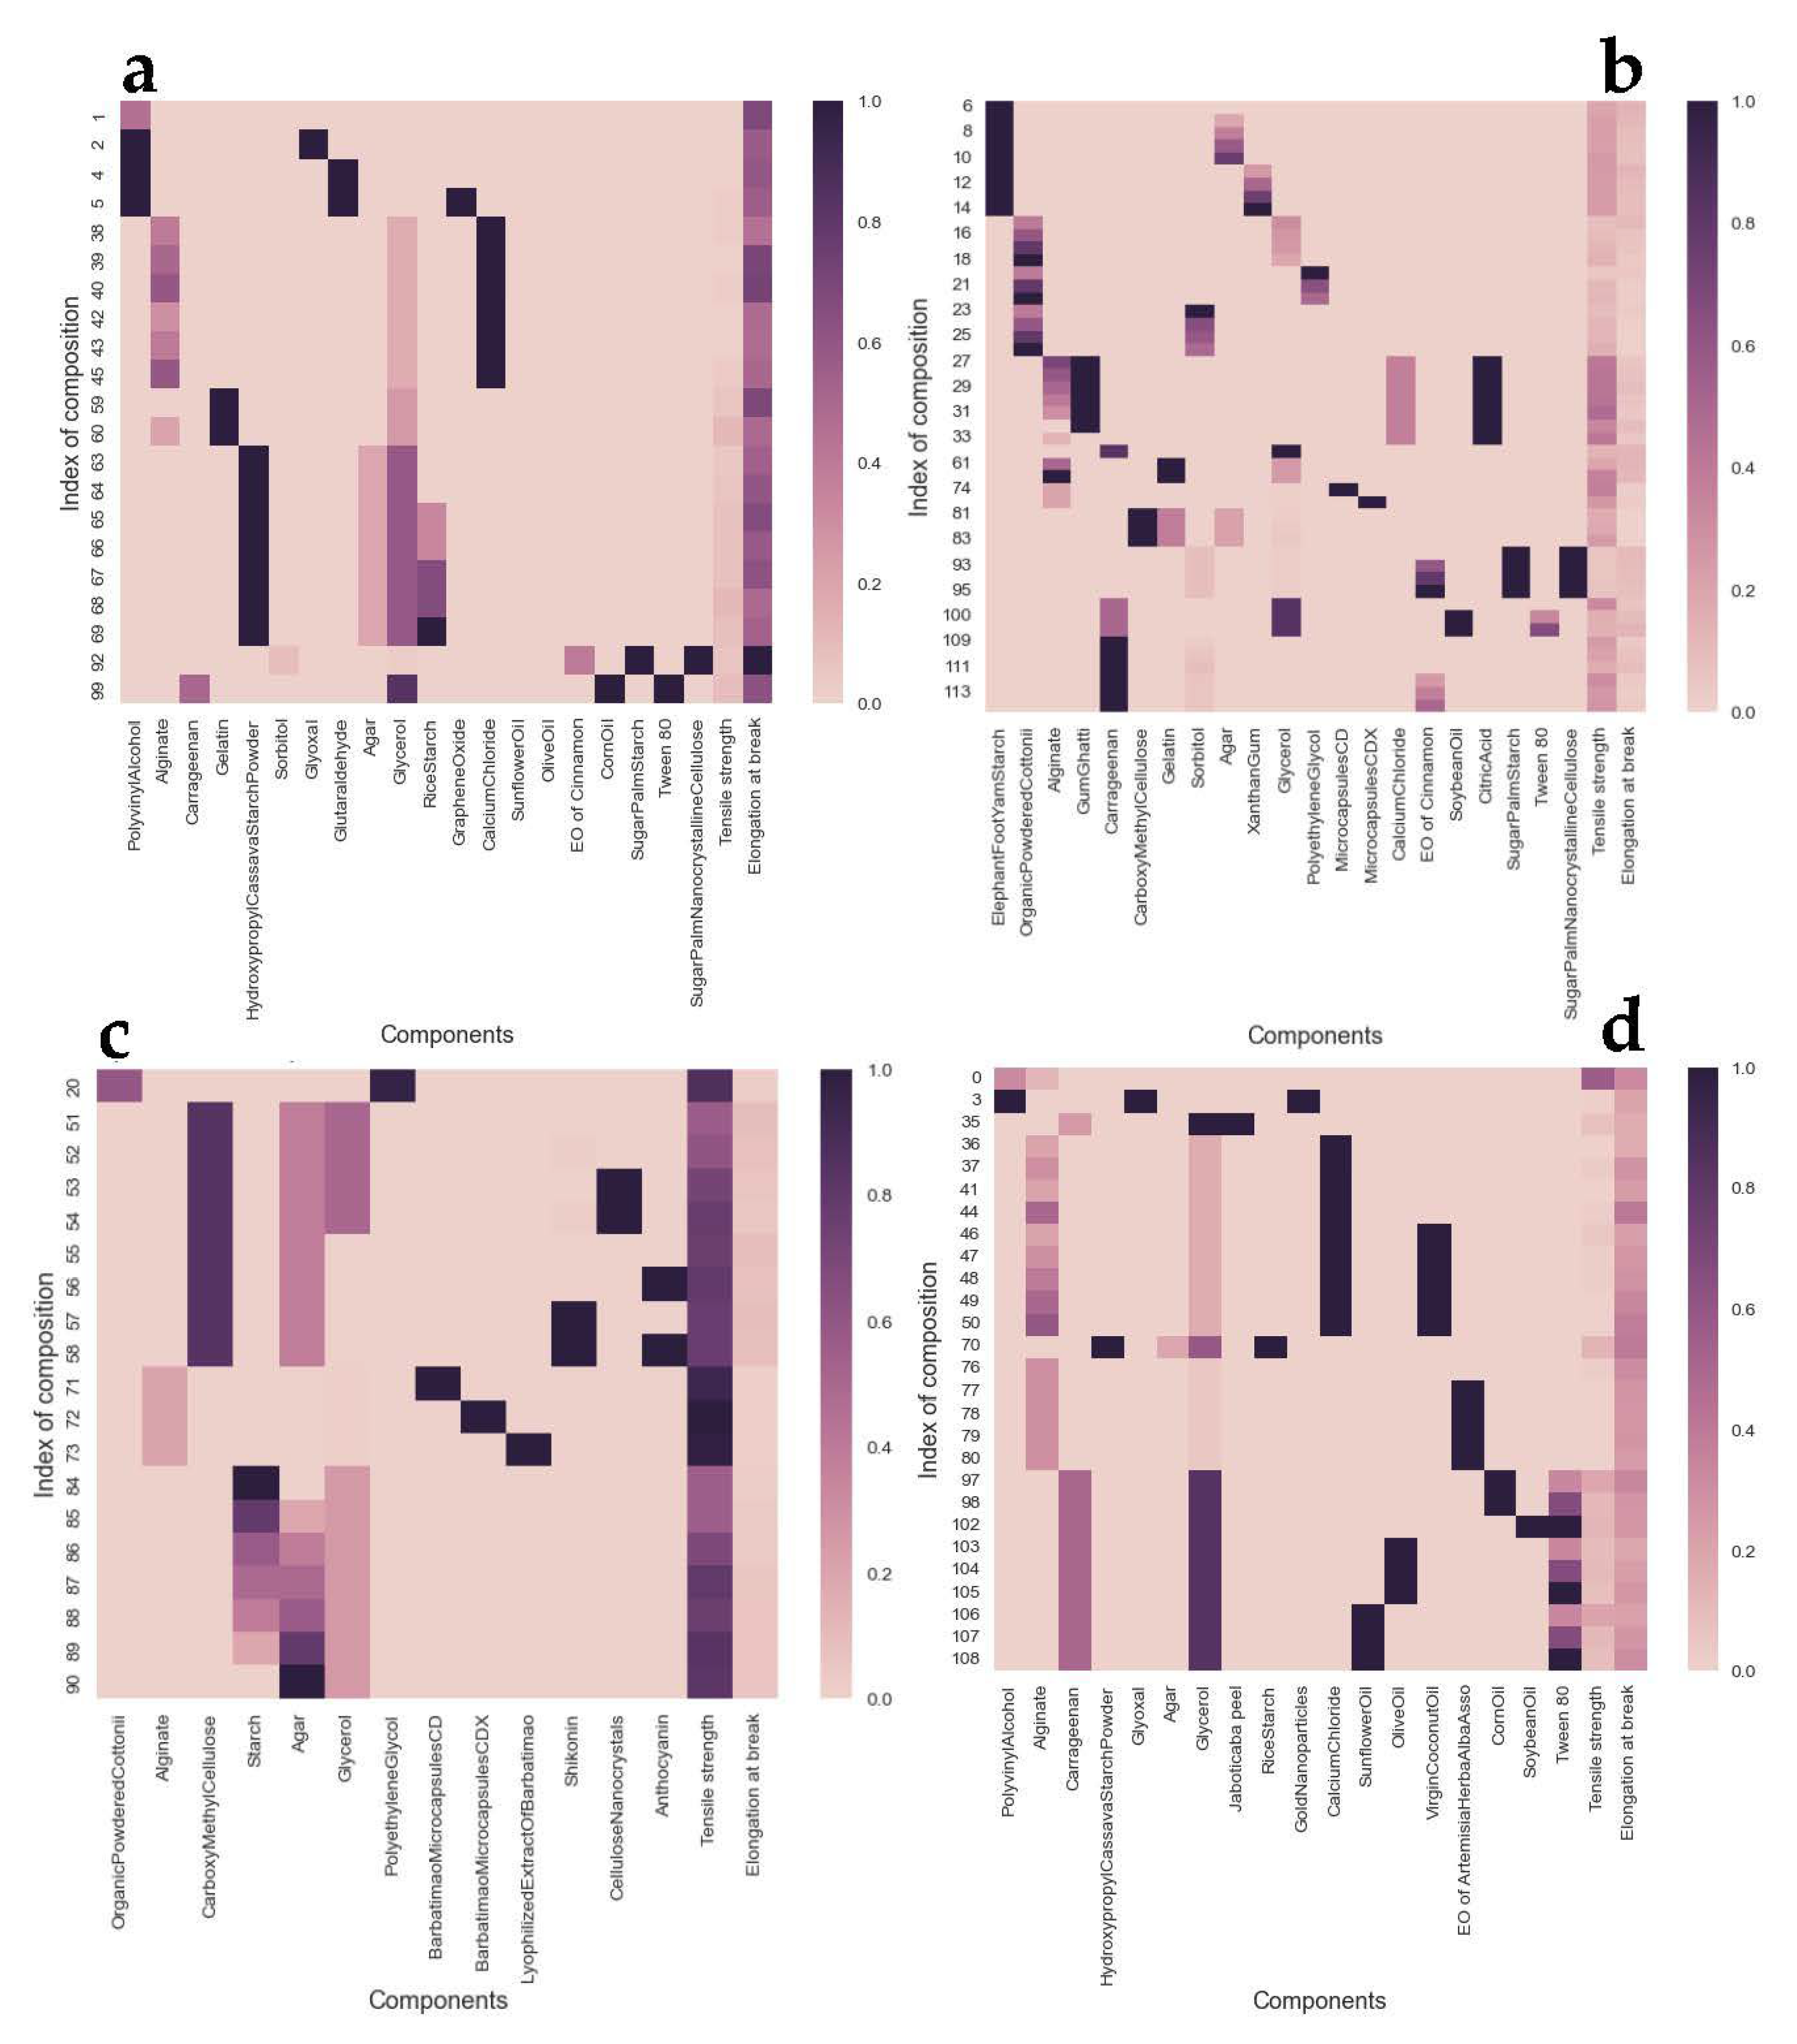
3.1. Clustering Analysis

Clustering techniques are useful in identifying subgroups in all spatial dimensions. Its ability to group points into compact and separate clusters can help reveal underlying structures in the data and identify groups of similar points in a multidimensional space. Thus, the K-means algorithm is a valuable tool in the exploration and analysis of unlabeled data, facilitating pattern understanding and decision making based on the intrinsic structure of the data. For the choice of the number of clusters, the Jambu elbow technique is used (see Figure S2), where it is observed that there are four clusters before the inertia of the cluster decreases considerably [38]. Figure 1 shows the distribution of each of the clusters using principal component analysis (PCA), which projects each of the dimensions on the principal planes of the data. In general, orthogonal behavior formed between the four groups of points is observed, indicating that the data are distributed heterogeneously among each dependent variable, i.e., some formulations favor only tensile stress or elongation at break (purple and blue) and others favor in between (green and red). In addition, the figure allows the agglomerability of the groups to be evaluated, and good agglomeration of the data is observed, with the exception of some points that escape the average of the rest of the group.
Now, a relevant point of study for materials developers is to identify components that allow desirable properties in terms of their specific application. As shown in Figure 2a–d, the formulations are represented in each of the clusters in these heat maps, where each combination (row) of the described components is presented on the x-axis (columns), and the intensity of the color represents the relative value between 0 and 1 of the concentration of the corresponding component (normalization is only for visualization). It can be observed that the last two columns are reserved for the dependent variables’ tensile stress and elongation at break. That is, the heat map is like a large table where each row represents a different formula for making the bioplastic film and each column represents the specific ingredients one is using. The cells in the table indicate the concentration of the ingredient, except for the last two columns as mentioned. If we analyze the intensity levels with respect to the other clusters, they can be classified as follows:
  • Cluster a: High elongation at break, low tensile strength (Figure 2a).
  • Cluster b: Low elongation at break, medium tensile strength (Figure 2b).
  • Cluster c: Low elongation at break, high tensile strength (Figure 2c).
  • Cluster d: Medium elongation at break, low tensile strength (Figure 2d)
From this analysis, it is interesting to observe how the components and level of concentrations are distributed according to each of the clusters, making it possible to identify the components and combinations that are most conducive to improving material performance on both tensile strength and elongation at break. For example, if one wanted to improve the properties of elongation at break, cluster a or d shows the highest performance. If one views rice starch, which is centrally located in both clusters a and d, one can understand how the film behaves at the same concentrations of agar, glycerol, and hydroxypropyl cassava starch powder, but with varying concentrations of rice starch, given that the color intensity is similar in the concentration of the constant ingredients (agar, glycerol, and hydroxypropyl cassava starch powder) but not in the case of rice starch, and it seems that at low concentrations of rice starch in this mixture, a greater elongation at break is obtained, which is why they are in cluster a. In addition, it is possible to quantify this numerically using the Pearson correlation tables for each of the clusters (Tables S3–S6).
It is important to note that the predictions and observations that can be made from the literature synthesis are not inherently biased (especially on a small scale) since there are a variety of reasons why a component might be advantageous for a certain type of mixture and not for others, or even intrinsic variations in materials testing. To validate the results obtained, the most relevant components that favor each property were compiled in Table 1, together with the background information reported in publications other than those used for the extraction described. This provides a point of reference regarding other investigations of ingredient components and their impact on material performance. Table 1 identifies some of the additives used in combination with seaweed polysaccharide and summarizes their impact on material performance with respect to the other sources. For example, if calcium chloride is used, other sources listed in the table indicate that calcium chloride is associated with improved mechanical strength. This is supported by the data in cluster b in Figure 2b, where the combination of calcium chloride with alginate in the presence of citric acid and gum ghatti demonstrates high tensile strength. In general, we find that the results in the table are consistent with the clustering identified in the extracted data.

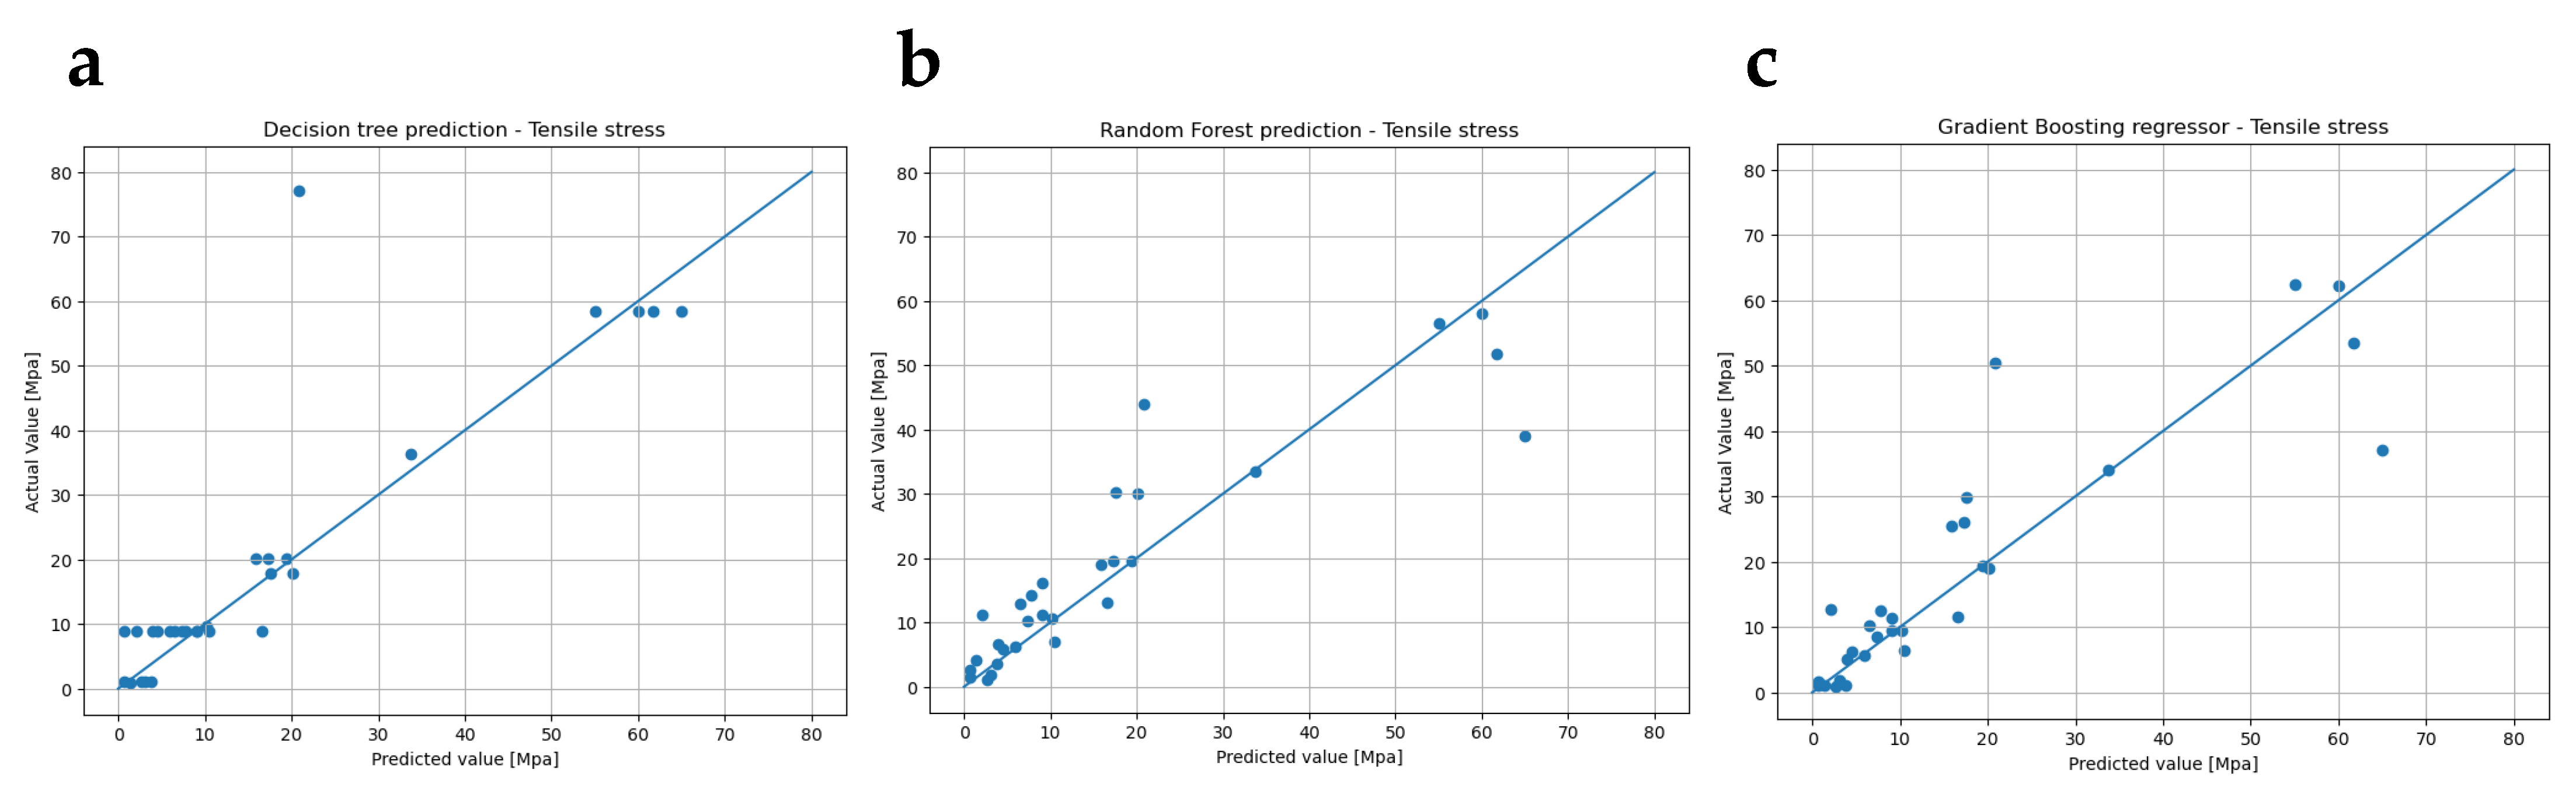
3.2. Regressions Analysis

The regression models used are able to identify the relationships between the components despite their high sparsity and the level of interaction between them, while tree-based regression models have good flexibility in the design of prediction models. The results obtained are shown in Table 2, which shows the performance indicators of the models for the prediction of the tensile strength variables and elongation at break at the same time. In general, it is observed that in all cases, the model is able to fit the training data (which even occurs after overfitting in the case of gradient boosting), which does not imply a good performance ( R 2 ) in the test data as in the case of elongation at break, but in terms of tensile strength, most models are able to explain over 60% of the variance in the test data. In the context of the predictor variables, it is clear that tensile strength is the best modeled, with the highest test  R 2  for random forest (0.821), followed by gradient boosting (0.778), and decision tree (0.661). However, for elongation at break, all models show a substantially lower performance, with the test  R 2  for random forest being the highest with a value of 0.421. When both variables are considered together (tensile strength–elongation at break), the decision tree model has a test  R 2  of 0.555, which is more acceptable than that of gradient boosting, which has a test  R 2  of 0.467. Therefore, it is possible to indicate that the tensile strength variable is more homogeneous than the elongation at break since the algorithms have greater predictive capacity.
When looking all the error metrics in Table 2, it is clear that the variable “Tensile strength” shows considerably lower error values compared to “Elongation at break” in all models. For example, considering the random forest model, the  M S E R M S E M A E M e d A E , and  R M S L E  metrics for “Tensile strength” are 64.310, 8.019, 5.003, 2.632, and 0.468 respectively. These are notably lower than the corresponding values for “Elongation at break”, which are 470.787, 21.698, 11.035, 4.590, and 0.474, respectively. This difference becomes even more evident when we consider the  M e d A E , a metric that is especially robust to outliers. Here, the  M e d A E  for “Tensile strength” with random forest is 2.632, much lower than that of 4.590 for “Elongation at break”. This indicates again that the model is more accurate and less affected by extreme values when predicting tensile strength. Furthermore, if we look at the  R M S L E , which is sensitive to the scale of the target variable, we find that although the values are comparable, they are still slightly lower for “Tensile strength” (0.468 for random forest) compared to “Elongation at break” (0.474 for random forest). This suggests that the model is not only more accurate in absolute terms, but that it also maintains this accuracy over different scales of the target variable. Therefore, a detailed comparison of errors between the predictor variables reveals that the models perform considerably better in predicting tensile strength, both in terms of error magnitude and robustness to outliers and scale variability of the target variable. This observation underscores the importance of data quality in developing and evaluating regression models in sparse data contexts.
It is essential to note that a higher test  R 2  generally suggests a more accurate model, but its interpretation becomes more nuanced when considered in conjunction with other error metrics. In the case of tensile strength, random forest has the highest test  R 2  (0.821), and this correlates well with lower errors in all metrics ( M S E  of 64.310,  R M S E  of 8.019,  M A E  of 5.003,  M e d A E  of 2.632, and  R M S L E  of 0.468). Here, the test  R 2  and error metrics show a consistent proportional relationship, where higher  R 2  means lower errors. However, this relationship is not uniform across all predictor variables nor across all models. For example, in the case of “Elongation at break”, random forest has a test  R 2  of 0.421, which is significantly higher than the  R 2  of gradient boosting, which is 0.156. Despite this large difference in  R 2 , the  M e d A E  for gradient boosting is 3.881, which is lower than the  M e d A E  of 4.590 for random forest. This is a clear case in which a higher test  R 2  does not necessarily imply a lower error in all metrics, underscoring the importance of not relying exclusively on  R 2  to assess model performance. Furthermore, the  R M S L E  metric, which is sensitive to the scale of the target variable, provides unique insight into this relationship. Despite having a lower test  R 2  in “Elongation at break”, gradient boosting shows an  R M S L E  of 0.490, which is comparable to the  R M S L E  of 0.474 for Random Forest. This indicates that although Gradient Boosting may not capture all the variability of the variables, it is relatively accurate at different scales, which is an aspect that the test  R 2  alone could not reveal. Therefore, although there is a general trend in which a higher test  R 2  suggests lower errors, this relationship is neither strictly linear nor uniform. Each error metric brings an additional layer of complexity to this relationship, which makes the interpretation of  R 2  richer and more contextual. It is crucial to consider these metrics together for a more complete and nuanced assessment of model performance, especially in a sparse dataset.
Then, for simplicity Figure 3 shows (a, b, c) the tensile strength prediction graphs for each of the models used. If we use the decision tree model as a reference, the random forest model has an effect on decreasing the variance of the model [92], while the gradient boosting model puts more emphasis on the reduction in bias [43,93].
Therefore, the level of fit is usually good with this type of model. For the results obtained independently of whether both dependent variables are predicted or each one is predicted separately, or the use of different models, the outliers are the most responsible for the increase in bias and the variance of the models. For example, it is no coincidence that the values farthest from the prediction line in Figure 3 are the values with the highest prediction error since they are in the last quintile. Finally, it is important to point out that the most stable model with the extracted data was the random forest model, so its use is recommended for the analysis of scarce and highly dispersed data. This model can be used to optimize the design of biodegradable polymeric materials and to support decision making in the biomaterials manufacturing industry. However, it is important to note that the study was conducted on a small scale and with a limited number of formulations and properties, so further research is needed to validate the results and extend the analysis to a larger dataset.

4. Conclusions

In the present study, we address the analytical challenge of synthesizing biopolymer films from a sparse data matrix. Through the application of advanced clustering algorithms, we sought to explore latent structures within the data, allowing a deeper understanding of the underlying relationships in the synthesis process. In addition, the effectiveness of predictive regression models based on decision trees to predict key properties of the resulting movies is evaluated. In this context, it is important to highlight the relevance of analyzing a limited and sparse dataset. If predictive machine learning techniques are shown to be effective in this type of environment, they could be of great use to entrepreneurs and scientists working with limited amounts of data. These results could provide valuable guidance for their innovation research and development (I + D) efforts in the absence of access to extensive datasets, promoting significant advances in the synthesis of biopolymer films and related fields.
The proposed algorithms are able to handle noisy data and scarce variables, which is crucial when working with complex and heterogeneous datasets. In addition, they can capture nonlinear relationships and handle large datasets, which provides the ability to scale these types of studies and thus achieve more accurate and reliable predictions.
The study identified tensile stress and elongation at break properties as the most recurrent and relevant properties in the analysis of seaweed biopolymer film formulations. This highlights the importance of these properties in the evaluation and design of biodegradable polymeric films. With the help of these predictive models, component concentrations can be obtained, and properties can be predicted efficiently. This enables the acceleration of the development of new biodegradable polymeric materials. The use of machine learning algorithms can significantly improve the efficiency and sustainability of the biopolymer industry by enabling more accurate and reliable predictions of the properties of biopolymer films made from seaweed. Furthermore, the proposed methodology can be extended to other types of biomaterials and can be used to optimize the design of biodegradable polymeric materials for various applications.

Supplementary Materials

The following supporting information can be downloaded at: https://www.mdpi.com/article/10.3390/app132111841/s1, Figure S1: Features count values (A) and standard deviation (B) of each component. Figure S2: Jambu elbow for k-mean clustering. Table S1: Structure of data extraction in table form. Table S2: Pearson correlation for raw data with respect to mechanical properties. Table S3: Pearson correlation for cluster a containing formulations with high elongation at break capacity and low tensile strength. Table S4: Pearson correlation cluster b containing formulations with low elongation at break capacity and medium tensile strength. Table S5: Pearson correlation for cluster c containing formulations with low elongation at break capacity and high tensile strength. Table S6: Pearson correlation for cluster d containing formulations with medium elongation at break capacity and low tensile strength.

Author Contributions

Conceptualization: D.I.-P., V.H.-M., C.S. and A.G.; methodology: D.I.-P., V.H.-M., C.S. and A.G.; software: D.I.-P.; validation: D.I.-P., V.H.-M. and S.F.; formal analysis: D.I.-P. and S.F.; investigation: D.I.-P., V.H.-M., C.S. and S.F.; data curation: D.I.-P.; writing—original draft preparation: D.I.-P., S.F. and A.G.; writing—review and editing: D.I.-P., V.H.-M., A.G. and M.J.G.; visualization: D.I.-P.; supervision: A.G. and M.J.G.; project administration: A.G.; funding acquisition: Universidad de Santiago de Chile. All authors have read and agreed to the published version of the manuscript.

Funding

We would further like to acknowledge the support of ANID, FONDEF—IX Concurso de Investigación Tecnológica, FONDEF/ANID 2020, Folio IT20I0127, POSTDOC_DICYT, Código 032161G_AYUDANTE, Vicerrectoría de Investigación, Desarrollo e Innovación. The authors would like to acknowledge the support of the Department of Management and the Faculty of Management and Economics, University of Santiago of Chile.

Institutional Review Board Statement

Not applicable.

Informed Consent Statement

Not applicable.

Data Availability Statement

The data presented in this study are openly available at https://data.mendeley.com/datasets/wcjwf6gn56/1.

Acknowledgments

We thank the researchers, Felipe Herrera, Thulasi Bikku, Diego Pavez Olave, and Fernanda Veliz for their discussions during the development process of this study.

Conflicts of Interest

The authors declare no conflict of interest.

References

  1. EUR-Lex—52018DC0028—EN—EUR-Lex. (n.d.). Europa.Eu. Available online: https://eur-lex.europa.eu/legal-content/EN/TXT/?uri=COM%3A2018%3A28%3AFIN (accessed on 25 August 2023).
  2. EUR-Lex—52019DC0190—EN—EUR-Lex. (n.d.). Europa.Eu. Available online: https://eur-lex.europa.eu/legal-content/EN/TXT/?uri=CELEX%3A52019DC0190 (accessed on 25 August 2023).
  3. Matthews, C.; Moran, F.; Jaiswal, A.K. A review on European Union’s strategy for plastics in a circular economy and its impact on food safety. J. Clean. Prod. 2021, 283, 125263. [Google Scholar] [CrossRef]
  4. Ahamed, A.; Veksha, A.; Giannis, A.; Lisak, G. Flexible packaging plastic waste—Environmental implications, management solutions, and the way forward. Curr. Opin. Chem. Eng. 2021, 32, 100684. [Google Scholar] [CrossRef]
  5. Prata, J.C.; Silva AL, P.; da Costa, J.P.; Mouneyrac, C.; Walker, T.R.; Duarte, A.C.; Rocha-Santos, T. Solutions and integrated strategies for the control and mitigation of plastic and microplastic pollution. Int. J. Environ. Res. Public Health 2019, 16, 2411. [Google Scholar] [CrossRef]
  6. Foschi, E.; Bonoli, A. The commitment of packaging industry in the framework of the European Strategy for plastics in a circular economy. Adm. Sci. 2019, 9, 18. [Google Scholar] [CrossRef]
  7. Svanes, E.; Vold, M.; Møller, H.; Pettersen, M.K.; Larsen, H.; Hanssen, O.J. Sustainable packaging design: A holistic methodology for packaging design: Sustainable packaging design. Packag. Technol. Sci. 2010, 23, 161–175. [Google Scholar] [CrossRef]
  8. George, A.; Sanjay, M.R.; Srisuk, R.; Parameswaranpillai, J.; Siengchin, S. A comprehensive review on chemical properties and applications of biopolymers and their composites. Int. J. Biol. Macromol. 2020, 154, 329–338. [Google Scholar] [CrossRef]
  9. Ebrahimzadeh, S.; Biswas, D.; Roy, S.; McClements, D.J. Incorporation of essential oils in edible seaweed-based films: A comprehensive review. Trends Food Sci. Technol. 2023, 135, 43–56. [Google Scholar] [CrossRef]
  10. Lomartire, S.; Marques, J.C.; Gonçalves, A.M.M. An overview of the alternative use of seaweeds to produce safe and sustainable bio-packaging. Appl. Sci. 2022, 12, 3123. [Google Scholar] [CrossRef]
  11. Thiruchelvi, R.; Das, A.; Sikdar, E. Bioplastics as better alternative to petro plastic. Mater. Today Proc. 2021, 37, 1634–1639. [Google Scholar] [CrossRef]
  12. Lim, C.; Yusoff, S.; Ng, C.G.; Lim, P.E.; Ching, Y.C. Bioplastic made from seaweed polysaccharides with green production methods. J. Environ. Chem. Eng. 2021, 9, 105895. [Google Scholar] [CrossRef]
  13. Rioux, L.-E.; Turgeon, S.L. Seaweed carbohydrates. In Seaweed Sustainability; Elsevier: Amsterdam, The Netherlands, 2015; pp. 141–192. [Google Scholar]
  14. Schmitz, C.; Auza, L.G.; Koberidze, D.; Rasche, S.; Fischer, R.; Bortesi, L. Conversion of chitin to defined chitosan oligomers: Current status and future prospects. Mar. Drugs 2019, 17, 452. [Google Scholar] [CrossRef]
  15. Chen, H.; Xiao, Q.; Weng, H.; Zhang, Y.; Yang, Q.; Xiao, A. Extraction of sulfated agar from Gracilaria lemaneiformis using hydrogen peroxide-assisted enzymatic method. Carbohydr. Polym. 2020, 232, 115790. [Google Scholar] [CrossRef]
  16. Kadam, S.U.; Álvarez, C.; Tiwari, B.K.; O’Donnell, C.P. Extraction of biomolecules from seaweeds. In Seaweed Sustainability; Elsevier: Amsterdam, The Netherlands, 2015; pp. 243–269. [Google Scholar]
  17. Kadam, S.U.; Álvarez, C.; Tiwari, B.K.; O’Donnell, C.P. Processing of seaweeds. In Seaweed Sustainability; Elsevier: Amsterdam, The Netherlands, 2015; pp. 61–78. [Google Scholar]
  18. Abdul Khalil HP, S.; Tye, Y.Y.; Saurabh, C.K.; Leh, C.P.; Lai, T.K.; Chong, E.W.N.; Nurul Fazita, M.R.; Mohd Hafiidz, J.; Banerjee, A.; Syakir, M.I. Biodegradable polymer films from seaweed polysaccharides: A review on cellulose as a reinforcement material. Express Polym. Lett. 2017, 11, 244–265. [Google Scholar] [CrossRef]
  19. Jumaidin, R.; Sapuan, S.M.; Jawaid, M.; Ishak, M.R.; Sahari, J. Effect of seaweed on mechanical, thermal, and biodegradation properties of thermoplastic sugar palm starch/agar composites. Int. J. Biol. Macromol. 2017, 99, 265–273. [Google Scholar] [CrossRef] [PubMed]
  20. Abdul Khalil HP, S.; Tye, Y.Y.; Ismail, Z.; Leong, J.Y.; Saurabh, C.K.; Lai, T.K.; Chong, E.W.N.; Aditiawati, P.; Tahir, P.M.; Dungani, R. Oil palm shell nanofiller in seaweed-based composite film: Mechanical, physical, and morphological properties. Bioresources 2017, 12, 5996–6010. [Google Scholar] [CrossRef]
  21. Aloui, H.; Deshmukh, A.R.; Khomlaem, C.; Kim, B.S. Novel composite films based on sodium alginate and gallnut extract with enhanced antioxidant, antimicrobial, barrier and mechanical properties. Food Hydrocoll. 2021, 113, 106508. [Google Scholar] [CrossRef]
  22. Nanda, S.; Patra, B.R.; Patel, R.; Bakos, J.; Dalai, A.K. Innovations in applications and prospects of bioplastics and biopolymers: A review. Environ. Chem. Lett. 2022, 20, 379–395. [Google Scholar] [CrossRef]
  23. Nanda, N.; Bharadvaja, N. Algal bioplastics: Current market trends and technical aspects. Clean Technol. Environ. Policy 2022, 24, 2659–2679. [Google Scholar] [CrossRef]
  24. Chia, W.Y.; Ying Tang, D.Y.; Khoo, K.S.; Kay Lup, A.N.; Chew, K.W. Nature’s fight against plastic pollution: Algae for plastic biodegradation and bioplastics production. Environ. Sci. Ecotechnol. 2020, 4, 100065. [Google Scholar] [CrossRef]
  25. Pyzer-Knapp, E.O.; Pitera, J.W.; Staar PW, J.; Takeda, S.; Laino, T.; Sanders, D.P.; Sexton, J.; Smith, J.R.; Curioni, A. Accelerating materials discovery using artificial intelligence, high performance computing and robotics. npj Comput. Mater. 2022, 8, 84. [Google Scholar] [CrossRef]
  26. Himanen, L.; Geurts, A.; Foster, A.S.; Rinke, P. Data-driven materials science: Status, challenges, and perspectives. Adv. Sci. 2019, 6, 1900808. [Google Scholar] [CrossRef] [PubMed]
  27. Suh, C.; Fare, C.; Warren, J.A.; Pyzer-Knapp, E.O. Evolving the materials genome: How machine learning is fueling the next generation of materials discovery. Annu. Rev. Mater. Res. 2020, 50, 1–25. [Google Scholar] [CrossRef]
  28. Sha, W.; Li, Y.; Tang, S.; Tian, J.; Zhao, Y.; Guo, Y.; Zhang, W.; Zhang, X.; Lu, S.; Cao, Y.-C.; et al. Machine learning in polymer informatics. InfoMat 2021, 3, 353–361. [Google Scholar] [CrossRef]
  29. Gormley, A.J.; Webb, M.A. Machine learning in combinatorial polymer chemistry. Nat. Rev. Mater. 2021, 6, 642–644. [Google Scholar] [CrossRef]
  30. Martin, T.B.; Audus, D.J. Emerging trends in machine learning: A polymer perspective. ACS Polym. Au 2023, 3, 239–258. [Google Scholar] [CrossRef]
  31. Kusne, A.G.; Yu, H.; Wu, C.; Zhang, H.; Hattrick-Simpers, J.; DeCost, B.; Sarker, S.; Oses, C.; Toher, C.; Curtarolo, S.; et al. On-the-fly closed-loop materials discovery via Bayesian active learning. Nat. Commun. 2020, 11, 5966. [Google Scholar] [CrossRef]
  32. Unsupervised Learning. In Encyclopedia of Machine Learning and Data Mining; Springer: New York, NY, USA, 2017; p. 1304.
  33. Goldstein, M.; Uchida, S. A comparative evaluation of unsupervised anomaly detection algorithms for multivariate data. PLoS ONE 2016, 11, e0152173. [Google Scholar] [CrossRef]
  34. Li, Z.; Liu, J.; Yang, Y.; Zhou, X.; Lu, H. Clustering-guided sparse structural learning for unsupervised feature selection. IEEE Trans. Knowl. Data Eng. 2014, 26, 2138–2150. [Google Scholar] [CrossRef]
  35. Pandit, A.A.; Pimpale, B.; Dubey, S. A comprehensive review on unsupervised feature selection algorithms. In International Conference on Intelligent Computing and Smart Communication 2019; Springer: Singapore, 2020; pp. 255–266. [Google Scholar]
  36. Syakur, M.A.; Khotimah, B.K.; Rochman EM, S.; Satoto, B.D. Integration K-means clustering method and elbow method for identification of the best customer profile cluster. IOP Conf. Ser. Mater. Sci. Eng. 2018, 336, 012017. [Google Scholar] [CrossRef]
  37. Umargono, E.; Suseno, J.E.; Vincensius Gunawan, S.K. K-means clustering optimization using the elbow method and early centroid determination based on mean and median formula. In Proceedings of the 2nd International Seminar on Science and Technology (ISSTEC 2019), Yogyakarta, Indonesia, 25–26 November 2019. [Google Scholar]
  38. Nainggolan, R.; Perangin-angin, R.; Simarmata, E.; Tarigan, A.F. Improved the performance of the K-means cluster using the Sum of Squared Error (SSE) optimized by using the elbow method. J. Phys. Conf. Ser. 2019, 1361, 012015. [Google Scholar] [CrossRef]
  39. Strehl, A.; Ghosh, J. Relationship-based clustering and visualization for high-dimensional data mining. INFORMS J. Comput. 2003, 15, 208–230. [Google Scholar] [CrossRef]
  40. Navada, A.; Ansari, A.N.; Patil, S.; Sonkamble, B.A. Overview of use of decision tree algorithms in machine learning. In Proceedings of the 2011 IEEE Control and System Graduate Research Colloquium, Shah Alam, Malaysia, 27–28 June 2011. [Google Scholar]
  41. Talekar, B. A detailed review on decision tree and random forest. Biosci. Biotechnol. Res. Commun. 2020, 13, 245–248. [Google Scholar] [CrossRef]
  42. Zhang, Z.; Zhu, X.; Liu, D. Model of gradient boosting random forest prediction. In Proceedings of the 2022 IEEE International Conference on Networking, Sensing and Control (ICNSC), Shanghai, China, 15–18 December 2022. [Google Scholar]
  43. Friedman, J.H. Stochastic gradient boosting. Comput. Stat. Data Anal. 2002, 38, 367–378. [Google Scholar] [CrossRef]
  44. Roy, S.; Kim, H.-J.; Rhim, J.-W. Effect of blended colorants of anthocyanin and shikonin on carboxymethyl cellulose/agar-based smart packaging film. Int. J. Biol. Macromol. 2021, 183, 305–315. [Google Scholar] [CrossRef] [PubMed]
  45. Nascimento, K.M.; Cavalheiro, J.B.; Netto, A.M.; Scapim, M.R.d.S.; Bergamasco, R.d.C. Properties of alginate films incorporated with free and microencapsulated Stryphnodendron adstringens extract (barbatimão). Food Packag. Shelf Life 2021, 28, 100637. [Google Scholar] [CrossRef]
  46. Syafiq, R.; Sapuan, S.M.; Zuhri, M.R.M. Antimicrobial activity, physical, mechanical and barrier properties of sugar palm based nanocellulose/starch biocomposite films incorporated with cinnamon essential oil. J. Mater. Res. Technol. 2021, 11, 144–157. [Google Scholar] [CrossRef]
  47. Guo, Y.; Zhang, B.; Zhao, S.; Qiao, D.; Xie, F. Plasticized starch/agar composite films: Processing, morphology, structure, mechanical properties and surface hydrophilicity. Coatings 2021, 11, 311. [Google Scholar] [CrossRef]
  48. Park, J.; Nam, J.; Yun, H.; Jin, H.-J.; Kwak, H.W. Aquatic polymer-based edible films of fish gelatin crosslinked with alginate dialdehyde having enhanced physicochemical properties. Carbohydr. Polym. 2021, 254, 117317. [Google Scholar] [CrossRef]
  49. Roy, S.; Kim, H.-J.; Rhim, J.-W. Synthesis of carboxymethyl cellulose and agar-based multifunctional films reinforced with cellulose nanocrystals and shikonin. ACS Appl. Polym. Mater. 2021, 3, 1060–1069. [Google Scholar] [CrossRef]
  50. Cheng, T.; Xu, J.; Li, Y.; Zhao, Y.; Bai, Y.; Fu, X.; Gao, X.; Mao, X. Effect of gum ghatti on physicochemical and microstructural properties of biodegradable sodium alginate edible films. J. Food Meas. Charact. 2021, 15, 107–118. [Google Scholar] [CrossRef]
  51. Phinainitisatra, T.; Harnkarnsujarit, N. Development of starch-based peelable coating for edible packaging. Int. J. Food Sci. Technol. 2021, 56, 321–329. [Google Scholar] [CrossRef]
  52. Yaradoddi, J.S.; Banapurmath, N.R.; Ganachari, S.V.; Soudagar, M.E.M.; Mubarak, N.M.; Hallad, S.; Hugar, S.; Fayaz, H. Biodegradable carboxymethyl cellulose based material for sustainable packaging application. Sci. Rep. 2020, 10, 21960. [Google Scholar] [CrossRef] [PubMed]
  53. Avila, L.B.; Barreto, E.R.C.; de Souza, P.K.; Silva, B.D.Z.; Martiny, T.R.; Moraes, C.C.; Morais, M.M.; Raghavan, V.; da Rosa, G.S. Carrageenan-based films incorporated with jaboticaba peel extract: An innovative material for active food packaging. Molecules 2020, 25, 5563. [Google Scholar] [CrossRef] [PubMed]
  54. Fransiska, D.; Giyatmi Basmal, J.; Susanti, E. The effect of organic powdered cottonii concentration and types of plasticizers on the characteristics of edible film. IOP Conf. Ser. Earth Environ. Sci. 2020, 483, 012008. [Google Scholar] [CrossRef]
  55. Chowdhury, S.; Teoh, Y.L.; Ong, K.M.; Rafflisman Zaidi, N.S.; Mah, S.-K. Poly(vinyl) alcohol crosslinked composite packaging film containing gold nanoparticles on shelf life extension of banana. Food Packag. Shelf Life 2020, 24, 100463. [Google Scholar] [CrossRef]
  56. Nagar, M.; Sharanagat, V.S.; Kumar, Y.; Singh, L. Development and characterization of elephant foot yam starch–hydrocolloids based edible packaging film: Physical, optical, thermal and barrier properties. J. Food Sci. Technol. 2020, 57, 1331–1341. [Google Scholar] [CrossRef]
  57. Mahcene, Z.; Khelil, A.; Hasni, S.; Akman, P.K.; Bozkurt, F.; Birech, K.; Goudjil, M.B.; Tornuk, F. Development and characterization of sodium alginate based active edible films incorporated with essential oils of some medicinal plants. Int. J. Biol. Macromol. 2020, 145, 124–132. [Google Scholar] [CrossRef]
  58. Ma, D.; Jiang, Y.; Ahmed, S.; Qin, W.; Liu, Y. Antilisterial and physical properties of polysaccharide-collagen films embedded with cell-free supernatant of Lactococcus lactis. Int. J. Biol. Macromol. 2020, 145, 1031–1038. [Google Scholar] [CrossRef]
  59. Marismandani, A.D.P.; Husni, A. Development and characterization of biobased alginate/glycerol/virgin coconut oil as biodegradable packaging. E3S Web Conf. 2020, 147, 03016. [Google Scholar] [CrossRef]
  60. Racmayani, N.; Husni, A. Effect of different formulations on characteristic of biobased alginate edible films as biodegradable packaging. E3S Web Conf. 2020, 147, 03003. [Google Scholar] [CrossRef]
  61. Dewi, M.Y.; Husni, A. Characterization of biobased alginate/glycerol/sunflower oil as biodegradable packaging. E3S Web Conf. 2020, 147, 03004. [Google Scholar] [CrossRef]
  62. Nazurah, N.F.; Nur Hanani, Z.A. Physicochemical characterization of kappa-carrageenan (Euchema cottoni) based films incorporated with various plant oils. Carbohydr. Polym. 2017, 157, 1479–1487. [Google Scholar] [CrossRef]
  63. Praseptiangga, D.; Fatmala, N.; Manuhara, G.J.; Utami, R.; Khasanah, L.U. Preparation and preliminary characterization of semi refined kappa carrageenan-based edible film incorporated with cinnamon essential oil. AIP Conf. Proc. 2016, 1746, 020036. [Google Scholar]
  64. Eghbalifam, N.; Frounchi, M.; Dadbin, S. Antibacterial silver nanoparticles in polyvinyl alcohol/sodium alginate blend produced by gamma irradiation. Int. J. Biol. Macromol. 2015, 80, 170–176. [Google Scholar] [CrossRef] [PubMed]
  65. Amariei, S.; Ursachi, F.; Petraru, A. Development of new biodegradable agar-alginate membranes for food packaging. Membranes 2022, 12, 576. [Google Scholar] [CrossRef]
  66. Ho, B.K.X.; Azahari, B.; Yhaya, M.F.B.; Talebi, A.; Ng, C.W.C.; Tajarudin, H.A.; Ismail, N. Green technology approach for reinforcement of calcium chloride cured sodium alginate films by isolated bacteria from palm oil mill effluent (POME). Sustainability 2020, 12, 9468. [Google Scholar] [CrossRef]
  67. Kim, H.-J.; Roy, S.; Rhim, J.-W. Gelatin/agar-based color-indicator film integrated with Clitoria ternatea flower anthocyanin and zinc oxide nanoparticles for monitoring freshness of shrimp. Food Hydrocoll. 2022, 124, 107294. [Google Scholar] [CrossRef]
  68. Hoque, M.S.; Benjakul, S.; Prodpran, T. Properties of film from cuttlefish (Sepia pharaonis) skin gelatin incorporated with cinnamon, clove and star anise extracts. Food Hydrocoll. 2011, 25, 1085–1097. [Google Scholar] [CrossRef]
  69. Thakur, R.; Pristijono, P.; Golding, J.B.; Stathopoulos, C.E.; Scarlett, C.; Bowyer, M.; Singh, S.P.; Vuong, Q.V. Effect of starch physiology, gelatinization, and retrogradation on the attributes of rice starch-ι-carrageenan film. Die Starke 2018, 70, 1700099. [Google Scholar] [CrossRef]
  70. de Lima Barizão, C.; Crepaldi, M.I.; de Oliveira S. Junior, O.; de Oliveira, A.C.; Martins, A.F.; Garcia, P.S.; Bonafé, E.G. Biodegradable films based on commercial κ-carrageenan and cassava starch to achieve low production costs. Int. J. Biol. Macromol. 2020, 165, 582–590. [Google Scholar] [CrossRef]
  71. Lim, Z.Q.J.; Tong, S.Y.; Wang, K.; Lim, P.N.; Thian, E.S. Cinnamon oil incorporated polymeric films for active food packaging. Mater. Lett. 2022, 313, 131744. [Google Scholar] [CrossRef]
  72. Castaño, J.; Guadarrama-Lezama, A.Y.; Hernández, J.; Colín-Cruz, M.; Muñoz, M.; Castillo, S. Preparation, characterization and antifungal properties of polysaccharide–polysaccharide and polysaccharide–protein films. J. Mater. Sci. 2017, 52, 353–366. [Google Scholar] [CrossRef]
  73. Tyuftin, A.A.; Wang, L.; Auty, M.A.E.; Kerry, J.P. Development and assessment of duplex and triplex laminated edible films using whey protein isolate, gelatin and sodium alginate. Int. J. Mol. Sci. 2020, 21, 2486. [Google Scholar] [CrossRef] [PubMed]
  74. Sahraee, S.; Milani, J.M.; Ghanbarzadeh, B.; Hamishehkar, H. Effect of corn oil on physical, thermal, and antifungal properties of gelatin-based nanocomposite films containing nano chitin. LWT Food Sci. Technol. 2017, 76, 33–39. [Google Scholar] [CrossRef]
  75. Yang, M.; Shi, J.; Xia, Y. Effect of SiO2, PVA and glycerol concentrations on chemical and mechanical properties of alginate-based films. Int. J. Biol. Macromol. 2018, 107, 2686–2694. [Google Scholar] [CrossRef] [PubMed]
  76. Afshar, M.; Dini, G.; Vaezifar, S.; Mehdikhani, M.; Movahedi, B. Preparation and characterization of sodium alginate/polyvinyl alcohol hydrogel containing drug-loaded chitosan nanoparticles as a drug delivery system. J. Drug Deliv. Sci. Technol. 2020, 56, 101530. [Google Scholar] [CrossRef]
  77. Avila, L.B.; Barreto, E.R.C.; Moraes, C.C.; Morais, M.M.; da Rosa, G.S. Promising new material for food packaging: An active and intelligent carrageenan film with natural jaboticaba additive. Foods 2022, 11, 792. [Google Scholar] [CrossRef]
  78. Nehchiri, N.; Amiri, S.; Radi, M. Improving the water barrier properties of alginate packaging films by submicron coating with drying linseed oil. Packag. Technol. Sci. 2021, 34, 283–295. [Google Scholar] [CrossRef]
  79. Abdin, M.; El-Beltagy, A.E.; El-sayed, M.E.; Naeem, M.A. Production and characterization of sodium alginate/gum Arabic based films enriched with Syzygium cumini seeds extracts for food application. J. Polym. Environ. 2022, 30, 1615–1626. [Google Scholar] [CrossRef]
  80. Tongnuanchan, P.; Benjakul, S.; Prodpran, T.; Nilsuwan, K. Emulsion film based on fish skin gelatin and palm oil: Physical, structural and thermal properties. Food Hydrocoll. 2015, 48, 248–259. [Google Scholar] [CrossRef]
  81. de Campo, C.; Pagno, C.H.; Costa, T.M.H.; Rios, A.d.O.; Flôres, S.H. Gelatin capsule waste: New source of protein to develop a biodegradable film. Polímeros 2017, 27, 100–107. [Google Scholar] [CrossRef]
  82. Hilbig, J.; Hartlieb, K.; Gibis, M.; Herrmann, K.; Weiss, J. Rheological and mechanical properties of alginate gels and films containing different chelators. Food Hydrocoll. 2020, 101, 105487. [Google Scholar] [CrossRef]
  83. Gulati, K.; Lal, S.; Kumar, S.; Arora, S. Effect of agar and walnut (Juglans regia.L) shell fibre addition on thermal stability, water barrier, biodegradability and mechanical properties of corn starch composites. Indian Chem. Eng. 2022, 64, 314–325. [Google Scholar] [CrossRef]
  84. Gutiérrez-Jara, C.; Bilbao-Sainz, C.; McHugh, T.; Chiou, B.-S.; Williams, T.; Villalobos-Carvajal, R. Physical, mechanical and transport properties of emulsified films based on alginate with soybean oil: Effects of soybean oil concentration, number of passes and degree of surface crosslinking. Food Hydrocoll. 2020, 109, 106133. [Google Scholar] [CrossRef]
  85. Sudhakar, M.P.; Magesh Peter, D.; Dharani, G. Studies on the development and characterization of bioplastic film from the red seaweed (Kappaphycus alvarezii). Environ. Sci. Pollut. Res. Int. 2021, 28, 33899–33913. [Google Scholar] [CrossRef]
  86. Davoodi, M.N.; Milani, J.M.; Farahmandfar, R. Preparation and characterization of a novel biodegradable film based on sulfated polysaccharide extracted from seaweed Ulva intestinalis. Food Sci. Nutr. 2021, 9, 4108–4116. [Google Scholar] [CrossRef]
  87. Roy, S.; Rhim, J.-W. Preparation of gelatin/carrageenan-based color-indicator film integrated with shikonin and Propolis for smart food packaging applications. ACS Appl. Bio Mater. 2021, 4, 770–779. [Google Scholar] [CrossRef]
  88. Zhang, J.; Huang, X.; Shi, J.; Liu, L.; Zhang, X.; Zou, X.; Xiao, J.; Zhai, X.; Zhang, D.; Li, Y.; et al. A visual bi-layer indicator based on roselle anthocyanins with high hydrophobic property for monitoring griskin freshness. Food Chem. 2021, 355, 129573. [Google Scholar] [CrossRef]
  89. Yan, J.; Zhang, H.; Yuan, M.; Qin, Y.; Chen, H. Effects of anthocyanin-rich Kadsura coccinea extract on the physical, antioxidant, and pH-sensitive properties of biodegradable film. Food Biophys. 2022, 17, 375–385. [Google Scholar] [CrossRef]
  90. Alves, M.C.M.A.; Nascimento, M.F.; de Almeida, B.M.; Alves, M.M.A.; Lima-Verde, I.B.; Costa, D.S.; Araújo, D.C.M.; de Paula, M.N.; de Mello, J.C.P.; Cano, A.; et al. Hydrophilic Scaffolds Containing Extracts of Stryphnodendron adstringens and Abarema cochliacarpa for Wound Healing: In Vivo Proofs of Concept. Pharmaceutics 2022, 14, 2150. [Google Scholar] [CrossRef]
  91. Wang, S.; Gao, Z.; Liu, L.; Li, M.; Zuo, A.; Guo, J. Preparation, in vitro and in vivo evaluation of chitosan-sodium alginate-ethyl cellulose polyelectrolyte film as a novel buccal mucosal delivery vehicle. Eur. J. Pharm. Sci. 2022, 168, 106085. [Google Scholar] [CrossRef] [PubMed]
  92. Genuer, R. Variance reduction in purely random forests. J. Nonparametr. Stat. 2012, 24, 543–562. [Google Scholar] [CrossRef]
  93. Natekin, A.; Knoll, A. Gradient boosting machines, a tutorial. Front. Neurorobotics 2013, 7, 21. [Google Scholar] [CrossRef] [PubMed]
Figure 1. Principal component visualization of clusters; it shows how each formulation is represented in the two principal components.
Applsci 13 11841 g001
Figure 2. Components and composition of normalized data distribution of (a) cluster containing formulations with high elongation at break capacity and low tensile strength, (b) cluster b containing formulations with low elongation at break capacity and medium tensile strength, (c) cluster c containing formulations with low elongation at break capacity and high tensile strength, and (d) cluster d containing formulations with medium elongation at break capacity and low tensile strength.
Applsci 13 11841 g002
Figure 3. Tensile stress evaluations for (a) decision tree prediction, (b) random forest prediction, and (c) gradient boosting prediction.
Applsci 13 11841 g003
Table 1. Identifies some of the complementary components to the seaweed polysaccharide base and interprets their results with respect to property materials.
PropertyIngredientDescriptionReferences
Elongation at BreakCalcium chlorideThe addition of calcium chloride of 0.08 g (1.6 wt.%) improves mechanical properties of membranes due to the network that is formed between calcium ions and carboxyl groups of alginate, but this is not necessarily the case in the elongation at break.[65,66]
GelatinIntermolecular interaction of gelatin–agar strengthened the film, showing an increase in elongation at break due to the intermolecular forces between two polymer chains.[67,68]
Rice and cassava starchCarrageenan films blended with rice or cassava starch showed significantly higher elongation at break due to strong binding forces in the compact crystalline region formed as a result of starch retrogradation.[69,70]
Essential oil of cinnamonThe incorporation of essential oil of cinnamon into poly-ε-caprolactone led to a reduction in the stretching ability of the film. Cinnamon agents tend to slightly lower values of elongation at break in polysaccharide films.[71,72]
Corn oilThe addition of corn oil improved mechanical properties of films based on protein isolate, gelatin, and sodium alginate, but this is not necessarily the case in the elongation at break.[73,74]
Polyvinyl alcohol (PVA)Alginate-based films shown an increase in elongation at break due to the addition of PVA.[75,76]
Jaboticaba peelThe addition of jaboticaba peel in the polymeric matrix film based on carrageenan promoted a reduction in elongation at break.[77]
Sunflower oilThe addition of sunflower oil did not change the mechanical properties of alginate films. The highest concentration of Syzygium cumini seeds extract caused lower values of elongation at break in alginate/gum arabic films.[78,79]
Olive oilThe addition of plant oils to the formulation substantially increased elongation at break.[62,80]
Virgin coconut oilCoconut oil provided films with higher flexibility and higher elongation at break values of gelatin-based films.[81]
Tensile StrengthGum ghattiThe addition of gum ghatti in biodegradable sodium alginate edible films increased the tensile strength.[50]
Citric acidThe addition of citric acid significantly decreased the TS of the casing of alginate films.[82,83]
Soybean oilThe tensile strength decreased with increasing oil concentrations due to the plasticizing effect from oil of alginate films.[84]
PolyethyleneGlycol (PEG)PEG is used as a plasticizer, improving the mechanical properties of bioplastic film from seaweeds.[85,86]
ShikoninShikonin is used as a reinforcement. The gelatin/carrageenan film’s mechanical properties did not change significantly by shikonin. But the incorporation into carboxymetyl cellulose/agar films slightly improved tensile strength, showing a reinforcing effect.[49,87]
AnthocyaninAddition of roselle anthocyanin showed a plasticizing effect in polyvinylidene fluoride films. However, Kadsura coccinea extract added to a chitosan, gelatin, and sodium alginate film increased tensile strength.[88,89]
Starch extractA decrease in tensile strength was observed in starch/agar composite films.[19,47]
Barbatimao extract (Stryphnodendron adstringens)The incorporation of Stryphnodendron adstringens extract improved mechanical properties of gelatin membranes.[90]
Cellulose extractThe chitosan-sodium alginate-ethyl cellulose polyelectrolyte films showed high tensile strength.[91]
Cottonni extractEucheuma cottonii extract was incorporated as a biofiller to improve tensile strength values of starch/agar composite films.[19]
Table 2. Errors and predictive capability of the proposed regression models.
Predicted Variable(s)Model Predictive R 2  Train R 2  Test   M S E   R M S E   M A E   M e d A E   R M S L E
Tensile strengthDecision tree0.9610.661121.99811.0454.6262.4910.559
Random forest0.9390.82164.3108.0195.0032.6320.468
Gradient boosting0.9990.77879.8918.9385.2012.1620.465
Elongation at breakDecision tree0.5060.276588.67524.26317.97313.9450.764
Random forest0.9310.421470.78721.69811.0354.5900.474
Gradient boosting0.9970.156686.07526.19311.8863.8810.490
Tensile strength–elongation at breakDecision tree0.5360.555281.60616.08611.3336.9500.609
Random forest0.9300.650232.91914.3248.5403.8010.555
Gradient boosting0.9960.467408.51617.0868.3412.4280.433
Disclaimer/Publisher’s Note: The statements, opinions and data contained in all publications are solely those of the individual author(s) and contributor(s) and not of MDPI and/or the editor(s). MDPI and/or the editor(s) disclaim responsibility for any injury to people or property resulting from any ideas, methods, instructions or products referred to in the content.

