
Spatial Patterns and Multi-Dimensional Impact Analysis of Urban Street Quality Perception under Multi-Source Data: A Case Study of Wuchang District in Wuhan, China

Abstract
:1. Introduction
2. Literature Review
2.1. Perceived Spatial Quality of Urban Streets
2.2. Application of Big Data Tools in Urban Spatial Research
2.3. Trends in Urban Street Perception Research and the Innovativeness of This Study
3. Data and Methodology
3.1. Research Framework
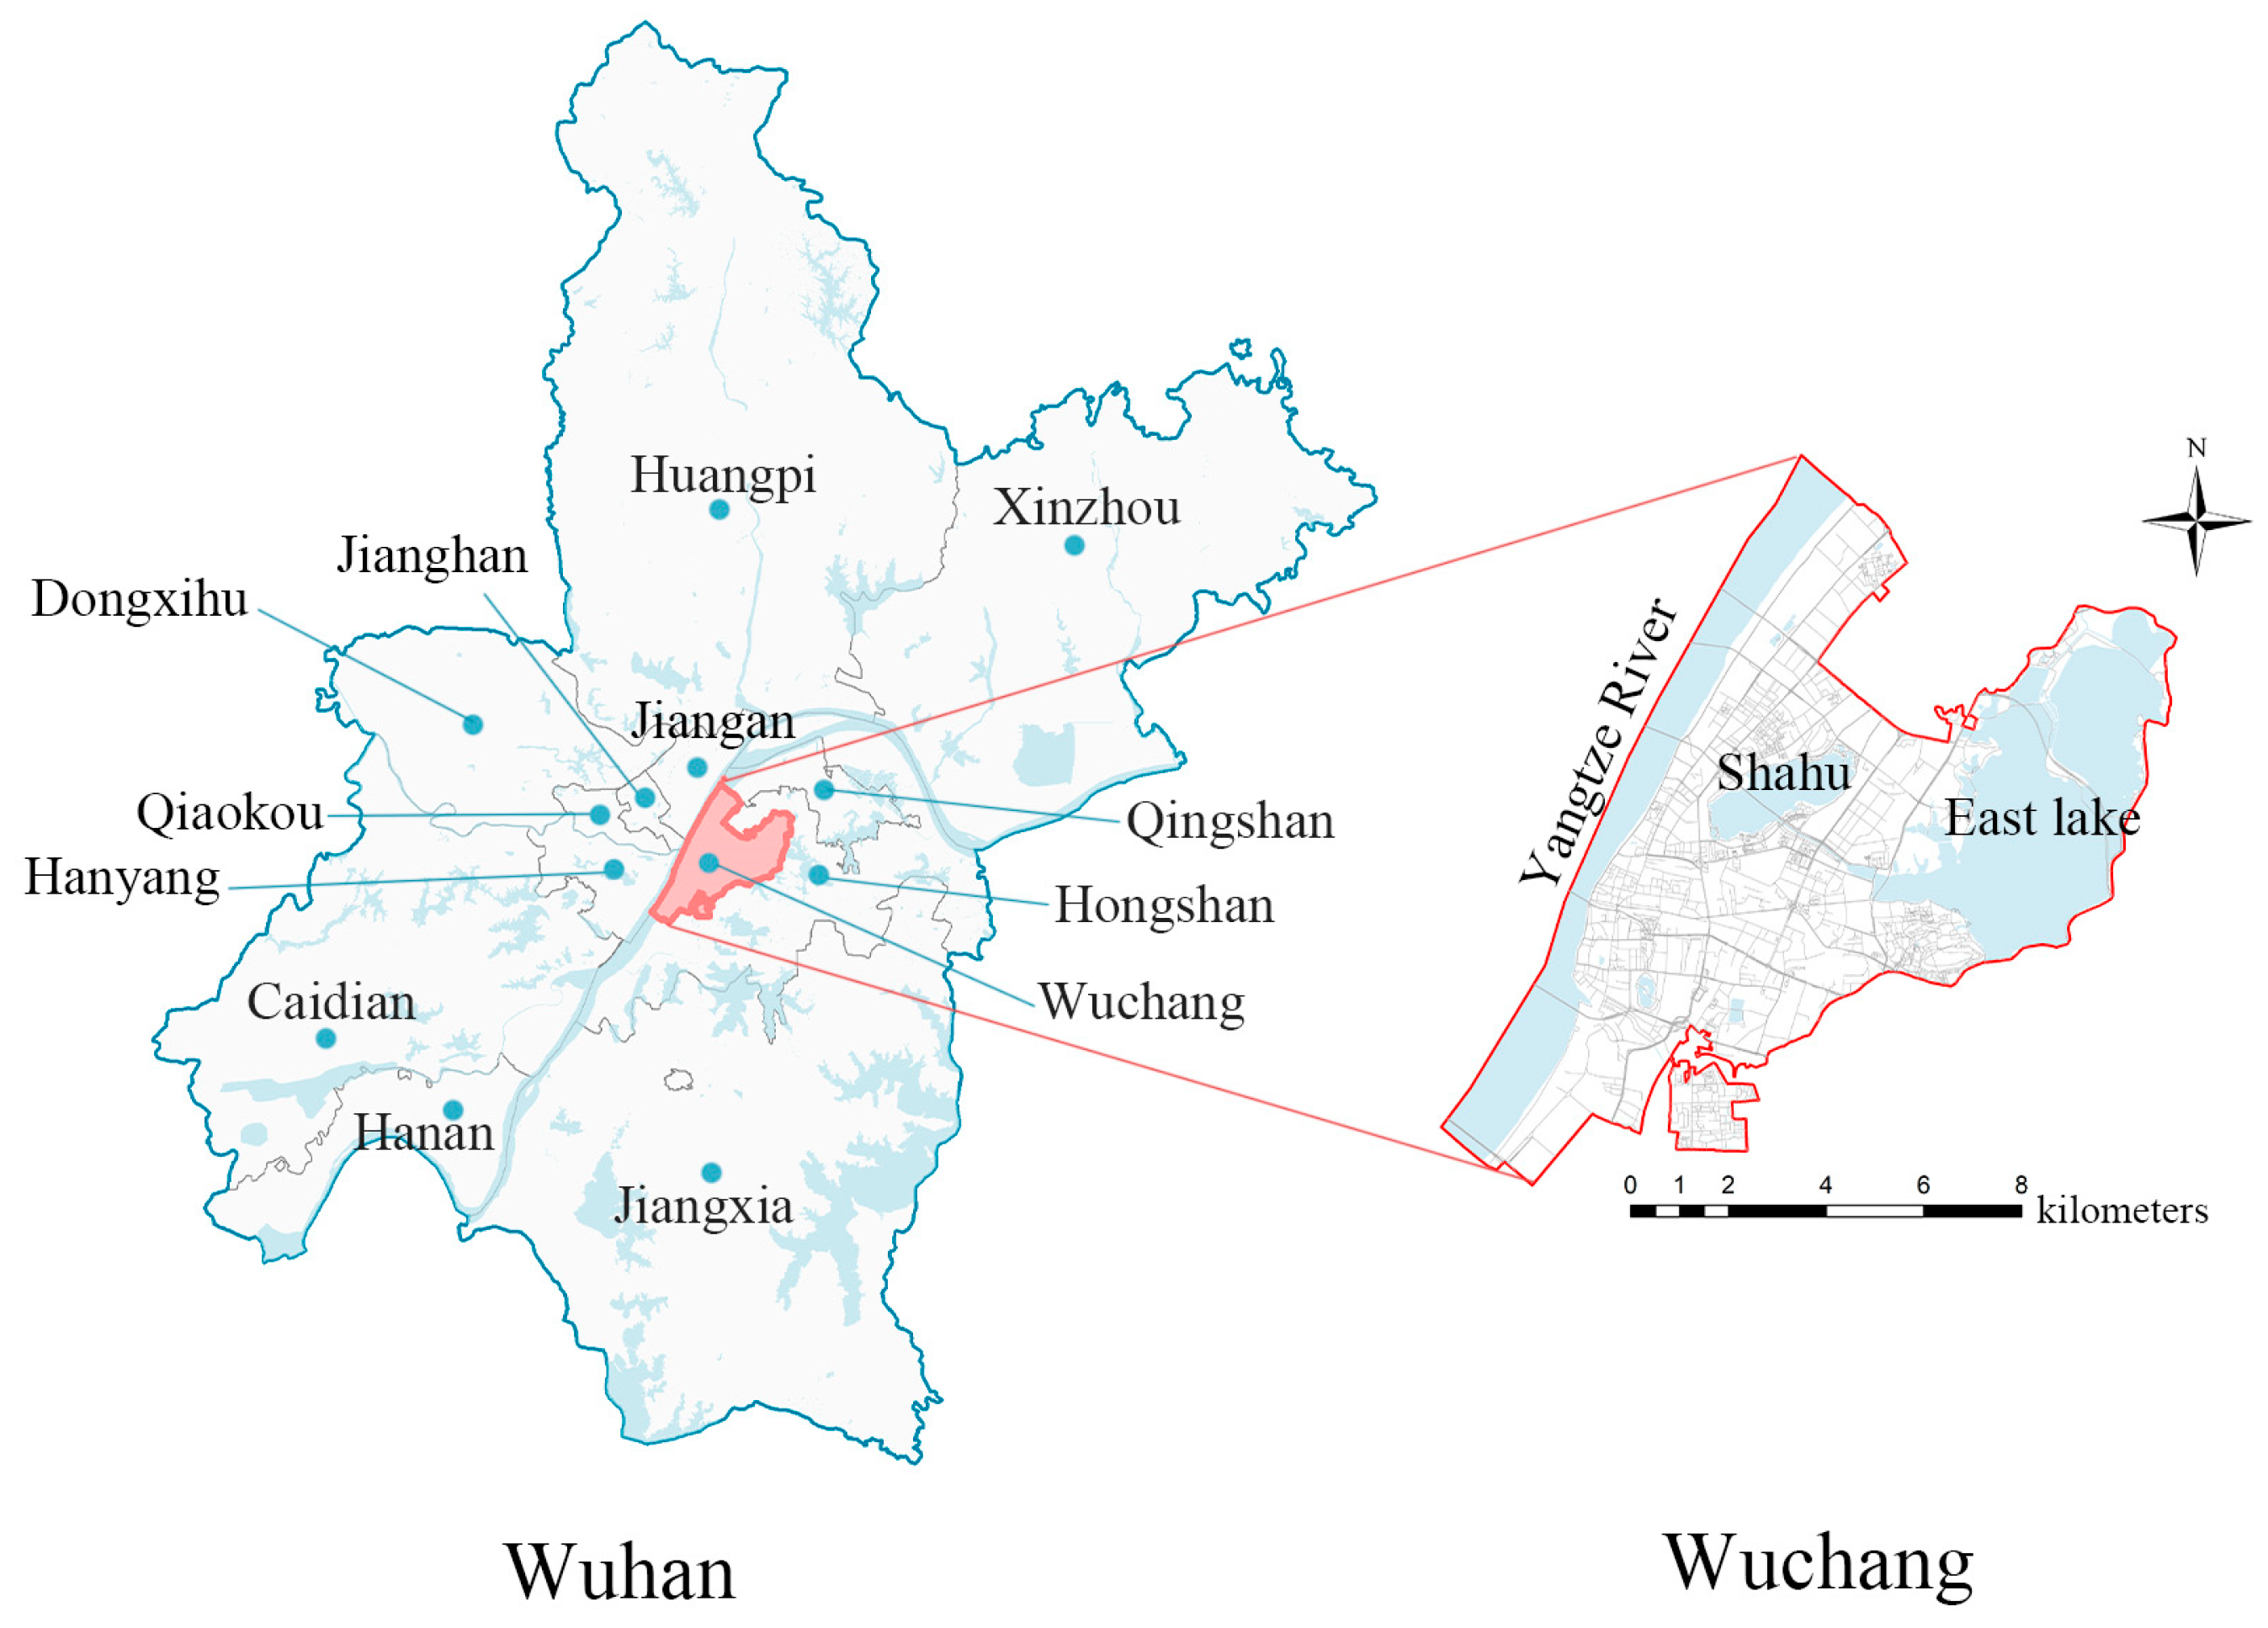
3.2. Study Area
3.3. Acquisition of Research Data
3.4. Semantic Segmentation and Spatial Measurement Index Calculation of Street-View Images Based on Deep Learning
3.5. Convolutional Neural Network-Based Scoring and Spatial Pattern Study for Scene Perception
3.6. Study on the Correlation of Multi-Dimensional Elements of Spatial Quality of Urban Streets
4. Results and Analysis
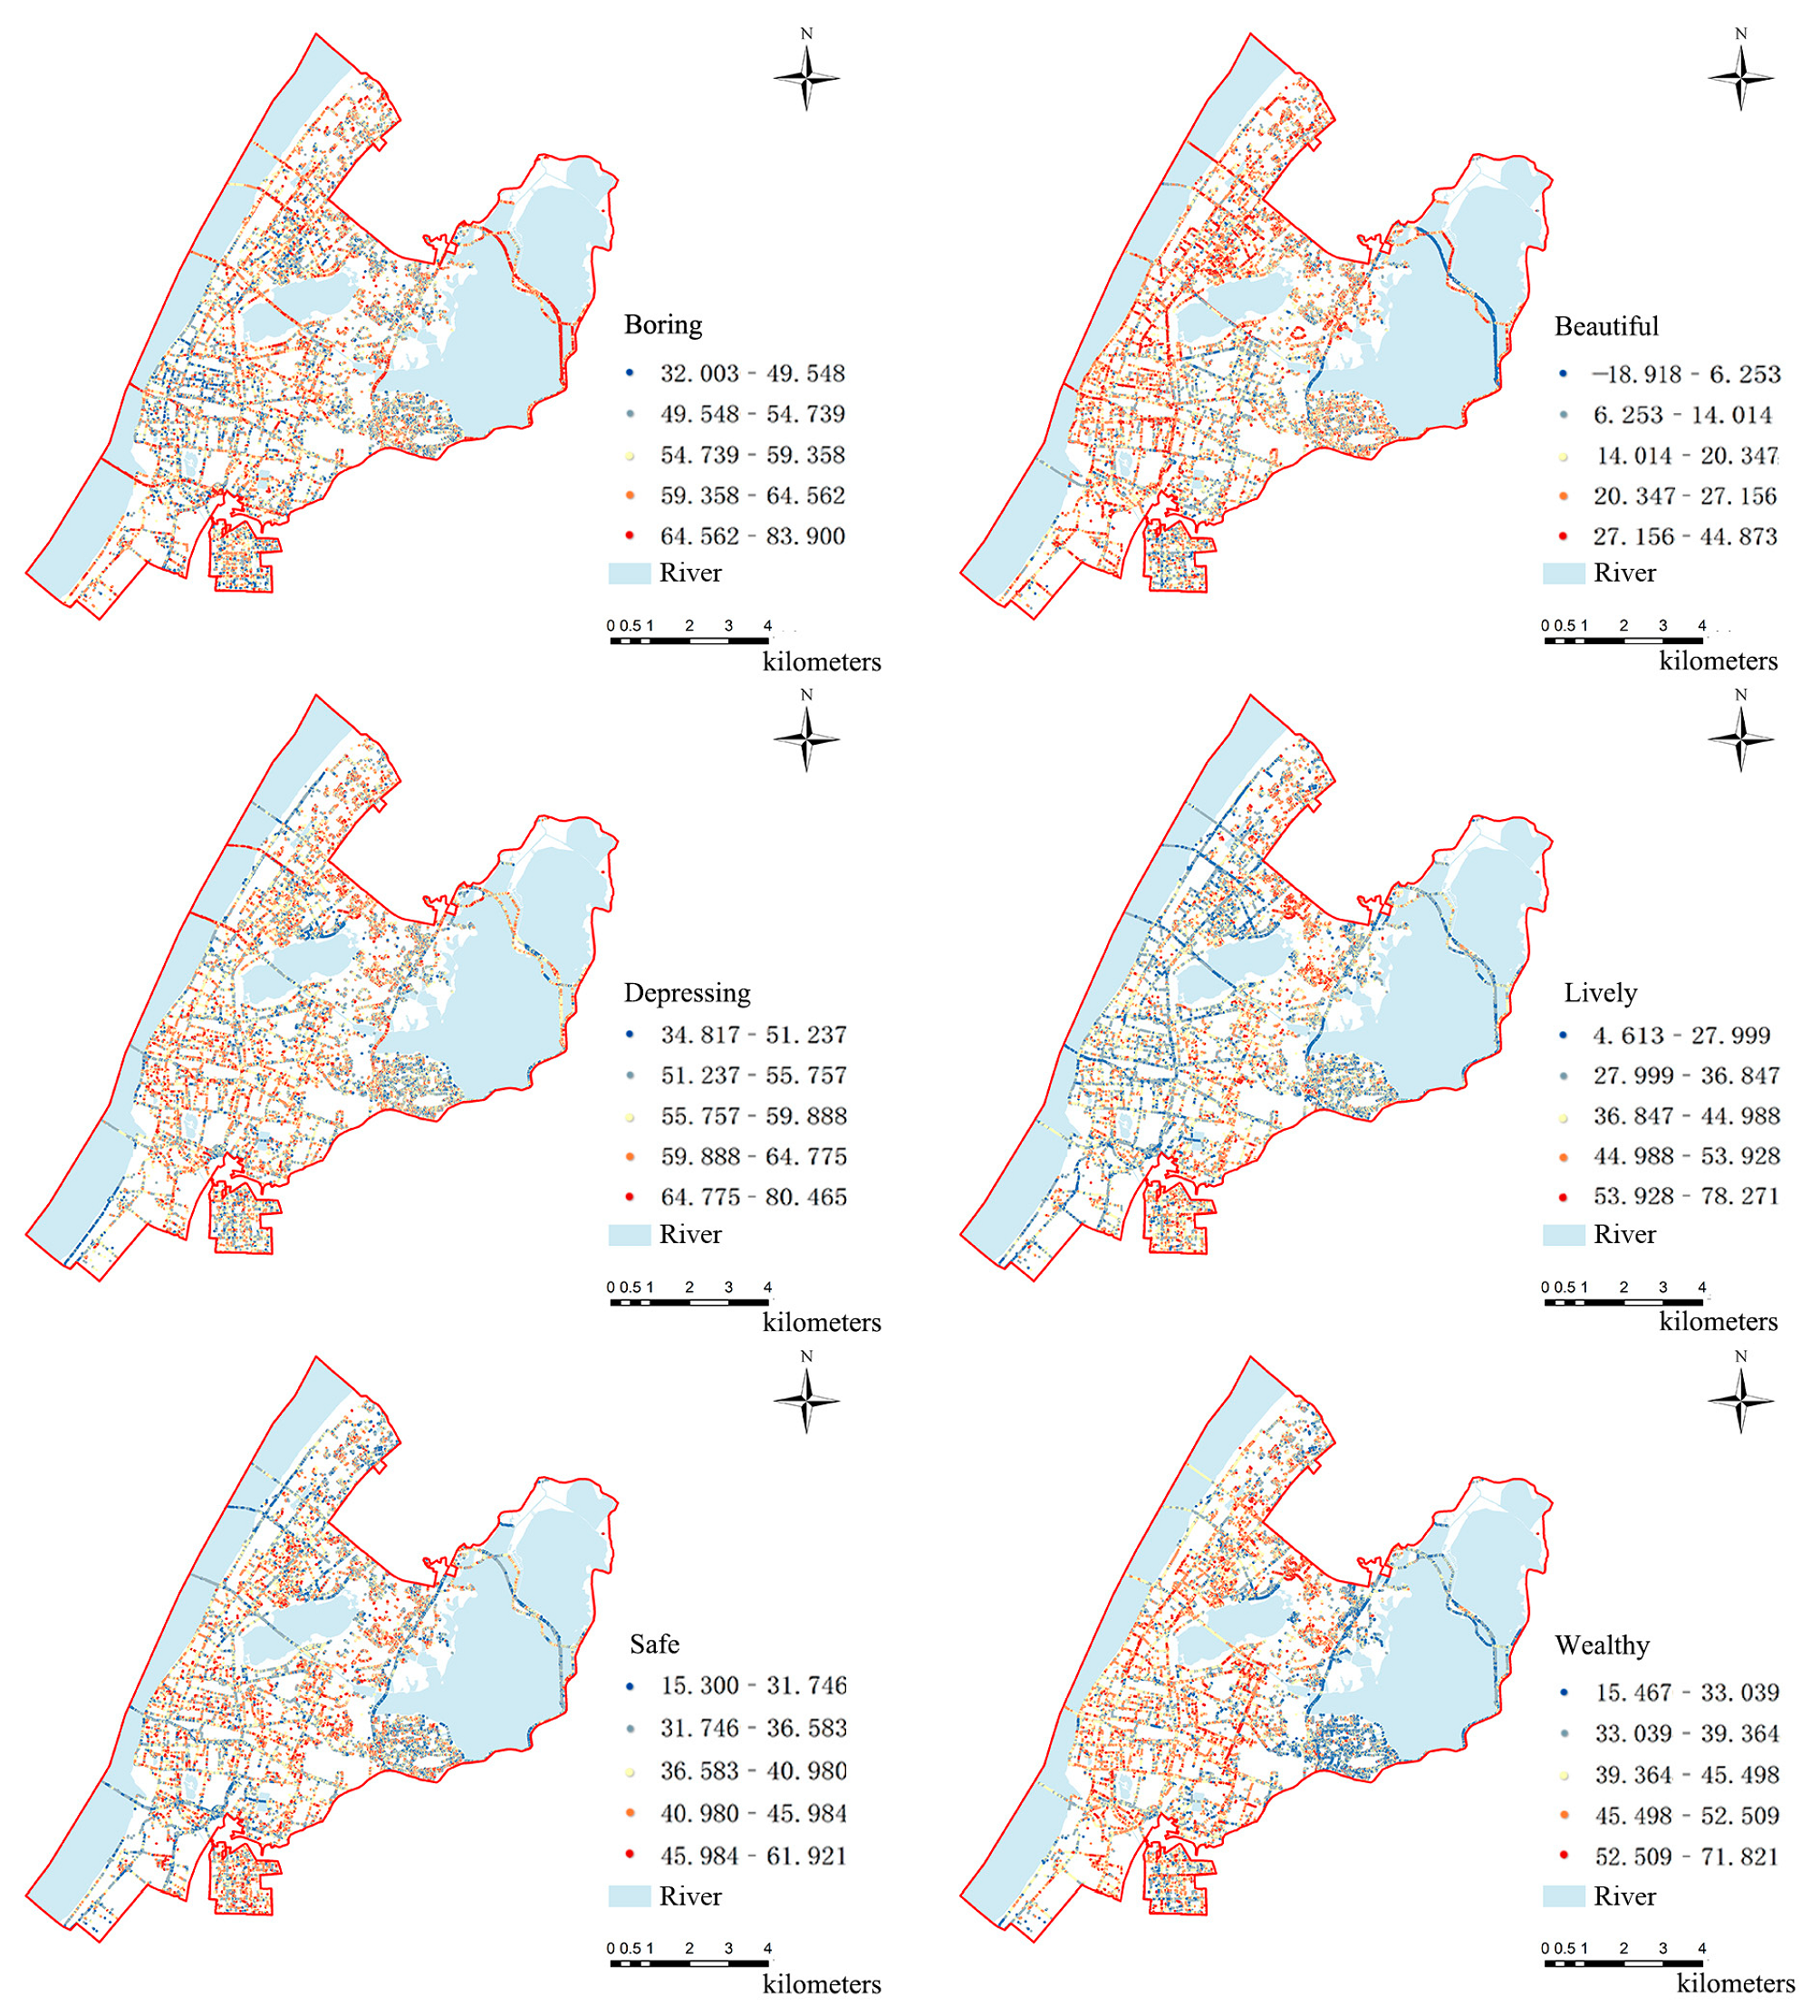
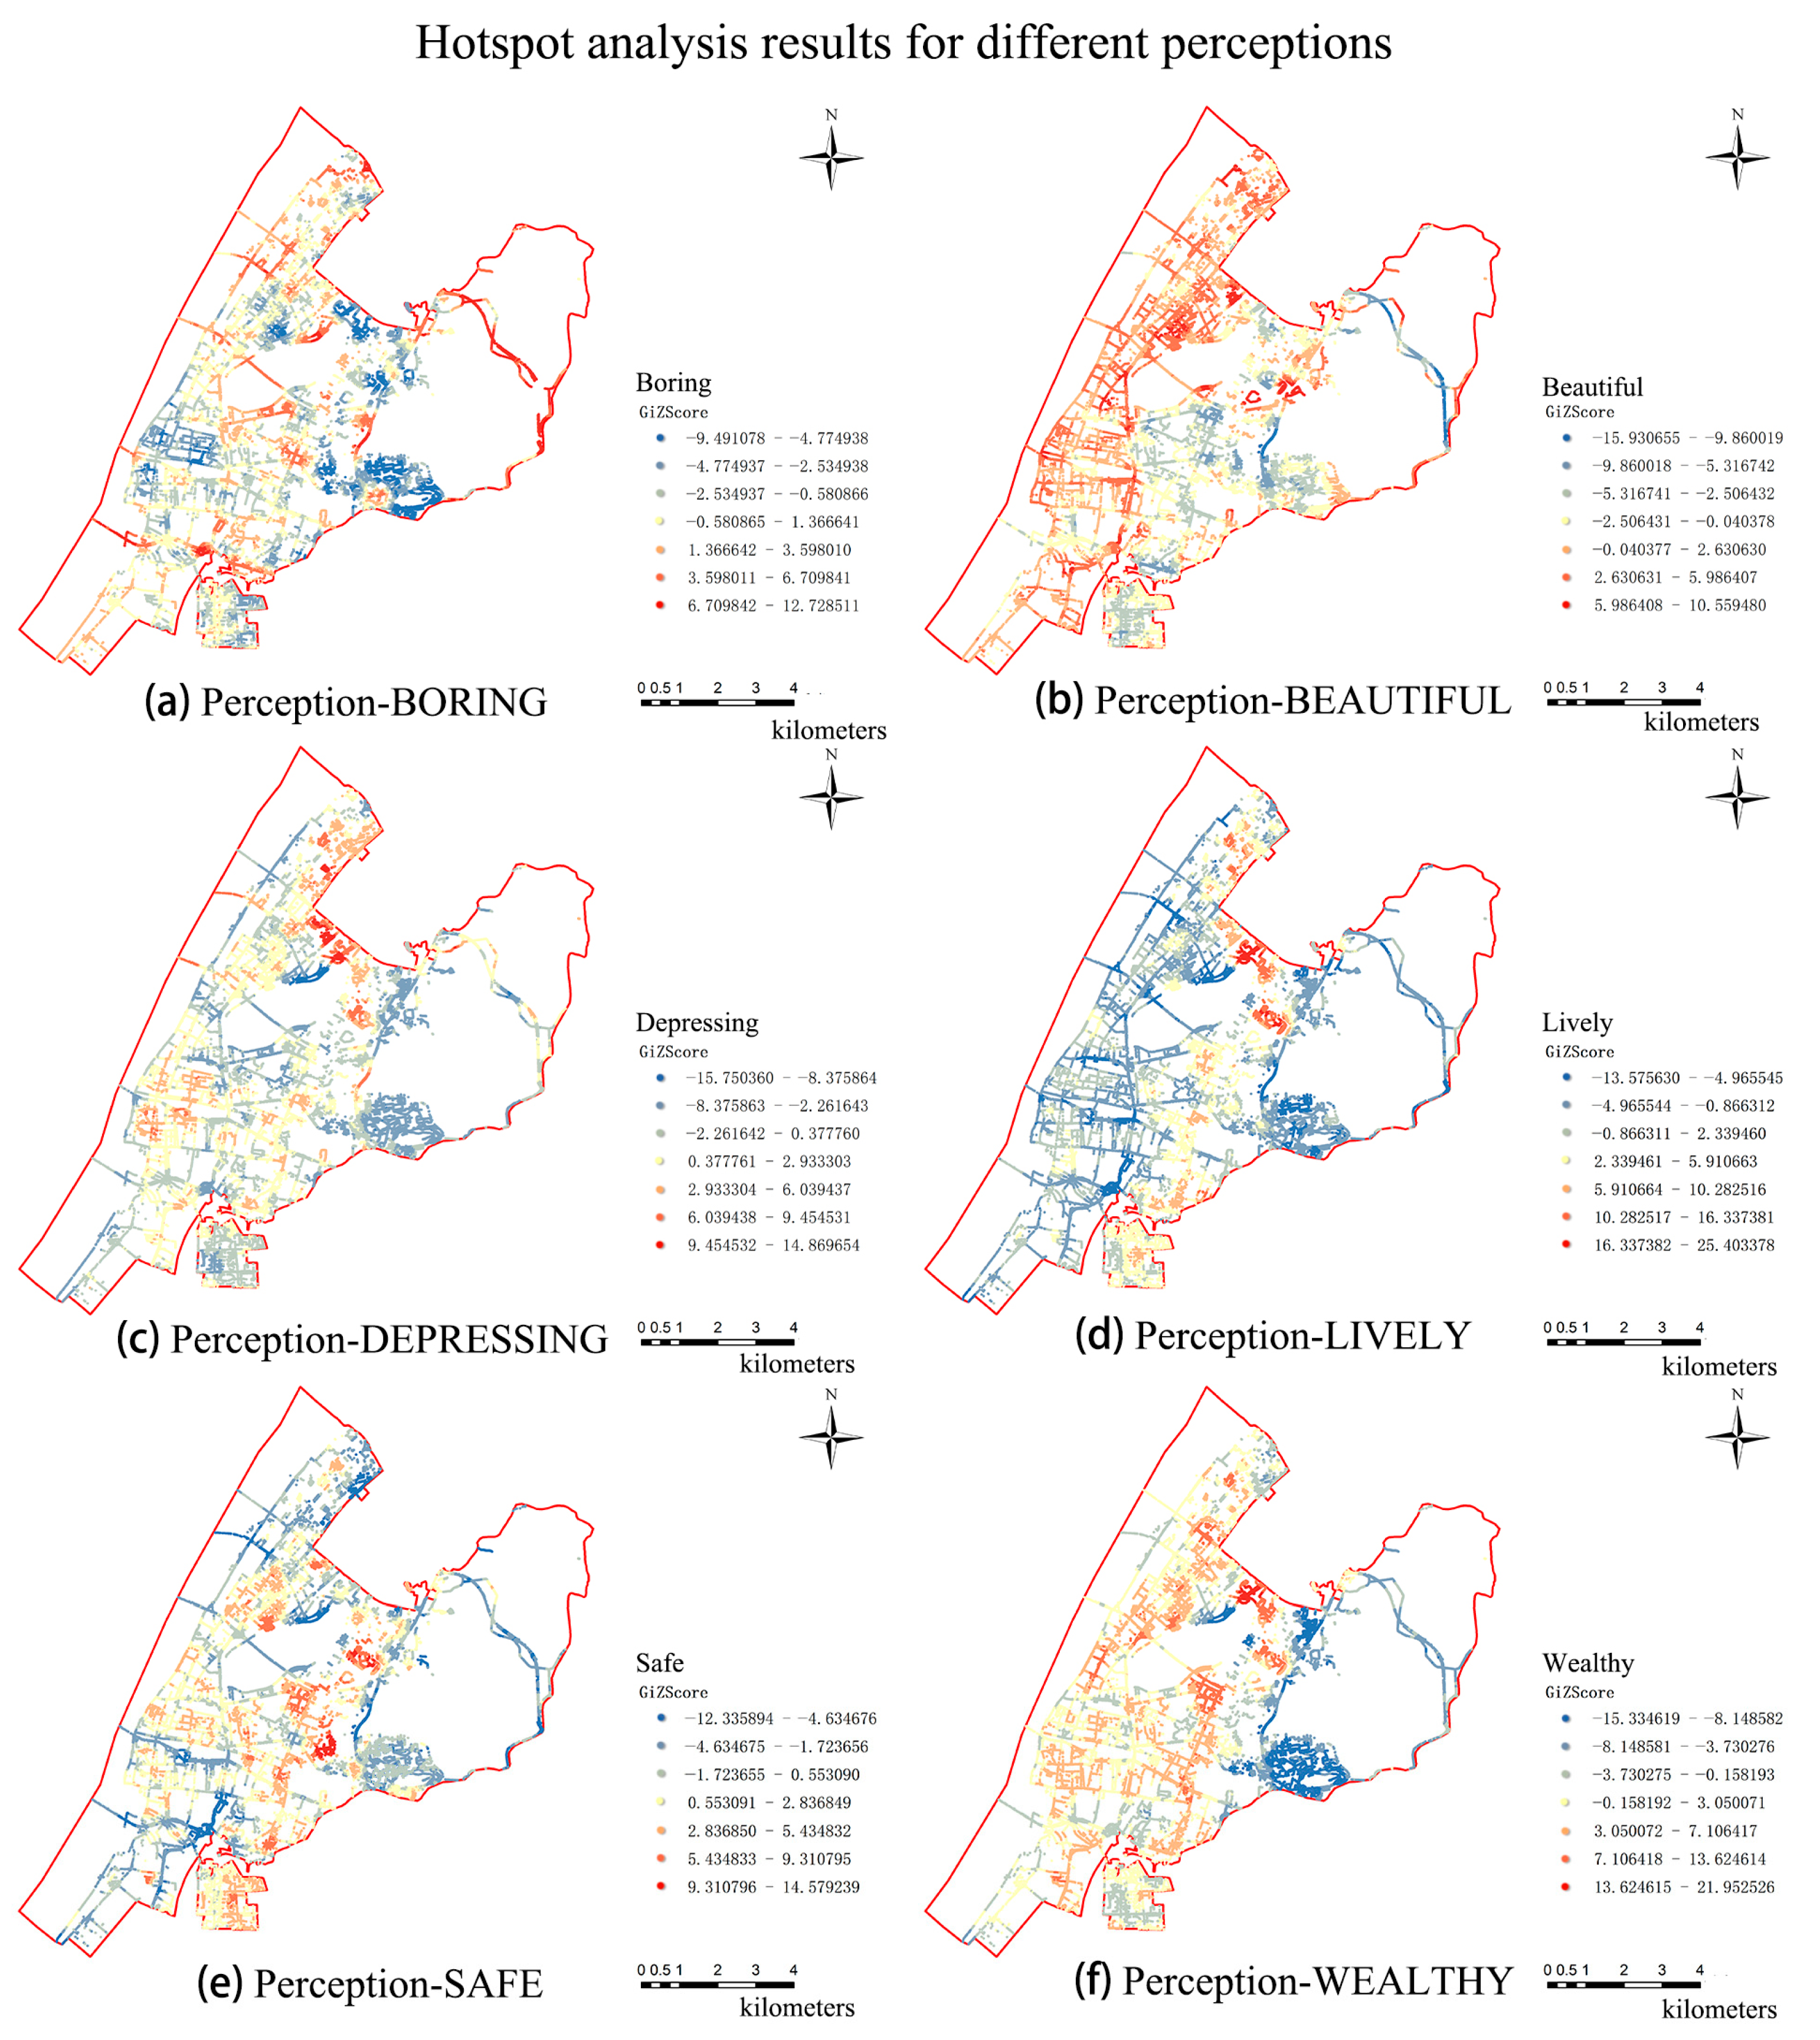
4.1. Analysis of Spatial Patterns of Perceived Spatial Quality in Urban Streets
4.2. Results and Analysis of Regression Analysis of the Spatial Quality of Urban Streets and Urban Amenity Points
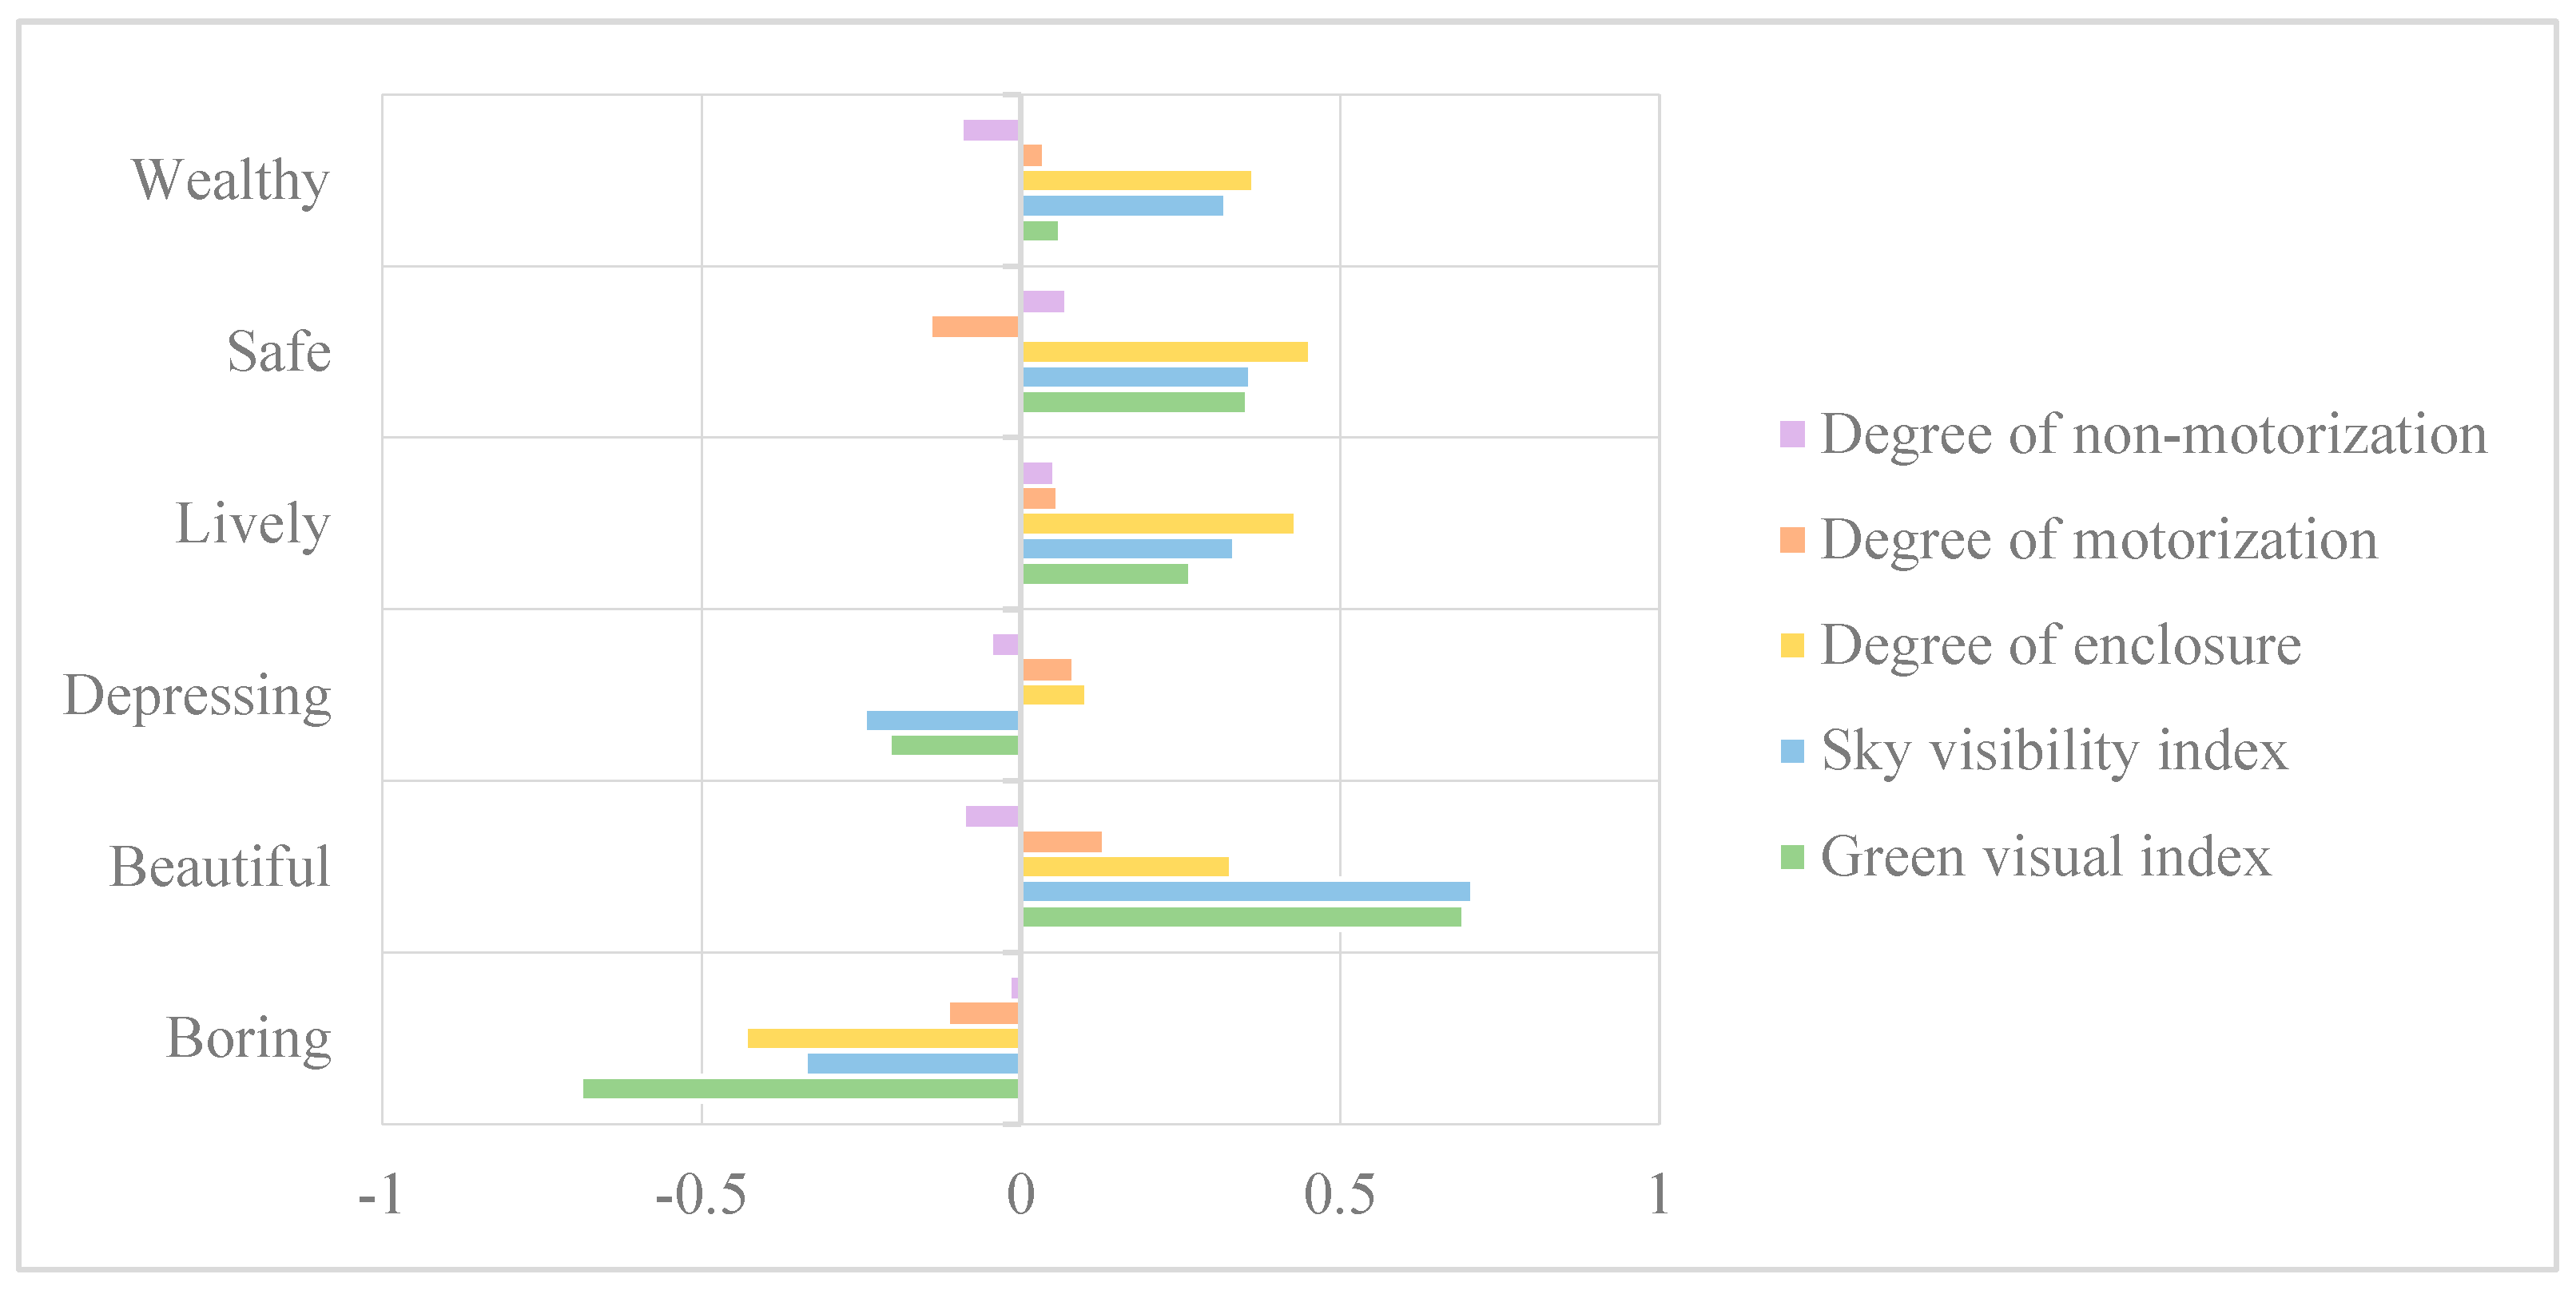
4.3. Analysis of the Impact of Spatial Visual Elements on the Spatial Quality of Urban Streets
5. Discussion
5.1. The Aggregation Characteristics of the Urban Street Spatial Perception Score in Spatial Pattern
5.2. Discussion on the Difference of Factors Affecting the Perception of Street-Space Quality at the Level of Urban Facilities
5.3. Discussion of the Differences of Factors Influencing the Spatial Quality of Urban Streets at the Urban Micro Scale
6. Conclusions
Author Contributions
Funding
Institutional Review Board Statement
Informed Consent Statement
Data Availability Statement
Conflicts of Interest
References
- Eini, R.; Linkous, L.; Zohrabi, N.; Abdelwahed, S. Smart Building Management System: Performance Specifications and Design Requirements. J. Build. Eng. 2021, 39, 102222. [Google Scholar] [CrossRef]
- Selvaraj, R.; Kuthadi, V.M.; Baskar, S. Smart Building Energy Management and Monitoring System Based on Artificial Intelligence in Smart City. Sustain. Energy Technol. Assess. 2023, 56, 103090. [Google Scholar] [CrossRef]
- Verma, R. Smart City Healthcare Cyber Physical System: Characteristics, Technologies and Challenges. Wirel. Pers. Commun. 2022, 122, 1413–1433. [Google Scholar] [CrossRef] [PubMed]
- Oladimeji, D.; Gupta, K.; Kose, N.A.; Gundogan, K.; Ge, L.; Liang, F. Smart Transportation: An Overview of Technologies and Applications. Sensors 2023, 23, 3880. [Google Scholar] [CrossRef] [PubMed]
- Chen, S.; Biljecki, F. Automatic Assessment of Public Open Spaces Using Street View Imagery. Cities 2023, 137, 104329. [Google Scholar] [CrossRef]
- Zhang, F.; Wu, L.; Zhu, D.; Liu, Y. Social Sensing from Street-Level Imagery: A Case Study in Learning Spatio-Temporal Urban Mobility Patterns. ISPRS J. Photogramm. Remote Sens. 2019, 153, 48–58. [Google Scholar] [CrossRef]
- Zhou, H.; Wang, J.; Wilson, K. Impacts of Perceived Safety and Beauty of Park Environments on Time Spent in Parks: Examining the Potential of Street View Imagery and Phone-Based GPS Data. Int. J. Appl. Earth Obs. Geoinf. 2022, 115, 103078. [Google Scholar] [CrossRef]
- Lu, Y.; Ferranti, E.J.S.; Chapman, L.; Pfrang, C. Assessing Urban Greenery by Harvesting Street View Data: A Review. Urban For. Urban Green. 2023, 83, 127917. [Google Scholar] [CrossRef]
- Pelizari, P.A.; Geiß, C.; Aguirre, P.; María, H.S.; Peña, Y.M.; Taubenböck, H. Automated Building Characterization for Seismic Risk Assessment Using Street-Level Imagery and Deep Learning. ISPRS J. Photogramm. Remote Sens. 2021, 180, 370–386. [Google Scholar] [CrossRef]
- Wang, N. Literature review. Tour. Geogr. 2001, 3, 236–241. [Google Scholar] [CrossRef]
- Yu, Z. Regulation of Urban Character: Style, Colour and Historic Character in a Modern Chinese City—The Case of Harbin. Ph.D. Thesis, The University of Manchester, Manchester, UK, 2013. [Google Scholar]
- Krizhevsky, A.; Sutskever, I.; Hinton, G.E. ImageNet Classification with Deep Convolutional Neural Networks. Commun. ACM 2017, 60, 84–90. [Google Scholar] [CrossRef]
- Lynch, K. The Image of the City; MIT Press: Cambridge, MA, USA, 1964. [Google Scholar]
- Ashihara, Y. The Aesthetics Townscape; Huazhong University of Science and Technology Press: Wuhan, China, 1989. [Google Scholar]
- Gehl, J. Life between Buildings: Using Public Space; Island Press: Washington, DC, USA, 2012; ISBN 978-1-61091-023-1. [Google Scholar]
- Cullen, G. Concise Townscape; Taylor & Francis: Abingdon, UK, 2012; ISBN 978-1-136-02089-6. [Google Scholar]
- Carmona, M. Public Places Urban Spaces: The Dimensions of Urban Design; Taylor & Francis: Abingdon, UK, 2021; ISBN 978-1-351-65661-0. [Google Scholar]
- Tavassolian, G.; Nazari, M. Studying Legibility Perception and Pedestrian Place in Urban Identification. Int. J. Sci. Technol. Soc. 2015, 3, 112. [Google Scholar] [CrossRef]
- Singh, N.; Katiyar, S.K. Application of Geographical Information System (GIS) in Reducing Accident Blackspots and in Planning of a Safer Urban Road Network: A Review. Ecol. Inform. 2021, 66, 101436. [Google Scholar] [CrossRef]
- Li, Y.; Yabuki, N.; Fukuda, T. Integrating GIS, Deep Learning, and Environmental Sensors for Multicriteria Evaluation of Urban Street Walkability. Landsc. Urban Plan. 2023, 230, 104603. [Google Scholar] [CrossRef]
- Sitte, C. The Art of Building Cities: City Building According to Its Artistic Fundamentals; Ravenio Books: Oakland, CA, USA, 1979. [Google Scholar]
- Aoki, Y. Relationship between Percieved Greenery and Width of Visual Fields. J. Jpn. Inst. Landsc. Archit. 1987, 51, 1–10. [Google Scholar] [CrossRef]
- Oke, T.R. Canyon Geometry and the Nocturnal Urban Heat Island: Comparison of Scale Model and Field Observations. J. Climatol. 1981, 1, 237–254. [Google Scholar] [CrossRef]
- Shanghai Municipal Administration of Planning and Land Resources. Technical Guidelines for Detailed Planning of Shanghai Municipal Control. Available online: https://hd.ghzyj.sh.gov.cn/zcfg/ghbz/201701/P020170111543883631659.pdf (accessed on 7 December 2016).
- Bentley, I. Responsive Environments: A Manual for Designers; Architectural Press: New York, NY, USA; Elsevier Limited: Oxford, UK, 2010; ISBN 978-0-08-096620-5. [Google Scholar]
- Moughtin, C. Urban Design: Street and Square; Architectural Press: New York, NY, USA, 2003; ISBN 978-0-7506-5717-4. [Google Scholar]
- Cinnamon, J.; Jahiu, L. Panoramic Street-Level Imagery in Data-Driven Urban Research: A Comprehensive Global Review of Applications, Techniques, and Practical Considerations. ISPRS Int. J. Geo-Inf. 2021, 10, 471. [Google Scholar] [CrossRef]
- Xu, H.; Zhu, J.; Wang, Z. Exploring the Spatial Pattern of Urban Block Development Based on POI Analysis: A Case Study in Wuhan, China. Sustainability 2019, 11, 6961. [Google Scholar] [CrossRef]
- Tang, L.; Lin, Y.; Li, S.; Li, S.; Li, J.; Ren, F.; Wu, C. Exploring the Influence of Urban Form on Urban Vibrancy in Shenzhen Based on Mobile Phone Data. Sustainability 2018, 10, 4565. [Google Scholar] [CrossRef]
- Biljecki, F.; Ito, K. Street View Imagery in Urban Analytics and GIS: A Review. Landsc. Urban Plan. 2021, 215, 104217. [Google Scholar] [CrossRef]
- Li, X.; Chen, D. A Survey on Deep Learning-Based Panoptic Segmentation. Digit. Signal Process. 2022, 120, 103283. [Google Scholar] [CrossRef]
- Xu, J.; Lu, K.; Wang, H. Attention Fusion Network for Multi-Spectral Semantic Segmentation. Pattern Recognit. Lett. 2021, 146, 179–184. [Google Scholar] [CrossRef]
- Yan, X.; Zhang, H.; Wu, Y.; Lin, C.; Liu, S. Construction Instance Segmentation (CIS) Dataset for Deep Learning-Based Computer Vision. Autom. Constr. 2023, 156, 105083. [Google Scholar] [CrossRef]
- Nagata, S.; Nakaya, T.; Hanibuchi, T.; Amagasa, S.; Kikuchi, H.; Inoue, S. Objective Scoring of Streetscape Walkability Related to Leisure Walking: Statistical Modeling Approach with Semantic Segmentation of Google Street View Images. Health Place 2020, 66, 102428. [Google Scholar] [CrossRef] [PubMed]
- Xia, Y.; Yabuki, N.; Fukuda, T. Sky View Factor Estimation from Street View Images Based on Semantic Segmentation. Urban Clim. 2021, 40, 100999. [Google Scholar] [CrossRef]
- Tu, X.; Fu, C.; Huang, A.; Chen, H.; Ding, X. DBSCAN Spatial Clustering Analysis of Urban “Production–Living–Ecological” Space Based on POI Data: A Case Study of Central Urban Wuhan, China. Int. J. Environ. Res. Public. Health 2022, 19, 5153. [Google Scholar] [CrossRef] [PubMed]
- Wu, Z.; Yu, Z.; Song, X.; Li, Y.; Cao, X.; Yuan, Y. A Methodology for Assessing and Mapping Pressure of Human Activities on Coastal Region Based on Stepwise Logic Decision Process and GIS Technology. Ocean Coast. Manag. 2016, 120, 80–87. [Google Scholar] [CrossRef]
- Kucukpehlivan, T.; Cetin, M.; Aksoy, T.; Kurkcuoglu, M.A.S.; Cabuk, S.N.; Pekkan, O.I.; Dabanli, A.; Cabuk, A. Determination of the Impacts of Urban-Planning of the Urban Land Area Using GIS Hotspot Analysis. Comput. Electron. Agric. 2023, 210, 107935. [Google Scholar] [CrossRef]
- Stefan Fina, J.J.; Wittowsky, D. Monitoring Travel Patterns in German City Regions with the Help of Mobile Phone Network Data. Int. J. Digit. Earth 2021, 14, 379–399. [Google Scholar] [CrossRef]
- Dai, L.; Zheng, C.; Dong, Z.; Yao, Y.; Wang, R.; Zhang, X.; Ren, S.; Zhang, J.; Song, X.; Guan, Q. Analyzing the Correlation between Visual Space and Residents’ Psychology in Wuhan, China Using Street-View Images and Deep-Learning Technique. City Environ. Interact. 2021, 11, 100069. [Google Scholar] [CrossRef]
- Çalışkan, B. Factors Making a Street a Vibrant Place: Comparing Street Users’ Vibrancy Perception between Main Street, Fort Worth, Texas, USA and Inonu Boulevard, Sivas, Turkey. Master’s Thesis, The University of Texas, Arlington, MA, USA, 2017. [Google Scholar]
- Jeong, N.-R.; Han, S.-W.; Ko, B. Understanding Urban Residents’ Perceptions of Street Trees to Develop Sustainable Maintenance Guidelines in the Seoul Metropolitan Area, Korea. Forests 2023, 14, 837. [Google Scholar] [CrossRef]
- Lu, S.; Shi, C.; Yang, X. Impacts of Built Environment on Urban Vitality: Regression Analyses of Beijing and Chengdu, China. Int. J. Environ. Res. Public. Health 2019, 16, 4592. [Google Scholar] [CrossRef] [PubMed]
- Lyu, M.; Meng, Y.; Gao, W.; Yu, Y.; Ji, X.; Li, Q.; Huang, G.; Sun, D. Measuring the Perceptual Features of Coastal Streets: A Case Study in Qingdao, China. Environ. Res. Commun. 2022, 4, 115002. [Google Scholar] [CrossRef]
- Xu, J.; Xiong, Q.; Jing, Y.; Xing, L.; An, R.; Tong, Z.; Liu, Y.; Liu, Y. Understanding the Nonlinear Effects of the Street Canyon Characteristics on Human Perceptions with Street View Images. Ecol. Indic. 2023, 154, 110756. [Google Scholar] [CrossRef]
- Wu, C.; Ye, Y.; Gao, F.; Ye, X. Using Street View Images to Examine the Association between Human Perceptions of Locale and Urban Vitality in Shenzhen, China. Sustain. Cities Soc. 2023, 88, 104291. [Google Scholar] [CrossRef]
- Larkin, A.; Gu, X.; Chen, L.; Hystad, P. Predicting Perceptions of the Built Environment Using GIS, Satellite and Street View Image Approaches. Landsc. Urban Plan. 2021, 216, 104257. [Google Scholar] [CrossRef]
- Zhang, F.; Zhou, B.; Liu, L.; Liu, Y.; Fung, H.H.; Lin, H.; Ratti, C. Measuring Human Perceptions of a Large-Scale Urban Region Using Machine Learning. Landsc. Urban Plan. 2018, 180, 148–160. [Google Scholar] [CrossRef]
- Yao, Y.; Liang, Z.; Yuan, Z.; Liu, P.; Bie, Y.; Zhang, J.; Wang, R.; Wang, J.; Guan, Q. A Human-Machine Adversarial Scoring Framework for Urban Perception Assessment Using Street-View Images. Int. J. Geogr. Inf. Sci. 2019, 33, 2363–2384. [Google Scholar] [CrossRef]
- Wuchang Overview. Available online: https://www.wuchang.gov.cn/zjwc/ (accessed on 9 June 2023).
- Wuhan Municipal Urban-Rural Development Bureau Notice of the Municipal Urban Construction Bureau on the Issuance of the Technical Guidelines for the Construction of All Elements of Urban Streets in Wuhan (for Trial Implementation). Available online: https://cjw.wuhan.gov.cn/zwgk_11915/zcfgyjd_11923/tzgg_11932/202204/t20220424_1960875.html (accessed on 24 March 2022).
- Yang, D.; Du, Y.; Yao, H.; Bao, L. Image Semantic Segmentation with Hierarchical Feature Fusion Based on Deep Neural Network. Connect. Sci. 2022, 34, 1772–1784. [Google Scholar] [CrossRef]
- Arnab, A.; Jayasumana, S.; Zheng, S.; Torr, P.H.S. Higher Order Conditional Random Fields in Deep Neural Networks. In Proceedings of the Computer Vision–ECCV 2016, Amsterdam, The Netherlands, 11–14 October 2016; Leibe, B., Matas, J., Sebe, N., Welling, M., Eds.; Springer International Publishing: Cham, Switzerland, 2016; pp. 524–540. [Google Scholar]
- Badrinarayanan, V.; Kendall, A.; Cipolla, R. SegNet: A Deep Convolutional Encoder-Decoder Architecture for Image Segmentation. IEEE Trans. Pattern Anal. Mach. Intell. 2017, 39, 2481–2495. [Google Scholar] [CrossRef]
- Zhao, H.; Shi, J.; Qi, X.; Wang, X.; Jia, J. Pyramid Scene Parsing Network. arXiv 2017, arXiv:1612.01105. [Google Scholar]
- Ma, B.; Hauer, R.J.; Xu, C.; Li, W. Visualizing Evaluation Model of Human Perceptions and Characteristic Indicators of Landscape Visual Quality in Urban Green Spaces by Using Nomograms. Urban For. Urban Green. 2021, 65, 127314. [Google Scholar] [CrossRef]
- Shi, S.; Gou, Z.; Chen, L.H.C. How Does Enclosure Influence Environmental Preferences? A Cognitive Study on Urban Public Open Spaces in Hong Kong. Sustain. Cities Soc. 2014, 13, 148–156. [Google Scholar] [CrossRef]
- Sun, D.; Ji, X.; Gao, W.; Zhou, F.; Yu, Y.; Meng, Y.; Yang, M.; Lin, J.; Lyu, M. The Relation between Green Visual Index and Visual Comfort in Qingdao Coastal Streets. Buildings 2023, 13, 457. [Google Scholar] [CrossRef]
- Hodul, M.; Knudby, A.; Ho, H.C. Estimation of Continuous Urban Sky View Factor from Landsat Data Using Shadow Detection. Remote Sens. 2016, 8, 568. [Google Scholar] [CrossRef]
- Olabarría, M.; Pérez, K.; Santamariña-Rubio, E.; Novoa, A.M.; Racioppi, F. Effect of Neighbourhood Motorization Rates on Walking Levels. Eur. J. Public Health 2015, 25, 740–747. [Google Scholar] [CrossRef]
- Brunsdon, C.; Fotheringham, A.S.; Charlton, M.E. Geographically Weighted Regression: A Method for Exploring Spatial Nonstationarity. Geogr. Anal. 1996, 28, 281–298. [Google Scholar] [CrossRef]
- Fu, X.; Jia, T.; Zhang, X.; Li, S.; Zhang, Y. Do Street-Level Scene Perceptions Affect Housing Prices in Chinese Megacities? An Analysis Using Open Access Datasets and Deep Learning. PLoS ONE 2019, 14, e0217505. [Google Scholar] [CrossRef]

| Maximum | Minimum | Average | Standard Deviation | |
|---|---|---|---|---|
| road | 0.723 | 0.016 | 0.188 | 0.068 |
| sidewalk | 0.140 | 0.000 | 0.017 | 0.017 |
| building | 0.681 | 0.000 | 0.151 | 0.101 |
| wall | 0.172 | 0.000 | 0.005 | 0.009 |
| fence | 0.133 | 0.000 | 0.007 | 0.011 |
| vegetation | 0.713 | 0.000 | 0.205 | 0.154 |
| sky | 0.480 | 0.000 | 0.200 | 0.123 |
| person | 0.189 | 0.000 | 0.010 | 0.008 |
| rider | 0.025 | 0.000 | 0.001 | 0.001 |
| car | 0.983 | 0.000 | 0.191 | 0.064 |
| truck | 0.186 | 0.000 | 0.007 | 0.013 |
| bus | 0.115 | 0.000 | 0.001 | 0.005 |
| motorcycle | 0.048 | 0.000 | 0.002 | 0.004 |
| bicycle | 0.059 | 0.000 | 0.002 | 0.003 |
| Average | Maximum | Minimum | Standard Deviation | |
|---|---|---|---|---|
| boring | 57.81194 | 85.11137 | 23.5317 | 6.27788 |
| beautiful | 17.61704 | 54.10796 | −22.4117 | 7.96088 |
| depressing | 56.69106 | 91.56737 | 34.66571 | 5.30669 |
| lively | 37.11306 | 86.62331 | 2.01155 | 9.80697 |
| safe | 37.37488 | 61.92188 | 15.30053 | 5.68273 |
| wealthy | 41.92913 | 79.03056 | 10.92321 | 7.75064 |
| Boring | Beautiful | Depressing | Lively | Safe | Wealthy | |
|---|---|---|---|---|---|---|
| Moran’s I | 0.125 | 0.122 | 0.131 | 0.257 | 0.126 | 0.336 |
| z-score | 157.58 | 153.67 | 165.64 | 323.54 | 159.10 | 424.31 |
| p-value | 0.000 | 0.000 | 0.000 | 0.000 | 0.000 | 0.000 |
| Boring | Beautiful | Depressing | Lively | Safe | Wealthy | |
|---|---|---|---|---|---|---|
| Local R2 | 0.398 | 0.388 | 0.414 | 0.413 | 0.419 | 0.422 |
| Boring | Beautiful | Depressing | Lively | Safe | Wealthy | |
|---|---|---|---|---|---|---|
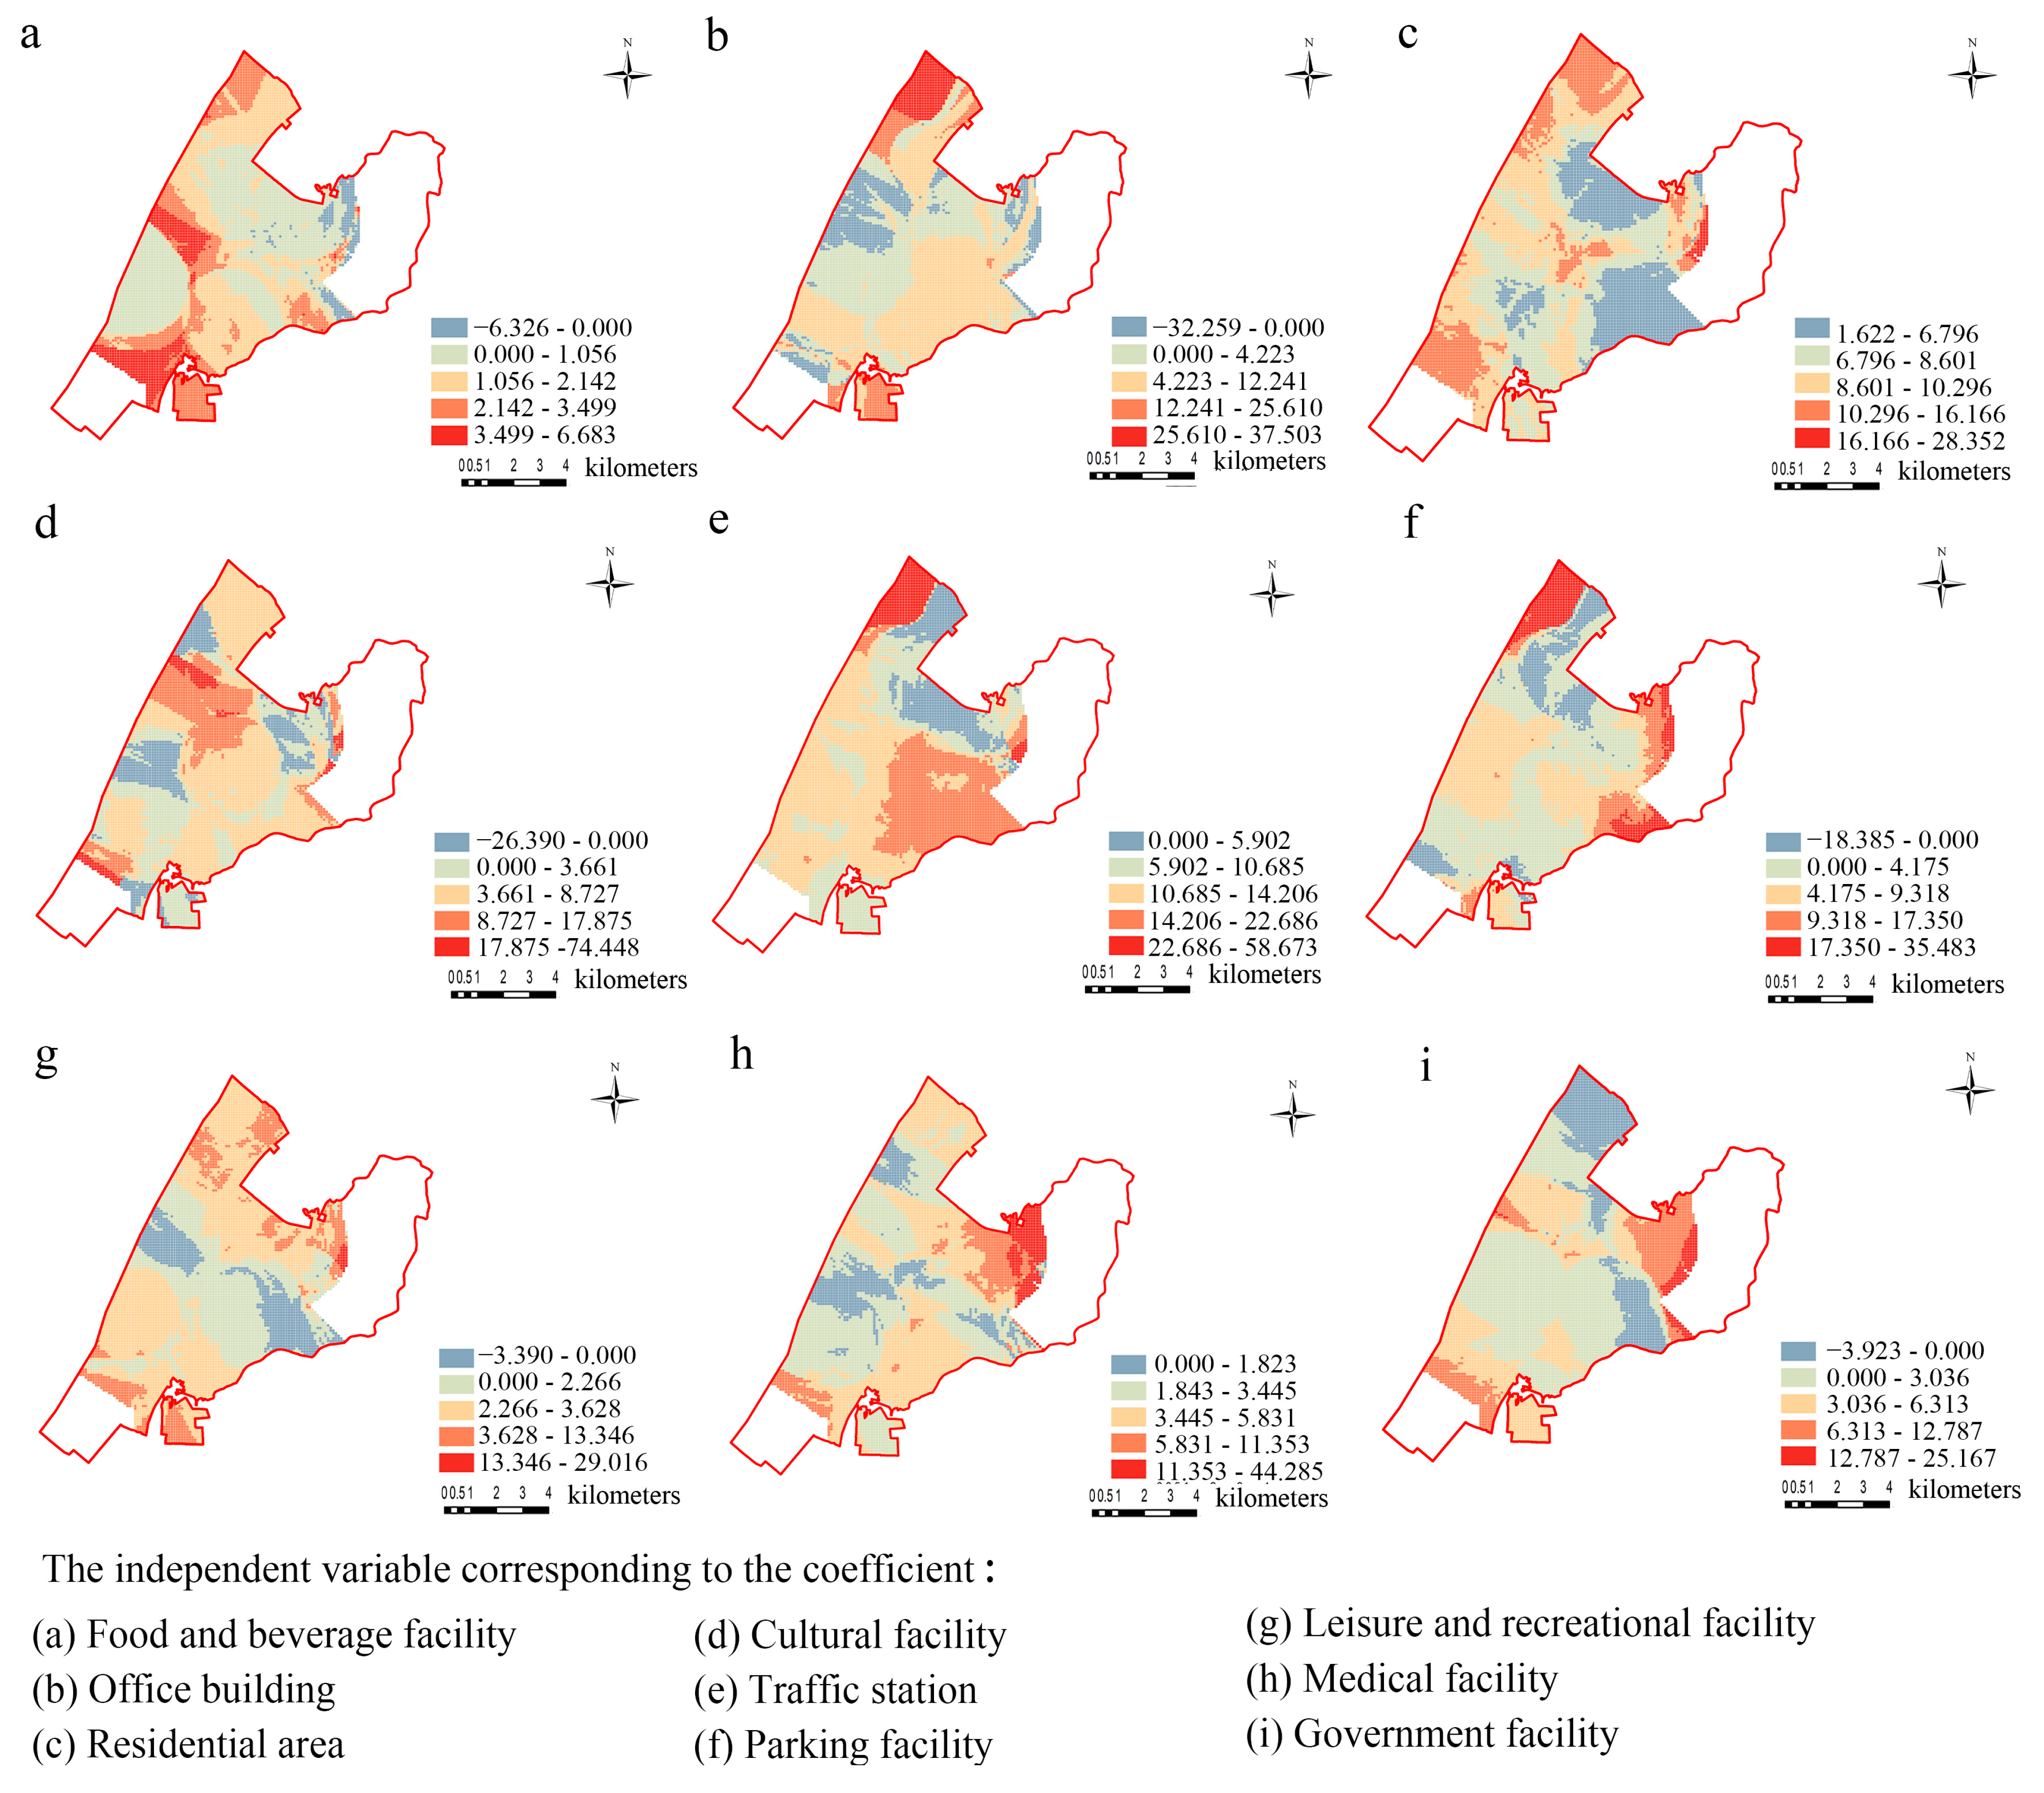
| Full positive influence | Residential area; traffic station; parking facility; and medical facility | Food and beverage facility; residential area; traffic station; recreation and leisure facility; and medical facility | Parking facility; medical facility; and government facility | Food and beverage facility; residential area; traffic station; medical facility government facility; recreational facility; and parking facility | Government facility; medical facility; recreation and leisure facility; cultural facility; and wealthy facility | Recreation and leisure facility; traffic station; and government facility |
| Impact of localized influences | Food and beverage facility; office buildings; cultural facility; recreation and leisure facility; and government facility | Office building; cultural facility; parking facility; and government facility | Food and beverage facility; office building; residential area; cultural facility; traffic station; and recreation and leisure facility | Office building; cultural facility; and recreation and leisure facility | Food and beverage facility; office building; parking facility; residential area; and traffic station | Food and beverage facility; office building; cultural facility; traffic station; parking facility; and medical facility |
| Boring | Beautiful | Depressing | Lively | Safe | Wealthy | |
|---|---|---|---|---|---|---|
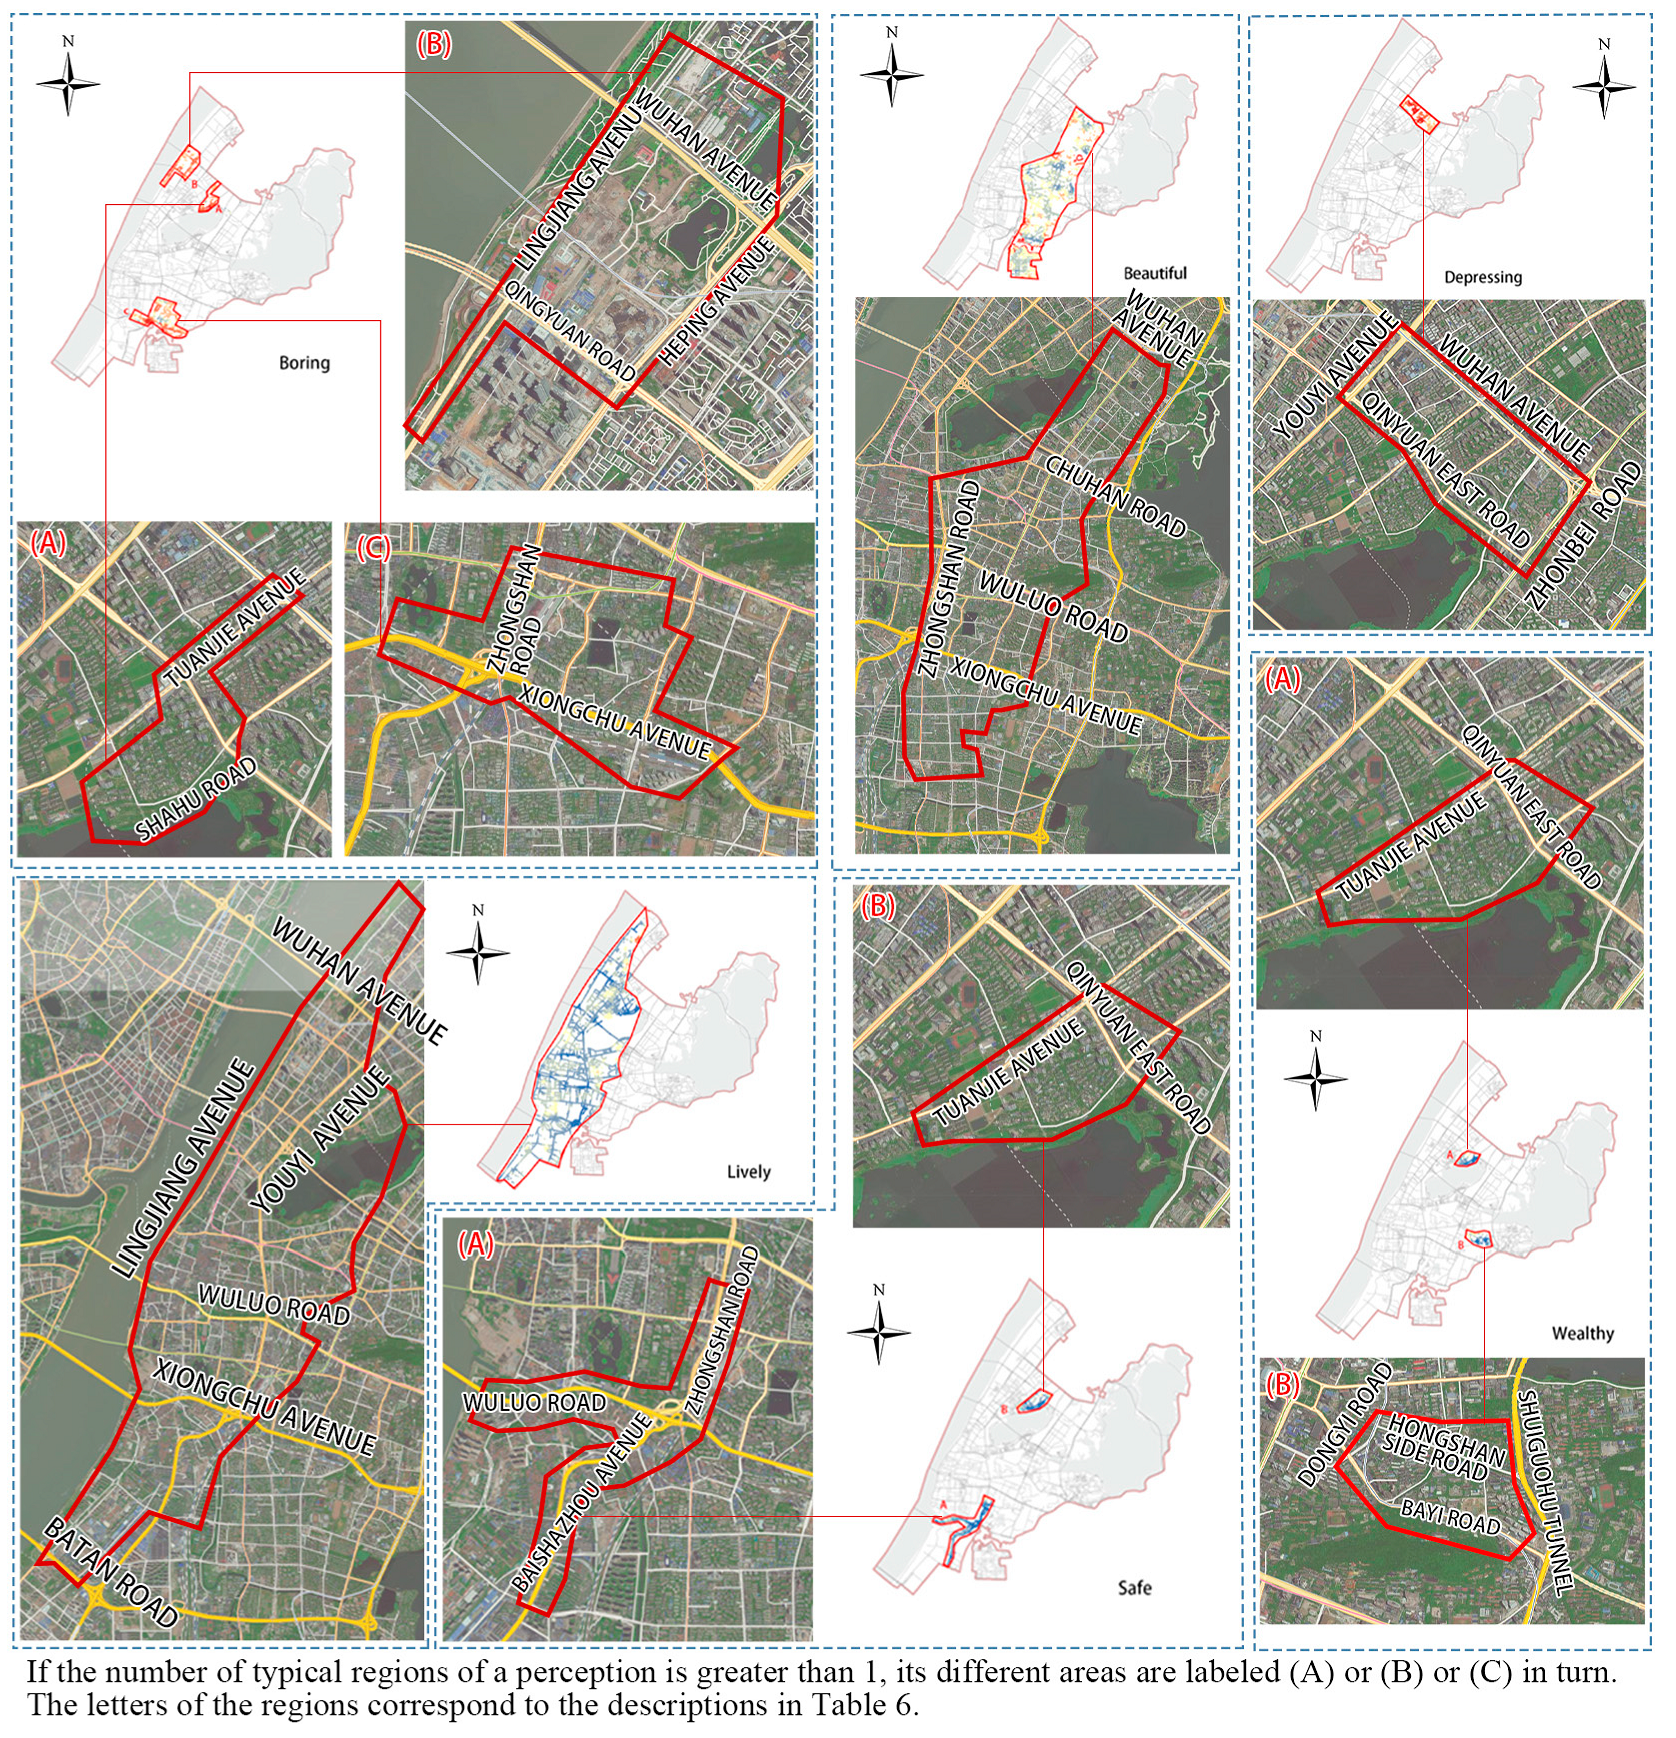
| Regional situation | (A) Sand Lake Road and its vicinity (b) East of Linjiang Avenue, west of Heping Avenue (c) Around and north of Xiongchu Avenue | South-central area of Wuchang District | South of Xu Dong Avenue. North of Qin Yuan Zhong Road | Roads along the Yangtze River and surrounding residential areas | (A) Zhongshan Road Tunnel Section, Po On Street, and Baishazhou Elevated Road and its surrounding side roads | (A) Sand Lake Road and its surrounding roads |
| (B) Sand Lake and its surrounding roads | (B) Chagang Community and vicinity | |||||
| Key impact elements | (A) Cultural facilities (negative correlation); medical facilities | Office building | Residential area, parking facility (negative correlation), and medical facility | Residential area and traffic station | (A) Residential area and traffic station | (A) Cultural facility |
| (B) Office building; residential area; cultural facility; and traffic station | (B) Cultural facilities | (B) Office building and parking facility | ||||
| (C) Office building; residential area; and traffic area |
Disclaimer/Publisher’s Note: The statements, opinions and data contained in all publications are solely those of the individual author(s) and contributor(s) and not of MDPI and/or the editor(s). MDPI and/or the editor(s) disclaim responsibility for any injury to people or property resulting from any ideas, methods, instructions or products referred to in the content. |
© 2023 by the authors. Licensee MDPI, Basel, Switzerland. This article is an open access article distributed under the terms and conditions of the Creative Commons Attribution (CC BY) license (https://creativecommons.org/licenses/by/4.0/).
Share and Cite
Li, T.; Xu, H.; Sun, H. Spatial Patterns and Multi-Dimensional Impact Analysis of Urban Street Quality Perception under Multi-Source Data: A Case Study of Wuchang District in Wuhan, China. Appl. Sci. 2023, 13, 11740. https://doi.org/10.3390/app132111740
Li T, Xu H, Sun H. Spatial Patterns and Multi-Dimensional Impact Analysis of Urban Street Quality Perception under Multi-Source Data: A Case Study of Wuchang District in Wuhan, China. Applied Sciences. 2023; 13(21):11740. https://doi.org/10.3390/app132111740
Chicago/Turabian StyleLi, Tianyue, Hong Xu, and Haozun Sun. 2023. "Spatial Patterns and Multi-Dimensional Impact Analysis of Urban Street Quality Perception under Multi-Source Data: A Case Study of Wuchang District in Wuhan, China" Applied Sciences 13, no. 21: 11740. https://doi.org/10.3390/app132111740
APA StyleLi, T., Xu, H., & Sun, H. (2023). Spatial Patterns and Multi-Dimensional Impact Analysis of Urban Street Quality Perception under Multi-Source Data: A Case Study of Wuchang District in Wuhan, China. Applied Sciences, 13(21), 11740. https://doi.org/10.3390/app132111740