Abstract
In this study, we present a methodology to solve the multi-period ambulance relocation problem based on historical data. We present a methodology to convert historical data in latitude–longitude coordinates into cell-based network data. Then, we propose a mixed-integer programming model that utilizes the converted data for the concomitant problem. Patient incidence is highly uncertain. Rather than simply covering historical demand, we propose a methodology that allows ambulances to reach as many locations as possible at any given time within a limited amount of time, the golden time. We experimented with real data from Seoul, South Korea, and show that the proposed mathematical model can derive an efficient ambulance operation policy with fewer ambulances.
1. Introduction
Emergency medical services are critical to the survival of patients facing life-threatening situations. Ambulances are used as the primary means of transport to healthcare facilities, and studies have shown a strong correlation between transport times and patient survival outcomes [1]. This highlights the importance of fast and efficient ambulance operations.
The concept of the “golden time” is critical in emergency medical services. Defined as the time from dispatch to first patient contact, meeting the golden hour is critical to patient survival. Different studies have defined the golden hour in different ways. While there is no clear definition of the golden time across countries, the general consensus is that it is important to transport patients quickly. However, in urban centers with heavy traffic and a high population density, arriving quickly is often a challenge. There may be a “zero zone” where a patient cannot be reached within the designated golden time.
Traditionally, ambulances are deployed from designated locations, such as fire stations, which facilitates vehicle maintenance, but can limit operational efficiency. Given the dynamics of urban environments, such as changes in traffic patterns and fluctuations in population density, a static approach to ambulance deployment can be inefficient.
This study aimed to define and optimize a multi-period ambulance relocation problem with temporal and spatial variations in demand. We propose a mathematical optimization model based on integer programming. We considered not only fire stations, but also other administrative organizations as potential deployment sites. The contribution of this study was to dynamically relocate ambulances based on real-time traffic data and historical emergency response data. By doing so, we aimed to maximize the supply of emergency medical services in areas where emergencies are likely to occur.
2. Literature Review
Optimizing ambulance relocation is crucial for effective emergency medical services (EMSs). As urban areas grow, so does the complexity of ensuring timely medical interventions. This literature review explores key methodologies in existing research aimed at improving EMS efficiency and response times.
Ambulance deployment studies are broadly divided into the location set covering problem (LSCP) and the maximal covering location problem (MCLP). The LSCP is a model that calculates the minimum number of vehicles required to fully cover the demand area. The MCLP is a study of where to locate the maximum number of vehicles to cover the demand area with a fixed number of vehicles.
From a firefighting force optimization perspective, the location set covering problem (LSCP) was first introduced in [2] and has since been extended to include the study of dynamic dispatch. The dynamic available coverage location (DACL), designed to respond efficiently to varying demand over time, was presented in [3]. Based on the double standard model (DSM), a mathematical model using the integer programming method was presented [4]. The presented model ensures that all regions can be supplied with emergency services within a certain time. A methodology incorporating real-time traffic information and social media data to predict traffic congestion and dynamically position ambulances was also introduced [5]. However, it should be noted that, in the LSCP, the number of vehicles is not fixed, which could pose economic feasibility issues.
The first model of the MCLP was proposed in [6]. They did not consider the probability of an available ambulance when an emergency call came in. The maximum expected coverage location problem (MEXCLP) was proposed in [7]. They presented a mathematical model based on integer programming to reflect the probability of ambulance availability. Later, an extension of the model to a multi-period model was presented in [8]. They validated the effectiveness of the proposed model with real data from Amsterdam. There are studies that have evaluated the economics of static and dynamic models [9]. They verified that dynamic dispatching is efficient based on real data from Montreal. A study [10] examined minimizing paramedic travel distance while maximizing demand coverage. They derived the solution based on a two-phase integer programming method and evaluated the solution through a discrete-event simulator. Another study [11] discussed the problem with the objective of minimizing the queue time of emergency calls in a rescue center. They presented a methodology for dispatching and relocating ambulances to maximize demand coverage while reducing the queue time at emergency rescue centers. In the paper, they proposed an algorithm that integrates discrete-event simulation and mathematical models. They validated the effectiveness of the proposed algorithm on a real dataset from Montreal. Another study was presented that categorized and weighted the importance of emergency medical calls [12]. They presented a mathematical optimization model based on integer programming that considers the relocation of ambulances. They implemented a decision support system (DSS) and verified its effectiveness through practical applications. Recent studies on time-dependent MEXCLPs are similar to our study in that they reflect ambulance relocation based on patterns of demand. However, our study differs in that we focused our analysis on the zero zone, which is outside of the golden time.
Looking at other studies related to optimizing ambulance operations, one study focused on the ambulance location problem, considering the rarity and randomness of road crashes [13]. They presented a methodology for determining the optimal location of ambulances using an edge maximal covering model and the Empirical Bayes method. Another study addressed ambulance deployment by simultaneously considering demand at one point in time and at the next point in time [14]. They defined and applied the concept of “preparedness”, which represents the rate of readiness for emergency response. In addition, some studies presented that COVID-19 led to a surge in demand for emergency services and suggested strategies for efficient ambulance operations [15,16].
In addition, there exists a study that optimizes the addition of resources to a fire department to minimize the response time to an emergency call [17]. Their research is similar to ours in that it focused on the addition of resources within a fire department, but differs in that it was simulation-based. Jahangiri et al. [18] discussed the optimization of the utilization of emergency department resources to reduce waiting times for emergencies in the department. They studied the optimization of emergency department resource operations based on simulation and integer programming. Their study is similar to ours in that it focused on the efficient utilization of emergency resources, while ours focused on multiple ambulances in a specific region. During natural disasters such as earthquakes, there exists research on optimizing supply chains and routes to maximize the demand for relief supplies [19]. In addition to optimizing emergency resources, Ghasemi et al. [20] addressed the location and routing optimization of centers to ensure timely delivery of goods to customers. These studies are similar to ours in that they optimized resource management strategies to best satisfy demand. However, our work differs in that it involved the dynamic reallocation of ambulances in multiple periods.
In this paper, we present a methodology for generating a network based on historical ambulance dispatch data to address the ambulance relocation optimization problem. Furthermore, since the demand for ambulance calls is influenced by diseases and some of these diseases exhibit seasonality, we introduced a methodology for seasonal ambulance relocation and assessed its effectiveness. Additionally, we outline a methodology to integrate real-time traffic information into the ambulance operational strategy. Finally, we present the results of a case study experiment to robustly calculate the number of zero zones according to the season in order to efficiently manage zero zones, which are areas where it is difficult for ambulances to dispatch in the golden time.
3. Problem Description and Mathematical Model
3.1. Problem Description
In this study, we first partitioned the boroughs into subzones, which are represented as hexagonal cells. We utilized Uber’s H3 package to generate these hexagonal cells [21]. We set the size of the hexagonal cells to be 100 m from the center of the hexagon to the vertices. The size of Seoul, which we analyzed in this paper, is 605 km. We determined the size of the hexagonal cell to encompass road and terrain information suitable for ambulance operations by conducting interviews with the person in charge of ambulance operations. We chose hexagonal cells because they have six sides and more neighboring sides than rectangular cells, allowing them to represent more ambulance routes.
Our model aims to determine, at each time point within a given time horizon, the number of ambulances to be allocated to each of these cells. Ambulance relocation can occur between existing fire stations and what we term “potential centers”, which include community centers and administrative buildings.
The purpose of the relocation is to efficiently respond to dynamically changing demand. However, this strategy comes with two significant costs. First, placing an ambulance in a potential center incurs a cost because the center was not originally designed to house the ambulance. Second, there is a cost for the relocation itself at each point in time.
For ambulance maintenance, ambulances are ideally managed from a base center, such as a fire station. It is also efficient for paramedics to return to the fire station where they work to rest after a call. From a demand management perspective, the most-effective relocation strategy is to place ambulances in hard-to-reach areas within the golden time window for emergency medical response. However, locating ambulances away from these base centers can be operationally inefficient. Centralizing ambulances at locations like fire stations ensures regular maintenance, inspection, and restocking, keeping them always ready for emergencies. Additionally, this centralized approach enhances dispatch efficiency, ensuring quicker response times. We evaluated the cost of relocation based on the distance required for the ambulance to return to the base center.
3.2. Notations
Table 1 describes the notations used in this paper. In South Korea, each administrative region has its own fire station. We define and assumed that demand cells in each borough are only covered by ambulances assigned to locations within that borough. Let be 1 if location covers demand cell within the golden time, and 0 otherwise. To check for coverage, we used the Navigation API based on real-time traffic data. We define the golden time as 5 min.

Table 1.
Sets, parameters, and decision variables.
3.3. Mathematical Model
In this section, we present a mathematical model based on integer programming for the concomitant problem.
The objective function consists of four terms. When we analyze an objective expression in Section 4.3, we give it an index to analyze each term separately. The first term (a) is the expected value to cover the demand of demand cell when increasing the number of ambulances by one at each center for each time. An additional explanation of the first term was presented in [8]. The second term (b) is the cost incurred when a potential center is newly used. The third term (c) is the cost incurred if an ambulance is assigned to location c at time t and relocated to location at time . As mentioned before, we computed the relocation cost as the difference in the distance back to the base center. Finally, the fourth term (d) minimizes the number of cells with less than one ambulance within the golden time.
Constraint (2) implies that demand cell i is covered by at least k ambulances if k of the ambulances deployed in the centers serving demand cell i cover demand cell i. Constraint (3) means that the sum of the number of ambulances deployed to all centers is equal to the total number of available ambulances at each time point. Constraint (4) is a constraint that assigns a value of 1 if potential center c is used at least once in the planning horizon. Constraints (5) and (6) are constraints that connect the values at time t and time by the ambulance’s relocation. Constraints (7) and (8) are constraints that are logically established based on the number of ambulances, k, that minimally cover demand cell i. To give an example of the constraint (7), we assumed that an arbitrary demand cell i is covered by at least three ambulances. Since demand cell i is covered by at least three ambulances, we can say that it is also covered by two ambulances. Similarly, it is covered by one ambulance. To give an example of the constraint (8), we assumed that an arbitrary demand cell i is not covered by at least four ambulances. Since demand cell i is not covered by at least 4 ambulances, it cannot be covered by more than 5 ambulances.
4. Numerical Experiments
We tested our proposed model on real-world emergency rescue data from Seoul, South Korea. We used the GUROBI 10.0 solver on a machine with an Intel(R) i7-4th CPU with 32 GB of RAM.
4.1. Dataset
We selected three boroughs in Seoul (Seongbuk-gu, Dongdaemun-gu, Seongdong-gu) to conduct the experiment. The dataset we used is the emergency rescue data from a selected region from 2021 to 2022. The total size of the data is 666,358 cases. We define the amount of demand in each demand cell as a proportion of the total number of calls, as shown in Equation (11).
Figure 1 shows the regions we analyzed and a visualization of the analysis based on hexagonal cells. Furthermore, based on the interviews with fire officials, we divided the planning horizon into seasons because there is seasonality in the efficiency of ambulance operations and disease outbreaks. Thus, we considered December through February to be winter, March through May to be spring, June through August to be summer, and September through November to be fall. The number of ambulances assigned to each time period () was the same at 17. This is because, in Korea, all ambulances are operated around the clock in shifts.
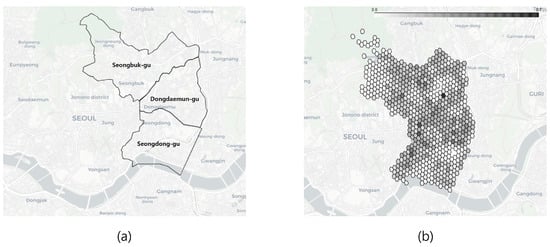
Figure 1.
(a) shows the regions to be analyzed. (b) is a map of the demand information after dividing the region into hexagonal cells from the historical data for the three regions we want to analyze. The darker the color, the higher the demand is.
4.2. Parameters
Using a grid search method, we determined the best parameters in the objective function (1). We created a set of combinations of parameters for the 2021 dataset, conducted the experiments, and interviewed real-world ambulance dispatchers. We set to 30, to 1, and to 3 for the parameters of the objective function given in Equation (1). We calculated as the cost of returning to the base center, as described in Section 3.1. We performed an analysis on the dataset and defined the probability that an ambulance will arrive in the golden time, when an accident is reported, as 0.9. Details regarding the parameter settings are described in Appendix A.
4.3. Result
Table 2 is a table that compares the results of the experiments for each term of the objective function (1).

Table 2.
Experiment results.
For each column, the number in parentheses indicates the index assigned to each term in the objective function (1). The “Before” column represents the current operational strategy without applying the proposed mathematical model.
The sum of the objective values improved from 222.78 before to 445.43 after applying the mathematical model, an improvement of about 99.94%. Looking at the values of the main terms, Term (a) for the demand cover reward improved by 1.33%. Term (d), which rewards cells where an ambulance can be dispatched within the golden time, improved by 138.46%, from 156 before to 372 after applying the mathematical model.
Figure 2 compares the current practice and the results from the mathematical model regarding the number of ambulances deployed in each region. For Seongbuk-gu, the number of ambulances remained the same at 6 during spring, while it was reduced to 5 for the rest of the seasons. In Dongdaemun-gu, 6 ambulances were deployed in winter and 7 in the other seasons. In Seongdong-gu, 4 ambulances were deployed in spring as before, but the number increased to 5 in summer and fall and to 6 in winter.
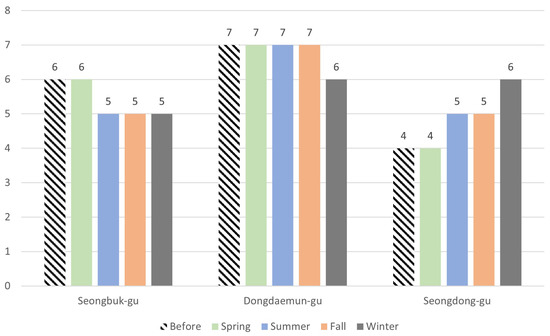
Figure 2.
Number of ambulance deployments for each time period.
This result is likely due to Dongdaemun-gu being located at the center of the three regions, with the main demand stemming from the center, as illustrated in Figure 1b. For Seongdong-gu, even though the demand was not lower than in the other two regions, the current number of ambulances was insufficient. Therefore, more ambulances were deployed to cover more demand cells within the golden time.
Figure 3 is a chart comparing the number of cells that cannot be covered within the golden time, by region and season, before and after applying the mathematical model.
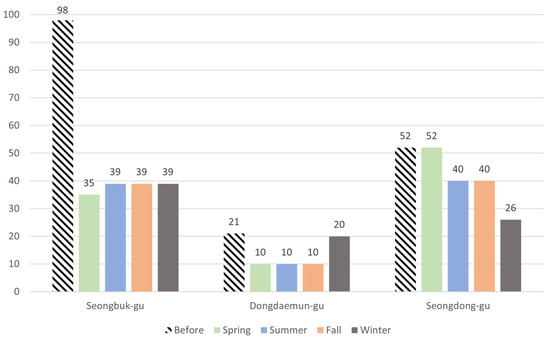
Figure 3.
Number of zero zones where it is difficult for an ambulance to cover within the golden time.
We defined the zero zone as the cells with that are not covered by at least one ambulance. Prior to the mathematical model, there were 171 zero zones. In the mathematical model solution, there were 90 on average for the four planning horizons. The number of zero zones decreased by 47.37%, especially for Seongbuk-gu, which decreased by about 61.22% from 98 to an average of 38.
Figure 4 shows the change in ambulance deployment over the seasons on a map.

Figure 4.
(a) shows spring; (b) shows summer; (c) shows fall; (d) shows winter. Red cells represent ambulances deployed to existing fire stations. Black cells represent ambulances deployed to new potential centers. Black-bordered cells with no color are base centers, meaning that no ambulances are deployed.
When analyzing Seongbuk-gu, we see that even though one fewer ambulance is deployed compared to before, as shown in Figure 2, the number of zero zones was reduced by more than half, as illustrated in Figure 3. This reduction can likely be attributed to ambulances being deployed across a broader area than in the previous setup. For fall and winter, while the center locations remained consistent from a regional perspective, the distribution of ambulances across the three regions varied seasonally, as depicted in Figure 2.
4.4. Case Study
In Figure 3, the number of zero zones in Seongdong-gu varies by season. We observed that the number of zero zones in each region changed with the change in the number of available ambulances (), and the seasonal variation in Seongdong-gu decreased. Table 3 shows the average number of zero zones in all regions and the number of zero zones in each region as changes. The number of ambulances before applying the mathematical model was 17.

Table 3.
Variation in the number of zero zones with the number of ambulances.
Through the mathematical model, we observed that, when the number of ambulances was 15, the number of zero zones reduced by 32.75%. However, this reduction corresponded to an increase to 51.46% when the number of ambulances reached 19. In the case of Seongdong-gu, there were initially 52 zero zones. The mathematical model suggested a reduction in the number of zero zones by 11.05% with 15 and 16 ambulances, 24.04% with 17 ambulances, and a diminished reduction of 13.94% with 18 ambulances. The pattern reversed and increased to 26.95% with 19 ambulances.
From an overall regional perspective, we see that the number of ambulances was less than the 17 currently in operation, but they were efficiently utilized. We also see that the average reduction in zero zones in Seongdong-gu when there were 19 ambulances was twice as high as when there were 15 ambulances.
Table 4 shows the change in the number of seasonal zero zones in Seongdong-gu as changes. From 15 ambulances to 18 ambulances, there were deviations in the number of zero zones by season. When the number of ambulances reached 19, the number of zero zones became the same.

Table 4.
Seasonal changes in the number of zero zones due to changes in the number of ambulances in Seongdong-gu.
From an ambulance operations perspective, minimizing the number of zero zones is important. However, when the number of zero zones changes over time, it becomes a cumbersome task to keep track of when and where the zero zones are for operational policy purposes. From a robust policy perspective, we found that 19 ambulances were needed to cover the area analyzed. However, since the introduction of additional ambulances is expensive, the ambulance operation manager should make decisions based on the presented mathematical model and economic considerations.
5. Conclusions
In this study, we defined the multi-period ambulance relocation problem based on a mathematical programming model and derived its solution. We organized the analysis area into subzones in the form of hexagonal cells. Then, we mapped the demand in each cell based on historical ambulance call data. The organized data were the input to our proposed mathematical model.
Through analyzing a solution of the proposed model, we observed that the demand was covered by about 1.33% more, and the number of zero zones, where it is difficult for an ambulance to reach in the golden time, was reduced by 47.37%. We also observed that the ambulances were redeployed appropriately to meet the changes in demand at each time point.
Furthermore, we showed that the mathematical model presented in the case study can efficiently improve the number of zero zones even with fewer available ambulances. We also calculated the number of ambulances required for a robust ambulance operation strategy where the number of zero zones does not change over the planning horizon. This confirmed that ambulance operations managers need to comprehensively consider demand coverage, the number of zero zones, and the economics of introducing ambulances.
The study we conducted can be extended to various future studies. For example, we conducted our study in three boroughs as a problem size limitation. However, Seoul comprises 25 boroughs, and future research could encompass larger-scale problem-solving methodologies, such as the entire city of Seoul. Additionally, there is a high correlation between ambulance dispatch time and traffic volume, and we used traffic volume as an average value. Future research could adopt a stochastic approach to traffic volume for more accurate modeling. Regarding emergency demand, we based our analysis on historical accident data. Future research could incorporate probabilistic modeling of ambulance demand, taking into account demographic information such as disease outbreak history, the number of people, and their ages by borough. With a designed model, it can be extended to optimize ambulance deployment to efficiently cover maximum demand.
Author Contributions
Conceptualization, S.K. and T.C.; methodology, S.K. and T.C.; software, S.K.; validation, T.C.; formal analysis, S.K.; investigation, S.K.; resources, S.K.; data curation, S.K.; writing—original draft preparation, S.K.; writing—review and editing, T.C.; visualization, S.K.; supervision, T.C.; project administration, S.K.; funding acquisition, T.C. All authors have read and agreed to the published version of the manuscript.
Funding
This research was supported by the National Research Foundation of Korea (NRF) grant funded by the Korean government (MSIT) (No. NRF-2021R1F1A105930213) and also supported by the “National R&D Project for Smart Construction Technology (No. 23SMIP-A158708-04)” funded by the Korea Agency for Infrastructure Technology Advancement under the Ministry of Land, Infrastructure and Transport and managed by the Korea Expressway Corporation. This research was also supported by the Korea Institute for Advancement of Technology (KIAT) grant funded by the Korean Government (MOTIE) (The Competency Development Program for Industry Specialist) under Grant P0008691. This research was also supported by the Seoul Data Fellowship funded by the Seoul Metropolitan Government in 2023.
Institutional Review Board Statement
Not applicable.
Informed Consent Statement
Not applicable.
Data Availability Statement
Not applicable.
Conflicts of Interest
The authors declare no conflict of interest.
Appendix A. Parameter Settings
We selected the parameters in Section 4.2 based on the experiments shown in Figure A1 and Figure A2. We conducted a sensitivity experiment on the number of zero zones by changing the parameters in Equation (1). Based on the results of the sensitivity experiment, we determined the parameter combination that minimized the number of zero zones.
Figure A1 shows the change in the number of zero zones as changes. We observed a decrease in the number of zero zones when was greater than or equal to 20. We also noticed a minimum number of zero zones when was 30.
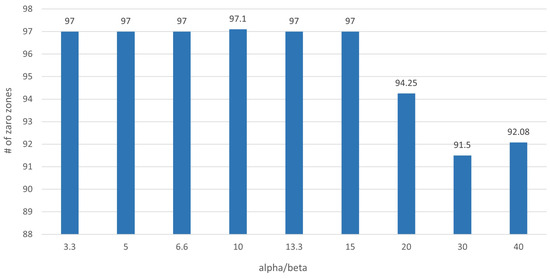
Figure A1.
The number of zero zones as the ratio of to changes.
Figure A2 shows the change in the number of zero zones as changes. We observed that the number of zero zones decreased when was greater than or equal to 5.
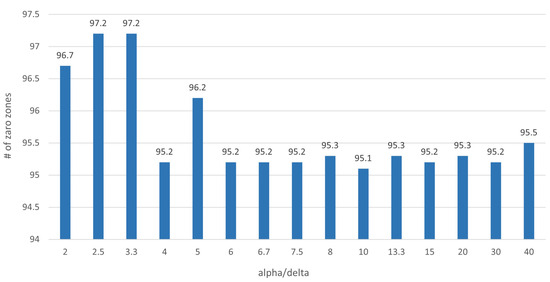
Figure A2.
The number of zero zones as the ratio of to changes.
References
- Bedard, A.F.; Mata, L.V.; Dymond, C.; Moreira, F.; Dixon, J.; Schauer, S.G.; Ginde, A.A.; Bebarta, V.; Moore, E.E.; Mould-Millman, N.K. A scoping review of worldwide studies evaluating the effects of prehospital time on trauma outcomes. Int. J. Emerg. Med. 2020, 13, 64. [Google Scholar] [CrossRef] [PubMed]
- Toregas, C.; Swain, R.; ReVelle, C.; Bergman, L. The location of emergency service facilities. Oper. Res. 1971, 19, 1363–1373. [Google Scholar] [CrossRef]
- Rajagopalan, H.K.; Saydam, C.; Xiao, J. A multiperiod set covering location model for dynamic redeployment of ambulances. Comput. Oper. Res. 2008, 35, 814–826. [Google Scholar] [CrossRef]
- Dibene, J.C.; Maldonado, Y.; Vera, C.; de Oliveira, M.; Trujillo, L.; Schütze, O. Optimizing the location of ambulances in Tijuana, Mexico. Comput. Biol. Med. 2017, 80, 107–115. [Google Scholar] [CrossRef] [PubMed]
- Yuangyai, C.; Nilsang, S.; Cheng, C.Y. Robust ambulance base allocation strategy with social media and traffic congestion information. J. Ambient. Intell. Humaniz. Comput. 2020, 1–14. [Google Scholar] [CrossRef]
- Church, R.; ReVelle, C. The maximal covering location problem. In Papers of the Regional Science Association; Springer: Berlin/Heidelberg, Germany, 1974; Volume 32, pp. 101–118. [Google Scholar]
- Daskin, M.S. A maximum expected covering location model: Formulation, properties and heuristic solution. Transp. Sci. 1983, 17, 48–70. [Google Scholar] [CrossRef]
- Van den Berg, P.L.; Aardal, K. Time-dependent MEXCLP with start-up and relocation cost. Eur. J. Oper. Res. 2015, 242, 383–389. [Google Scholar] [CrossRef]
- Bélanger, V.; Kergosien, Y.; Ruiz, A.; Soriano, P. An empirical comparison of relocation strategies in real-time ambulance fleet management. Comput. Ind. Eng. 2016, 94, 216–229. [Google Scholar] [CrossRef]
- Enayati, S.; Mayorga, M.E.; Rajagopalan, H.K.; Saydam, C. Real-time ambulance redeployment approach to improve service coverage with fair and restricted workload for EMS providers. Omega 2018, 79, 67–80. [Google Scholar] [CrossRef]
- Bélanger, V.; Lanzarone, E.; Nicoletta, V.; Ruiz, A.; Soriano, P. A recursive simulation-optimization framework for the ambulance location and dispatching problem. Eur. J. Oper. Res. 2020, 286, 713–725. [Google Scholar] [CrossRef]
- Hajiali, M.; Teimoury, E.; Rabiee, M.; Delen, D. An interactive decision support system for real-time ambulance relocation with priority guidelines. Decis. Support Syst. 2022, 155, 113712. [Google Scholar] [CrossRef]
- Mohri, S.S.; Haghshenas, H. An ambulance location problem for covering inherently rare and random road crashes. Comput. Ind. Eng. 2021, 151, 106937. [Google Scholar] [CrossRef]
- Carvalho, A.; Captivo, M.; Marques, I. Integrating the ambulance dispatching and relocation problems to maximize system’s preparedness. Eur. J. Oper. Res. 2020, 283, 1064–1080. [Google Scholar] [CrossRef]
- Dolan, E.; Johnson, N.; Kepler, T.; Lam, H.; Lelo de Larrea, E.; Mohammadi, S.; Olivier, A.; Quayyum, A.; Sanabria, E.; Sethuraman, J.; et al. Hospital Load Balancing: A Data-Driven Approach to Optimize Ambulance Transports during the COVID-19 Pandemic in New York City. SSRN 2022. preprint. [Google Scholar] [CrossRef]
- Majlesinasab, N.; Maleki, M.; Nikbakhsh, E. Performance evaluation of an EMS system using queuing theory and location analysis: A case study. Am. J. Emerg. Med. 2022, 51, 32–45. [Google Scholar] [CrossRef] [PubMed]
- Ghasemi, P.; Babaeinesami, A. Simulation of fire stations resources considering the downtime of machines: A case study. J. Ind. Eng. Manag. Stud. 2020, 7, 161–176. [Google Scholar]
- Jahangiri, S.; Abolghasemian, M.; Ghasemi, P.; Chobar, A.P. Simulation-based optimization: Analysis of the emergency department resources under COVID-19 conditions. Int. J. Ind. Syst. Eng. 2023, 43, 1–19. [Google Scholar] [CrossRef]
- Ghasemi, P.; Goodarzian, F.; Muñuzuri, J.; Abraham, A. A cooperative game theory approach for location-routing-inventory decisions in humanitarian relief chain incorporating stochastic planning. Appl. Math. Model. 2022, 104, 750–781. [Google Scholar] [CrossRef]
- Ghasemi, P.; Hemmaty, H.; Pourghader Chobar, A.; Heidari, M.R.; Keramati, M. A multi-objective and multi-level model for location-routing problem in the supply chain based on the customer’s time window. J. Appl. Res. Ind. Eng. 2022, in press. [Google Scholar]
- Uber H3. Available online: https://h3geo.org/ (accessed on 29 June 2023).
Disclaimer/Publisher’s Note: The statements, opinions and data contained in all publications are solely those of the individual author(s) and contributor(s) and not of MDPI and/or the editor(s). MDPI and/or the editor(s) disclaim responsibility for any injury to people or property resulting from any ideas, methods, instructions or products referred to in the content. |
© 2023 by the authors. Licensee MDPI, Basel, Switzerland. This article is an open access article distributed under the terms and conditions of the Creative Commons Attribution (CC BY) license (https://creativecommons.org/licenses/by/4.0/).