A Study on Analyses of the Production Data of Feed Crops and Vulnerability to Climate Impacts According to Climate Change in Republic of Korea
Abstract
:1. Introduction
2. Data Collection and Preprocessing
3. Climate-Related Production Prediction Model for Forage Crops
3.1. Italian Ryegrass Production Prediction Model
3.2. Grass Production Prediction Model
4. Electromagnetic Climate Map for Suitable Cultivation Areas for Forage Crops
5. Conclusions
Author Contributions
Funding
Institutional Review Board Statement
Informed Consent Statement
Data Availability Statement
Conflicts of Interest
References
- Guo, Y.; Chen, S.; Li, X.; Cunha, M.; Jayavelu, S.; Cammarano, D.; Fu, Y. Machine Learning-Based Approaches for Predicting SPAD Values of Maize Using Multi-Spectral Images. Remote Sens. 2022, 14, 1337. [Google Scholar] [CrossRef]
- Moon, T.H.; Chae, Y.; Lee, D.-S.; Kim, D.-H.; Kim, H.-G. Analyzing climate change impacts on health, energy, water resources, and biodiversity sectors for effective climate change policy in South Korea. Sci. Rep. 2021, 11, 18512. [Google Scholar] [CrossRef] [PubMed]
- Jung, J.S.; Park, H.S.; Ji, H.J.; Kim, K.Y.; Lee, S.Y.; Lee, B.H. Predicting Changes in the Suitable Agro-climate Zone of Italian Ryegrass Cultivars with RCP 8.5 Climate Change Scenario. J. Korean Soc. Grassl. Forage Sci. 2020, 40, 196–210. [Google Scholar] [CrossRef]
- Korea Rural Development Administration. Report, 2016: Development of Livestock Adaptation Tool for Climate Change; Korea Rural Development Administration: Jeonju, Republic of Korea, 2016.
- Chung, S.U.; Sung, S.H.; Zhang, Q.-M.; Jung, J.S.; Oh, M.; Yun, Y.S.; Seong, H.J.; Moon, S.H. Assessment of Productivity and Vulnerability of Climate Impacts of Forage Corn Due to Climate Change in Central Korea. J. Korean Soc. Grassl. Forage Sci. 2019, 39, 105–113. [Google Scholar] [CrossRef]
- Ahn, B.I.; Han, S.H. Analysis on the effects of government’s support for forage production. Korea Agric. Econ. Assoc. 2016, 57, 55–78. [Google Scholar]
- Kim, H.; Hyun, S.; Kim, K.S. A Study on the Prediction of Suitability Change of Forage Crop Italian Ryegrass (Lolium multiflorum L.) using Spatial Distribution Model. Korean J. Agric. For. Meteorol. 2014, 16, 103–113. [Google Scholar] [CrossRef]
- Kim, K.D.; Sung, K.I.; Jung, Y.S.; Lee, H.I.; Ghassemi Nejad, J.; Lee, B.H.; Kim, Y.J.; Cho, M.H.; Lim, Y.C. Suitability classes for Italian ryegrass using soil and climate digital database in Gangwon Province. Korean Soc. Grassl. Forage Sci. 2012, 32, 437–446. [Google Scholar] [CrossRef]
- Kim, W.-H.; Kim, K.-Y.; Jung, M.-W.; Ji, H.-C.; Lim, Y.-C.; Seo, S.; Kim, J.-D.; Yoon, B.-K.; Lee, H.-W. Dry matter yield and forage quality at mixture of annual legumes and Italian ryegrass on paddy field. J. Korean Soc. Grassl. Forage Sci. 2011, 31, 33–38. [Google Scholar] [CrossRef]
- Kim, K.-Y.; Ji, H.-C.; Lee, S.-H.; Lee, K.-W.; Kim, W.-H.; Jung, M.-W.; Seo, S.; Choi, G.-J. Yield and nutritive value of spring-seeded early and late maturity italian ryegrass (Lolium multiflorum Lam.). J. Korean Soc. Grassl. Forage Sci. 2010, 30, 97–102. [Google Scholar] [CrossRef]
- Kim, M.J.; Kim, J.G.; Ki, G.S.; Choi, G.J.; Seo, S.; Yoon, S.H. Feeding effect of TMR using Italian ryegrass silage on milk yield and composition in dairy cattle. Proc. Korean Soc. Grassl. Forage Sci. Conf. 2007, 45, 254–255, (In Korean with English Abstract). [Google Scholar]
- Kim, K.-Y.; Lee, S.-H.; Ji, H.C.; Hwang, T.-Y.; Lee, K.-W.; Park, S.M. Growth characteristics and yield comparisons of domestic and foreign Italian ryegrass (Lolium multiflorum Lam) varieties in Yecheon area of Korea. J. Korean Soc. Grassl. Forage Sci. 2015, 35, 43–49. [Google Scholar] [CrossRef]
- Stöckle, C.O.; Higgins, S.; Nelson, R.; Abatzoglou, J.; Huggins, D.; Pan, W.; Karimi, T.; Antle, J.; Eigenbrode, S.D.; Brooks, E. Evaluating opportunities for an increased role of winter crops as adaptation to climate change in dryland cropping systems of the US Inland Pacific Northwest. Clim. Chang. 2017, 146, 247–261. [Google Scholar] [CrossRef]
- Kim, M.; Sung, K. Comparison of Causality of Temperature and Precipitation on Italian Ryegrass (Lolium multiflorum Lam.) Yield between Cultivation Fields via Multi-Group Structural Equation Model Analysis in the Republic of Korea. Agriculture 2019, 9, 254. [Google Scholar] [CrossRef]
- Choi, G.J.; Lim, Y.C.; Kim, K.Y.; Sung, B.R.; Lee, J.K.; Ji, H.C.; Park, H.S.; Kim, D.K.; Moon, J.S.; Seo, S. A ultracold-tolerant and early-maturing italian ryegrass (Lolium multiflorum Lam.) new variety, ‘Kowinearly’. Proc. Korean Soc. Grassl. Forage Sci. Conf. 2007, 45, 192–193. [Google Scholar]
- Seo, S.; Kim, W.-H.; Kim, K.-Y.; Choi, G.-J.; Ji, H.-C.; Lee, S.-H.; Lee, K.-W.; Kim, M.-J. Forage productivity and quality of domestic Italian ryegrass and barley varieties. J. Korean Soc. Grassl. Forage Sci. 2011, 31, 261–268. [Google Scholar] [CrossRef]
- Hatfield, J.L.; Wright-Morton, L.; Hall, B. Vulnerability of grain crops and croplands in the Midwest to climatic variability and adaptation strategies. Clim. Chang. 2018, 146, 263–275. [Google Scholar] [CrossRef]
- Farhangfar, S.; Bannayan, M.; Khazaei, H.R.; Baygi, M.M. Vulnerability assessment of wheat and maize production affected by drought and climate change. Int. J. Disaster Risk Reduct. 2015, 13, 37–51. [Google Scholar] [CrossRef]
- Malhi, G.S.; Kaur, M.; Kaushik, P. Impact of Climate Change on Agriculture and Its Mitigation Strategies: A Review. Sustainability 2021, 13, 1318. [Google Scholar] [CrossRef]
- Sen, S.; Choudhary, V. Module 10: ICT applications for smallholder inclusion in agribusiness supply chains. In ICT in Agriculture: Connecting Smallholders to Knowledge, Networks and Institutions E-Source Book; World Bank: Washington, DC, USA, 2011; Available online: https://cto.int/wp-content/themes/solid/_layout/dc/k-r/ICT_in_Ag_Sourcebook_web_light.pdf (accessed on 10 July 2023).


| Category | Variable | Meaning | Mean | S.E. |
|---|---|---|---|---|
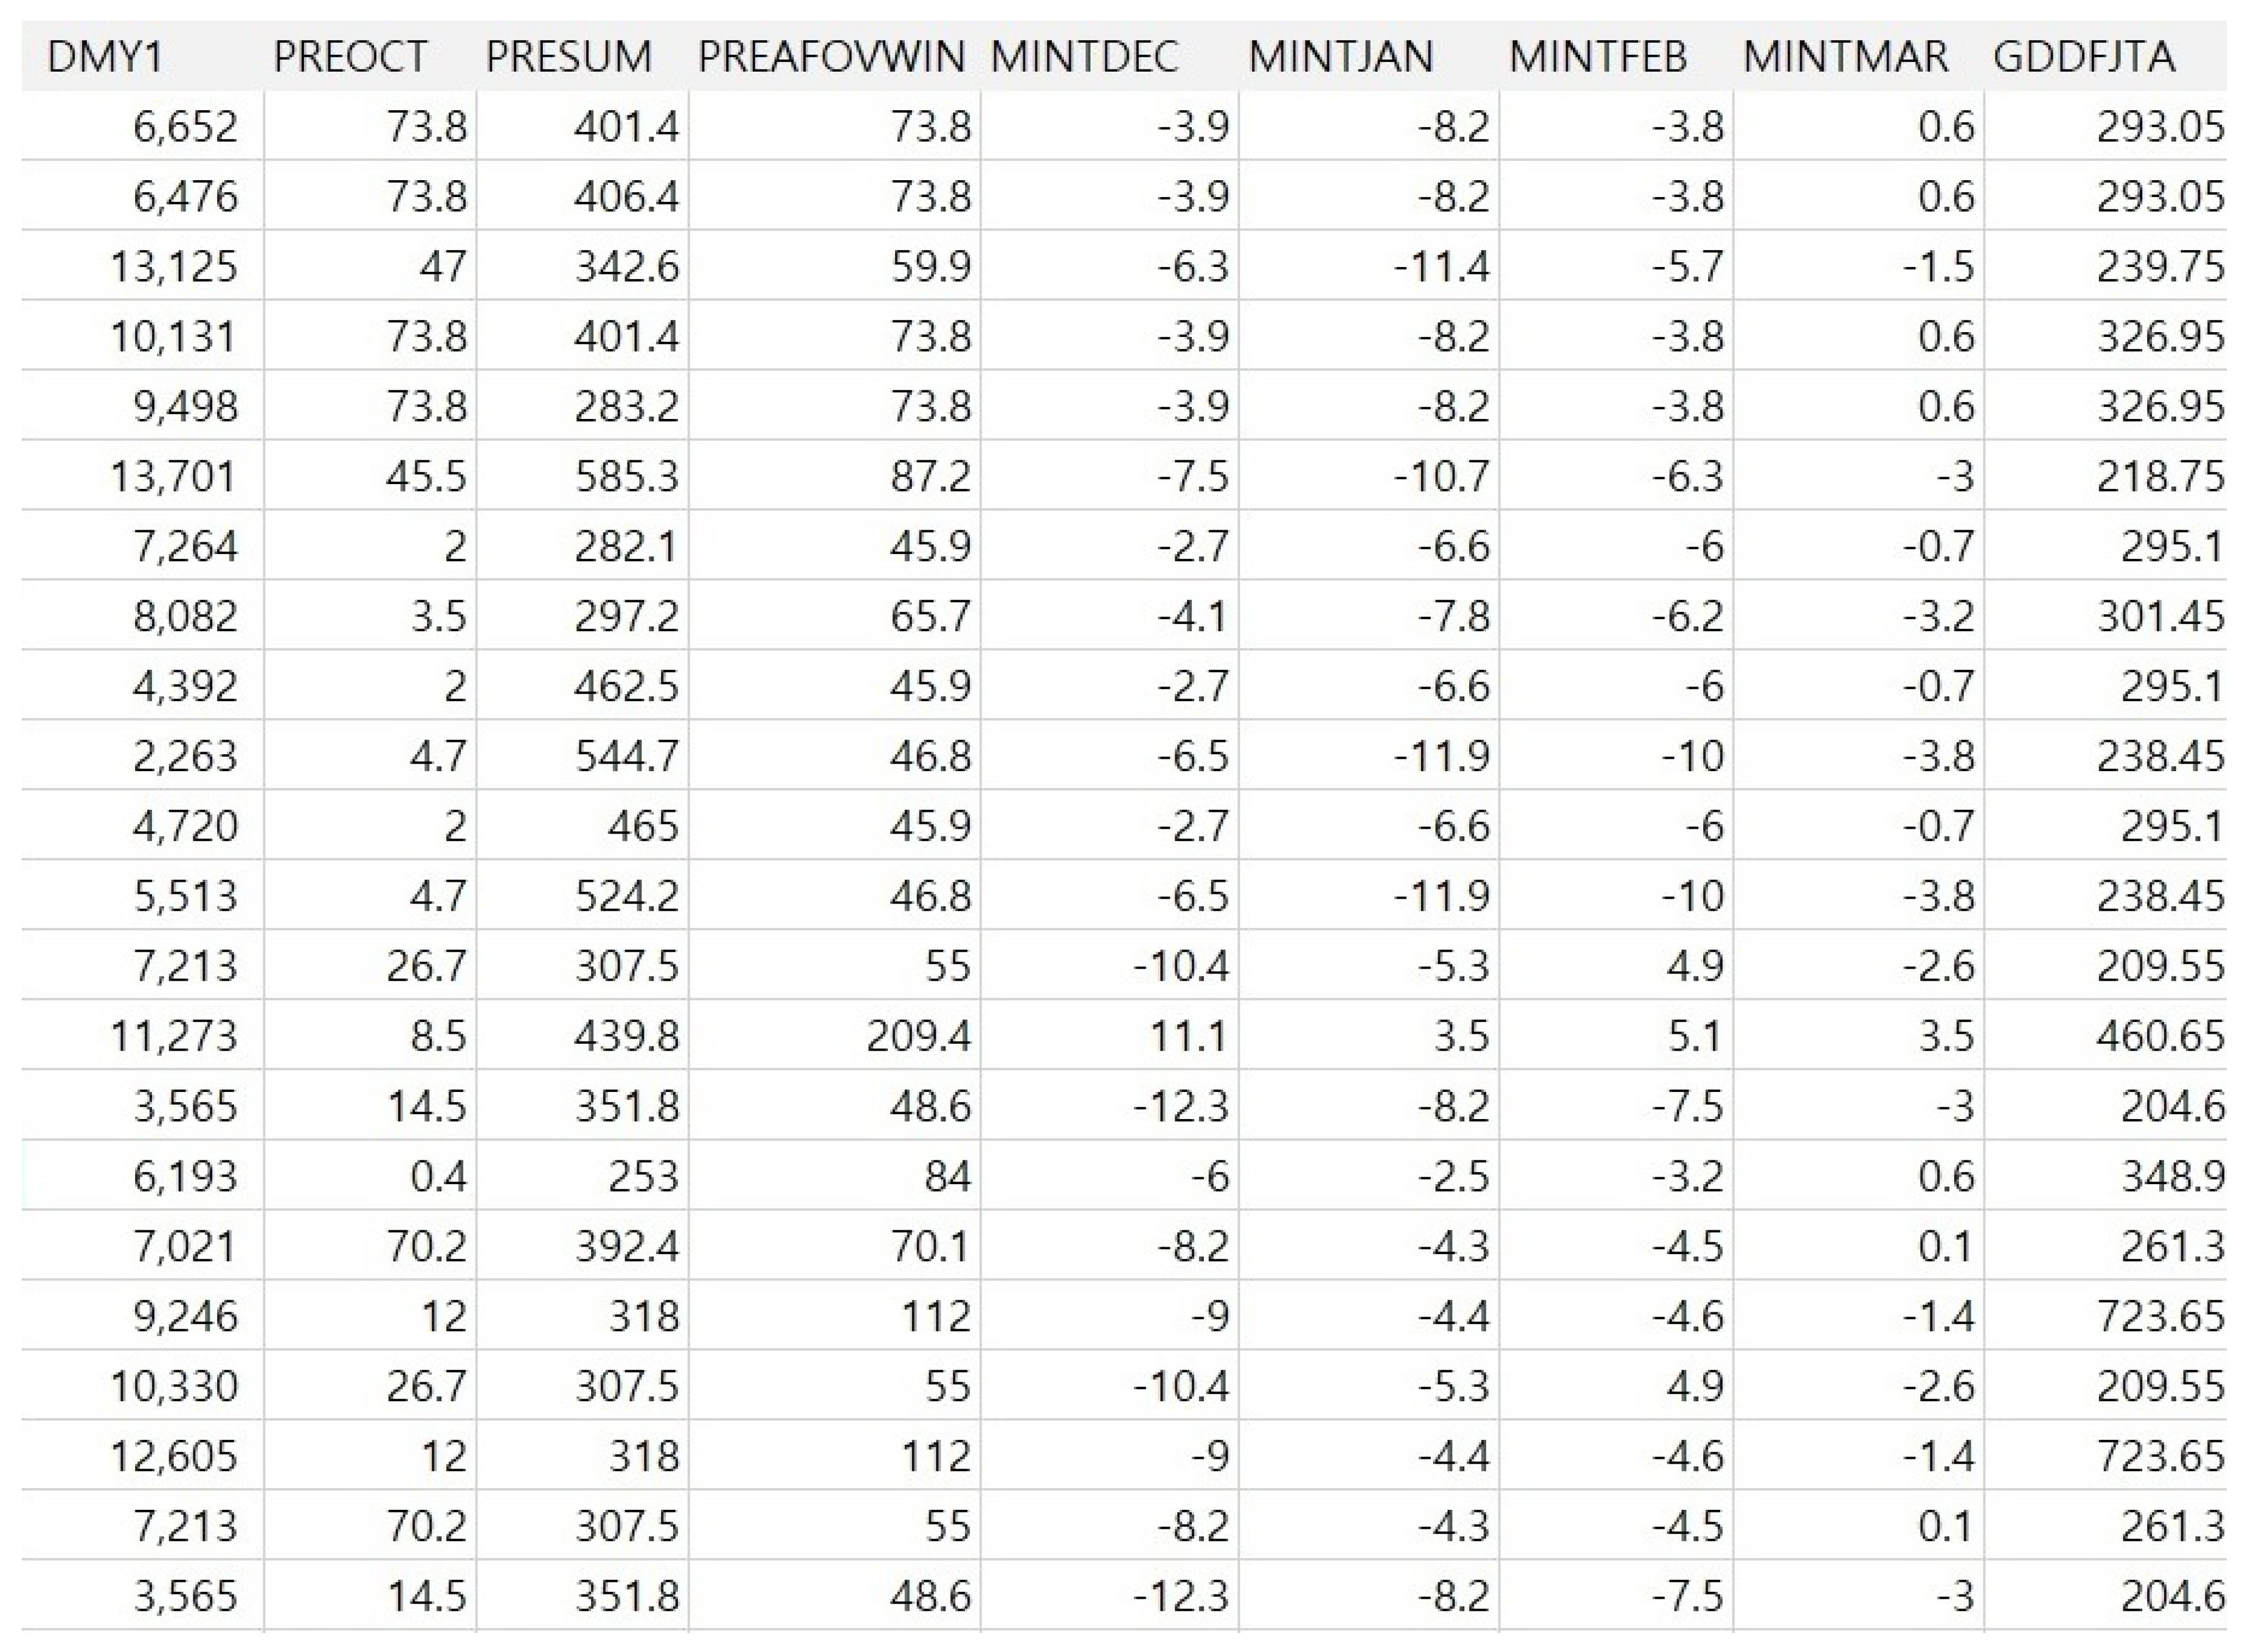
| Yield | DMY1 | First Dry Matter Yield of IRG | 9011.877 | 4295.5617 |
| Precipitation | PREOCT | Precipitation in October | 50.2601 | 69.8917 |
| PRESUM | Sum of Precipitation | 365.834 | 117.2916 | |
| PREAFTOVWIN | Precipitation Sum Over Winter | 93.315 | 56.7692 | |
| Temperature | MINTDEC | Minimum Temperature in December | −3.323 | 5.1069 |
| MINTJAN | Minimum Temperature in January | −5.595 | 5.0707 | |
| MINTFEB | Minimum Temperature in February | −3.714 | 4.6233 | |
| MINTMAR | Minimum Temperature in March | 1.490 | 3.2148 | |
| GDD | GDDFJTA | GDD From January To April | 339.207 | 133.038 |
| PREOCT | PRESUM | PREAFOVWIN | MINTDEC | MINTJAN | MINTFEB | MINTMAR | GDDFJTA | ||
|---|---|---|---|---|---|---|---|---|---|
| Pearson | DMY1 | 0.445 ** | 0.407 ** | 0.493 ** | 0.574 ** | 0.600 ** | 0.569 ** | 0.583 ** | 0.564 ** |
| (a) | ||||||||
| Model Summary | ||||||||
| Model | R | R Squared | Modified R Squared | Standard Error of the Estimate | Durbin–Watson | |||
| 3 | 0.672 | 0.451 | 0.446 | 3197.9769 | 0.744 | |||
| (b) | ||||||||
| ANOVA a | ||||||||
| Model | Sum of Squares | Degree of Freedom | Mean Square | F | Significance Probability | |||
| 3 | Regression | 2,498,119,243.996 | 3 | 832,706,414.665 | 81.422 | 0.000 | ||
| Residual | 3,037,435,744.456 | 297 | 10,227,056.379 | |||||
| Total | 5,535,554,988.452 | 300 | ||||||
| (c) | ||||||||
| Coefficient a | ||||||||
| Model | Non-Standardized Coefficient | Standardized Coefficient | t | Significance Probability | Collinearity Statistic | |||
| B | Standard Error | Beta | Tolerance | VIF | ||||
| 3 | (Constant) | 6167.375 | 1046.588 | 5.893 | 0.000 | |||
| MINTJAN | 231.498 | 58.153 | 0.273 | 3.981 | 0.000 | 0.392 | 2.551 | |
| PREOCT | 19.046 | 2.746 | 0.310 | 6.935 | 0.000 | 0.925 | 1.081 | |
| GDDFJTA | 9.382 | 2.166 | 0.291 | 4.332 | 0.000 | 0.411 | 2.435 | |
| Variables | Coefficients | Intercept | R2 | |
|---|---|---|---|---|
| Multivariate regression (stepwise) (N = 304, X = 7) | DMY1~ | 6167.375 | 0.34 | |
| PREOCT | 19.046 | |||
| MINTJAN | 231.498 | |||
| GDDFJTA | 9.382 | |||
| Lasso regression (N = 304, X = 7) | DMY1~ | 4765.62 | 0.6019 | |
| PREOCT | 18.87 | |||
| PRESUM | 0.12 | |||
| PREAFOVWIN | 9.459 | |||
| MINTDEC | −122.77 | |||
| MINTJAN | 90.58 | |||
| MINTFEB | 101.65 | |||
| MINTMAR | 227.68 | |||
| GDDFJTA | 7.51 | |||
| Lasso regression (N = 304, X = 4) | DMY1~ | 0.627 | ||
| PREOCT | 18.4995 | 6208.17 | ||
| MINTJAN | 120.31 | |||
| MINTFEB | 140.11 | |||
| GDDFJTA | 9.2 | |||
| Lasso regression (N = 304, X = 3) | DMY1~ | 6441.169 | 0.629 | |
| PREOCT | 18.778 | |||
| MINTJAN | 239.335 | |||
| GDDFJTA | 8.906 |
| Category | Variable | Meaning | Mean | S.E. |
|---|---|---|---|---|
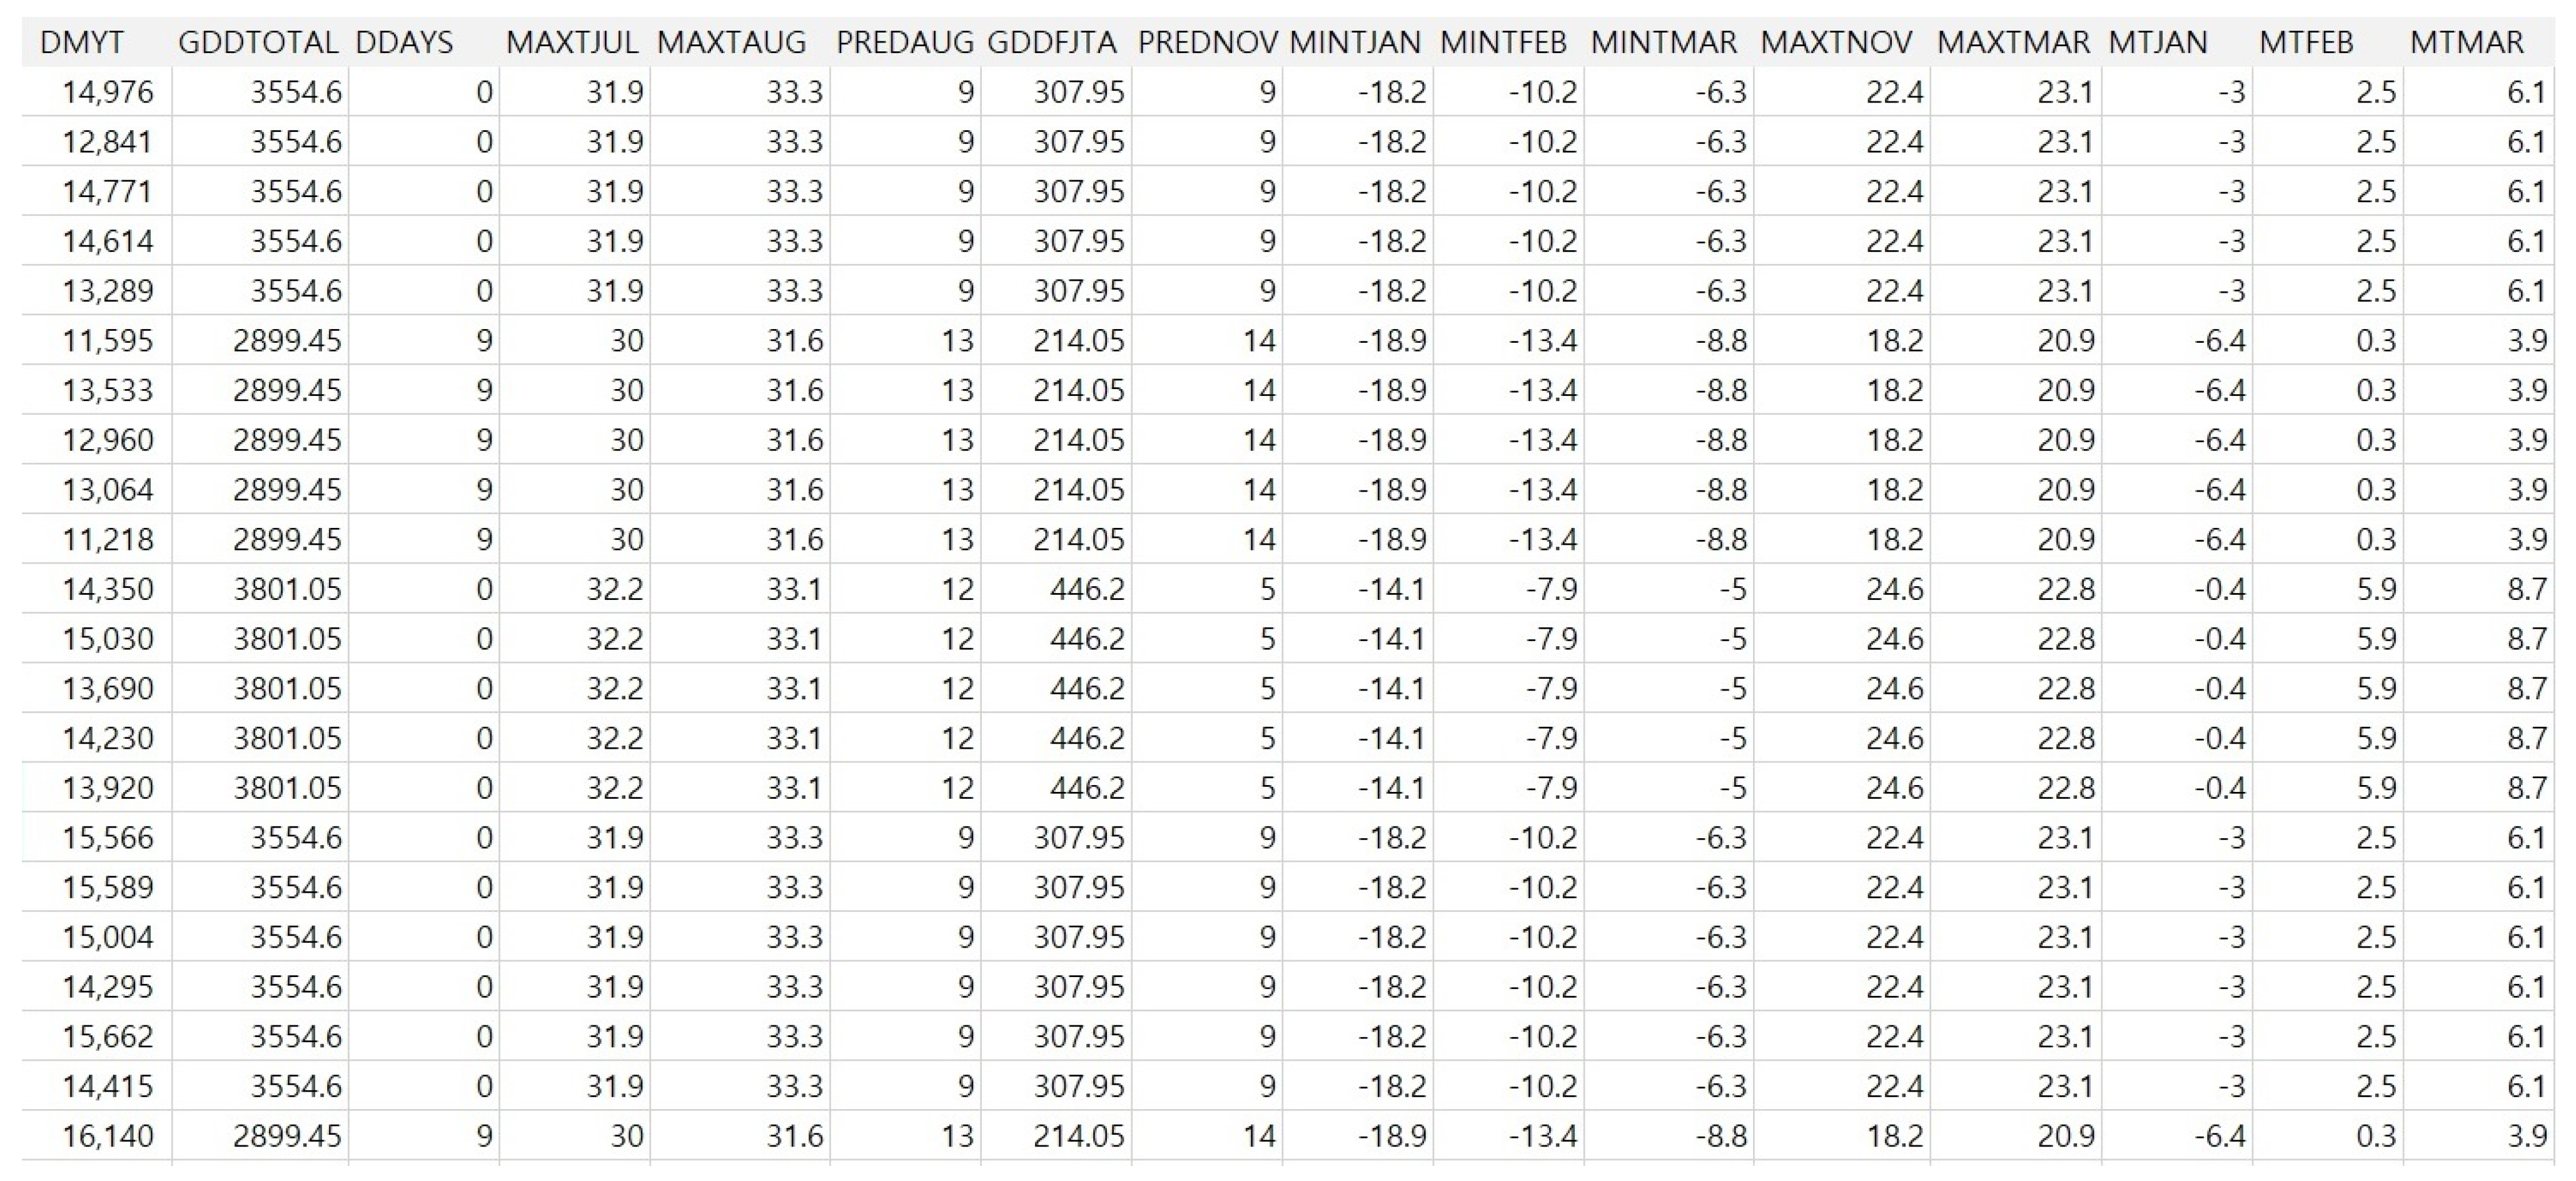
| Yield | DMYT | Total Dry Matter Yield | 15,854.71 | 4023.565 |
| Precipitation | DDAYS | Drought Days | 1.68 | 3.209 |
| PREDAUG | Sum of Precipitation Days in August | 14.07 | 4.130 | |
| Temperature | MAXJUL | Maximum Temperature in July | 34.0262 | 1.70214 |
| MAXAUG | Maximum Temperature in August | 34.9328 | 1.71471 | |
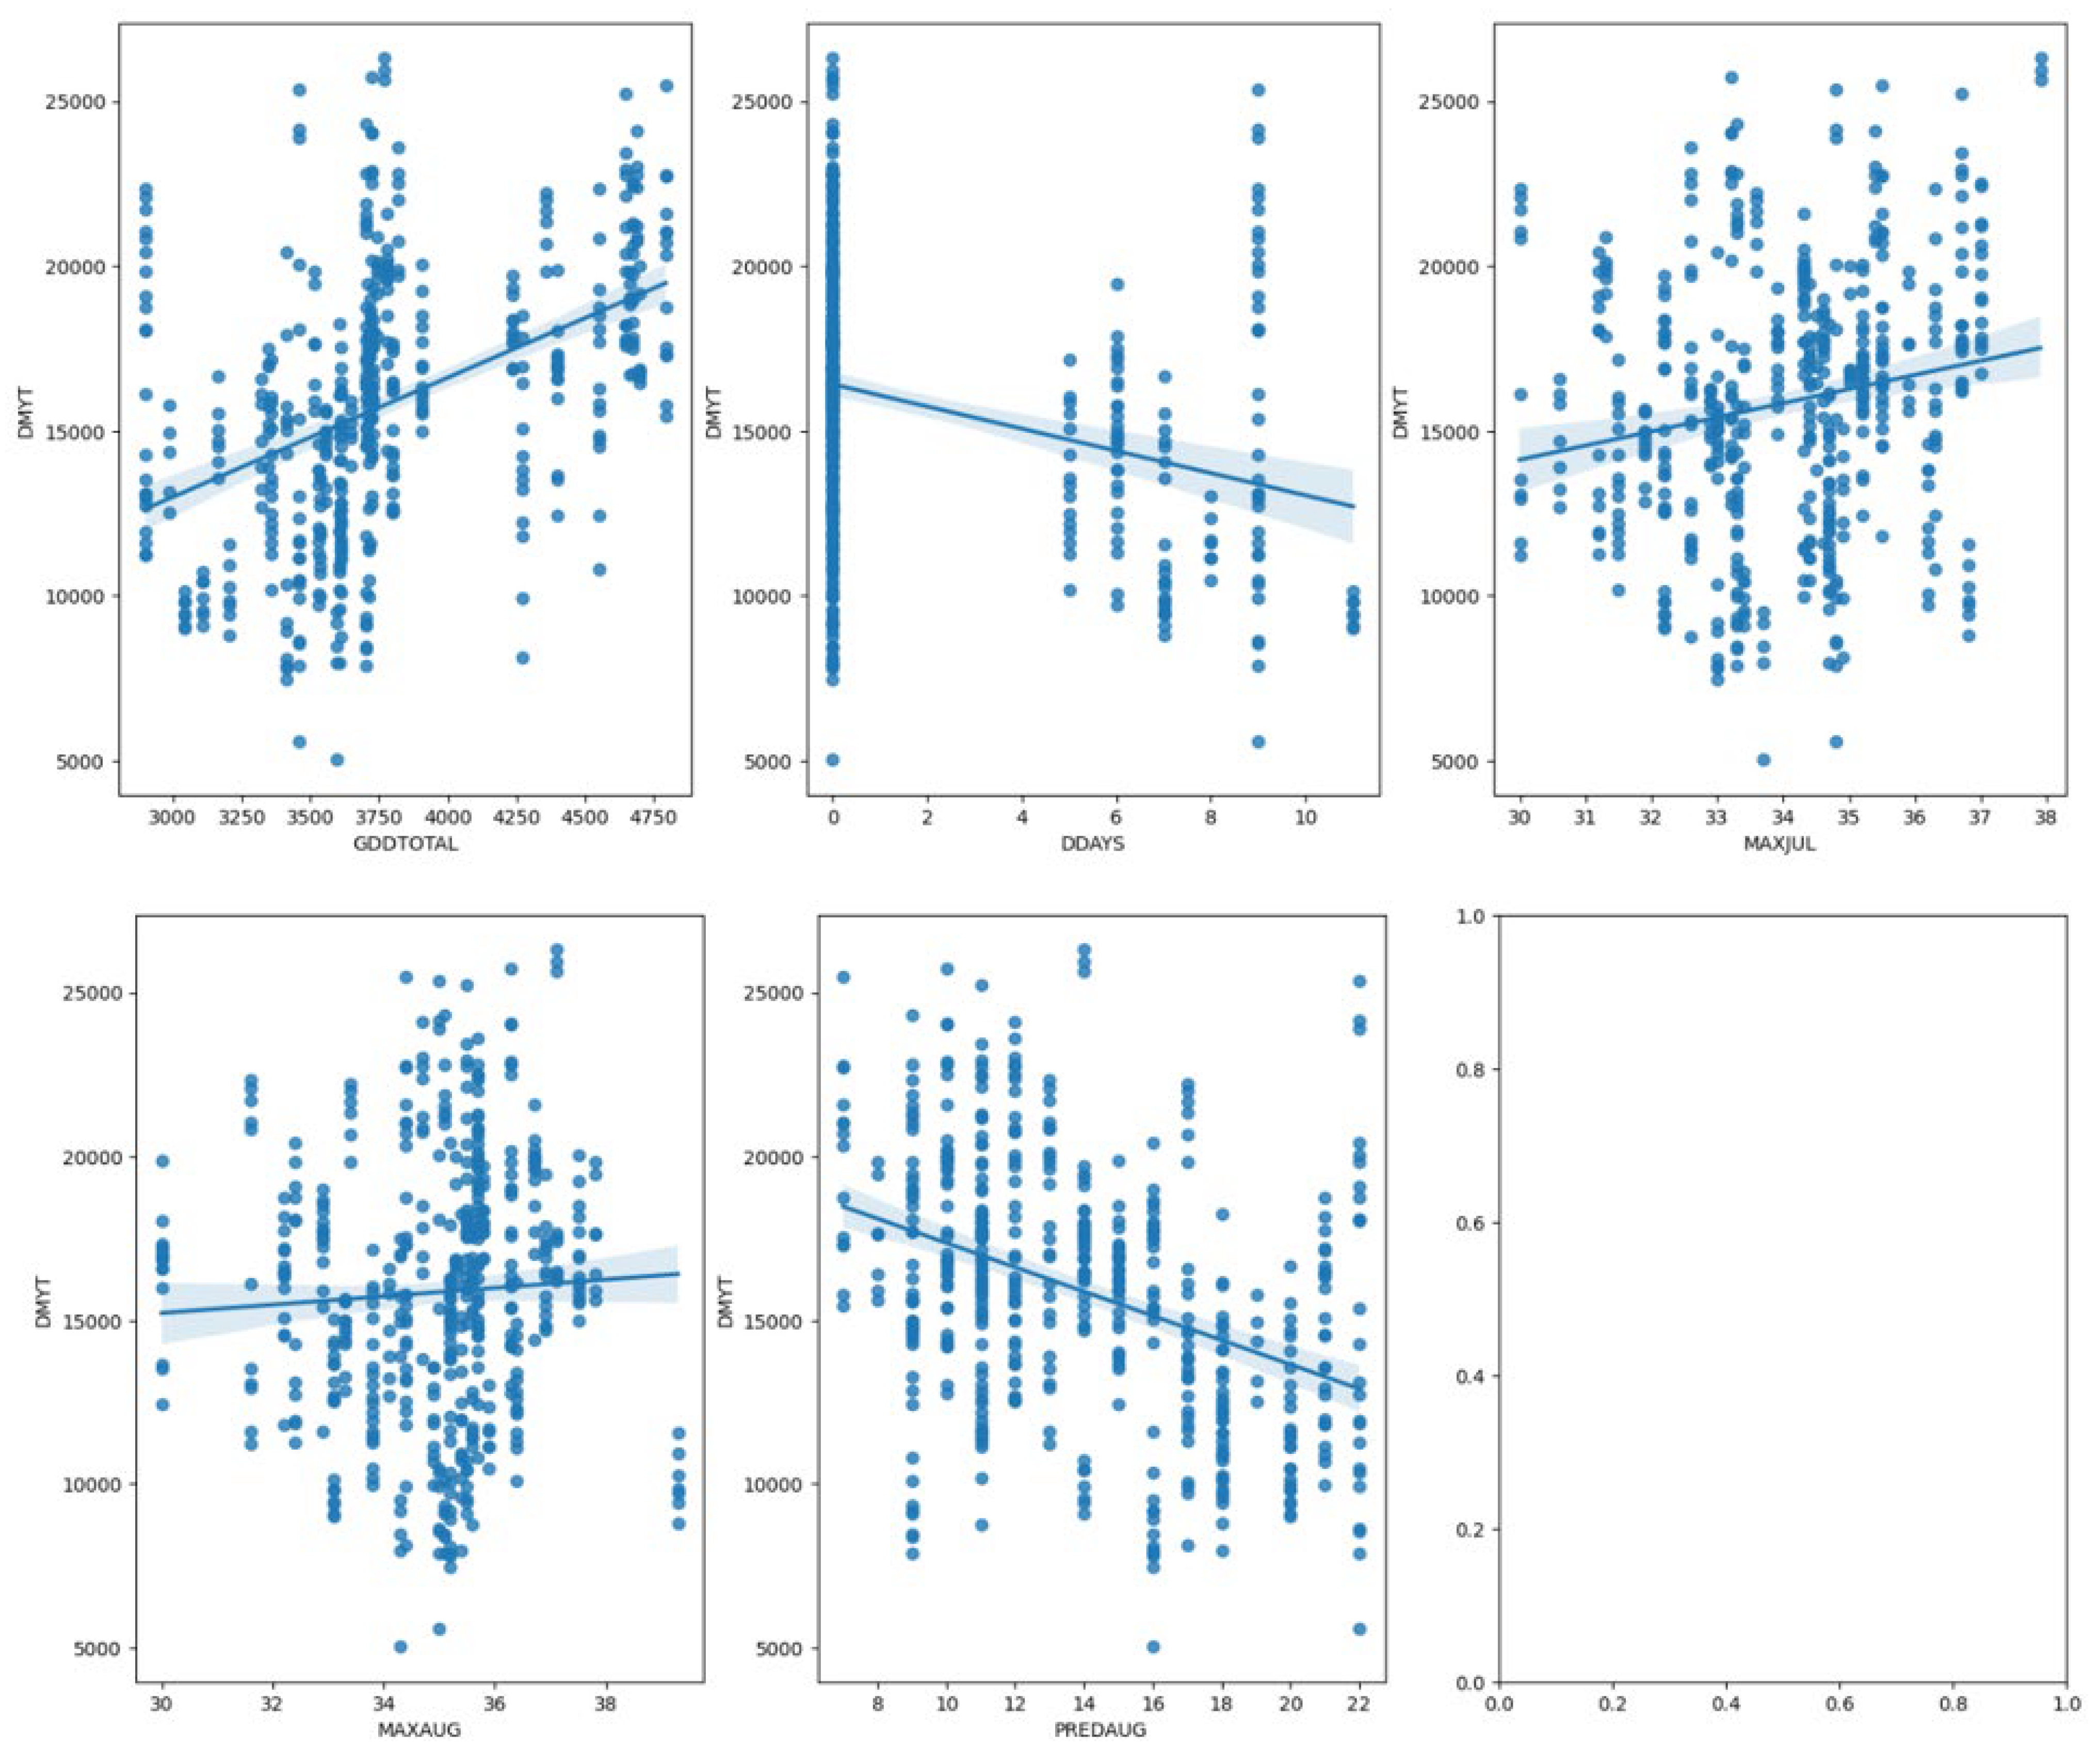
| GDD | GDDTOTAL | GDD From January to December | 3789.4775 | 493.55510 |
| DDAYS | PREDAUG | MAXJUL | MAXAUG | GDDTOTAL | ||
|---|---|---|---|---|---|---|
| Pearson | DMY1 | 0.444 | −0.381 | 0.181 | 0.055 | 0.444 |
| (a) | |||||||
| Model | R | R Squared | Adjusted R Squared | Standard Error of the Estimate | |||
| 2 | 0.482 | 0.233 | 0.230 | 3531.551 | |||
| (b) | |||||||
| ANOVA a | |||||||
| Model | Sum of Squares | Degree of Freedom | Mean Square | F | Significance Probability | ||
| 2 | Regression | 1,879,834,560.268 | 2 | 939,917,280.134 | 75.363 | 0.000 | |
| Residual | 6,198,512,188.682 | 497 | 12,471,855.510 | ||||
| Total | 8,078,346,748.950 | 499 | |||||
| (c) | |||||||
| Model | Non-Standardized Coefficient | Standardized Coefficient | t | Significance Probability | |||
| B | Standard Error | Beta | |||||
| 2 | (Constant) | 8380.649 | 1779.579 | 4.709 | 0.000 | ||
| PREDAUG | 2.757 | 0.367 | 0.338 | 7.521 | 0.000 | ||
| GDDTOTAL | −211.288 | 43.808 | −0.217 | −4.823 | 0.000 | ||
| Variables | Coefficients | Intercept | R2 | |
|---|---|---|---|---|
| Multivariate Regression (Stepwise) (N = 500, X = 5) | DMY1~ | 8380.649 | 0.23 | |
| PREDAUG | −211.288 | |||
| GDDTOTAL | 2.757 | |||
| Lasso Regression (N = 500, X = 5) | DMY1~ | 11,016.29 | 0.4799 | |
| DDAYS | 53.6 | |||
| PREDAUG | −205.95 | |||
| MAXJUL | −129.12 | |||
| MAXAUG | −7.35 | |||
| GDDTOTAL | 3.244 | |||
| Lasso regression (N = 400, X = 5) | DMY1~ | 12,613.215 | 0.367 | |
| DDAYS | 8.305 | |||
| PREDAUG | −133.099 | |||
| MAXJUL | −97.403 | |||
| MAXAUG | 12.386 | |||
| GDDTOTAL | 2.096 | |||
| Lasso regression (N = 300, X = 5) | DMY1~ | 5119.838 | 0.288 | |
| DDAYS | 21.278 | |||
| PREDAUG | −25.871 | |||
| MAXJUL | 170.076 | |||
| MAXAUG | 36.197 | |||
| GDDTOTAL | 1.1505 | |||
| Lasso regression (N = 500, X = 8) | DMY1~ | 13,656.397 | 0.434 | |
| DDAYS | 73.392 | |||
| PREDAUG | −235.871 | |||
| MAXJUL | −11.940 | |||
| MAXAUG | 250.936 | |||
| GDDTOTAL | −1.031 | |||
| MINTFEB | 314.83 | |||
| MINTMAR | −170.95 | |||
| MTMAR | 445.2049 | |||
| Lasso regression (N = 500, X = 15) | DMY1~ | 13,581.535 | 0.480 | |
| DDAYS | 64.391 | |||
| PREDAUG | −266.45 | |||
| MAXJUL | −33.03 | |||
| MAXAUG | 378.06 | |||
| GDDTOTAL | −0.7308 | |||
| GDDFJTA | −3.647 | |||
| PREDNOV | 94.77 | |||
| MINTJAN | 11.742 | |||
| MINTFEB | 282.09 | |||
| MINTMAR | −224.659 | |||
| MAXTNOV | −220.732 | |||
| MAXTMAR | −171.907 | |||
| MTJAN | −224.456 | |||
| MTFEB | 326.645 | |||
| MTMAR | 915.632 |
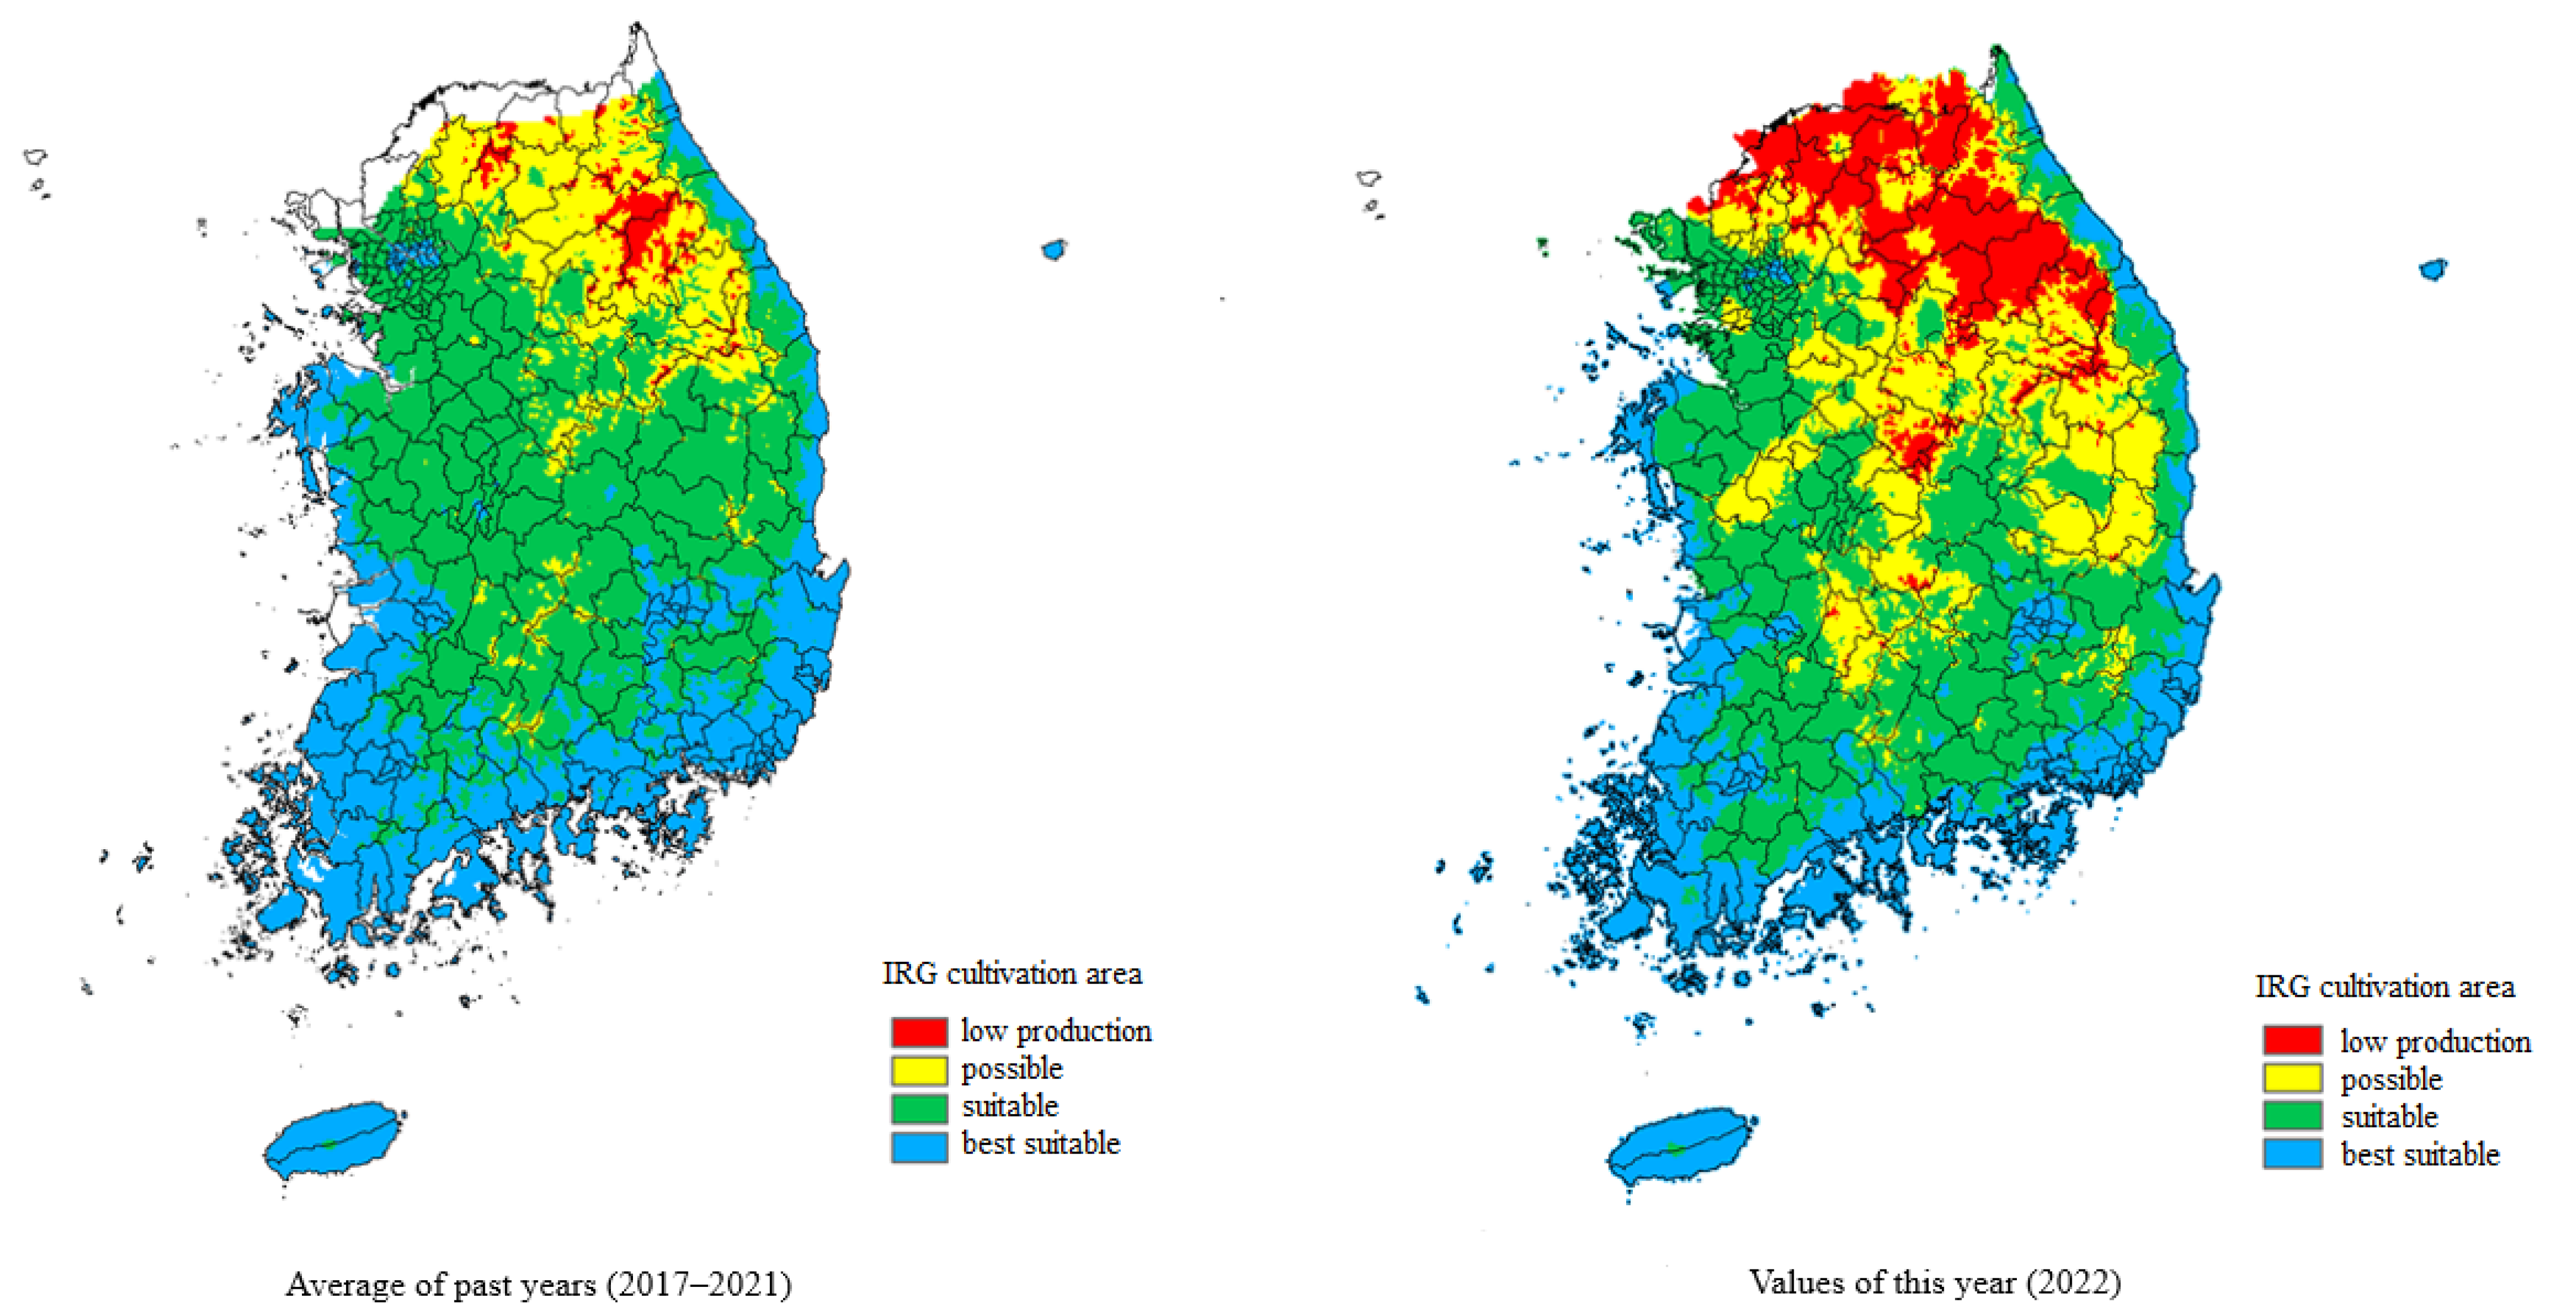
| Category (AVGMINTJAN) | Best Suitable (≥−5 °C) | Suitable (−5 °C~−9 °C) | Possible (−9 °C~−12 °C) | Low Production (<−12 °C) |
|---|---|---|---|---|
| Result of Year (2022) | 27% | 39% | 22% | 12% |
| Result of Past 5 Years (2017~2021) | 32% | 51% | 15% | 2% |
| Category (AVGMAXTAUG) | Best Suitable (≤25 °C) | Suitable (26 °C~28 °C) | Possible (29 °C~31 °C) | Low Production (≥32 °C) |
|---|---|---|---|---|
| Result of year (2022) | 16% | 64% | 20% | |
| Result of past 5 years (2017~2021) | 8% | 29% | 63% |
Disclaimer/Publisher’s Note: The statements, opinions and data contained in all publications are solely those of the individual author(s) and contributor(s) and not of MDPI and/or the editor(s). MDPI and/or the editor(s) disclaim responsibility for any injury to people or property resulting from any ideas, methods, instructions or products referred to in the content. |
© 2023 by the authors. Licensee MDPI, Basel, Switzerland. This article is an open access article distributed under the terms and conditions of the Creative Commons Attribution (CC BY) license (https://creativecommons.org/licenses/by/4.0/).
Share and Cite
Shin, M.; Hwang, S.; Kim, J.; Kim, B.; Jung, J.-S. A Study on Analyses of the Production Data of Feed Crops and Vulnerability to Climate Impacts According to Climate Change in Republic of Korea. Appl. Sci. 2023, 13, 11603. https://doi.org/10.3390/app132011603
Shin M, Hwang S, Kim J, Kim B, Jung J-S. A Study on Analyses of the Production Data of Feed Crops and Vulnerability to Climate Impacts According to Climate Change in Republic of Korea. Applied Sciences. 2023; 13(20):11603. https://doi.org/10.3390/app132011603
Chicago/Turabian StyleShin, MoonSun, Seonmin Hwang, Junghwan Kim, Byungcheol Kim, and Jeong-Sung Jung. 2023. "A Study on Analyses of the Production Data of Feed Crops and Vulnerability to Climate Impacts According to Climate Change in Republic of Korea" Applied Sciences 13, no. 20: 11603. https://doi.org/10.3390/app132011603
APA StyleShin, M., Hwang, S., Kim, J., Kim, B., & Jung, J.-S. (2023). A Study on Analyses of the Production Data of Feed Crops and Vulnerability to Climate Impacts According to Climate Change in Republic of Korea. Applied Sciences, 13(20), 11603. https://doi.org/10.3390/app132011603


