Article

Semi-Analytical Prediction of Ground Surface Heave Induced by Shield Tunneling Considering Three-Dimensional Space Effect

1
Faculty of Engineering, China University of Geosciences, Wuhan 430074, China
2
Wuhan Metro Group Co., Ltd., Wuhan 430070, China
3
Wuhan Rail Transit Line 12 Construction and Operation Co., Ltd., Wuhan 430010, China
*
Author to whom correspondence should be addressed.
Appl. Sci. 2023, 13(20), 11588; https://doi.org/10.3390/app132011588
Submission received: 13 September 2023 / Revised: 15 October 2023 / Accepted: 16 October 2023 / Published: 23 October 2023
(This article belongs to the Section Civil Engineering)

Abstract

:
The ground surface deformation induced by shield tunnels passing through enclosure structures of existing tunnels is a particular underground construction scenario that has been encountered in Wuhan Metro Line 12 engineering cases in China. Timely ground deformation prediction is important to keep shield tunneling safe. However, the classic ground deformation theory is difficult to accurately predict for this ground deformation. This paper develops a semi-analytical method to predict ground heave considering the space effect in this engineering condition. Based on the improved ground deformation theory, a novel deformation prediction method for the ground and enclosure structure is derived and combined with Kirchhoff plate theory. Comparing with field deformation measurements, the maximum difference between the measured and calculated deformation is 14.6%, which demonstrates that the proposed method can be used to predict the ground heave induced by shield tunnels passing through the enclosure structure of existing tunnels. The parameters of the underground diaphragm wall used in Wuhan Metro Line 12 are further studied in detail. The results show that the ground heaves have a positive correlation with the embedded ratio of the diaphragm wall, but a negative correlation with its elastic modulus and thickness. However, the thickness and embedded ratio have a limited effect on ground heaves. This study provides a technical reference for optimizing the setting of enclosure structures in order to protect existing buildings.

1. Introduction

The construction of subway tunnel shielding in urban settings disturbs the original stress state of the surrounding soil [1,2], which may lead to the cracking, tilting, and even collapse of preexisting buildings [3,4,5,6,7,8]. Therefore, it is essential to protect buildings from damage during shielding excavation. Engineers need to possess adequate specialized knowledge in order to estimate the potential ground movements so that they can assess whether the damage of neighboring buildings would be serious.
Early studies focus on using elastic mechanics and soil mechanics to solve the analytical solutions of ground deformation considering simplified tunnel excavation boundaries [9]. For example, Mindlin [10] used the Galerkin method to derive the formation of stress fields and displacement fields under the action of concentrated forces in elastic half spaces. Based on this form, Timoshenko [11] proposed a general solution in the form of Airy’s function to describe the ground deformation caused by tunnel excavation. Sagaseta [12] assumed that the soil was an incompressible, isotropic, elastic semi-infinite body and adopted the mirror image method to eliminate the influence of the top free boundary. The soil strain and stress field caused by formation loss at a depth below the surface was then analyzed. Verruijt [13] adopted a complex function method to derive the analytical deformation solution of the ground caused by circular tunnel excavations in elastic half spaces. Empirical solutions can extend application conditions of the proposed analytical solution. The empirical formula for predicting ground settlement caused by tunnel excavations was first proposed by Peck [14], and the Gaussian normal distribution curve was used to describe the ground settlement profile. Later, many scholars further improved Peck’s [14] equation according to different geological conditions, such as Zhao et al. [15], Moh et al. [16], and Atkinson et al. [17]. Finno et al. [18] pointed out that Peck’s [14] equation and its modified forms have unavoidable calculation errors due to not considering the soil’s three-dimensional (3D) space effect. A 3D numerical simulation method was gradually developed to analyze ground deformation [19,20,21,22]. Wang et al. [23] presented a case study of ground settlements induced by twin shield tunneling in Copenhagen using analytical and numerical methods. Although the numerical method has advantages in simulating complex boundary conditions and capturing the 3D space effect, it has shortcomings that make it highly time consuming challenging to model ([24,25]). Therefore, it is desirable to develop a simple and practical method for calculating the ground movements.
In addition, there are imbalances in many large soil-tunnel structures caused by shield tunnels passing under existing tunnels, which is another common and important problem that has been studied by many scholars [26,27,28,29,30]. Klar et al. [31] studied the effect of shield excavation on existing pipelines by using the boundary integral method, and gave the normalized solution of calculating the maximum bending moment and angle. Zhang et al. [32] studied the soil disturbance caused by multi-line tunnels and the complex overlapping interaction mechanisms of adjacent tunnels. Combined with the field monitoring data of tunnels in Shanghai, the theoretical solution of the existing tunnel is obtained. He et al. [33] pointed out that shield tunneling affected the stability of existing tunnels, and it was crucial to make a reasonable supporting scheme. At present, the protection measures for existing tunnels are building enclosure structures to cut off building and existing tunnels [34,35] and strengthening the surrounding soil with grout [33,36]. Grout fluid is difficult to control and easy to lose, so enclosure structures can better control the soil and the existing tunnel’s deformation. Shield tunneling would produce additional thrust acting on the enclosure structure. If additional thrust is too large, the enclosure structure may cause a large squeeze deformation, which leads to ground heave. However, predicting the deformation of the enclosure structure and the ground heave induced by shield tunnels passing through the enclosure structure is still an unsolved challenge.
This paper aims to derive a simple, explicit solution for predicting the ground heave induced by shield tunnels passing through enclosure structures of existing tunnels considering the 3D space effect. To fulfill this objective, the relationships between the deformation volume of the enclosure structure and ground deformation volume are first established. Furthermore, the ground heave solutions considering 3D space effect are obtained. The validity and applicability of the proposed method is checked with field deformation monitoring results of preexisting Yuanlin Road station when Metro Line 12 passing through Line 4. The proposed method may offer some insights in evaluating the ground heaves induced by tunnels passing through enclosure structures for the purpose of protecting existing buildings.

2. Problem Description

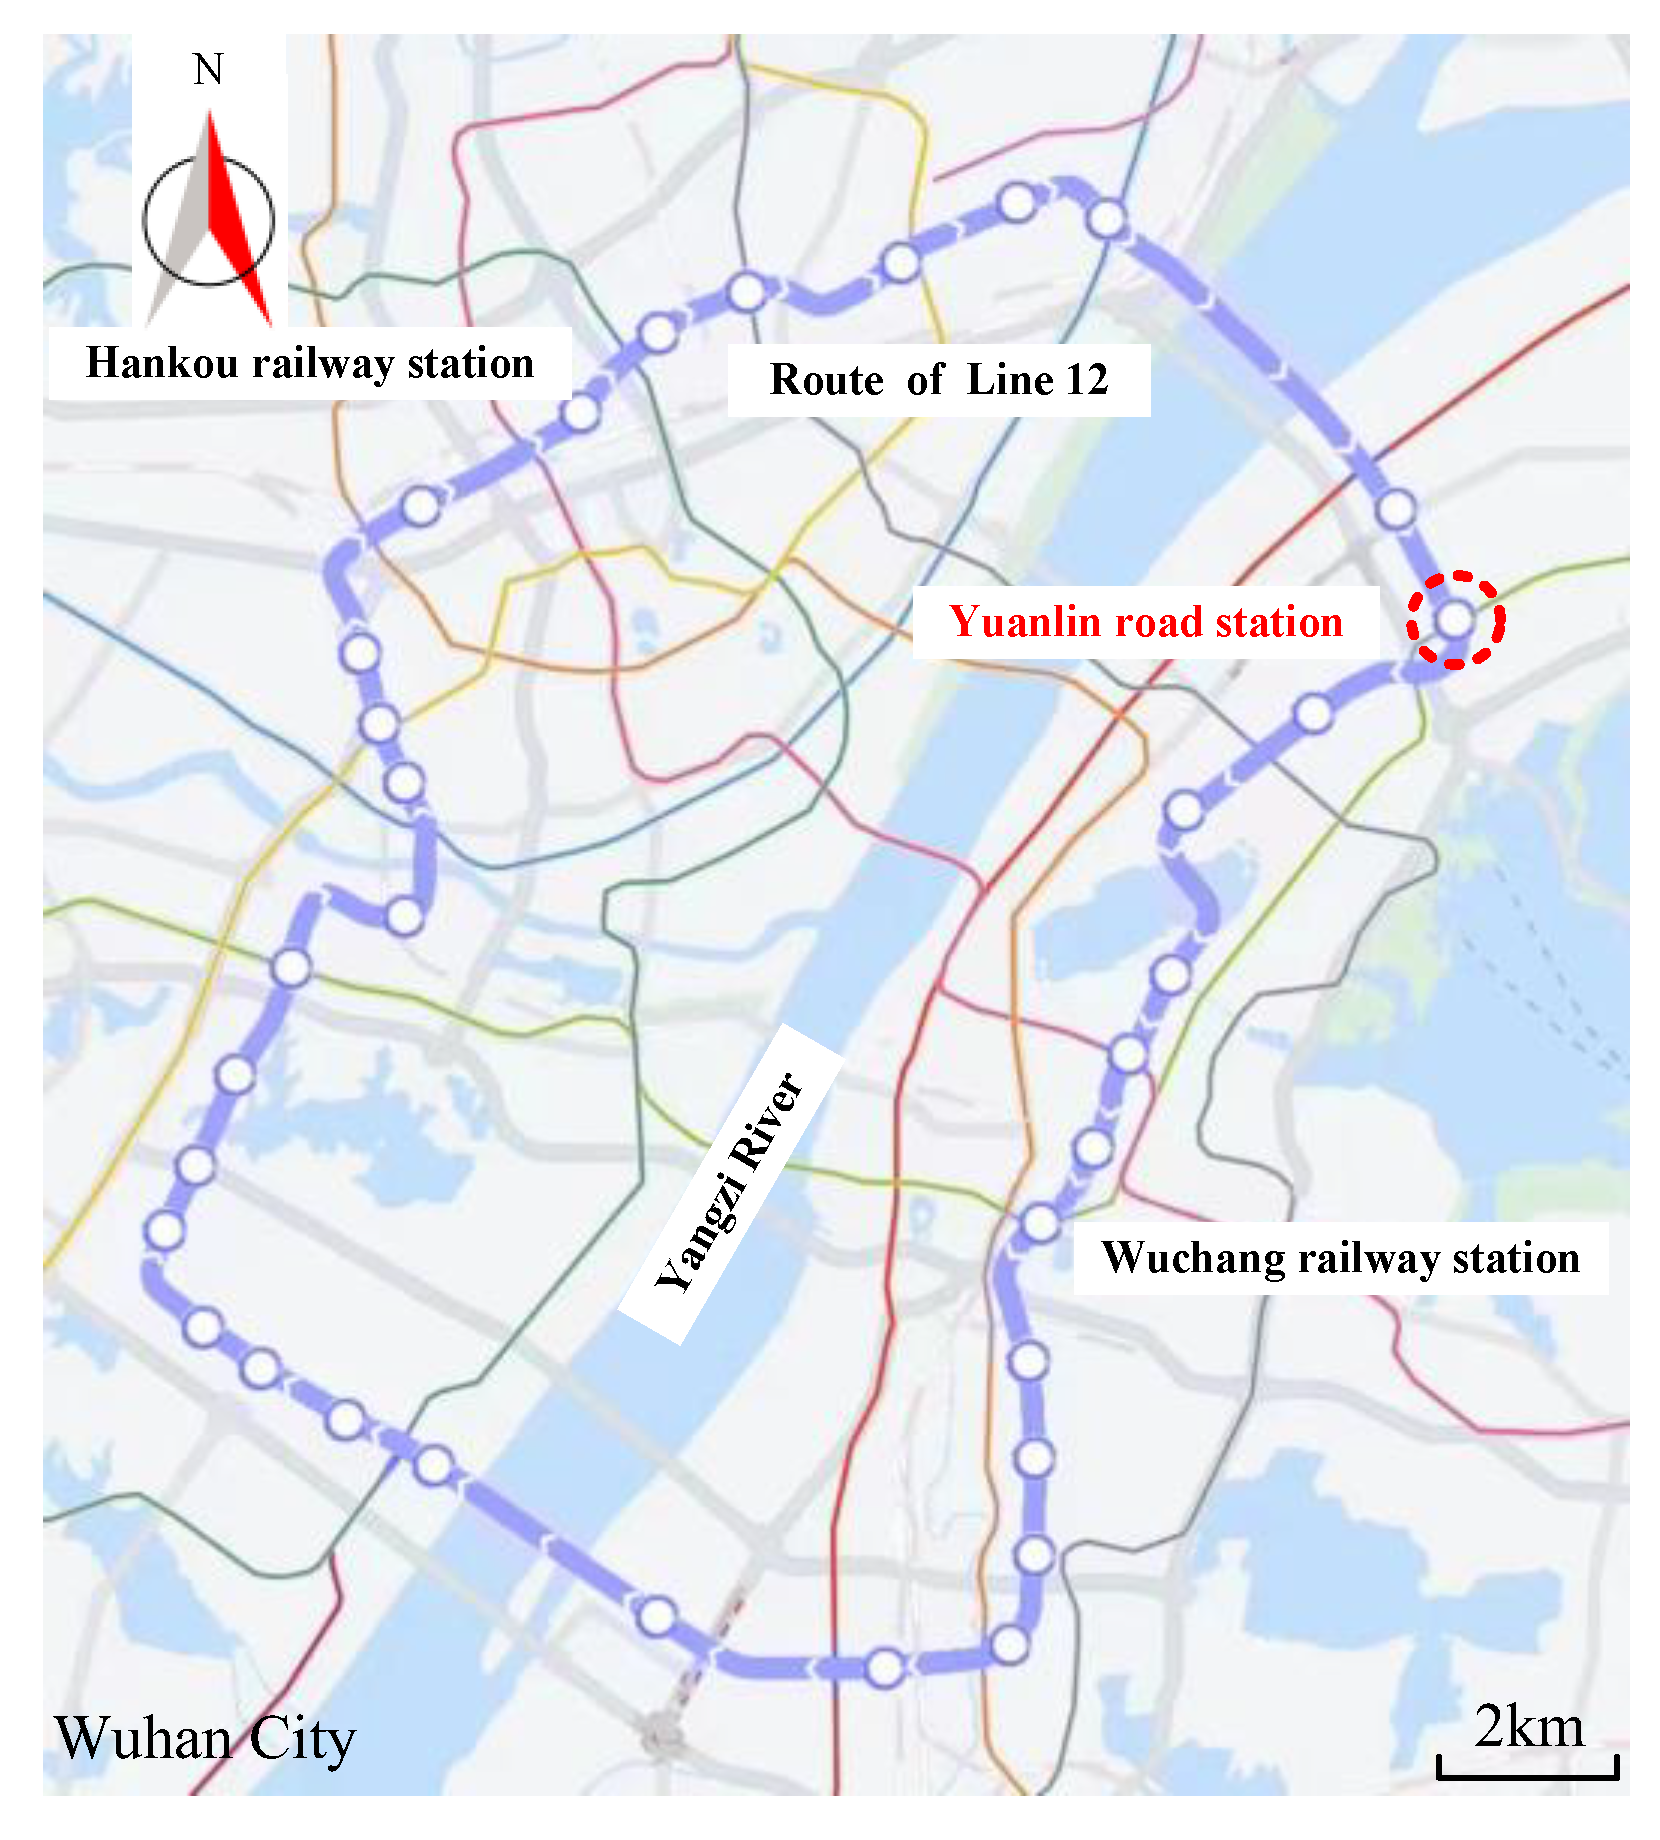
2.1. Engineering Background

Wuhan Metro Line 12, China’s only loop line in the Wuhan Metro network, has a total length of 59.9 km and consists of 37 stations. Single line and double-hole schemes are adopted in Line 12. The diameter of the tunnel is 6.8 m, and its thickness is 400 mm. The route map of Wuhan Metro Line 12 is shown in Figure 1. At the position of the planned Yuanlin Road station, Line 12 needs to underpass Yuanlin Road station of Metro Line 4.
The Yuanlin Road station of Line 4 is a single-column and double-span box structure, and has been in operation for many years. The covering thickness of the station is 2.9 m, the buried depth of the bottom plate is 15.46 m, and the width of the station foundation pit is 19.7 m. The base of the station is located in the silty sand layer. The distance between the Line 12 and bottom plate of Yuanlin Road station is only 2.34 m. Hence, it is very dangerous for Line 12 to pass through Yuanlin Road station of Metro Line 4.
In order to ensure Line 12 passes through Yuanlin Road station of Line 4 safety, an underground diaphragm wall with a thickness of 1200 mm and length of 41 m is considered. The diaphragm wall is a widely used enclosure structure in urban underground engineering construction with high stiffness, good anti-seepage performance, and few effects on the surrounding environment. C30 concrete is used to construct diaphragm walls. The bottom of the wall is set into the weathered silty mudstone at a depth of 2 m. The I-steel joint is adopted to bond each wall segment. However, even with the protection of the underground diaphragm wall, large deformations may occur in the Yuanlin Road station because the additional thrust from tunneling with Line 12 passing through the underground diaphragm wall. Figure 2 shows the space relationship of Metro Line 12, Line 4, and the underground diaphragm wall. Hence, it is important to accurately evaluate the deformation of Yuanlin Road station to determine if more supporting schemes should be adopted.

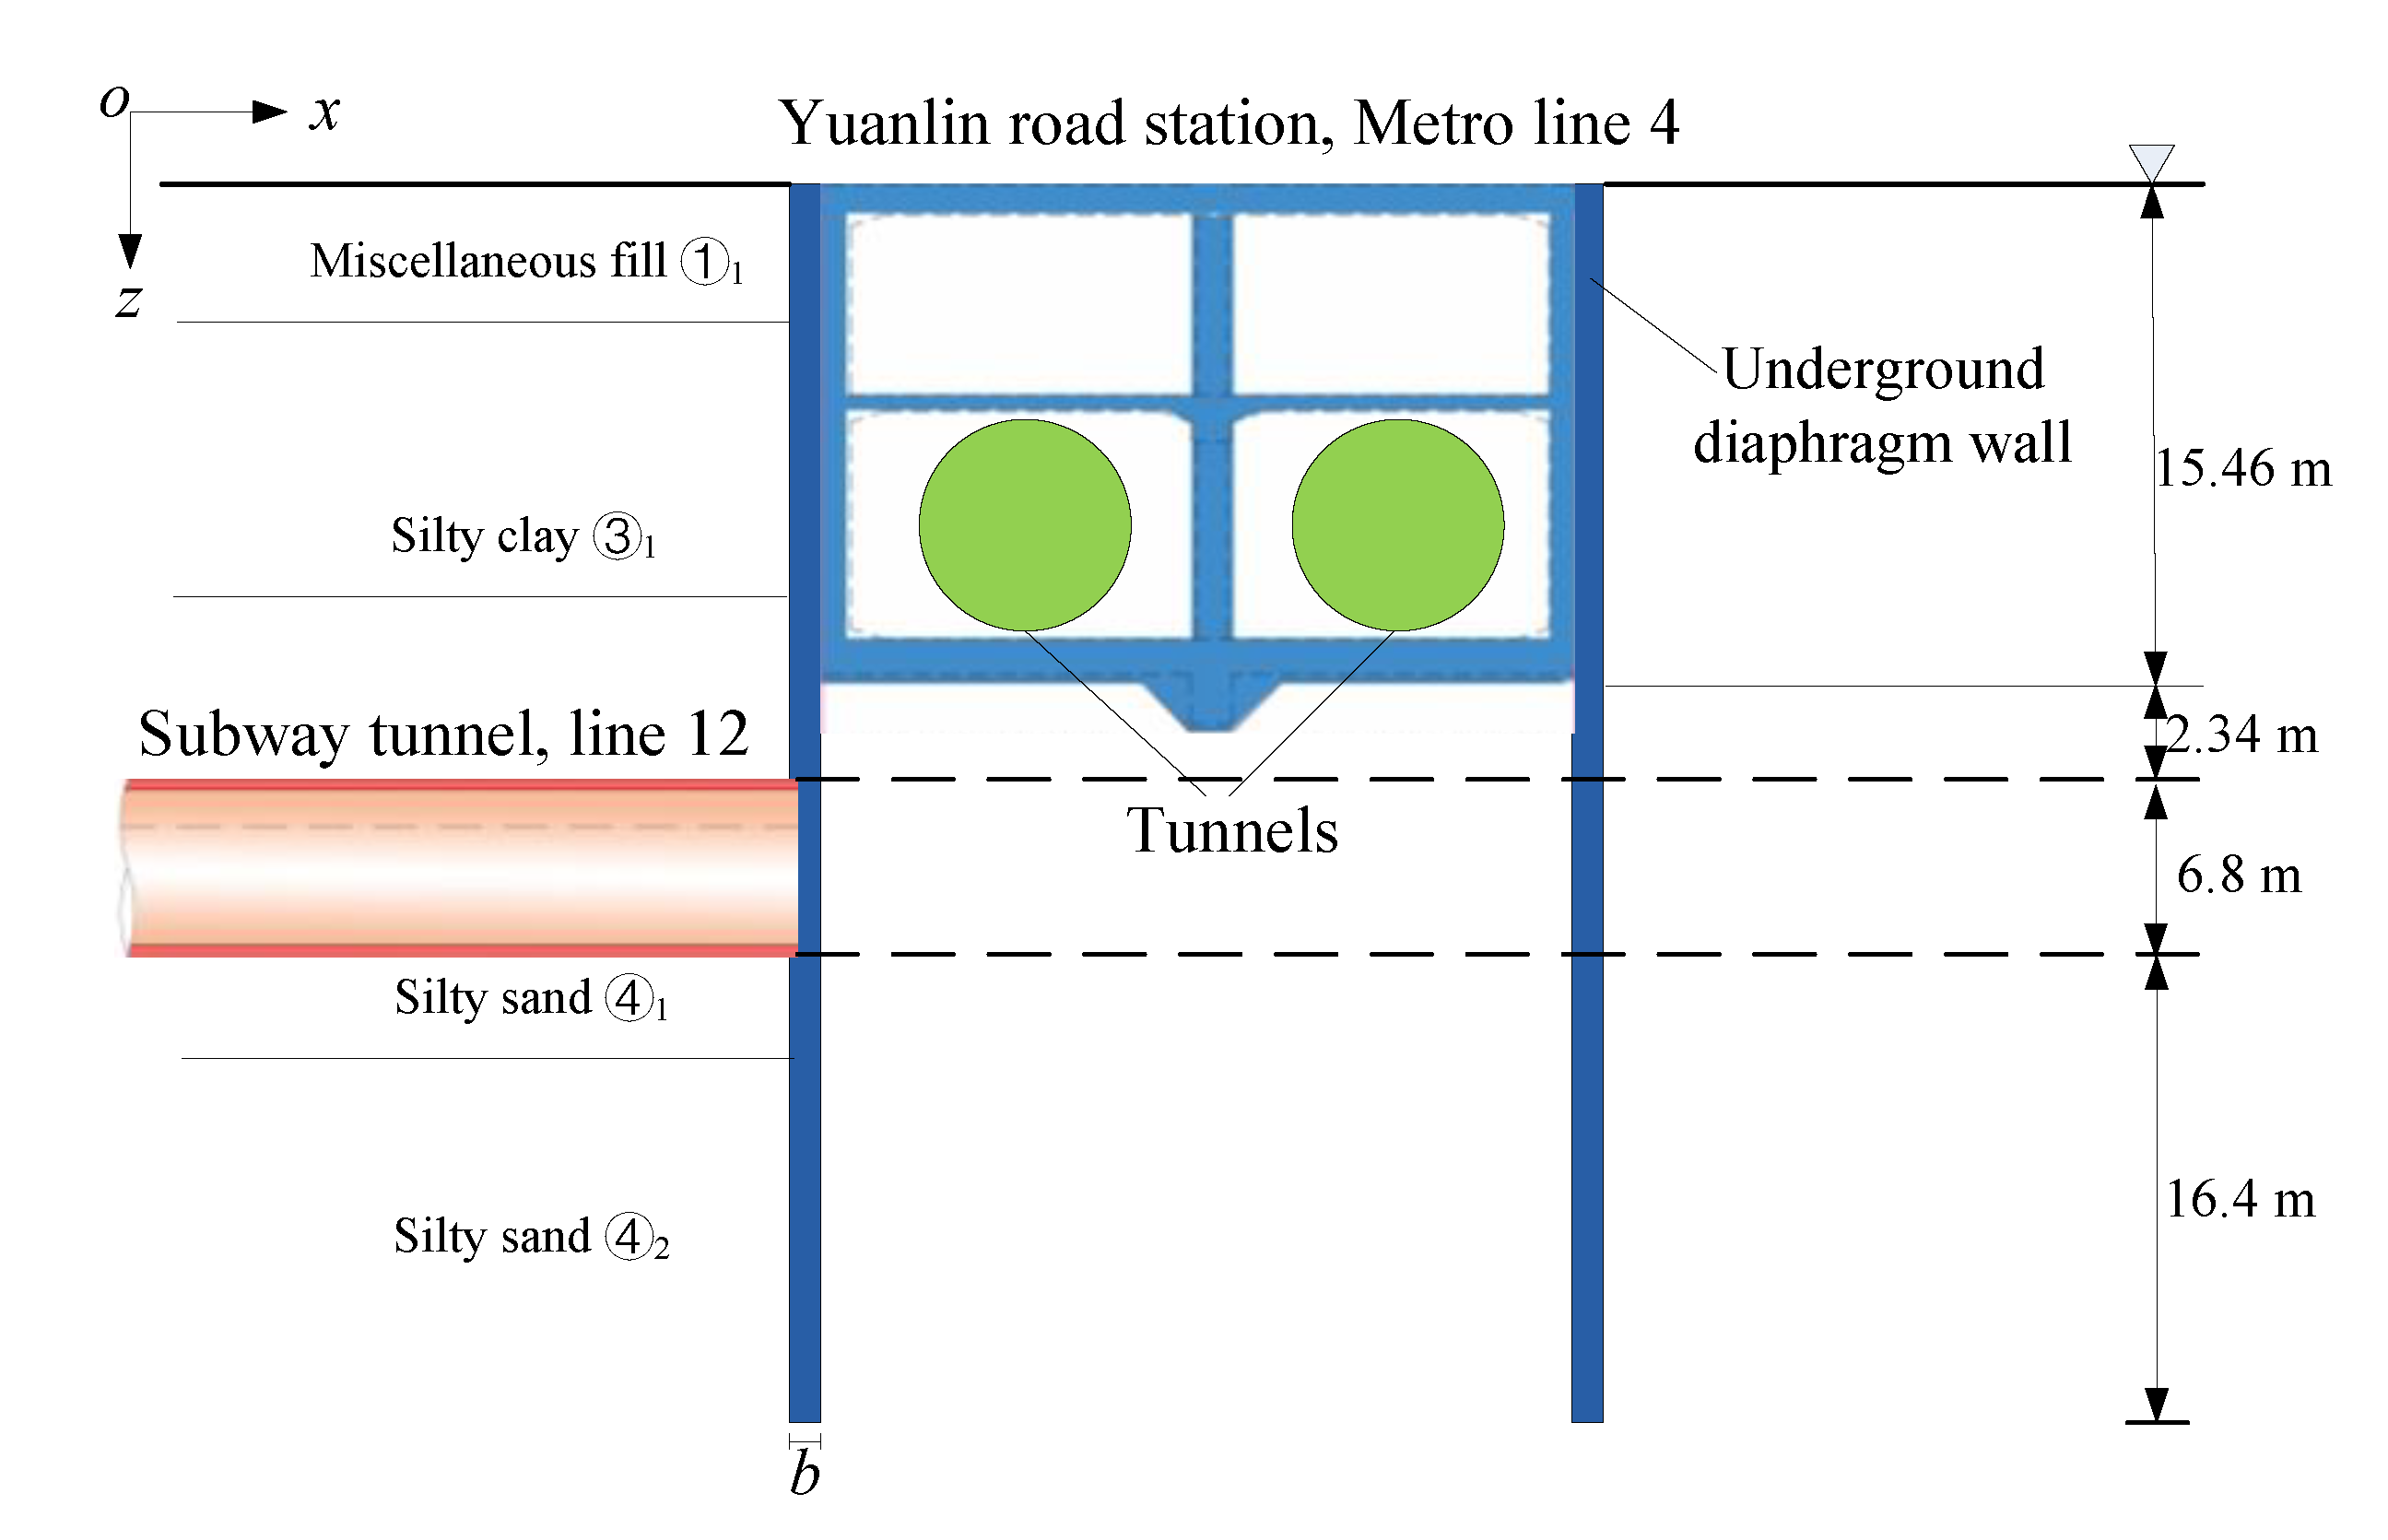
2.2. Engineering Geological Conditions

The proposed project site is located in a river accumulation plain area and belongs to the first-class terrace of the Yangtze River. The terrain of the site is low in the west and high in the east, and the ground elevation varies between 20.8 and 21.6 m. The strata of the site from top to bottom are mainly ①1 miscellaneous fill, ③1 silty clay, ④1 silty sand, and ④2 silty sand, as shown in Figure 2. Line 12 is located in the silty sand layer. The physical parameters of the soils are listed in Table 1, which originates from the survey and design files of Metro Line 12.

3. Prediction Method of Ground Heave Considering the 3D Space Effect

3.1. Basic Assumptions

This section illustrates the prediction method of shield tunneling-induced ground heave considering the 3D space effect. Some assumptions are introduced to establish the deformation calculation method, which are as follows:
(1)
The diaphragm wall is a linear elastic material, and underground water is not considered.
(2)
Under the process of tunneling, the soil volume behind the underground diaphragm wall remains constant.
(3)
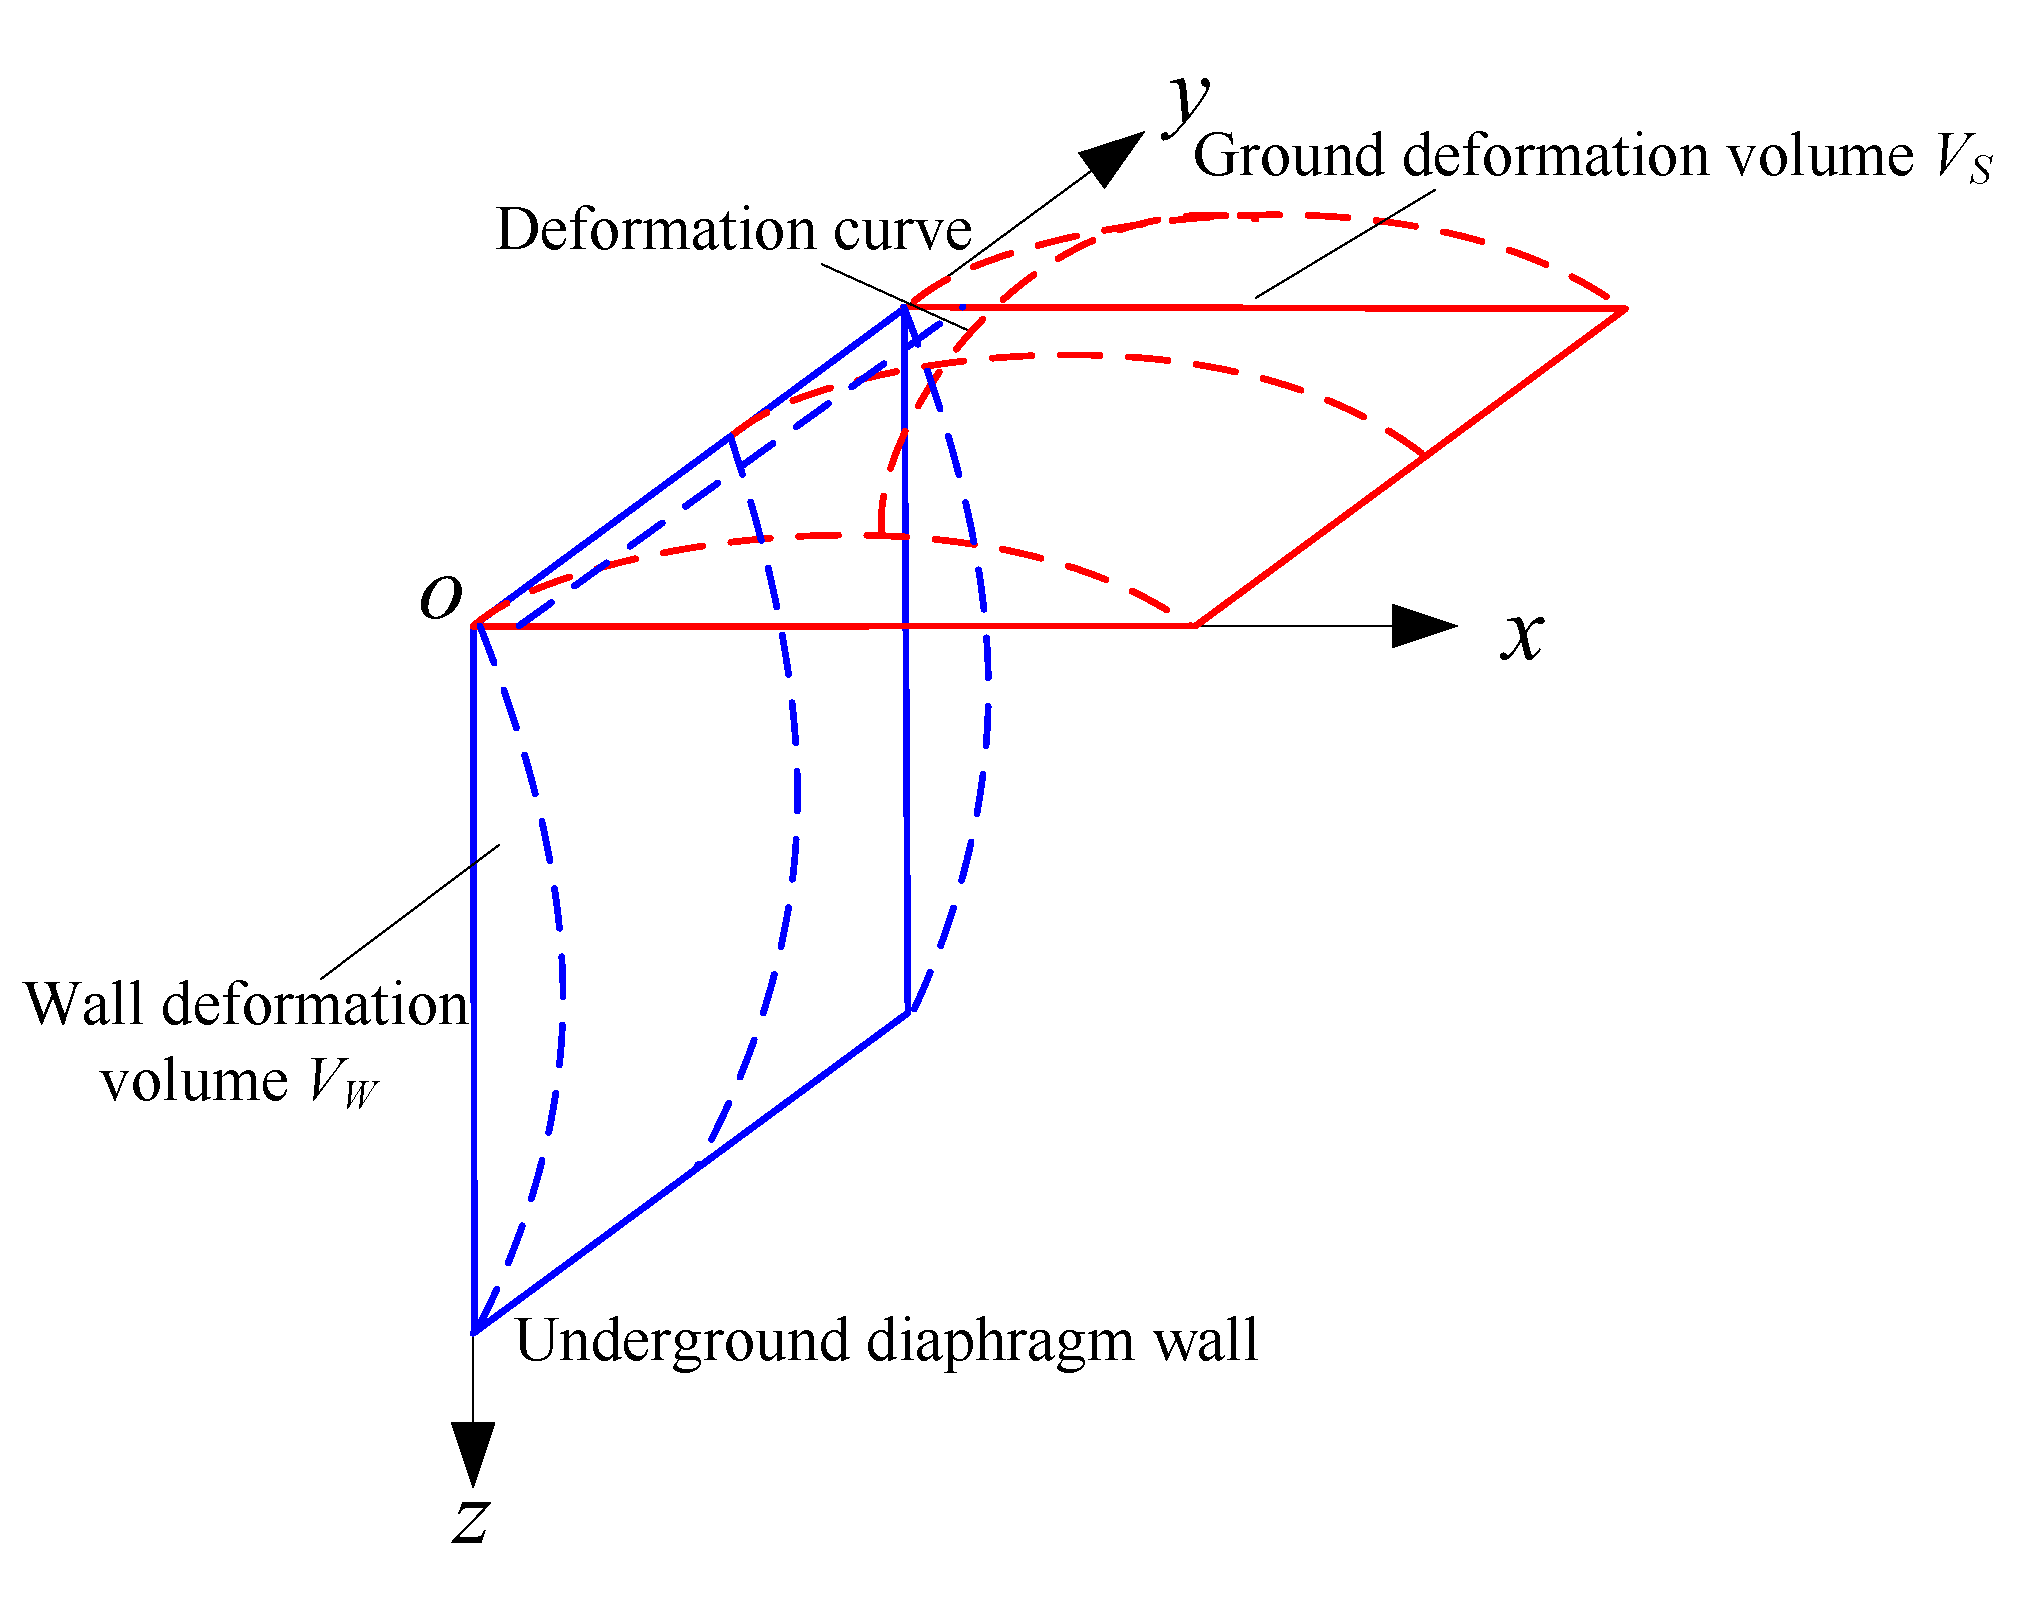
Ground heave is induced by lateral deformation of the underground diaphragm wall, which is shown in Figure 3.
(4)
Diaphragm wall deformation volume VW has a proportional relationship with deformation volume VS.
This is example 1 of an equation:
VS = MuVW,
where Mu is coefficient proportionality, which depends on compressibility of soil [38]. Considering silty clay used in Metro Line 12, the value of Mu can be set as 0.8.
(5)
In order to simplify the calculation, the weighted average method is used to homogenize multilayer soils.
(6)
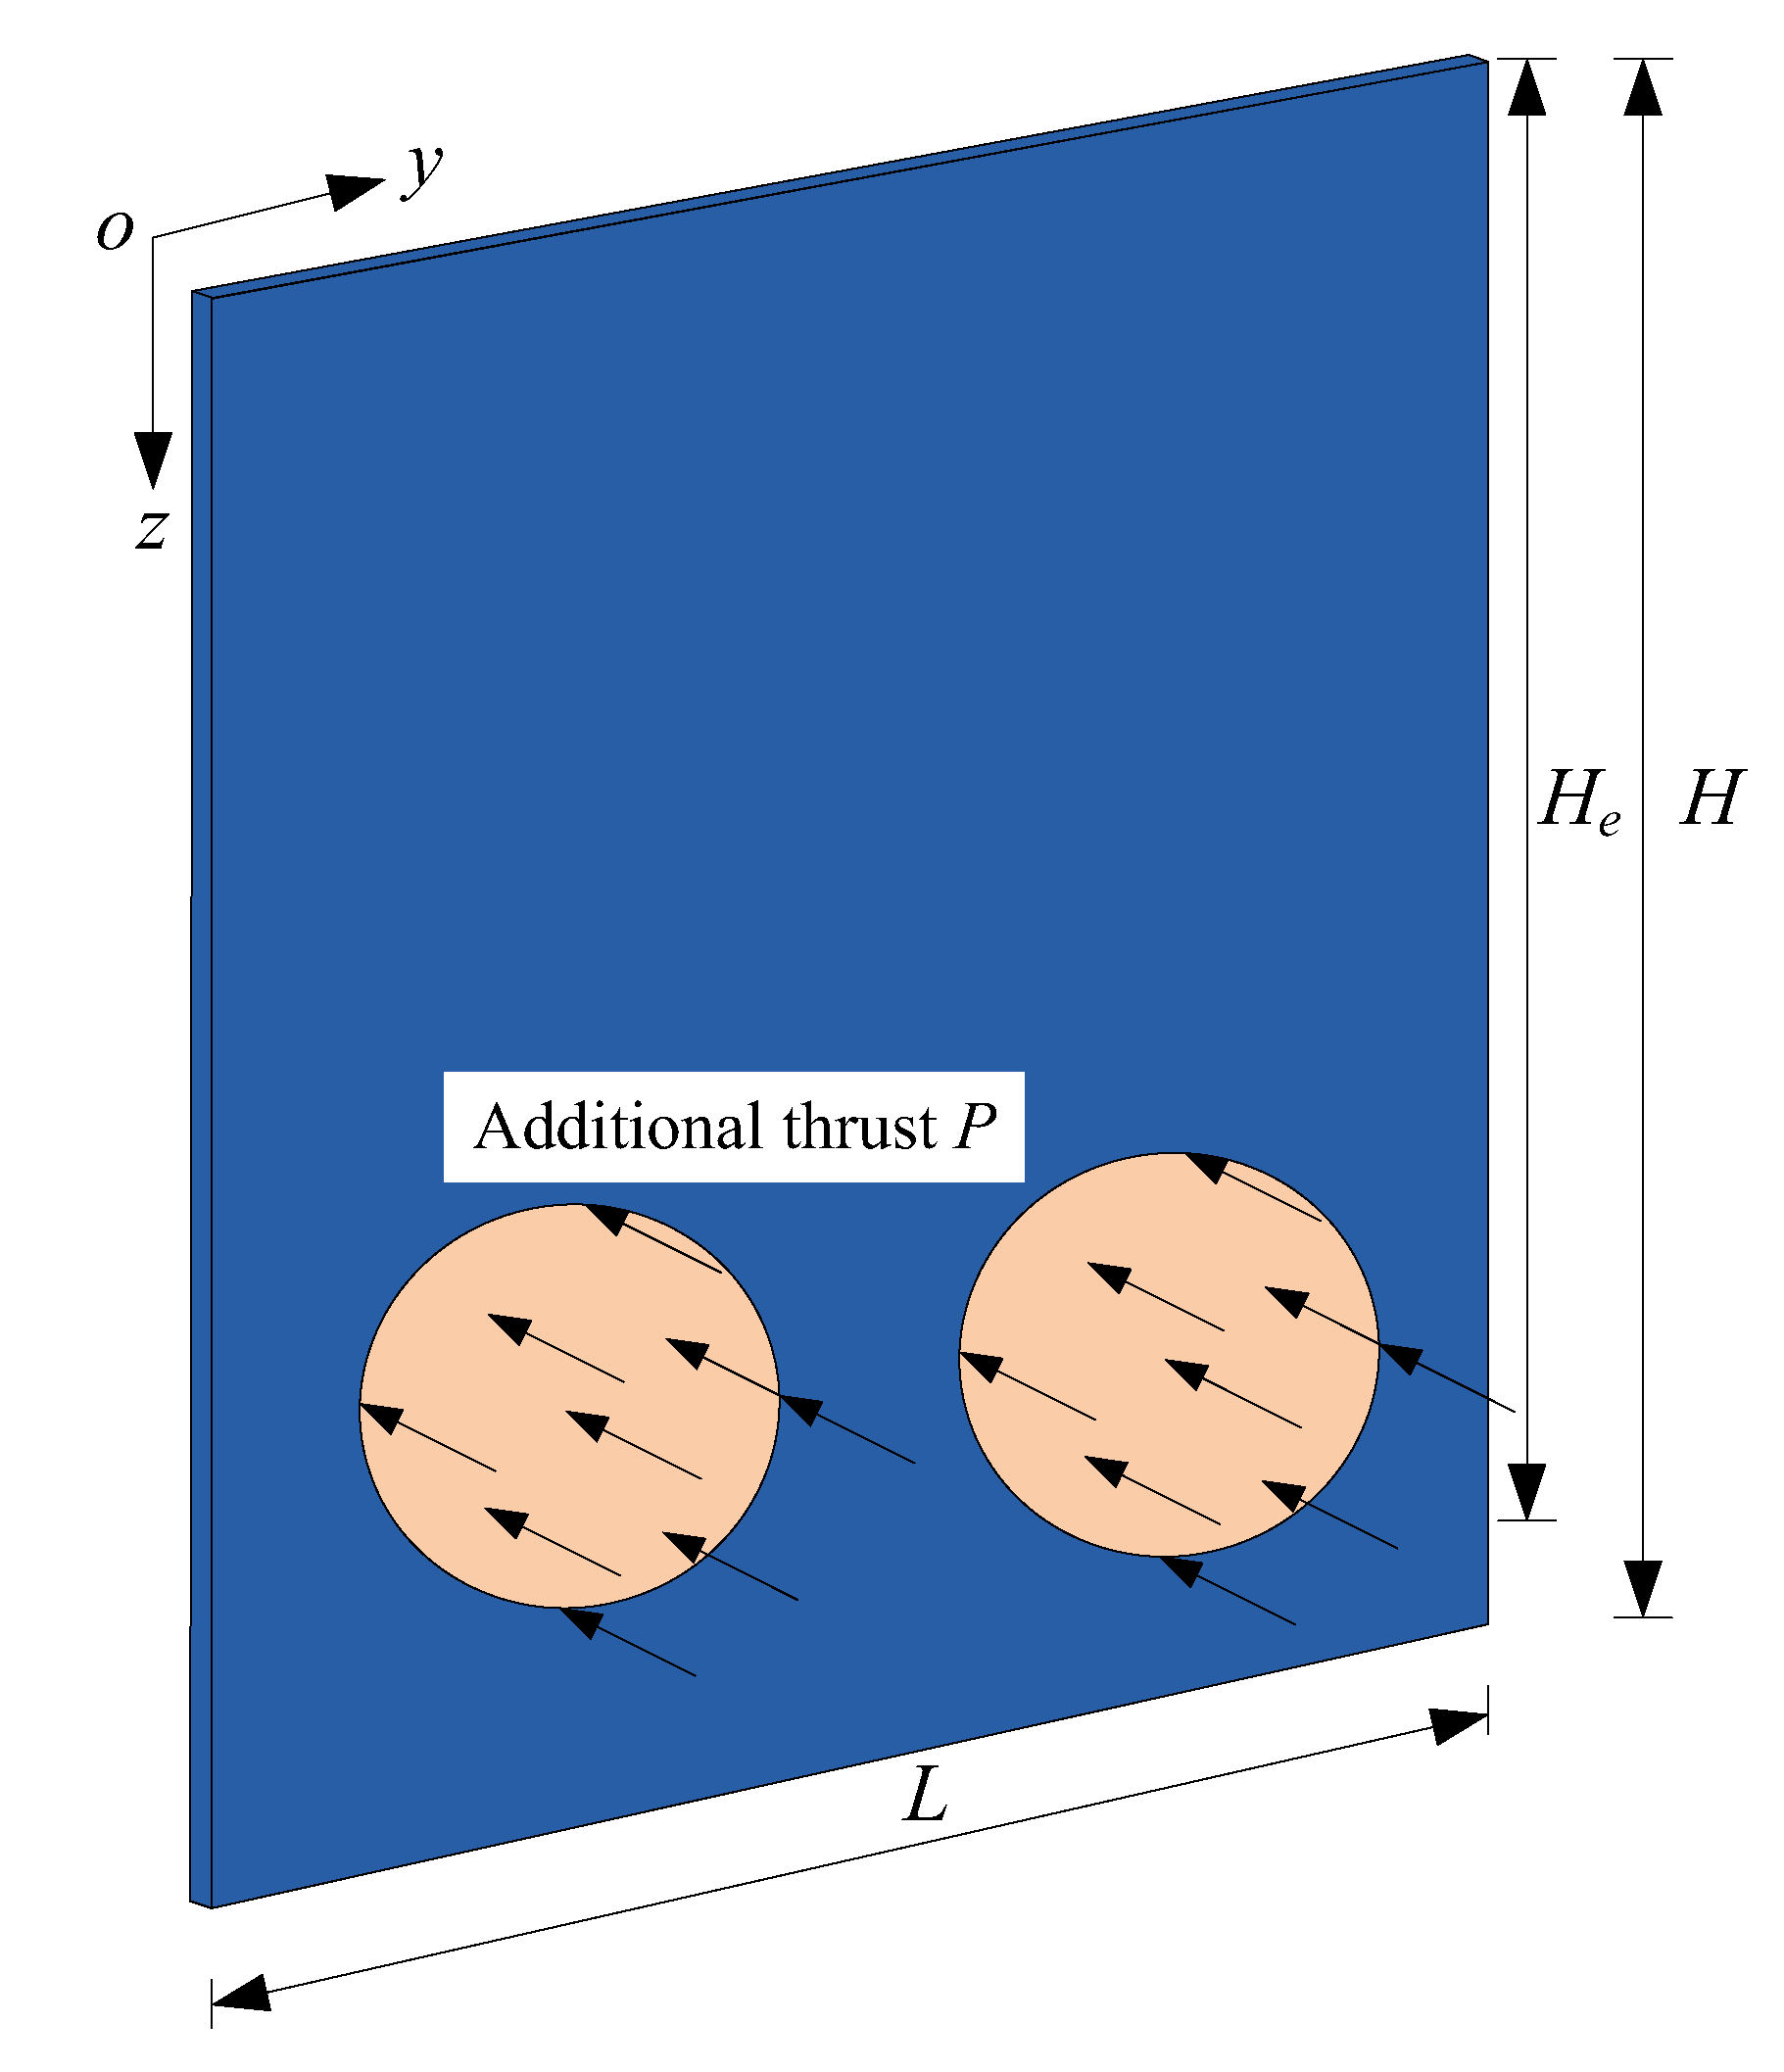
The diaphragm wall follows Kirchhoff plate theory [39]. The reason is that the ratio of width and depth of the wall is 1.2 m/41 m, which far less than 1/5. Hence, this wall is a typical Kirchhoff plane.
(7)
Due to high strength of the diaphragm wall, only elastic deformation is considered in the wall, which is widely adopted. Additionally, the diaphragm wall is considered as an isotropic material.
Based on the above assumptions, a calculation model of ground heave induced by the diaphragm wall deformation is established.

3.2. Deformation Volume of Diaphragm Wall

In our engineering case, the deformation of the diaphragm wall is induced by additional thrust during shield tunneling. This can be simplified as a rectangular thin plate bending with four edges that are simply supported, as shown in Figure 4.
Navier [38] thinks of the deflection of Kirchhoff plate w as a double Fourier Series,
w = m = 1 n = 1 A m n sin m π y L sin n π z H
where Amn is Fourier coefficient, and m and n are positive integer. Considering all boundary conditions, the value of Amn can be obtained. The deflection w for additional thrust P acting on diaphragm wall is induced. The more detailed derivation process is seen in Appendix A. The deformation volume VW of wall can be further calculated as
V W = 0 L 0 H w d y d z
Equation (3) is expanded, a primary expression is obtained,
V W = m = 1 n = 1 A m n L H m n π 2 cos m π 1 cos n π 1

3.3. Ground Deformation Volume

Due to the space effect of the considered ground deformation, a transverse deformation curve (x-direction) perpendicular to the diaphragm wall and longitudinal deformation curve (y-direction) parallel to the diaphragm wall should be introduced to calculate the deformation volume. Many experimental and numerical results show that the transverse deformation curve has a good agreement with normal distribution [3,38], as shown in Figure 5a. Hence, the expression of transverse deformation curve is
S x = S x max e π x x m 2 / x 0 x m 2
where Sxmax is maximum value of transverse deformation, x0 is influence range of transverse deformation, and xm is distance from the position where it has the maximum deformation value. Based on field monitoring and theoretical results, Peck’s [14] raised that ground deformation of sandy clay is in range of 2 times the excavated depth, and soft soil in 2.5 to 5 times the excavated depth. Peck’s [14] suggestion does not give the value of influence for the range of deformation. Bowles [38] studied ground and wall movements induced by excavation of foundation pits. They developed an empirical expression to determine the value x0 of ground movement:
x 0 = H tan 45 φ / 2
where φ is friction angle of soil. It is also used by Fan et al. [3], Kung [40], Clough and ORourke [41]. Likewise, the xm can be calculated with an empirical expression
x m = H tan 82 ° 2.36 φ
Longitudinal deformation curves can be fitted better with the Boltzmann function based on a large number of measured data of ground deformation in Beijing, China [42]. Figure 5b shows the longitudinal deformation calculated model. Hence, ground longitudinal deformation can be expressed as
S y = S y max 1 1 + e y y 0 / 2 / 12
where Symax is maximum value of longitudinal deformation, and y0 is influence range of longitudinal deformation. Taking x0 as reference, the value of y0 can be determined as
y 0 = H tan 45 φ / 2 + L
where L is the width of the diaphragm wall. Considering transverse deformation and longitudinal deformation, the deformation S at any point in ground is
S = S max e π x x m 2 / x 0 x m 2 1 1 + e y y 0 / 2 / 12
where Smax is the maximum value of deformation. In the influence range of deformation, integrating Equation (10) to obtain the deformation volume VS
V S = 0 x 0 0 y 0 S max e π x x m 2 / x 0 x m 2 1 1 + e y y 0 / 2 / 12 d x d y
Equation (11) does not have primary form, but can be solved by double numerical integration function using MATLAB 2015a code.

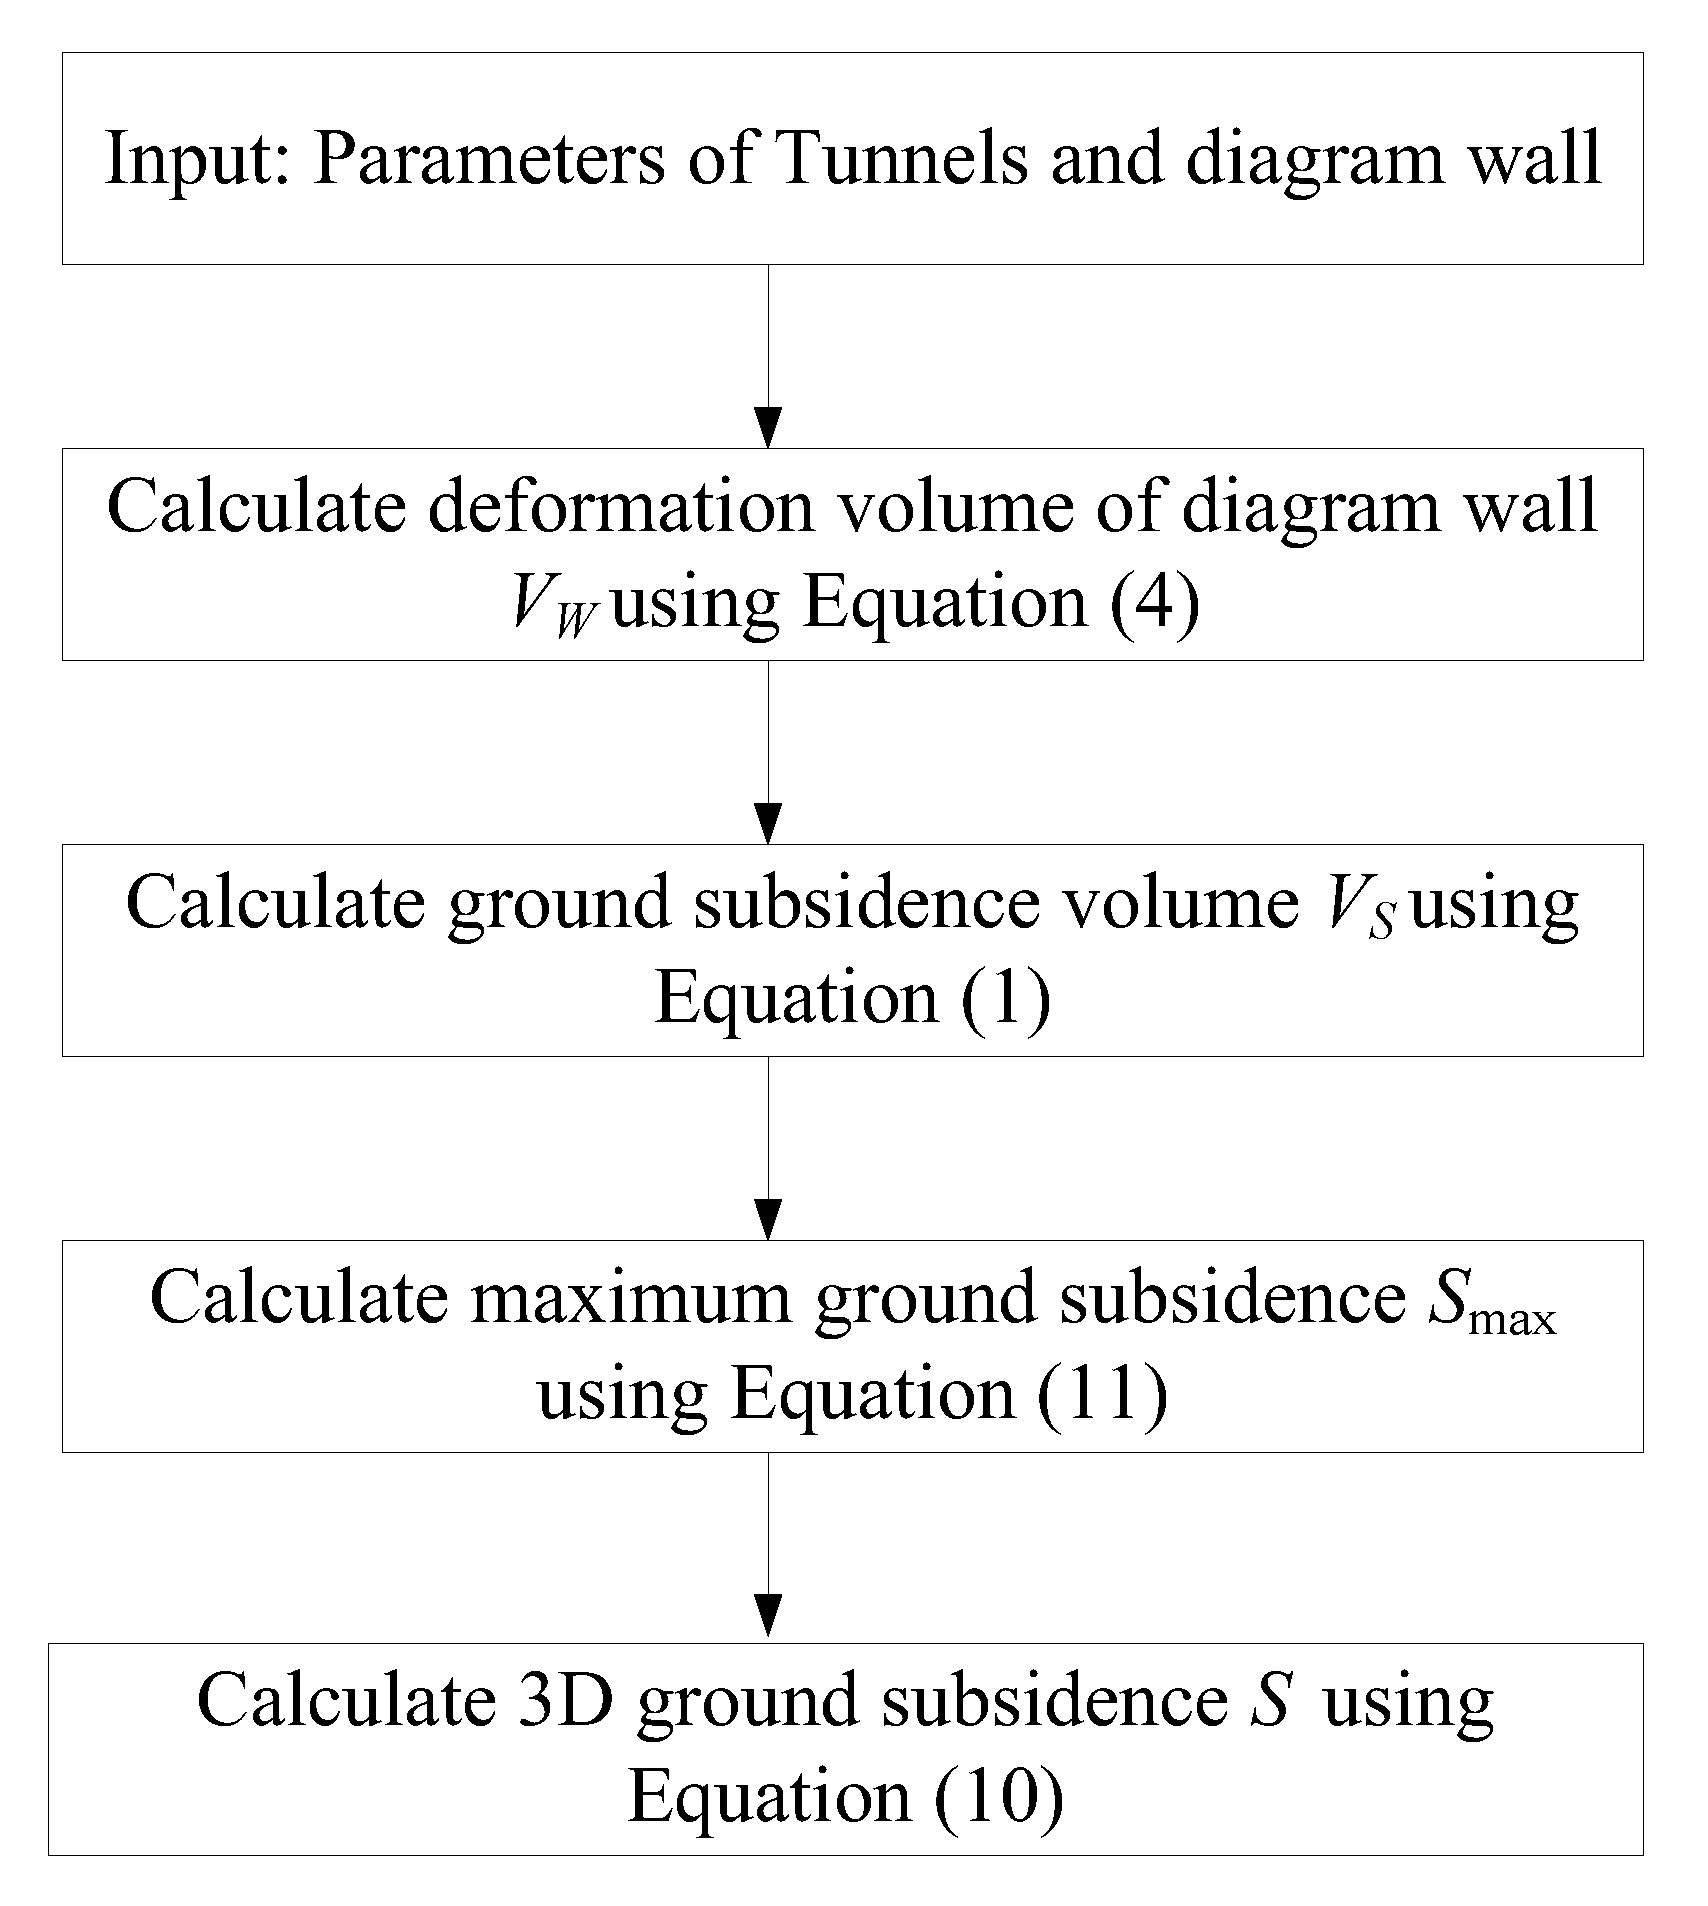
3.4. Deformation Calculation

Figure 6 plots the flowchart of the ground heave calculation induced by tunnels passing through the underground diaphragm wall. First, the geometrical and mechanical parameters of tunnels and diaphragm wall are substituted into Equation (10), and then the deformation volume of diaphragm wall VW is obtained. According to properties of soil, the coefficient of proportionality Mu in Equation (1) is determined. Then, the ground heave volume VS is calculated using Equation (1). Based on the value of VS, the numerical solution of Equation (11) using the MATLAB code is obtained to calculate the maximum value of ground heave Smax. Finally, ground heave S at any point can be calculated using Equation (10). The main calculation parameters of the ground deformation procedure are x E and Poisson’s ratio μ of diaphragm wall, depth H and thickness b of the diaphragm wall, and the coefficient of proportionality Mu. In these parameters, the value of Mu needs to be empirically determined by considering the properties of the soil.

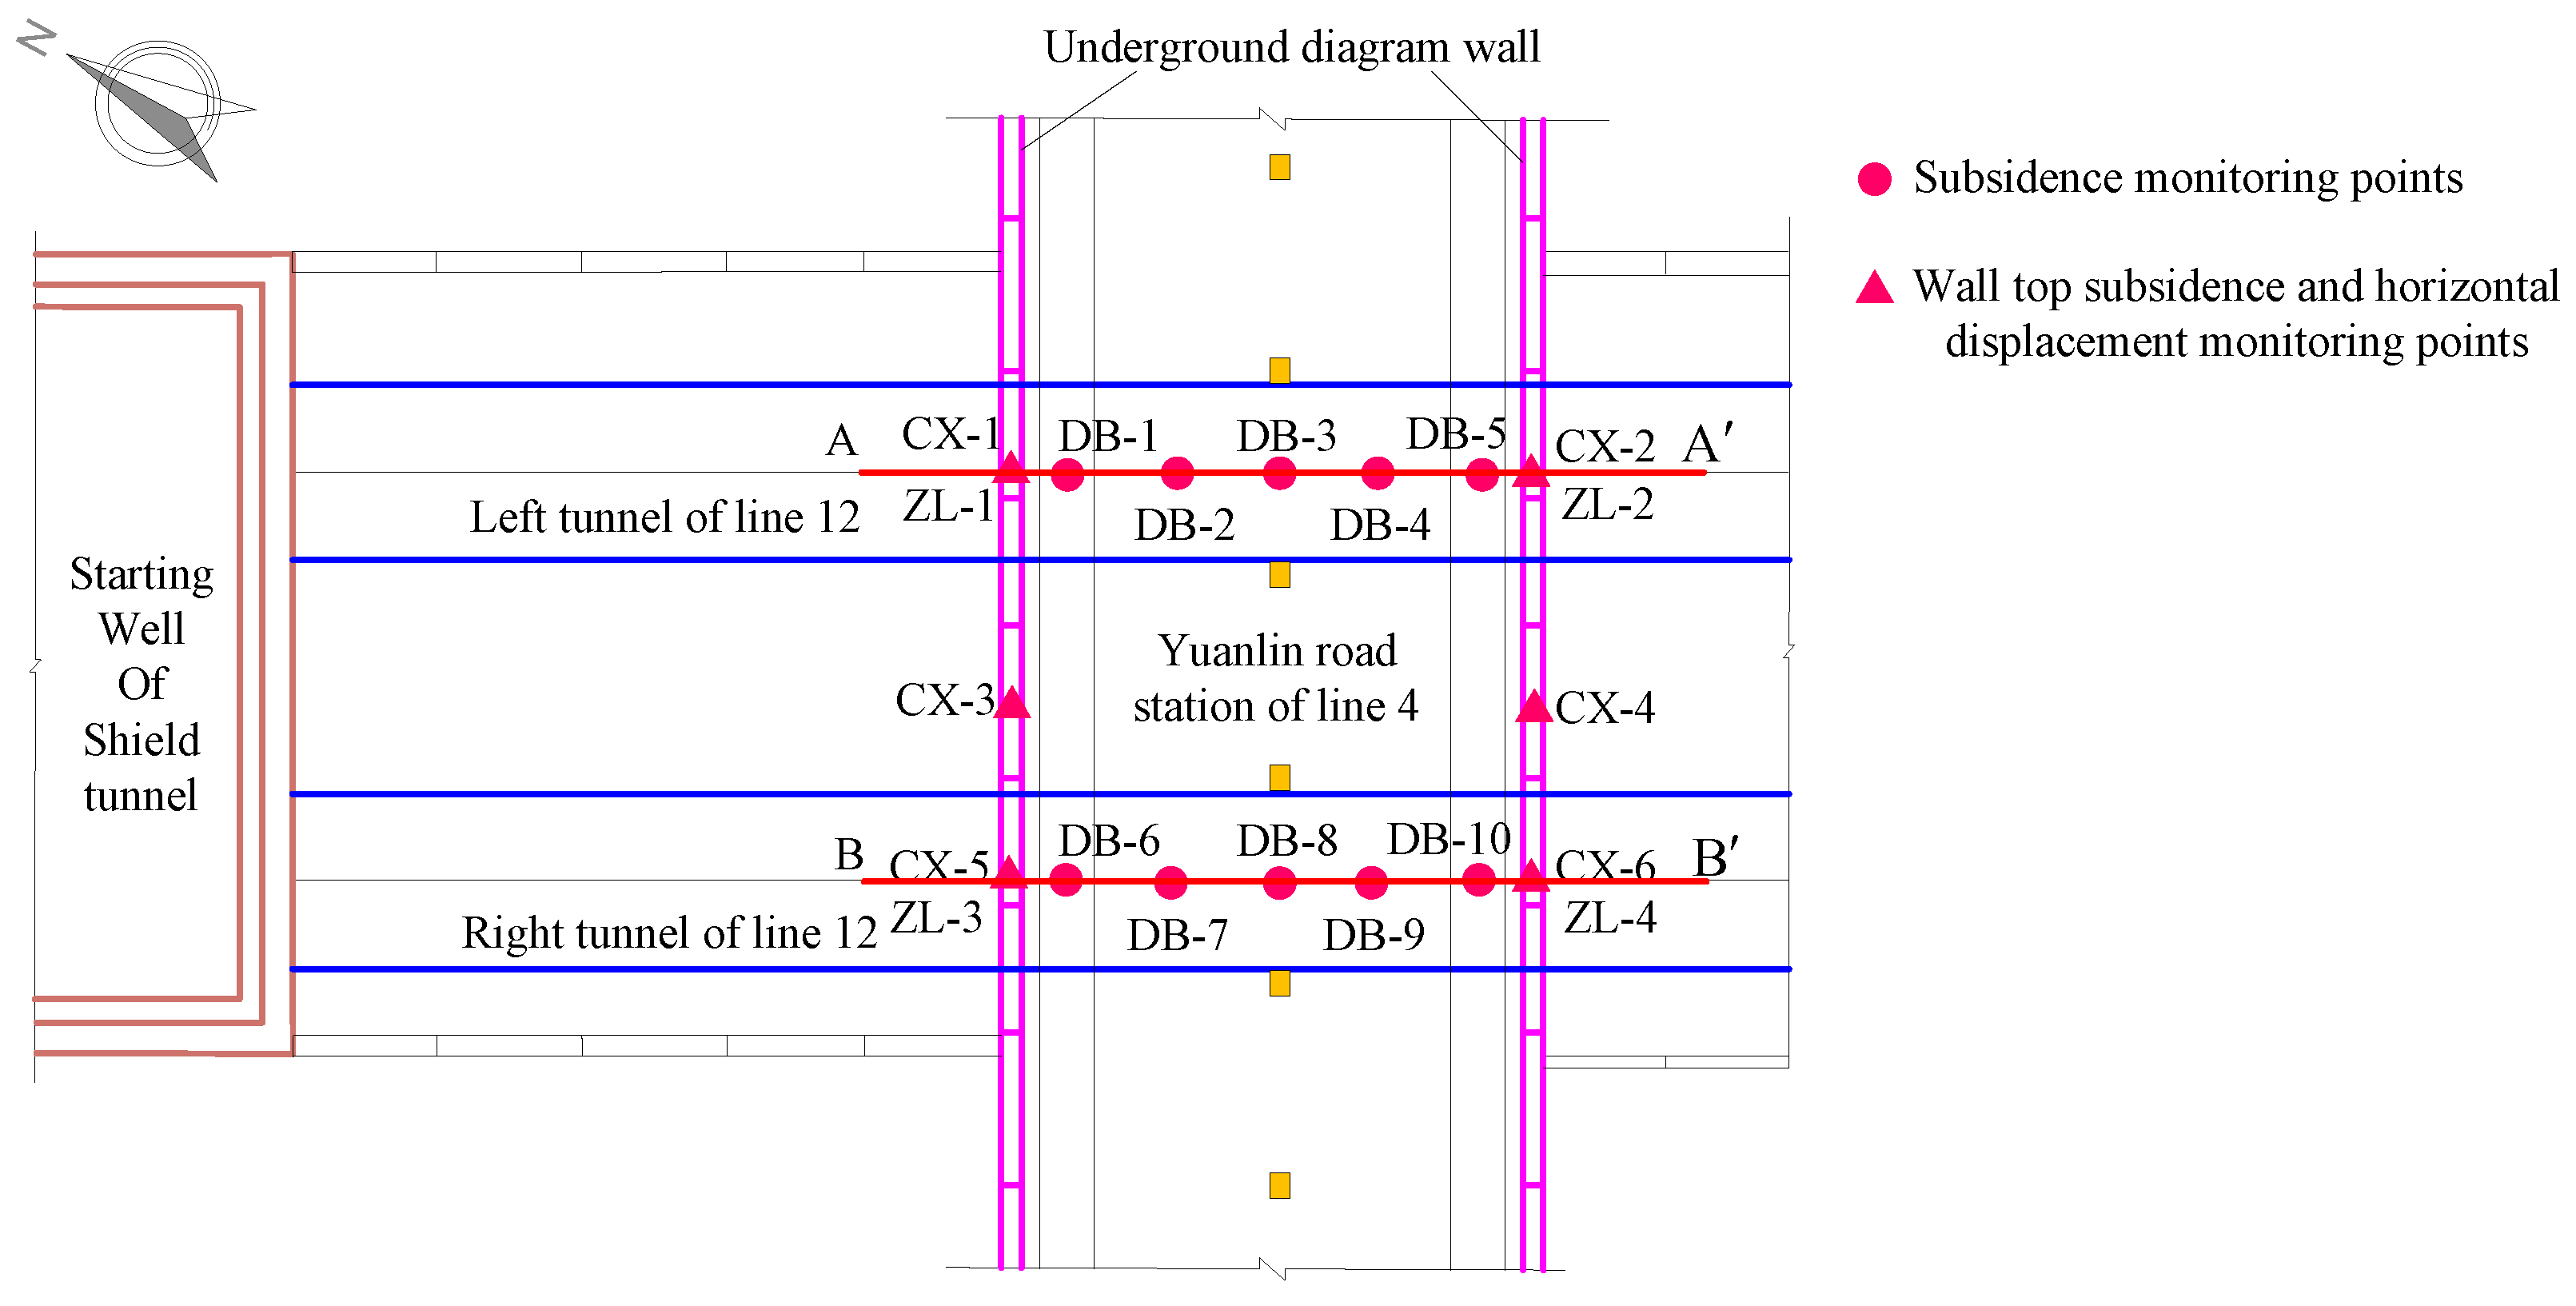
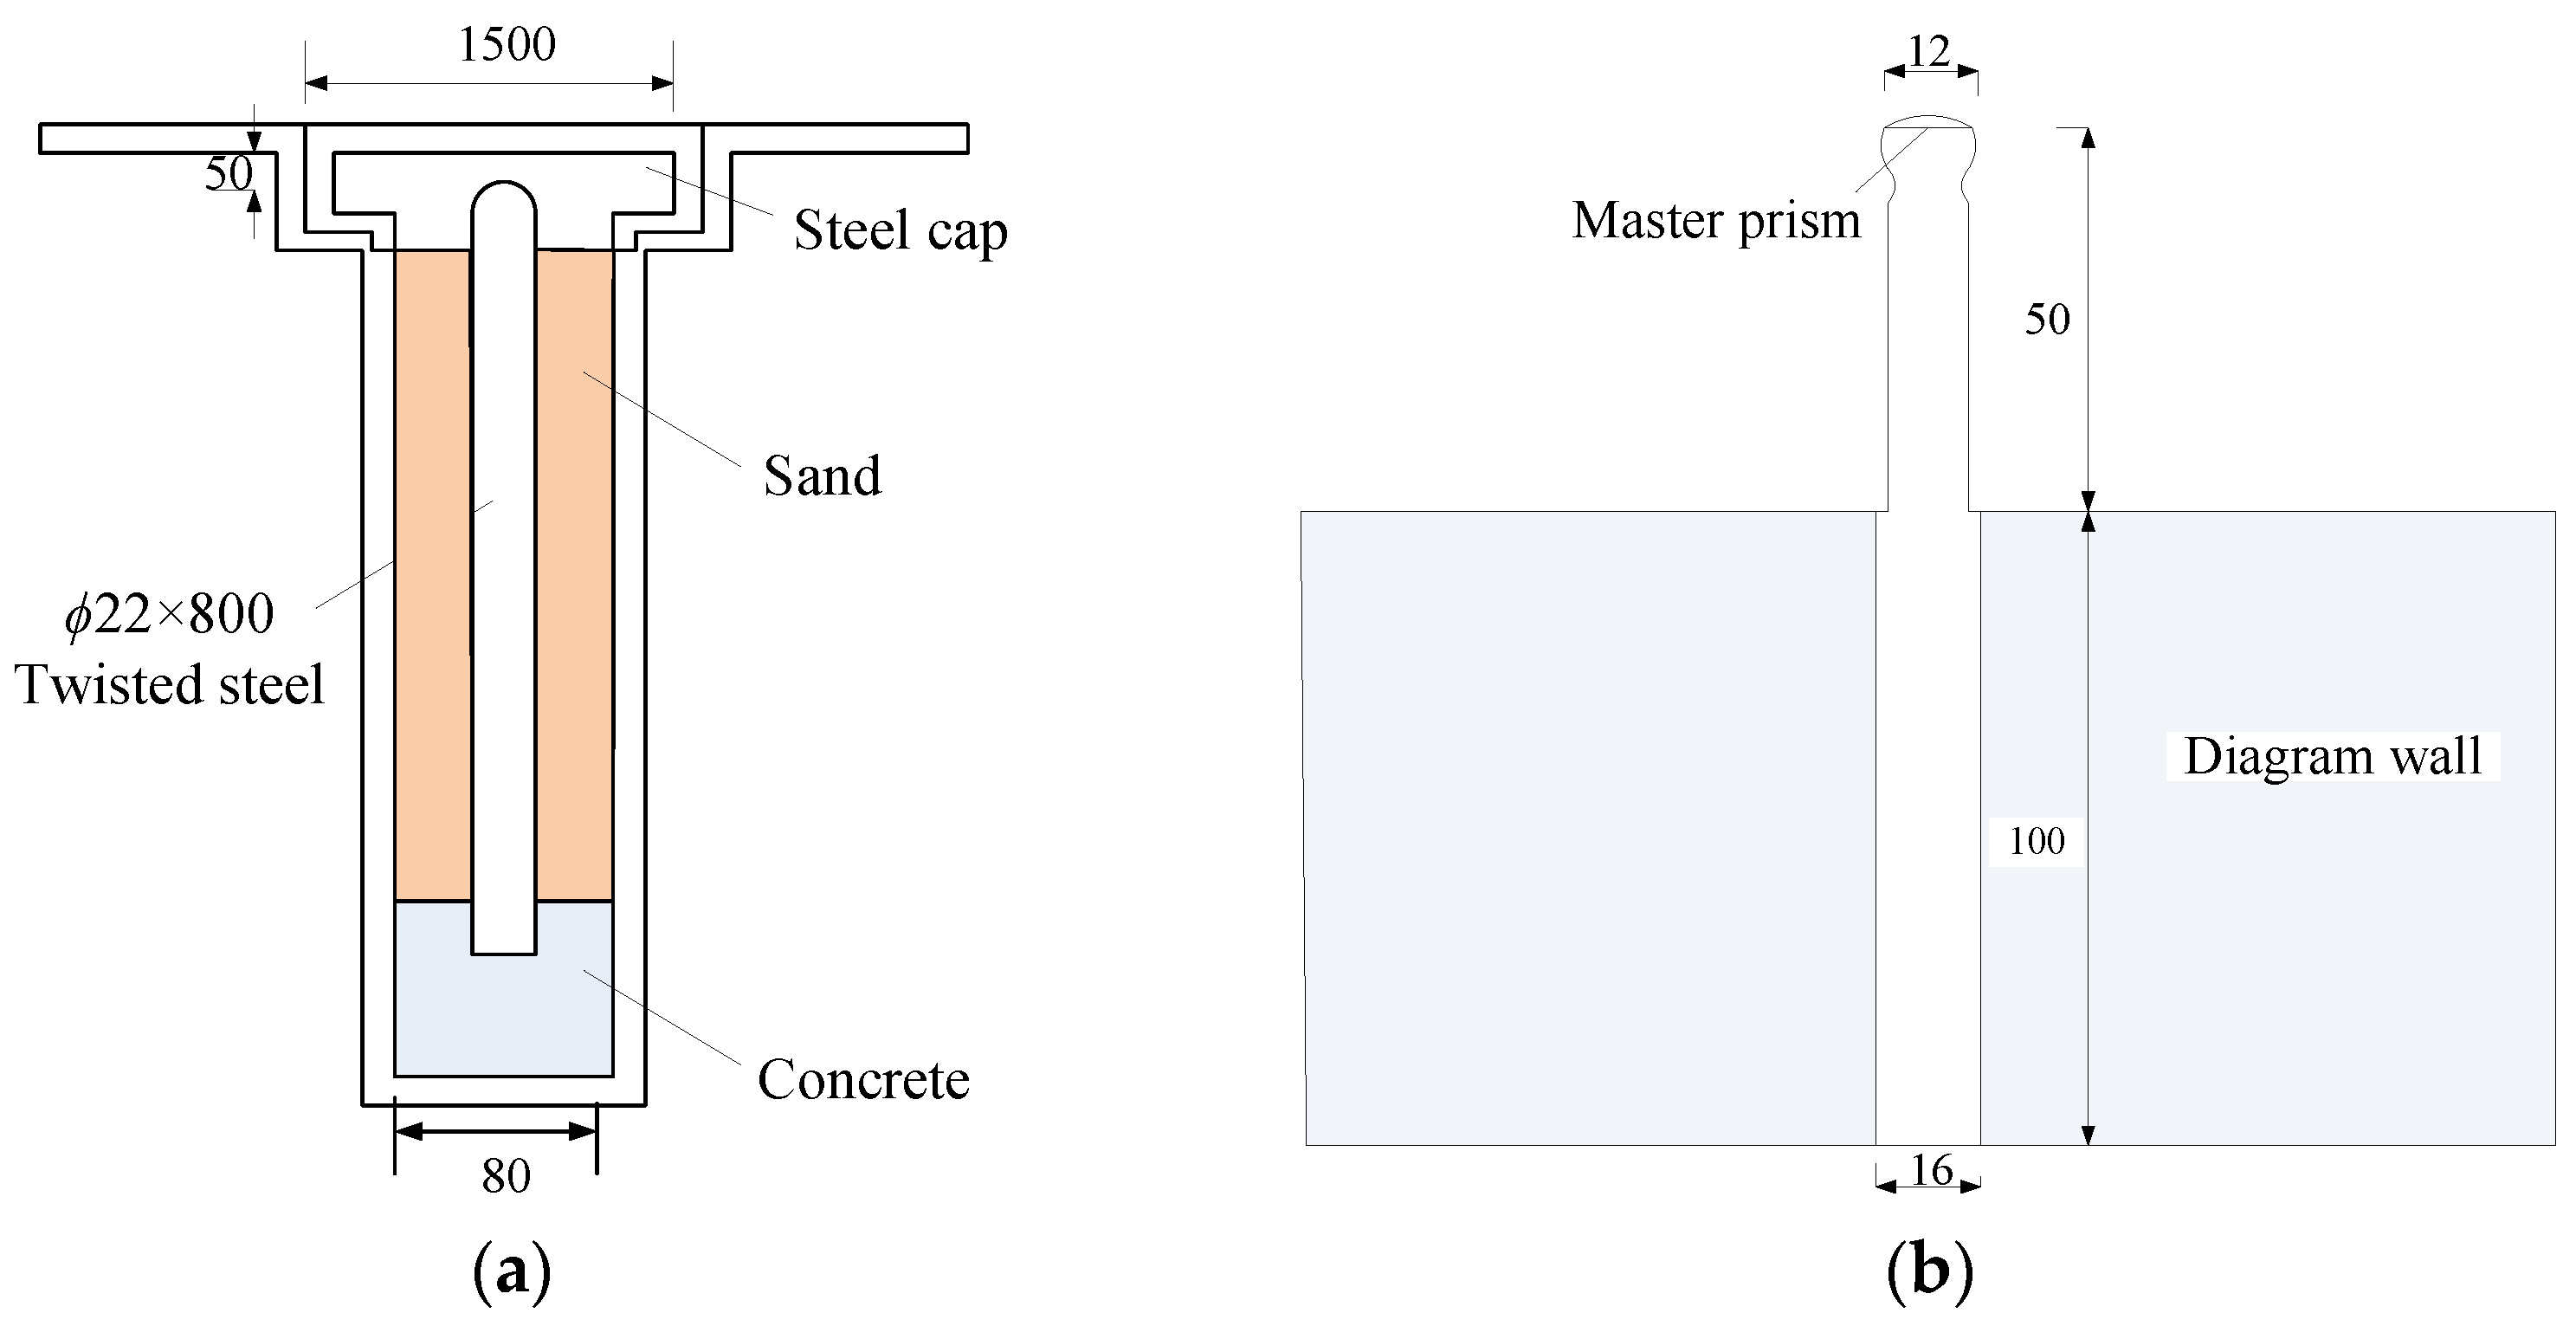
4. Field Monitoring Setting

To investigate the influence of shield tunnels of Line 12 passing through the diaphragm wall on Yuanlin Road station of Line 4, the deformation monitoring, diaphragm wall top deformation, horizontal displacement monitoring, and axial force monitoring are arranged to evaluate the deformation of Yuanlin Road station and diaphragm wall. Figure 7 shows the layout of monitoring points in Yuanlin Road station.
The arrangement of deformation monitoring points aimed to monitor the overall deformation of Yuanlin Road station. DINI03 electronic level, Tianbao, China and indium steel ruler are used in deformation monitoring. A total of 10 ground observation piers are installed on different positions of Yuanlin Road station, as denoted DB-1 to DB-10 in Figure 7. DB-1, DB-2, DB-3, DB-4, and DB-5 points are arranged on monitoring section A-A’, which located upward side of left tunnel. In addition, DB-6, DB-7, DB-8, DB-9, and DB-10 are arranged on monitoring section B-B’, which located upward side of right tunnel. These points are installed by sleeve burying method, as shown in Figure 8a.
TCA2003 total station and DINI03 electronic level are employed to monitor the vertical deformation (points ZL-1, ZL-2, ZL-3, and ZL-4) and horizontal displacement (points CX-1, CX-2, CX-3, CX-4, CX-5, and CX-6) of wall top, respectively. Monitoring points are installed by screw-thread steel in the top of diaphragm wall with a length of 100 mm and diameter of 16 mm, as plotted in Figure 8b. The buried depth of screw-thread steel is 100 mm, and master prism is installed on steel top. The layout of monitoring points is shown in Figure 7.

5. Results and Discussion

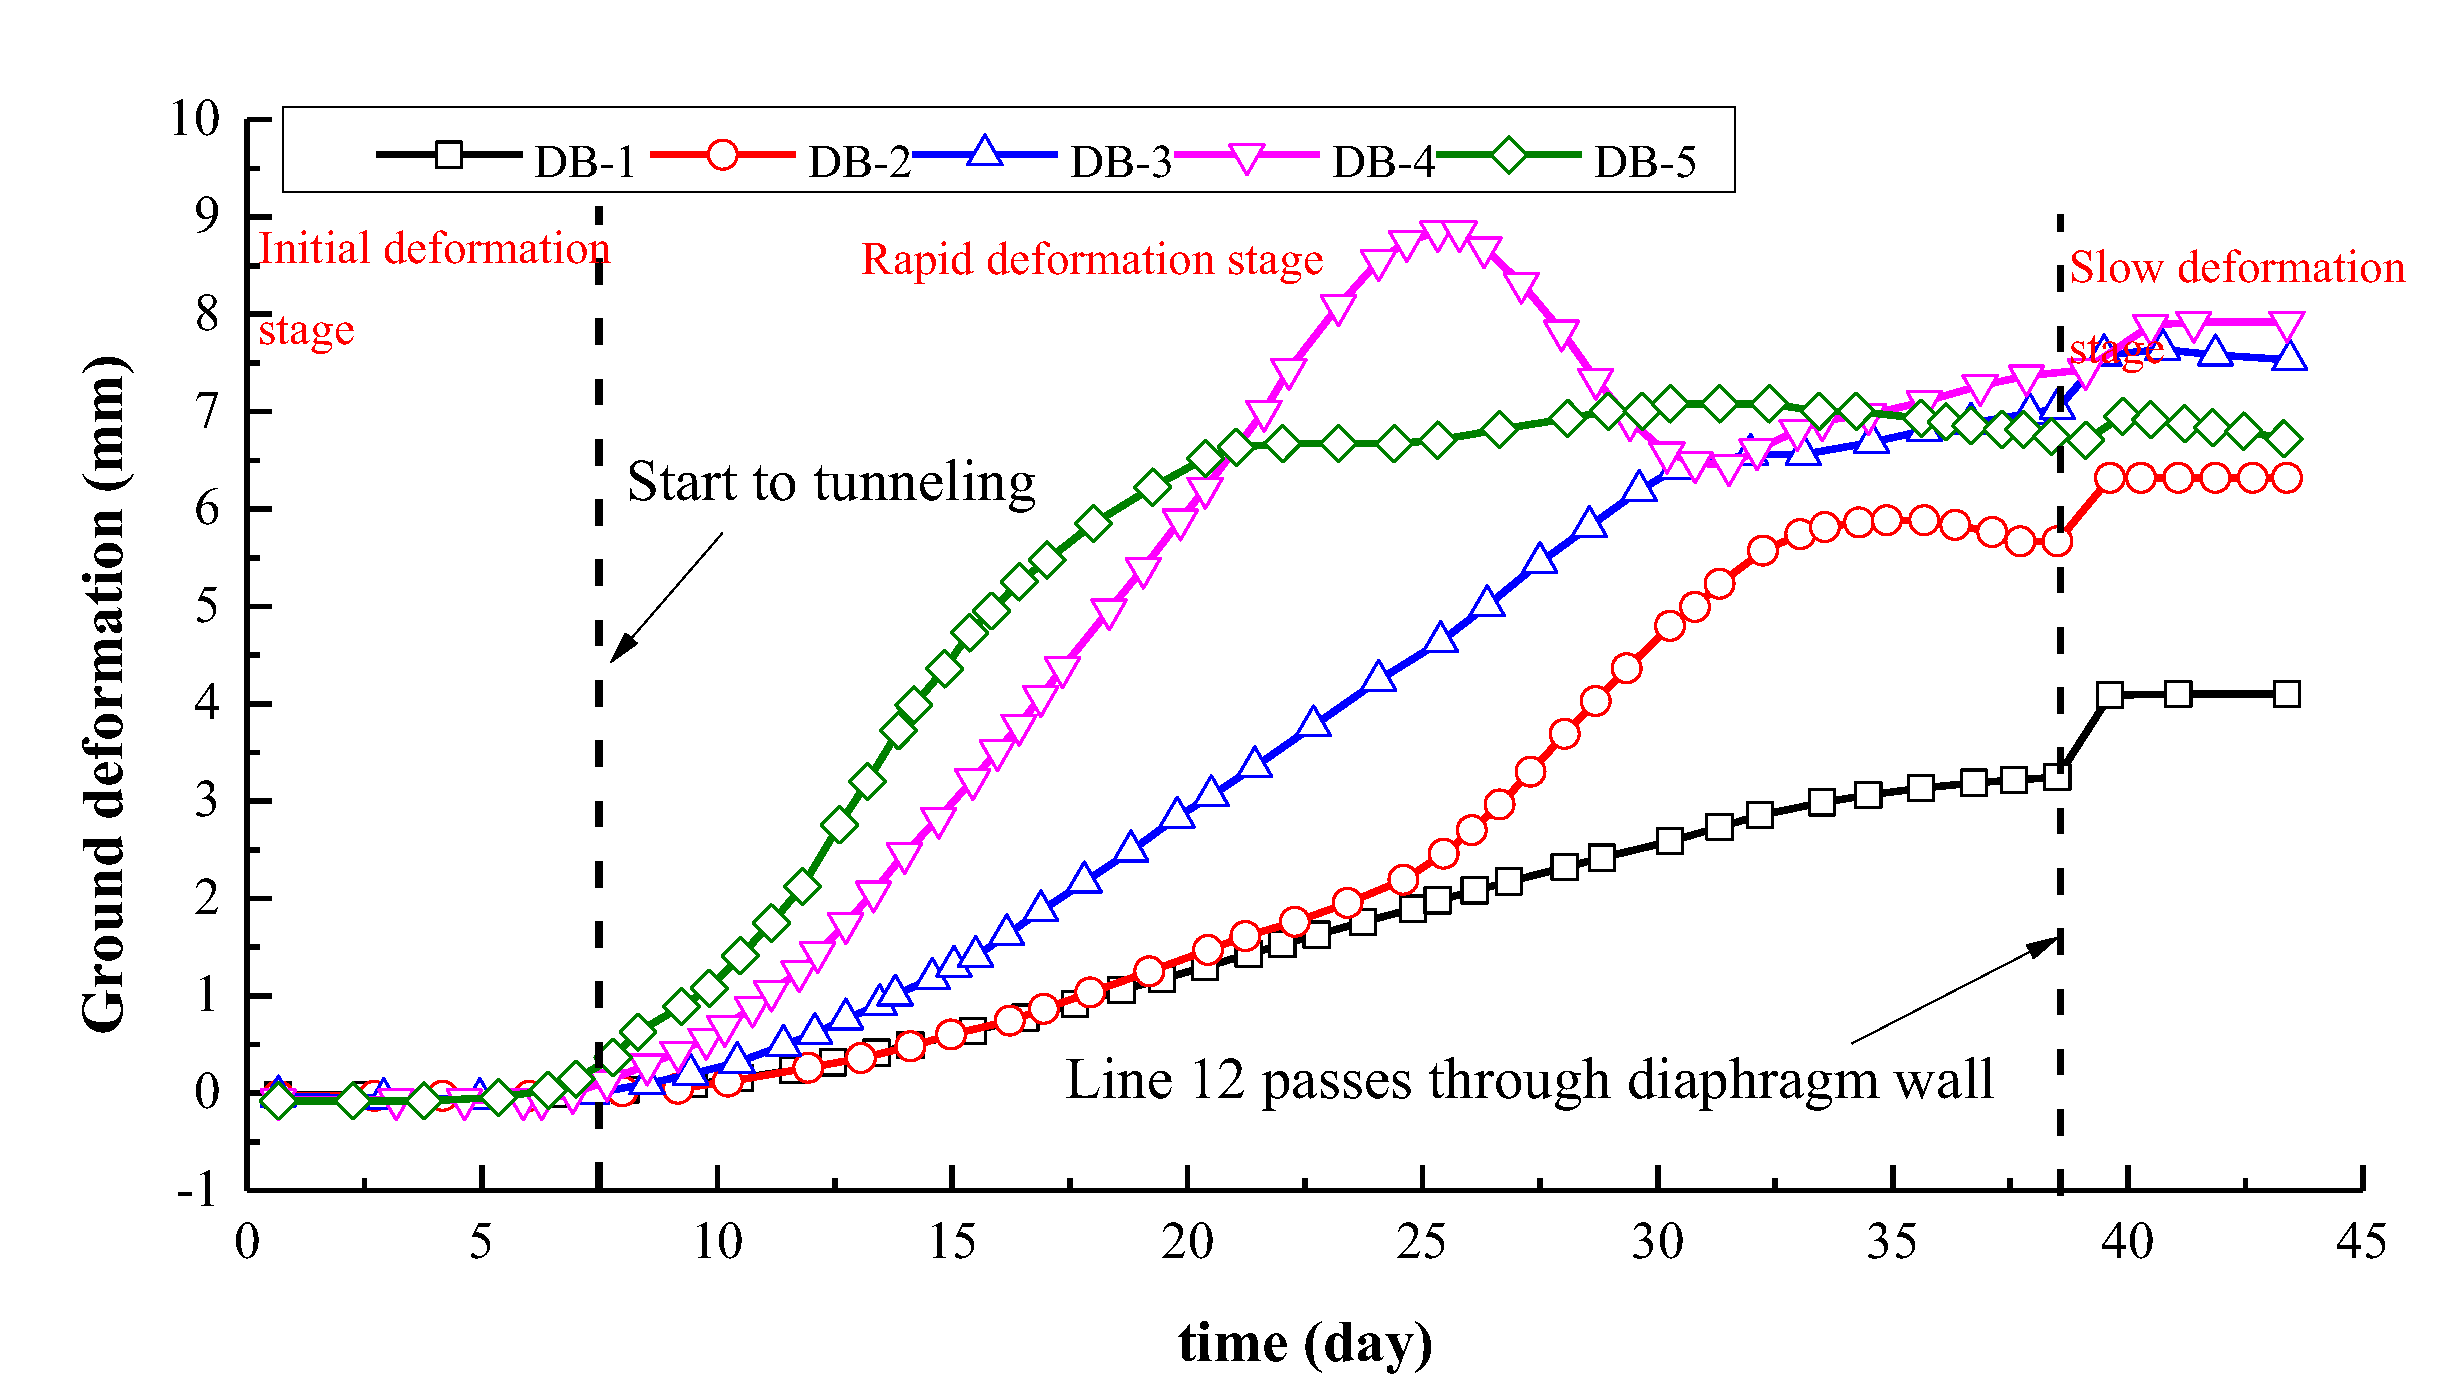
5.1. Field Monitoring Results

All monitoring instruments installation finishes before shield tunneling from starting well. The deformation of the diaphragm wall and the ground heave data are recorded from the start of the tunnel through to the diaphragm wall.
Figure 9 shows the variation of ground heave of some typical deformation monitoring points (DB-1, DB-2, DB-3, DB-4, and DB-5) with time. Because the monitoring section A-A’ is symmetrical to section B-B’, monitoring points DB-1, DB-2, DB-3, DB-4, and DB-5 are selected to analyze the deformation mechanism of Yuanlin Road station when Line 12 passes through the underground diaphragm wall. The ground shows a tendency of upward deformation in the process of shield tunneling. Additionally, three deformation stages of slope were observed from Figure 9, namely the initial deformation stage, rapid deformation stage, and slow deformation stage. In the initial shield excavation stage, the ground deformed at a low rate because of the small volume of excavation. After 7 days, the tunnel for Line 12 was excavated rapidly, and close to Yuanlin Road station of Line 4, which leads to the deformation rate at the surface monitoring points increasing dramatically. When tunnels pass through diaphragm walls, the ground heave suddenly increases, and then shows a temporary stability. After the tunnel for Line 12 passed through the diaphragm wall, the deformation values of monitoring points DB-1, DB-2, DB-3, DB-4, and DB-5 were 4.1 mm, 6.2 mm, 7.53 mm, 7.92 mm, and 6.72 mm, respectively. Overall, the ground heave is small, which did not affect the stability of Line 4.
Likewise, the monitoring results of the top vertical wall deformation of CX-1, CX-2, CX-3, and CX-4 are plotted in Figure 10. Overall, three deformation stages are observed to be the same as that of the ground heave. An initial small deformation lasts 25 days, which is longer than that of the ground heave. The main reason is that the high stiffness of the diaphragm wall leads to its smaller deformation response, compared to the ground heave response. Additionally, the diaphragm wall produces a large deformation when Line 12 passed through the wall. As shown in Figure 10, after tunnel Line 12 passed through the diaphragm wall, the vertical deformation values of monitoring points CX-1, CX-2, CX-3, and DB-4 are 0.21 mm, 0.1 mm, 0.15 mm, and 0.5 mm, respectively.
Figure 11 shows the horizontal deformation result of typical monitoring points ZL-1 and ZL-2 in section A-A’ during tunneling of Line 12. The main horizontal deformation of diaphragm wall tendency of monitoring points is consistent with the vertical deformation. The direction of horizontal deformation of the diaphragm wall is adjacent to Yuanlin Road station. After tunneling for 43 days, the horizontal deformations of monitoring points ZL-1 and ZL-2 are 6.81 mm and 4.71 mm, respectively.

5.2. Field Monitoring Results

According to the proposed deformation calculation method, the deformation of the diaphragm wall and Yuanlin Road station of Line 4 is determined. The value of additional thrust P can be taken as 20 kPa [43,44,45]. Table 2 lists the calculated mechanical parameters of ground deformation. C30 concrete was used to construct the diaphragm wall. The value of m and n in Equation (4) affects the calculation accuracy of the proposed method. To determine optimum value of m and n, more than 100 trial calculations are conducted. The values of m and n vary from 3 to 20 in trial calculations. Figure 12 shows the deformation of the wall acting on additional thrusts under different m and n. The variation of calculated results is small when the values of m and n are greater than 10. It is shown that the values of m and n are 11, which is sufficient in terms of computational accuracy.
Deformation monitoring points DB-1, DB-2, DB-3, DB-4, and DB-5, and horizontal deformation monitoring point CX-1 in monitoring section A-A’ are selected to verify the accuracy of the proposed method. Figure 13 shows the comparisons of the deformation of the diaphragm wall and the ground measured by the monitoring points and calculated by the proposed method. The calculated horizontal deformation of the top of the diaphragm wall is 0.6 mm, which is a small difference from the measured value. The calculated deformation values for DB-1, DB-2, DB-3, DB-4, and DB-5 are 3.74 mm, 5.95 mm, 7.44 mm, 7.64 mm, and 6.31 mm, respectively. The maximum difference between the measured and calculated deformation is 14.6%, which is acceptable for engineering analysis. Additionally, the measured ground heave is greater than the calculated value, as plotted in Figure 13. The reason is that the vertical deformation of the diaphragm wall is not considered in the proposed model. Actually, the deformation of the wall would affect the surrounding ground heave. However, the measured deformation of the diaphragm wall is 0.2 mm, which is too small to obviously affect the accuracy of the proposed model. Hence, it is indicated that the proposed method can be used to analyze the ground heave induced by shield tunnels passing through the building envelope.
Based on the ground heave calculation results, the 3D ground heave of Yuanlin Road station is plotted in Figure 14. The groove shape is observed in the whole ground heave. The maximum deformation is 7.64 mm, which is located in the center of the two tunnels. In addition, the value of the deformation lessens the further it is from the two tunnels.

5.3. Parametric Study of Underground Diaphragm Wall

The main factors that affect the ground heave induced by tunnels passing through a diaphragm wall are thickness b, elasticity modulus E, and depth H of diaphragm wall. However, how those factors affect the ground heave is not known, which should be studied.
Based on the proposed method, the thickness of the diaphragm wall of 600 mm, 800 mm, 900 mm, 1000 mm, 1100 mm, and 1200 mm is used to calculate ground heave, and other parameters are the same as those in Section 5.2. Figure 15 plots the ground heave under different thicknesses of diaphragm wall at center of the twin tunnels. As the thickness of the diaphragm wall increases, the ground heave decreases gradually. The maximum deformation values are 8.1 mm, 7.64 mm, 7.26 mm, 7.03 mm, 6.88 mm, and 6.84 mm for thicknesses of 600 mm, 800 mm, 900 mm, 1000 mm, 1100 mm, and 1200 mm, respectively. Compared with the maximum deformation value of thicknesses of 600 mm, the decrements of 0.46 mm, 0.84 mm, 1.07 mm, 1.22 mm, and 1.26 mm are for the thickness of 800 mm, 900 mm, 1000 mm, 1100 mm, and 1200 mm, respectively. This indicates that the ground heave trends to stability as the thickness increases. Hence, the large thickness of the diaphragm wall can control the ground heave, but the effect of larger thicknesses is limited. Reasonable selection of thickness of diaphragm wall is significant.
The effects of elastic modulus of diaphragm wall on ground heave is shown in Figure 16. The values of elastic modulus E are selected as 15 GPa, 20 GPa, 25 GPa, 30 GPa, and 35 GPa, and other parameters are same as those in Section 5.2. As the elastic modulus increases, the deformation gradually decreases; meanwhile, the ground heave curve is getting much narrower and shallower. Further analysis shows that compared with maximum deformation value of elastic modulus of 15 GPa, the decrements of 0.39 mm, 0.77 mm, 1.16 mm, and 1.55 mm are for the elastic modulus of 20 GPa, 25 GPa, 30 GPa, and 35 GPa, respectively. Hence, the stiff diaphragm wall facilitates the control of ground heave, and the effect is significant.
To discuss the effect of the embedded length of the diaphragm wall on ground heave, an embedded ratio re is defined as
r e = H e H
where He is the length between the bottom of tunnels and the top of the diaphragm wall.
The effect of the embedded ratio re of the diaphragm wall on ground heave is shown in Figure 17. The length of the diaphragm wall H is set as 41 m, 49.2 m, 61.5 m, 82.0 m, and 123 m and He kept a constant value of 24.6 m. It is shown that as the embedded ratio increases, the ground heave gradually increases. The increase in degrees for the re of 0.3, 0.4, 0.5, and 0.6 are 1.02%, 2.15%, 7.83%, and 13.5%, respectively. This indicates that the embedded length of the diaphragm wall is beneficial to control ground heave, but when the embedded length reaches a certain value, it has little effect on the surface deformation.
Considering the above studies, the length of 49.2 m and thickness of 1000 mm diaphragm wall is capable to keep shield tunneling and the ground safe. This design of diaphragm wall is also economical.

6. Conclusions and Discussion

This paper develops a semi-analytical method to predict ground heave induced by shield tunnels passing through enclosure structures of existing tunnels considering the space effect. The proposed method is based on improved ground deformation theory combined with Kirchhoff plate theory. The proposed method is verified by comparing with the field measurements. The main conclusions drawn are as follows:
(1)
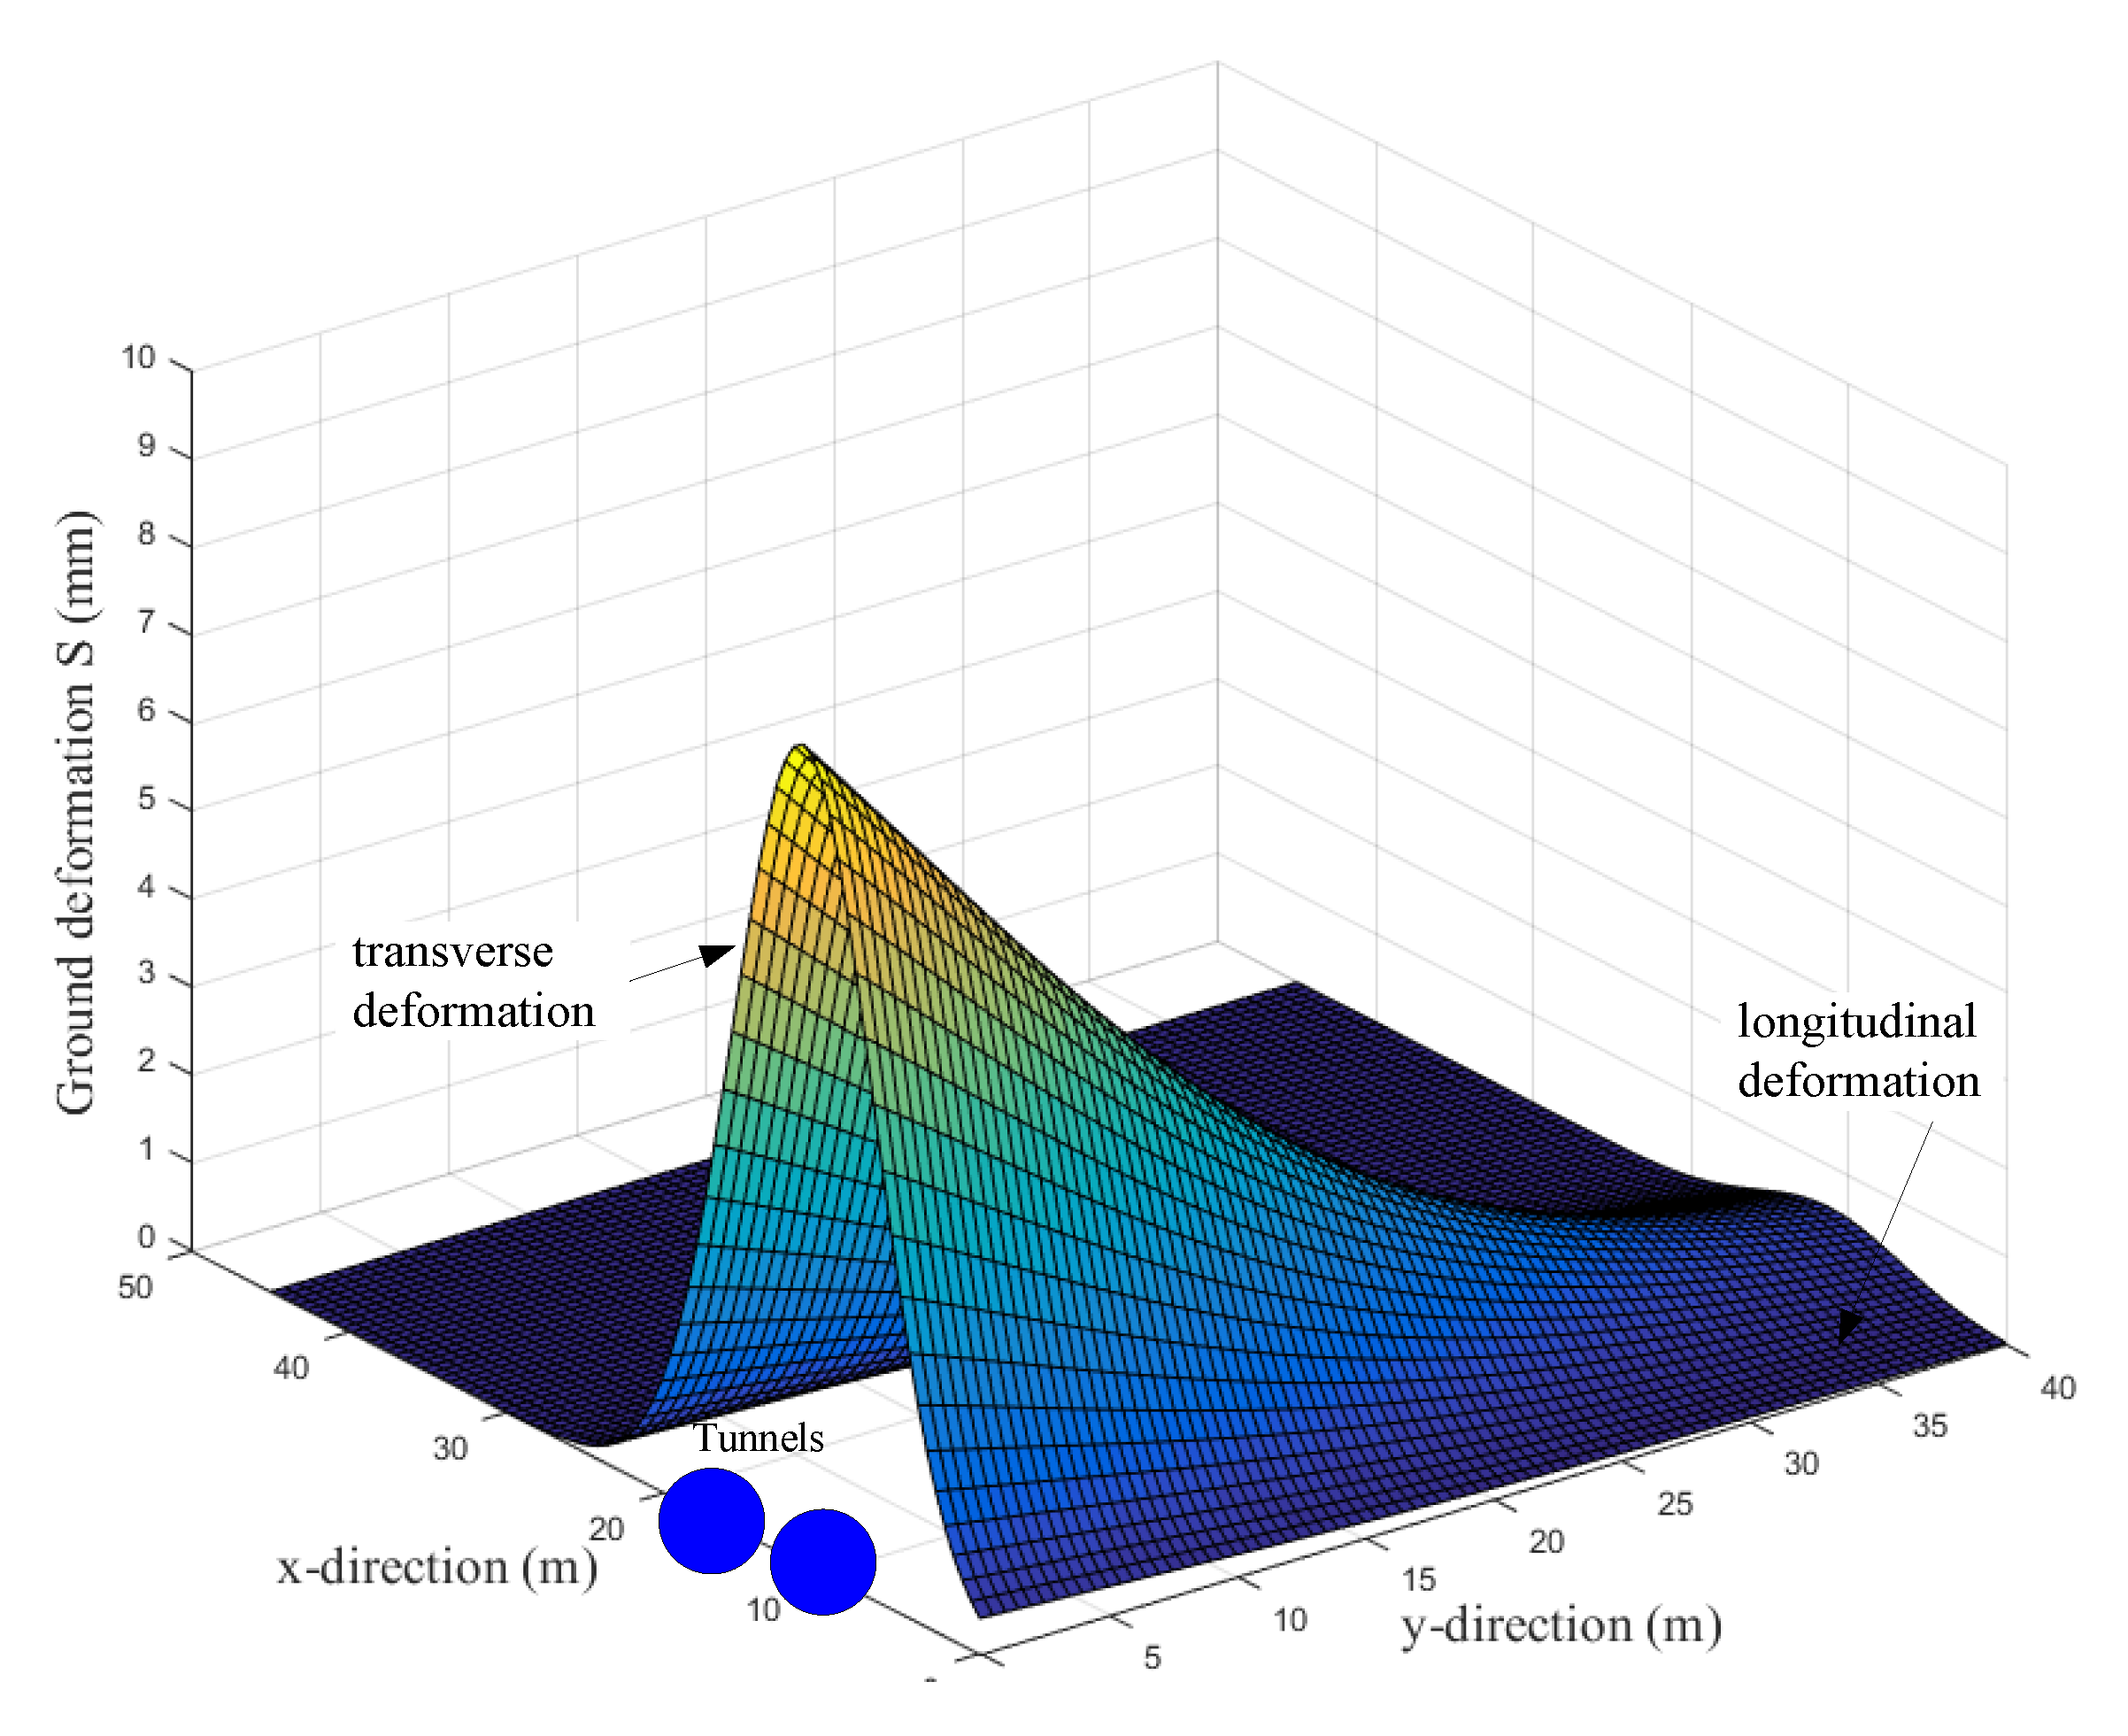
The relationships between the deformation volume of the underground diaphragm wall and the ground deformation volume are first established. The deformation volume of the diaphragm wall is calculated using Kirchhoff plate theory, and the ground deformation volume is evaluated by the transverse deformation curve and longitudinal deformation curve. Further, the ground heave solutions at arbitrary position are obtained.
(2)
The proposed method is verified by field measurements from Wuhan Metro tunnel cases from China. In general, a good agreement has been observed for shield excavation-induced ground heave profiles and the predictions are good for normalized ground heave profiles. The maximum error is 14.6%, which is acceptable. Hence, the proposed method can be used as a feasible approach for the estimation of deformations induced by shield excavations.
(3)
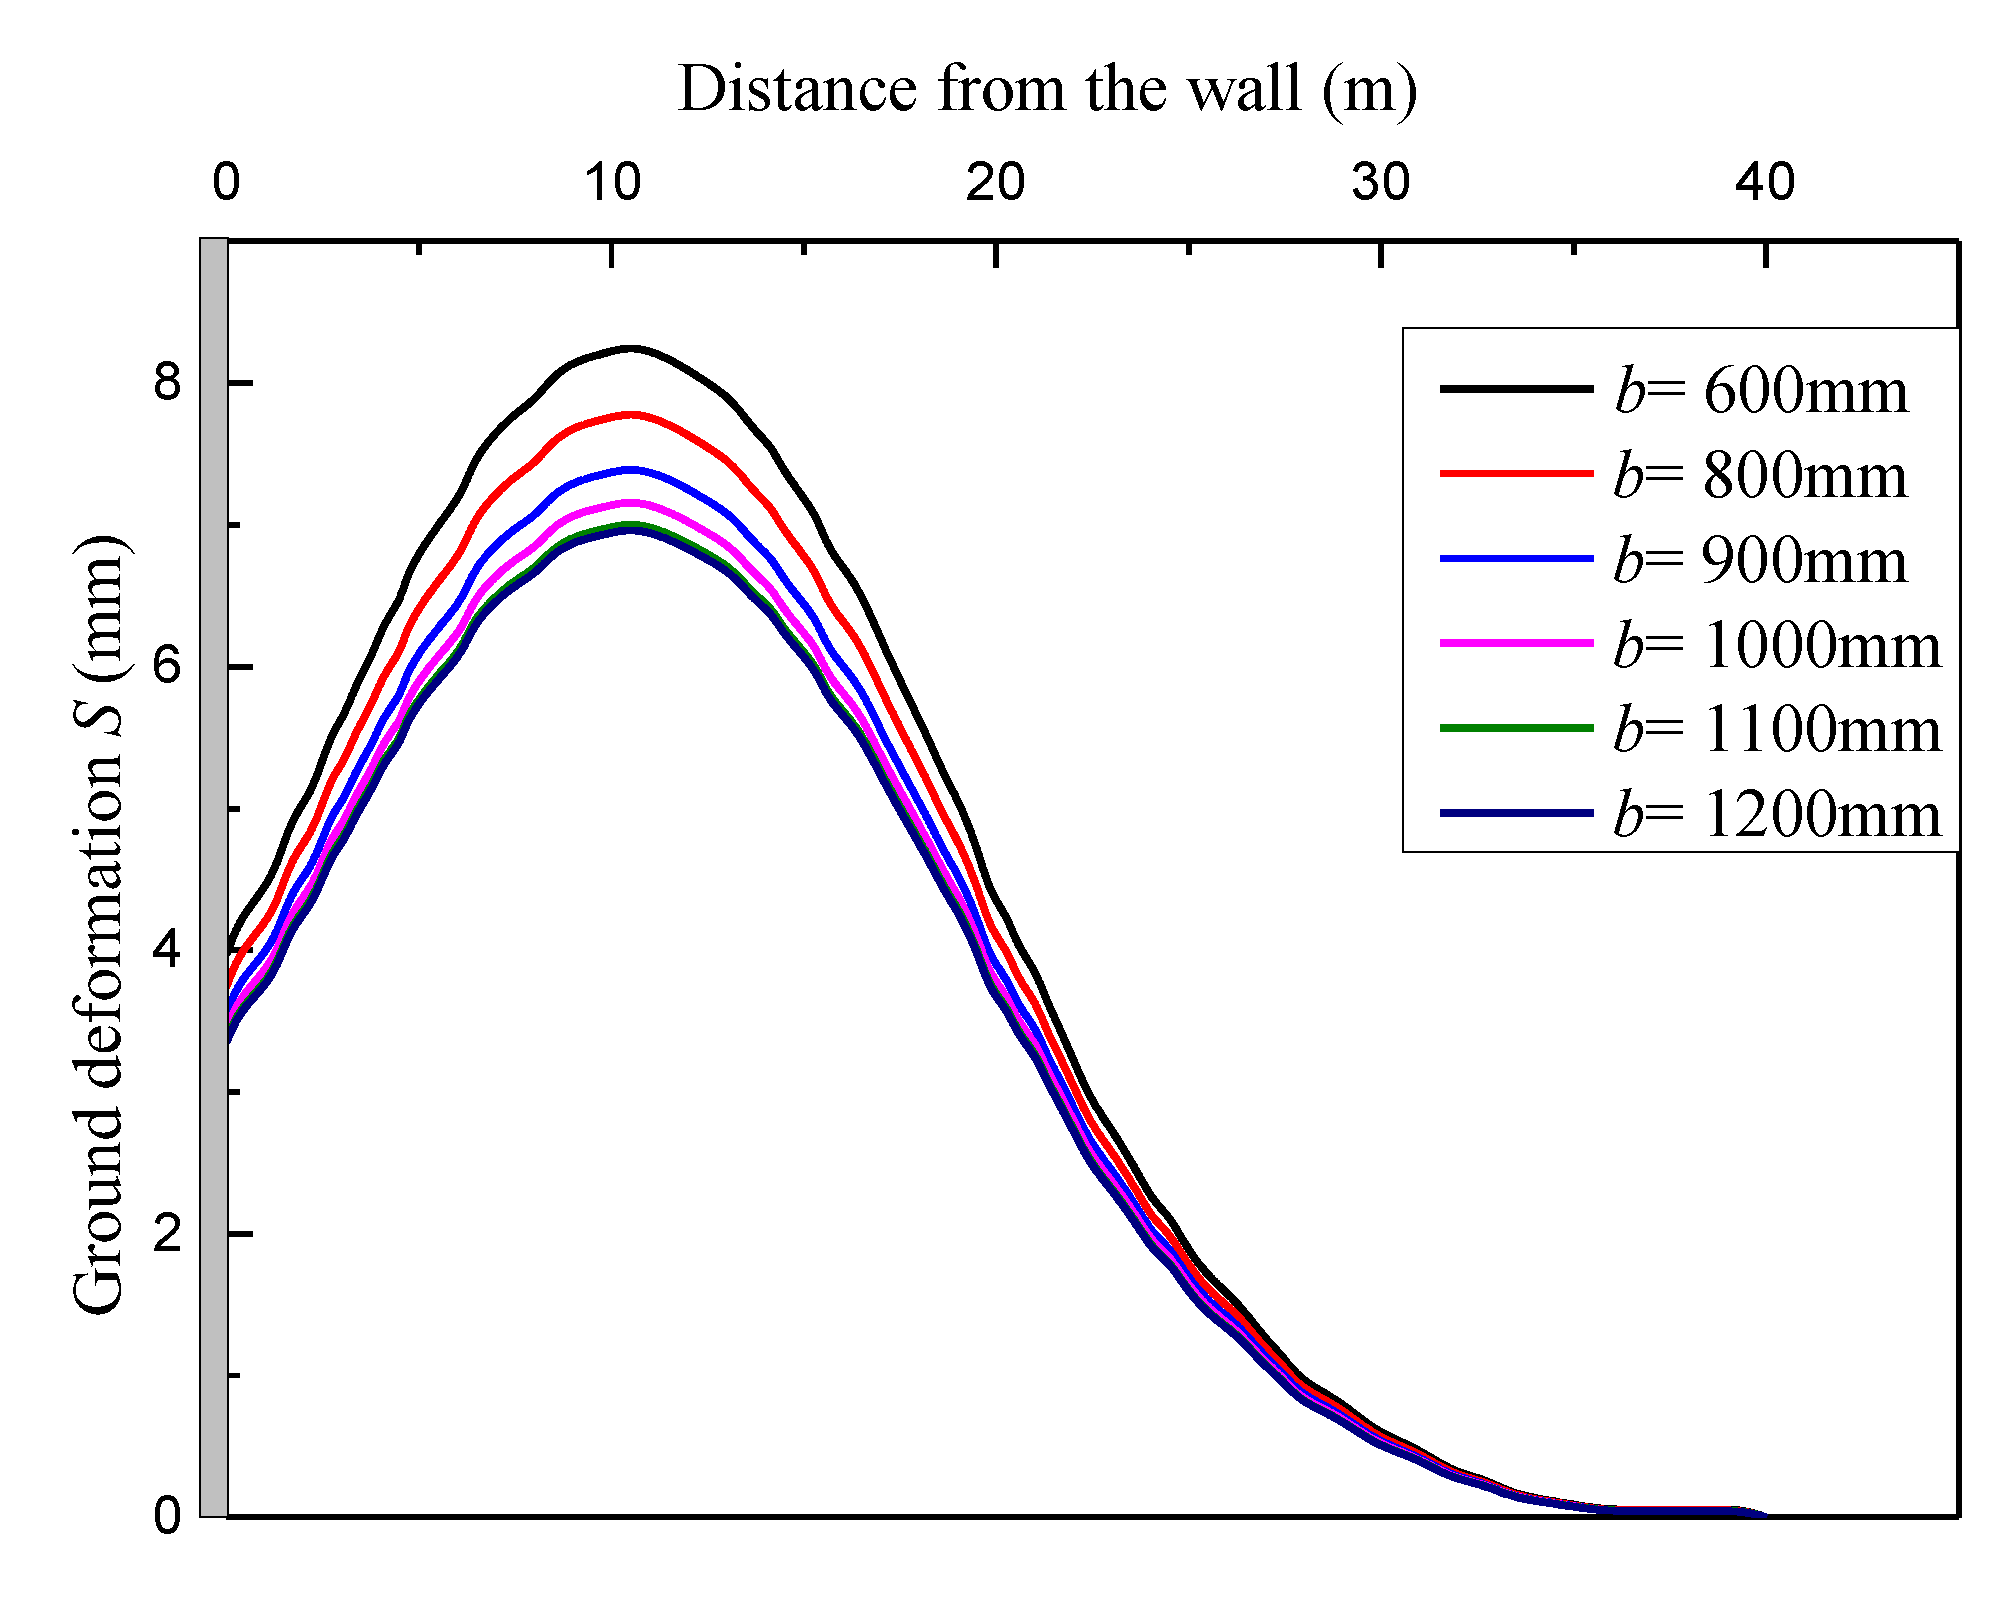
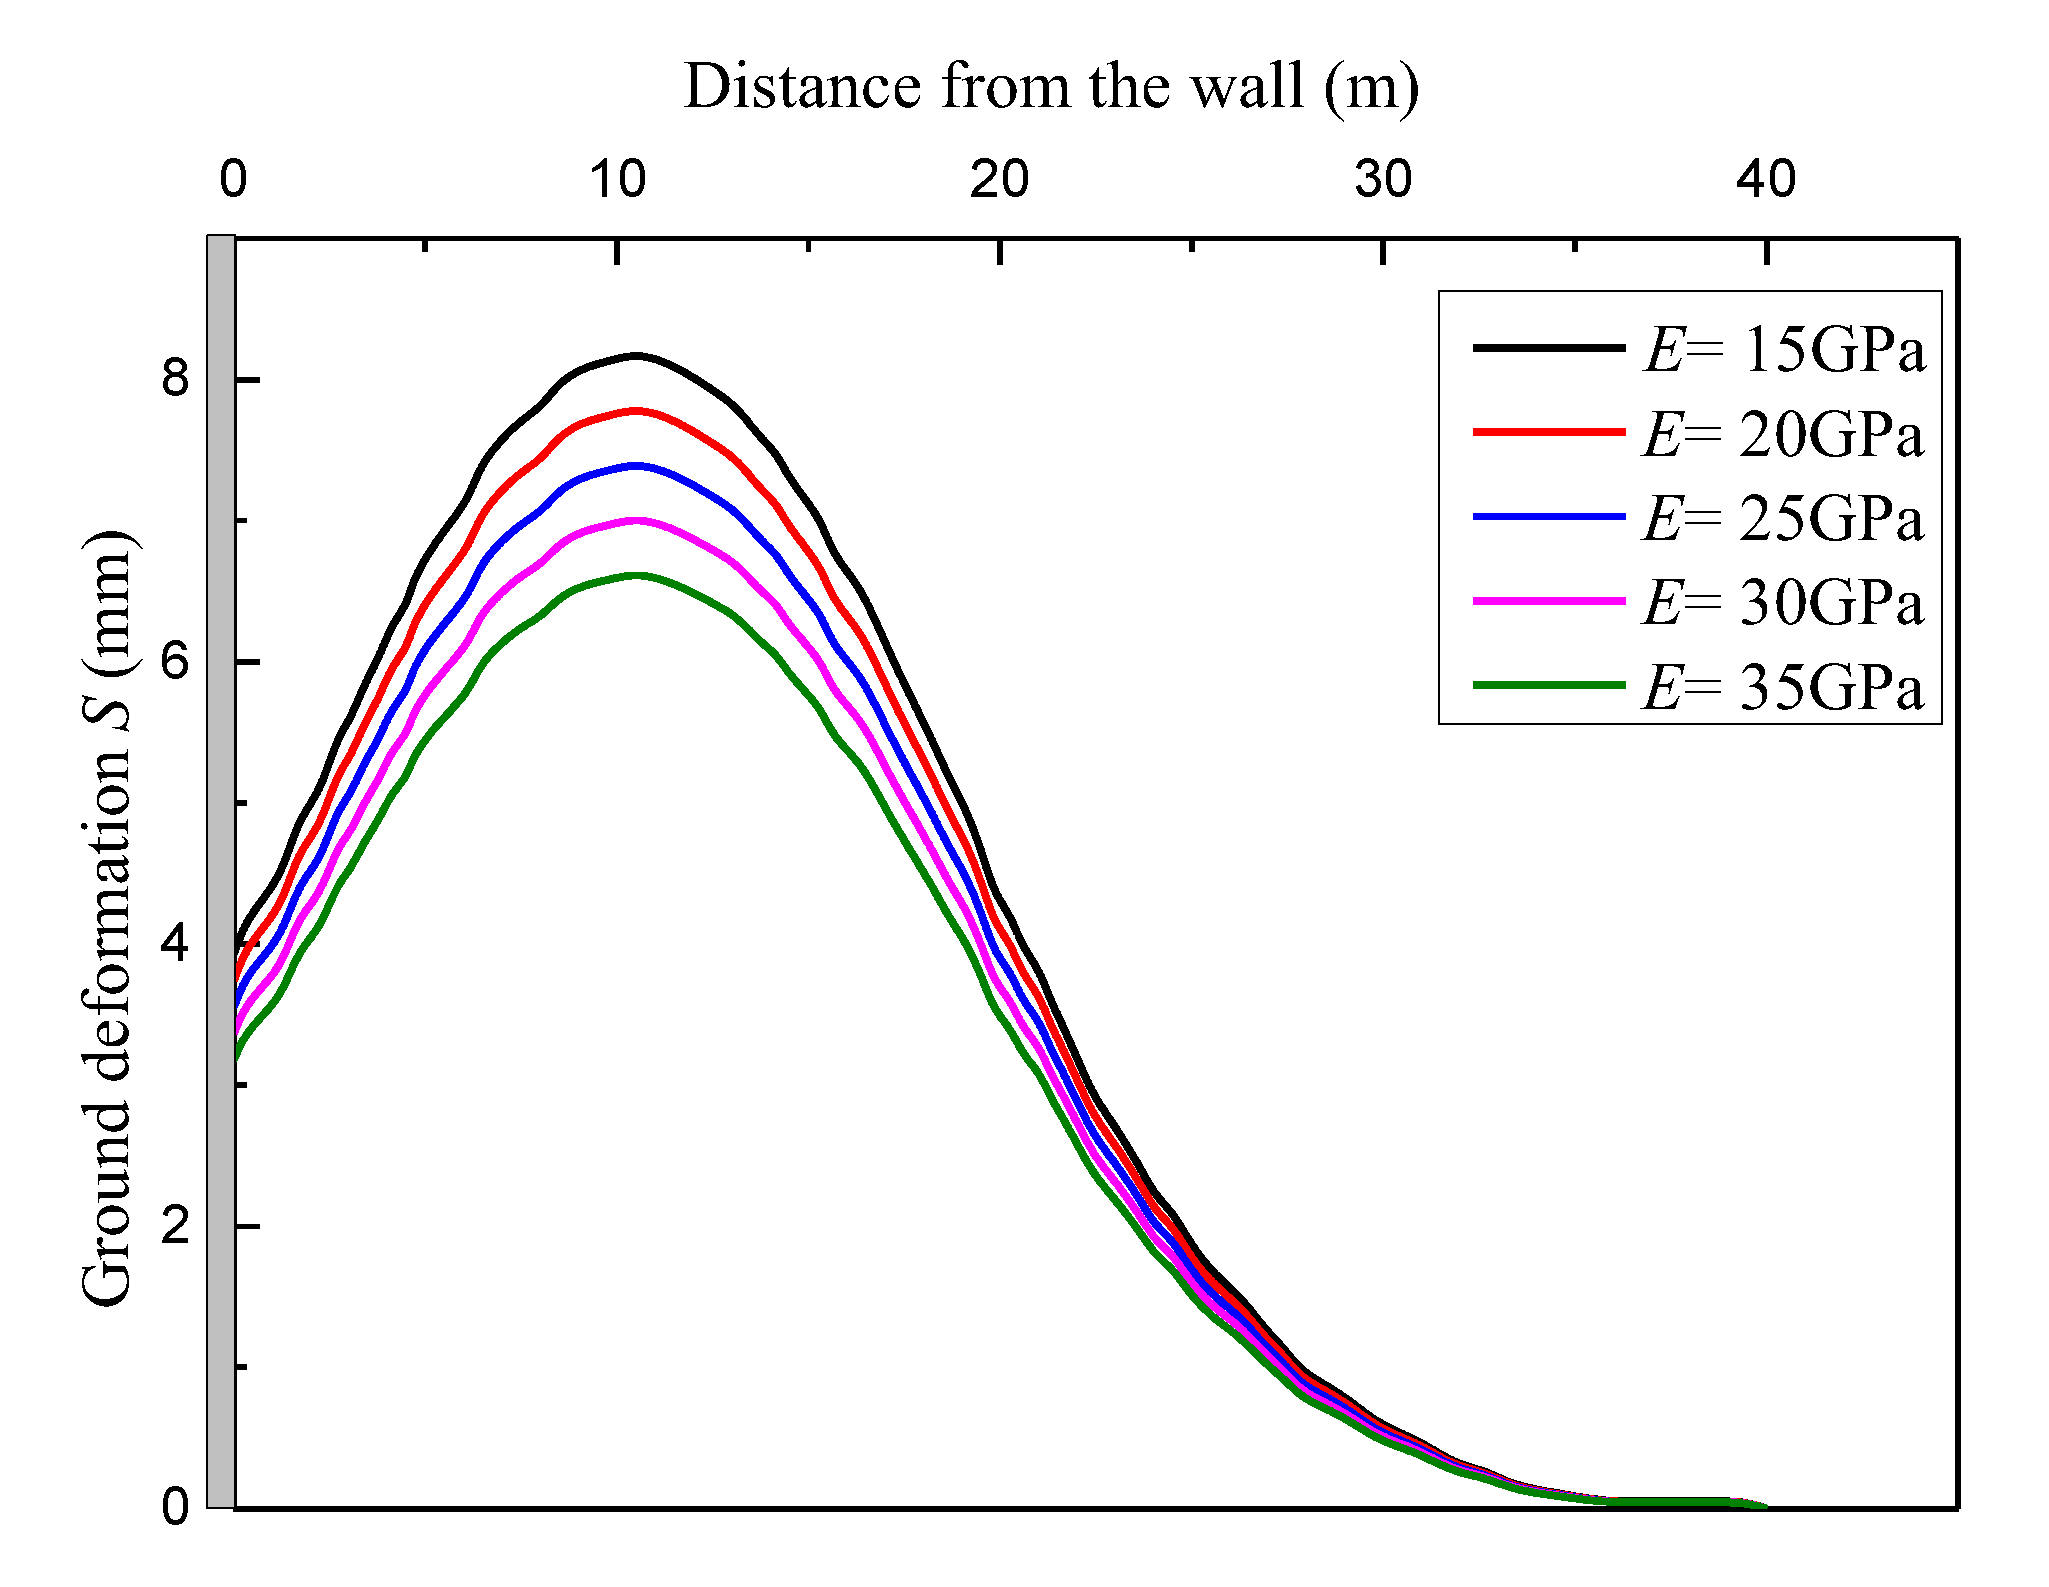
The parameters of underground diaphragm walls are studied using the proposed deformation calculation method to determine reasonable design schemes for underground diaphragm walls. The elastic modulus of diaphragm walls has significant effects on ground heaves, while the thickness and embedded ratio of diaphragm walls has limited effects on ground heaves. As elastic modulus and the thickness of diaphragm wall increase, the ground heaves gradually decrease. In addition, the effects of the embedded ratio show a positive correlation. However, when the thickness and embedded ratio reach a certain value, they have little effect on ground heaves.
(4)
The presence of underground water has non-ignorable influences on ground deformation. So a new ground heave prediction method should be derived considering underground water seepage in the future.

Author Contributions

Methodology, J.Q.; software, J.Q.; validation, J.Q. and G.Z.; formal analysis, L.S. and P.Z.; investigation, J.Z. and L.S.; data curation, F.Z.; writing, J.Q. and G.Z.; supervision, Y.J.; project administration, Y.J.; funding acquisition, Y.J. and G.Z. All authors have read and agreed to the published version of the manuscript.

Funding

This research was sponsored by the National Natural Science Foundation of China (Grant Nos.: 41920104007, 42227805).

Institutional Review Board Statement

Not applicable.

Informed Consent Statement

Not applicable.

Data Availability Statement

Data are available on request due to restrictions, e.g., privacy or ethical concerns. The data presented in this study are available on request from the corresponding author. The data are not publicly available due to business reasons.

Acknowledgments

The authors would like to thank Feipeng Li for assistance in data collection and curation.

Conflicts of Interest

The authors declare no conflict of interest.

Appendix A

Deflection solution for diaphragm wall with additional thrust P.
For arbitrary loading q, Navier [35] gives the value of Amn in Equation (2),
A m n = 4 0 L 0 H q sin m π y L sin n π z H d y d z π 4 L H D m 2 L 2 + n 2 H 2 2
where D is bending stiffness of thin-plate, which is calculated as
D = E b 3 12 1 μ 2
in which E is the elasticity modulus of the plate and μ is Poisson’s ratio of the plate. In our condition, two circle zones (tunnels) in thin-plate are sufficient for additional thrust P. In local conditions, the positions of two circle are x 1 , z 1 and x 2 , z 2 , and have same radius of R. Figure A1 shows the schematic diagram of the diaphragm wall with additional thrust. Hence, the Amn can be written as
A m n = 4 π 4 L H D m 2 L 2 + n 2 H 2 2 Ω 1 + Ω 2 + Ω 3 q sin m π y L sin n π z H
Due to no any force acting on zone Ω3, the Equation (A3) can be simplified as
A m n = 4 π 4 L H D m 2 L 2 + n 2 H 2 2 Ω 1 + Ω 2 q sin m π y L sin n π z H
Adopting polar coordinate transforms (r, θ) to solve double integral, y = r cos θ , z = r sin θ , and dA = rdrdθ is substituted into Equation (A4). Equation (A4) becomes
A m n = 4 π 4 L H D m 2 L 2 + n 2 H 2 2 0 2 π 0 R P r sin m π y 1 + r cos θ L sin n π z 1 + r sin θ H + sin m π y 2 + r cos θ L sin n π z 2 + r sin θ H d r d θ
Equation (A4) does not have a primary solution. MATLAB 2015a commercial software provides a double numerical integration function. The value of Amn can be calculated using MATLAB code, which are listed as
close all; clear all; clc
                                                                      f = @(r, theta) P*r*(sin(m*pi*(y1 + r*cos(theta))/L)* sin(n*pi*(z1 + r*sin(theta))/H)+
                                                                  sin(m*pi*(y2 + r*cos(theta))/L)* sin(n*pi*(z2 + r*sin(theta))/H));
                                                                                                         Amn = 4/(pi^4*L*H*D*(m^2/L^2 + n^2/H^2))*dblquad(f,0,2*pi,0,R,1.0 × 10−3,’quadl’);
Figure A1. Calculated model of the diaphragm wall with additional trust.
Applsci 13 11588 g0a1

References

  1. Schuster, M.; Kung, G.; Juang, C.; Hashash, Y. Simplified model for evaluating damage potential of buildings adjacent to a braced excavation. J. Geotech. Geoenviron. Eng. 2009, 135, 1823–1835. [Google Scholar] [CrossRef]
  2. Hsiao, E.; Schuster, M.; Juang, C.; Kung, G. Reliability analysis and updating of excavation-induced ground settlement for building serviceability assessment. J. Geotech. Geoenviron. Eng. 2008, 134, 1448–1458. [Google Scholar] [CrossRef]
  3. Fan, X.; Phoon, K.; Xu, C.; Tang, C. Closed-form solution for excavation-induced ground settlement profile in clay. Comput. Geotech. 2021, 137, 104266. [Google Scholar] [CrossRef]
  4. Cao, L.; Zhang, D.; Fang, Q. Semi-analytical prediction for tunnelling-induced ground movements in multi-layered clayey soils. Tunneling Undergr. Space Technol. 2020, 102, 103446. [Google Scholar] [CrossRef]
  5. Dalgoc, K.; Hendriks, M.; Ilki, A. Building response to tunneling and excavation-induced ground movements: Using transfer functions to review the limiting tensile strain method. Struct. Infrastruct. Eng. Maint. Manag. Life-Cycle Des. Perform. 2018, 14, 766–779. [Google Scholar] [CrossRef]
  6. Park, K. Elastic solution for the tunneling-induced ground movements in clays. Int. J. Geomech. 2004, 4, 310–318. [Google Scholar] [CrossRef]
  7. Bobet, A. Analytical solutions for shallow tunnels in saturated ground. J. Eng. Mech. 2001, 127, 1258–1266. [Google Scholar] [CrossRef]
  8. Fattah, M.; Shlash, K.; Salim, N. Prediction of settlement through induced by tunneling in cohesive ground. Acta Geotech. 2013, 8, 167–179. [Google Scholar] [CrossRef]
  9. Kong, F.; Lu, D.; Du, X.; Shen, C. Elastic analytical solution of shallow tunnel owing to twin tunnelling based on a unified displacement function. Appl. Math. 2019, 68, 422–442. [Google Scholar] [CrossRef]
  10. Mindlin, R. Force at a point in the interior of a semi-infinite solid. Physics 1936, 7, 195–202. [Google Scholar] [CrossRef]
  11. Timoshenko, S.; Goodier, J. Theory of Elasticity; McGraw-Hill Higher Education: New York, NY, USA, 1970. [Google Scholar]
  12. Sagaseta, C. Analysis of undrained soil deformation due to ground loss. Geotechnique 1987, 37, 301–320. [Google Scholar] [CrossRef]
  13. Verruijt, A. A complex variable solution for a deforming circular tunnel in an elastic half-plane. Int. J. Numer. Anal. Methods Geomech. 1997, 21, 77–89. [Google Scholar] [CrossRef]
  14. Peck, R. Deep excavation and tunneling in soft ground. In Proceedings of the 7th International Conference on Soil Mechanics and Foundation Engineering, State-of-the-Art, Mexico City, Mexico, 25–29 August 1969; pp. 225–290. [Google Scholar]
  15. Zhao, C.; Lavasan, A.; Barciaga, T. Mechanized tunneling induced ground movement and its dependency on the tunnel volume loss and soil properties. Int. J. Numer. Anal. Methods Geomech. 2019, 43, 781–800. [Google Scholar] [CrossRef]
  16. Moh, Z.; Ju, H.; Hwang, R. Ground movements around tunnels in soft ground. In Proceedings of the International Symposium on Geotechnical Aspects of Underground Construction in Soft Ground; Balkema: Rotterdam, The Netherlands, 1996; pp. 268–273. [Google Scholar]
  17. Atkinson, J.; Potts, D. Stability of a shallow circular tunnel in cohesionless soil. Geotechnique 1977, 27, 203–215. [Google Scholar] [CrossRef]
  18. Finno, R.; Blackburn, J.; Roboski, J. Three-dimensional effects for supported excavations in clay. J. Geotech. Geoenviron. Eng. 2007, 133, 30–36. [Google Scholar] [CrossRef]
  19. Liu, C.; Peng, Z.; Pan, L.; Pan, L.; Liu, H.; Yang, Y.; Chen, W. Influence of tunnel boring machine (TBM) advance on adjacent tunnel during ultra-rapid underground pass (URUP) tunneling: A case study and numerical investigation. Appl. Sci. 2020, 10, 3746. [Google Scholar] [CrossRef]
  20. Shah, R.; Lavasan, A.; Peila, D. Numerical study on backfilling the tail void using a two-component grout. J. Mater. Civ. Eng. 2018, 30, 4018003–40180011. [Google Scholar] [CrossRef]
  21. Fu, J. Modelling Ground Movement and Associated Building Response Due to Tunneling in Soils. Ph.D. Thesis, Technische Universitaet Bergakademie Freiberg, Freiberg, Germany, 2014. [Google Scholar]
  22. Franzius, J.; Potts, D. Influence of mesh geometry on three-dimensional finite-element analysis of tunnel excavation. Int. J. Geomech. 2005, 5, 256–266. [Google Scholar] [CrossRef]
  23. Wang, X.; Schmettow, T.; Chen, X.; Xia, C. Prediction of ground settlements induced by twin shield tunneling in rock and soil—A case study. Undergr. Space 2022, 7, 623–635. [Google Scholar] [CrossRef]
  24. Zhu, C. Surface settlement analysis induced by shield tunneling construction in the loess region. Adv. Mater. Sci. Eng. 2021, 2021, 5573372. [Google Scholar] [CrossRef]
  25. Jin, H.; Yuan, D.; Jin, D.; Wu, J.; Wang, X.; Han, B.; Mao, J. Shield kinematics and its influence on ground settlement in ultrasoft soil: A case study in Suzhou. Can. Geotech. J. 2022, 59, 1887–1900. [Google Scholar] [CrossRef]
  26. Gan, X.; Yu, J.; Gong, X.; Liu, N.; Zheng, D. Behaviours of existing shield tunnels due to tunneling underneath considering asymmetric ground settlements. Undergr. Space 2022, 7, 882–897. [Google Scholar] [CrossRef]
  27. Zhang, J.; Gao, Y.; Liu, X.; Zhang, Z.; Yuan, Y.; Mang, H. A shield tunneling for enlarging the diameter of existing tunnels: Experimental investigations. Tunneling Undergr. Space Technol. 2022, 128, 104605. [Google Scholar] [CrossRef]
  28. Liu, B.; Yu, Z.; Zhang, R.; Han, Y.; Wang, Z.; Wang, S. Effects of undercrossing tunneling on existing shield tunnels. Int. J. Geomech. 2021, 21, 1–12. [Google Scholar] [CrossRef]
  29. Lin, X.; Chen, R.; Wu, H.; Cheng, H. Deformation of behaviors of existing tunnels caused by shield tunneling undercrossing oblique angle. Tunneling Undergr. Space Technol. 2019, 89, 78–90. [Google Scholar] [CrossRef]
  30. Chakeri, H.; Hasanpour, R.; Hindistan, M. Analysis of interaction between tunnels in soft ground by 3D numerical modeling. Bull. Eng. Geol. Environ. 2011, 70, 439–448. [Google Scholar] [CrossRef]
  31. Klar, A.; Vorsster, T.; Soga, K.; Mair, R. Soil-pipe interaction due to tunnelling: Comparison between Winkler and elastic continuum solutions. Geotechnique 2005, 55, 461–466. [Google Scholar] [CrossRef]
  32. Zhang, H.; Huang, M. Geotechnical influence on existing subway tunnels induced by multiline tunneling in Shanghai soft soil. Comput. Geotech. 2014, 56, 121–132. [Google Scholar] [CrossRef]
  33. He, S.; Lai, J.; Wang, L.; Wang, K. A literature review on properties and applications of grouts for shield tunnel. Constr. Build. Mater. 2020, 239, 117782. [Google Scholar] [CrossRef]
  34. Zhao, Y.; Chen, X.; Hu, B.; Wang, P.; Li, W. Evolution of tunnel uplift induced by adjacent long and collinear excavation and an effective protective measure. Tunn. Undergr. Space Technol. 2023, 131, 104846. [Google Scholar] [CrossRef]
  35. Wei, G.; Qi, Y.; Chen, C.; Zhang, S.; Qian, C.; Zhou, J. Analysis of the protective effect of setting isolation piles outside the foundation pit on the underpass tunnel side. Transp. Geotech. 2022, 35, 100791. [Google Scholar] [CrossRef]
  36. Liang, X.; Ying, K.; Ye, F.; Su, E.; Xia, T.; Han, X. Selection of backfill grouting materials and ratios for shield tunnel considering stratum suitability. Constr. Build. Mater. 2022, 314, 125431. [Google Scholar] [CrossRef]
  37. Bowles, J. Foundation Analysis and Design; McGraw-Hill: New York, NY, USA, 1988. [Google Scholar]
  38. Qian, W.; Qi, T.; Zhao, Y.; Le, Y.; Yi, H. Deformation characteristics and safety assessment of a high-speed railway induced by undercutting metro tunnel excavation. J. Rock Mech. Geotech. Eng. 2019, 11, 88–98. [Google Scholar] [CrossRef]
  39. Simo, J.; Hughes, T. Interdisciplinary Applied Mathematics; Springer: Berlin/Heidelberg, Germany, 1998. [Google Scholar]
  40. Kung, G.; Juang, C.; Hsiao, E.; Hashash, Y. Simplified model for wall deflection and ground-surface settlement caused by braced excavation in clays. J. Geotech. Geoenviron. Eng. 2007, 133, 731–747. [Google Scholar] [CrossRef]
  41. Clough, G.; O’Rourke, T. Construction Induced Movements of Insitu Wall, Design and Performance of Earth Retaining Structure; ASCE: New York, NY, USA, 1990; pp. 439–470. [Google Scholar]
  42. Feng, C.; Zhang, D. The general deformation mode and its application of subway station foundation pit in sandy cobble stratum. Chin. J. Rock Mech. Eng. 2018, 37, 4395–4405. (In Chinese) [Google Scholar] [CrossRef]
  43. Huang, M.; Zhang, C.; Li, Z. A simplified analysis method for the influence of tunneling on ground piles. Tunn. Undergr. Space Technol. 2009, 125, 207–215. [Google Scholar] [CrossRef]
  44. Xiong, F.; Sun, H.; Zhang, Q.; Wang, Y.; Jiang, Q. Preferential flow in three-dimensional stochastic fracture networks: The effect of topological structure. Eng. Geol. 2022, 309, 106856. [Google Scholar] [CrossRef]
  45. Xiong, F.; Zhu, C.; Feng, G.; Zheng, J.; Sun, H. A three-dimensional coupled thermo-hydro model for geothermal development in discrete fracture networks of hot dry rock reservoirs. Gondwana Res. 2023, 122, 331–347. [Google Scholar] [CrossRef]
Figure 1. Location of Metro Line 12 in Wuhan city, China.
Applsci 13 11588 g001
Figure 2. Space relationship of Metro Line 4 and Line 12.
Applsci 13 11588 g002
Figure 3. Calculation model of ground heave induced by diaphragm wall deformation.
Applsci 13 11588 g003
Figure 4. The simplified calculation model of the tunnel for Metro Line 12 passing through the diaphragm wall.
Applsci 13 11588 g004
Figure 5. (a) Calculation model of transverse deformation curve; (b) calculation model of longitudinal deformation curve.
Applsci 13 11588 g005
Figure 6. Flowchart of the ground heave calculation.
Applsci 13 11588 g006
Figure 7. Layout of field monitoring points. Red circle represents deformation monitoring point, and red triangle represents diaphragm wall top deformation and horizontal displacement monitoring points.
Applsci 13 11588 g007
Figure 8. (a) Installation instruction of deformation monitoring points; (b) installation instruction of diaphragm wall top monitoring points.
Applsci 13 11588 g008
Figure 9. The monitoring results of ground heave of DB1–DB5. Day 38 is when Line 12 passed through the underground diaphragm wall.
Applsci 13 11588 g009
Figure 10. The monitoring results of wall top vertical deformation of CX1–CX4.
Applsci 13 11588 g010
Figure 11. The monitoring results of wall top horizontal deformation of ZL1–ZL2.
Applsci 13 11588 g011
Figure 12. Calculated deformation of underground diaphragm wall acting of additional thrust P.
Applsci 13 11588 g012
Figure 13. Deformation of the diaphragm wall and ground. The solid line is ground heave calculated by the proposed method; dashed line is horizontal deformation of diaphragm wall, solid square is measured deformation and open square is measure horizontal deformation of the diaphragm wall.
Applsci 13 11588 g013
Figure 14. 3D ground heave distribution of the proposed method.
Applsci 13 11588 g014
Figure 15. The effects of thickness of diaphragm wall b on ground heave.
Applsci 13 11588 g015
Figure 16. The effects of elasticity modulus E of diaphragm wall on ground heave.
Applsci 13 11588 g016
Figure 17. The effects of embedded ratio re of diaphragm wall on ground heave.
Applsci 13 11588 g017
Table 1. Physical parameters of soil layers (Reprinted/adapted with permission from Ref. Qian et al. [37]).
SoilWeight
γ
(kN/m3)
Bearing Capacity fak (kPa)Friction Angle
φ (°)
Modulus of
Compression
Es (MPa)
Poisson
Ratio μ
Permeability
Coefficient k (cm/s)
miscellaneous fill ①120.0-18-0.255.0 × 10−3
silty clay ③119.1123114.50.33.5 × 10−3
silty sand ④119.015533.413.50.32.8 × 10−3
silty sand ④219.520635.218.60.33.1 × 10−3
Table 2. Calculated parameters used in proposed model.
Modulus of Elasticity
E (GPa)
Poisson Ratio
μ
Friction Angle
φ (°)
Diaphragm wall200.150
Equivalent soil12.20.325
Disclaimer/Publisher’s Note: The statements, opinions and data contained in all publications are solely those of the individual author(s) and contributor(s) and not of MDPI and/or the editor(s). MDPI and/or the editor(s) disclaim responsibility for any injury to people or property resulting from any ideas, methods, instructions or products referred to in the content.

