Article

Experimental–Simulation Analysis of a Radiation Tolerant Erbium-Doped Fiber Amplifier for Space Applications

1
Laboratoire Hubert Curien, UMR CNRS 5516, Université Jean Monnet, 42000 Saint-Etienne, France
2
Department of Electrical and Information Engineering, Politecnico di Bari, Via E. Orabona 4, 70125 Bari, Italy
3
Exail, rue Paul Sabatier, 22300 Lannion, France
4
Institut Universitaire de France (IUF), Ministère de l’Enseignement Supérieur et de la Recherche, sis 1 rue Descartes, 75005 Paris, France
*
Author to whom correspondence should be addressed.
Appl. Sci. 2023, 13(20), 11589; https://doi.org/10.3390/app132011589
Submission received: 20 September 2023 / Revised: 13 October 2023 / Accepted: 16 October 2023 / Published: 23 October 2023
(This article belongs to the Section Aerospace Science and Engineering)

Abstract

:
Research on optical amplifiers has highlighted how ionizing radiation negatively impacts the performance of erbium-doped fiber amplifiers (EDFAs), through the degradation of their gain. The amplitudes and kinetics of this degradation are mainly explained by the radiation-induced attenuation (RIA) phenomenon at the pump and signal wavelengths. In this work, the gain degradation of a radiation tolerant EDFA (exploiting a cerium-co-doped active optical fiber) induced by ionizing radiation up to 3 kGy (SiO2), at two dose rates, 0.28 Gy/s and 0.093 Gy/s, is studied through an experimental/simulation approach. Using a home-made simulation code based on the rate and power propagation equations and including the RIA effects, the radiation-dependent performance of EDFAs were estimated. The variations in the spectroscopic parameters caused by irradiation were also characterized, but our results show that they give rise to EDFA gain degradation of about 1%. To overcome the issue of overestimating the RIA during the radiation tests on the sole active rare-earth-doped fiber, a new RIA experimental setup is introduced allowing us to better consider the photobleaching mechanisms related to the pumping at 980 nm. A good agreement between experimental and simulated gain degradation dose dependences was obtained for two different irradiation conditions, thus also validating the simulation code for harsh environments applications.

1. Introduction

REDFs represent a key technology for the realization of amplifiers and lasers, with high gain, large bandwidth and good performance in terms of noise. Thanks to these characteristics, REDFs have proved to be an ideal solution in the field of telecommunications, specifically in the telecom window around 1550 nm [1]. Moreover, thanks to the small size, low weight and low power consumption of REDFs, they are recently finding great use in the context of space missions and satellite communications to ensure free space high-speed data transfer. REDFAs and REDFSs are used as part of space optical communications terminals to enable long-range communications as well as in fiber optic gyroscopes [2,3,4,5,6,7,8].
These devices are typically based on optical fibers doped with Er3+, Yb3+ ions or a combination of both. However, RE-based systems also have limitations in such harsh environments, linked to the effects of ionizing radiation (protons, electrons, etc.) present in space context, which give rise to the degradation of REDF performance; in fact, it has been demonstrated that active fiber represents the most radiation-sensitive part of an EDFA [9,10].
The radiation effects on the optical fibers appear through three macroscopic phenomena. Among them, the main one is the RIA. It is an increase in the optical fiber losses that appear during irradiation. It is caused by the generation of point defects (color centers) in the host silica-based glass matrix, that lead to new absorption bands in the band gap. Generally, RIA increases with TID and then reduces partially after irradiation is stopped. The second effect is the RIE: it is constituted by Cerenkov light and radioluminescence light, that is, the light emission from pre-existing or radiation-induced centers, excited by the radiation. The last effect is the RIC, that takes place at high doses or at high neutron fluences [9,11,12].
The RIA directly affects the gain of the system. REDFs have been shown to be much more sensitive to radiation than telecom-grade germanosilicate optical fibers [13,14]. In fact, this vulnerability is not linked to the presence of RE ions, such as Er3+ and Yb3+ ions, but it is due to the presence of co-dopants, such as Al or P [8,15], added to the glass matrix to facilitate the incorporation of RE ions and to prevent the formation of RE ions clusters that limit the amplification efficiency [1,16].
Under steady-state radiation, for example, optical fibers can be classified into three groups, considering their RIA levels: sensitive, tolerant or resistant fibers. Examples of radiation-sensitive optical fibers include all fibers doped with P and/or Al in their core or cladding: their losses are so high that dosimeters are today based on such fibers. Among the radiation-tolerant optical fibers are the telecom-grade germanosilicate optical fibers, without P in their core and cladding, whereas radiation-hardened optical fibers are the ones with pure silica or F-doped cores and F-doped cladding, and N-doped optical fibers [9,17,18]. The sensitivity of REDFAs to ionizing radiation manifests itself mostly with a gain degradation. Over the years, various techniques have been developed at the component level to make REDFAs more radiation-resistant, including co-doping of the REDF core with cerium ions and/or pre-loading it with H2 or D2 [19,20,21]. The use of co-doping with cerium is justified by its ability, depending on its multivalent state, to trap electrons or holes that may be created during the radiation exposure and may have a significant contribution to the P- or Al-related defects generation [22,23].
During the last 30 years, the topic of point defects related to P and Al in the amorphous silica matrix, as well as in the active and passive optical fibers, has been investigated by researchers [24,25]. For example, EDFAs are usually co-doped with Al ions, but the exact natures of the Al-related point defects induced under radiation are not clear yet, especially in the infrared spectral region. However, it is known that the RIA in the infrared is influenced by the presence of the tail of the AlOHCs, whose absorption peaks around 540 nm, and by another defect, whose structure remains unknown. For the EDFAs, while the pump transmission at 980 nm is affected by the AlOHC presence, the signal at 1550 nm is mainly impacted by this unknown center [25].
Under specific conditions such as EDFAs (where a pump signal is injected into the guide), the PB begins to compete with the radiation-induced defect generation by enhancing the recombination of defects. By injecting a pump signal at the appropriate wavelength and power into the fiber, metastable defects created by radiation can recombine not only thermally but also thanks to the energy supplied by the injected light. Then, PB allows us to reduce the RIA by accelerating its recovery processes [25,26]. In the case of EDFA, the injected signal able to induce a PB phenomenon is the pump signal at 980 nm [27]. In a previous study, Aubry et al. [28] noted that by injecting the high-power pump signal into an EDF with a core co-doped with cerium during the 80% of the irradiation run time duration, the RIA at 980 nm is reduced by 20%, while the RIA at 1550 nm is reduced by 50%, compared to the case in which the pump signal is not injected into the fiber. Moreover, radiations can also influence the spectroscopic parameters of the fiber, as reported in [29,30,31,32].
This work aims to analyze, through an experimental–simulation approach, the gain degradation induced by the presence of ionizing radiations in the space environment. Generally, for space applications in which EDFAs are used, the TID of kGy can be reached for the most challenging mission, so in this study, we will consider a maximum dose of 3 kGy (SiO2) that covers rather the current and future space needs.
Since an EDFA using a Ce co-doped fiber presents a better radiation resistance than one based on telecom-grade active fiber, without Ce-doping or H2 loading [20,23], we will focus our study on such an EDFA. The gain degradation will be measured experimentally and evaluated using a simulation code based on the PSO algorithm [33,34] which solves the rate equations of the involved energy levels and the power propagation equations. The radiation effects giving RIA and changing the spectroscopic parameters as radiative lifitime, emission and absorption cross sections were considered in the numerical code, too. This work highlights a good agreement between the measured and simulated gain degradation kinetics and allows us to understand the basic mechanisms that rule the gain degradation.

2. Simulation and Experimental Procedure

2.1. Tested Optical Fiber and Amplifier

The FUT was an aluminosilicate fiber co-doped with erbium and cerium, manufactured by EXAIL (Lannion, France). The diameter of the fiber core and cladding are 2.8 μm 127 µm, respectively. Additional optical fiber details are given in Table 1.
Table 2 summarizes the details related to the EDFA used in the experiments, specifying the operational and physical conditions.
The optimized length of 4.3 m was obtained experimentally and through the simulation code, and it corresponds to a maximum gain equal to 31.8 dB [35].

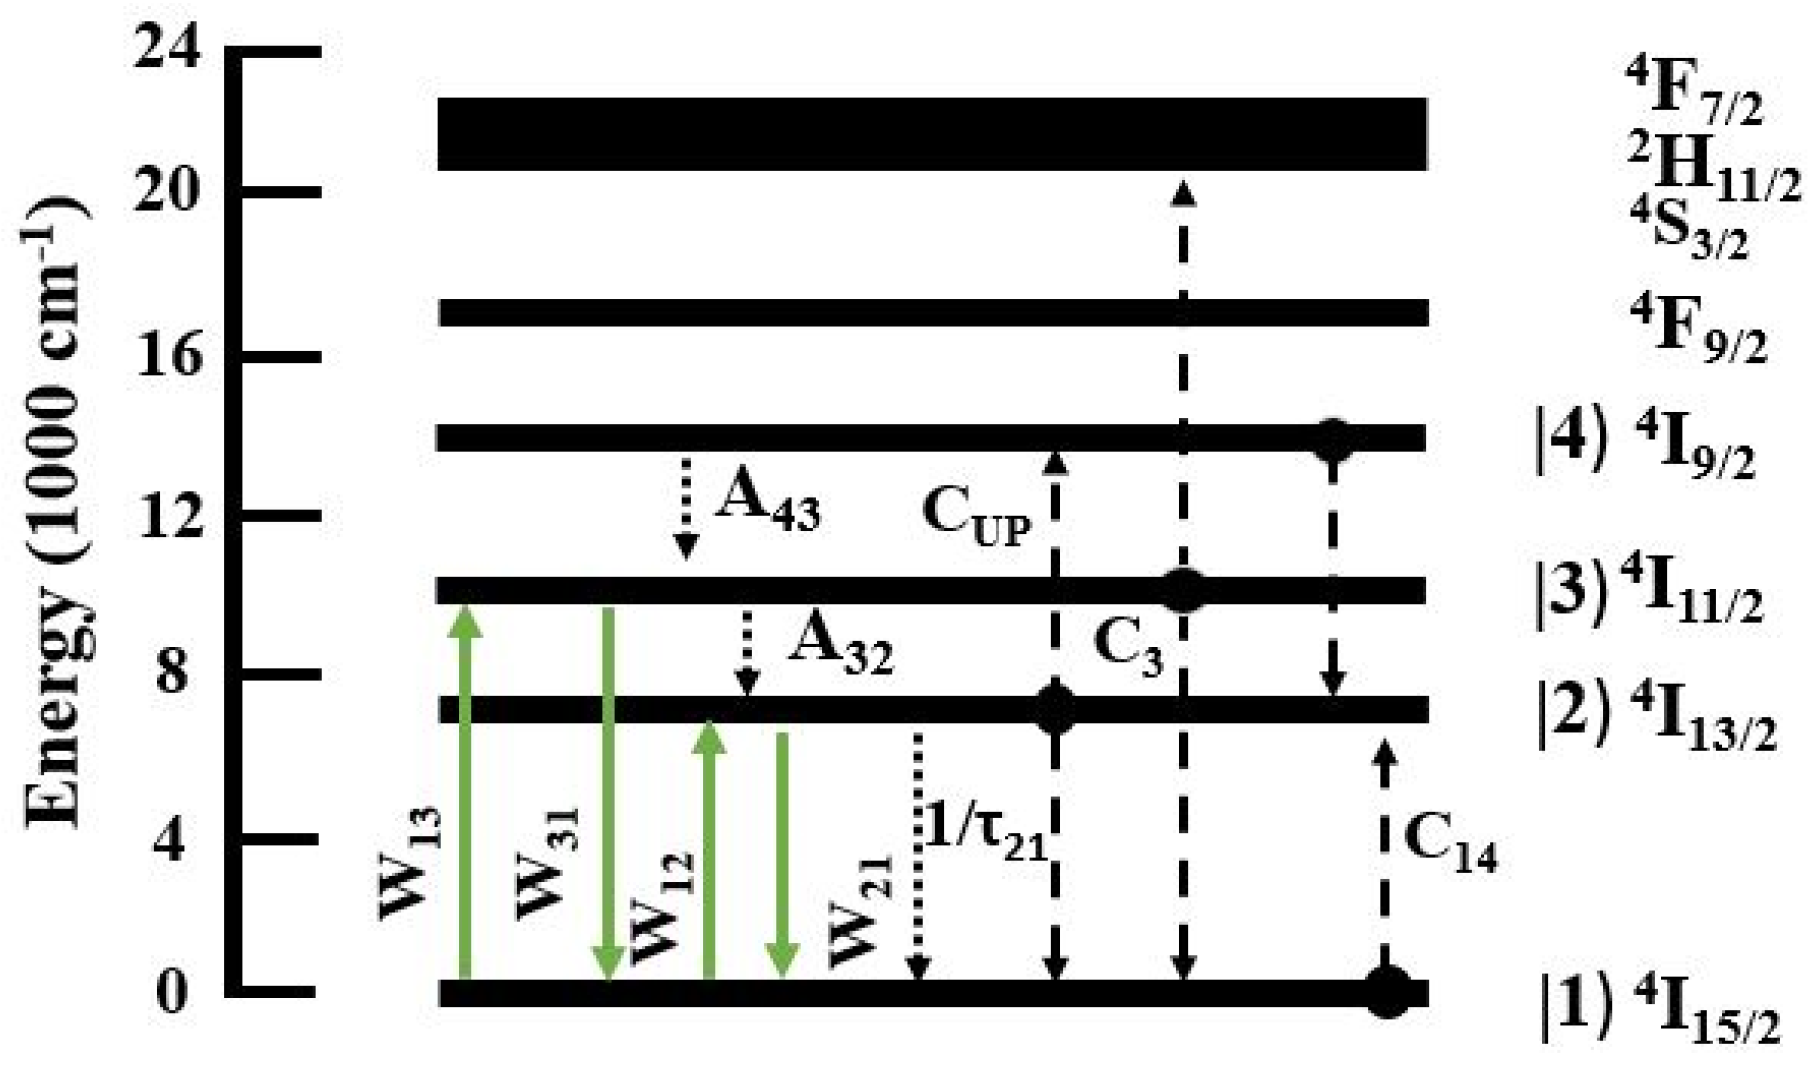
2.2. Theoretical Model

The theoretical model is based on the differential equations underlying the multilevel rate equations describing the ion populations of the different erbium energy levels, as well as the power propagation equations describing the longitudinal evolution of pump, signal and amplified spontaneous emission (ASE) power. A schematic of the Er3+ energy level system illustrating the transitions considered in the model is shown in Figure 1.
Specifically, in our simulations, the following phenomena were taken into account: (1) spontaneous decay from 4I13/2, 4I11/2 and 4I9/2 energy levels; (2) pump absorption and stimulated emission between 4I15/2 and 4I11/2 energy levels; (3) signal absorption and stimulated emission between 4I15/2 and 4I13/2 energy levels; (4) uniform cooperative upconversion beetween a pair of excited Er3+ ions: 4I13/2 + 4I13/24I9/2 + 4I15/2 and 4I11/2 + 4I11/24I15/2 + 4S3/2; (5) cross-relaxation process between two Er3+ ions: 4I9/2 + 4I15/24I13/2. The rate Equations (1)–(5) are reported below and are solved with the simulation code using the Newton–Raphson method:
d N 1 d t = ( W 12 + W 13 ) N 1 + W 31 N 3 + W 21 N 2 + N 2 τ 21 + C u p N 2 2 + C 3 N 3 2 C 14 N 1 N 4
d N 2 d t = W 12 N 1 W 21 N 2 N 2 τ 21 2 C u p N 2 2 + C 14 N 1 N 4
d N 3 d t = W 13 N 1 W 31 N 3 + A 43 N 4 A 32 N 3 C 3 N 3 2
d N 4 d t = A 43 N 4 + A 32 N 3 + C u p N 2 2 C 14 N 1 N 4
i = 1 4 N i = N E r
In these equations, Ni is the population of the i-th energy level; τ21 corresponds to the radiative lifetime of the 4I13/2 energy level; Wij is the absorption/stimulated emission rate between energy levels i and j; Aij is the non-radiative decay rate from levels i to level j; Cup and C3 are the homogeneous upconversion coefficients related to 4I13/2 and 4I11/2 energy levels, respectively; C14 is the cross-relaxation coefficient between Er3+ ions; and NEr is the total Er3+ population [35,36,37]. The total distribution of Er3+ ions is assumed to be uniform over the cross section of the fiber core and along the whole fiber length. The optical power propagation equations for the pump, signal and ASE, along the forward (+) and backward (−) directions are reported in (6)–(8). They form a two-boundary values problem which is solved using an iterative forward and backward integration technique, suitably developed, based on the Runge–Kutta method.
d P p ± ( z ) d z = ± Γ ( υ p ) [ N 3 σ e ( υ p ) N 1 σ a ( υ p ) α ( υ p ) ] P p ± ( z )
d P s ± ( z ) d z = ± Γ ( υ s ) [ N 2 σ e ( υ s ) N 1 σ a ( υ s ) α ( υ s ) ] P s ± ( z )
d P A S E ± ( z , υ k ) d z = ± Γ ( υ k ) [ N 2 σ e ( υ k ) N 1 σ a ( υ k ) α ( υ s ) ] P A S E ± ( z , υ k ) ± 2 N 2 Γ ( υ k ) h υ k Δ υ k σ e ( υ k )
In (6)–(8), υp and υs correspond to the frequency of the pump and signal, respectively; σe and σa are the emission and absorption cross sections of Er3+ ions, respectively; and α is the total attenuation of active fiber, which also includes RIA. The forward and backward components of ASE noise spread over a continuous frequency range. Thus, in order to perform the numerical computations, the whole Er3+ spectrum is sampled into K frequency slots centered at the frequency υk with bandwidth Δυk, k = 1, 2, …, K. The overlap factor Γ(υ) quantifying the transverse optical mode profile overlapping with erbium ion distribution is defined as follows
Γ ( υ ) = 0 2 π 0 R c | E ( r , ϕ , υ ) | 2 r d r d ϕ 0 2 π 0 | E ( r , ϕ , υ ) | 2 r d r d ϕ
with
0 2 π 0 | E ( r , ϕ , υ ) | 2 r d r d ϕ = 1
In (9), we consider that the actual erbium ion distribution is constant on the optical fiber core with radius Rc. Moreover, E ( r , ϕ , υ ) is the transverse electric field envelope normalized using Equation (10). The overlap factor is a very important parameter, since it quantifies the percentage of the guided optical mode that interacts with the RE doping the fiber core. Therefore, an accurate calculation of the overlap factor results in an accurate estimate of the REDFA performance [33].
The computational code used for the prediction of the EDFA performance needs various input parameters: fiber parameters (fiber length, core radius, overlapping factor); spectroscopic parameters (radiative and non-radiative lifetimes, upconversion and cross-relaxation coefficients, erbium ion concentration, emission and absorption cross sections spectra); operative parameters (pump and signal wavelengths, pump and signal power, pumping scheme) and irradiation parameters (RIA at pump and signal wavelengths, which depend on dose rate, dose and temperature).

2.3. Spectroscopic Characterization

Among the used values of the spectroscopic parameters, some have been measured experimentally on the FUT, while others have been taken from the literature. Table 3 reports the values used in the simulation code.
The Er3+ absorption cross section was calculated from the absorption spectrum of the tested EDF, obtained through the cutback technique [38,39] and using the following formula:
σ a E r ( υ ) = a t t E r ( υ ) 10 log ( e ) N E r Γ ( υ )
where NEr is the Er3+ ion concentration, reported in Table 2. On the basis of the McCumber theory, the Er3+ emission cross section was calculated by the relationship
σ e E r ( υ ) = σ a E r ( υ ) e E h υ κ T
where E is the energy difference between the lower lying state of the multiplet forming the 4I13/2 energy level and lower lying state of the multiplet forming the ground state 4I15/2; T is the temperature; and κ and h are the Boltzmann and Planck constants, respectively.
The lifetime measurements were performed using the TRL technique. The set-up description was reported in Ladaci et al. [29,40]. The radiation-induced variations in the Er3+ absorption and emission cross sections and the lifetime of the 4I13/2 energy level were also measured, to evaluate their influence on the gain degradation.

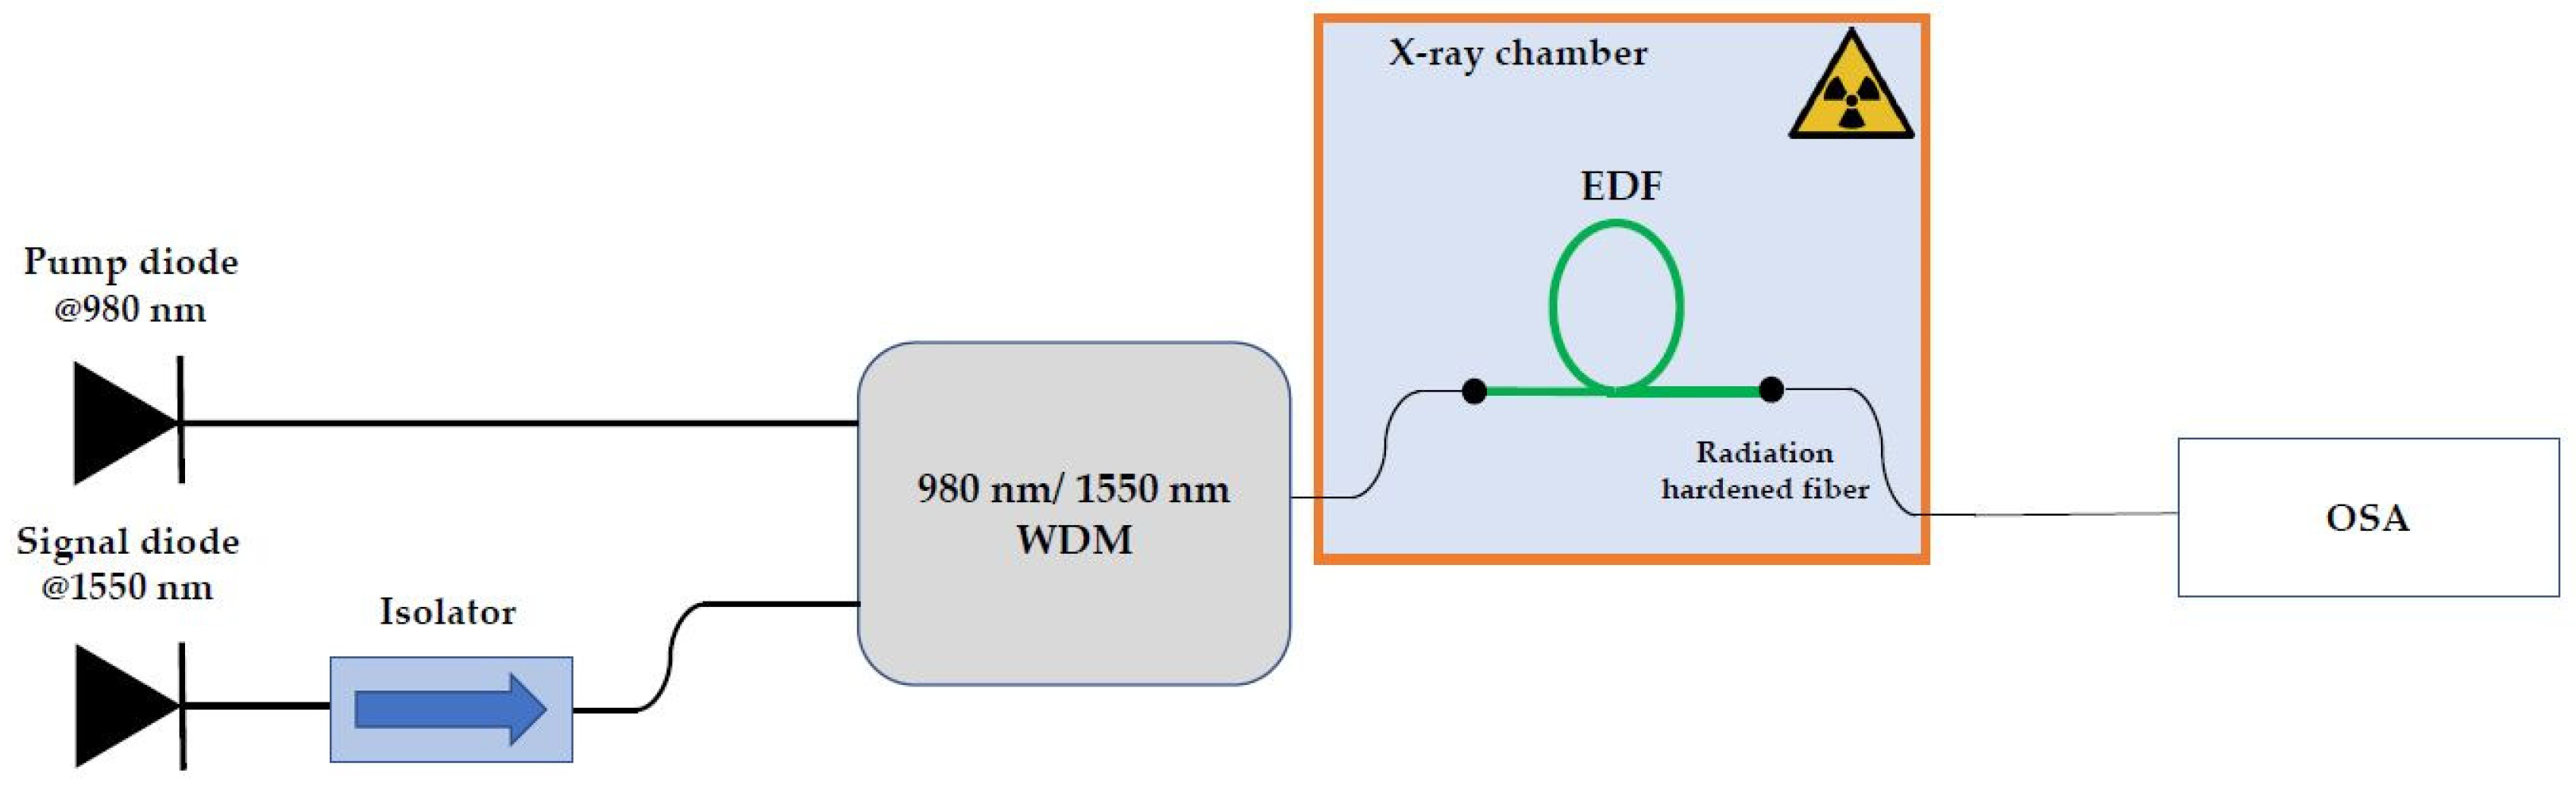
2.4. RIA Measurements

In order to evaluate the performances of EDFA under the ionizing radiation, the simulation code needs to know how the transmissions at the pump and signal wavelengths are degraded under radiation, so RIA measurements were also carried out. To evaluate the evolution of RIA as a function of the absorbed dose, the EDF, introduced in Section 2.1, was irradiated in the MOPERIX facility of the Laboratoire Hubert Curien (Saint-Etienne, France). This is characterized by a Tungsten tube operating with a 100 kV voltage, that gives a mean energy fluence of 40 keV.
In the previous work of our research group, Aubry et al. [28] showed that adding periods of high pump power during the fiber testing reduces the measured RIA at the pump and signal wavelengths. They used an experimental setup for the RIA measurements that allowed them to inject, considering time slots of 15 min, the pump signal into the FUT during the 80% of the time, while during the remaining 20%, only a low-power light source was injected to allow the RIA spectral acquisition. The percentage of time in which the pump signal is not injected into the fiber can cause an overestimation of the RIA obtained during the operation of an EDFA. Indeed, during the fiber testing, there is a lower contribution of the PB to the RIA reduction. This RIA overestimation was potentially identified as one of the causes of the slight observed disagreement between measured and simulated gain degradation kinetics on a similar EDFA, observed at high TIDs in a previous work [28]. For this reason, in this work, we developed a new experimental setup for RIA measurements, that was able to reduce the percentage of time during which the pump is not injected into the fiber.
Figure 2 reports the experimental setup used for the RIA measurement. The signals of two sources, the 1999CHP pump diode at 980 nm by 3S Photonics (Nozay, France) and a halogen white light source from Ocean Optics (Orlando, FL, USA), were injected through an optical switch (belonging to the Thorlabs PRO8000-4 rack) into the EDF. The white light signal was then collected, thanks to another switch synchronized to the first one, with an IR spectrometer (the NIRQuest spectrometer by Ocean Optics), while the pump was recorded using the YOKOGAWA Optical Spectrum Analyzer (OSA) (Tokyo, Japan). The considered EDF sample had a length of 19 cm.
The two-switch system allows one signal to pass through the EDF at a time. Using this type of system, we can adjust the percentage of time the pump signal is injected into the EDF through a LabVIEW 2015 program. Obviously, the pump signal cannot be injected 100% of the time into the EDF, as we need the white light signal to determine the impact of ionizing radiation on the fiber transmission. However, we can obtain very high percentages of time in which the pump signal is injected into the EDF, such as 99%.
In this work, two different dose rates were investigated: 0.28 Gy/s (SiO2) and 0.093 Gy/s (SiO2) up to a TID of 3 kGy. Moreover, at each dose rate, two irradiation runs were carried out, employing different percentages of time in which the pump was injected into the EDF, as highlighted in Table 4. The pump power used in these measurements was 50 mW, the same used for gain degradation measurements. This kind of measurement was carried out at a temperature of 25 °C.

2.5. Gain Degradation Measurements

In order to evaluate the gain degradation under irradiation, the EDFA was also irradiated with the same X-ray machine and irradiation conditions. The setup used for the gain measurement, reported in Figure 3, is as follows: 1999CHP pump diode at 980 nm by 3S Photonics, a 1550 nm laser diode with an isolator and a WDM combiner from IDIL Fibres Optiques (Lannion, France).
The amplified signal is acquired by the YOKOGAWA OSA. For the measurements, a 4.3 m-long EDF was used, since this length allows the maximum gain to be achieved with a 50 mW pump at 980 nm and a 1 µW signal at 1550 nm. Also, in this case, the temperature of the experiment is 25 °C.

3. Results

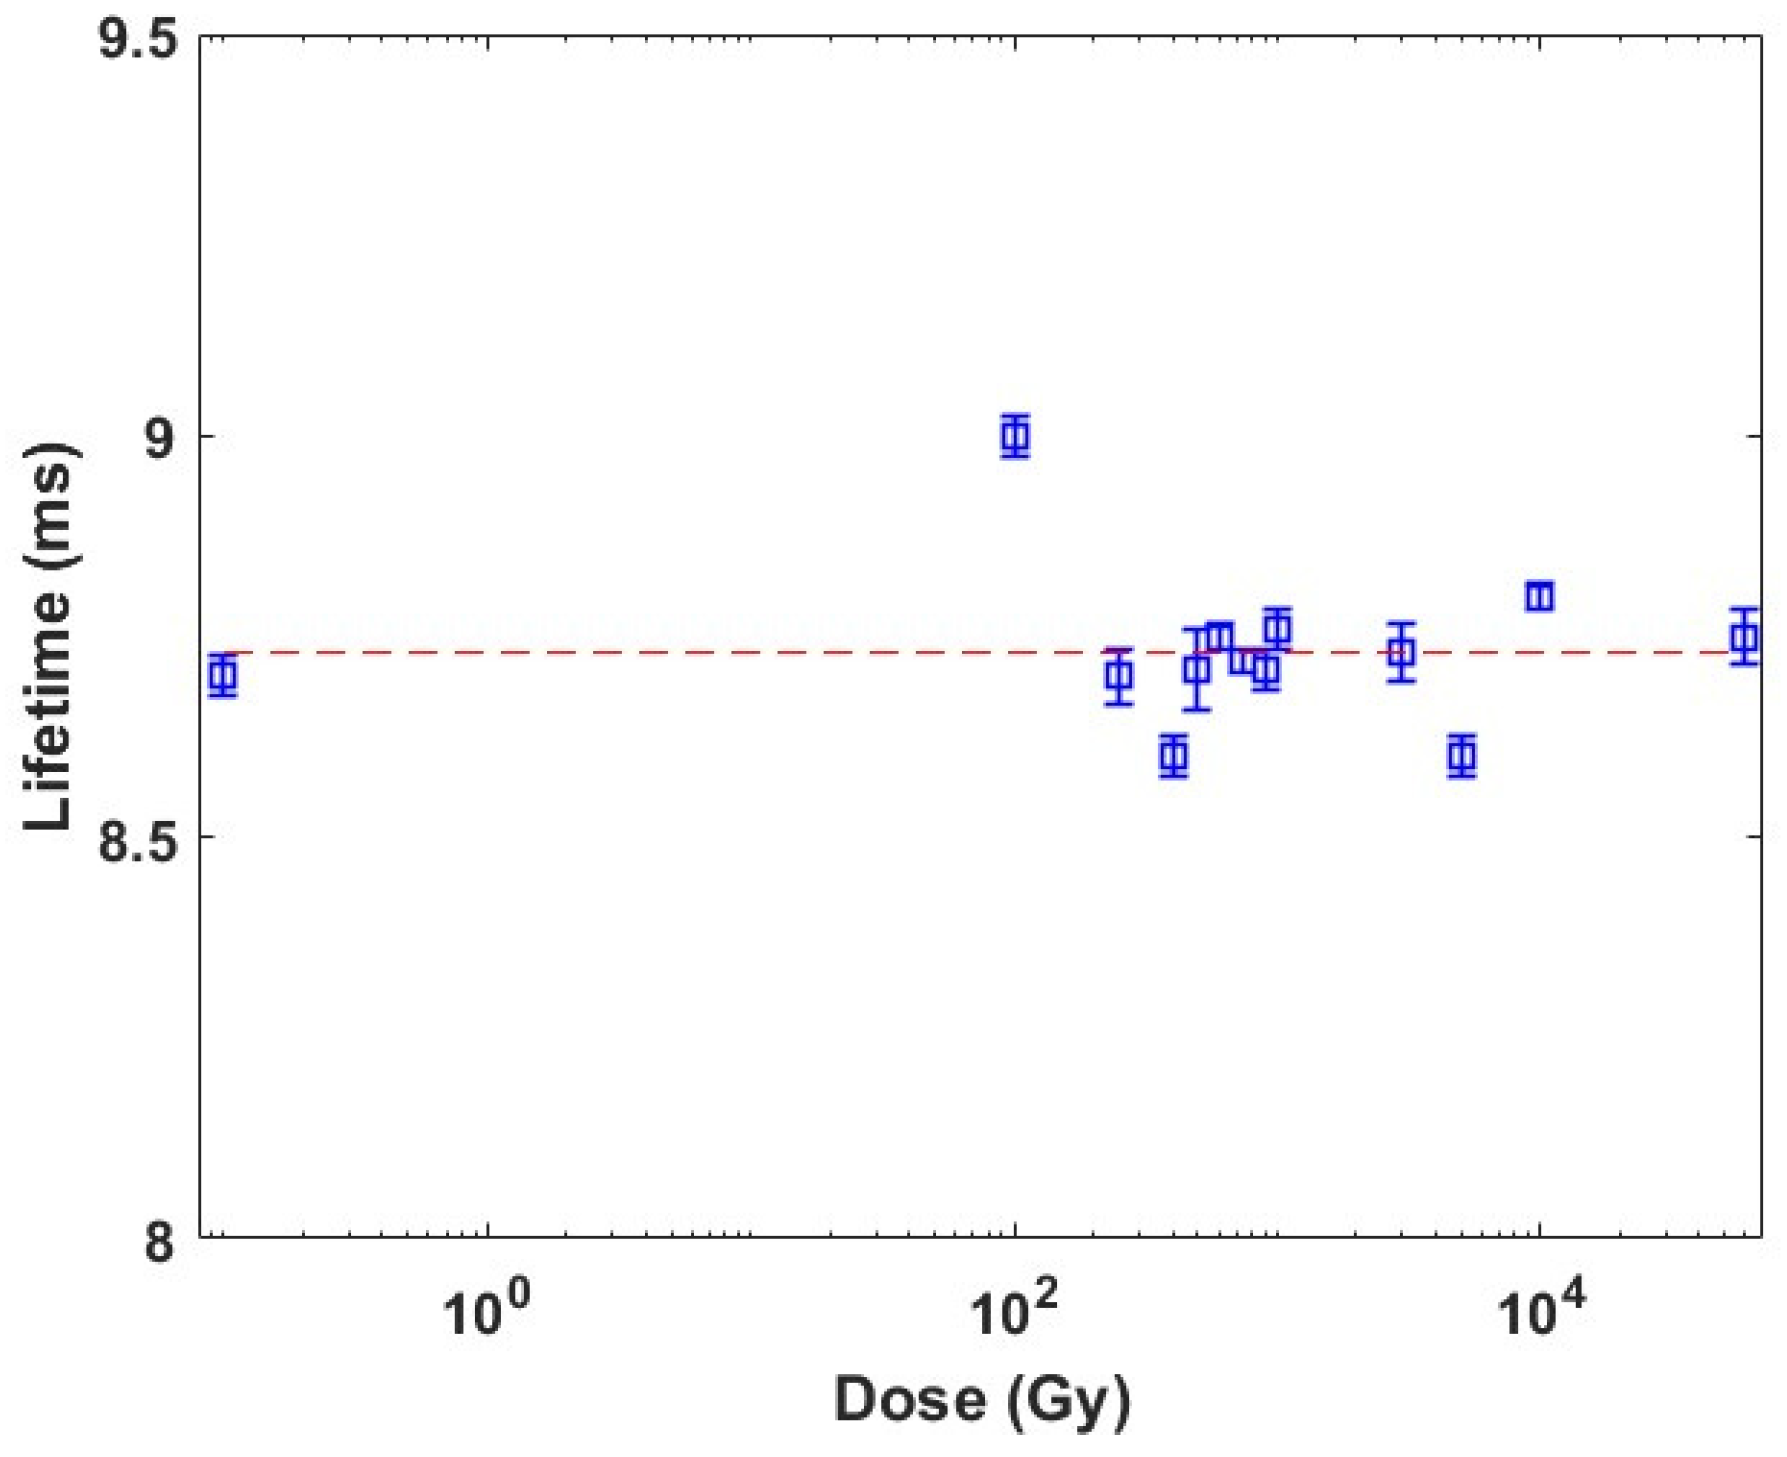
3.1. 4I13/2 Energy Level Lifetime

Using the TRL technique [29,40], it was possible to determine the evolution of the lifetime of the 4I13/2 energy level as a function of different accumulated doses on different various EDF samples. Figure 4 shows that the 4I13/2 energy level lifetime does not depend on the absorbed dose within ~3%.
The average measured lifetime, introduced in the simulation code, was 8.72 ms and it agrees with the result reported in [29] for an Er3+/Yb3+ co-doped fiber. This independence from the dose, at least up to 3 kGy, is associated with the presence of Ce3+ ions within the silica glass matrix. In general, the 4I13/2 energy level lifetime of Er3+ for Ce3+-undoped EDF should decrease with an increasing dose because of the changes in the host glass matrix environment induced by ionizing radiation [29]. The presence of Ce3+ ions makes the EDF more radiation-hardened, reducing the changes induced by the radiations on the environment of the silica matrix and then keeping the lifetime constant. A sort of compromise is found regarding the introduction of Ce3+ ions in the EDF: there is a robustness of the 4I13/2 lifetime with respect to ionizing radiation, at the expense of a small reduction in the lifetime, from 10 ms [31] for an aluminosilicate fiber without Ce3+ to 8.72 ms for our EDF.

3.2. Absorption and Emission Cross Sections

Figure 5a shows the absorption spectrum, obtained through the cutback technique [38,39], of two EDF samples, one pristine and the other pre-irradiated at 3 kGy (dose rate of 0.28 Gy/s, without injecting any signal into the fiber, therefore without considering the PB effect. It must be noted that there is only a slight increase in fiber losses, compared to the pristine losses, with an absorbed dose of 3 kGy.
Figure 5b shows the absorption and emission cross sections, both in pristine and irradiated samples, obtained using the mathematical formula presented in Section 2.3. The increase in fiber losses leads to an increase in the absorption and emission cross sections, of 0.5 × 10⁻²⁵ m2 at 1530 nm, at a TID of 3 kGy.
Through the simulation code, it has been obtained that the gain variation in an EDFA associated with these small changes in the absorption and emission cross sections is less than 1%. As a consequence, the radiation slightly affects the spectroscopic parameters, up to a TID of 3 kGy. The radiation-induced gain degradation must then be due mainly to the RIA phenomenon.
Therefore, in the code simulations, whose results will be reported in the next section, the cross sections were considered constant. The absorption and emission cross sections at 980 nm and 1550 nm values used in the simulations have been reported in Table 2.

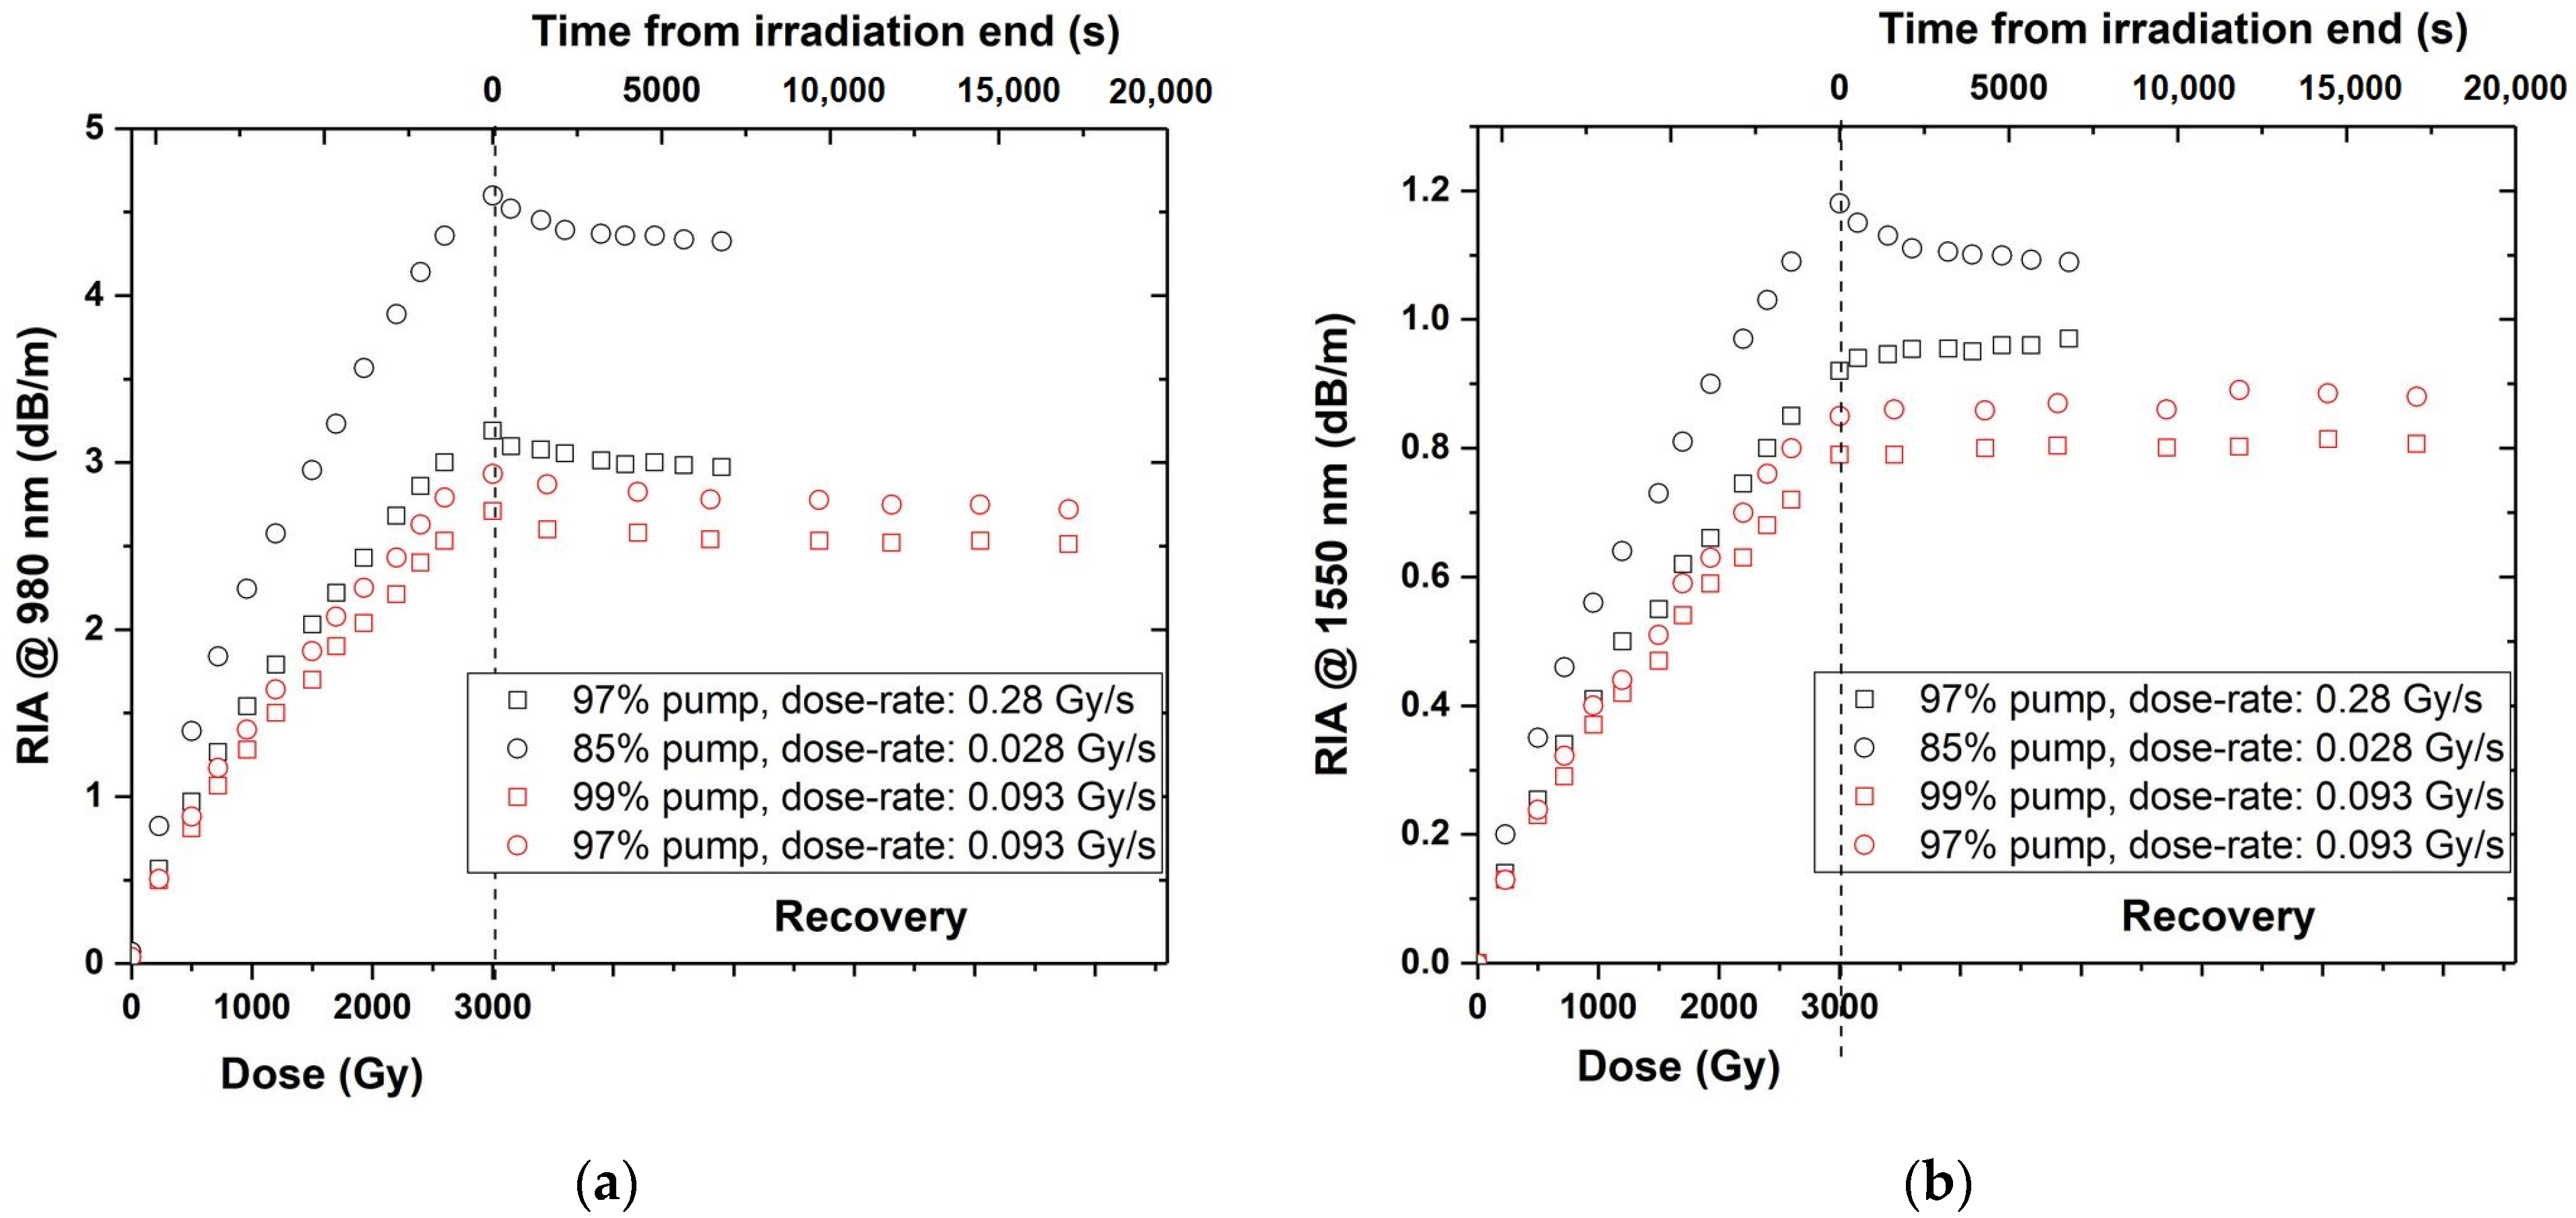
3.3. RIA Measurements Results

The main parameter that affects the gain under radiation is the RIA. But, because of the PB effect induced by the high pump power, the RIA must be measured in conditions as close as possible to the ones of an EDFA. The focal point of this work is to measure the RIA while injecting the pump with the highest percentage possible, in order not to overestimate the RIA level, and then to compare the measured behavior of EDFA under irradiation with the simulated one. The RIA was monitored up to a maximum dose of 3 kGy and during the post-irradiation recovery phase, which lasts 2 h for the dose rate of 0.28 Gy/s and 6 h for 0.093 Gy/s.
Figure 6 shows the spectral RIA obtained at the maximum dose for the four different irradiation conditions, whose specifications are listed in Table 4. The obtained RIAs agree with those reported in [25,28] and are mainly due to the tail of the Al-OHC point defects, whose absorption band is centered in the visible range around 540 nm, and to a not-yet-well-known defect absorbing in the IR [25]. Thus, whereas at 980 nm, the RIA is associated with the presence of the Al-OHCs, at 1550 nm, on the other hand, the RIA is linked to the unknown center. For both dose rates, it can be noted that the RIA is lower as the percentage of time the pump signal was injected into the EDF increases: the higher the percentage of time the pump signal was injected into the fiber, the greater the impact of the PB and the lower the RIA.
Furthermore, it can be observed that for the same pump percentage for both dose rates (97%), the RIA is lower for the lower dose rate, as already observed for this EDF but also for other fibers. This is due to the fact that with a lower dose rate the defects have more time to recombine during the irradiation run [41,42].
Figure 7a,b show the RIA as a function of the absorbed dose, at the pump and signal wavelengths, respectively.
The RIA values at 980 nm and 1550 nm, reported in Figure 7a,b, were averaged over a 4 nm wide range around the wavelength of interest, obtaining a relative error of the RIA less than 3%.
At both wavelengths, the RIA increases almost linearly with the dose, as expected for aluminosilicate matrix. As already observed in Figure 6, by increasing the pump percentage, and getting closer and closer to the EDFA real application case, the RIA amplitude is reduced. Moreover, a lower dose rate corresponds to a lower RIA. It is interesting to note that, in Figure 7a, during the recovery phase, the RIA at 980 nm decreases slightly, with a recovery rate of 10%, whereas the RIA at 1550nm (Figure 7b) shows a slight recovery only at the highest investigated dose rate and with the lower percentage of time using the pump. For the other irradiation runs (#2, #3 and #4), no recovery is observed at 1550 nm. This may be explained as follows: the not-well-known defect that characterizes the RIA at 1550 nm and that is generated under these irradiation conditions, is created at lower concentration but it appears also to be more stable.
It is worth noticing that he RIA values employed in the calculation code were measured on a 19 cm-long sample, while the optimal active fiber length for the EDFA is 4.3 m. The impact of PB varies as a function of the sample length, which means that it should not be uniform. However, the RIA measurement cannot be carried out on a sample of the same length as the fiber used for the gain degradation measurements, which is 4.3 m, as the losses of the pristine fiber result in being too high [28]. We can only make the hypothesis that the measured RIA is a good approximation of the real situation.

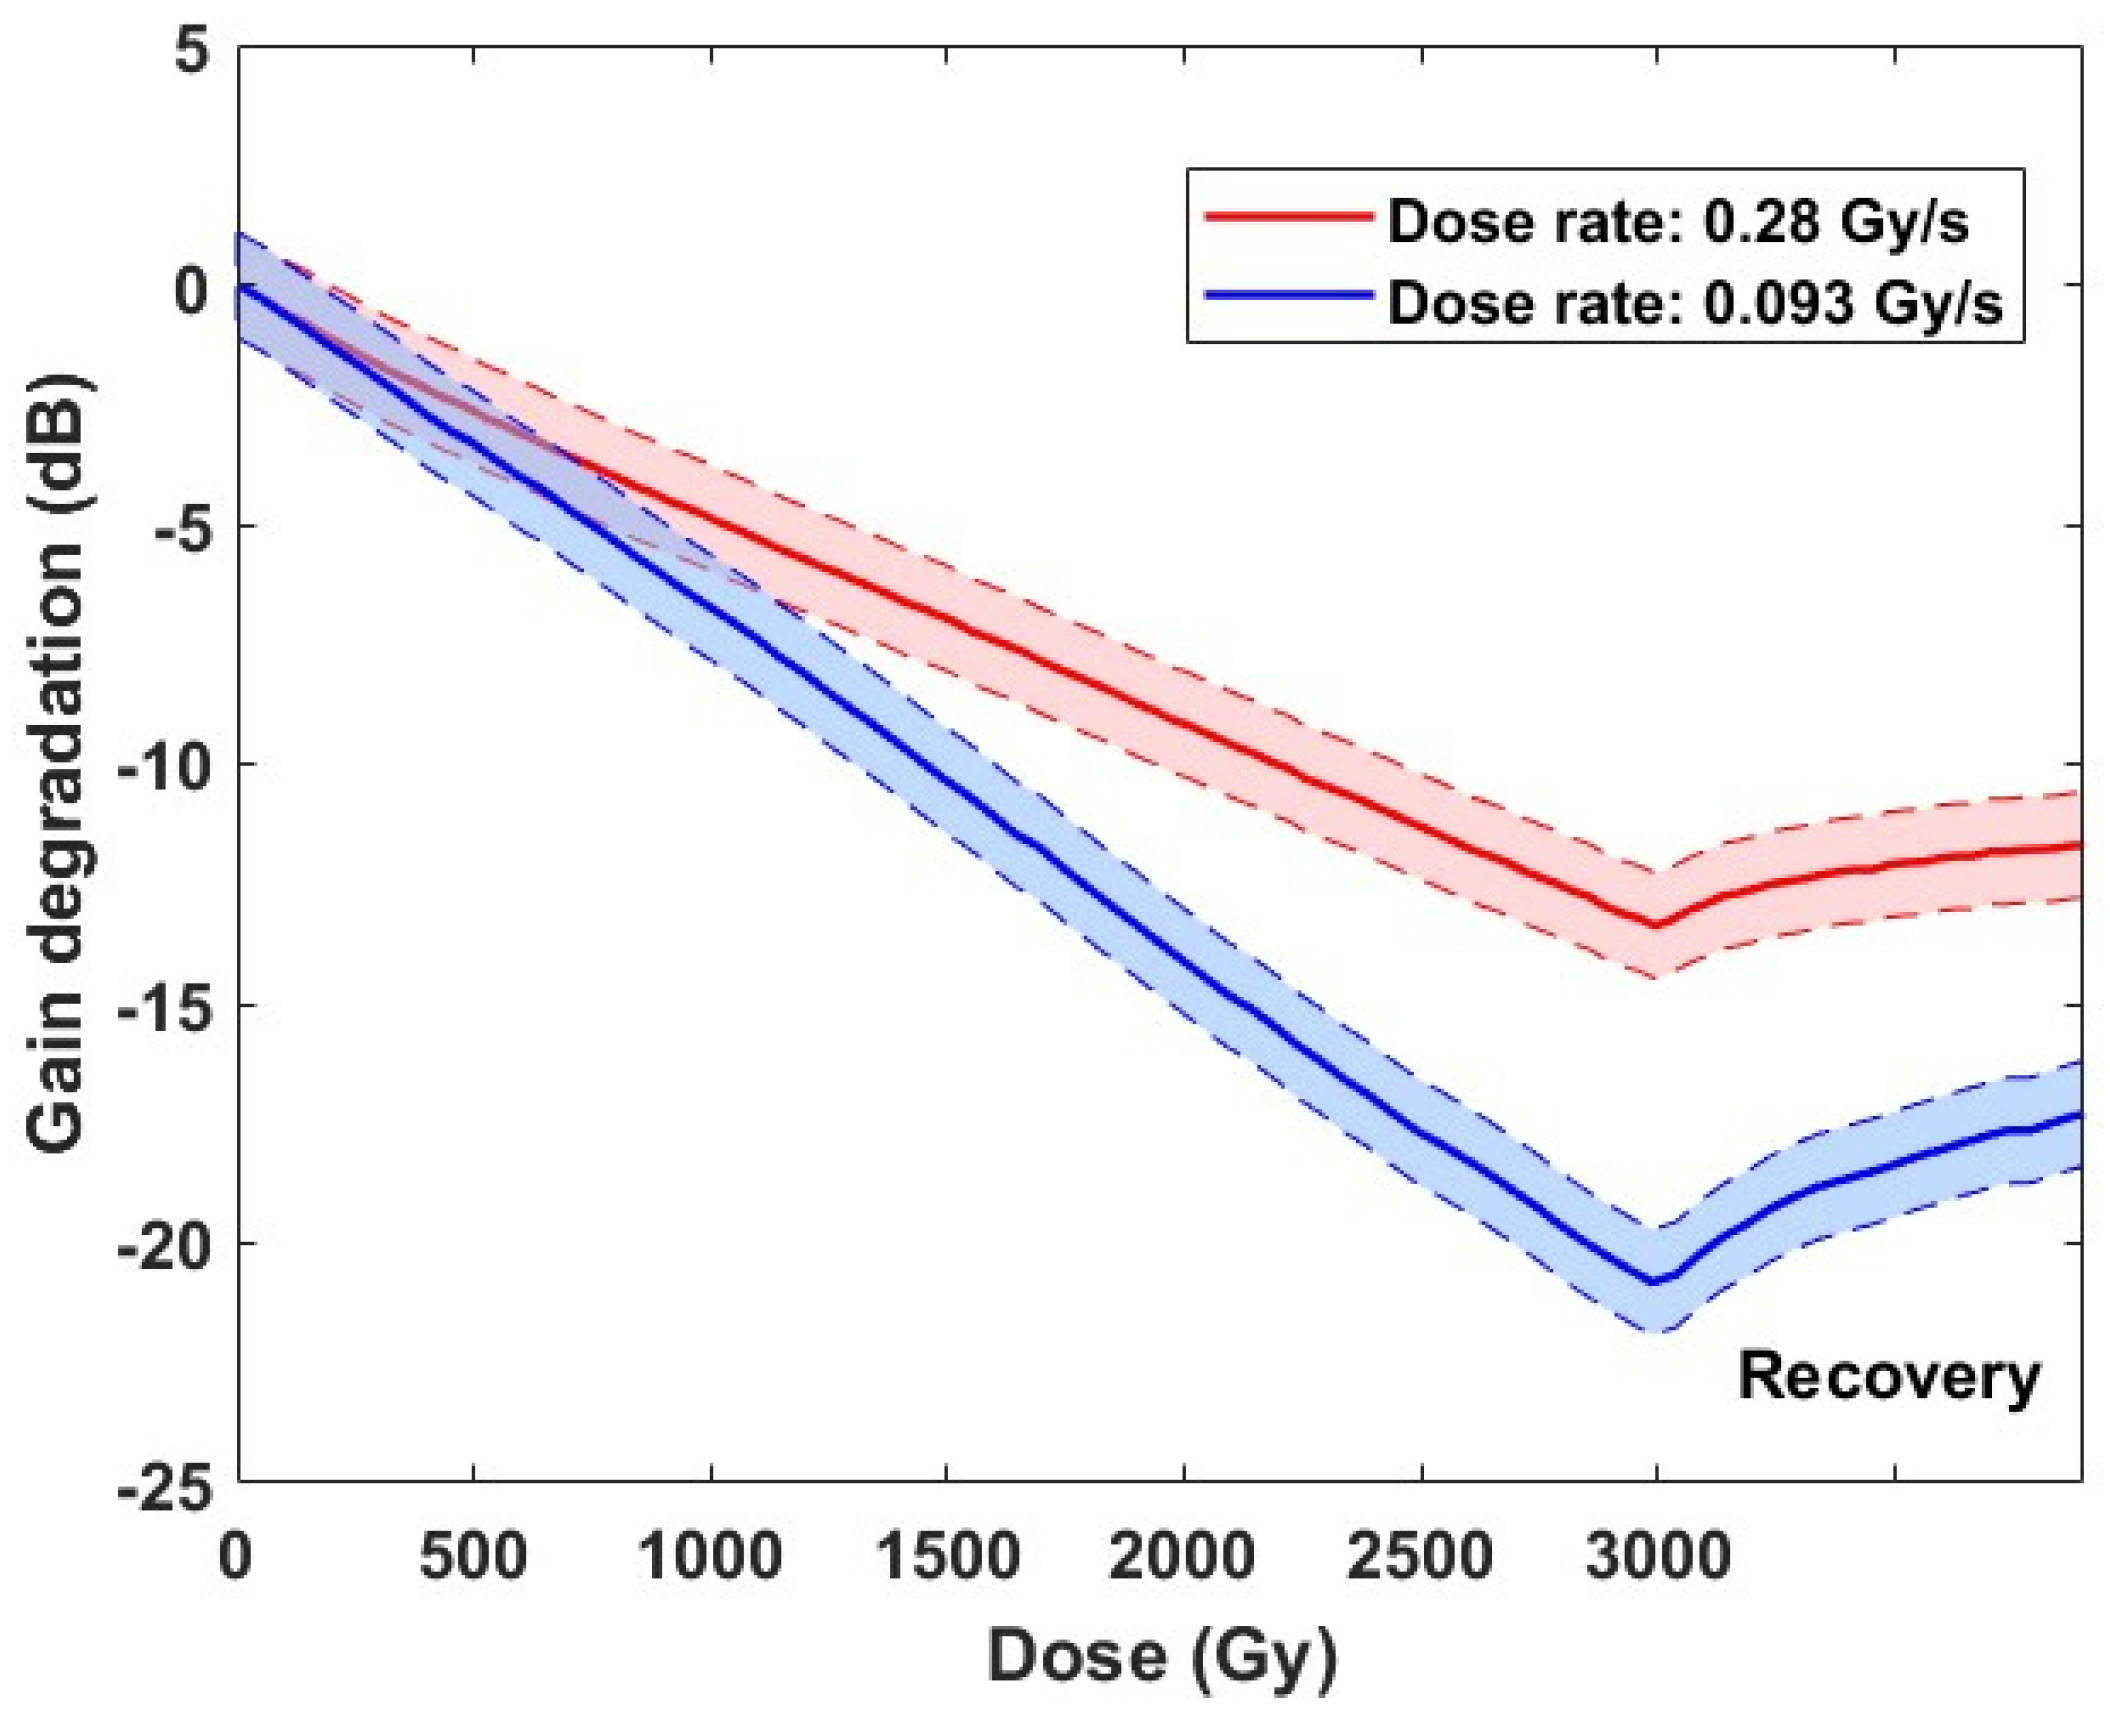
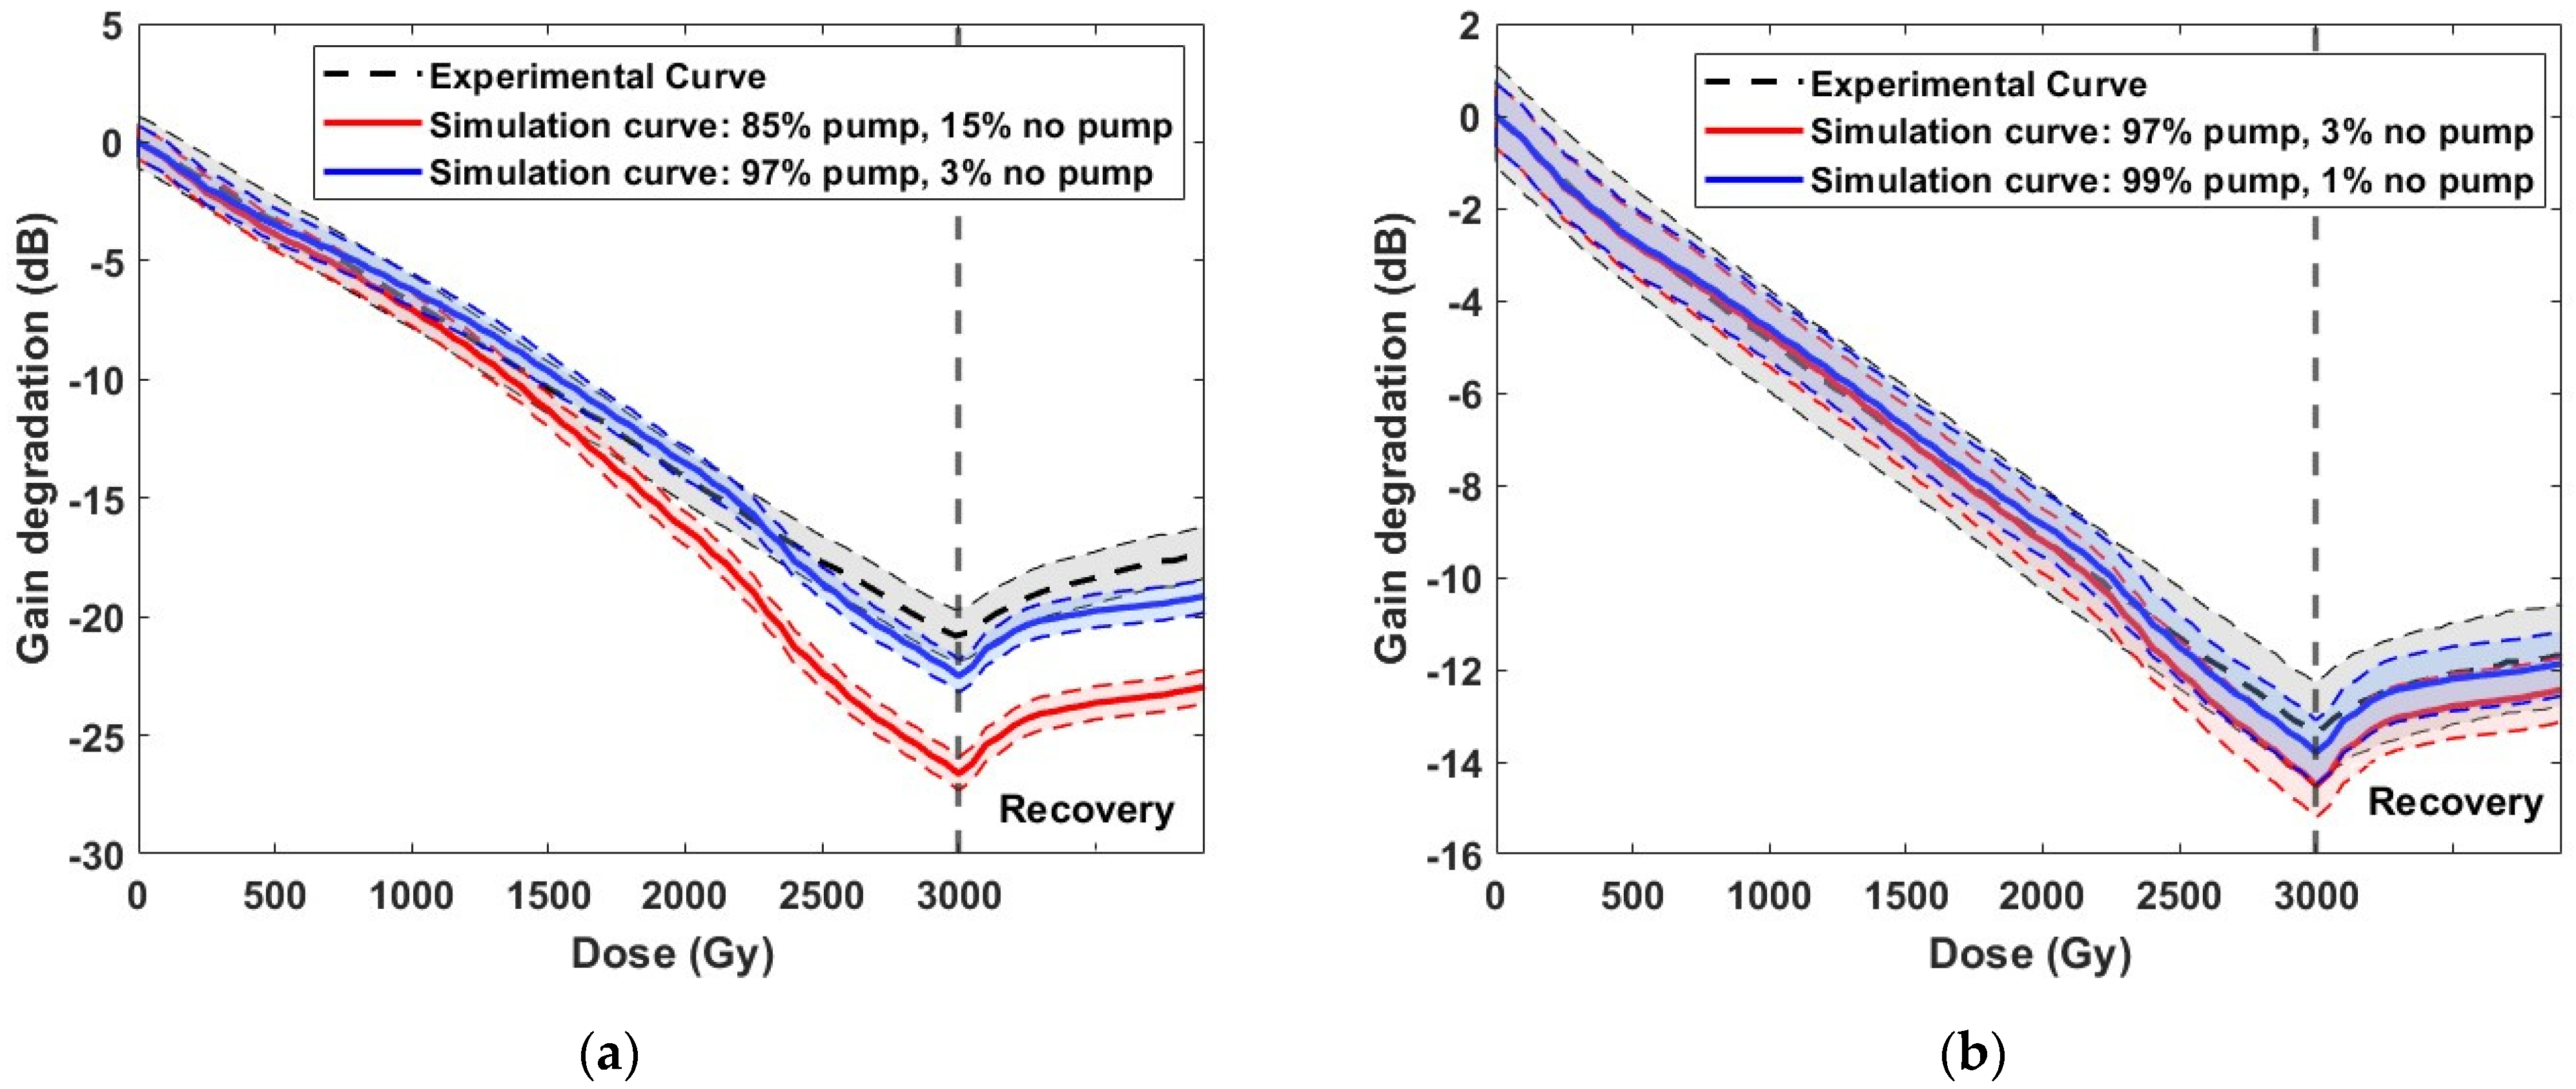
3.4. Gain Degradation Measurements Results

The gain degradation measurements were performed through the measurement setup introduced in Section 2.5 and are reported for the two dose rates in Figure 8.
First, a lower gain degradation was observed at a lower dose rate, in agreement with the lower measured RIA [41,42].
Furthermore, for both dose rates, the evolution of the gain degradation with dose has an almost linear trend, in line with the linear trend of the RIA at 980 nm and 1550 nm shown in Figure 7a,b. The error bars associated with the gain degradation in Figure 8 consider the error related to the peak and noise determination of the amplified and injected signals at 1550 nm, which is equal to ~3% of the gain.

4. Discussion

The simulation code, validated in [33,34,35,36], is able to predict the behavior of an EDFA under ionizing radiation, when introducing the measured RIA values into the simulation code itself. Then, the simulated estimate of the gain degradation can be compared with the measured ones, as presented in Figure 9a,b, for the dose rate 0.28 Gy/s and 0.093 Gy/s, respectively.
For the highest dose rate, in Figure 9a, it can be highlighted that the simulated curve that best adheres to the experimental one is the one that considers the RIA values obtained with the highest pump time percentage (97% of the time slot). Therefore, we can denote that the higher the pump time percentage is, the smaller the deviation between the simulated and experimental curves and the better the software prediction will be. We have a maximum error of 20% in the case of the 85% injected pump. In this case, the deviation between the experimental and simulated curves increases with the dose, since the RIA at both wavelengths of interest increases faster with the dose than in the 97% pump injection configuration in Figure 7.
In conclusion, a larger time percentage of the pump injection implies a smaller overestimation of the RIA and a result closer to the one occurring in the EDFA.
Figure 9b compares the experimental curve at a dose rate of 0.093 Gy/s and the simulated ones with a pump percentage of 97 and 99%. Both simulated curves agree with the measured one, within their error bars; however, by increasing the pump injection from 97 to 99%, the agreement slightly improves. In the closest possible situation to the real one, that of the blue curve in Figure 9b obtained by injecting the pump 99% of the time, the EDFA performance can be predicted with an error of less than 2%, since the overestimation of the RIA is strongly minimized. For the case of the red curve, with a pump injection of 97%, there is a maximum error of 5%, found at the maximum dose absorbed by the EDFA, which is 3 kGy. However, a pump percentage of 99% cannot be applied for each dose rate, because in cases of very high dose rates, in which the time slot is short, there might not be the possibility of recording a minimum number of acquisitions.
We probably have a pump signal that remains in the 4.3 m of fiber sufficient to have a positive effect of the PB linked to the pump on the RIA.

5. Conclusions

In this work, an analysis of the performance of an EDFA in a harsh environment, subjected to the presence of ionizing radiation, was carried out. From the literature [22,23,24,25], the modification and worsening of the behavior of optical amplifiers under the effect of radiation was known. Our first objective was to understand what were the factors impacting on the degradation of the performance of the amplifiers, including the spectroscopic parameters and the RIA, and quantify their impact on the amplifier gain. It was observed that, for the sample studied, the variation in the spectroscopic parameters has an impact of less than 1% on the gain of the EDFA, and therefore, it was concluded that the RIA is the main factor that degrades the EDFA gain.
The second goal was to compare the measured gain degradation, at two different dose rates, with the simulated one that considered the measured RIA, trying to obtain the best possible agreement between experiment and simulation.
Specifically, for the simulation of the gain degradation relating to an RIA measurement at a dose rate of 0.093 Gy/s and a pump injected for 99% of the time slot, an almost perfect agreement was obtained between the experimental and the simulated curves with a maximum error of 2%.
In conclusion, the software, combined with this RIA measurement setup, presented in Section 2.4, turns out to be a good solution for predicting the behavior of an optical amplifier subjected to the effect of ionizing radiation.

Author Contributions

Conceptualization, A.F., A.M., L.M., C.C., T.R., Y.O., A.B. and S.G.; methodology, A.F., A.M., C.C. and M.M.K.S.; software, A.F., A.M., L.M. and C.C.; formal analysis, A.F., A.M., L.M., C.C. and S.G.; data curation, A.F., A.M., C.C. and M.M.K.S.; resources, T.R.; writing—original draft preparation, A.F., A.M., L.M., Y.O. and S.G.; writing—review and editing, C.C.,T.R., E.M. and A.B. All authors have read and agreed to the published version of the manuscript.

Funding

This work has been funded by a public grant from the French National Research Agency (ANR) under the “France 2030” investment plan, which has the reference EUR MANUTECH SLEIGHT-ANR-17-EURE-0026.

Institutional Review Board Statement

Not applicable.

Informed Consent Statement

Not applicable.

Data Availability Statement

The data presented in this study are available on reasonable request from the corresponding author.

Conflicts of Interest

Thierry Robin was employed by the company Exail. The remaining authors declare that the research was conducted in the absence of any commercial or financial relationships that could be construed as a potential conflict of interest.

Abbreviations

The following abbreviations are used in this manuscript:
AlOHCAl-oxygen hole center
ASEAmplified spontaneous emission
EDFErbium-doped fiber
EDFAErbium-doped fiber amplifier
FUTFiber under test
PBPhotobleaching
PSOParticle swarm optimization
RERare earth
REDFRare-earth-doped fiber
REDFARare-earth-doped fiber amplifier
REDFSRare-earth-doped fiber source
RIARadiation-induced attenuation
RIERadiation-induced emission
RICRadiation-induced compaction
TIDTotal ionizing dose
TRLTime-resolved luminescence
WDMWavelength division multiplexing

References

  1. Giles, C.R.; Desurvire, E. Modeling erbium-doped fiber amplifiers. J. Light. Technol. 1991, 9, 271–283. [Google Scholar] [CrossRef]
  2. Delavaux, J.-M.P.; Nagel, J.A. Multi-stage erbium-doped fiber amplifier designs. J. Light. Technol. 1995, 13, 703–720. [Google Scholar] [CrossRef]
  3. Wright, M.W.; Valley, G.C. Yb-Doped Fiber Amplifier for Deep-Space Optical Communications. J. Light. Technol. 2005, 23, 1369–1374. [Google Scholar] [CrossRef]
  4. Lefevre, H.C. The Fiber-Optic Gyroscope, 2nd ed.; Artech House: Norwood, MA, USA, 2014. [Google Scholar]
  5. Falconi, M.C.; Laneve, D.; Portosi, V.; Taccheo, S.; Prudenzano, F. Design of a Multi-Wavelength Fiber Laser Based on Tm:Er:Yb:Ho Co-Doped Germanate Glass. J. Light. Technol. 2020, 38, 2406–2413. [Google Scholar] [CrossRef]
  6. Falconi, M.C.; Loconsole, A.M.; Prudenzano, F. Modeling of rare-earth-doped glass devices and optical parameter indirect evaluation. Opt. Mater. 2022, 132, 112835. [Google Scholar] [CrossRef]
  7. Liu, C.; Wu, X.; Zhu, J.; He, N.; Li, Z.; Zhang, G.; Zhang, L.; Ruan, S. Radiation-Resistant Er3+-Doped Superfluorescent Fiber Sources. Sensors 2018, 18, 2236. [Google Scholar] [CrossRef] [PubMed]
  8. Janvier, P.-O.; Matte-Breton, C.; Monga, K.J.-J.; Wang, L.; Rusch, L.; LaRochelle, S. Optimization criteria and design of few-mode Erbium-doped fibers for cladding-pumped amplifiers. Opt. Express 2023, 31, 14888–14902. [Google Scholar] [CrossRef] [PubMed]
  9. Girard, S.; Morana, A.; Ladaci, A.; Thierry, R.; Mescia, L.; Bonnefois, J.-J.; Boutillier, M.; Mekki, J.; Paveau, A.; Cadier, B.; et al. Recent advances in radiation hardened fiber-based technologies for space applications. J. Opt. 2018, 20, 093001. [Google Scholar] [CrossRef]
  10. Dakin, J.P.; Brown, R.G.W. Handbook of Optoelectronics: Applied Optical Electronics; CRC Press: Boca Raton, FL, USA, 2018; Volume 3, pp. 409–427. [Google Scholar]
  11. Barrera, D.; Madrigal, J.; Delepine-Lesoille, S.; Salvador, S. Multicore optical fiber shape sensors suitable for use under gamma radiation. Opt. Express 2019, 27, 29026–29033. [Google Scholar] [CrossRef]
  12. Cheymol, G.; Verneuil, A.; Grange, P.; Maskrot, H.; Destouches, C. High-Temperature Measurements with a Fabry–Perot Extensometer. IEEE Trans. Nucl. Sci. 2020, 67, 552–558. [Google Scholar] [CrossRef]
  13. Campanella, C.; Mescia, L.; Bia, P.; Chiapperino, M.; Girard, S.; Robin, T.; Mekki, J.; Boukenter, A.; Ouerdane, Y. Theoretical Investigation of Thermal Effects in High Power Er3+/Yb3+—Codoped Double-Clad Fiber Amplifiers for Space Applications. Phys. Status Solidi A 2019, 216, 1800582. [Google Scholar] [CrossRef]
  14. Yan, B.; Liu, H.; Liu, B.; Liu, J.; Zhang, H.; Yang, C.; Hu, Z.; Li, X. EDFA Anti-Irradiation Schemes for Inter-Satellite Optical DPSK Communication Systems. IEEE Photonics J. 2019, 11, 4900711. [Google Scholar] [CrossRef]
  15. Jiao, Y.; Guo, M.T.; Wang, R.L.; Shao, C.Y.; Hu, L.L. Influence of Al/Er ratio on the optical properties and structures of Er3+/Al3+ co-doped silica glasses. J. Appl. Phys. 2021, 129, 053104. [Google Scholar] [CrossRef]
  16. Ainslie, B.J. A review of the fabrication and properties of erbium-doped fibers for optical amplifiers. J. Light. Technol. 1991, 9, 220–227. [Google Scholar] [CrossRef]
  17. Shikama, T.; Kakuta, T.; Shamoto, N.; Narui, M.; Sagawa, T. Behavior of developed radiation-resistant silica-core optical fibers under fission reactor irradiation. Fusion Eng. Des. 2000, 51–52, 179–183. [Google Scholar] [CrossRef]
  18. Wijnands, T.; Aikawa, K.; Kuhnhenn, J.; Ricci, D.; Weinand, U. Radiation Tolerant Optical Fibers: From Sample Testing to Large Series Production. J. Light. Technol. 2011, 29, 3393–3400. [Google Scholar] [CrossRef]
  19. Gencheng, W.; She, S.; Zhang, Y.; Wang, Y.; Li, M.; Ma, Z.; Zhang, Y.; Gao, S.; Cui, X.; Li, Z.; et al. Hydrogen-Related Anti-Radiation Effect and Its Suppression Mechanism in Er3+/Al3+/Ge4+ Co-Doped Silica Fibers. J. Light. Technol. 2023, 41, 6073–6080. [Google Scholar] [CrossRef]
  20. Jiao, Y.; Yang, Q.; Zhu, Y.; Wang, F.; Zhang, L.; Meng, M.; Wang, S.; Shao, C.; Yu, C.; Hu, L. Improved radiation resistance of an Er-doped silica fiber by a preform pretreatment method. Opt. Express 2022, 30, 6236–6247. [Google Scholar] [CrossRef]
  21. Zhu, Y.; Shao, C.; Wang, F.; Wang, M.; Zhang, L.; Dai, Y.; Yu, C.; Hu, L. Improved Radiation Resistance of Er-Yb Co-Doped Silica Fiber by Pretreating Fibers. Photonics 2023, 10, 414. [Google Scholar] [CrossRef]
  22. Vivona, M.; Girard, S.; Marcandella, C.; Robin, T.; Cadier, B.; Cannas, M.; Boukenter, A.; Ouerdane, Y. Influence of Ce codoping and H2 pre-loading on Er/Yb-doped fiber: Radiation response characterized by Confocal Micro-Luminescence. J. Non-Cryst. Solid 2010, 357, 1963–1965. [Google Scholar] [CrossRef]
  23. Vivona, M.; Girard, S.; Robin, T.; Cadier, B.; Vacarro, L.; Cannas, M.; Boukenter, A.; Ouerdane, Y. Influence of Ce3+ Codoping on the Photoluminescence Excitation Channels of Phosphosilicate Yb/Er-Doped Glasses. IEEE Photonics Technol. Lett. 2012, 24, 509–511. [Google Scholar] [CrossRef]
  24. Girard, S.; Alessi, A.; Richard, N.; Martin-Samos, L.; De Michele, V.; Giacomazzi, L.; Agnello, S.; Di Francesca, D.; Morana, A.; Winkler, B.; et al. Overview of radiation induced point defects in silica-based optical fibers. Rev. Phys. 2019, 4, 100032. [Google Scholar] [CrossRef]
  25. Campanella, C.; De Michele, V.; Morana, A.; Guttilla, A.; Mady, F.; Benabdesselam, M.; Marin, E.; Boukenter, A.; Ouerdane, Y.; Girard, S. Temperature Dependence of Radiation Induced Attenuation of Aluminosilicate Optical Fiber. IEEE Trans. Nucl. Sci. 2022, 69, 1515–1520. [Google Scholar] [CrossRef]
  26. Zotov, K.V.; Likhachev, M.E.; Tomashuk, A.L.; Kosolapov, A.F.; Bubnov, M.M.; Yashkov, M.V.; Guryanov, A.N.; Dianov, E.M. Radiation Resistant Er-Doped Fibers: Optimization of Pump Wavelength. IEEE Photonics Technol. Lett. 2008, 20, 1476–1478. [Google Scholar] [CrossRef]
  27. Kenworthy, A.K. Photobleaching FRET microscopy. In Molecular Imaging; American Physiological Society: Rockville, MD, USA, 2005; pp. 146–164. [Google Scholar] [CrossRef]
  28. Aubry, M.; Mescia, L.; Morana, A.; Robin, T.; Arnaud, L.; Mekki, J.; Marin, E.; Ouerdane, Y.; Girard, S.; Boukenter, A. Temperature Influence on the Radiation Responses of Erbium-Doped Fiber Amplifiers. Phys. Status Solidi (A) 2021, 218, 2100002. [Google Scholar] [CrossRef]
  29. Ladaci, A.; Girard, S.; Mescia, L.; Robin, T.; Laurent, A.; Cadier, B.; Boutillier, M.; Morana, A.; Di Francesca, D.; Ouerdane, Y.; et al. X-rays, γ-rays, electrons and protons radiation-induced changes on the lifetimes of Er3+ and Yb3+ ions in silica-based optical fibers. J. Lumin. 2017, 195, 402–407. [Google Scholar] [CrossRef]
  30. Miniscalco, W.J. Erbium doped glasses for fiber amplifiers at 1550 nm. J. Light. Technol. 1991, 9, 234. [Google Scholar] [CrossRef]
  31. Pukhkaya, V.; Goldner, P.; Ferrier, A.; Ollier, N. Impact of rare earth element clusters on the excited state lifetime evolution under irradiation in oxide glasses. Opt. Express 2015, 23, 3270–3281. [Google Scholar] [CrossRef]
  32. Ollie, R.N.; Doualan, J.-L.; Pukhkaya, V.; Charpentier, T.; Moncorgé, R.; Sabyasachi, S. Evolution of Yb3+ environment and luminescence properties under ionizing irradiation in aluminoborosilicate glasses. J. Non-Cryst. Solids 2011, 357, 1037–1043. [Google Scholar] [CrossRef]
  33. Mescia, L.; Girard, S.; Bia, P.; Robin, T.; Laurent, A.; Prudenzano, F.; Boukenter, A.; Ouerdane, Y. Optimization of the Design of High Power Er3+/Yb3+-Codoped Fiber Amplifiers for Space Missions by Means of Particle Swarm Approach. IEEE J. Sel. Top. Quantum Electron. 2014, 20, 100108. [Google Scholar] [CrossRef]
  34. Giaquinto, A.; Mescia, L.; Fornarelli, G.; Prudenzano, F. Particle swarm optimization-based approach for accurate evaluation of upconversion parameters in Er3+-doped fibers. Opt. Lett. 2011, 36, 142–144. [Google Scholar] [CrossRef] [PubMed]
  35. Ladaci, A.; Girard, S.; Mescia, L.; Robin, T.; Laurent, A.; Cadier, B.; Boutillier, M.; Ouerdane, Y.; Boukenter, A. Optimized radiation-hardened erbium doped fiber amplifiers for long space missions. J. Appl. Phys. 2017, 121, 163104. [Google Scholar] [CrossRef]
  36. Mescia, L.; Bia, P.; Girard, S.; Ladaci, A.; Chiapperino, M.; Thierry, R.; Laurent, A.; Cadier, B.; Boutillier, M.; Ouerdane, Y.; et al. Temperature-Dependent Modeling of Cladding-Pumped Er3+/Yb3+—Codoped Fiber Amplifiers for Space Applications. J. Light. Technol. 2018, 36, 3594–3602. [Google Scholar] [CrossRef]
  37. Tao, M.; Chen, H.; Feng, G.; Luan, K.; Wang, F.; Huang, K.; Xisheng, Y. Thermal modeling of high-power Yb-doped fiber lasers with irradiated active fibers. Opt. Express 2020, 28, 10104–10123. [Google Scholar] [CrossRef]
  38. Ladaci, A.; Girard, S.; Mescia, L.; Robin, T.; Cadier, B.; Laurent, A.; Boutillier, M.; Sane, B.; Marin, E.; Ouerdane, Y.; et al. Validity of the McCumber Theory at High Temperatures in Erbium and Ytterbium-Doped Aluminosilicate Fibers. IEEE J. Quantum Electron. 2018, 54, 7000207. [Google Scholar] [CrossRef]
  39. Roderick, L.J. Spectroscopy of Rare Earth Doped Glasses. Ph.D. Thesis, Faculty of Science, University of Southampton, Southampton, UK, 1992; p. 218. [Google Scholar]
  40. Kitazawa, M. POF Data Book; MRC Techno Research Inc.: Tokyo, Japan, 1993; p. 37. [Google Scholar]
  41. Rose, T.; Gunn, D.; Valley, G. Gamma and proton radiation effects in erbium-doped fiber amplifiers: Active and passive measurements. J. Light. Technol. 2001, 19, 1918–1923. [Google Scholar] [CrossRef]
  42. Zotov, K.V.; Likhachev, M.E.; Tomashuk, A.L.; Bubnov, M.M.; Yashkov, M.V.; Guryanov, A.N.; Klyamkin, S.N. Radiation-Resistant Erbium-Doped Fiber for Spacecraft Applications. IEEE Trans. Nucl. Sci. 2008, 55, 2213–2215. [Google Scholar] [CrossRef]
Figure 1. Schematic of the erbium energy levels system used in the model, adapted from [35]. The green arrows correspond to the energetic transitions involving 4I15/2, 4I13/2 and 4I9/2 energy levels. The dotted arrows indicate non-radiative decays, and the dashed arrows correspond to the ion–ion energy transfer mechanisms.
Applsci 13 11589 g001
Figure 2. Experimental setup of the RIA measurement used in this work.
Applsci 13 11589 g002
Figure 3. Experimental setup of the gain degradation measurement used in this work.
Applsci 13 11589 g003
Figure 4. 4I13/2 energy level lifetime as a function of the dose.
Applsci 13 11589 g004
Figure 5. (a) Spectral attenuation and (b) Er3+ absorption and emission cross sections of two samples: one pristine (red curves) and one irradiated at 3 kGy (blue curves).
Applsci 13 11589 g005
Figure 6. Spectral RIA obtained at 3 kGy TID for the four different case studies.
Applsci 13 11589 g006
Figure 7. Dose dependence of the (a) 980 nm RIA (b) 1550 nm RIA for various 980 nm pumping conditions.
Applsci 13 11589 g007
Figure 8. Gain degradation as a function of the dose, for two dose rates: 0.28 Gy/s (blue dots) and 0.0093 Gy/s (red dots), at 25 °C.
Applsci 13 11589 g008
Figure 9. Evolution of measured–simulated gain degradation as the dose varies, for two dose rates: (a) 0.28 Gy/s; (b) 0.093 Gy/s.
Applsci 13 11589 g009
Table 1. Optical fiber parameters.
Core/Cladding
Diameter
Erbium Ions
Concentration
Losses
@1530 nm
Losses
@980 nm
Background
Losses
Core
Dopants
2.8 µm/127 µm1.21 × 1019 ions/cm324 dB/m14 dB/m6.2 dB/kmAl-Er-Ce
Table 2. EDFA parameters.
Fiber LengthSignal–Pump ConfigurationSignal Power
at 1550 nm
Pump Power
at 980 nm
4.3 mCo-propagating1 µW50 mW
Table 3. List of spectroscopic parameters and their corresponding values used in the simulation code. □ refers to the parameters measured experimentally.
Spectroscopic ParameterValue
4I13/2 Lifetime τ218.72 ms (□)
4I11/2 Lifetime τ3210 µs [23]
4I9/2 Lifetime τ430.1 µs [23]
σ12 Er3+ @1530 nm8.8 × 10−25 m2 (□)
σ21 Er3+ @1530 nm9.3 × 10−25 m2 (□)
σ13 Er3+ @980 nm6 × 10−25 m2 (□)
σ31 Er3+ @980 nm0.007 × 10−25 m2 (□)
Cup4 × 10−24 m3/s [23]
C31.09 × 10−24 m3/s [23]
C146.4 × 10−23 m3/s [23]
Table 4. Specifications of the RIA measurements performed.
RIA
Measurement
Dose RatePercentage of Pump TimePercentage of No Pump Time
#10.28 Gy/s (SiO2)85%15%
#20.28 Gy/s (SiO2)97%3%
#30.093 Gy/s (SiO2)97%3%
#40.093 Gy/s (SiO2)99%1%
Disclaimer/Publisher’s Note: The statements, opinions and data contained in all publications are solely those of the individual author(s) and contributor(s) and not of MDPI and/or the editor(s). MDPI and/or the editor(s) disclaim responsibility for any injury to people or property resulting from any ideas, methods, instructions or products referred to in the content.

