Effects of Micro-Scale Environmental Factors on the Quantity of Questing Black-Legged Ticks in Suburban New York


Abstract
:1. Introduction
2. Materials and Methods
3. Results
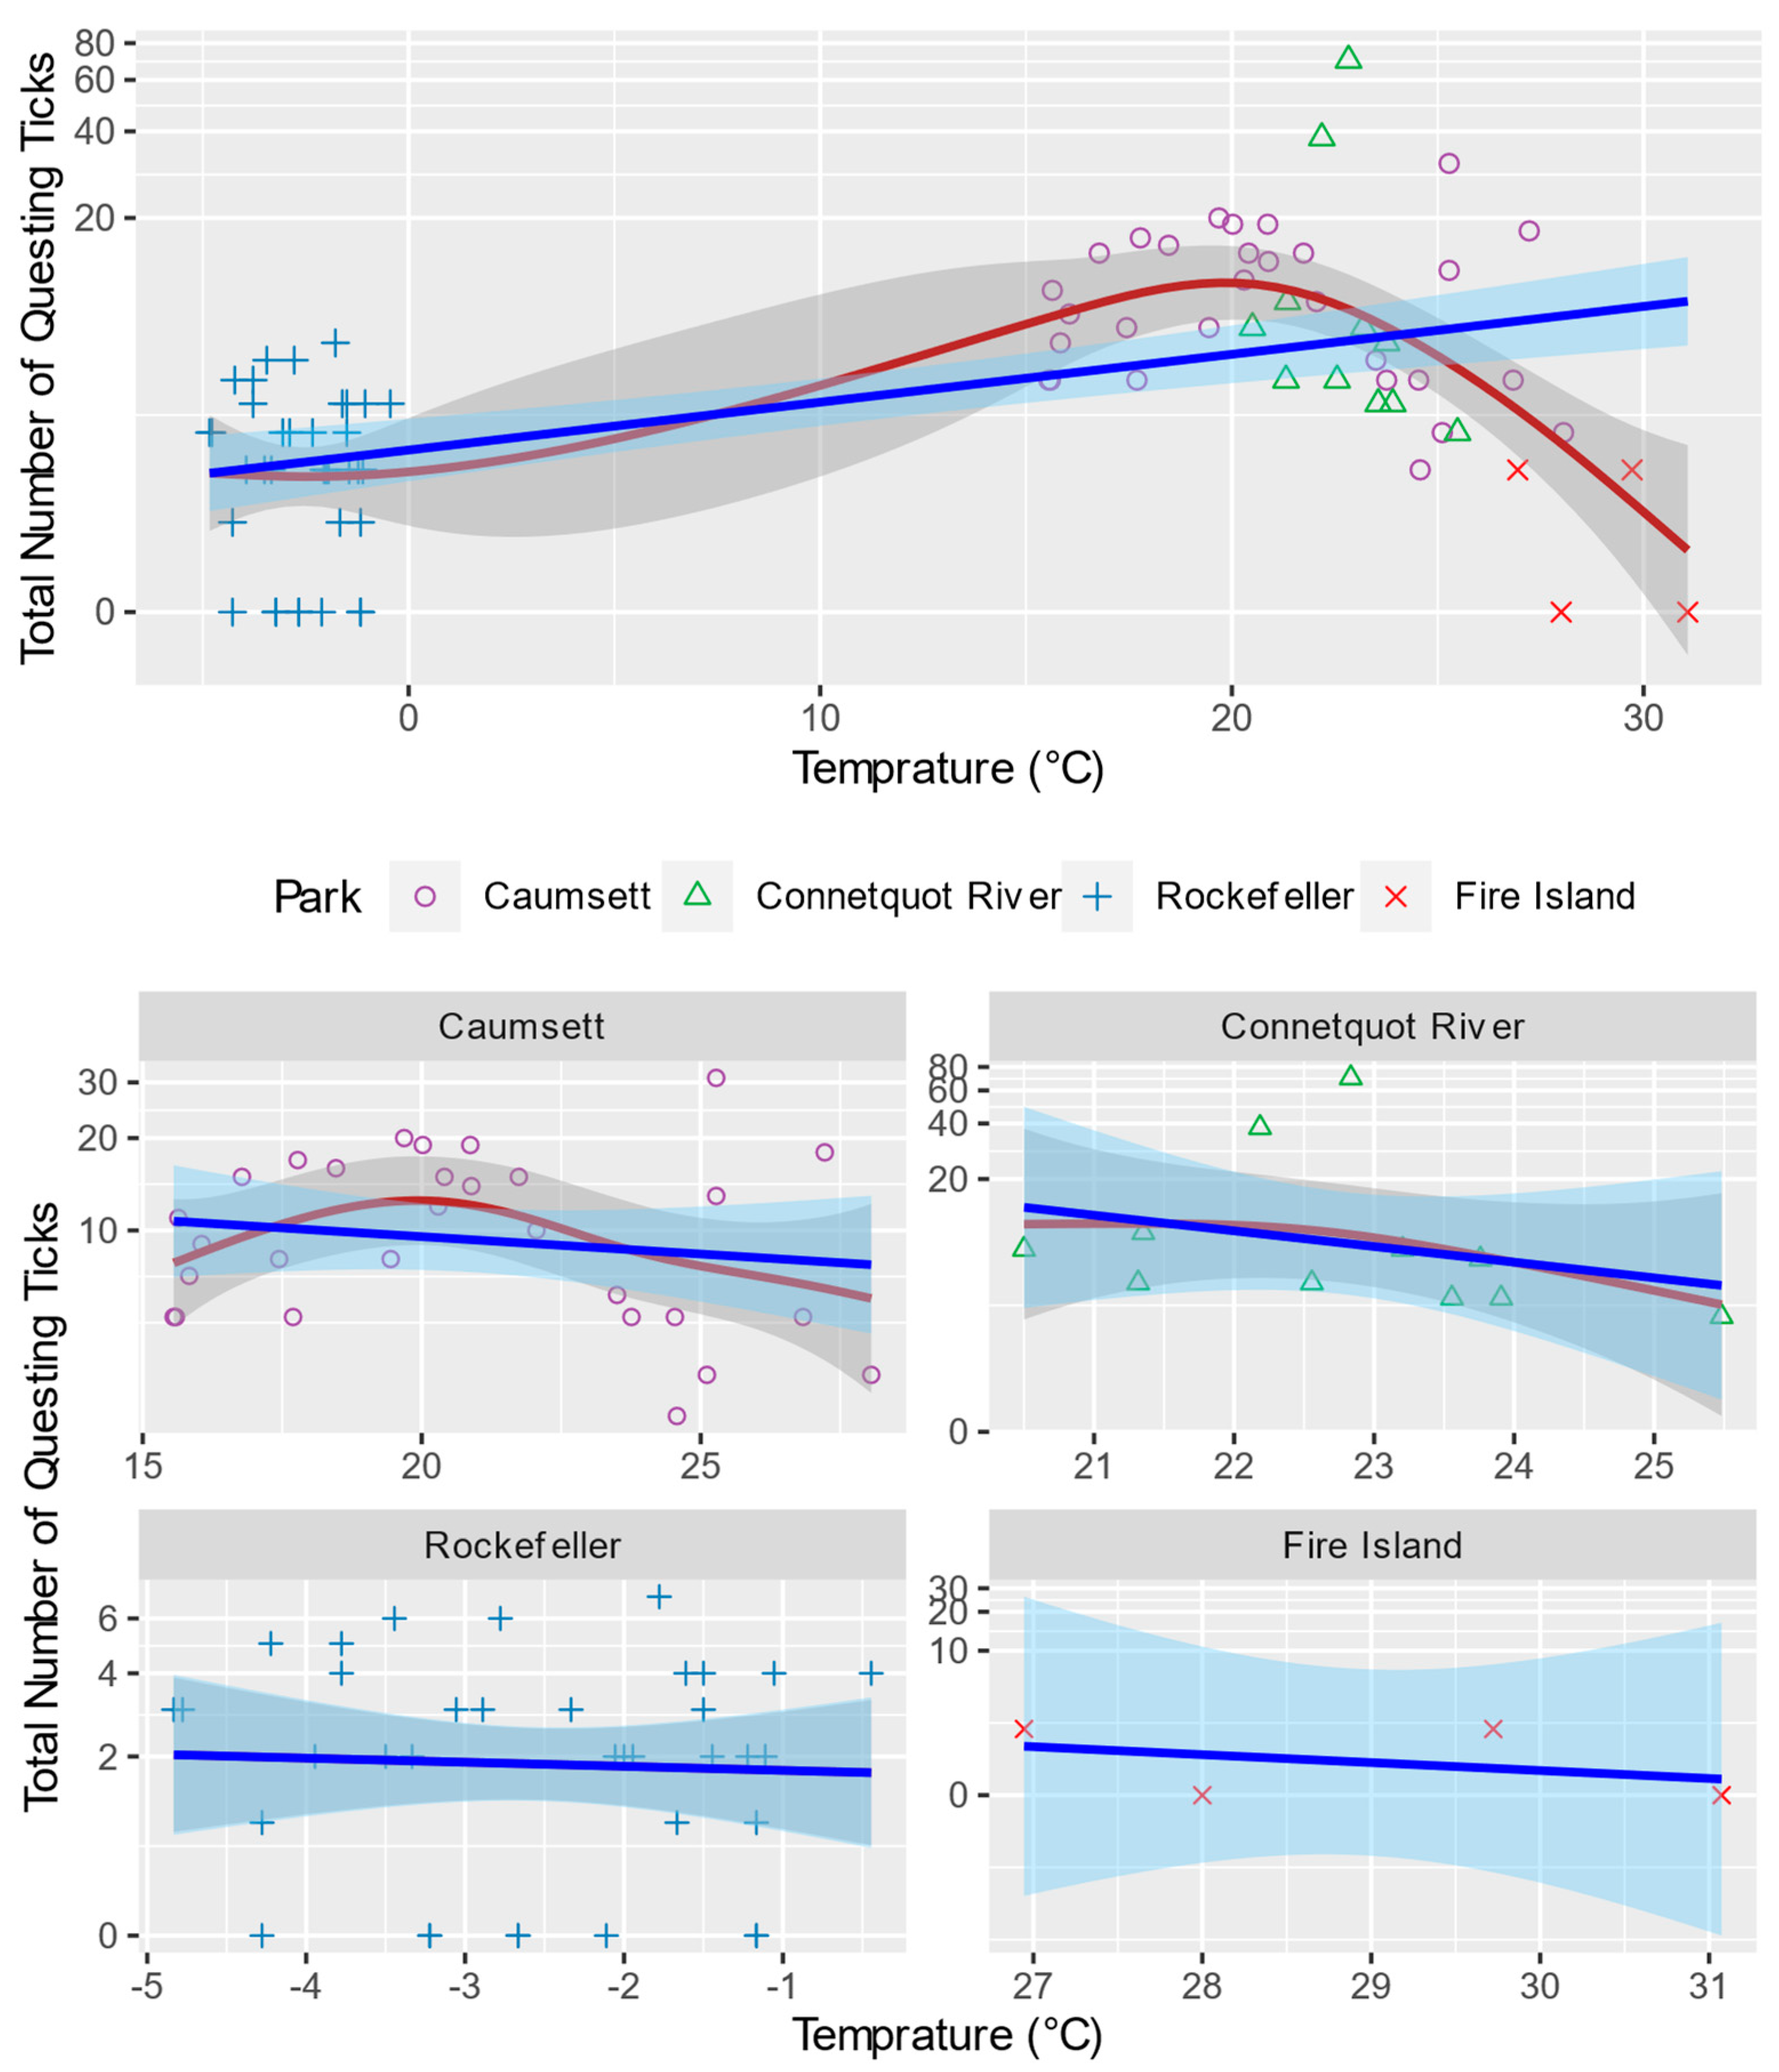
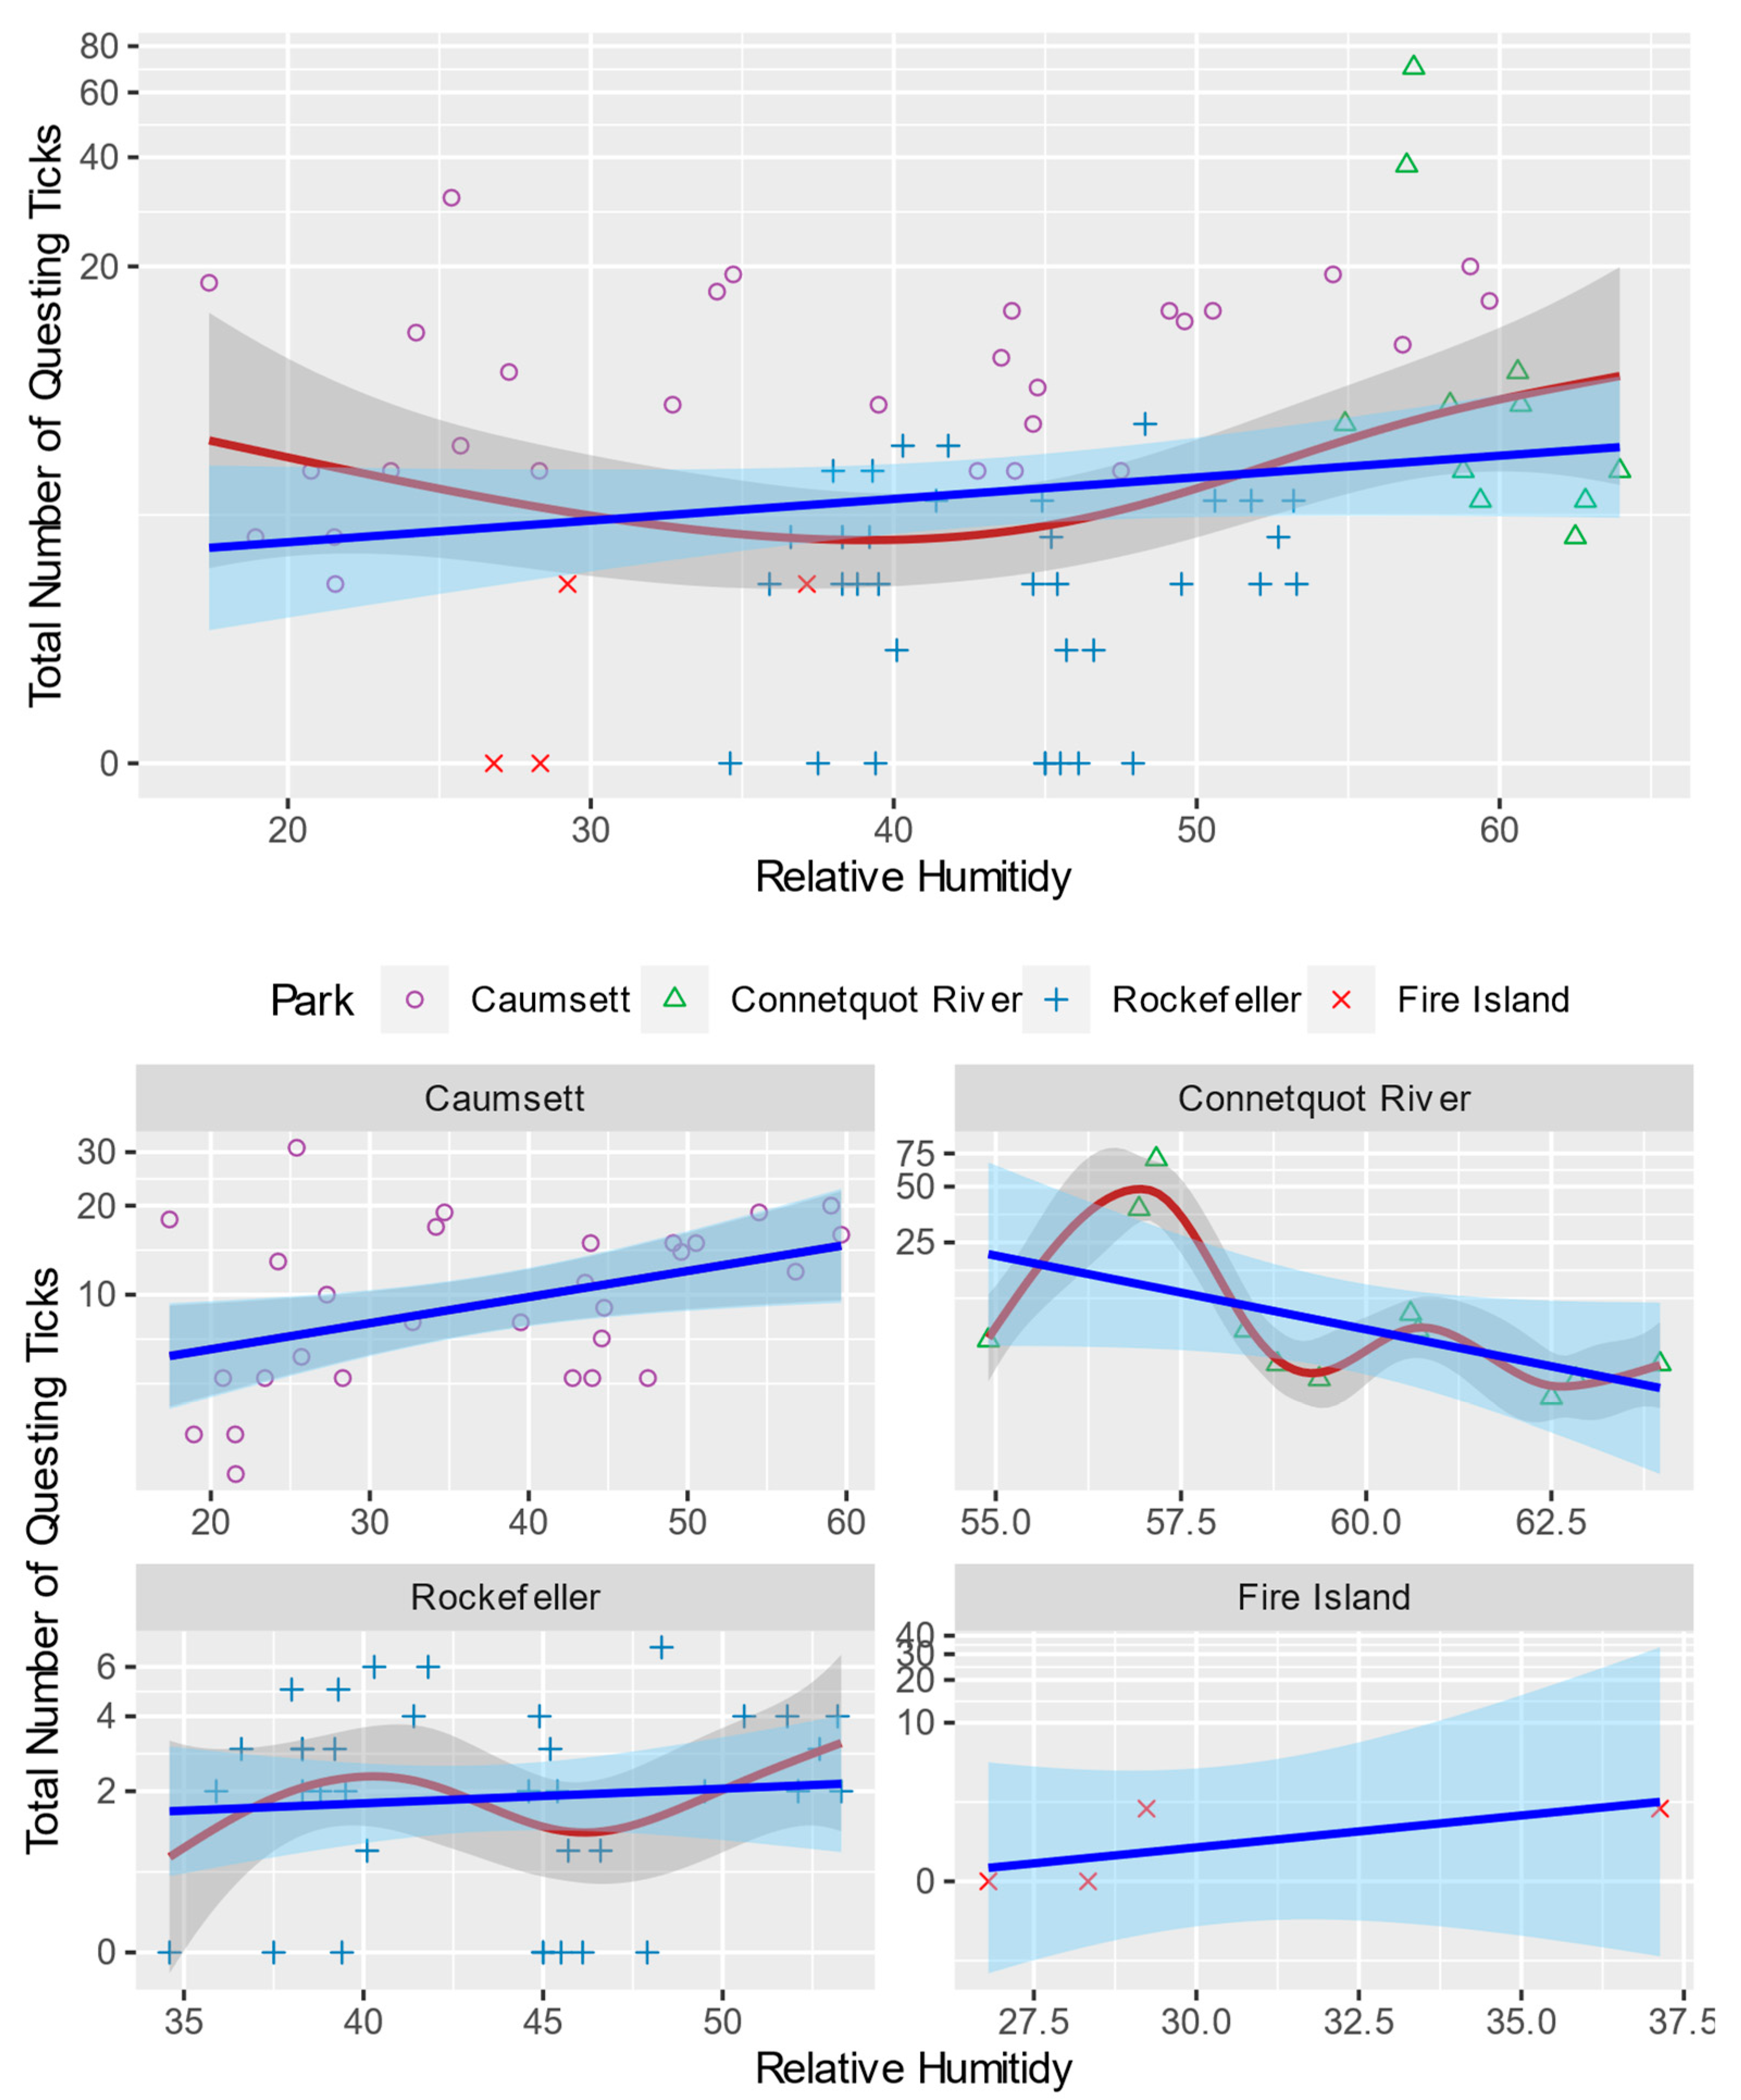
3.1. General Pattern and Correlation
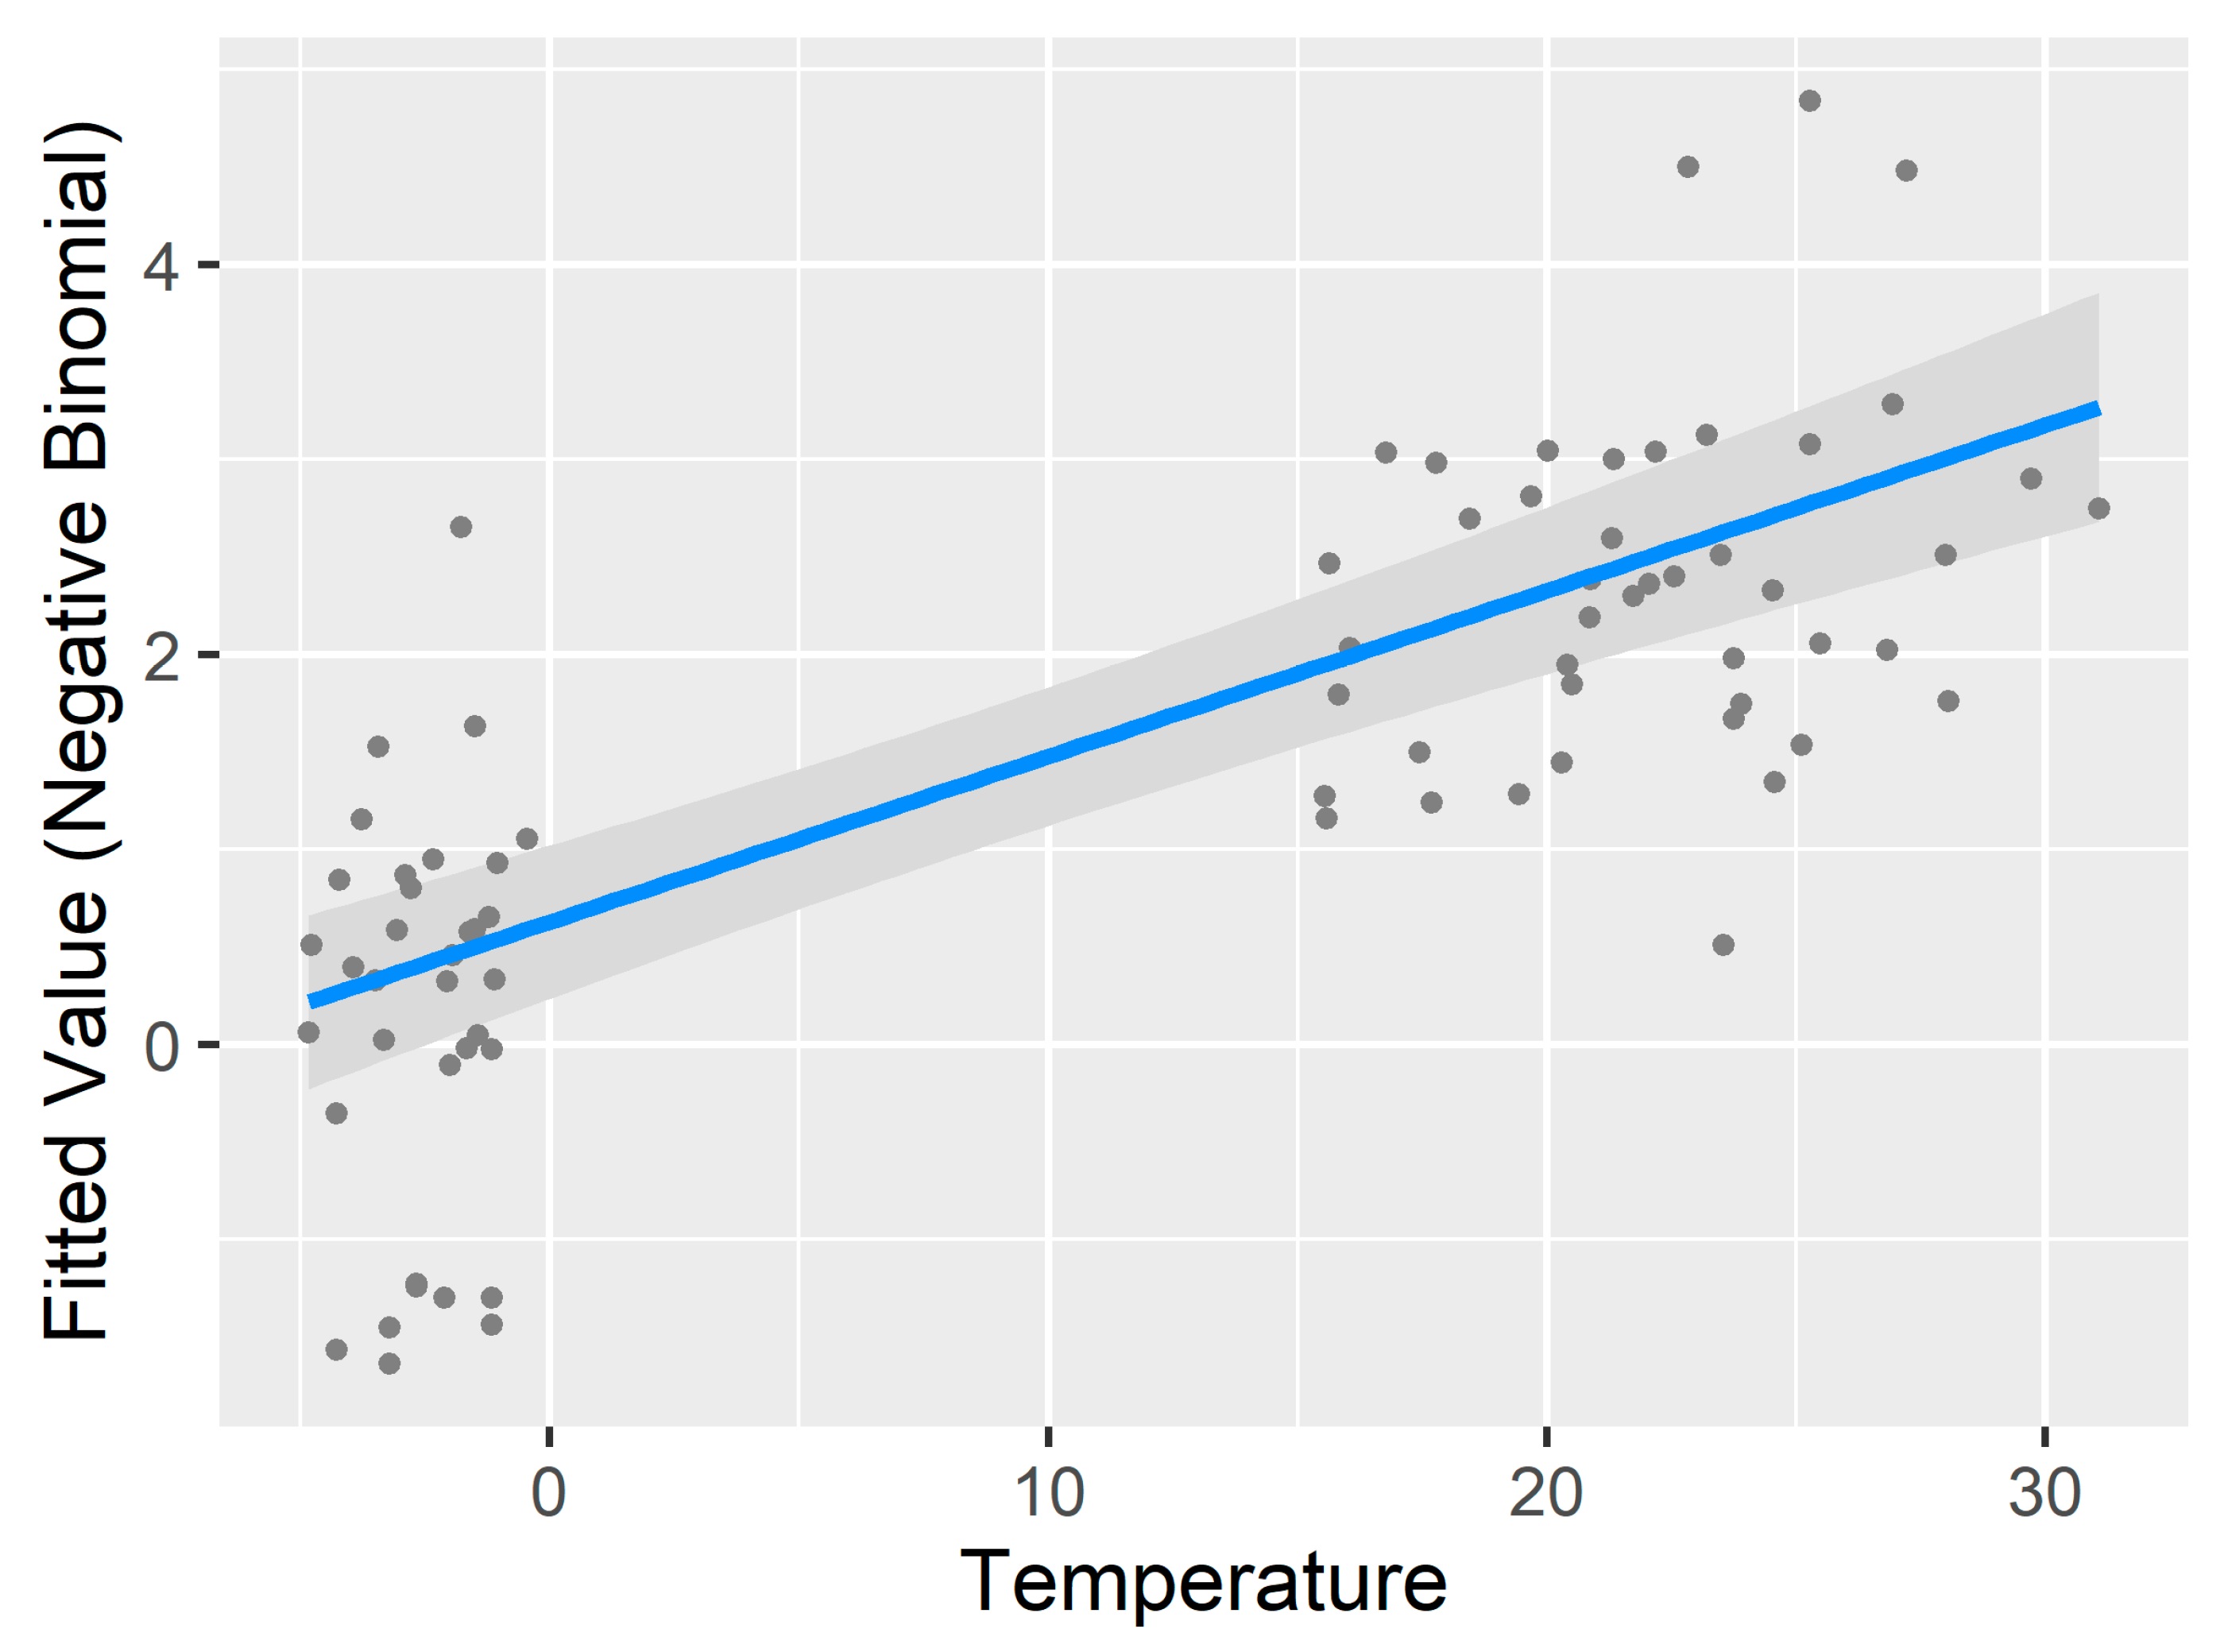
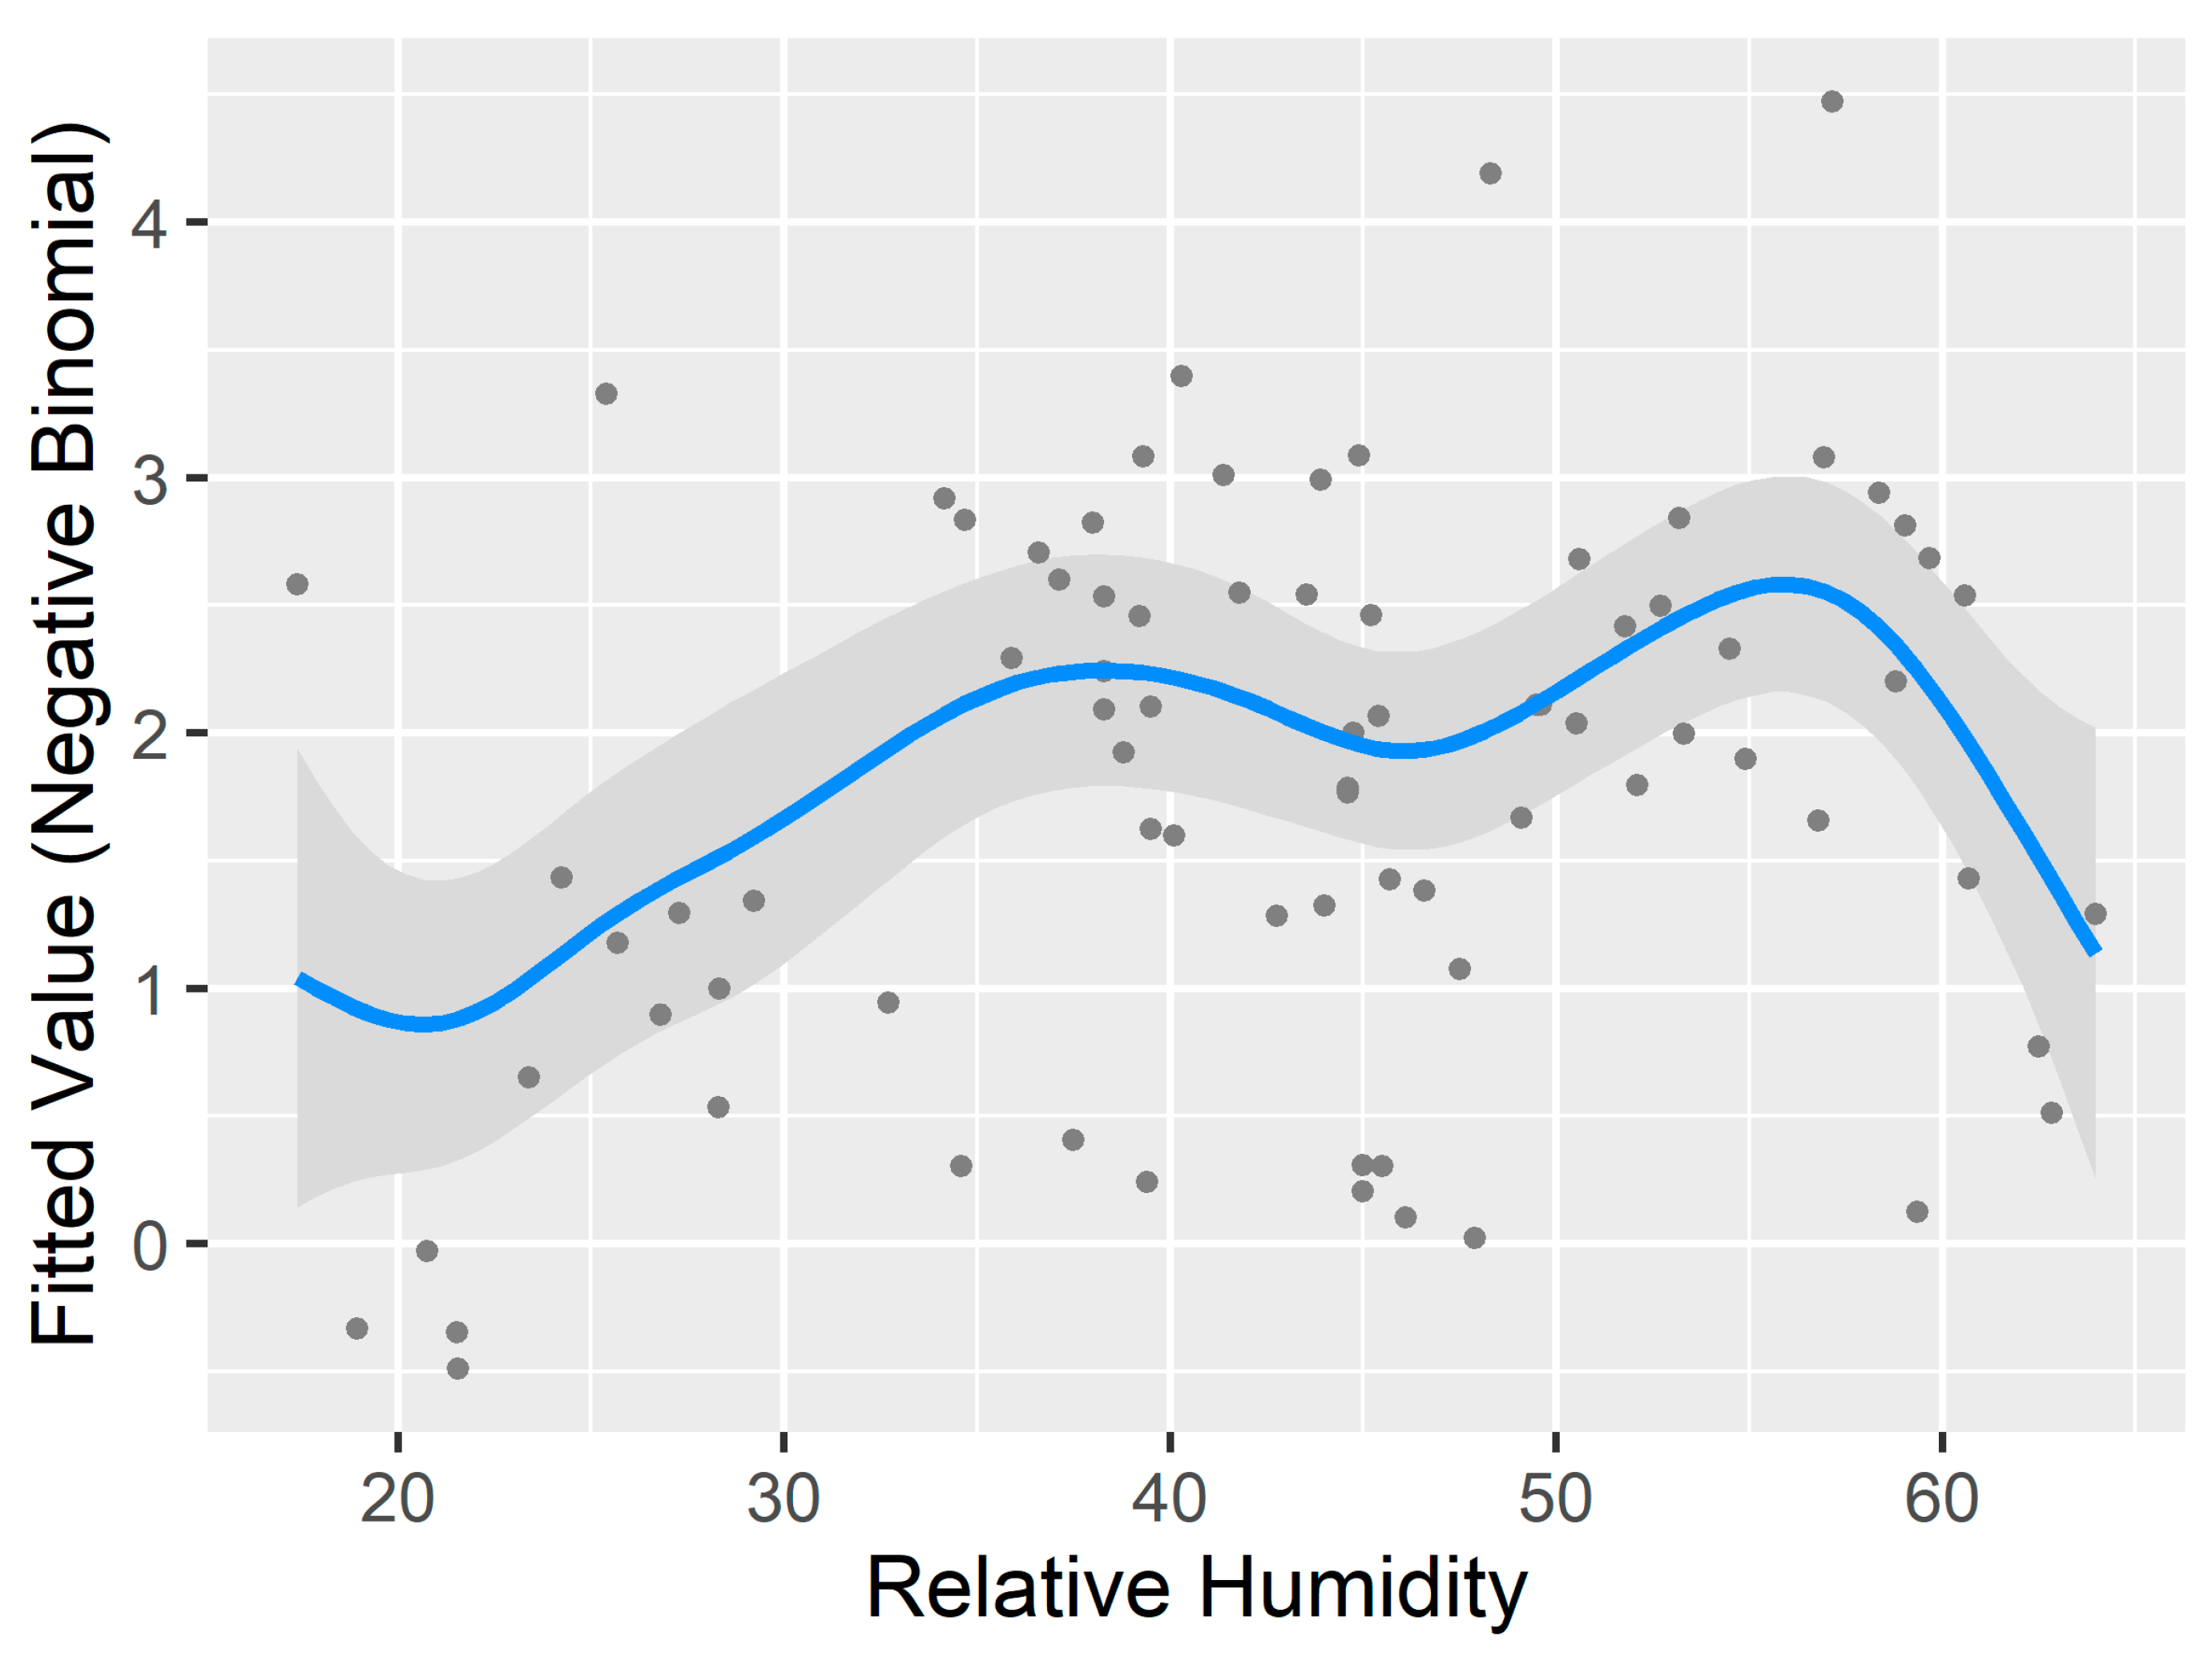
3.2. Negative Binomial Generalized Linear Regression Analysis
3.3. Generalized Additive Model for Nonlinearity
4. Discussion
4.1. Variability of Questing Tick Populations between Seasons and Parks
4.2. Influence of Environmental Factors
4.2.1. Temperature and Relative Humidity
4.2.2. Vegetation and Landscape Fragmentation
5. Conclusions
Author Contributions
Funding
Institutional Review Board Statement
Informed Consent Statement
Data Availability Statement
Acknowledgments
Conflicts of Interest
References
- Kugeler, K.J.; Schwartz, A.M.; Delorey, M.J.; Mead, P.S.; Hinckley, A.F. Estimating the frequency of Lyme disease diagnoses, United States, 2010–2018. Emerg. Infect. Dis. 2021, 27, 616. [Google Scholar] [CrossRef] [PubMed]
- Centers for Disease Control and Prevention. Why Is CDC Concerned about Lyme Disease? Available online: https://www.cdc.gov/lyme/why-is-cdc-concerned-about-lyme-disease.html (accessed on 31 May 2021).
- Arsnoe, I.; Tsao, J.I.; Hickling, G.J. Nymphal Ixodes scapularis questing behavior explains geographic variation in Lyme borreliosis risk in the eastern United States. Ticks Tick-Borne Dis. 2019, 10, 553–563. [Google Scholar] [CrossRef] [PubMed]
- Burgdorfer, W.; Barbour, A.G.; Hayes, S.F.; Benach, J.L.; Grunwaldt, E.; Davis, J.P. Lyme disease-a tick-borne spirochetosis? Science 1982, 216, 1317–1319. [Google Scholar] [CrossRef] [PubMed]
- Ostfeld, R.S. The Ecology of Lyme-Disease Risk: Complex interactions between seemingly unconnected phenomena determine risk of exposure to this expanding disease. Am. Sci. 1997, 85, 338–346. [Google Scholar]
- Horak, I.G.; Camicas, J.-L.; Keirans, J.E. The Argasidae, Ixodidae and Nuttalliellidae (Acari: Ixodida): A world list of valid tick names. In Ticks and Tick-Borne Pathogens; Jongejan, F., Kaufman, W.R., Eds.; Springer: Dordrecht, The Netherlands, 2003; pp. 27–54. [Google Scholar]
- Brown, R.N.; Lane, R.S.; Dennis, D.T. Geographic distributions of tick-borne diseases and their vectors. In Tick-Borne Diseases of Humans; Goodman, J.L., Dennis, D.T., Sonenshine, D.E., Eds.; ASM Press: Washington, DC, USA, 2005; pp. 361–391. [Google Scholar]
- Ebel, G.D. Update on Powassan virus: Emergence of a North American tick-borne flavivirus. Annu. Rev. Entomol. 2010, 55, 95–110. [Google Scholar] [CrossRef]
- Homer, M.J.; Aguilar-Delfin, I.; Telford Iii, S.R.; Krause, P.J.; Persing, D.H. Babesiosis. Clin. Microbiol. Rev. 2000, 13, 451–469. [Google Scholar] [CrossRef]
- Piesman, J.; Eisen, L. Prevention of tick-borne diseases. Annu. Rev. Entomol. 2008, 53, 323–343. [Google Scholar] [CrossRef]
- Piesman, J.; Gern, L. Lyme borreliosis in europe and north america. Parasitology 2004, 129, S191–S220. [Google Scholar] [CrossRef]
- Ostfeld, R. Lyme Disease: The Ecology of a Complex System; Oxford University Press: New York, NY, USA, 2010. [Google Scholar]
- Kocan, K.M.; de la Fuente, J.; Coburn, L.A. Insights into the development of Ixodes scapularis: A resource for research on a medically important tick species. Parasites Vectors 2015, 8, 592. [Google Scholar] [CrossRef]
- Yuval, B.; Spielman, A. Duration and regulation of the developmental cycle of Ixodes dammini (Acari: Ixodidae). J. Med. Entomol. 1990, 27, 196–201. [Google Scholar] [CrossRef]
- Lindsay, L.R.; Barker, I.K.; Surgeoner, G.A.; McEwen, S.A.; Gillespie, T.J.; Addison, E.M. Survival and development of the different life stages of Ixodes scapularis (Acari: Ixodidae) held within four habitats on Long Point, Ontario, Canada. J. Med. Entomol. 1998, 35, 189–199. [Google Scholar] [CrossRef] [PubMed]
- Lindsay, L.R.; Barker, I.K.; Surgeoner, G.A.; McEwen, S.A.; Gillespie, T.J.; Robinson, J.T. Survival and development of Ixodes scapularis (Acari: Ixodidae) under various climatic conditions in Ontario, Canada. J. Med. Entomol. 1995, 32, 143–152. [Google Scholar] [CrossRef] [PubMed]
- Jaworski, D.C.; Sauer, J.R.; Williams, J.P.; McNew, R.W.; Hair, J.A. Age-related effects on water, lipid, hemoglobin, and critical equilibrium humidity in unfed adult lone star ticks (Acari: Ixodidae). J. Med. Entomol. 1984, 21, 100–104. [Google Scholar] [CrossRef]
- Lees, A.D. The effect of ageing and locomotor activity on the water transport mechanism of ticks. Acarologia 1964, 6, 915–923. [Google Scholar]
- Williams, J.P.; Sauer, J.R.; McNew, R.W.; Hair, J.A. Physiological and biochemical changes in unfed lone star ticks, Amblyomma americanum (Acari: Ixodidae), with increasing age. J. Med. Entomol. 1986, 23, 230–235. [Google Scholar] [CrossRef] [PubMed]
- Eisen, R.J.; Eisen, L.; Ogden, N.H.; Beard, C.B. Linkages of weather and climate with Ixodes scapularis and Ixodes pacificus (Acari: Ixodidae), enzootic transmission of Borrelia burgdorferi, and Lyme disease in North America. J. Med. Entomol. 2016, 53, 250–261. [Google Scholar] [CrossRef]
- Ginsberg, H.S.; Rulison, E.L.; Miller, J.L.; Pang, G.; Arsnoe, I.M.; Hickling, G.J.; Ogden, N.H.; LeBrun, R.A.; Tsao, J.I. Local abundance of Ixodes scapularis in forests: Effects of environmental moisture, vegetation characteristics, and host abundance. Ticks Tick-Borne Dis. 2020, 11, 101271. [Google Scholar] [CrossRef]
- Ogden, N.H.; Lindsay, L.R.; Beauchamp, G.; Charron, D.; Maarouf, A.; O’Callaghan, C.J.; Waltner-Toews, D.; Barker, I.K. Investigation of relationships between temperature and developmental rates of tick Ixodes scapularis (Acari: Ixodidae) in the laboratory and field. J. Med. Entomol. 2004, 41, 622–633. [Google Scholar] [CrossRef]
- Sonenshine, D.E.; Tigner, J.A. Oviposition and hatching in two species of ticks in relation to moisture deficit. Ann. Entomol. Soc. Am. 1969, 62, 628–640. [Google Scholar] [CrossRef]
- Vandyk, J.K.; Bartholomew, D.M.; Rowley, W.A.; Platt, K.B. Survival of Ixodes scapularis (Acari: Ixodidae) exposed to cold. J. Med. Entomol. 1996, 33, 6–10. [Google Scholar] [CrossRef]
- Balashov, Y.S. Bloodsucking ticks (Ixodoidea)--vectors of diseases of man and animals. Misc. Publ. Entomol. Soc. Am. 1972, 8, 163–376. [Google Scholar]
- Ogden, N.H.; Radojevic, M.; Wu, X.; Duvvuri, V.R.; Leighton, P.A.; Wu, J. Estimated effects of projected climate change on the basic reproductive number of the Lyme disease vector Ixodes scapularis. Environ. Health Perspect. 2014, 122, 631–638. [Google Scholar] [CrossRef]
- Estrada-Peña, A.; Alexander, N.; Wint, G.W. Perspectives on modelling the distribution of ticks for large areas: So far so good? Parasites Vectors 2016, 9, 179. [Google Scholar] [CrossRef] [PubMed]
- Li, S.; Heyman, P.; Cochez, C.; Simons, L.; Vanwambeke, S.O. A multi-level analysis of the relationship between environmental factors and questing Ixodes ricinus dynamics in Belgium. Parasites Vectors 2012, 5, 149. [Google Scholar] [CrossRef]
- Levin, M.L.; Fish, D. Density-dependent factors regulating feeding success of Ixodes scapularis larvae (Acari: Ixodidae). J. Parasitol. 1998, 84, 36–43. [Google Scholar] [CrossRef] [PubMed]
- Wharton, G.W. Uptake of water vapour by mites and mechanisms utilized by the Acaridei. In Comparative Physiology: Water, Ions and Fluid Mechanics; Schmidt-Nielsen, K., Bolis, L., Maddrell, S.H.P., Eds.; Cambridge University Press: Cambridge, UK, 1978; p. 79. [Google Scholar]
- Knülle, W.; Rudolph, D. Humidity relationships and water balance of ticks. In Physiology of Ticks; Obenchain, F.D., Galun, R., Eds.; Pergamon Press: Oxford, UK, 1982; pp. 43–70. [Google Scholar]
- Berger, K.A.; Ginsberg, H.S.; Gonzalez, L.; Mather, T.N. Relative humidity and activity patterns of Ixodes scapularis (Acari: Ixodidae). J. Med. Entomol. 2014, 51, 769–776. [Google Scholar] [CrossRef] [PubMed]
- Mathisson, D.C.; Kross, S.M.; Palmer, M.I.; Diuk-Wasser, M.A. Effect of Vegetation on the Abundance of Tick Vectors in the Northeastern United States: A Review of the Literature. J. Med. Entomol. 2021, 58, 2030–2037. [Google Scholar] [CrossRef]
- Lindsay, L.R.; Mathison, S.W.; Barker, I.K.; McEwen, S.A.; Gillespie, T.J.; Surgeoner, G.A. Microclimate and habitat in relation to Ixodes scapularis (Acari: Ixodidae) populations on Long Point, Ontario, Canada. J. Med. Entomol. 1999, 36, 255–262. [Google Scholar] [CrossRef]
- Morecroft, M.D.; Taylor, M.E.; Oliver, H.R. Air and soil microclimates of deciduous woodland compared to an open site. Agric. For. Meteorol. 1998, 90, 141–156. [Google Scholar] [CrossRef]
- Schulze, T.L.; Jordan, R.A. Influence of meso-and microscale habitat structure on focal distribution of sympatric Ixodes scapularis and Amblyomma americanum (Acari: Ixodidae). J. Med. Entomol. 2005, 42, 285–294. [Google Scholar] [CrossRef]
- Alverson, W.S.; Waller, D.M.; Solheim, S.L. Forests too deer: Edge effects in northern Wisconsin. Conserv. Biol. 1988, 2, 348–358. [Google Scholar] [CrossRef]
- Stafford, K.C., III. Reduced abundance of Ixodes scapularis (Acari: Ixodidae) with exclusion of deer by electric fencing. J. Med. Entomol. 1993, 30, 986–996. [Google Scholar] [CrossRef] [PubMed]
- Stafford, K.C., III. Survival of immature Ixodes scapularis (Acari: Ixodidae) at different relative humidities. J. Med. Entomol. 1994, 31, 310–314. [Google Scholar] [CrossRef] [PubMed]
- Wilson, M.L.; Adler, G.H.; Spielman, A. Correlation between abundance of deer and that of the deer tick, Ixodes dammini (Acari: Ixodidae). Ann. Entomol. Soc. Am. 1985, 78, 172–176. [Google Scholar] [CrossRef]
- Ferrell, A.M.; Brinkerhoff, R.J. Using landscape analysis to test hypotheses about drivers of tick abundance and infection prevalence with Borrelia burgdorferi. Int. J. Environ. Res. Public Health 2018, 15, 737. [Google Scholar] [CrossRef]
- Del Fabbro, S.; Gollino, S.; Zuliani, M.; Nazzi, F. Investigating the relationship between environmental factors and tick abundance in a small, highly heterogeneous region. J. Vector Ecol. 2015, 40, 107–116. [Google Scholar] [CrossRef]
- Burtis, J.C.; Sullivan, P.; Levi, T.; Oggenfuss, K.; Fahey, T.J.; Ostfeld, R.S. The impact of temperature and precipitation on blacklegged tick activity and Lyme disease incidence in endemic and emerging regions. Parasites Vectors 2016, 9, 606. [Google Scholar] [CrossRef]
- Tomkins, J.L.; Aungier, J.; Hazel, W.; Gilbert, L. Towards an evolutionary understanding of questing behaviour in the tick Ixodes ricinus. PLoS ONE 2014, 9, e110028. [Google Scholar] [CrossRef]
- Falco, R.C.; Fish, D. Potential for exposure to tick bites in recreational parks in a Lyme disease endemic area. Am. J. Public Health 1989, 79, 12–15. [Google Scholar] [CrossRef]
- Fish, D.; Dowler, R.C. Host associations of ticks (Acari: Ixodidae) parasitizing medium-sized mammals in a Lyme disease endemic area of southern New York. J. Med. Entomol. 1989, 26, 200–209. [Google Scholar] [CrossRef]
- James, M.C.; Bowman, A.S.; Forbes, K.J.; Lewis, F.; McLeod, J.E.; Gilbert, L. Environmental determinants of Ixodes ricinus ticks and the incidence of Borrelia burgdorferi sensu lato, the agent of Lyme borreliosis, in Scotland. Parasitology 2013, 140, 237–246. [Google Scholar] [CrossRef]
- Estrada-Peña, A. Distribution, abundance, and habitat preferences of Ixodes ricinus (Acari: Ixodidae) in northern Spain. J. Med. Entomol. 2001, 38, 361–370. [Google Scholar] [CrossRef]
- Vassallo, M.; Pichon, B.; Cabaret, J.; Figureau, C.; Pérez-Eid, C. Methodology for sampling questing nymphs of Ixodes ricinus (Acari: Ixodidae), the principal vector of Lyme disease in Europe. J. Med. Entomol. 2000, 37, 335–339. [Google Scholar] [CrossRef] [PubMed]
- Qviller, L.; Risnes-Olsen, N.; Bærum, K.M.; Meisingset, E.L.; Loe, L.E.; Ytrehus, B.; Viljugrein, H.; Mysterud, A. Landscape level variation in tick abundance relative to seasonal migration in red deer. PLoS ONE 2013, 8, e71299. [Google Scholar] [CrossRef]
- Dobson, A.D.M.; Finnie, T.J.R.; Randolph, S.E. A modified matrix model to describe the seasonal population ecology of the European tick Ixodes ricinus. J. Appl. Ecol. 2011, 48, 1017–1028. [Google Scholar] [CrossRef]
- Perret, J.L.; Guigoz, E.; Rais, O.; Gern, L. Influence of saturation deficit and temperature on Ixodes ricinus tick questing activity in a Lyme borreliosis-endemic area (Switzerland). Parasitol. Res. 2000, 86, 554–557. [Google Scholar] [CrossRef]
- Gilbert, L. Altitudinal patterns of tick and host abundance: A potential role for climate change in regulating tick-borne diseases? Oecologia 2010, 162, 217–225. [Google Scholar] [CrossRef] [PubMed]
- Garcia-Martí, I.; Zurita-Milla, R.; Van Vliet, A.J.H.; Takken, W. Modelling and mapping tick dynamics using volunteered observations. Int. J. Health Geogr. 2017, 16, 41. [Google Scholar] [CrossRef] [PubMed]
- Rosà, R.; Andreo, V.; Tagliapietra, V.; Baráková, I.; Arnoldi, D.; Hauffe, H.C.; Manica, M.; Rosso, F.; Blaňarová, L.; Bona, M. Effect of climate and land use on the spatio-temporal variability of tick-borne bacteria in Europe. Int. J. Environ. Res. Public Health 2018, 15, 732. [Google Scholar] [CrossRef]
- Lindén, A.; Mäntyniemi, S. Using the negative binomial distribution to model overdispersion in ecological count data. Ecology 2011, 92, 1414–1421. [Google Scholar] [CrossRef] [PubMed]
- Anderson, D.R.; Burnham, K.P.; White, G.C. AIC model selection in overdispersed capture-recapture data. Ecology 1994, 75, 1780–1793. [Google Scholar] [CrossRef]
- Galante, P.J.; Alade, B.; Muscarella, R.; Jansa, S.A.; Goodman, S.M.; Anderson, R.P. The challenge of modeling niches and distributions for data-poor species: A comprehensive approach to model complexity. Ecography 2018, 41, 726–736. [Google Scholar] [CrossRef]
- Burnham, K.P.; Anderson, D.R.; Huyvaert, K.P. AIC model selection and multimodel inference in behavioral ecology: Some background, observations, and comparisons. Behav. Ecol. Sociobiol. 2011, 65, 23–35. [Google Scholar] [CrossRef]
- Yee, T.W.; Mitchell, N.D. Generalized additive models in plant ecology. J. Veg. Sci. 1991, 2, 587–602. [Google Scholar] [CrossRef]
- Hastie, T.; Tibshirani, R. Generalized additive models: Some applications. J. Am. Stat. Assoc. 1987, 82, 371–386. [Google Scholar] [CrossRef]
- Fushiki, T. Estimation of prediction error by using K-fold cross-validation. Stat. Comput. 2011, 21, 137–146. [Google Scholar] [CrossRef]
- de Rooij, M.; Weeda, W. Cross-Validation: A Method Every Psychologist Should Know. Adv. Methods Pract. Psychol. Sci. 2020, 3, 248–263. [Google Scholar] [CrossRef]
- Yates, L.A.; Aandahl, Z.; Richards, S.A.; Brook, B.W. Cross validation for model selection: A review with examples from ecology. Ecol. Monogr. 2023, 93, e1557. [Google Scholar] [CrossRef]
- Cortina, J.M. Interaction, Nonlinearity, and Multicollinearity: Implications for Multiple Regression. J. Manag. 1993, 19, 915–922. [Google Scholar] [CrossRef]
- Graham, M.H. Confronting Multicollinearity in Ecological Multiple Regression. Ecology 2003, 84, 2809–2815. [Google Scholar] [CrossRef]
- Schulze, T.L.; Jordan, R.A. Seasonal and long-term variations in abundance of adult Ixodes scapularis (Acari: Ixodidae) in different coastal plain habitats of New Jersey. J. Med. Entomol. 1996, 33, 963–970. [Google Scholar] [CrossRef] [PubMed]
- Kollars, T.M., Jr.; Oliver, J.H., Jr.; Kollars, P.G.; Durden, L.A. Seasonal activity and host associations of Ixodes scapularis (Acari: Ixodidae) in southeastern Missouri. J. Med. Entomol. 1999, 36, 720–726. [Google Scholar] [CrossRef]
- Agoulon, A.; Malandrin, L.; Lepigeon, F.; Vénisse, M.; Bonnet, S.; Becker, C.A.M.; Hoch, T.; Bastian, S.; Plantard, O.; Beaudeau, F. A vegetation index qualifying pasture edges is related to Ixodes ricinus density and to Babesia divergens seroprevalence in dairy cattle herds. Vet. Parasitol. 2012, 185, 101–109. [Google Scholar] [CrossRef]
- Vail, S.G.; Smith, G. Vertical movement and posture of blacklegged tick (Acari: Ixodidae) nymphs as a function of temperature and relative humidity in laboratory experiments. J. Med. Entomol. 2002, 39, 842–846. [Google Scholar] [CrossRef] [PubMed]
- Randolph, S.E.; Storey, K. Impact of microclimate on immature tick-rodent host interactions (Acari: Ixodidae): Implications for parasite transmission. J. Med. Entomol. 1999, 36, 741–748. [Google Scholar] [CrossRef] [PubMed]
- Brownstein, J.S.; Holford, T.R.; Fish, D. A climate-based model predicts the spatial distribution of the Lyme disease vector Ixodes scapularis in the United States. Environ. Health Perspect. 2003, 111, 1152–1157. [Google Scholar] [CrossRef]
- Brownstein, J.S.; Holford, T.R.; Fish, D. Effect of Climate Change on Lyme Disease Risk in North America. EcoHealth 2005, 2, 38–46. [Google Scholar] [CrossRef]
- Estrada-Peña, A.; Cutler, S.; Potkonjak, A.; Vassier-Tussaut, M.; Van Bortel, W.; Zeller, H.; Fernández-Ruiz, N.; Mihalca, A.D. An updated meta-analysis of the distribution and prevalence of Borrelia burgdorferi s.l. in ticks in Europe. Int. J. Health Geogr. 2018, 17, 41. [Google Scholar] [CrossRef]
- Clark, D.D. Lower temperature limits for activity of several Ixodid ticks (Acari: Ixodidae): Effects of body size and rate of temperature change. J. Med. Entomol. 1995, 32, 449–452. [Google Scholar] [CrossRef]
- Duffy, D.C.; Campbell, S.R. Ambient air temperature as a predictor of activity of adult Ixodes scapularis (Acari: Ixodidae). J. Med. Entomol. 1994, 31, 178–180. [Google Scholar] [CrossRef]
- Brownstein, J.S.; Skelly, D.K.; Holford, T.R.; Fish, D. Forest fragmentation predicts local scale heterogeneity of Lyme disease risk. Oecologia 2005, 146, 469–475. [Google Scholar] [CrossRef] [PubMed]
- Barrios, J.M.; Verstraeten, W.W.; Maes, P.; Clement, J.; Aerts, J.-M.; Farifteh, J.; Lagrou, K.; Van Ranst, M.; Coppin, P. Remotely sensed vegetation moisture as explanatory variable of Lyme borreliosis incidence. Int. J. Appl. Earth Obs. Geoinf. 2012, 18, 1–12. [Google Scholar] [CrossRef]
- Benedetti, R.; Rossini, P. On the use of NDVI profiles as a tool for agricultural statistics: The case study of wheat yield estimate and forecast in Emilia Romagna. Remote Sens. Environ. 1993, 45, 311–326. [Google Scholar] [CrossRef]
- Olson, C.A.; Cupp, E.W.; Luckhart, S.; Ribeiro, J.M.C.; Levy, C. Occurrence of Ixodes pacificus (Parasitiformes: Ixodidae) in Arizona. J. Med. Entomol. 1992, 29, 1060–1062. [Google Scholar] [CrossRef] [PubMed]
- Schulze, T.L.; Jordan, R.A. Meteorologically mediated diurnal questing of Ixodes scapularis and Amblyomma americanum (Acari: Ixodidae) nymphs. J. Med. Entomol. 2003, 40, 395–402. [Google Scholar] [CrossRef]
- Goddard, J. Ecological studies of adult Ixodes scapularis in central Mississippi: Questing activity in relation to time of year, vegetation type, and meteorologic conditions. J. Med. Entomol. 1992, 29, 501–506. [Google Scholar] [CrossRef]
- Das, A.; Lele, S.R.; Glass, G.E.; Shields, T.; Patz, J. Modelling a discrete spatial response using generalized linear mixed models: Application to Lyme disease vectors. Int. J. Geogr. Inf. Sci. 2002, 16, 151–166. [Google Scholar] [CrossRef]
- Battaly, G.R.; Fish, D. Relative importance of bird species as hosts for immature Ixodes dammini (Acari: Ixodidae) in a suburban residential landscape of southern New York State. J. Med. Entomol. 1993, 30, 740–747. [Google Scholar] [CrossRef]
- Fish, D.; Daniels, T.J. The role of medium-sized mammals as reservoirs of Borrelia burgdorferi in southern New York. J. Wildl. Dis. 1990, 26, 339–345. [Google Scholar] [CrossRef]

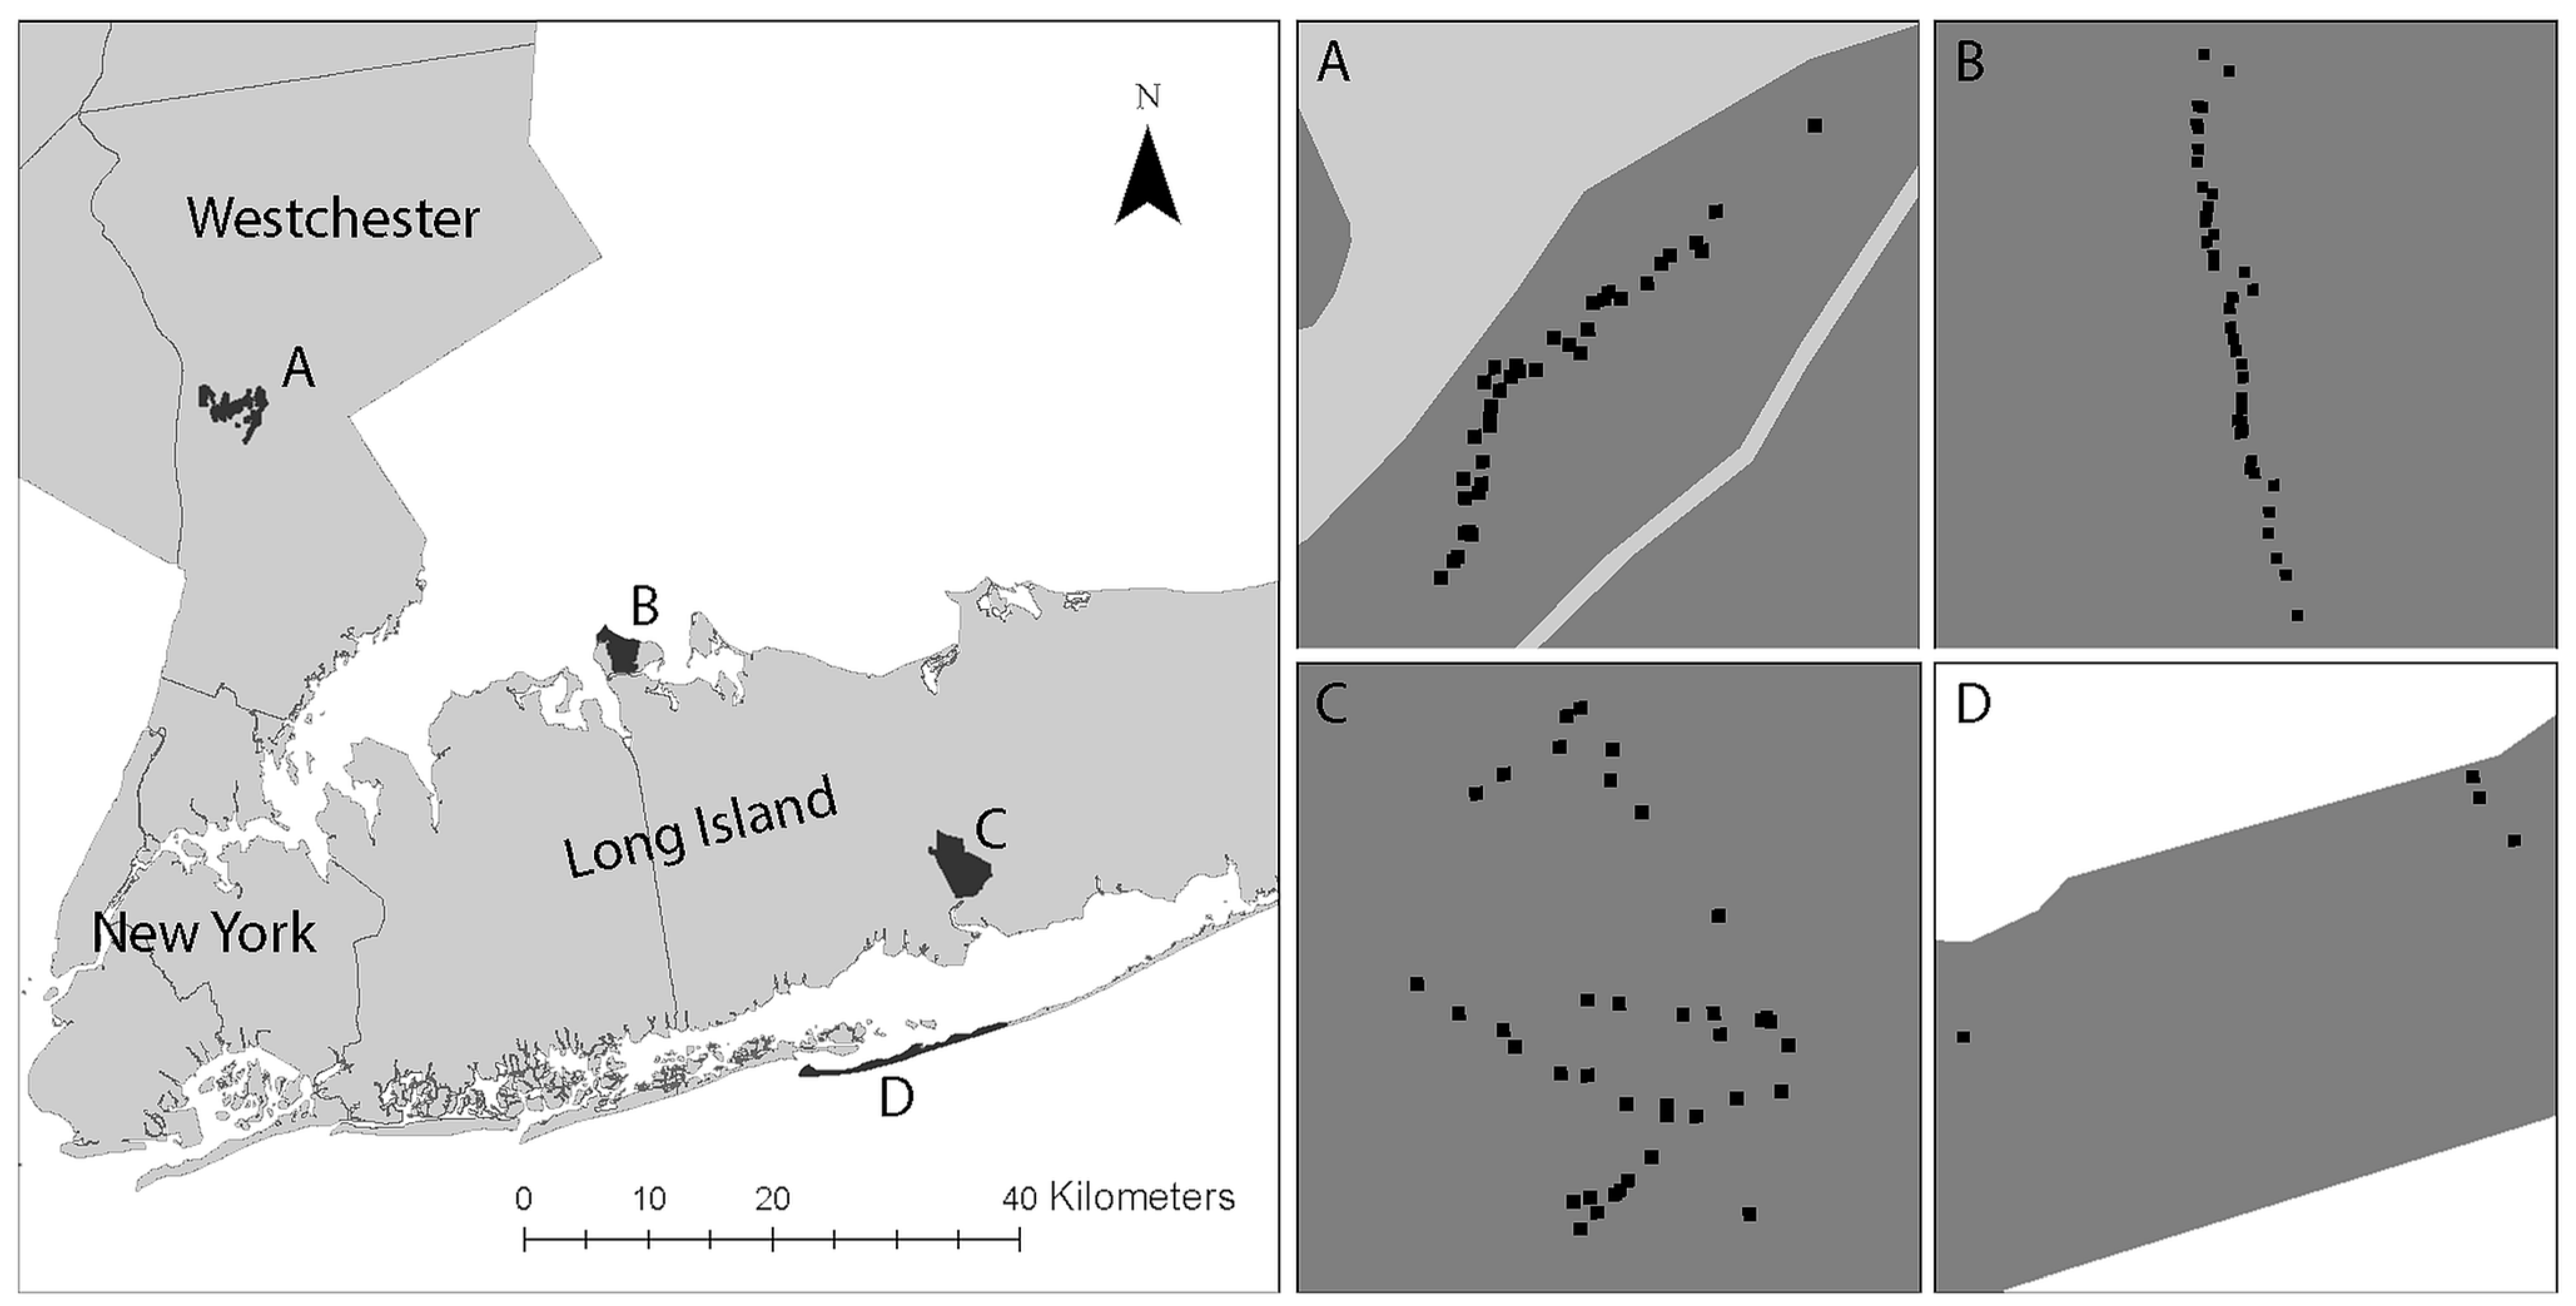
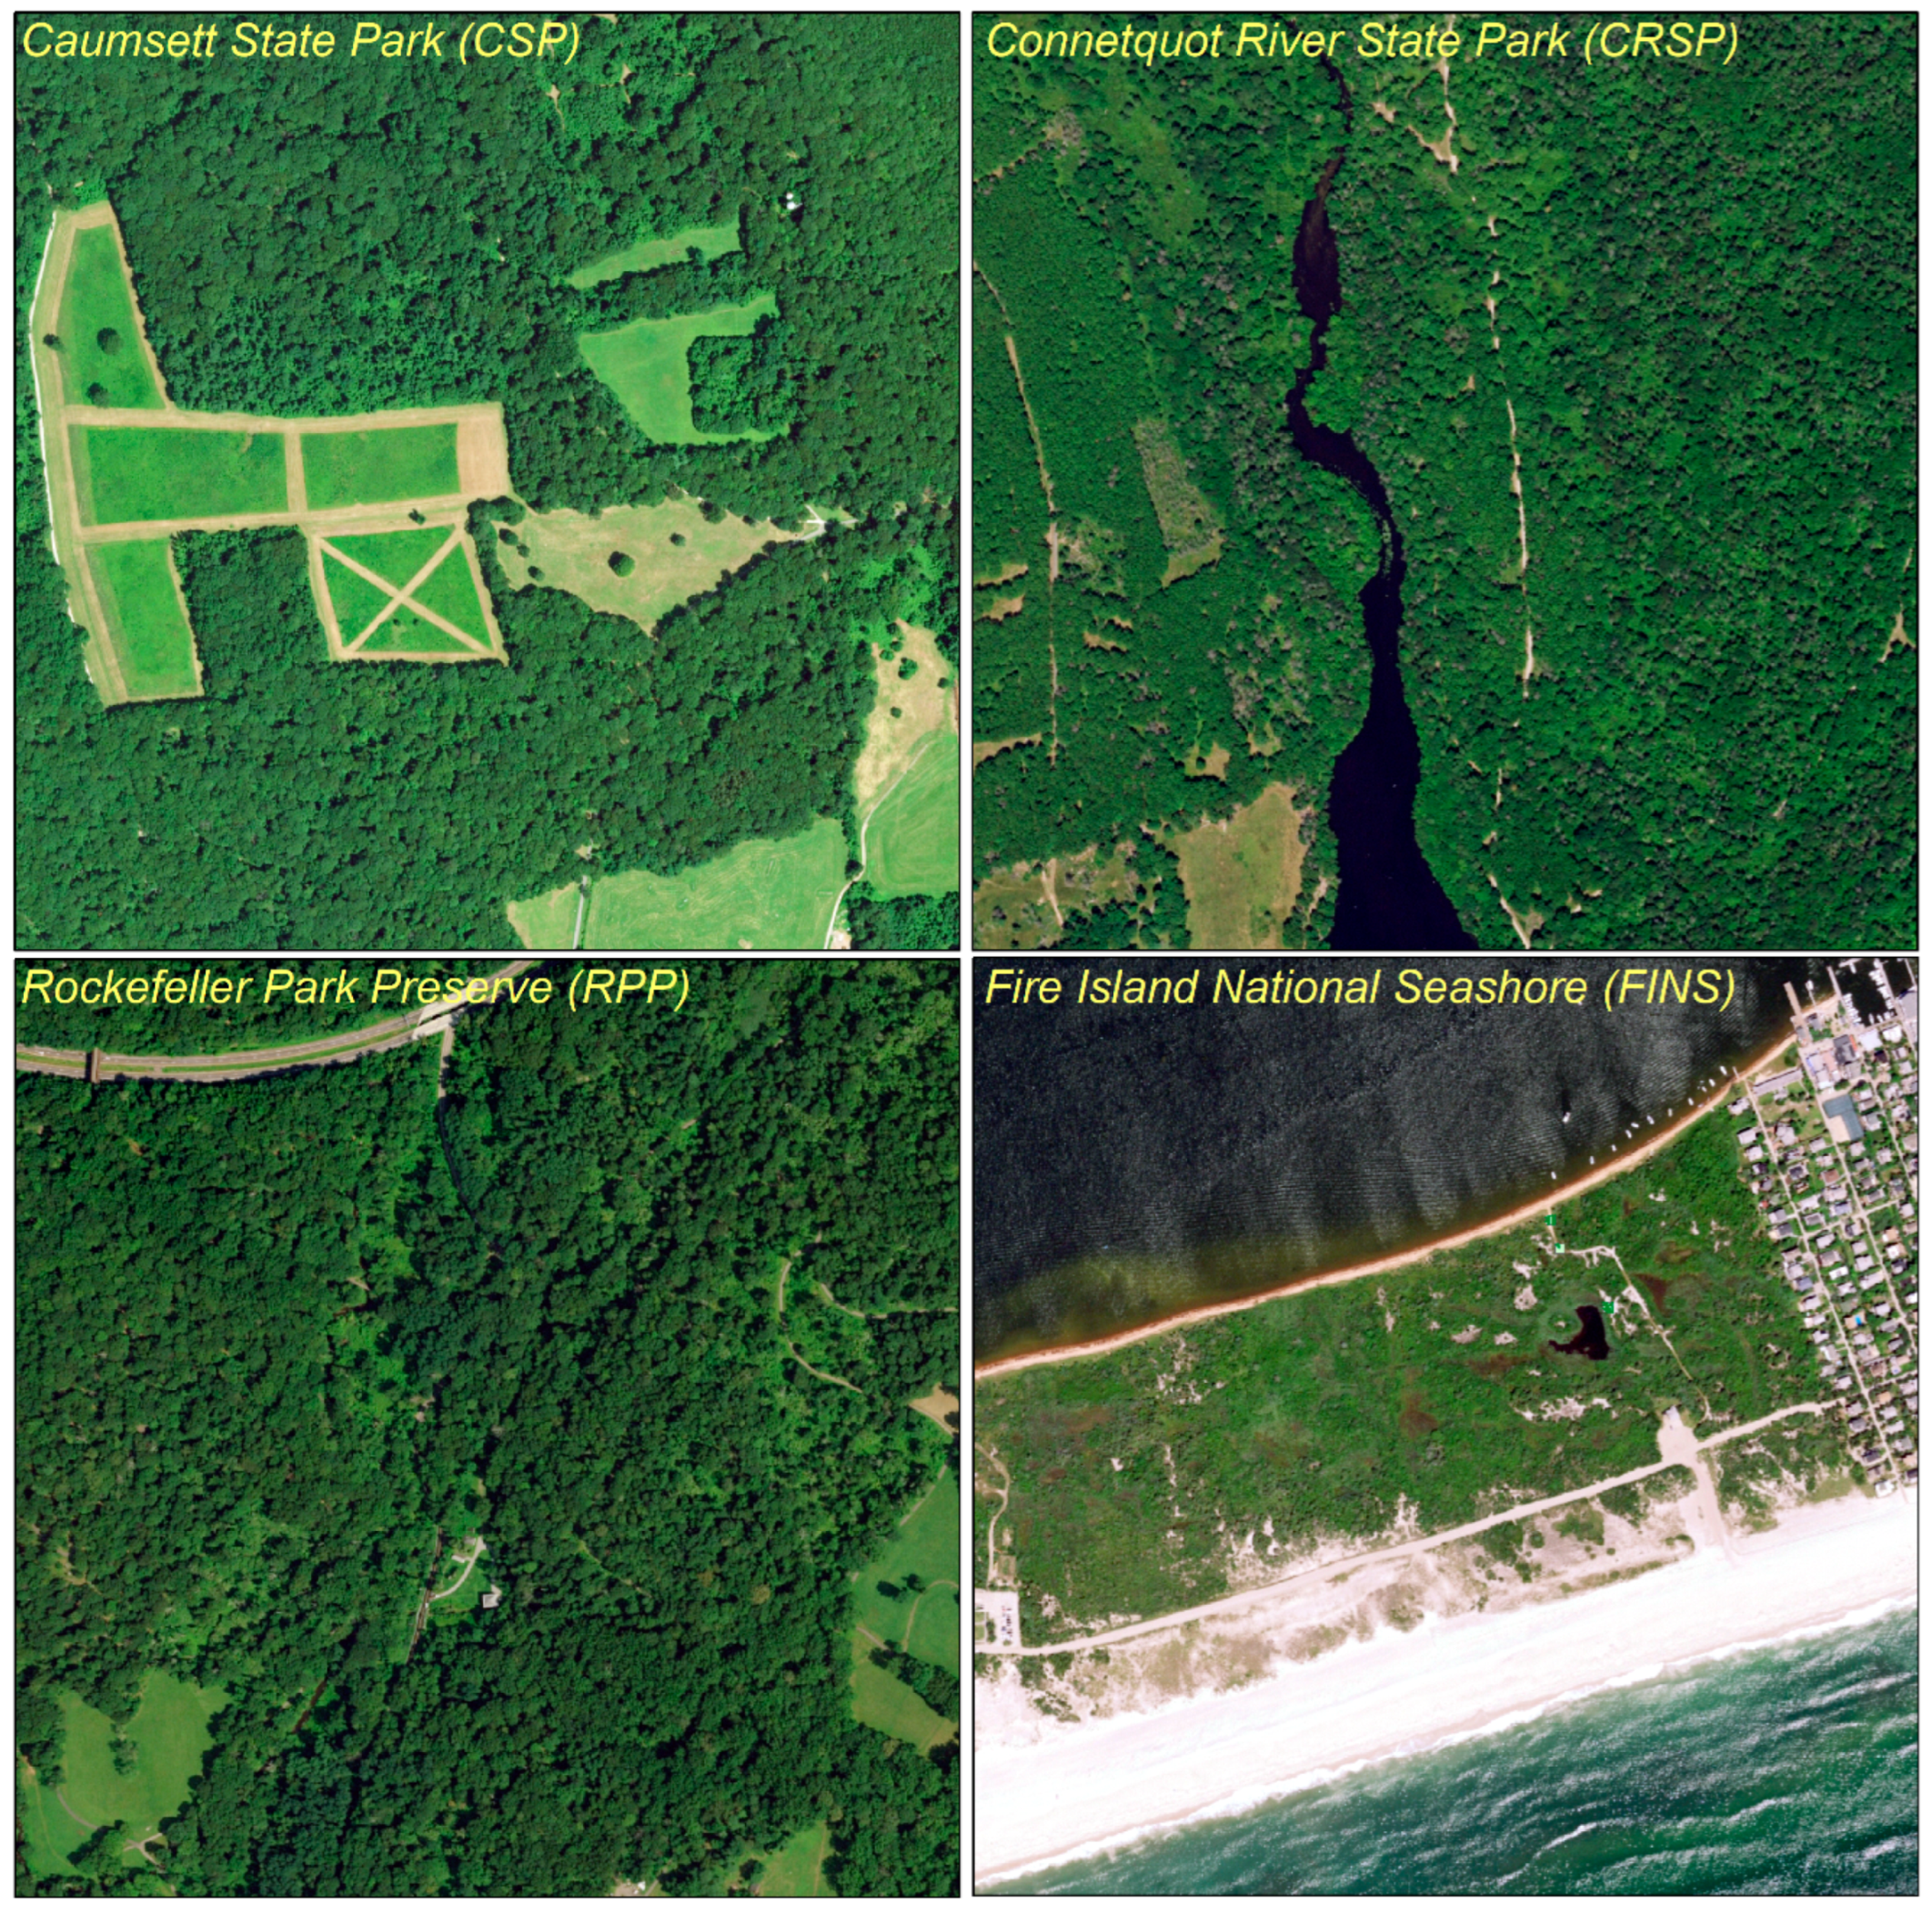
| Study Area | Land Cover | Wildlife |
|---|---|---|
| Caumsett State Park (CSP), Suffolk County, New York https://parks.ny.gov/ (access on 31 May 2019) | Dominated by oak–tulip forest (2.78 sq km). Other component land cover consists of costal oak–hickory forest (0.54 sq km), low salt marsh (0.36 sq km), successional shrubland (0.09 sq km), and salt shrubland (0.07 sq km). | The major resident mammal species is the white-tailed deer. CSP is home to a wide variety of migratory bird species (e.g., Canada Geese). |
| Connetquot River State Park (CRSP), Suffolk County, New York https://www.dec.ny.gov/outdoor/61668.html (access on 31 May 2019) | Land cover consisting of sandy pine barrens, wetlands, ponds, and oak brush plains provides refuge for more than 300 plant species. | CRSP is home to several mammal species (e.g., white-tailed deer, red fox, eastern cottontail rabbit, chipmunks), reptiles, 200 birds. |
| Rockefeller Park Preserve (RPP), Westchester County, New York https://www.inaturalist.org/ (access on 31 May 2019) | Primarily covered by hardwood forest. Dominant plant species include huge oak, tulip poplar, maple, and beech trees. | RPP supports 202 species of resident and migratory birds, reptiles, amphibians, and mammals (e.g., white tailed deer, eastern grey squirrel). |
| Fire Island National Seashore (FINS), Suffolk County, New York https://www.nps.gov/index.htm (access on 31 May 2019) | Main land cover includes beaches, sand dunes, interdune scrub, maritime forest, and wetland habitats. The severe environment only supports a few plant species (e.g., beach grasslands, pitch pine woodlands, bearberry dwarf scrubs). | In addition to a number of terrestrial mammal species (e.g., white tailed deer, red fox, eastern cottontail rabbits, white footed mouse) identified on the seashore, it is home to a wide variety of species including migratory birds, marine mammals, and reptiles. |
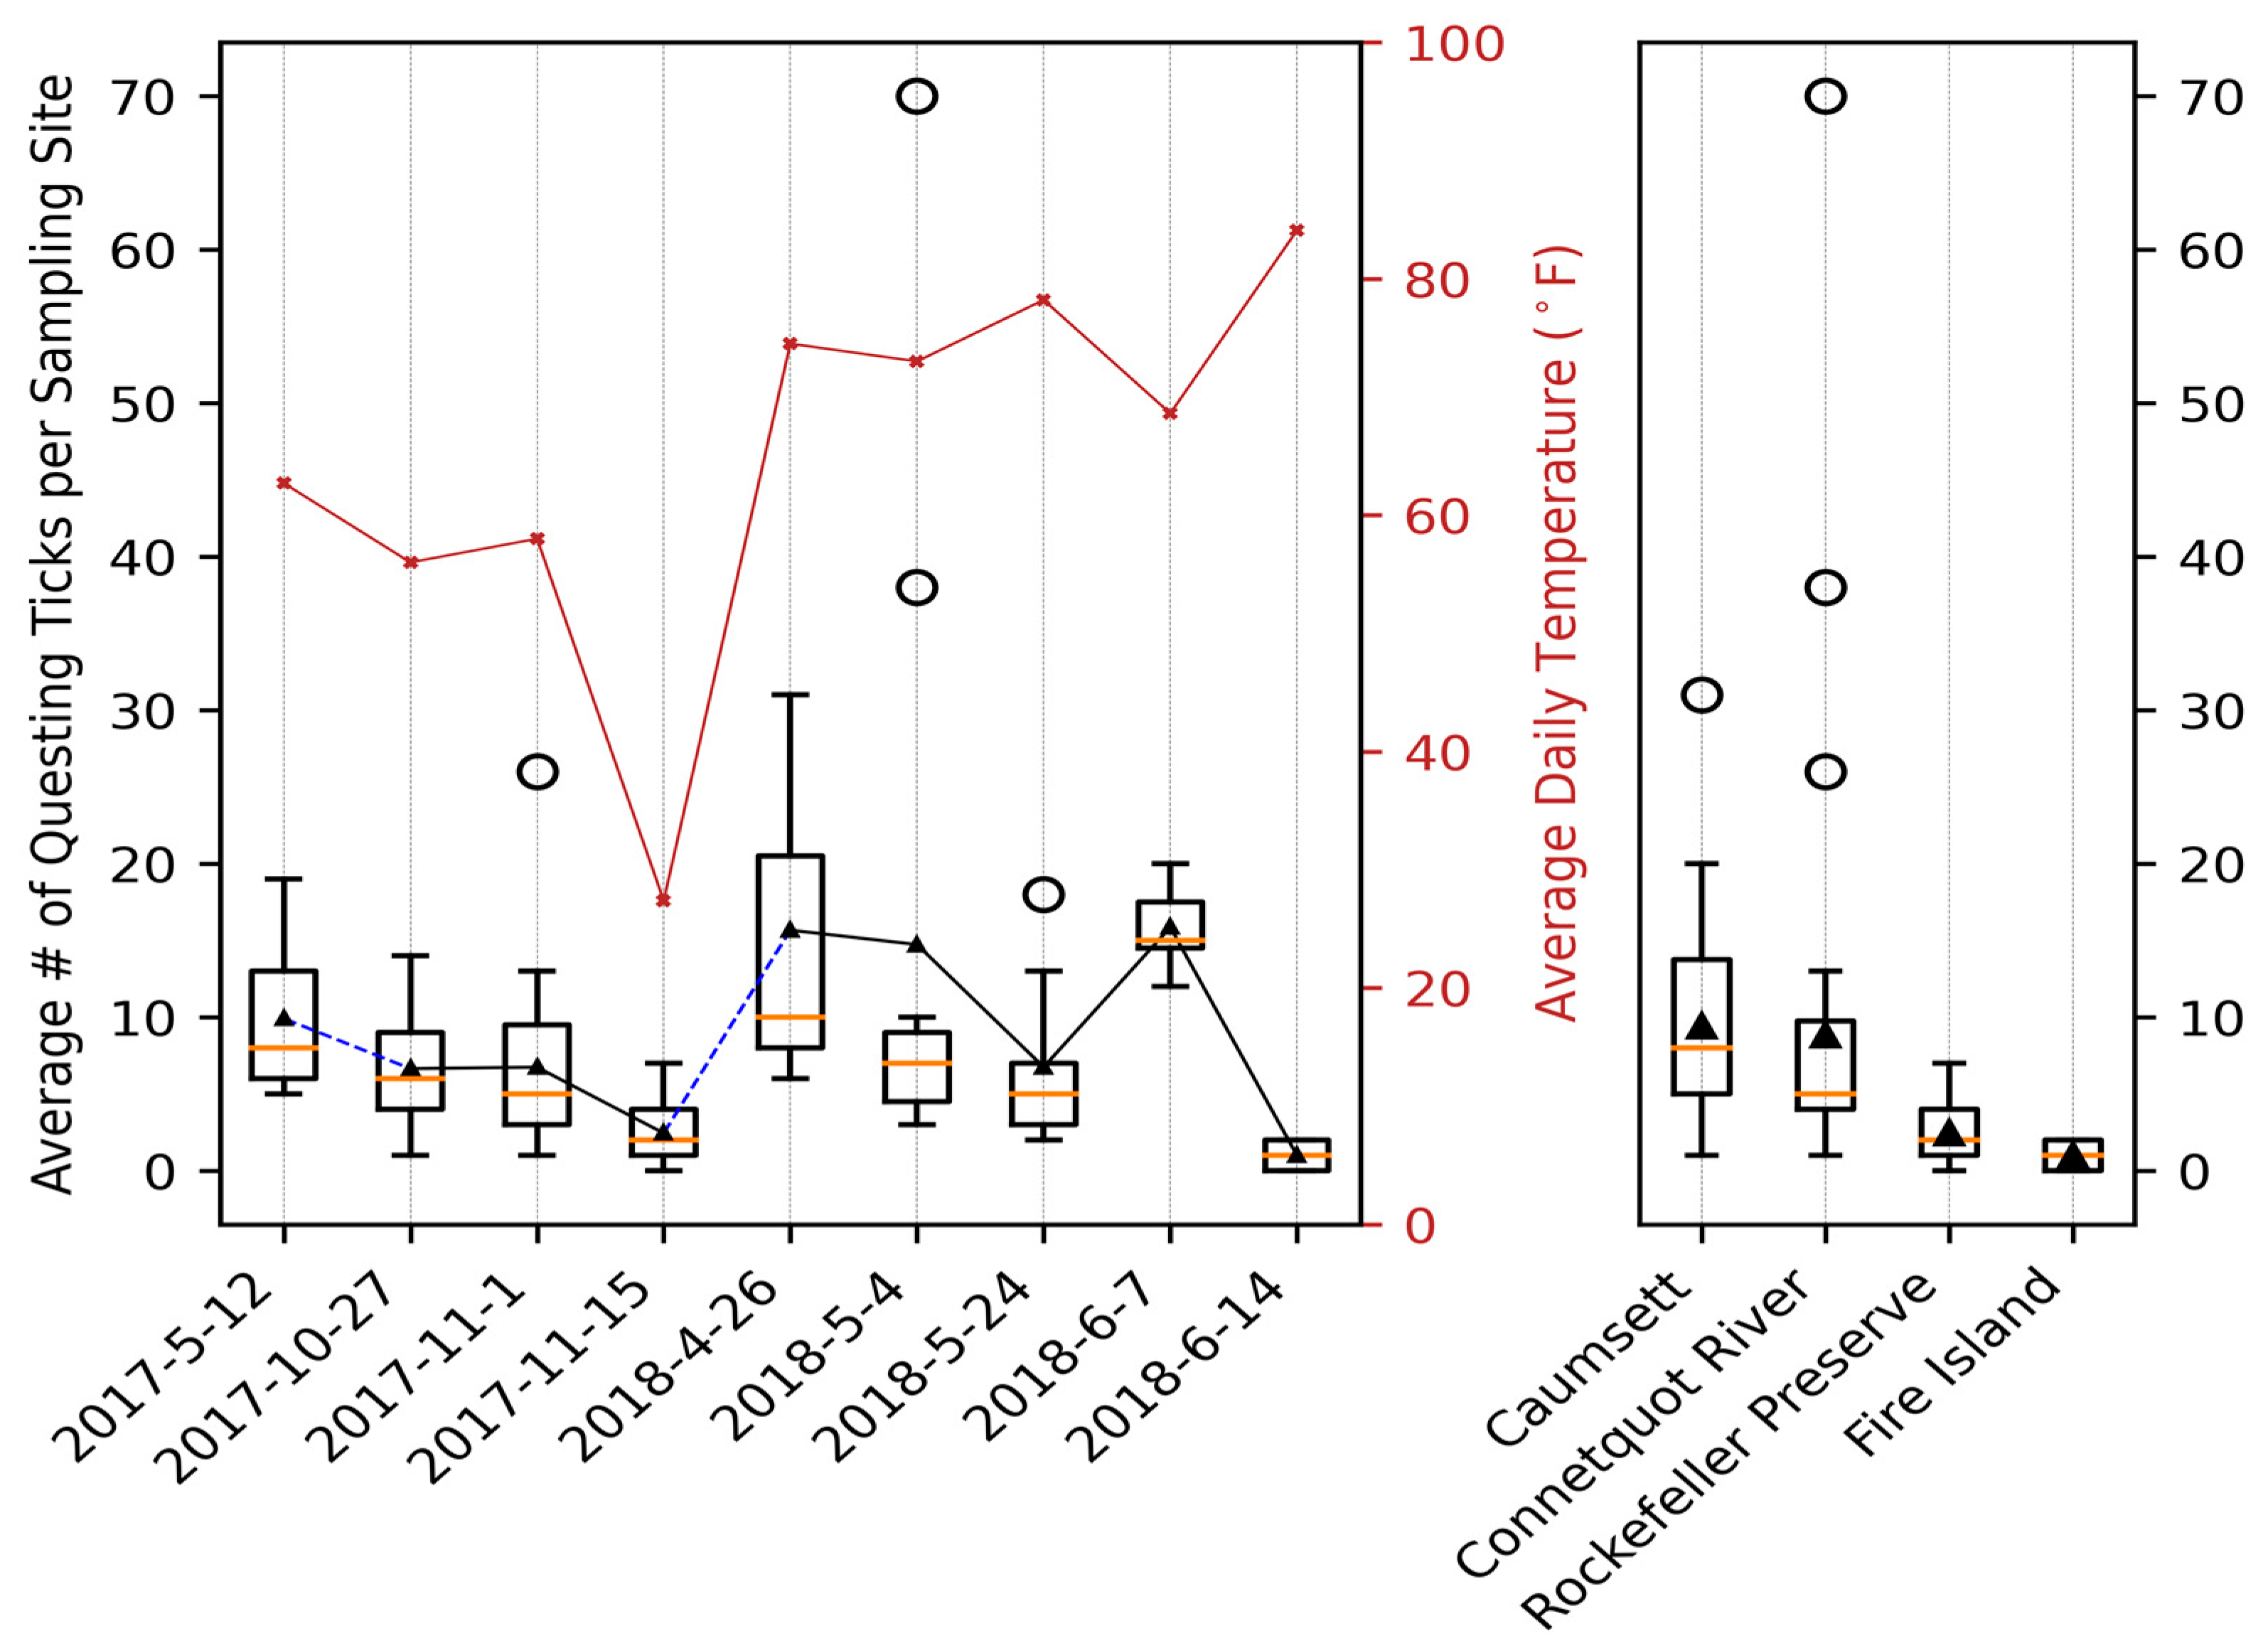
| Date | Location | # of Sites | Total of Adult Ticks () | Total of Nymph () |
|---|---|---|---|---|
| 12 May 2017 | Caumsett SP | 11 | 109 (9.90, 4.99) | 0 |
| 27 October 2017 | Caumsett SP | 16 | 113 (7.06, 3.86) | 0 |
| 1 September 2017 | Connetquot River SP | 30 | 209 (6.74, 5.13) | 0 |
| 15 September 2017 | Rockefeller Park Preserve | 35 | 88 (2.44, 1.91) | 0 |
| 26 April 2018 | Caumsett SP | 3 | 47 (15.67, 13.43) | 0 |
| 4 May 2018 | Connetquot River SP | 10 | 162 (14.73, 20.80) | 0 |
| 24 May 2018 | Caumsett SP | 8 | 54 (6.75, 5.68) | 0 |
| 7 June 2018 | Caumsett SP | 7 | 10 (1.43, 1.27) | 101 (14.42, 3.46) |
| 14 June 2018 | Fire Island NS | 4 | 0 | 4 (1, 1.15) |
| Total | 124 | 792 | 105 |
| Model | Specification | AICc (AICc) | (se) | CVc (Normalized) | Pseudo-R2 | |
|---|---|---|---|---|---|---|
| Nagelkerke | Adjusted McFadden | |||||
| Null | Tick count ~ 1 | 490.25 (0.00) | 0.94 (0.17) | 6.04 (0.086) | 0.00 | 0.00 |
| Full | Tick count ~ temperature + relative humidity + season + solar + elevation + ndvi + ecotone length + land cover * | 455.22 (35.03) | 2.67 (0.62) | 5.86 (0.084) | 0.57 | 0.10 |
| Alternative | Tick count ~ elevation + relative humidity + season + ndvi + ecotone length | 449.15 (41.10) | 2.01 (0.43) | 5.57 (0.080) | 0.47 | 0.10 |
| Calibrated | Tick count ~ temperature + relative humidity + land cover * | 440.90 (49.35) | 2.69 (0.70) | 5.12 (0.073) | 0.55 | 0.11 |
| Variable | Calibrated Model | Alternative Model | ||
|---|---|---|---|---|
| log(IRR) | 95% CI | log(IRR) | 95% CI | |
| Temperature | 0.07 *** | 0.05, 0.09 | - | - |
| Relative Humidity | 0.03 ** | 0.01, 0.04 | 0.025 * | 0.00, 0.05 |
| Land Cover Percentage | ||||
| Mixed Hardwood | 7.0 *** | 3.5, 12 | - | - |
| Dwarf Shrub | 7.3 *** | 3.4, 13 | - | - |
| Grassland | 6.2 * | 1.3, 13 | - | - |
| Pine Forest | 5.1 * | 1.4, 11 | - | - |
| Season | - | - | 3.51 *** | 1.6, 5.4 |
| Elevation | 0.023 * | 0.00, 0.05 | ||
| NDVI | - | - | 2.23 * | 0.26, 4.2 |
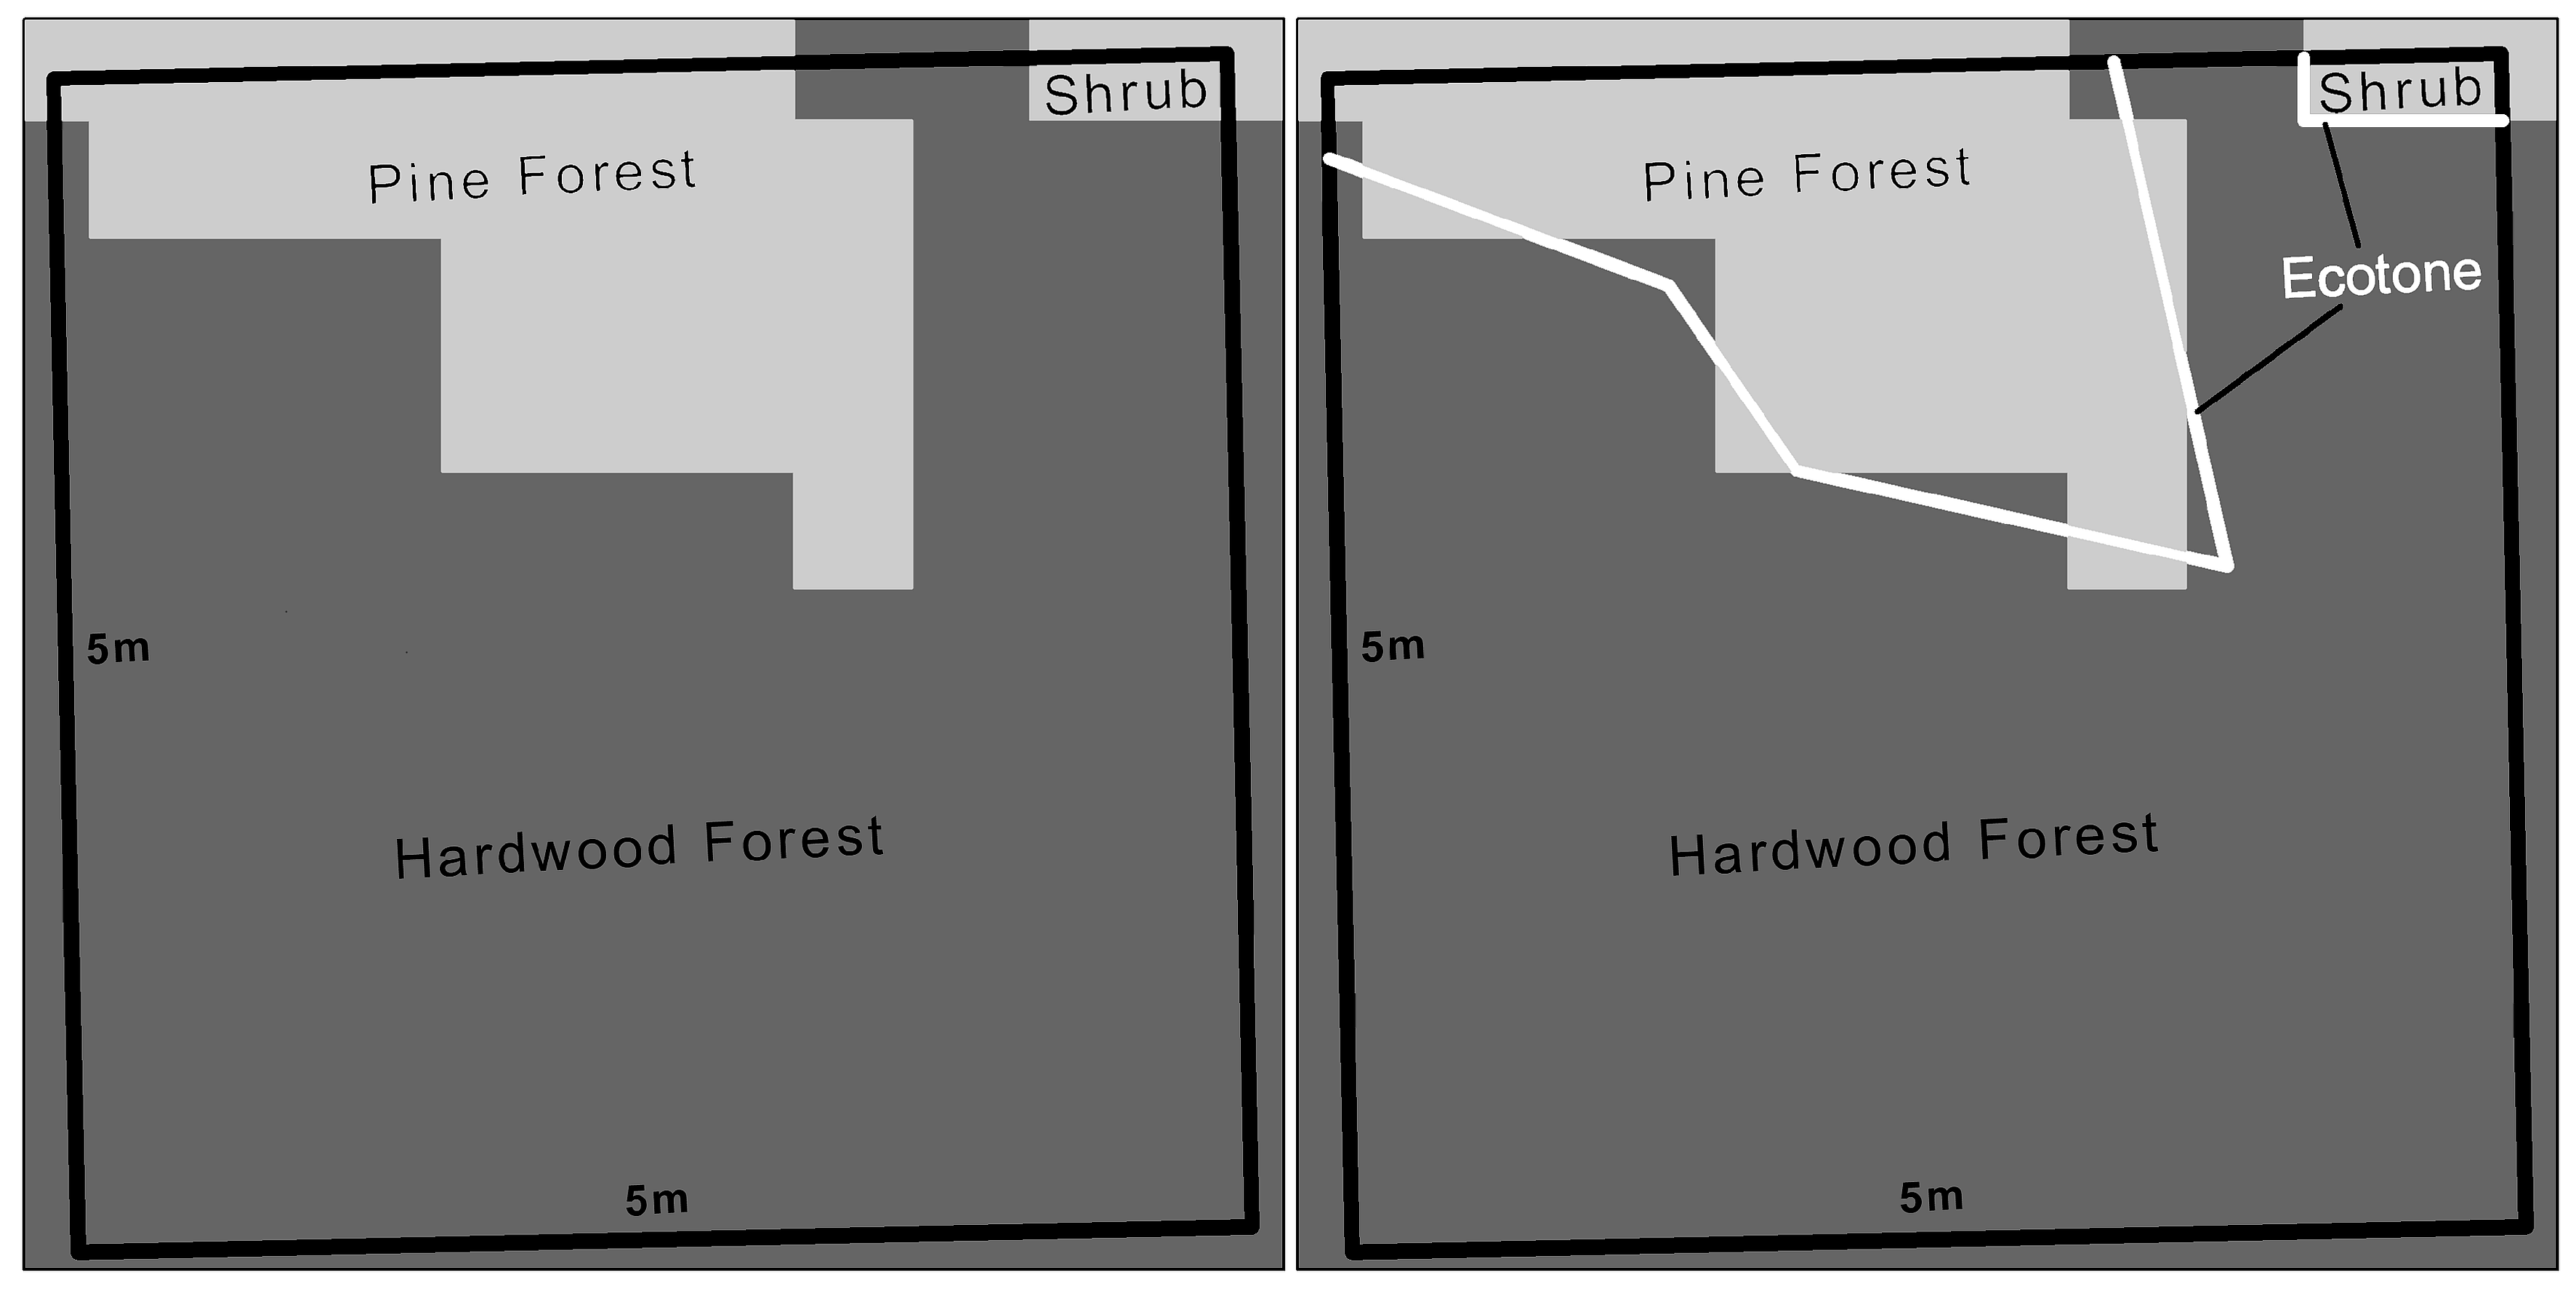
| Ecotone Length | - | - | 0.0046 | −0.02, 0.03 |
| Variable | EDF | p-Value | |
|---|---|---|---|
| Temperature | 1 | 64.786 | <0.001 *** |
| Relative Humidity | 6.05 | 29.834 | <0.001 *** |
| Vegetation Land Cover Percentage | |||
| Mixed Hardwood | 1 | 12.029 | <0.001 *** |
| Dwarf Shrub | 4.002 | 22.226 | <0.001 *** |
| Grassland | 1 | 7.038 | 0.008 ** |
| Pine Forest | 1 | 5.973 | 0.015 * |
Disclaimer/Publisher’s Note: The statements, opinions and data contained in all publications are solely those of the individual author(s) and contributor(s) and not of MDPI and/or the editor(s). MDPI and/or the editor(s) disclaim responsibility for any injury to people or property resulting from any ideas, methods, instructions or products referred to in the content. |
© 2023 by the authors. Licensee MDPI, Basel, Switzerland. This article is an open access article distributed under the terms and conditions of the Creative Commons Attribution (CC BY) license (https://creativecommons.org/licenses/by/4.0/).
Share and Cite
Di, C.; Sulkow, B.; Qiu, W.; Sun, S. Effects of Micro-Scale Environmental Factors on the Quantity of Questing Black-Legged Ticks in Suburban New York. Appl. Sci. 2023, 13, 11587. https://doi.org/10.3390/app132011587
Di C, Sulkow B, Qiu W, Sun S. Effects of Micro-Scale Environmental Factors on the Quantity of Questing Black-Legged Ticks in Suburban New York. Applied Sciences. 2023; 13(20):11587. https://doi.org/10.3390/app132011587
Chicago/Turabian StyleDi, Chong, Brian Sulkow, Weigang Qiu, and Shipeng Sun. 2023. "Effects of Micro-Scale Environmental Factors on the Quantity of Questing Black-Legged Ticks in Suburban New York" Applied Sciences 13, no. 20: 11587. https://doi.org/10.3390/app132011587
APA StyleDi, C., Sulkow, B., Qiu, W., & Sun, S. (2023). Effects of Micro-Scale Environmental Factors on the Quantity of Questing Black-Legged Ticks in Suburban New York. Applied Sciences, 13(20), 11587. https://doi.org/10.3390/app132011587