Article

Experimental Study on Permeability Evolution of Sandstone during Triaxial Compression Damage

1
State Key Laboratory of Geomechanics and Geotechnical Engineering, Institute of Rock and Soil Mechanics, Chinese Academy of Sciences, Wuhan 430071, China
2
College of Civil and Architectural Engineering, Guangxi University of Science and Technology, 2 Wenchang Road, Liuzhou 545006, China
3
Guangxi Communications Design Group Co., Ltd., Nanning 530029, China
*
Author to whom correspondence should be addressed.
Appl. Sci. 2023, 13(20), 11579; https://doi.org/10.3390/app132011579
Submission received: 25 August 2023 / Revised: 12 October 2023 / Accepted: 12 October 2023 / Published: 23 October 2023
(This article belongs to the Special Issue Rock Mechanics: Current Challenges and Novel Technologies)

Abstract

:
In order to investigate the mechanical properties and permeability characteristics of sandstone during damage evolution under hydromechanical condition, a series of coupled hydro-mechanical triaxial tests on sandstone specimens were conducted based on the Rock Top 50HT full-stress multi-field coupling triaxial test system. Variations in permeability as a function of confining pressure, seepage pressure gradient, and volumetric strain during damage evolution were obtained. The results show that: (1) When the confining pressure is constant and the specimen is gradually changed from a dry to a saturated state, the failure mode of sandstone changes from shear failure to single-slope shear failure. (2) There are four distinctive stages in the permeability evolution of sandstone: gradual decrease, steady development, gradual increase, and rapid growth. These stages correspond to the complete stress–strain curve under the respective working conditions. (3) Employing the Weibull distribution formula, this study investigates the evolution of fracture damage under varying working conditions and determines the permeability evolution relationships associated with damage variables. This exploration reveals an intrinsic link between permeability and damage variables. These findings enhance our understanding of the interplay between stress, deformation, permeability, and damage evolution in seepage-stress coupled sandstone. The results contribute valuable insights to the field of rock mechanics and hold implications for diverse geotechnical and engineering applications.

1. Introduction

The expansion of various engineering activities in China, such as transport tunnelling, water conservation, hydropower projects, and deep mining, has led to a transition from shallow to deeper underground projects. This shift has introduced new challenges as rocks in the deep underground are subjected to complex geo-stress and seepage pressure conditions, making the determination of their mechanical parameters and seepage prediction more intricate. Ensuring stability and safety in deep rock engineering projects requires a complete knowledge of the mechanical and permeability attributes of rocks under different seepage pressures and confining pressures. As a result, investigating the coupling between rock stress and permeability holds significant theoretical and practical importance for deep rock engineering [1,2,3,4]. Therefore, the study of rock under stress-permeability coupling conditions has important theoretical and applied value for deep rock engineering.
In the past few years, many experimental studies have studied the permeability of various types of rocks during the triaxial seepage stress process, including high-strength granite [5,6], low-strength sedimentary rock [7], and sandstone with high porosity [8,9,10]. These results provide an important reference for further understanding the mechanisms by which strength and porosity affect rock permeability. Alam et al. [11] carried out triaxial hydromechanical tests for three different lithologies and analyzed their permeability evolution by combining thin section image analysis and micro-focus X-ray computed tomography of structural changes. Wang et al. [12] explored the evolution of axial strain, volume strain, and permeability in rock specimens during the failure process by conducted a hydro-mechanical coupling test on limestone and sandstone. In addition, Wang et al. [13] formulated a model for the permeability evolution of rocks in the volume compression stage and volume shearing stage. These results provide an important reference for understanding the rock deformation and fracture mechanism. Hu et al. [14] studied the variation of the Biot coefficient and permeability by conducting a hydro-mechanical test. Chen et al. [15] and Zhang et al. [1] investigated the seepage characteristics of rocks under low pressure and high pressure, and the correlation between deformation characteristics and permeability was revealed. This means that the fracture and deformation characteristics of rock have an important effect on permeability. In addition, some scholars have carried out hydro-mechanical coupling experiments for fracture rocks, such as Nguyen et al. [16], who investigated the influence of stress paths on the mechanical properties and permeability evolution of quartz-filled fracture rock. Yang et al. [17] conducted a series of tests on the shear–seepage coupling characteristics of a single fractured rock mass under cyclic loading and unloading.
During the hydromechanical test, energy accumulation, evolution, and dissipation were measured. Wang et al. [18] conducted a series of compaction-permeability tests with in situ nuclear magnetic resonance (NMR) measurement; the permeability variation mechanism and the influence of stress damage on permeability were investigated during the complete stress–strain process. Zhao et al. [19] investigated the damage characteristics of sandstone during hydromechanical tests by conducting an acoustic emission test, and the power law relationship between permeability and porosity were determined. Zou et al. [20] revealed the relationship between damage properties and the permeability of granite by conducting hydro-mechanical tests. Gao et al. [21] studied the effects of pore volume change and seepage pressure on sandstone deformation and defined a damage variable and established a semi-analytical permeability change model. In addition, Chen et al. [22] carried out triaxial compression tests under different confining pressures and seepage pressures and used 3D digital image correlation and scanning electron microscopy to monitor the strain localization behavior of sandstones under different conditions and its effect on permeability evolution.
After reviewing the aforementioned research findings, it is evident that there is a limited amount of research focused on the relationship between the mechanical parameters, permeability characteristics, and damage state of rocks under hydromechanical conditions. To address this gap, the present study utilizes a Rock Top multi-field coupled tester and employs the steady-state permeability testing method to conduct an extensive investigation into the permeability evolution patterns and mechanical parameters of sandstone subjected to various hydromechanical conditions during the triaxial compression damage process. Moreover, a detailed analysis of the rock’s permeability under specific strain thresholds at each stage of stress–strain was conducted. The results of this study offer valuable insights into the safeguarding of deep rock engineering.

2. Test Principle and Method

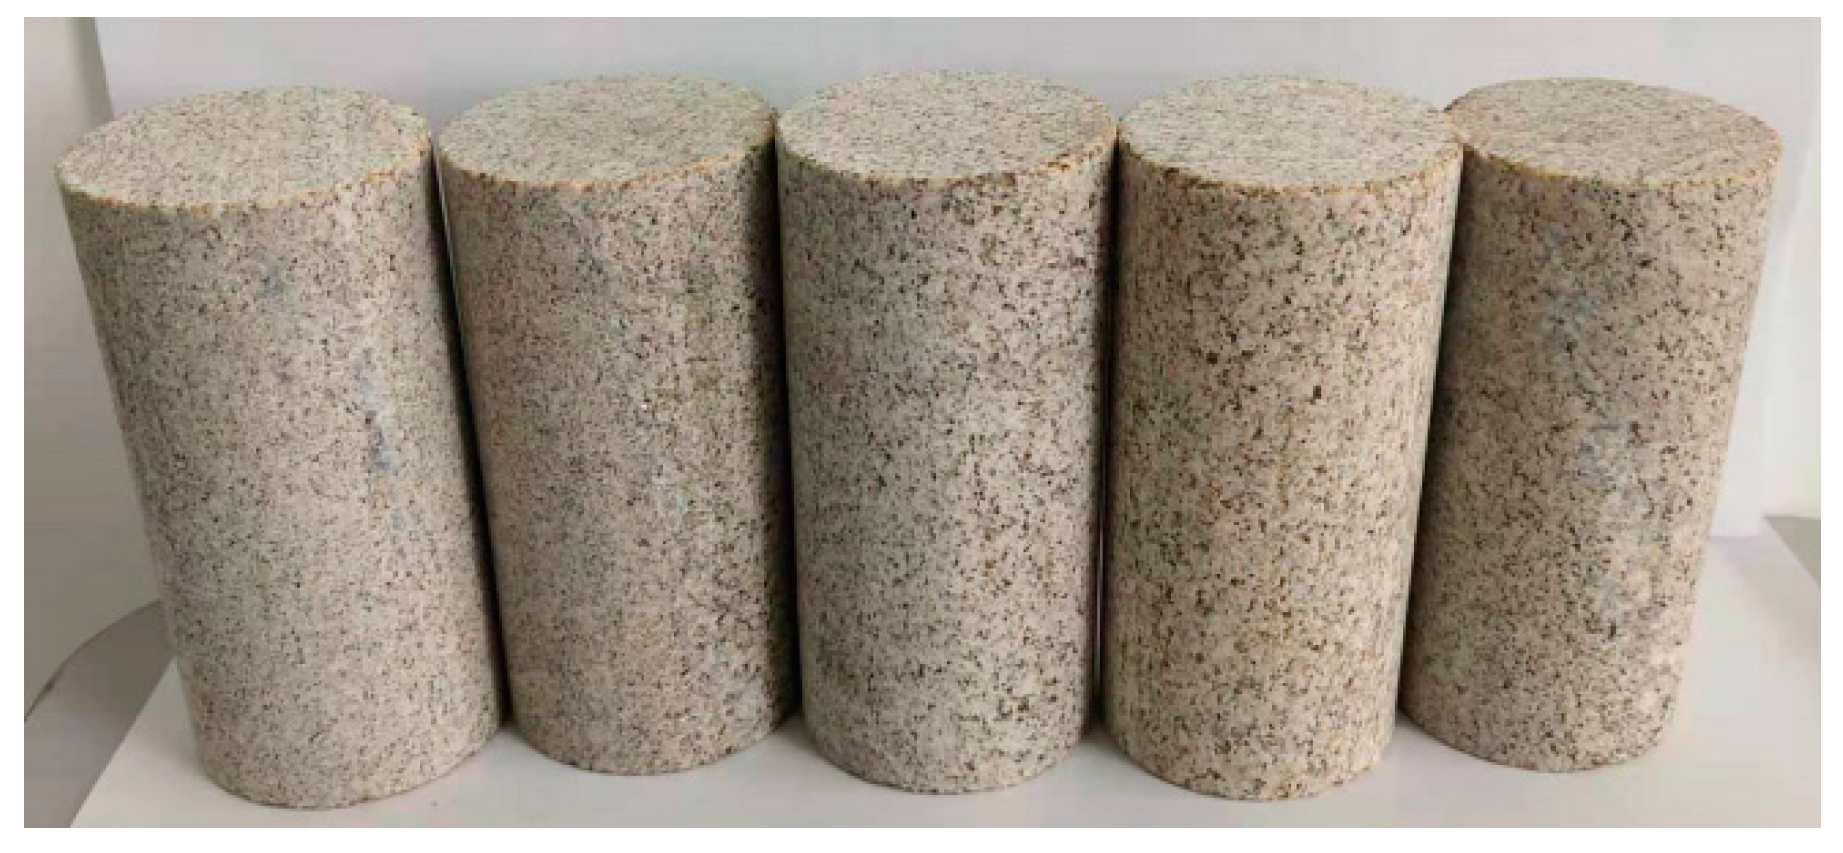
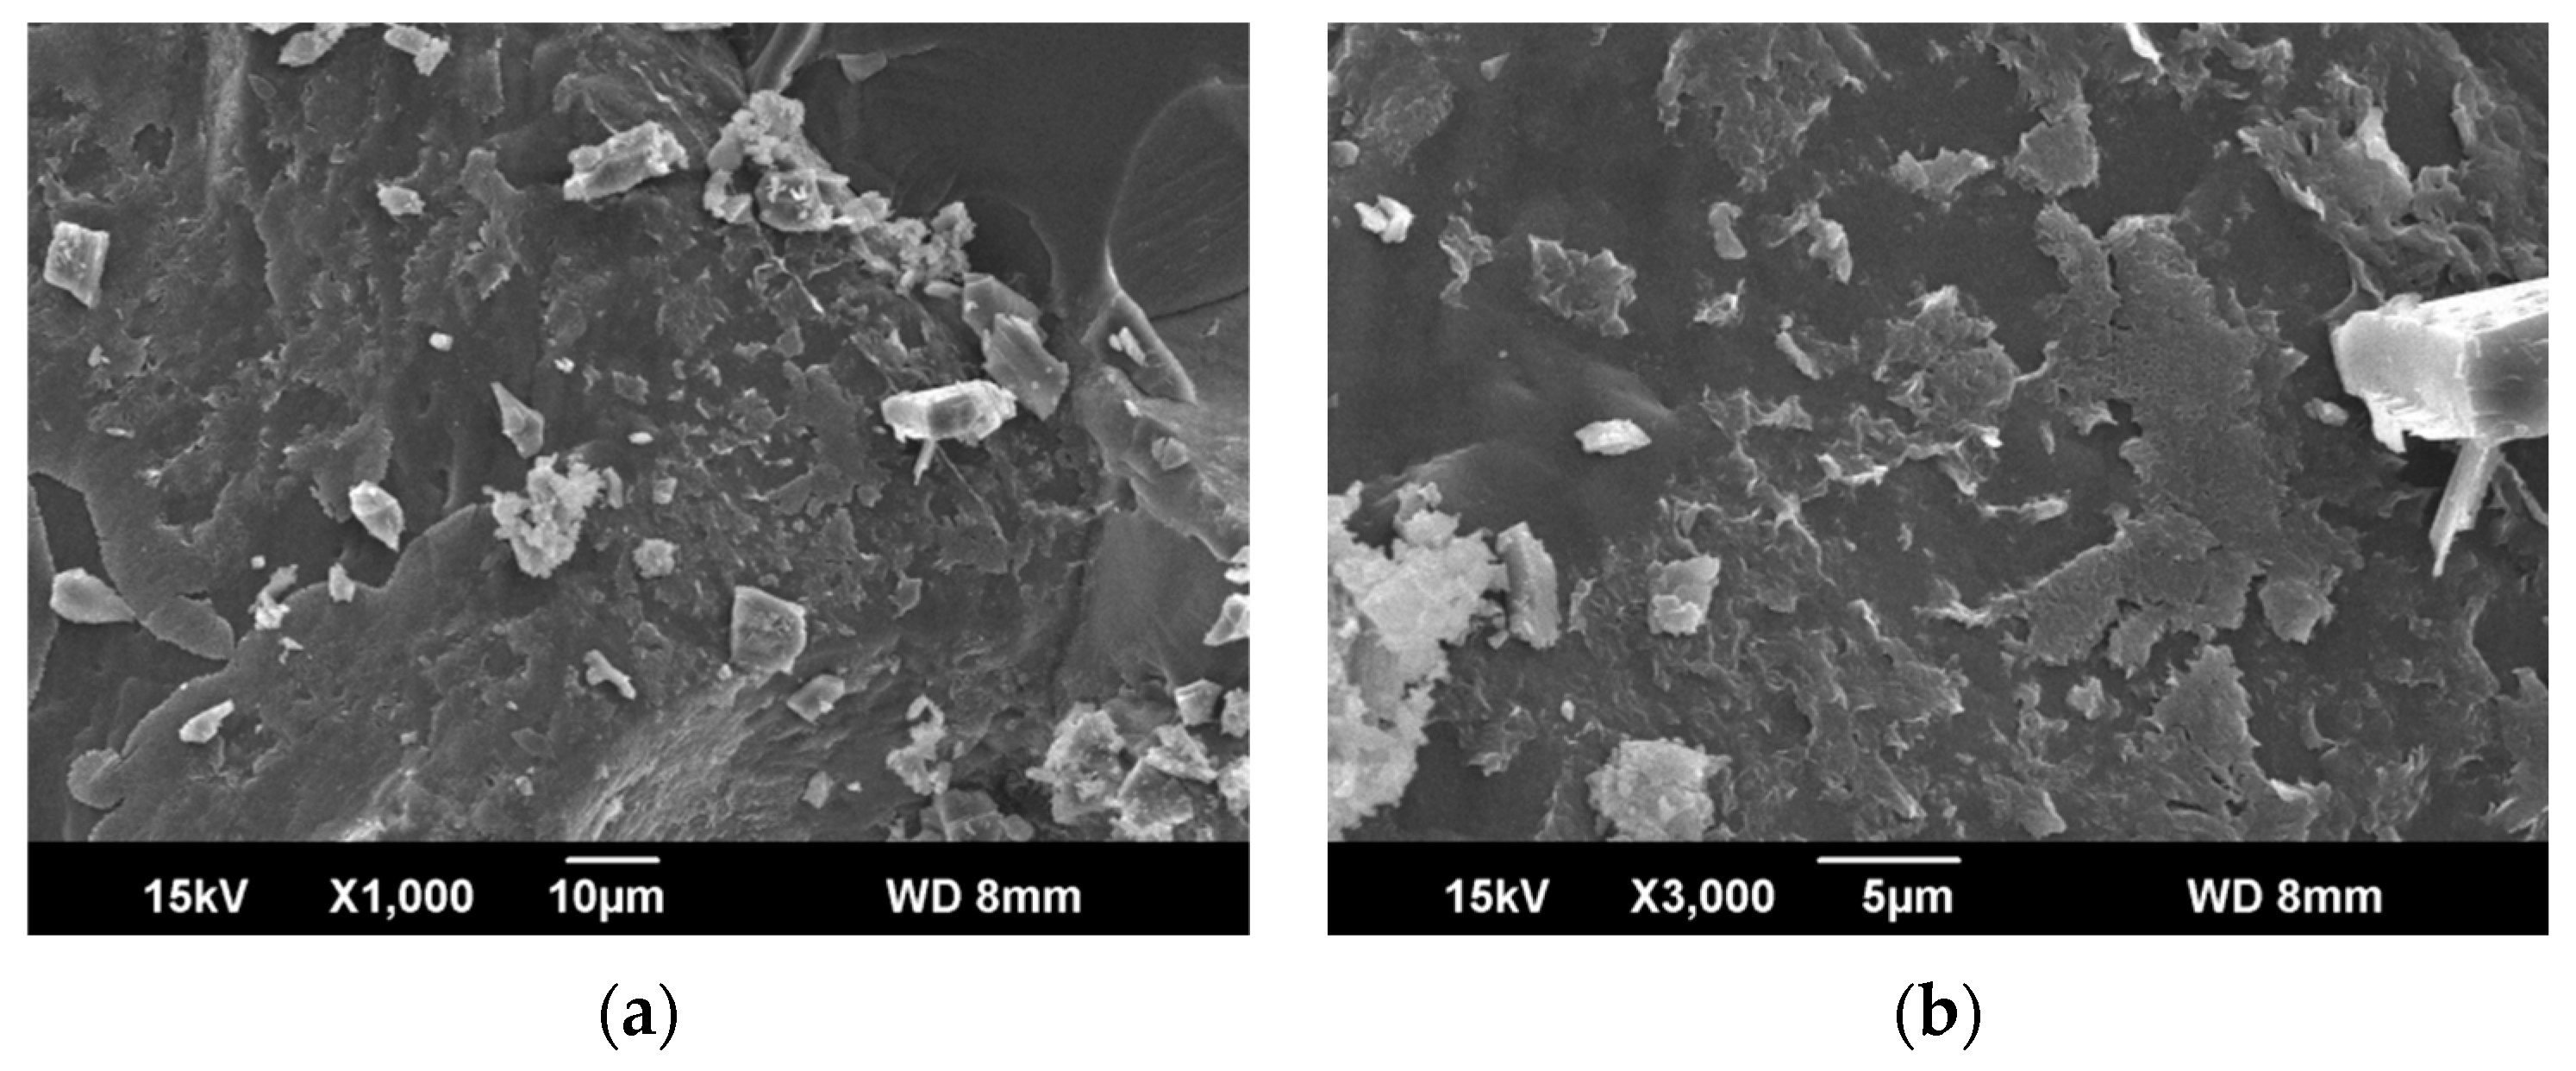
2.1. The Preparation of Tested Sample
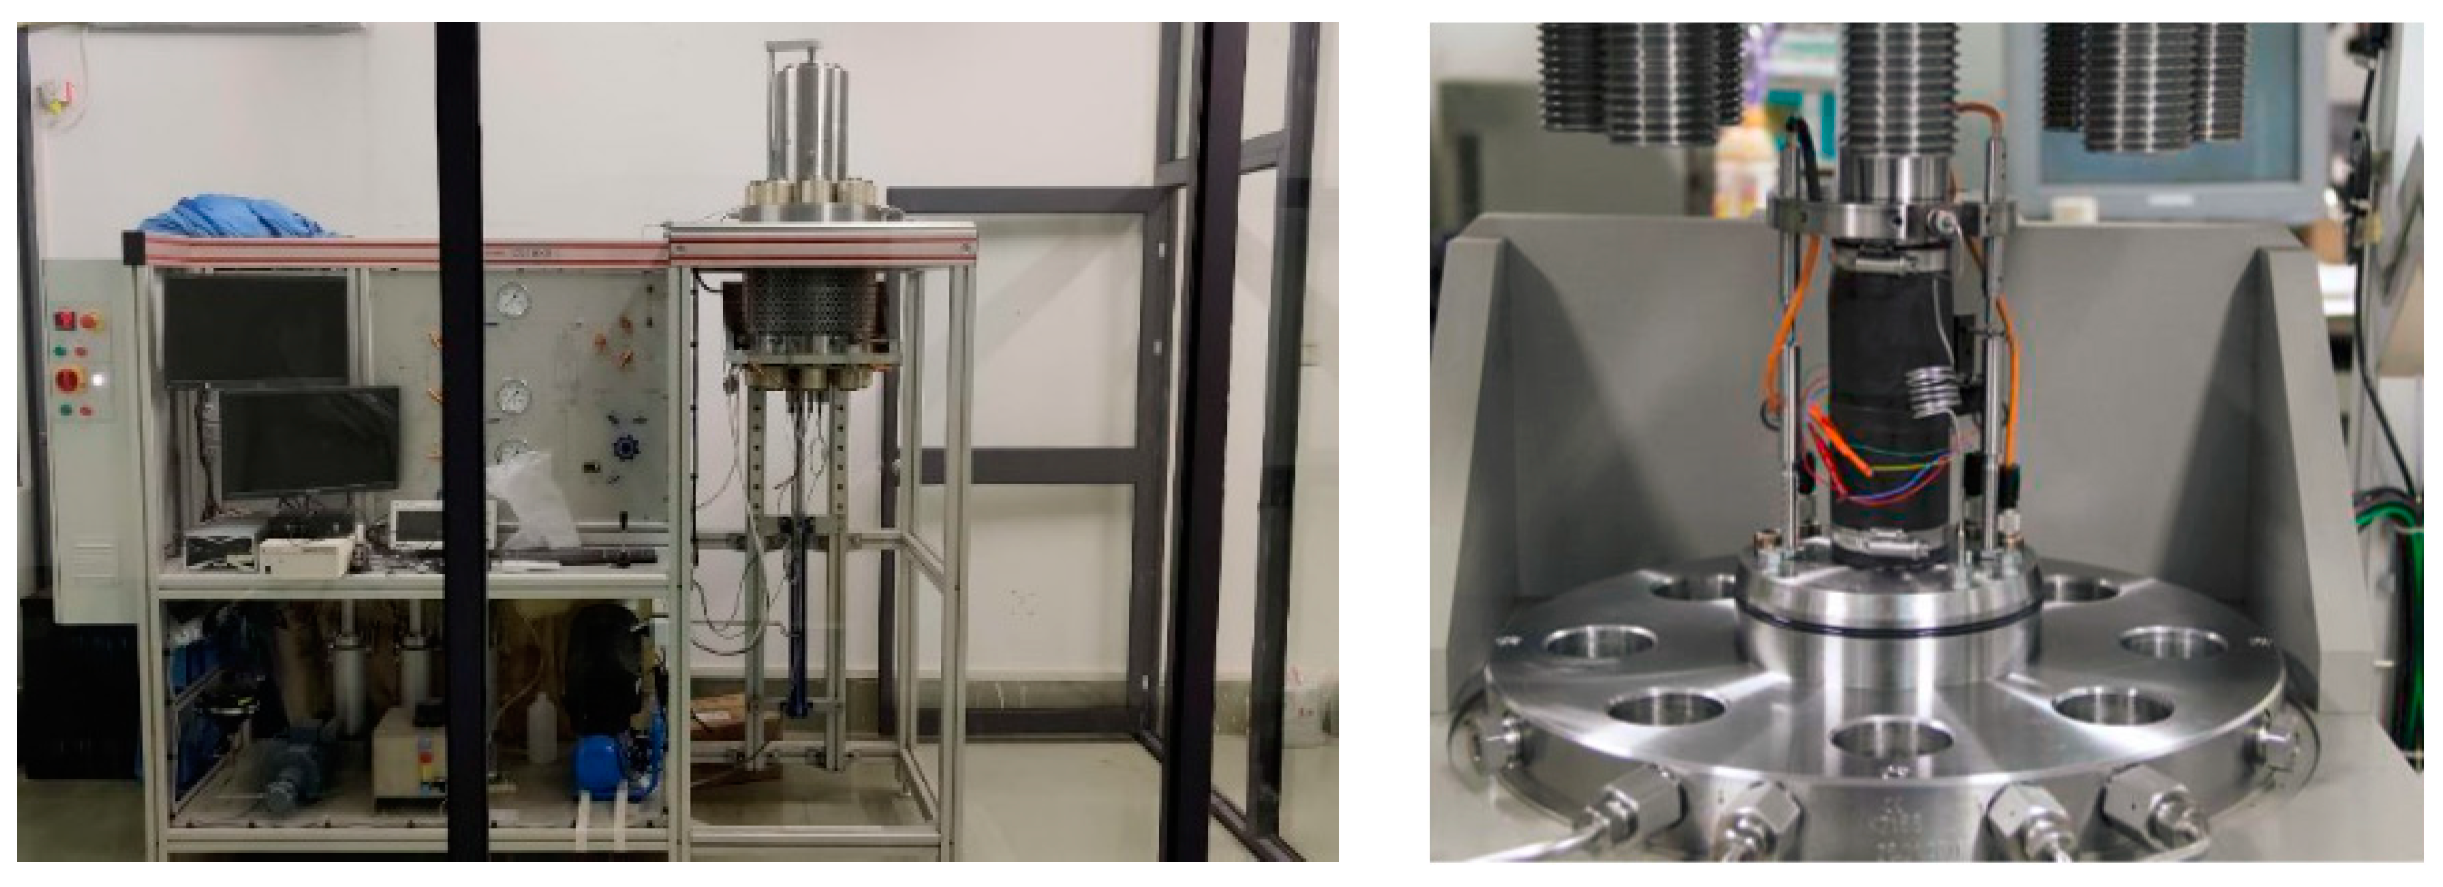
The density of the sandstone used for the test was 2.59 g/cm³, and it exhibited a greyish-white color, as depicted in Figure 1. Table 1 illustrates the main mineral elements in the content of the sandstone. The cylindrical sandstone samples used in the experiment have dimensions of ɸ50 mm × H100 mm, with a height-to-diameter ratio of 2.0. The flatness of the specimen at both ends is less than 0.05 mm. Scanning electron microscopy (SEM) was employed on the 2 cm × 2cm sandstone fragments to analyze the microstructure of the sandstone. The SEM images at different magnifications are shown in Figure 2. From the low-magnification image (1000×), it can be seen that the sandstone microscopic fine particles are tightly cemented and distributed in layers, and some of the compound particles are embedded in the surface layer of the cement.
Once all the specimens were numbered, weighed, and measured, they were subjected to a high-temperature oven at a constant temperature of 110 °C for 24 h. After the drying process, the specimens were removed and placed in a desiccator to cool to room temperature. For a hydro-mechanical test, the dried specimens were vacuum-saturated with water using a vacuum saturator.

2.2. Test Equipment

Figure 3 illustrates the Rock Top 50HT full-stress multi-field coupled triaxial tester system employed in this research. This system comprises three distinct sets of autonomous loading modules for an axial pressure loading system, confining pressure loading system, and seepage pressure loading system, respectively. The generation of both pressures is accomplished through a precision-oriented brushless servo-electronic controlled high-pressure pump, thereby allowing for the imposition of maximum axial pressure reaching 750 MPa, a maximum confining pressure of 60 MPa, and a peak seepage pressure of 60 MPa. Furthermore, this system enables real-time monitoring of both axial and circumferential deformation of the specimen. Throughout the experimental procedures, comprehensive data were automatically acquired at intervals of 5 s, subsequently archived within the computer repository for subsequent analysis and interpretation.

2.3. Experimental Principle

During this testing, the determination of permeability was carried out by employing the steady-state method, in accordance with the principles outlined by Darcy’s law. The expression as shown as follows:
K i = μ L Q i + 1 Q i A P i t i
where Ki is the mean permeability across a time span (m2); μ is the dynamic viscosity coefficient of water, which is 1.005 × 10⁻³ Pa.s under room-temperature conditions; L is the extent of water flow seepage; A is the cross-sectional area of water flow seepage (m2); ΔP is the disparity in seepage pressure spanning from one terminus of the specimen to the other, within the temporal interval Δt (MPa); Δt is the time span (s); and Qi and Qi+1 are the seepage quantities recorded at the i-th and i + 1-th data acquisition moments, respectively, quantified in millilitres (mL). By applying Darcy’s law and using the experimental data collected at different recording points, the average permeability of the sandstone can be determined.

2.4. Test Programme and Steps

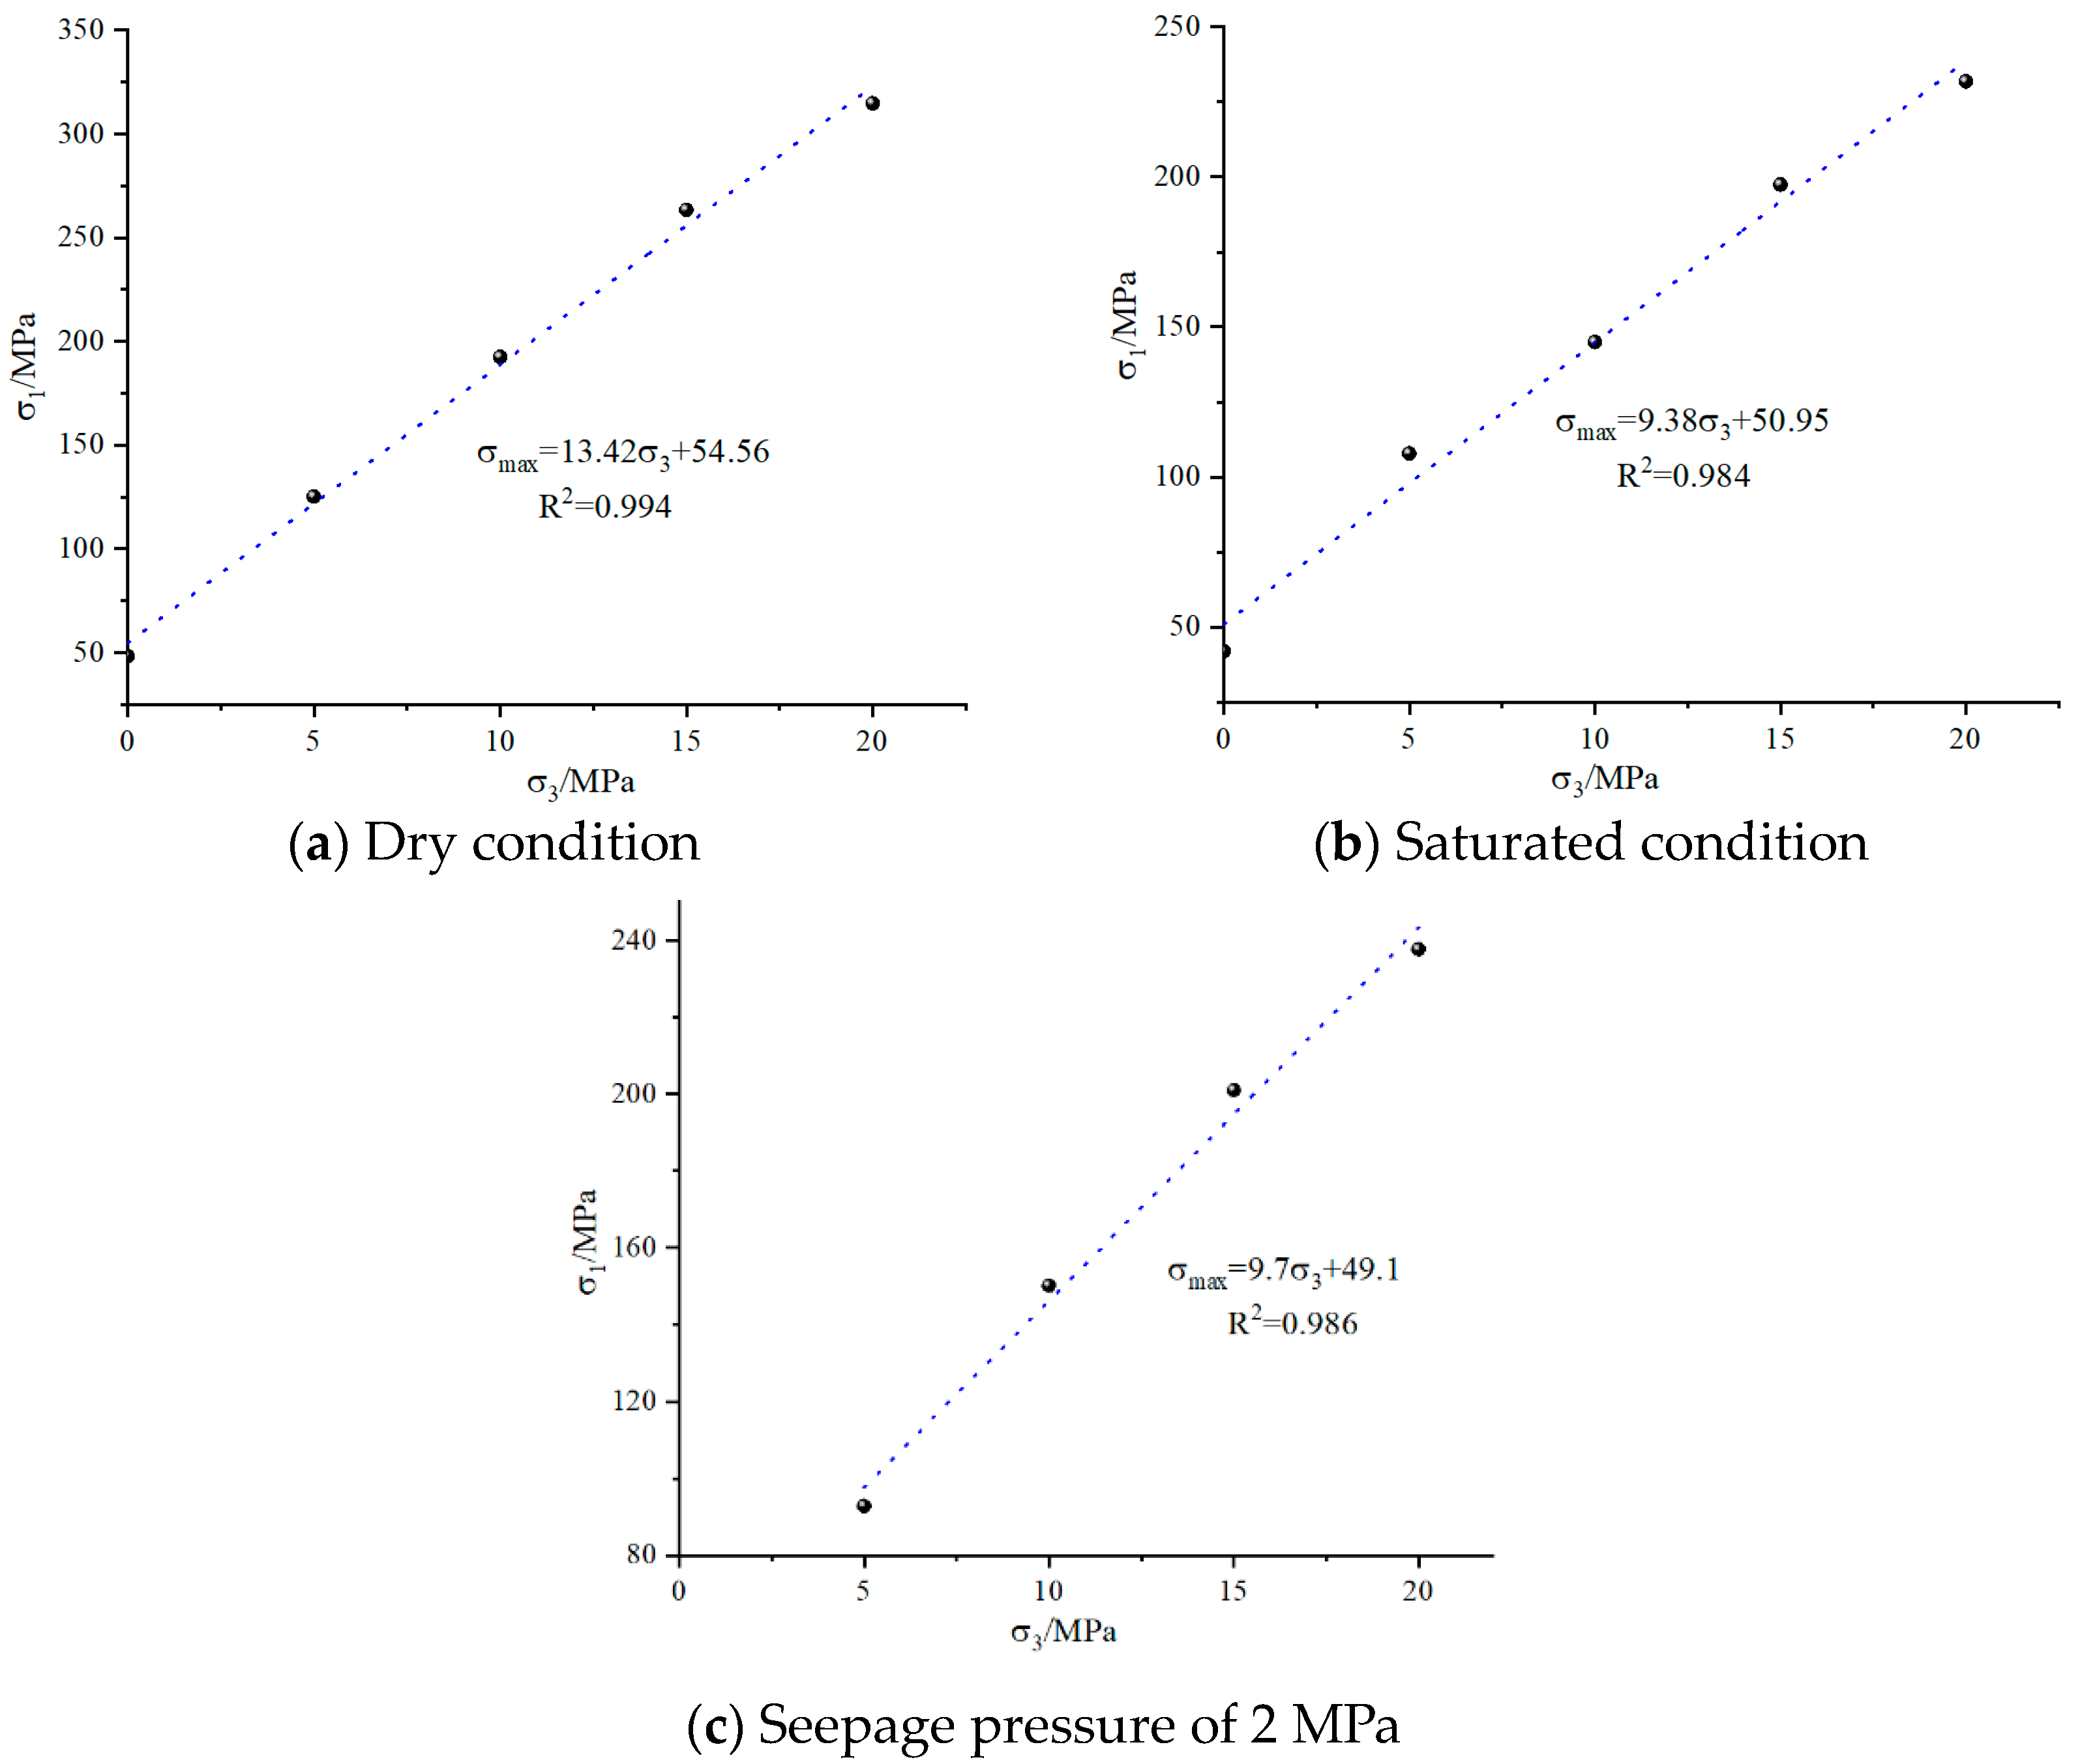
  • Under dry conditions, the uniaxial compressive strength of sandstone was determined to be 48.24 MPa, accompanied by a modulus of elasticity measuring 13.22 GPa and a Poisson’s ratio of 0.25. Conversely, when subjected to saturated conditions, the sandstone exhibited a reduced uniaxial compressive strength of 38.76 MPa, coupled with a modulus of elasticity of 15.42 GPa and a Poisson’s ratio slightly increased to 0.26.
  • The sandstone underwent triaxial compression tests in both dry and saturated states, along with different gradients of confining pressure, which provided a blank control group for the subsequent hydromechanical tests under saturation conditions. The following four gradients of confining pressure were utilized: 5, 10, 15, and 20 MPa.
  • Hydromechanical tests were carried out on sandstone, encompassing various magnitudes of confining pressure gradients and seepage pressure gradients. Confining pressure gradients of 5, 10, 15, and 20 MPa were established, while seepage pressure gradients of 2, 4, and 8 MPa were implemented, the test programme is shown in Table 2. The ensuing hydromechanical test procedures were executed according to the subsequent steps:
    • Firstly, the sandstone was secured in the triaxial pressure chamber and then the installation of the circumferential and axial sensors began in sequence.
    • Secondly, the confining pressure was applied to the sandstone automatically using a control system, gradually ramping it up from 0 MPa to the designated target value at a controlled rate of 1 MPa/min. Following the stabilization of the confining pressure, the seepage pressure was applied from the upper chamber, incrementally increasing from 0 MPa to the intended value at a controlled pace of 1 MPa/min. It is important to note that the seepage pressure within the lower chamber was maintained at atmospheric pressure throughout this process.
    • Thirdly, subsequent to achieving the targeted seepage pressure and ensuring its stability, the next step is to proceed to apply the deviatoric stress. This should be executed by applying a loading rate of 0.01 mm/min until the point of specimen failure is reached.

3. Analysis of Test Results

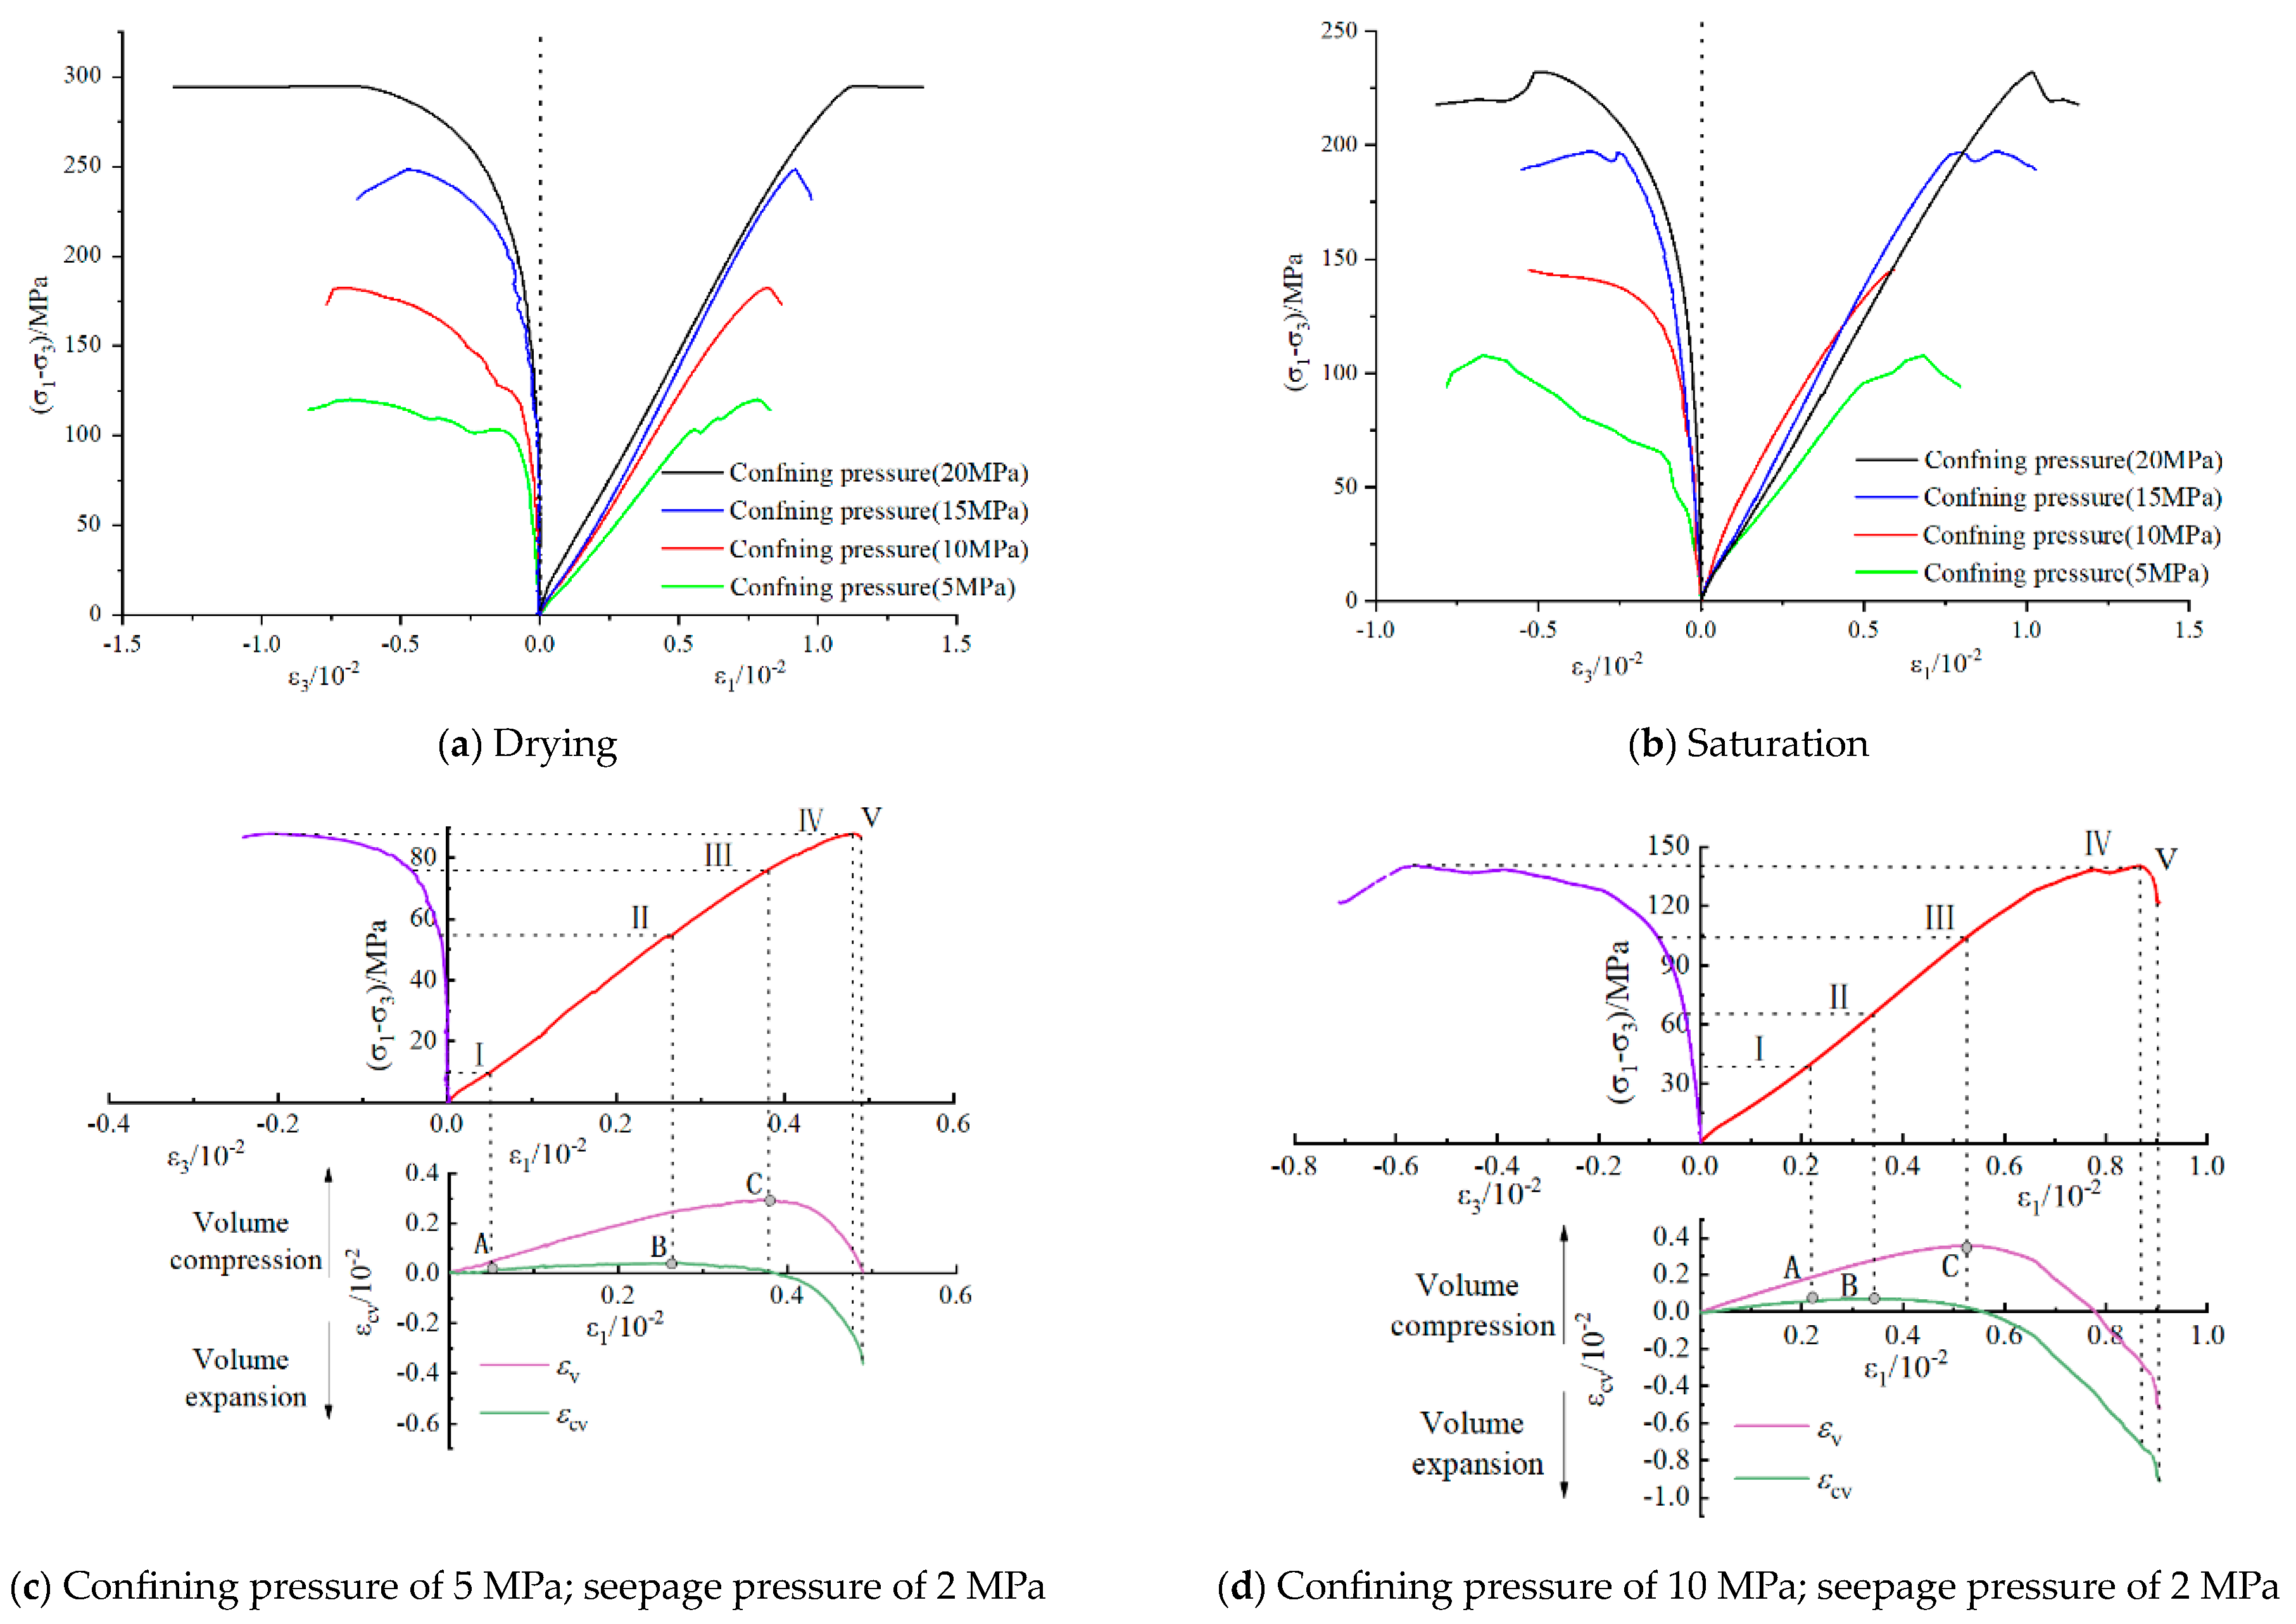
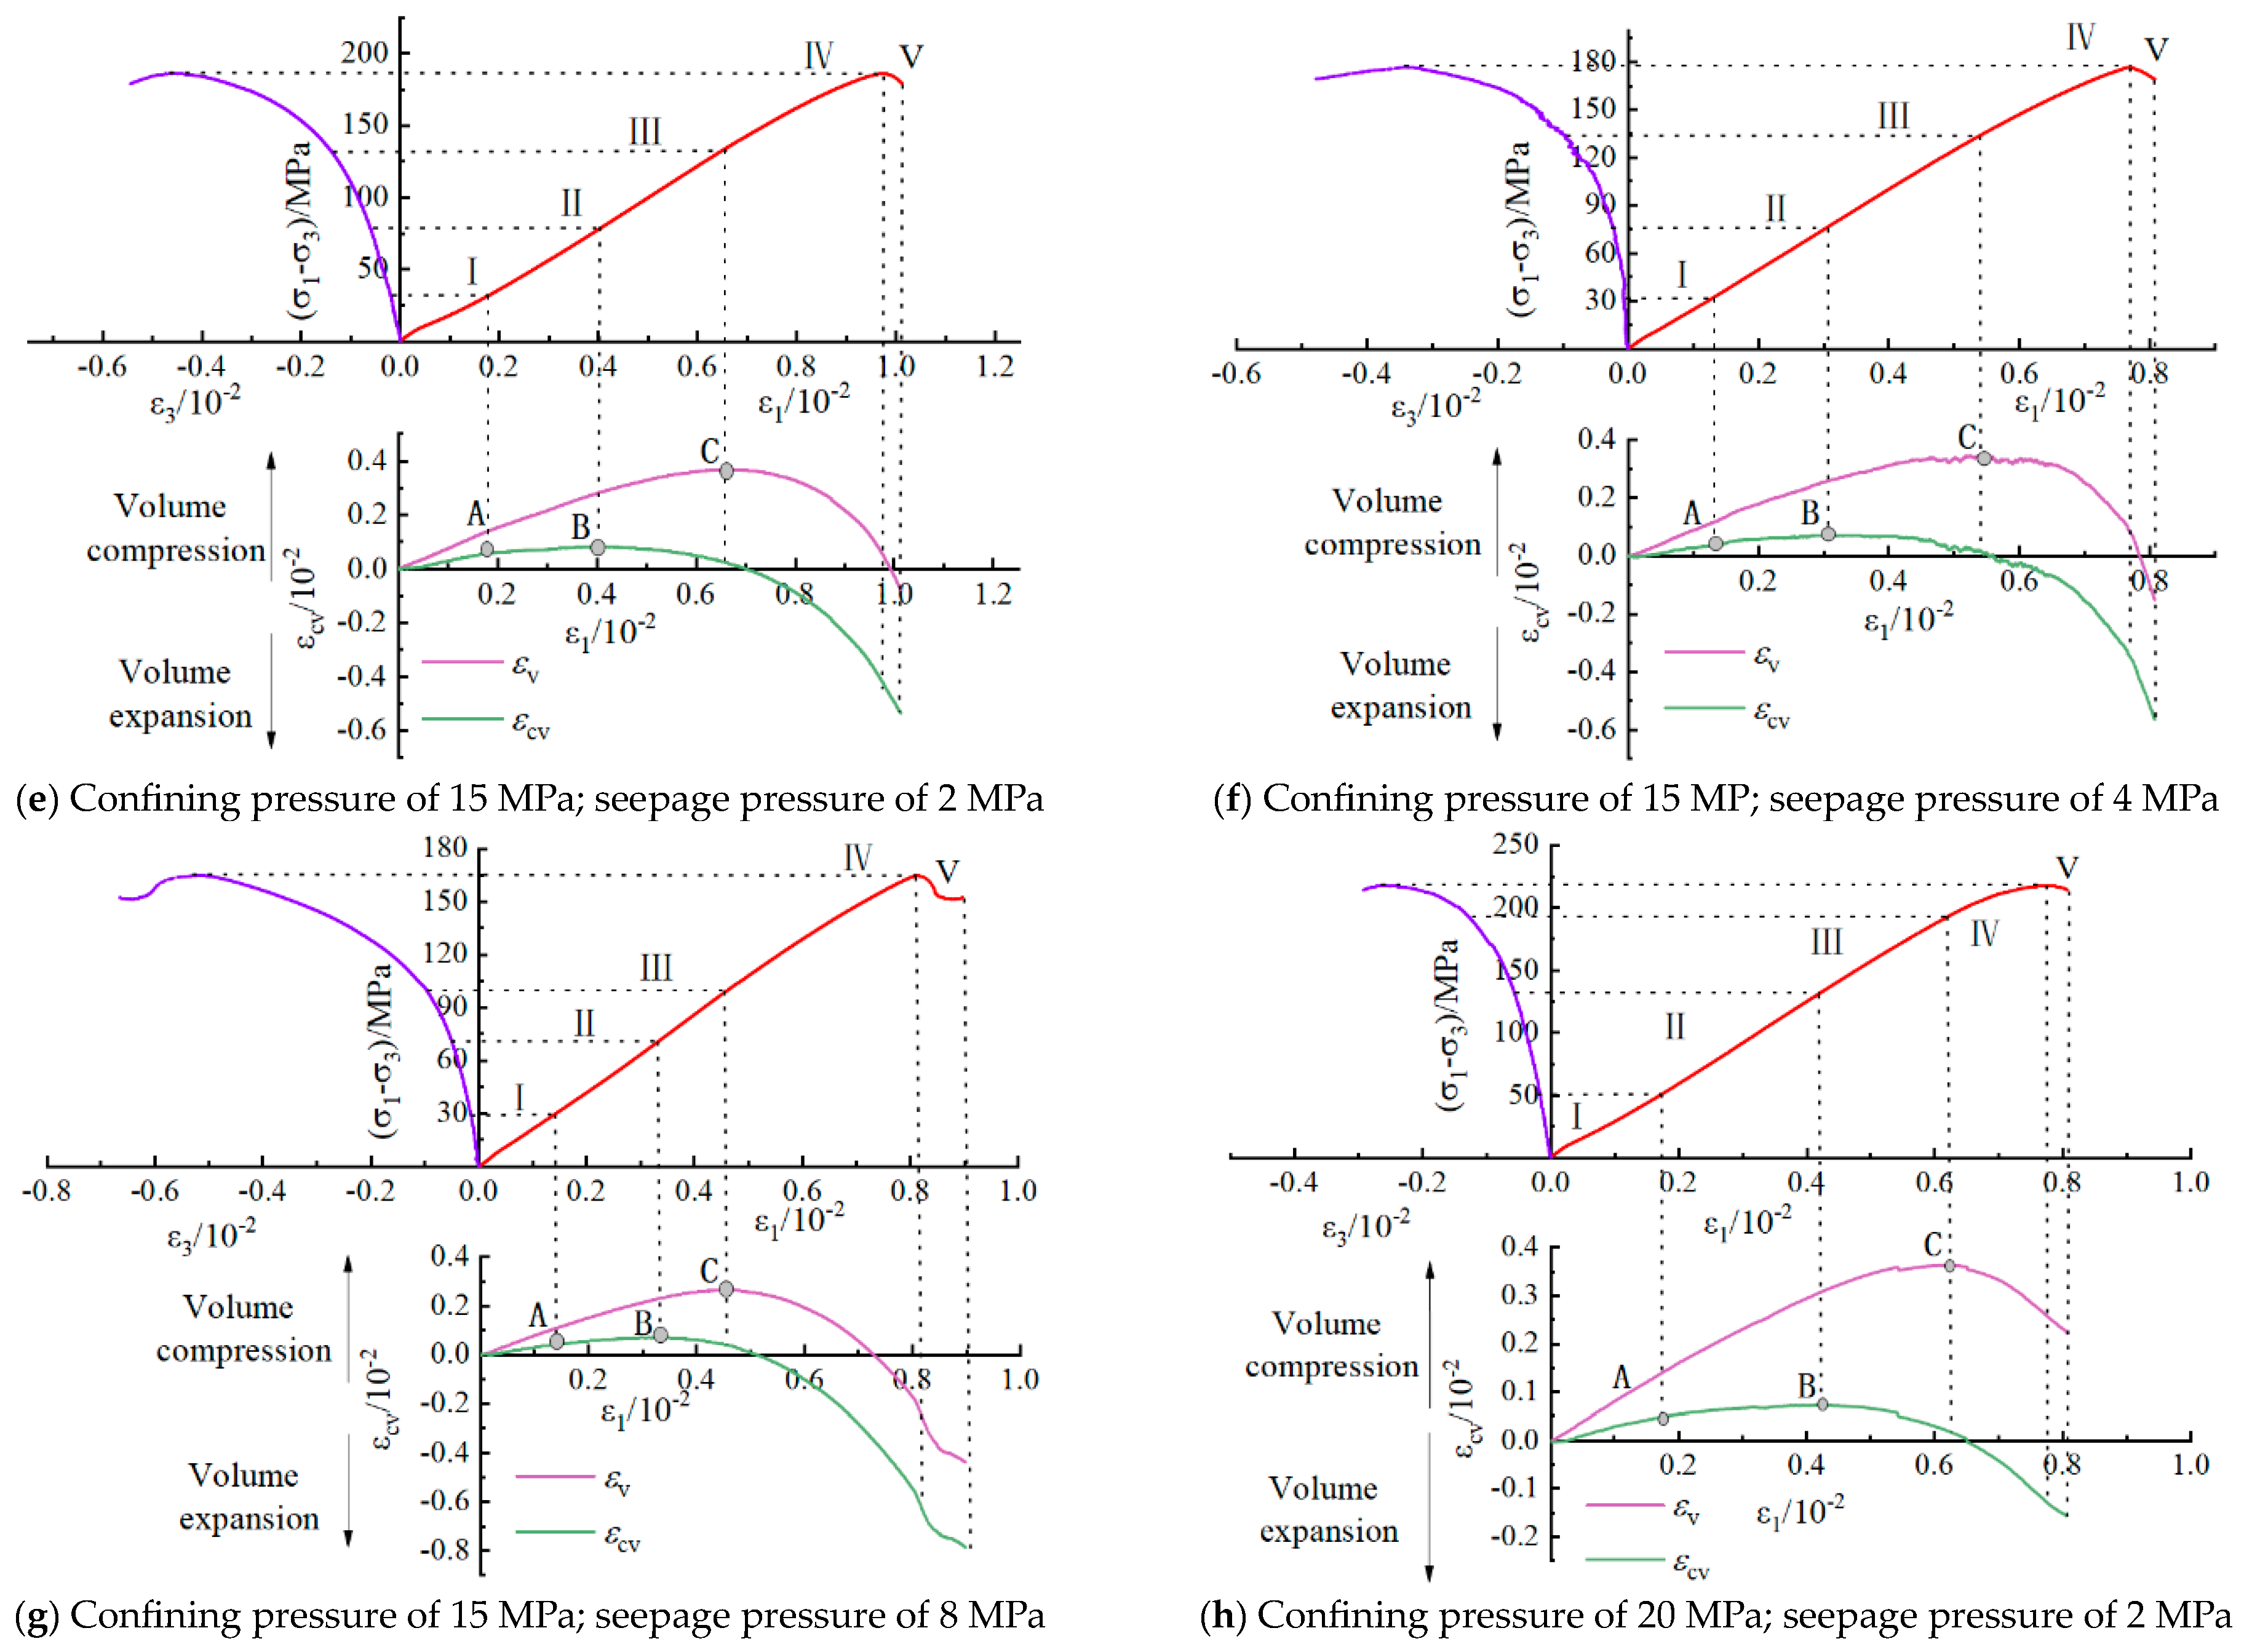
3.1. Stress–Strain Curve and Damage Characterization

The whole stress–strain behaviour of sandstone is the basis for studying its mechanical deformation characteristics, which show different physical significances in different yield stages. Figure 4 depicts the whole set of stress–strain curves of sandstone specimens under hydromechanical conditions. Observing Figure 4a–f, a distinct brittle behaviour is evident in the sandstone samples. As the confining pressure increases, a transition from brittle failure to ductile failure is discernible in the sandstone. This effect becomes notably pronounced, particularly under high confining pressures, accompanied by a noteworthy augmentation in the failure strength. At low confining pressures, the compression degree of fissures within the sandstone remains minimal. At this time, the crack tip area easily receives a high concentration of stress, which leads to the rapid development of cracks, and the sandstone is easily destroyed. Under elevated confining pressures, a substantial closure of micro-cracks is observed, the crack propagation is difficult, and the failure strength is larger. Under water-saturated conditions, the peak strength is reduced due to the weakening of water.
According to the crack volumetric strain method [23,24], the correlation between volume strain ( ε v ) and axial strain ( ε 1 ) can been examined, along with the relationship between crack strain ( ε c v ) and axial strain ( ε 1 ). The precise values of volume strain ( ε v ) and crack strain ( ε c v ) can be computed using the following equations:
ε v = ε 1 + 2 ε 3
ε c v = ε v ( 1 2 μ ) ( σ 1 σ 3 ) E
where ε 1 , ε 3 , and ε e v represent axial strain, circumferential strain, and elastic volume strain, respectively; σ1 and σ3 correspond to major and minor principal stress, respectively. Additionally, E and μ denote the elastic modulus and Poisson’s ratio, respectively.
The technique employed for determining the fracture closure stress of the rock involved the utilization of the axial strain difference approach. This method identifies the stress level at which the primary microfractures within the specimen achieve complete closure. The methodology is described by the following equations:
ε 1 = ε 1 ε c d σ c d σ 1 σ 3
where ε 1 represents the axial strain difference and ε c d is the axial strain associated with the threshold of crack damage stress σ c d .
According to different stress thresholds, the full stress–strain curve of sandstone can be segmented into five distinct stages as follows:
  • Stage I (microcrack closure stage): The internal primary pores and microcracks are closed in a compression manner, which is mainly the deformation of the weakest portion of the rock’s internal bearing capacity, and the deviatoric stress–axial strain curve at this stage has no obvious upward-concave characteristics. The relationship between deviatoric stress and axial strain appears as an approximately linear trend, characterized by an upper limit stress value which corresponds to the rock’s crack closure stress σ c c .
  • Stage II (linear elastic deformation stage): As deviatoric stress progressively escalates, the primary pores and microcracks within the rock continue to close and compact. During this phase, the stress–axial strain curve maintains a linear trend, with the upper stress limit signifying the onset of rock fracturing.
  • Stage III (stable crack expansion stage): The deviatoric stress–axial strain curve maintains an approximate linear pattern. However, the deviatoric stress–circumferential strain curve begins to exhibit nonlinear behavior as new cracks emerge within the specimen and gradually propagate in a stable fashion. The upper stress limit aligns with the crack damage stress.
  • Stage IV (cracks non-stationary expansion stage): The microfracture increases rapidly, and progressive damage occurs within the rock sample. As the volumetric strain enters an expansion phase, the stress–strain curve demonstrates pronounced nonlinearity. The upper stress value in this context corresponds to the peak strength of the sandstone σ c .
  • Stage V (post-peak strain and damage stage): At the point where the deviatoric stress reaches its maximum, the internal structure undergoes complete disruption. Fissures rapidly propagate, culminating in the formation of a macroscopic fracture surface. The overall deformation is primarily characterized by shear-slip damage along this fracture surface. Subsequently, stress diminishes progressively with the augmentation of strain.
Based on the findings presented by Zhao et al. [19] and Yang et al. [25], it is known that the fracture modes of rocks are single shear, conjugate shear, shear–tension combination, and cleavage. The damage patterns of sandstone under various combinations of confining pressures and seepage pressures were obtained, as shown in Figure 5, Figure 6, Figure 7 and Figure 8. Most of them are monoclinic shear damage throughout the whole sandstone, while it is tensile splitting at uniaxial compression. In summary, it can be deduced that the damage pattern exhibited by sandstone is notably characterized by brittleness, with minimal evidence of volumetric expansion. The shear damage surface appears sleek, while an abundance of granular fragments is observable.

3.2. Strength Characteristics

Researchers have explored the strength characteristics of rocks from various perspectives. Zhang et al. [26] examined the evolutionary attributes of sandstone’s peak strength concerning confining pressure or effective confining pressure across both dry and saturated conditions. Zhang et al. [27] investigated the impact of intermediate principal stresses on rock strength by utilizing the M-C strength criterion. The research explores the strength parameters of sandstone under dry and saturated conditions, such as cohesion and internal friction, as determined by the following Equations (5) and (6), the result as shown in Table 3.
c = n 2 m
φ = t a n 1 ( m 1 2 m )
where c and φ represent the cohesion and the angle of internal friction, respectively. m and n denote fitting parameters.
As depicted in Figure 9, an evident linear growth pattern in the peak strength of sandstone is observed with escalating confining pressures across distinct conditions. It is discernible that the strength characteristics of sandstone are significantly influenced by variations in the confining pressure. When comparing saturated sandstone to its dry counterpart, the cohesion of the former experiences a notable increase of 12.2%, while the angle of internal friction undergoes a reduction of 9.6%. Furthermore, under saturated conditions, the osmotic pressure effect on sandstone strength is apparent due to the weakening influence of water. Specifically, in contrast to a seepage pressure of 0 MPa, the cohesion of saturated sandstone under a seepage pressure of 2 MPa displays a reduction of 4.8%, while the angle of internal friction registers a marginal increase of 1.1%.

3.3. Permeability Characteristics

3.3.1. Relationship between Permeability and Axial Stress–Strain

During the triaxial compression process, permeability is closely associated with various deformation stages within the rock sample, such as initiation, propagation, and connection of internal fractures. To further investigate the evolution of the axial stress–strain-permeability response under the coupling of fluid flow and stress, this investigation undertakes an exhaustive analysis of the axial strain, volumetric strain, and permeability reactions exhibited throughout the complete deformation progression of sandstone under varying conditions. The distinctive correlation between permeability and axial stress–strain is visually represented in Figure 10.
Within the permeability evolution curve of sandstone, six critical permeability values are identified: (1) initial permeability under static hydrostatic pressure (k0); (2) minimum permeability (kmin); (3) permeability at the maximum volumetric compression point (kc); (4) permeability at the zero volumetric strain point (kz); (5) permeability at the peak stress point (ks); (6) maximum permeability (kmax).
In accordance with the insights gleaned from Figure 11 and Table 4, a discernible trend emerges in permeability evolution during the deformation phases of sandstone specimens under diverse conditions. This trend unfolds in four distinctive stages: gradual decrease, steady development, gradual increase, and rapid growth. These stages showcase a marked correspondence with the micro-fracture closure phase, linear elastic deformation phase, fracture development and propagation phase, and post-peak strain and failure phase, as discerned from the corresponding sandstone deviatoric stress–axial strain curves. For instance, in the case of a pore pressure of 2 MPa and a confining pressure of 10 MPa, the permeability of the sandstone sample gradually decreases from the initial permeability K0 of 1.21 × 10⁻¹⁷ m2 to the minimum permeability Kmin of 0.79 × 10⁻¹⁷ m2, then stabilizes and gradually increases to a Kc of 1.89 × 10⁻¹⁷ m2, and finally rapidly increases to a Ks of 5.27 × 10⁻¹⁷ m2, reaching the maximum permeability Kmax of 13.8 × 10⁻¹⁷ m2 at the post-peak stage. Comparing Kmax and Kmin, there is a two-order-of-magnitude difference, and, compared with K0, there is a one-order-of-magnitude difference. This effect becomes more pronounced with lower confining pressures under the same pore pressure, for instance, at a pore pressure of 2 MPa and confining pressures of 15 MPa, the initial permeability K0 significantly increases compared with the state with a confining pressure of 10 MPa, primarily due to variations in the degree of development of inherent microcracks within the rock.
Prior to the commencement of deviatoric stress loading, elevated confining pressures result in a reduction of the initial permeability, denoted as K0. Notably, the permeability of sandstone is predominantly influenced by the confining pressure, which corresponds to the disparity between the actual confining pressure and the pore pressure. As the confining pressure increases, the radial inhibitory effect on the rock sample intensifies, leading to densification of inherent micro-fractures within the sandstone, resulting in reduced openness of these fractures. This phenomenon induces a constriction and diminishment of fluid flow pathways, consequently yielding a gradual decline in permeability. The connection between fracture advancement and permeability across distinct loading stages can be delineated as follows:
(1)
With the initial loading of deviatoric stress, the combined effect of confining pressure and deviatoric stress leads to further closure of pores and micro-fractures within the rock. As new fluid flow pathways have yet to establish, a gradual decrease in permeability ensues until the point of minimum permeability Kmin becomes evident.
(2)
During the linear elastic deformation stage, the sandstone approaches an elastic behaviour, where the fracture aperture remains approximately unchanged or slightly decreases. Fluid flow channels remain relatively constant or narrow in width, leading to a near-constant or slightly reduced permeability.
(3)
In the phase of stable crack propagation, the newly formed fractures within the sandstone have minimal aperture and connectivity. The rock undergoes a shift from volume compression to volume expansion. This phase corresponds to the maximum volumetric compression point permeability Kc, where the inhibitory effect of confining pressure weakens and permeability gradually increases.
(4)
During the phase characterized by unstable crack propagation, the interconnection of internal fractures intensifies, thereby leading to a substantial augmentation in the count of fluid flow pathways and the rapid escalation of permeability. The permeability Ks is observed at the peak stress point. Upon complete failure of the sandstone, macroscopic interconnected fractures form, leading to shear failure along these interconnected fractures, resulting in the maximum permeability Kmax.
To comprehensively dissect the permeability evolution pattern within sandstone, this study proceeds to delve into the analysis of permeability at distinct stress thresholds, as delineated in Table 5. The permeability associated with the closure stress of rock fractures, denoted as Kcc, and the permeability corresponding to the initiation of fracturing stress, denoted as Kci, are analysed in depth. Combining Table 4 and Table 5 reveals that the difference between Kcc and the minimum permeability Kmin for different conditions is negligible. During the micro-fracture closure and linear elastic deformation phases, the permeability Kcc can be considered as equivalent to the minimum permeability Kmin. The permeability Kci, associated with the initial state of rock fracturing, is lower than the value of Kc due to the relatively underdeveloped nature of fluid flow pathways.

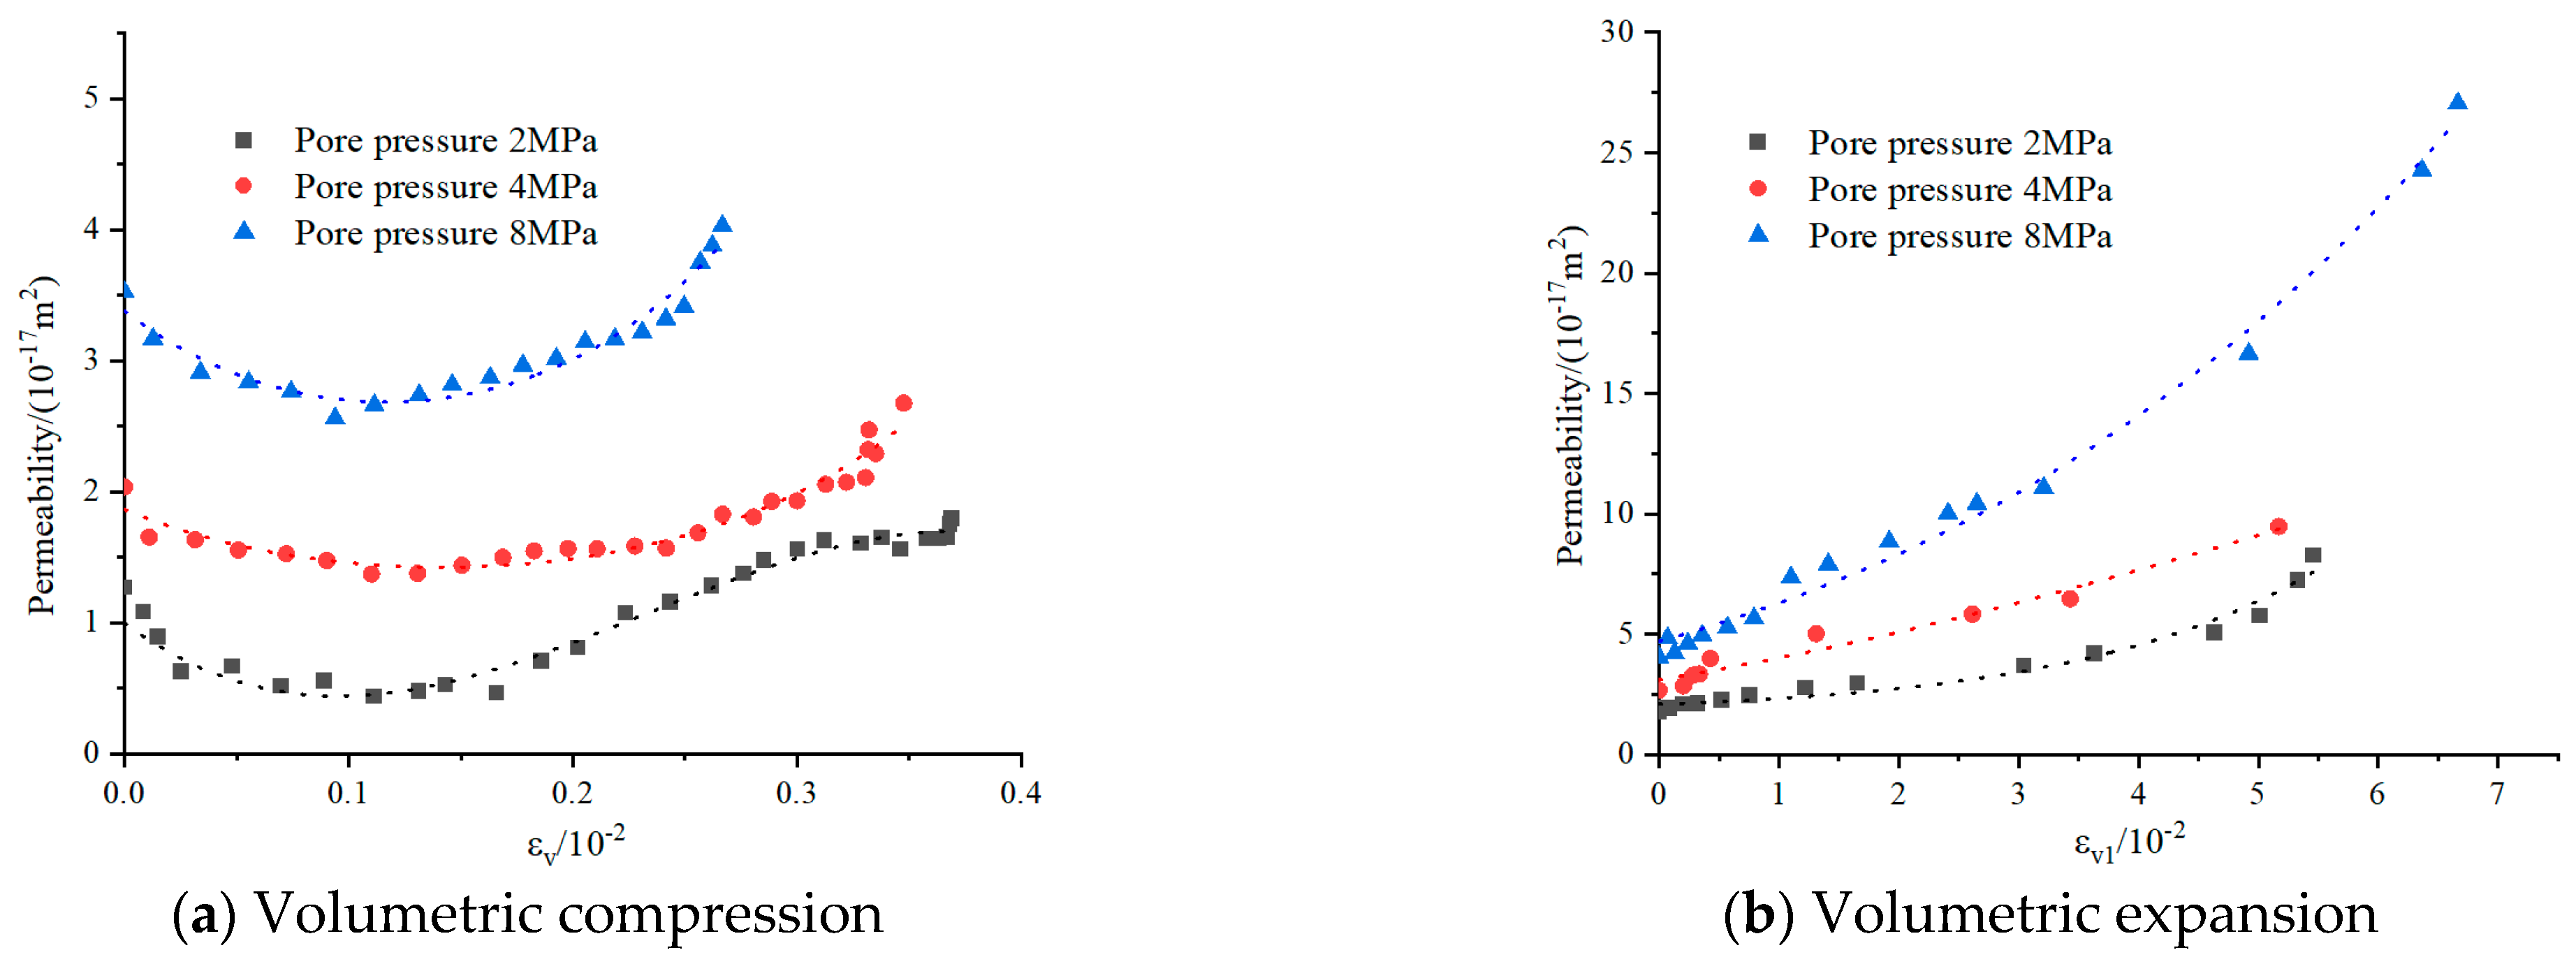
3.3.2. Relationship between Permeability and Volumetric Strain

Throughout the experimental procedure, the evolution of volumetric strain in sandstone unfolds in two discernible stages: volumetric compaction and volumetric expansion. The transitional periods of permeability closely align with these volumetric strain stages. Figure 12 presents the permeability–volumetric strain curves spanning the entirety of the stress–strain progression under varied conditions. Throughout the deformation process of sandstone, the permeability exhibits a distinct pattern of gradual decrease, steady development, gradual increase, and rapid growth, which correlates well with the four stages of sandstone deformation: slow volumetric compression, rapid volumetric compression, rapid volumetric expansion, and slow volumetric expansion. For instance, under conditions of a pore pressure of 2 MPa and a confining pressure of 15 MPa, during the stage of volumetric compaction, due to the weaker radial expansion of the sandstone compared to axial compression, the sandstone undergoes micro-fracture closure, linear elastic deformation, and stable fracture expansion. The predominant deformation in this stage is axial compression, leading to a gradual transition of internal pores and micro-fractures from slow compression to slow expansion. Consequently, the fluid flow pathways within the sandstone expand slowly, yielding a progressive increase in permeability.
Interestingly, the rock sample’s minimum permeability does not coincide with the moment of peak volumetric compaction (which is the inflection point between the compression stage and the expansion stage), but rather precedes the inflection point of volumetric strain. Under the same pore pressure, with an increase in confining pressure, the minimum permeability Kmin and the permeability at the maximum volumetric compression point Kc gradually approach each other. After the point of compaction (in the stage of rapid volumetric expansion), as the sandstone undergoes rapid volumetric expansion, the aperture of newly formed fractures within the rock increases, resulting in an augmented number of fluid flow pathways and a rapid increase in permeability. It is evident from Figure 12 that the maximum permeability Kmax of the sandstone is achieved only subsequent to the rock reaching its peak strength, displaying a distinct lag effect.
Indeed, the preceding discussion highlights the intricate interrelationship between rock permeability and volumetric strain. To further advance the analysis of fluid flow–stress coupling, the variation in permeability with volumetric strain during the stages of volumetric compression and expansion, with a confining pressure of 15 MPa and differing pore pressure differentials of 2, 4, and 8 MPa, was subjected to fitting. The volumetric strain during the expansion stage is considered as a relative value of volumetric expansion:
ε v 1 = ε v r ε v 0
where ε v 1 is the relative value of the volumetric expansion strain, ε v r   is the maximum volumetric compression strain, and ε v 0 is the volumetric expansion.
In the volumetric compression stage, the evolution of sandstone permeability is depicted in Figure 13a. At a pore pressure of 2 MPa, the relationship between permeability and volumetric strain is described using a cubic polynomial:
K = A ε v 3 + B ε v 2 + C ε v + 1
where, A, B, and C are fitting parameters.
For pore pressures of 4 and 8 MPa, as well as the volumetric expansion stage, the permeability evolution patterns with volumetric strain are illustrated in Figure 13b. The relationship between permeability and volumetric strain is modeled using an exponential function:
K = exp E ε v 2 + F ε v + G
where, E, F, and G are fitting parameters.
Table 6 demonstrates the equation coefficients of the relationship between permeability and volumetric strain at different void pressures. As can be seen from the table, the permeability of sandstones is affected by stress during both the volumetric compression and expansion phases, but there is some variation in the manner and extent of this effect.

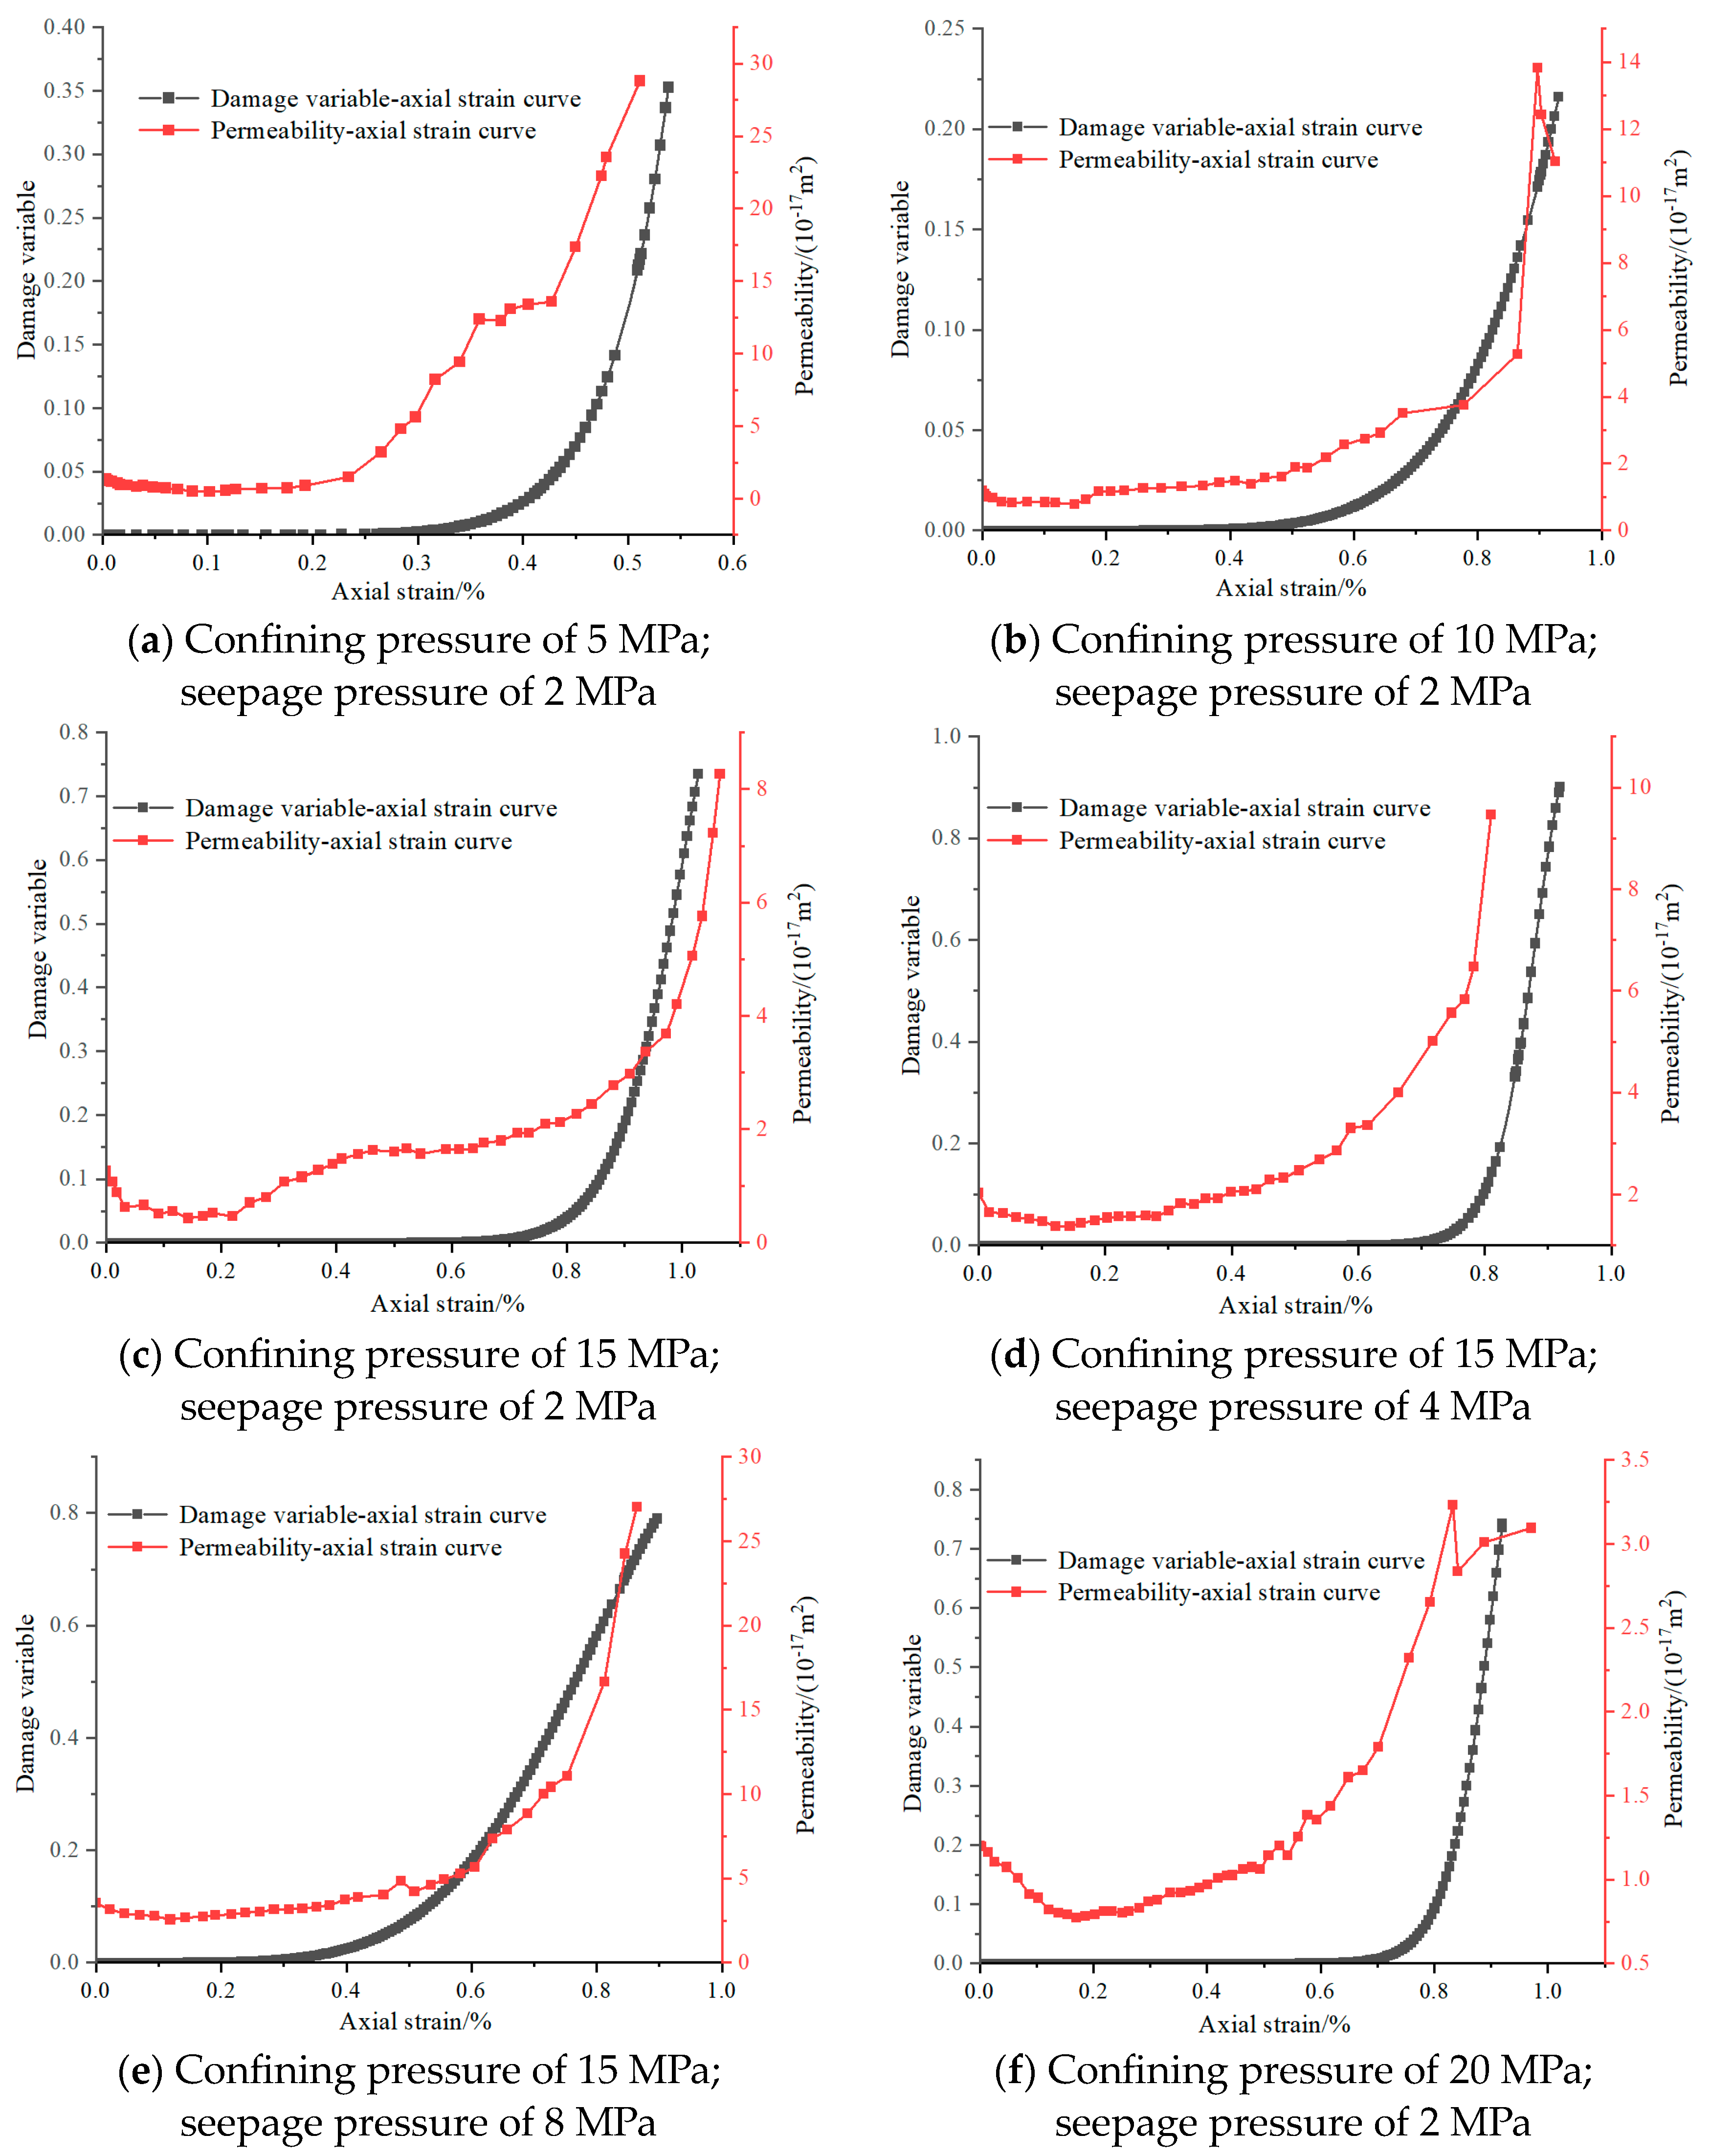
3.4. Analysis of Rock Damage Evolution

Throughout the failure process, a considerable number of newly generated fractures exist within the rock, accompanied by evolving damage within the sample. The introduction of the damage variable D is paramount. Assuming that the microstructural strength of the rock follows the Weibull distribution, the amalgamation of statistical theory and damage mechanics gives rise to a statistical damage expression:
D = 1 e x p 1 ε ε 0 s
where D represents the damage variable, ε is the strain, and s and ε0 are parameters of the Weibull distribution.
The Weibull distribution parameters are predicated on the distinctive features exhibited by the peak of the deviatoric stress–axial strain curve:
s = 1 l n E ε c σ c 2 μ σ 3
ε 0 = ε c s 1 s
where E is the elastic modulus, μ is the Poisson’s ratio of the sandstone, σ3 is the confining pressure, and σc and εp are the peak stress and peak strain, respectively.
The evolution curves of axial strain, the damage variable, and permeability under different conditions are shown in Figure 14a–f. During the stages of micro-fracture closure and linear elastic deformation, where new voids and micro-fractures have yet to form, and due to the increased circumferential confinement experienced by the rock sample, both permeability and damage variable changes are relatively gradual, with the damage variable nearly approaching zero. In the phase of crack propagation, with increasing loads, newly generated fractures emerge, causing the damage variable to increase slowly, leading to a corresponding increase in permeability. The change rate of the damage variable demonstrates a strong correlation with the corresponding alteration in permeability, revealing that the variation in the damage variable mirrors the development of internal fractures within the rock specimen. The evolution of rock permeability is closely linked to the development of its internal cracks and fractures. Hence, a higher damage rate within the specimen corresponds to a swifter alteration in permeability.

4. Conclusions

To explore the deformation behavior, permeability attributes, and damage progression of sandstone in both dry and saturated conditions, a series of hydromechanical tests were conducted. The following conclusions were drawn:
(1)
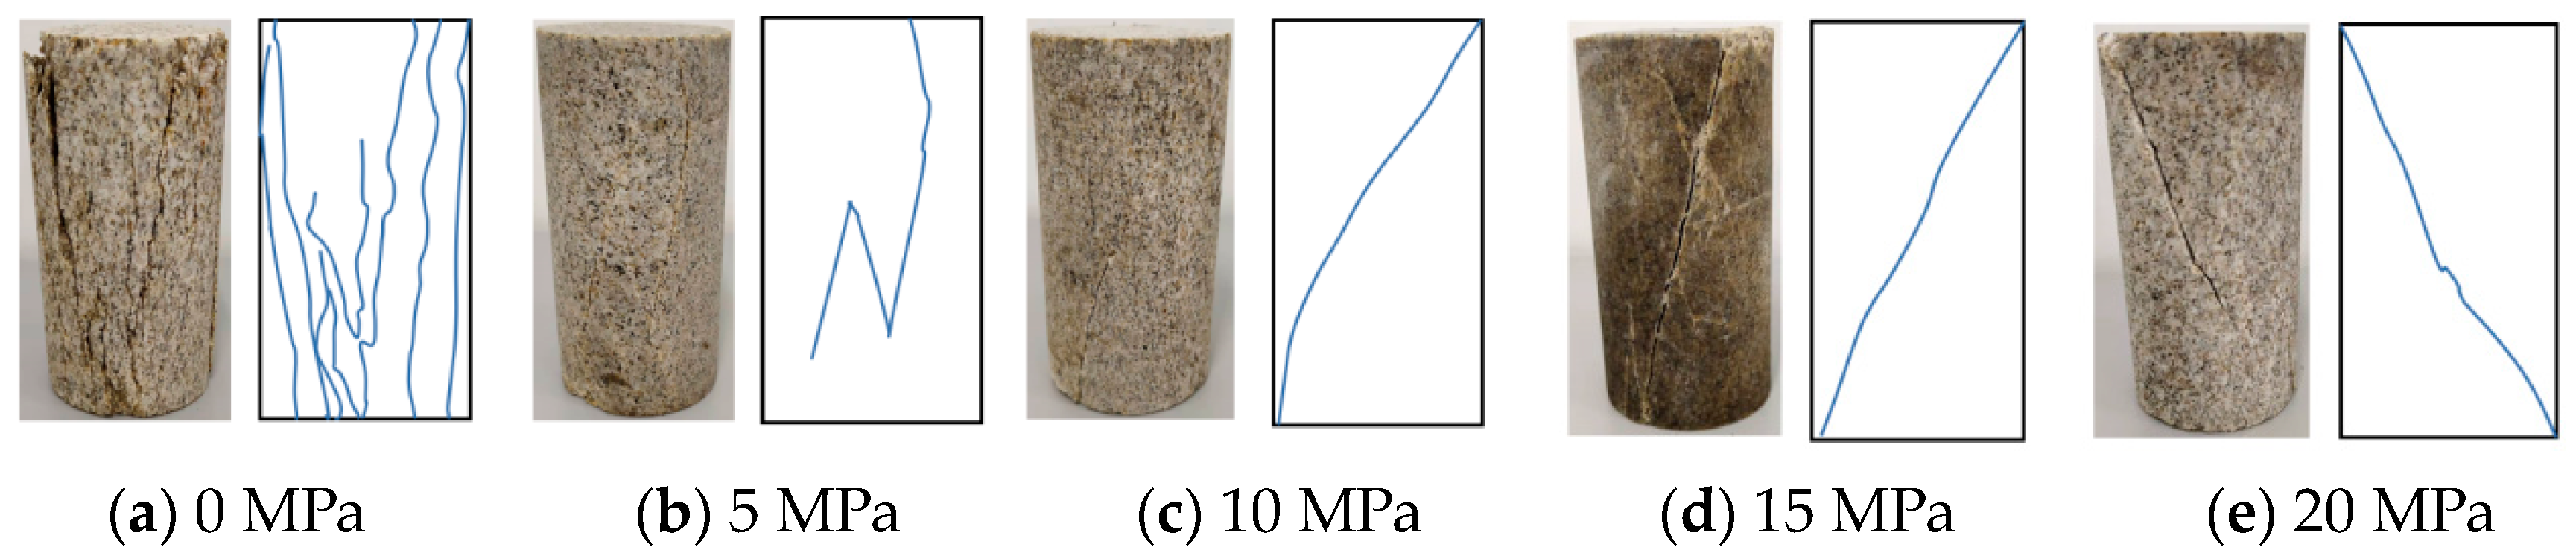
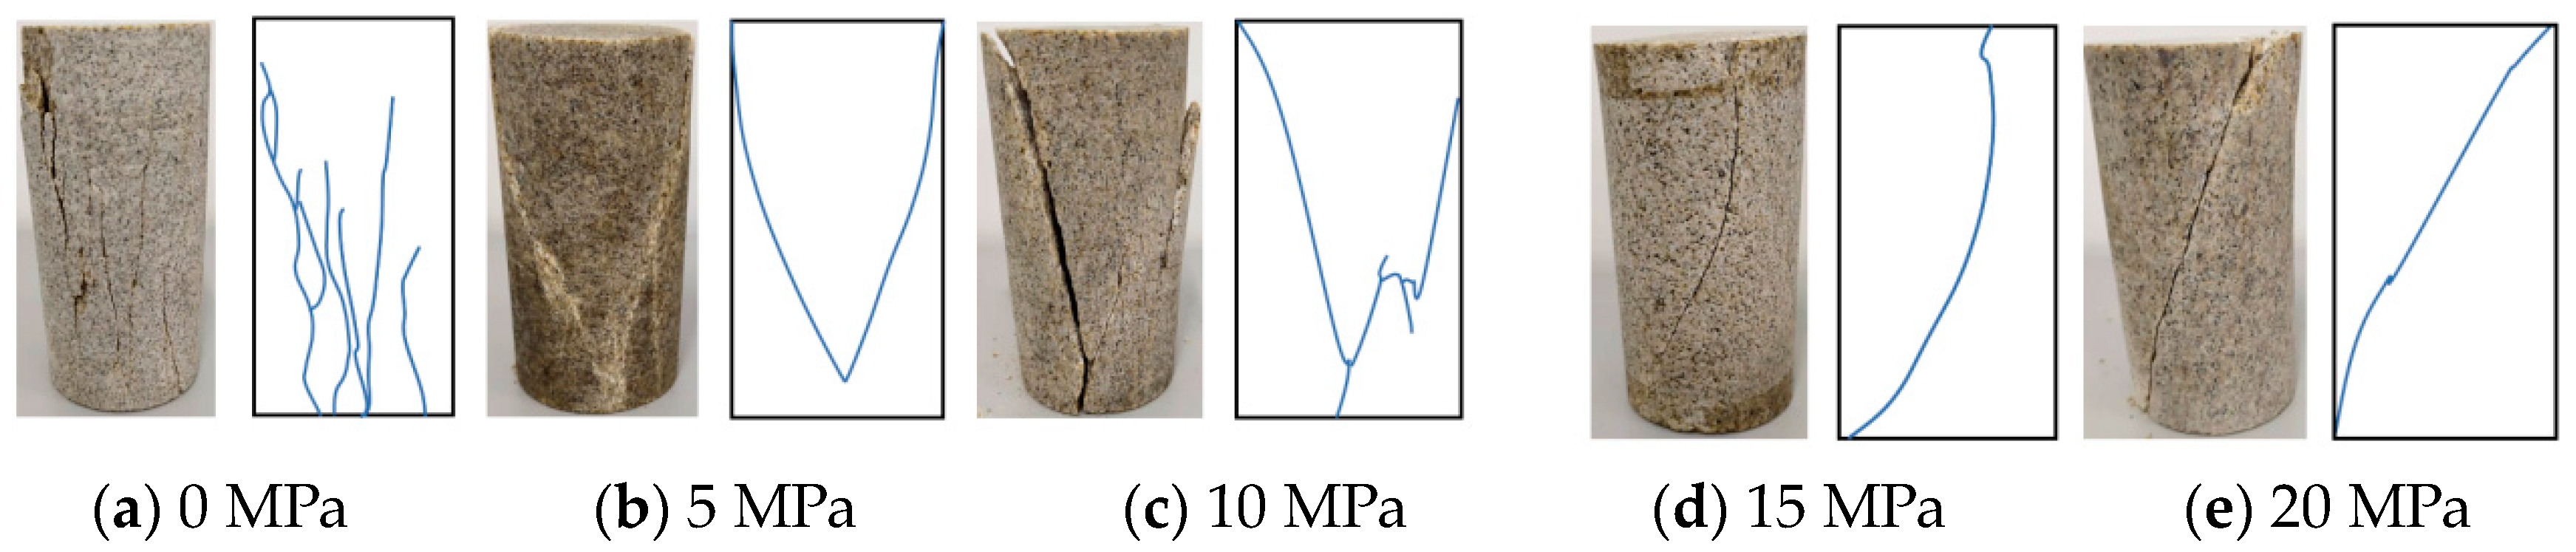
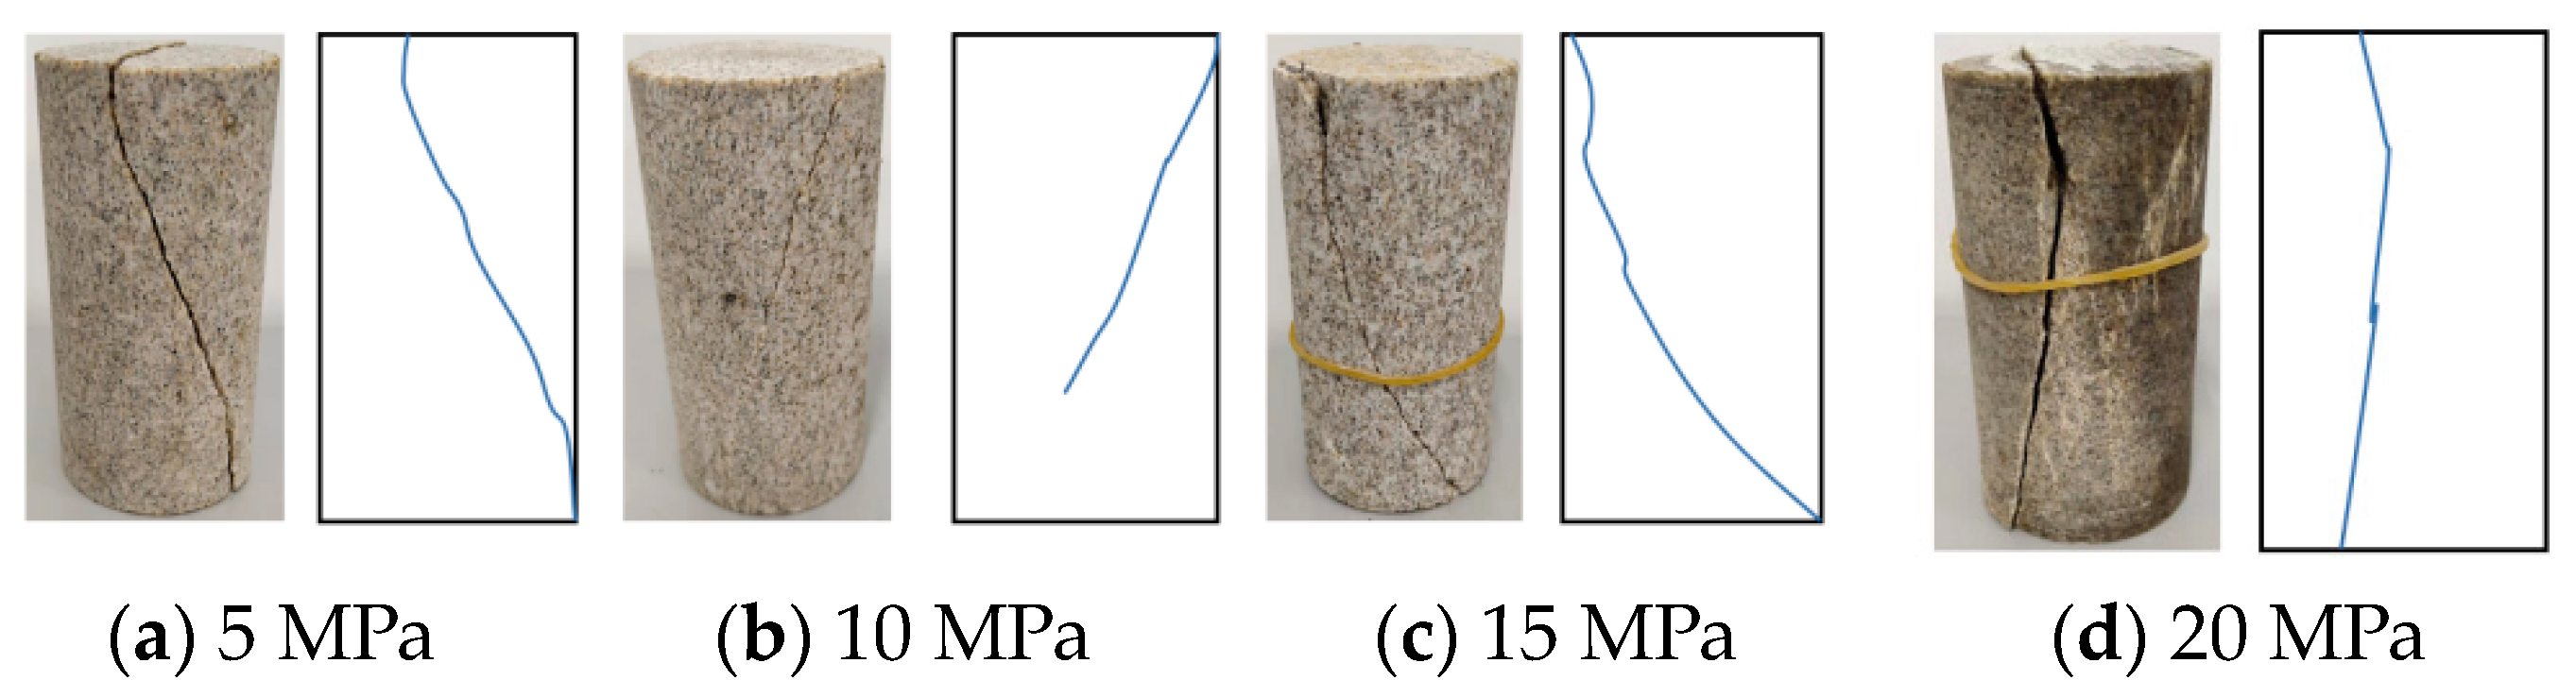
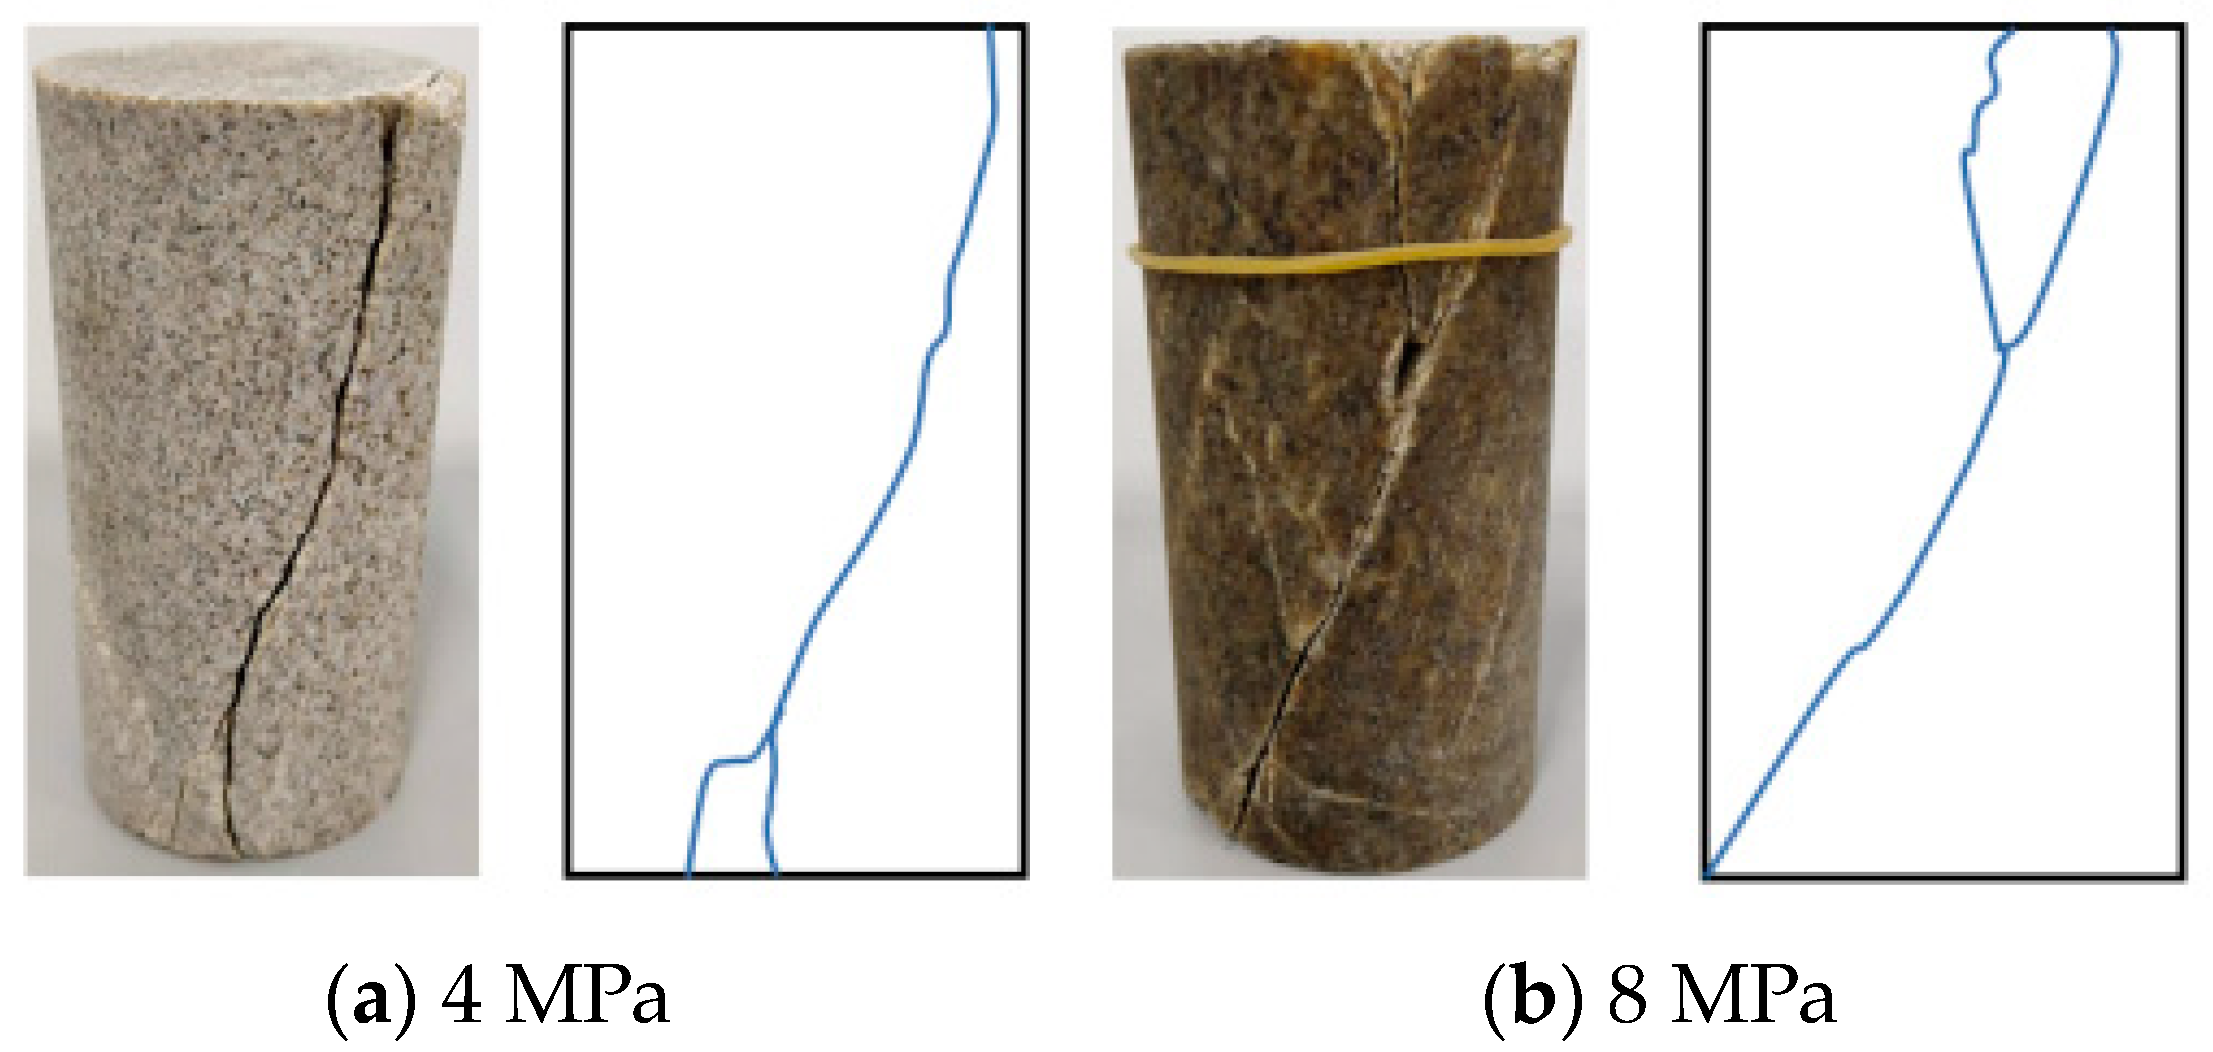
Different stress thresholds correspond to distinct stages of rock deformation, namely the micro-fracture closure stage, linear elastic deformation stage, stable crack expansion stage, crack non-stationary expansion stage, and post-peak strain and damage stage. Under dry conditions, with increasing confining pressure, the failure mode shifts from macroscopic multi-crack failure to shear failure. In saturation conditions, the predominant failure mode is inclined plane shear failure.
(2)
Throughout the rock specimen’s deformation and failure process, the evolution of sandstone permeability exhibits four characteristic stages: gradual decrease, steady development, gradual increase, and rapid growth. This pattern correlates well with the micro-fracture closure, linear elastic deformation, crack development and expansion, and post-peak strain and failure stages. Key permeability values increase as pore pressure increases, but decrease as confining pressure increases. The permeability kcc can be approximated as the minimum permeability kmin.
(3)
The permeability adheres to a distinct four-stage pattern of gradual decrease, steady development, gradual increase, and rapid growth. This trend corresponds to the four phases of slow volumetric compression, rapid volumetric compression, rapid volumetric expansion, and slow volumetric expansion observed during rock deformation. The correlation between permeability and volumetric strain during the compression and expansion stages can be adequately described by the corresponding equations.
(4)
The propagation of internal cracks in sandstone under different conditions leads to evolving fracture damage. A correlation curve depicting the relationship between permeability and the damage variable was constructed, shedding light on the underlying mechanisms that govern the evolution of permeability in response to alterations in rock damage.

Author Contributions

Paper revision and polishing, L.W. and Z.L.; laboratory experiment, H.L.; paper writing, Z.L. and Q.Y.; literature research, Q.Y. All authors have read and agreed to the published version of the manuscript.

Funding

The project was funded by the Science Foundation of Department of Transportation of Guangxi, grant number 2020-1-14, the Natural Science Foundation in Guangxi Province of China, grant numbers 2021GXNSFBA196043 and 2023GXNSFAA026185, the National Natural Science Foundation of China, grant number 51074152.

Institutional Review Board Statement

Not applicable.

Informed Consent Statement

Not applicable.

Data Availability Statement

Not applicable.

Conflicts of Interest

The authors declare no conflict of interest.

References

  1. Xie, H.P.; Wang, J.H.; Shen, B.H.; Liu, J.-Z. New idea of coal mining: Scientific mining and sustainable mining capacity. Meitan Xuebao/J. China Coal Soc. 2012, 37, 1069–1079. [Google Scholar]
  2. Liang, Y. Scientific conception of precision coal mining. J. China Coal Soc. 2017, 42, 1–7. [Google Scholar]
  3. Jeanpert, J.; Iseppi, M.; Adler, P.M.; Genthon, P.; Sevin, B.; Thovert, J.-F.; Dewandel, B.; Join, J.-L. Fracture controlled permeability of ultramafic basement aquifers. Inferences from the Koniambo massif, New Caledonia. Eng. Geol. 2019, 256, 67–83. [Google Scholar] [CrossRef]
  4. Giot, R.; Auvray, C.; Conil, N.; de La Vaissière, R. Multi-stage water permeability measurements on claystone by steady and transient flow methods. Eng. Geol. 2018, 247, 27–37. [Google Scholar] [CrossRef]
  5. Zhang, Y.; Ma, Y.; Hu, Z.; Lei, H.; Bai, L.; Lei, Z.; Zhang, Q. An experimental investigation into the characteristics of hydraulic fracturing and fracture permeability after hydraulic fracturing in granite. Renew. Energy 2019, 140, 615–624. [Google Scholar] [CrossRef]
  6. Ning, Z.; Xue, Y.; Li, Z.; Su, M.; Kong, F. Damage Characteristics of Granite Under Hydraulic and Cyclic Loading–Unloading Coupling Condition. Rock Mech. Rock Eng. 2022, 55, 1393–1410. [Google Scholar] [CrossRef]
  7. Peng, S.; Qu, H.; Luo, L. An experimental study on the penetrability of sedimentary rock during the complete stress strain path. J. China Coal Soc. 2000, 25, 113–116. [Google Scholar]
  8. Xiao, W.J.; Zhang, D.M.; Wang, X.J. Experimental study on progressive failure process and permeability characteristics of red sandstone under seepage pressure. Eng. Geol. 2020, 265, 105406. [Google Scholar] [CrossRef]
  9. Menezes, F.F. Anisotropy of volume change and permeability evolution of hard sandstones under triaxial stress conditions. J. Pet. Sci. Eng. 2019, 174, 921–939. [Google Scholar] [CrossRef]
  10. Xu, P.; Yang, S.Q. Permeability evolution of sandstone under short-term and long-term triaxial compression. Int. J. Rock Mech. Min. Sci. 2016, 85, 152–164. [Google Scholar] [CrossRef]
  11. Badrul Alam, A.K.M.; Niioka, M.; Fujii, Y.; Fukuda, D.; Kodama, J.-I. Effects of confining pressure on the permeability of three rock types under compression. Int. J. Rock Mech. Min. Sci. 2014, 65, 49–61. [Google Scholar] [CrossRef]
  12. Wang, H.L.; Xu, W.Y.; Yang, S.Q. Experimental investigation on permeability evolution law during course of deformation and failure of rock specimen. Chin. J. Rock Soil Mech. 2006, 27, 1703–1708. [Google Scholar]
  13. Wang, H.; Xu, W. Relationship Between Permeability and Strain of Sandstone During the Process of Deformation and Failure. Geotech. Geol. Eng. 2013, 31, 347–353. [Google Scholar] [CrossRef]
  14. Hu, D.W.; Zhou, H.; Zhang, F.; Shao, J.F. Evolution of poroelastic properties and permeability in damaged sandstone. Int. J. Rock Mech. Min. Sci. 2010, 47, 962–973. [Google Scholar] [CrossRef]
  15. Chen, X.; Tang, C.-A.; Yu, J.; Zhou, J.-F. Experimental investigation on deformation characteristics and permeability evolution of rock under confining pressure unloading conditions. J. Cent. South Univ. 2018, 25, 1987–2001. [Google Scholar] [CrossRef]
  16. Nguyen, V.H.; Gland, N.; Dautriat, J.; David, C.; Wassermann, J.; Guélard, J. Compaction, permeability evolution and stress path effects in unconsolidated sand and weakly consolidated sandstone. Int. J. Rock Mech. Min. Sci. 2014, 67, 226–239. [Google Scholar] [CrossRef]
  17. Yang, T.; Wang, P.; Wang, S.; Liu, H. Experimental Study on Shear-Seepage Coupling Characteristics of Single Fractured Rock Mass Under Cyclic Loading and Unloading. Rock Mech. Rock Eng. 2023, 56, 2137–2156. [Google Scholar] [CrossRef]
  18. Wang, C.; Zhao, Y.; Ning, L.; Bi, J. Permeability evolution of coal subjected to triaxial compression based on in-situ nuclear magnetic resonance. Int. J. Rock Mech. Min. Sci. 2022, 159, 105213. [Google Scholar] [CrossRef]
  19. Zhao, Y.; Zhou, H.; Zhong, J.; Liu, D. Study on the relation between damage and permeability of sandstone at depth under cyclic loading. Int. J. Coal Sci. Technol. Engl. Ed. 2019, 6, 479–492. [Google Scholar] [CrossRef]
  20. Zou, H.; Liu, J.F.; Yu, B.; Zhou, Z.-W. Experimental study on mechanical and permeability properties of sandstone with different granularities. Chin. J. Geotech. Eng. 2015, 37, 1462–1468. [Google Scholar]
  21. Gao, C.; Xie, L.Z.; Xie, H.P.; He, B.; Li, C.B.; Wang, J.; Luo, Y. Coupling between the statistical damage model and permeability variation in reservoir sandstone: Theoretical analysis and verification. J. Nat. Gas Sci. Eng. 2016, 37, 375–385. [Google Scholar] [CrossRef]
  22. Chen, Y.; Xu, J.; Cao, Q.; Rao, H.; Cui, M.; Zhang, Q. Experimental Study on Mechanical and Strain Localisation Behaviour of Sandstone Under Seepage–Stress Coupling. Rock Mech. Rock Eng. 2023. [Google Scholar] [CrossRef]
  23. Martin, C.D.; Chandler, N.A. The progressive fracture of Lac du Bonnet granite. Int. J. Rock Mech. Min. Sci. Geomech. 1994, 31, 643–659. [Google Scholar] [CrossRef]
  24. Li, G.; Zhu, D.R.; Yao, H.Y.; Pan, P.Z.; Zhou, Y.X.; Wang, R. Loading and unloading test on fracture characteristics of marble after heating. Chin. J. Hefei Univ. Technol. Nat. Sci. Ed. 2016, 39, 109–114+133. [Google Scholar]
  25. Yang, H.Q.; Liu, J.F.; Wong, N.Y. Influence of petroleum on the failure pattern of saturated pre-cracked and intact sandstone. Bull. Eng. Geol. Environ. 2017, 77, 767–774. [Google Scholar] [CrossRef]
  26. Zhang, J.W.; Song, Z.X.; Fan, W.B.; Huang, D. Experimental study on mechanical behavior and permeability characteristics of sandstone under stress-seepage coupling. Chin. J. Rock Mech. Eng. 2019, 38, 1364–1372. [Google Scholar]
  27. Zhang, L.M.; Jiang, S.Q.; Yu, J. Experimental Research into the Evolution of Permeability of Sandstone under Triaxial Compression. Energies 2020, 13, 5065. [Google Scholar] [CrossRef]
Figure 1. The sandstone samples.
Applsci 13 11579 g001
Figure 2. Electron microscope scanning image of white sandstone samples: (a) 1000 times; (b) 3000 times.
Applsci 13 11579 g002
Figure 3. Rock Top 50HT full-stress multi-field coupling triaxial test system.
Applsci 13 11579 g003
Figure 4. Stress–strain curves of sandstone during the whole process of deformation.
Applsci 13 11579 g004aApplsci 13 11579 g004b
Figure 5. Failure modes of drying specimens under different confining pressures.
Applsci 13 11579 g005
Figure 6. Failure modes of saturation specimens under different confining pressures.
Applsci 13 11579 g006
Figure 7. Failure modes of specimens under different confining pressures (seepage pressure of 2 MPa).
Applsci 13 11579 g007
Figure 8. Failure modes of specimens under different seepage pressures (confining pressure of 15 MPa).
Applsci 13 11579 g008
Figure 9. The strength characteristics of sandstone under different conditions.
Applsci 13 11579 g009
Figure 10. Typical relationship curve between permeability and axial stress–strain.
Applsci 13 11579 g010
Figure 11. Relationship between sandstone permeability and axial stress–strain under different working conditions.
Applsci 13 11579 g011
Figure 12. Permeability–axial stress–volumetric strain relationship curves for sandstone under different conditions.
Applsci 13 11579 g012
Figure 13. The relationship between permeability and volumetric strain in different stages (confining pressure of 15 MPa).
Applsci 13 11579 g013
Figure 14. Relationship between permeability and the damage variable under different conditions.
Applsci 13 11579 g014
Table 1. Contents of major elements in sandstone.
OSiFeKCCa
47.7%30.2%6.01%3.81%2.28%1.02%
Table 2. Test programme.
Seepage Pressure/MPaConfining Pressure/MPa
25, 10, 15, 20
415
815
Table 3. Mechanical parameters of sandstone under different working conditions.
Seepage Pressure/MPaCondition Cohesion/MPaThe Angle of Internal Friction/°
/Dry7.459.5
0Saturated8.353.8
2Saturated7.954.4
Table 4. Six key permeability values of sandstone during the whole stress–strain process under different conditions.
Seepage Pressure/MPaConfining Pressure/MPaK0KminKcKzKsKmax
251.370.4812.317.323.528.8
101.210.791.893.755.2713.8
2151.270.431.793.363.688.26
42.031.372.675.565.839.46
83.522.564.0311.116.627.1
2201.200.771.433.092.323.23
Table 5. Two key permeability values of sandstone during whole stress–strain process under different conditions.
Seepage Pressure/MPaConfining Pressure/MPaKcc/(10−17/m2)Kci/(10−17/m2)
250.533.22
101.171.32
2150.491.46
41.371.73
82.643.11
2200.780.99
Table 6. The fitting parameters for the relationship between permeability and volumetric strain of sand-stone under different seepage pressure.
ItemConfining PressureSeepage PressureVolumetric Compression StageVolumetric Expansion Stage
1152 121.11 ε v 3 + 84.59 ε v 2 12.83 ε v + 1
(R2 = 0.992)
e x p 0.03 ε v 2 + 0.08 ε v + 0.74
(R2 = 0.963)
2154 e x p 13.37 ε v 2 3.79 ε v + 0.62
(R2 = 0.986)
e x p 0.01 ε v 2 0.27 ε v + 1.13
(R2 = 0.945)
3158 e x p 16.71 ε v 2 3.92 ε v + 1.22
(R2 = 0.981)
e x p 0.006 ε v 2 0.29 ε v + 1.55
(R2 = 0.980)
Disclaimer/Publisher’s Note: The statements, opinions and data contained in all publications are solely those of the individual author(s) and contributor(s) and not of MDPI and/or the editor(s). MDPI and/or the editor(s) disclaim responsibility for any injury to people or property resulting from any ideas, methods, instructions or products referred to in the content.

