Article

Effect of Different Local Vibration Durations on Knee Extensors’ Maximal Isometric Strength

1
INSERM UMR1093-CAPS, Université Bourgogne Franche-Comté, UFR des Sciences du Sport, F-21000 Dijon, France
2
Sports Performance Laboratory, School of Physical Education & Sports Science, National and Kapodistrian University of Athens, 15772 Athens, Greece
3
Theseus, Physical Medicine and Rehabilitation Center, 17671 Athens, Greece
4
Centre d’Expertise de la Performance, Université de Bourgogne, UFR des Sciences du Sport, F-21000 Dijon, France
*
Author to whom correspondence should be addressed.
Appl. Sci. 2023, 13(20), 11376; https://doi.org/10.3390/app132011376
Submission received: 21 September 2023 / Revised: 9 October 2023 / Accepted: 16 October 2023 / Published: 17 October 2023

Abstract

:

Featured Application

The application of short durations (≤6 min) for local vibration (LV) to the knee extensor muscles does not induce a significant loss of maximal isometric force production.

Abstract

The prolonged application (>20 min) of local vibration (LV) on muscles or tendons is known to reduce maximal isometric strength. However, the effect of short vibration durations (≤6 min) is still unknown. In fourteen participants, the changes in maximal voluntary isometric contraction (MVIC) were measured after 1, 3, and 6 min of rest (CONT) or local vibration (LV) over the quadricipital tendon (frequency: 100 Hz; amplitude: 0.5 mm). Before and after each condition, the amplitude of the twitch induced by a 100 Hz potentiated electrical doublet (PDPOT); the relative electromyographic activity of the vastus medialis and rectus femoris muscle during the MVIC (RMSMVIC.M−1); the torque developed 50 ms after the onset of contraction (T50); and the voluntary activation level (VAL) were evaluated. None of the three LV durations significantly changed the MVIC compared with the control condition (p = 0.379). The indices of central (i.e., VAL, T50, RMSMVIC.M−1) and peripheral (e.g., PDPOT) fatigue were unaffected (p > 0.147). In conclusion, a short-duration LV (≤6 min) on a voluminous muscle group does not impair maximal force production or induce any central or peripherical fatigue.

1. Introduction

Local vibration (LV) is a powerful tool for stimulating numerous receptors (e.g., cutaneous receptors, Golgi tendon organ, muscle spindles) by passively stretching the entire vibrated musculotendinous system [1,2,3,4]. When applied at high frequency (a range between 80 and 100 Hz) and low amplitude (<0.5 mm) to a tendon or relaxed muscle, it mainly stimulates primary afferences (Ia) [2,5,6], the latter projected onto motor neurons via a monosynaptic reflex circuit, as well as a more complex poly-synaptic circuits, which can result in a tonic vibratory reflex contraction (TVR) [7,8,9].
At rest, prolonged exposure (20–30 min) to LV on the plantar flexor [10,11,12] or knee extensor muscles [13,14,15,16,17,18], in most cases, leads to a loss of strength (for a review, refer to [19]), even though several studies have failed to demonstrate this effect [20,21,22,23]. The primary cause of this fatigue could be an intramuscular (peripheral) alteration beyond the neuromuscular junction [24,25]. However, this is still debatable, as in many cases, markers of peripheral fatigue (e.g., the maximal M-wave response; the mechanical twitch obtained using peripheral electrical stimulation or the characteristics of this twitch) were not altered by the prolonged LV protocols [10,11,20,21,23]. The second cause could be central (neural) alteration upstream of the neuromuscular junction. The magnitude of exercise-induced central fatigue is commonly evaluated by the level of voluntary activation through the use of interpolation twitch technique (ITT), electromyographic activity during maximal contraction, and early (less than the first 100 ms from the onset of muscle contraction) rate of force development evaluations [26,27,28]. The ITT technique with peripheral nerve stimulation [10,21] or corticospinal stimulation [14,23] was used in only four studies, and the results were never influenced by the LV protocol, regardless of strength loss. It seems that ITT, either with peripheral nerve stimulation [10,21] or corticospinal stimulation, is not affected after the application of different LV protocols, even if they lead to a significant reduction in maximum strength. However, a decrease in electromyographic activity [10,11,12,15,16,17] or a reduction in the rate of torque development (RTD) [15,16,29] was observed as soon as a loss of strength was observed.
Concomitant with the observed reduction in maximum strength after prolonged LV applications, an inactivation of α-motor units from the Ia afferent nerves can also be observed, as assessed through H-reflex evaluation [11,20,30]. This reduction in the H-reflex has long been attributed to presynaptic causes and is suspected to be involved in the observed reduction in muscle strength [3,31,32,33]. However, several studies have recently highlighted a decrease in post-synaptic excitability (i.e., motor neuron excitability) following an acute LV protocol. This is reflected in a reduction in the thoracic motor-evoked potential amplitude (TMEP) [14,29,34], a motor-unit-type-dependent change in persistent inward current (i.e., an increase for the lower-threshold and a decrease for the higher-threshold motor units) [35] and a reduction in motor unit discharge frequency [13]. Note that a decrease in post-LV motor neuron excitability appears to be accompanied by increased cortical excitability, estimated using the ratio of corticospinal tract excitability (measured with transcutaneous magnetic stimulation) to motor neuron excitability [14,29]. Nevertheless, this increase in cortical excitability does not appear to be sufficient to counteract the negative effects of LV on maximal force production. As a result, the origin of this loss of strength could come from a potential increase in motor neuron recruitment thresholds and a decrease in firing rates, particularly in fast motor units, resulting in a decrease in the activation of the y-loop.
The majority of the results presented above were obtained for prolonged LV protocols (>20 min). However, to the best of our knowledge, there is a lack of data regarding the possible effect of short-termed LV protocols on maximal force production capacity. After a thirty-second LV protocol, a reduction in the H reflex was observed in the soleus muscle in [30]. Furthermore, only after the application of an LV protocol lasted for over six minutes was the excitability of flexor carpi radialis motor neurons (assessed with cervicomedullary motor-evoked potential) reduced [36]. However, it is still unknown if these observations will also be true after short-term LV protocol application in other major locomotive muscles, like the quadriceps. Thus, the aim of this study was to identify the shortest duration that would induce a reduction in the knee extensor muscles’ force and confirm the central origin of such losses. We hypothesized that a minimum duration of 6 min would be necessary to induce a significant reduction in force.

2. Materials and Methods

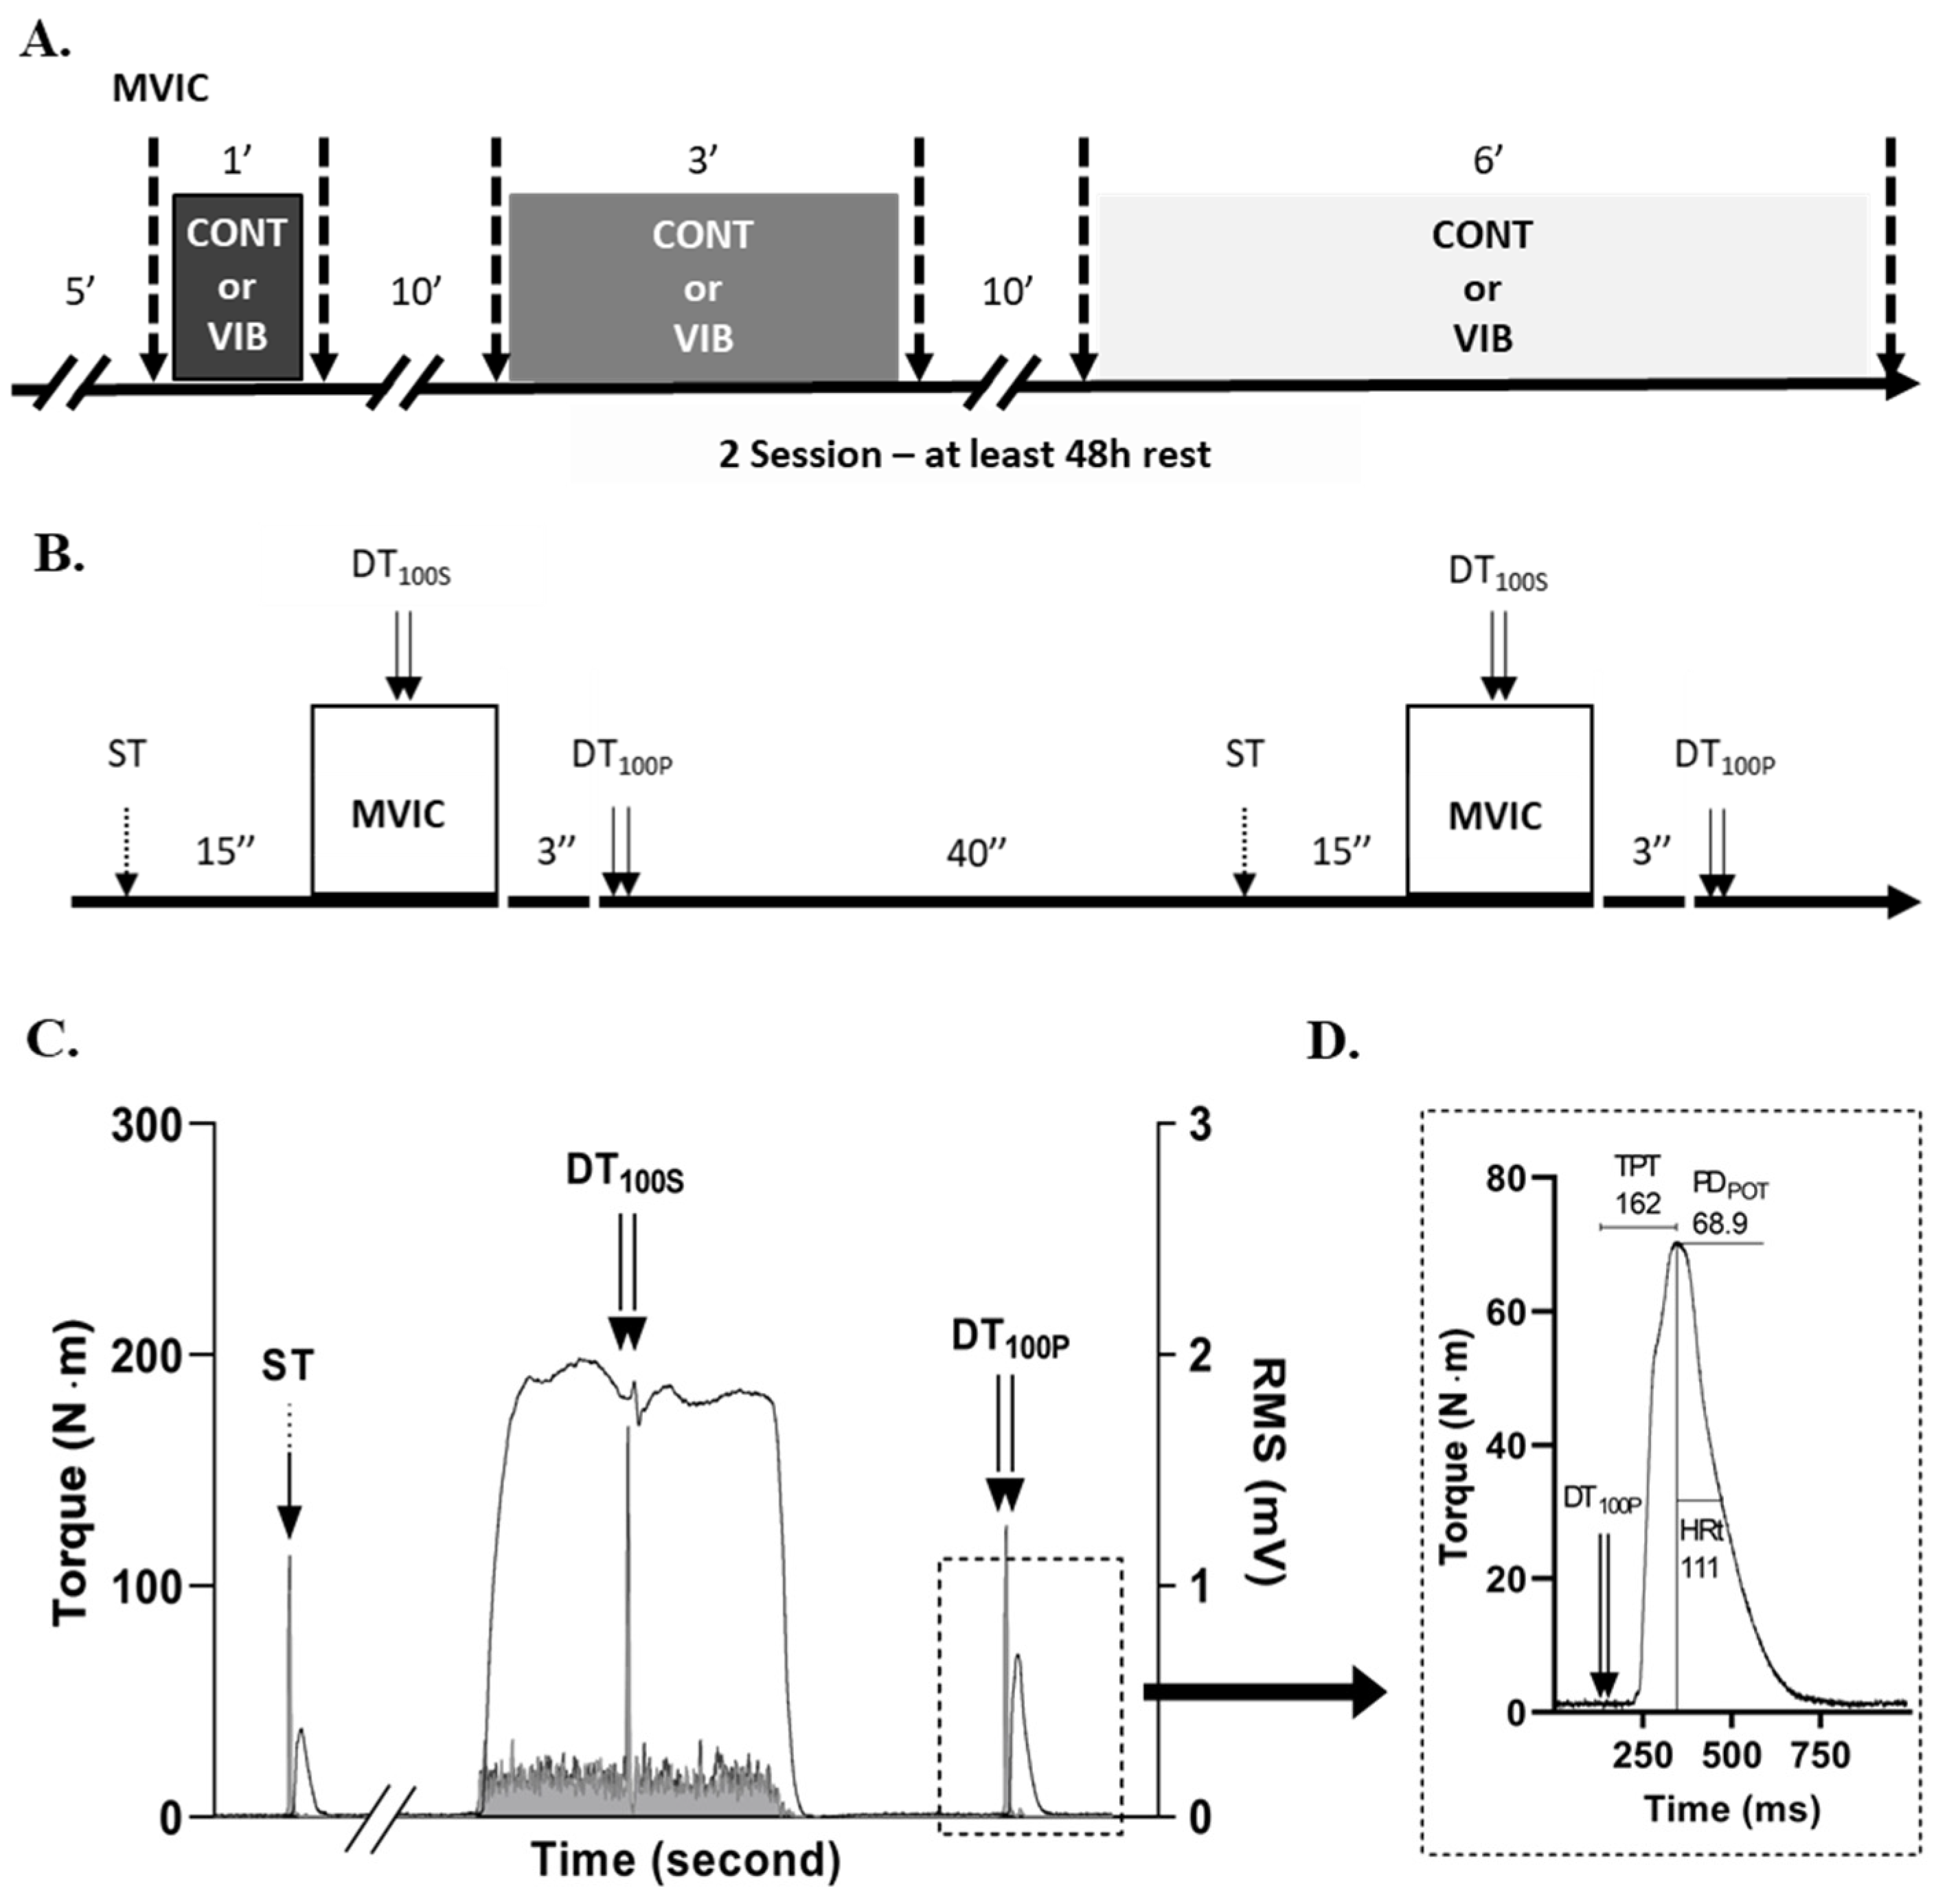
2.1. Experimental Design

All participants participated in two experimental sessions in a cross-over design, with at least 48 h of rest interval between them. Each experimental session started with a standardized warm-up. Then, participants performed maximal voluntary isometric contractions (MVIC) to measure quadriceps maximal strength before (PRE) and after (POST) 1, 3, and 6 min of local vibration (LV) or rest (CONT). The two conditions (i.e., LV or CONT) were performed in a random counterbalanced order between the two experiment sessions (Figure 1A). To ensure restoration of the neuromuscular system in the event of experimental condition effects and to avoid the production of MVIC-related fatigue [13,37,38], durations of 1 and 3 min and durations of 3 and 6 min were separated by 10 min of rest (Figure 1A). LV was delivered to the quadricipital tendon at 100 Hz and 0.5 mm displacement (Vibramoov, TechnoConcept). The electromyographic activity of the vastus lateralis (VL) and the rectus femoris (RF) were measured during the three durations in both the CONT and LV conditions. Voluntary activation level (VAL) was assessed with the interpolation twitch technique. In order to assess peripheral fatigue, the M wave associated with electrical single twitch (ST) stimulation and the parameters of the potentiated twitch post-MVIC were analyzed.

2.2. Participants

Fourteen healthy participants were included in the experiment (age: 23 ± 1.3 years old, body weight: 73.5 ± 11.6 kg, height: 178.2 ± 9.5 cm). All participants were familiarized with knee isometric extension and free from neurological disease and musculoskeletal injury. The research was in accordance with the Declaration of Helsinki and approved by the local university ethics committee (CERUBFC-2021-11-23-041). Participants were informed of the research and signed a written consent form before entering the research procedure.

2.3. Maximum Isometric Torque and Rate of Torque Development

Participants were placed on an isokinetic dynamometer (Biodex System 4, Biodex Medical Systems Inc., Shirley, NY, USA). The right leg was strapped to the rotation axis, and the position was recorded for identical replication in the second session: knee angle, 70° (0° = full knee extension); hip flexion, 110°. Movement of the upper body was limited with the help of a strap across the trunk and the waist.
MVIC was evaluated through 2 maximum efforts before and after each trial/block, with 1 min rest between them. Each contraction lasted for 4 s with a superimposed electrical doublet (100 Hz) and a potentiated doublet about 3 s after the contraction [39]. Moreover, a single electrical stimulation was delivered 5 s before each contraction to allow for the normalization of EMG signals a posteriori (Figure 1B). Strong verbal encouragements were delivered throughout the effort. Furthermore, MVIC was assessed at least 30 s after the end of the experimental condition. Thus, the last electrical stimulation was timed 2′30″ after the end of the condition. Maximum torque was determined as the highest peak on the curve. The onset of contraction was determined as the time when the participant reached 2% of maximum torque, and the rate of torque development (RTD) was the level of torque (T50) developed 50 ms after the onset of contraction. We have not reported the RTD from 0 to 50 ms because the value is numerically equivalent to the torque value at a specific time from 0 [28]. All the data were recorded in the same file as the EMG data through an analog-to-digital conversion system (MP150; Biopac Systems Inc., Goleta, CA, USA) at a sampling frequency of 2000 Hz, with a 30 Hz low-pass filter. At each time point, the T50 was the mean performance of the two trials [28]. In contrast, the other parameters described below were measured only for the trial that produced the maximum torque and were further used for statistical analysis.

2.4. Electrical Nerve Stimulation and M-Wave Amplitude

M-waves were investigated for the VL and RF muscles. Electrical nerve stimulation was assessed in the femoral nerve by using a stylus cathode pressed on the femoral triangle, 3–5 cm below the inguinal ligament. The anode, a 5 × 10 cm gel pad electrode (Compex SA), was located in the gluteal fold. Electrical stimulation (pulse duration: 1 ms—maximal output: 400 V) was delivered by a constant current stimulator (stimulator (DS7A, Digitimer, Hertfordshire, UK). Firstly, the optimal position was found when, at a given intensity, the M-waves were the greatest. Then, the increment to establish the maximal M-wave stimulation intensity was assessed by increasing 10 mA at a frequency of 0.2 Hz [40,41]. Afterward, 125% of the latter intensity was used as supramaximal stimulation during the session and was used to deliver single twitch (ST), superimposed electrical doublet (DT100S), and potentiated electrical doublet at 100 Hz (DT100P). The peak-to-peak (PP) amplitudes (M-waves) of both muscles were measured during an ST application before the MVIC for each trial/block.

2.5. Electromyographic Activity

The EMG activity of the right-leg VL and RF was measured during MVIC with Ag/AgCl electrodes (diameter: 7 mm, interelectrode distance: 20 mm). Reference electrodes were set on the right patella. Electrodes were positioned on shaved and cleaned skin, and the exact location was noted for the second session. At rest, the root-mean-square (RMS) signal averaged over a 5 s window was monitored to be less than 3.5 µV for each muscle.
EMG activity signal was measured during each contraction and experimental condition (i.e., 1, 3, and 6 min of LV or CONT) with a 2000 Hz sampling frequency using an analog-to-digital conversion system (MP150; Biopac Systems Inc., Goleta, CA, USA). The signal was amplified (gain = 500) and filtered (10–400 Hz). A bandpass filter (90–110 Hz) was applied to the raw EMG activity recorded during the LV or CONT condition. Data were stored and analyzed with commercially available software (Acqknowledge MP150). From the raw EMG data, the RMS was calculated to quantify the activity of the quadriceps using the following formula:
R M S = 1 n X n ² n
Computing the RMS during MVIC was realized in a 25 ms window (n = 50 points) with an overlap of 49 points. The same procedure was used to compute the RMS signal during the experimental conditions (i.e., LV or CONT) for each muscle with a time window of 60 s (n = 120.000 points) and no overlap. RMSMVIC refers to the average RMS signal recorded from 100 ms to 0 ms before peak force (window shifted if too close to DT100 S), and RMSCOND refers to the average RMS signal recorded over 1, 3, or 6 min. Thus, the RMS values were then normalized based on the peak-to-peak values from the M-wave evaluation (RMSMVIC.M−1 and RMSCOND.M−1 ratios) measured before the MVIC for both muscles.

2.6. Interpolated Twitch Technic

The interpolated twitch technique (ITT) was used to calculate the voluntary activation level (VAL) during the MVIC. For ITT, doublet stimulation at 100 Hz was superimposed during the MVIC (DT100 S) 2 s after the beginning of the onset of muscle contraction, and a second doublet potentiated at 100 Hz (DT100P) was delivered at rest, approximatively 3 s after MVIC ended (see below for a method of electrical nerve stimulation; Figure 1B). The superimposed peak doublet (PDSUP) and the potentiated peak doublet (PDPOT) corresponded to the maximum torque signal recorded from stimulation to 250 ms after stimulation. As DT100S could not be superimposed every time at the maximal torque moment (TMAX), Strojnik and Komi (1998) correction was used by incorporating the torque produced at the moment of stimulation (TSTIM) into the following calculation method [42]:
VAL = [1 − (PDPOT × (TSTIM/TMAX))/PDSUP] × 100

2.7. Potentiated Doublet Stimulation

In our experiment, peripheral fatigue markers were measured with a DT100P of 10 ms in width. Peak torque (PDPOT), time to peak torque (TPT), and half-relaxation time (HRt) were calculated from that electrical stimulation. PDPOT represents the peak torque recorded from the stimulation to 250 ms after stimulation. TPT represents the time between the potentiated electrical doublet (DT100P) delivery and reaching peak force. Finally, HRt represents the time between the peak force of the twitch and a force level equal to half that peak (Figure 1C,D). Sarcolemmal excitability was also estimated with peak-to-peak (PP) amplitude measurement of the single twitch delivered before the MVIC [43].

2.8. Statistical Analysis

Raw data: The normal distribution of data was tested using the Shapiro–Wilk test on raw or log-transformed data. The transformation concerns raw data for the variables RMSCOND.M−1 for RF and VL muscle HRt and RMSMVIC.M−1 for RF and VL muscle. Repeated measures ANOVAs with three within-subject factors (Condition (CONT, LV) × Duration (1, 3, 6) × Time (PRE, POST)) of the raw data for all variables were performed (i.e., MVIC, VAL, RMSMVIC.M−1 for RF and VL muscle, PDPOT, HRt, TPT, T50, PP RF, and PP VL). In addition, repeated measures ANOVAs with two within-subject factors (Condition (CONT, LV) × Duration (1, 3, 6)) were conducted on the RMSCOND.M−1 of the RF and VL muscle. For each ANOVA, the hypothesis of sphericity was verified using Mauchly’s test, and the Greenhouse–Geisser correction was applied if the hypothesis was violated. Each significant main effect or interaction in the repeated measures ANOVAs was followed by a post hoc analysis using the HSD Tukey’s test.
Relative data: POST values were also expressed as a percentage of PRE to normalize the amplitude of changes between participants. The following formula was used for each duration (i.e., 1, 3, or 6 min):
Changes (%) = (POST − PRE)/PRE × 100
The normality of these data was also checked using the Shapiro–Wilk test. The variables T50, VAL, and RMSMVIC.M−1 of each muscle were transformed. Repeated measures ANOVAs with two within-subject factors (Condition (CONT, LV) × Duration (1, 3, 6)) were conducted on these variables. The treatment of the sphericity assumption and the post hoc analysis for significant main effects or interactions were the same as for the raw data analysis. Despite the transformation, the MVIC, PDPOT, HRt, and TPT did not follow normal distribution, and Friedman ANOVAs were performed with one factor (Time (POST 1CONT, POST 3CONT, POST 6CONT, POST 1LV, POST 3LV, POST 6LV)). Lastly, the grouped change observed in each condition irrespective of duration (i.e., POSTLV vs. POSTCONT) was computed. Normality was checked, and the two conditions were compared using Student’s t-tests for paired samples on log-transform data (MVIC, VAL, RMSMVIC.M−1 for RF and VL muscle, T50, PP VL) or using Wilcoxon tests (PDPOT, TPT, HRt, PP RF). The amount of change was compared with the initial pretreatment state using a one-sample Student’s test or a one-sample Wilcoxon signed-rank test, depending on the respect or non-respect of normality.
The Statistica software (Statsoft, version 12, Tulsa, OK, USA) was used to perform statistical analyses. Significance was set at p < 0.05. Partial eta squared (ηp2) was used as a measure of effect size (ES) for the factors in each ANOVA. Small, medium, or large effects were considered for ηp2 ≥ 0.01, ≥0.06, and ≥0.14, respectively. G*Power (version 3.1.9.2, Germany) was used to compute Cohen’s d ES for all significant pairwise comparisons. d ≥ 0.20, ≥0.50, and ≥0.80 represent small, medium, and large effects, respectively. The ES of the Friedman ANOVAs corresponded to Kendall’s W coefficients, and the ES for Wilcoxon matched-pairs tests were computed as the Z-score divided by the square root of the pair number. Kendall’s W coefficient and Z score interpretation were shared. Small, moderate, and large ESs corresponded to values of ≥0.10, ≥0.30, and ≥0.50, respectively [44].

3. Results

3.1. MVIC and Central Fatigue Markers

The raw data for MVIC, VAL, RMSMVIC.M−1 of both muscles, and T50 are presented in Table 1. Concerning the MVIC data, there was a significant Condition × Time interaction (F (1, 13) = 4.922, p = 0.045, ηp² = 0.275). The MVIC level in PRE was higher in CONT than in the LV condition (218.52 ± 78.63 N⋅m vs. 212.08 ± 76.03 N⋅m, p = 0.032, ES = 0.419). However, no Condition × Duration interaction (p = 0.192) or Condition × Duration × Time interaction (p = 0.379) was found. There was no significant interaction for the VAL (p > 0.113), the RMSMVIC.M−1 of the RF muscle (p > 0.611), the RMSMVIC.M−1 of the VL muscle (p > 0.533), or the T50 (p > 0.147).
The same variables expressed as a change (cf. equation above) are presented in Table 2. The Time effect measured using Friedman ANOVAs was not significant for the MVIC (p = 0.113). The repeated measures ANOVAs showed no significant effect from the Condition or Condition × Duration interaction for VAL (p = 0.125 and p = 0.824), RMSMVIC.M−1 of the RF (p = 0.845 and p = 0.611), RMSMVIC.M−1 of the VL (p = 0.533 and p = 0.695), or T50 (p = 0.702 and p = 0.673). Concerning these central fatigue markers, no pairwise comparisons of grouped data were significant (p > 0.108). Only VAL in the CONT condition (−2.16 ± 2.59%) was significantly lower than the initial level (p = 0.006, ES = −0.878). The other markers did not differ from the initial level (p > 0.087).

3.2. Peripheral Fatigue Markers

The raw data for the PDPOT, TPT, HRt, and PP of each muscle are presented in Table 1. There was no significant interaction for the PDPOT (p > 0.147), PP of the RF (p > 0.299), or PP of the VL muscle (p > 0.399). Concerning the TPT data, there was a significant Condition × Duration interaction (F (1.418, 18.444) = 6.088, p = 0.015, ηp² = 0.319). The TPT for the 6 min duration was overall higher than the TPT for the 3 min duration in the LV condition (138.96 ± 14.90 ms vs. 149.27 ± 20.81 ms, p = 0.042, ES = 0.721). Other interactions were not significant (p > 0.256). Concerning the HRt data, there was a significant Condition × Duration interaction (F (2. 26) = 4.322, p = 0.024, ηp² = 0.250). However, post hoc analysis showed no significant differences between the pairs. Other interactions were not significant (p > 0.224).
The same variables expressed as a percentage change (cf. equation above) are presented in Table 2. No Time effect (Friedman ANOVAs) was observed for PDPOT (p = 0.813). TPT (p = 0.616), HRt (p = 0.332), RF muscle PP (p = 0.348), or that of the VL (p = 0.316). Concerning these peripheral fatigue markers, no significant pairwise comparisons were observed (p > 0.300). No marker showed a significant change from the initial level (p > 0.074).

3.3. Electromyographic Activity during LV

Concerning both muscles, there was no effect from Condition (p > 0.102) or Duration (p > 0.142) or Condition × Duration interaction (p > 0.336) for the RMSCOND.M−1 (Table 3).

4. Discussion

The aim of the present study was to identify the shortest duration that would induce a reduction in the knee extensor muscles’ force and confirm the central origin of such losses. The main finding of the present study was that the application of LV, lasting either 1, 3, or 6 min, does not negatively affect the quadriceps muscles’ force production, not inducing any central and/or peripheral fatigue.
Until now, the majority of the studies reporting significant reductions in maximum strength (from 4.3 [15] to 17.4% [17] for knee extension and from 5 [10] to 19% [12] for plantar flexion) have used long-term protocols, lasting between 20 and 30 min [13,14,15,16,17,18]. Considering that, in the above studies, as well as in the present study, the frequencies and amplitudes of the LV protocols were similar (frequency: 70–120, amplitude: 0.2–2 mm) [10,11,12,14,15,18,29], it can be concluded that the observation of no significant force reduction and the absence of central and peripherical fatigue, as they were evaluated in the present study, should be the outcome of the very short LV duration used in this research. We found no changes in markers of peripheral fatigue independent of experimental conditions (i.e., LV or CONT), as demonstrated in previous research, which has observed a loss of strength for longer LV durations.
Afferent feedback to the motoneuron pool is necessary for the recruitment of fast motor units during maximal contraction [31,45]. Impaired sensory feedback can easily lead to a stronger reduction in the activation of muscle characterized by an increased proportion of type II muscle fibers compared with those with a higher proportion of type I muscle fibers [11,12,15]. This reduction in muscle EMG activity was accompanied by a significant reduction in muscle force production [20,21,22,23]. More surprisingly, the level of voluntary activation remained unchanged when investigated despite the presence of a loss of strength and reduced EMG activity [10,14]. For instance, Souron’s study used transcranial magnetic stimulation to assess the level of voluntary activation. This method has several limitations, such as (i) using an estimation of the amplitude of potentiated stimulation to calculate the VAL, (ii) lower reproducibility, and (iii) a lower target specificity and stimulation intensity [27]. These biases, inherent in the method used, may have led to the absence of any significant interaction between the two conditions (CONT vs. LV) in their work, despite the loss of force. Although not significant in the Herda et al. study, a reduction in VAL was obtained in 10 of the 15 participants [10]. Conversely, a reduction in RTD is regularly observed in association with a loss of strength [15,16,29]. This result confirms the central origin of the loss of strength after LV and the difficulty in recruiting fast fibers in producing an explosive contraction [28]. In our case, the preservation of EMG activity levels, the voluntary activation level, and the RTD is consistent with the lack of force loss observed in our study.
The effect of LV on central nervous system excitability has been increasingly well established [34,46]. A reduction in motor neuron excitability assessed at rest or during weak contractions by means of thoracic or cervicomedullary stimulation corroborates the loss of force for durations of 30 min [14,29]. Moreover, this reduction in motoneuronal excitability appears to be partly responsible for a reduction in spinal loop excitability assessed by the H reflex [34,36]. The maintenance of maximal force production and the level of voluntary activation in our study might imply that motoneuron excitability and, consequently, the spinal loop remain intact. In addition, only 30 s of LV applied to the soleus muscle tendon is sufficient to induce a reduction in the H-reflex. However, no loss of strength was found despite reduced H-reflex assessed in the study by Fry and Folland on the vastus medialis muscle after 30 min of LV [20]. The same result was also observed for muscles involved in plantar flexion [22]. These results weaken the hypothesis of a direct relationship between vibration-induced altered spinal loop excitability and the ability to produce maximum force. It should also be noted that an increase in cortical excitability has already been observed after the application of 30 min of LV to the quadriceps muscles (estimated using the MEP/Thoracic MEP ratio) [14,29], as well as an increase in corticospinal excitability (estimated using the MEP) during the application of LV to the same muscle [47]. Consequently, the variables identified in our study did not allow us to determine whether the absence of force loss for the three durations tested results from the absence of changes in spinal excitability or from compensatory mechanisms at the level of the corticospinal pathway. In addition, other mechanisms modulating corticospinal excitability may be involved during contraction (e.g., neuromodulation, recurrent inhibition, or gamma loop contraction) and are not assessed using techniques performed at rest or during weak contraction.
It should be noted that our protocol did not induce TVR despite an optimal application to the tendon (i.e., LV parameters and localization). The latter, originating from mono- and polysynaptic circuits, has already been documented for the quadriceps muscles [9,48]. The presence of this reflex contraction has only been reported in a single study measuring the effect of LV on maximum force production [16]. The other studies did not mention and/or control for the potential presence of TVR. Thus, the absence of force loss in several studies, as well as the present one, could also be facilitated by the lack of this reflex contraction.
In conclusion, this study shows LV does not harm maximal force production in knee extensor muscles when the protocol is applied for 6 min or less. No changes appear to take place either above or below the neuromuscular junction. Even if changes in central nervous system excitability have already been reported for such short durations of LV applied to smaller muscle groups (e.g., flexor carpi radialis or plantar flexor muscles), this seems insufficient for the knee extensor muscles. The evolution of motor neuronal excitability and that of the spinal loop for short periods of LV should be investigated for such muscle groups. A better understanding of the mechanisms and optimization of the vibration parameters used to induce neuromuscular fatigue could lead to the improved application of LV in rehabilitation.

Author Contributions

Conceptualization. N.A. and C.P.; methodology. N.A., T.T., A.M., S.M., N.B. and C.P.; software. N.A. and S.Z.; validation. N.A., A.M., S.M., N.B. and C.P.; formal analysis. N.A. and S.Z.; investigation. S.Z., T.T. and N.A.; resources. S.Z., T.T. and N.A.; data curation. N.A.; writing—original draft preparation. N.A., T.T. and S.Z.; writing—review and editing. N.A., A.M., S.M., N.B. and C.P.; visualization. N.A., A.M., S.M., S.Z. and C.P.; supervision. C.P.; project administration. C.P. All authors have read and agreed to the published version of the manuscript.

Funding

This research received no external funding.

Institutional Review Board Statement

This study was conducted in accordance with the Declaration of Helsinki and approved by the ethics committee of the local university (CERUBFC-2021-11-23-041).

Informed Consent Statement

Informed consent was obtained from all subjects involved in the study.

Data Availability Statement

The data presented in this study are available upon request from the corresponding author.

Acknowledgments

We thank the subjects for the time and energy they invested in this study.

Conflicts of Interest

The authors declare no conflict of interest.

References

  1. Ribot-Ciscar, E.; Rossi-Durand, C.; Roll, J.P. Muscle Spindle Activity Following Muscle Tendon Vibration in Man. Neurosci. Lett. 1998, 258, 147–150. [Google Scholar] [CrossRef]
  2. Roll, J.P.; Vedel, J.P. Kinaesthetic Role of Muscle Afferents in Man, Studied by Tendon Vibration and Microneurography. Exp. Brain Res. 1982, 47, 177–190. [Google Scholar] [CrossRef]
  3. Hayward, L.F.; Nielsen, R.P.; Heckman, C.J.; Hutton, R.S. Tendon Vibration-Induced Inhibition of Human and Cat Triceps Surae Group I Reflexes: Evidence of Selective Ib Afferent Fiber Activation. Exp. Neurol. 1986, 94, 333–347. [Google Scholar] [CrossRef]
  4. Burke, D.; Hagbarth, K.E.; Löfstedt, L.; Wallin, B.G. The Responses of Human Muscle Spindle Endings to Vibration during Isometric Contraction. J. Physiol. 1976, 261, 695–711. [Google Scholar] [CrossRef] [PubMed]
  5. Roll, J.P.; Vedel, J.P.; Ribot, E. Alteration of Proprioceptive Messages Induced by Tendon Vibration in Man: A Microneurographic Study. Exp. Brain Res. 1989, 76, 213–222. [Google Scholar] [CrossRef] [PubMed]
  6. Burke, D.; Hagbarth, K.E.; Löfstedt, L.; Wallin, B.G. The Responses of Human Muscle Spindle Endings to Vibration of Non-Contracting Muscles. J. Physiol. 1976, 261, 673–693. [Google Scholar] [CrossRef]
  7. Gillies, J.D.; Burke, D.J.; Lance, J.W. Supraspinal Control of Tonic Vibration Reflex. J. Neurophysiol. 1971, 34, 302–309. [Google Scholar] [CrossRef]
  8. Desmedt, J.E.; Godaux, E. Mechanism of the Vibration Paradox: Excitatory and Inhibitory Effects of Tendon Vibration on Single Soleus Muscle Motor Units in Man. J. Physiol. 1978, 285, 197–207. [Google Scholar] [CrossRef]
  9. De Gail, P.; Lance, J.W.; Neilson, P.D. Differential Effects on Tonic and Phasic Reflex Mechanisms Produced by Vibration of Muscles in Man. J. Neurol. Neurosurg. Psychiatry 1966, 29, 1–11. [Google Scholar] [CrossRef]
  10. Herda, T.J.; Ryan, E.D.; Smith, A.E.; Walter, A.A.; Bemben, M.G.; Stout, J.R.; Cramer, J.T. Acute Effects of Passive Stretching vs Vibration on the Neuromuscular Function of the Plantar Flexors. Scand. J. Med. Sci. Sport. 2009, 19, 703–713. [Google Scholar] [CrossRef]
  11. Ushiyama, J.; Masani, K.; Kouzaki, M.; Kanehisa, H.; Fukunaga, T. Difference in Aftereffects Following Prolonged Achilles Tendon Vibration on Muscle Activity during Maximal Voluntary Contraction among Plantar Flexor Synergists. J. Appl. Physiol. 2005, 98, 1427–1433. [Google Scholar] [CrossRef] [PubMed]
  12. Yoshitake, Y.; Shinohara, M.; Kouzaki, M.; Fukunaga, T. Fluctuations in Plantar Flexion Force Are Reduced after Prolonged Tendon Vibration. J. Appl. Physiol. 2004, 97, 2090–2097. [Google Scholar] [CrossRef] [PubMed]
  13. Barrera-Curiel, A.; Colquhoun, R.J.; Hernandez-Sarabia, J.A.; DeFreitas, J.M. The Effects of Vibration-Induced Altered Stretch Reflex Sensitivity on Maximal Motor Unit Firing Properties. J. Neurophysiol. 2019, 121, 2215–2221. [Google Scholar] [CrossRef] [PubMed]
  14. Souron, R.; Besson, T.; McNeil, C.J.; Lapole, T.; Millet, G.Y. An Acute Exposure to Muscle Vibration Decreases Knee Extensors Force Production and Modulates Associated Central Nervous System Excitability. Front. Hum. Neurosci. 2017, 11, 519. [Google Scholar] [CrossRef]
  15. Jackson, S.W.; Turner, D.L. Prolonged Muscle Vibration Reduces Maximal Voluntary Knee Extension Performance in Both the Ipsilateral and the Contralateral Limb in Man. Eur. J. Appl. Physiol. 2003, 88, 380–386. [Google Scholar] [CrossRef]
  16. Kouzaki, M.; Shinohara, M.; Fukunaga, T. Decrease in Maximal Voluntary Contraction by Tonic Vibration Applied to a Single Synergist Muscle in Humans. J. Appl. Physiol. 2000, 89, 1420–1424. [Google Scholar] [CrossRef]
  17. Konishi, Y.; Kubo, J.; Fukudome, A. Effects of Prolonged Tendon Vibration Stimulation on Eccentric and Concentric Maximal Torque and Emgs of the Knee Extensors. J. Sports Sci. Med. 2009, 8, 548–552. [Google Scholar]
  18. Saito, A.; Ando, R.; Akima, H. Effects of Prolonged Patellar Tendon Vibration on Force Steadiness in Quadriceps Femoris during Force-Matching Task. Exp. Brain Res. 2016, 234, 209–217. [Google Scholar] [CrossRef]
  19. Souron, R.; Besson, T.; Millet, G.Y.; Lapole, T. Acute and Chronic Neuromuscular Adaptations to Local Vibration Training. Eur. J. Appl. Physiol. 2017, 117, 1939–1964. [Google Scholar] [CrossRef]
  20. Fry, A.; Folland, J.P. Prolonged Infrapatellar Tendon Vibration Does Not Influence Quadriceps Maximal or Explosive Isometric Force Production in Man. Eur. J. Appl. Physiol. 2014, 114, 1757–1766. [Google Scholar] [CrossRef]
  21. Cattagni, T.; Billet, C.; Cornu, C.; Jubeau, M. No Alteration of the Neuromuscular Performance of Plantar-Flexor Muscles After Achilles Tendon Vibration. J. Sport Rehabil. 2016, 26, 1–3. [Google Scholar] [CrossRef]
  22. Ekblom, M.M.N.; Thorstensson, A. Effects of Prolonged Vibration on H-Reflexes, Muscle Activation, and Dynamic Strength. Med. Sci. Sport. Exerc. 2011, 43, 1933–1939. [Google Scholar] [CrossRef] [PubMed]
  23. Farabet, A.; Souron, R.; Millet, G.Y.; Lapole, T. Changes in Tibialis Anterior Corticospinal Properties after Acute Prolonged Muscle Vibration. Eur. J. Appl. Physiol. 2016, 116, 1197–1205. [Google Scholar] [CrossRef] [PubMed]
  24. Taylor, J.L.; Amann, M.; Duchateau, J.; Meeusen, R.; Rice, C.L. Neural Contributions to Muscle Fatigue: From the Brain to the Muscle and Back Again. Med. Sci. Sports Exerc. 2016, 48, 2294–2306. [Google Scholar] [CrossRef] [PubMed]
  25. Place, N. Quantification of Central Fatigue: A Central Debate. Eur. J. Appl. Physiol. 2021, 121, 2375–2376. [Google Scholar] [CrossRef]
  26. Place, N.; Millet, G.Y. Quantification of Neuromuscular Fatigue: What Do We Do Wrong and Why? Sports Med. 2020, 50, 439–447. [Google Scholar] [CrossRef]
  27. Dotan, R.; Woods, S.; Contessa, P. On the Reliability and Validity of Central Fatigue Determination. Eur. J. Appl. Physiol. 2021, 121, 2393–2411. [Google Scholar] [CrossRef] [PubMed]
  28. Maffiuletti, N.A.; Aagaard, P.; Blazevich, A.J.; Folland, J.; Tillin, N.; Duchateau, J. Rate of Force Development: Physiological and Methodological Considerations. Eur. J. Appl. Physiol. 2016, 116, 1091–1116. [Google Scholar] [CrossRef]
  29. Kennouche, D.; Varesco, G.; Espeit, L.; Féasson, L.; Souron, R.; Rozand, V.; Millet, G.Y.; Lapole, T. Acute Effects of Quadriceps Muscle versus Tendon Prolonged Local Vibration on Force Production Capacities and Central Nervous System Excitability. Eur. J. Appl. Physiol. 2022, 122, 2451–2461. [Google Scholar] [CrossRef]
  30. Abbruzzese, M.; Minatel, C.; Reni, L.; Favale, E. Postvibration Depression of the H-Reflex as a Result of a Dual Mechanism: An Experimental Study in Humans. J. Clin. Neurophysiol. 2001, 18, 460–470. [Google Scholar] [CrossRef]
  31. Bongiovanni, L.G.; Hagbarth, K.E.; Stjernberg, L. Prolonged Muscle Vibration Reducing Motor Output in Maximal Voluntary Contractions in Man. J. Physiol. 1990, 423, 15–26. [Google Scholar] [CrossRef] [PubMed]
  32. Hultborn, H.; Meunier, S.; Morin, C.; Pierrot-Deseilligny, E. Assessing Changes in Presynaptic Inhibition of I a Fibres: A Study in Man and the Cat. J. Physiol. 1987, 389, 729–756. [Google Scholar] [CrossRef]
  33. Curtis, D.R.; Eccles, J.C. Synaptic Action during and after Repetitive Stimulation. J. Physiol. 1960, 150, 374–398. [Google Scholar] [CrossRef] [PubMed]
  34. Souron, R.; Baudry, S.; Millet, G.Y.; Lapole, T. Vibration-Induced Depression in Spinal Loop Excitability Revisited. J. Physiol. 2019, 597, 5179–5193. [Google Scholar] [CrossRef]
  35. Lapole, T.; Mesquita, R.N.O.; Baudry, S.; Souron, R.; Brownstein, C.G.; Rozand, V. Can Local Vibration Alter the Contribution of Persistent Inward Currents to Human Motoneuron Firing? J. Physiol. 2023, 601, 1467–1482. [Google Scholar] [CrossRef] [PubMed]
  36. Nito, M.; Yoshimoto, T.; Hashizume, W.; Shindo, M.; Naito, A. Vibration Decreases the Responsiveness of Ia Afferents and Spinal Motoneurons in Humans. J. Neurophysiol. 2021, 126, 1137–1147. [Google Scholar] [CrossRef]
  37. Ribot-Ciscar, E.; Vedel, J.P.; Roll, J.P. Vibration Sensitivity of Slowly and Rapidly Adapting Cutaneous Mechanoreceptors in the Human Foot and Leg. Neurosci. Lett. 1989, 104, 130–135. [Google Scholar] [CrossRef]
  38. Rozand, V.; Pageaux, B.; Marcora, S.M.; Papaxanthis, C.; Lepers, R. Does Mental Exertion Alter Maximal Muscle Activation? Front. Hum. Neurosci. 2014, 8, 755. [Google Scholar] [CrossRef]
  39. Garnier, Y.M.; Lepers, R.; Stapley, P.J.; Papaxanthis, C.; Paizis, C. Changes in Cortico-Spinal Excitability Following Uphill versus Downhill Treadmill Exercise. Behav. Brain Res. 2017, 317, 242–250. [Google Scholar] [CrossRef]
  40. Garnier, Y.M.; Paizis, C.; Lepers, R. Corticospinal Changes Induced by Fatiguing Eccentric versus Concentric Exercise. Eur. J. Sport Sci. 2019, 19, 166–176. [Google Scholar] [CrossRef]
  41. Babault, N.; Pousson, M.; Michaut, A.; Van Hoecke, J. Effect of Quadriceps Femoris Muscle Length on Neural Activation during Isometric and Concentric Contractions. J. Appl. Physiol. 2003, 94, 983–990. [Google Scholar] [CrossRef]
  42. Strojnik, V.; Komi, P.V. Neuromuscular Fatigue after Maximal Stretch-Shortening Cycle Exercise. J. Appl. Physiol. 1998, 84, 344–350. [Google Scholar] [CrossRef] [PubMed]
  43. Garnier, Y.M.; Lepers, R.; Dubau, Q.; Pageaux, B.; Paizis, C. Neuromuscular and Perceptual Responses to Moderate-Intensity Incline, Level and Decline Treadmill Exercise. Eur. J. Appl. Physiol. 2018, 118, 2039–2053. [Google Scholar] [CrossRef]
  44. Portney, L.G. Foundations of Clinical Research: Applications to Evidence-Based Practice, 4th ed.; Portney, L.G., Ed.; F. A. Davis Company: Philadelphia, PA, USA, 2020; ISBN 9780803661134. [Google Scholar]
  45. Bongiovanni, L.G.; Hagbarth, K.E. Tonic Vibration Reflexes Elicited during Fatigue from Maximal Voluntary Contractions in Man. J. Physiol. 1990, 423, 1–14. [Google Scholar] [CrossRef]
  46. Pfenninger, C.; Grosboillot, N.; Digonet, G.; Lapole, T. Effects of Prolonged Local Vibration Superimposed to Muscle Contraction on Motoneuronal and Cortical Excitability. Front. Physiol. 2023, 14, 1106387. [Google Scholar] [CrossRef]
  47. Souron, R.; Oriol, M.; Millet, G.Y.; Lapole, T. Intermediate Muscle Length and Tendon Vibration Optimize Corticospinal Excitability During Knee Extensors Local Vibration. Front. Physiol. 2018, 9, 1266. [Google Scholar] [CrossRef]
  48. Eklund, G.; Hagbarth, K.E. Normal Variability of Tonic Vibration Reflexes in Man. Exp. Neurol. 1966, 16, 80–92. [Google Scholar] [CrossRef]
Figure 1. (A) The experimental design of the present study. A 5 min recovery period separated the first MVIC from the warm-up and electrical stimulation settings (i.e., stimulation site and intensity). The two conditions (i.e., LV or CONT) were randomized between the two sessions, but the three experimental durations (1, 3, and 6 min) were presented in the same order between the two sessions. The dotted arrows indicate the evaluation of MVIC. (B) Details of MVIC evaluation protocol (temporal organization and electrical stimulation specifications) are represented by the arrows in panel A. (C) Typical data representation of the torque signal during MVIC and of RF and VL muscle activity (superposed) on the left and right y-axes, respectively. ST = single twitch; DT100S = superimposed electrical doublet with 10 ms inter-stimulation (100 Hz); DT100P = potentiated electrical doublet with 10 ms inter-stimulation (100 Hz). (D) Typical data representation of the values analyzed during the potentiated electrical doublet (DT100P) performed post-MVIC. Example of the values recorded for this trial: HRt (half-relaxation time) = 111 ms; TPT (time to peak torque) = 162 ms; PDPOT (potentiated doublet peak) = 68.1 N⋅m.
Applsci 13 11376 g001
Table 1. Central (MVIC, VAL, RMSMVIC.M−1 RF and VL, T50) and peripheral (PDPOT, TPT, HRt, PP RF, PP VL) fatigue markers for the 14 subjects. A time course (PRE vs. POST) is reported for each duration (i.e., 1, 3, or 6 min) for the control (CONT) and local vibration (LV) conditions. Data are expressed as mean ± SD. p-values and effect sizes are reported for each ANOVA for the condition-influenced interactions.
1 Min3 Min6 Minp-Values/ES (pη²)
PREPOSTPREPOSTPREPOSTC × DC × TC × D × T
MVIC (N∙m)CONT225.1 ± 83.7225.9 ± 77.6220.9 ± 83.8210.4 ± 75.7209.5 ± 73205.8 ± 720.192/0.1190.045/0.2750.379/0.072
LV211.2 ± 81.7 #213.2 ± 82.6215.8 ± 75.1212.2 ± 75.1209.3 ± 76.8216.5 ± 76.8
VAL (%)CONT87.2 ± 10.185.9 ± 10.486 ± 10.382.3 ± 9.782.8 ± 10.482 ± 10.10.143/0.1390.113/0.1820.837/0.014
LV84.5 ± 10.884.0 ± 12.286.3 ± 8.484.4 ± 885.3 ± 8.685.1 ± 8.4
RMSMVIC.M−1 RF (%)CONT6.79 ± 36.42 ± 2.886.53 ± 2.726.31 ± 2.55.96 ± 2.166.1 ± 2.490.714/0.0260.845/0.0030.611/0.037
LV6.61 ± 2.575.88 ± 1.966.15 ± 2.445.92 ± 2.076.57 ± 2.886.39 ± 2.87
RMSMVIC.M−1 VL (%)CONT4.94 ± 3.035.09 ± 3.345.52 ± 4.094.85 ± 3.254.69 ± 3.24.75 ± 3.170.737/0.0140.533/0.0310.695/0.028
LV5.68 ± 3.965.14 ± 3.284.98 ± 3.154.47 ± 2.574.9 ± 2.675.11 ± 2.99
T50 (N∙m)CONT50.1 ± 24.750.4 ± 24.644.4 ± 24.943.5 ± 24.842.3 ± 22.747.4 ± 23.90.147/0.1370.522/0.0320.659/0.032
LV43.6 ± 23.142 ± 22.744.4 ± 1944.2 ± 21.645.8 ± 25.347.7 ± 23.3
PDPOT (N⋅m)CONT82.2 ± 23.284.4 ± 2480.6 ± 24.680 ± 23.380.82 ± 23.2877.7 ± 21.90.321/0.0840.229/0.1090.147/0.137
LV80.5 ± 24.681.4 ± 24.482.7 ± 25.982.8 ± 25.879.14 ± 23.4879.6 ± 24.6
TPT (ms)CONT152.1 ± 16.8149.3 ± 20.5149.8 ± 15.2150.8 ± 18.7143.32 ± 14145 ± 21.70.015/0.3190.982/0.0000.256/0.100
LV144.5 ± 16.9143.9 ± 16.9139.7 ± 13.8 $142.1 ± 17.4 $148.9 ± 18.8 $151.9 ± 23.2 $
HRt (ms)CONT81.8 ± 18.982.2 ± 18.189.7 ± 36.884 ± 3091.54 ± 32.4295.3 ± 40.30.024/0.2500.280/0.0890.231/0.109
LV83 ± 2096.2 ± 43.997.5 ± 36.891.7 ± 29.686.18 ± 33.6488.6 ± 41.5
PP RF (mV)CONT2.34 ± 0.712.4 ± 0.752.24 ± 0.882.23 ± 0.862.14 ± 0.552.14 ± 0.710.619/0.0360.299/0.0830.882/0.010
LV2.12 ± 0.722.24 ± 0.842.24 ± 0.62.25 ± 0.612.18 ± 0.752.26 ± 0.86
PP VL (mV)CONT4.98 ± 1.744.98 ± 1.784.71 ± 2.624.73 ± 2.74.38 ± 1.794.32 ± 1.710.432/0.0530.399/0.0550.946/0.004
LV4.28 ± 2.64.39 ± 2.664.59 ± 1.894.69 ± 1.834.83 ± 2.74.79 ± 2.78
ES = effect size; pη² = partial eta squared for repeated measures ANOVAs; C × D = Condition × Duration interaction; C × T = Condition × Time interaction; C × D × T = Condition × Duration × Time interaction; MVIC = maximal voluntary isometric contraction; VAL = voluntary activation level; RMSMVIC.M−1 RF or VL = electromyographic activity (root-mean-square) of the rectus femoris or vastus lateralis muscle during the MVIC, expressed as a percentage of the maximal M-wave of the respective muscle; T50 = torque level 50ms after the onset of the contraction; PDPOT = peak force of the potentiated electrical doublet at 100 Hz; TPT = time to peak torque after nerve stimulation with 100 Hz electrical doublet; HRt = half-relaxation time, corresponding to the latency between the force peak and a torque level equal to half the peak; PP RF and PP VL = peak-to-peak of the maximal M-wave of both muscles. # = significant difference between each condition in PRE (p < 0.05). $ = significant difference between two durations in the same condition (p < 0.05).
Table 2. Relative data (i.e., expressed as a percentage of PRE) for central (MVIC, VAL, RMSMVIC.M−1 RF, RMSMVIC.M−1 VL, T50) and peripheral (PDPOT, TPT, HRt, PP RF, PP VL) fatigue markers for the 14 subjects. Relative changes (mean ± SD) are reported for each duration (i.e., 1, 3, or 6 min) for the control (CONT) and local vibration (LV) conditions. Grouped data represent the mean change observed over the 3 durations in each condition. p-values and effect sizes are reported for each ANOVA and for the paired sample comparison.
1 Min3 Min6 Minp-Values/ES (pη²/K’s W Coef.)Groupedp-Values/ES
CONTLVCONTLVCONTLVTCC × DCONTLV
MVIC (%)1.9 ± 7.11.2 ± 4.4−3.6 ± 7.9−1.9 ± 5.4−1.2 ± 12.24.1 ± 8.80.113/0.127N/AN/A−1 ± 3.91.2 ± 3.70.108/0.461
VAL (%)−1.4 ± 3.4−0.7 ± 6−4.2 ± 6.3−2.1 ± 3.6−0.9 ± 6.2−0.2 ± 4.2N/A0.125/0.1720.824/0.015−2.2 ± 2.6 *−1 ± 2.30.125/0.439
RMSMVIC.M−1 RF (%)0.7 ± 18.7−3.5 ± 18.8−9.9 ± 15−6.8 ± 14−0.6 ± 14.4−1.3 ± 19.6N/A0.845/0.0030.611/0.037−3.2 ± 11.4−3.8 ± 10.60.845/−0.344
RMSMVIC.M−1 VL (%)8.6 ± 27.80.4 ± 26.9−8.8 ± 15.8−9.8 ± 18.58.8 ± 35.88.3 ± 24.8N/A0.533/0.0310.369/0.6952.9 ± 16.2−0.4 ± 10.10.533/−0.053
T50 (%)3.3 ± 25.8−2.4 ± 25.223.1 ± 39.83.6 ± 35.3−1.6 ± 2012.8 ± 29.9N/A0.702/0.0120.673/0.0308 ± 32.24.9 ± 290.566/−0.171
PDPOT (%)2.7 ± 3.91.2 ± 6.1−0.2 ± 4.70.1 ± 5.6−3.1 ± 9.70.6 ± 70.813/0.032N/AN/A−0.2 ± 3.80.6 ± 3.80.300/0.248
TPT (%)−1.1 ± 3.2−0.6 ± 2.12.9 ± 12.21.4 ± 8.62.1 ± 12.83.2 ± 12.20.616/0.051N/AN/A1.3 ± 6.11.3 ± 50.730/0.064
HRt (%)0.8 ± 6.616.2 ± 49.1−4.1 ± 11.7−3.5 ± 10.63.1 ± 8.51.6 ± 6.50.332/0.082N/AN/A−0.1 ± 5.94.8 ± 18.10.510/0.302
PP RF (%)2.8 ± 6.15.1 ± 9.60.1 ± 5.50.5 ± 5.3−1.1 ± 25.12.5 ± 11.10.348/0.080N/AN/A0.6 ± 9.42.7 ± 4.80.433/0.271
PP VL (%)0.2 ± 5.32.6 ± 80.6 ± 8.34.1 ± 8.60.4 ± 19.8−2.4 ± 5.50.316/0.084N/AN/A0.4 ± 7.81.4 ± 4.30.465/0.201
ES = effect size; pη²/K’s W coef. = partial eta squared for repeated measures ANOVAs or Kendall’s W coefficients for Friedman ANOVAs; N/A = not applicable; T = Time effect for Friedman ANOVAs; C = Condition effect; C × D = Condition × Duration interaction; MVIC = maximal voluntary isometric contraction; VAL = voluntary activation level; RMSMVIC.M−1 RF or VL = electromyographic activity (root-mean-square) of the rectus femoris or vastus lateralis muscle during the MVIC, expressed as a percentage of the maximal M-wave of the respective muscle; T50 = torque level 50 ms after the onset of the contraction; PDPOT = peak force of the potentiated electrical doublet at 100 Hz; TPT = time to peak torque after nerve stimulation with 100 Hz electrical doublet; HRt = half-relaxation time, corresponding to the latency between the force peak and a torque level equal to half the peak; PP RF and PP VL = peak-to-peak of the maximal M-wave of both muscles; * = significant difference from the initial level (p < 0.05).
Table 3. Electromyographic activity (root-mean-square) of the rectus femoris (RMSCOND.M−1 RF) and vastus lateralis (RMSCOND.M−1 VL) muscle expressed as a percentage of the maximal M-wave recorded during the MVIC prior to recording for the 14 subjects. The data are reported for each duration (i.e., 1, 3, or 6 min) for the control (CONT) and local vibration (LV) conditions.
1 Min3 Min6 Min
CONTLVCONTLVCONTLV
RMSCOND.M−1 RF(%)0.023 ± 0.0130.028 ± 0.0190.024 ± 0.020.029 ± 0.0240.042 ± 0.0420.036 ± 0.037
RMSCOND.M−1 VL (%)0.056 ± 0.0370.051 ± 0.0250.056 ± 0.0310.061 ± 0.0580.084 ± 0.1070.084 ± 0.081
Disclaimer/Publisher’s Note: The statements, opinions and data contained in all publications are solely those of the individual author(s) and contributor(s) and not of MDPI and/or the editor(s). MDPI and/or the editor(s) disclaim responsibility for any injury to people or property resulting from any ideas, methods, instructions or products referred to in the content.

