Communication

A Novel Distributed Optical Fiber Temperature Sensor Based on Raman anti-Stokes Scattering Light

1
School of Electrical and Information Engineering, Anhui University of Technology, Maanshan 243002, China
2
No.5 Gas Production Plant of Changqing Oilfield Branch, China National Petroleum Corporation (CNPC), Xi’an 710016, China
*
Author to whom correspondence should be addressed.
Appl. Sci. 2023, 13(20), 11214; https://doi.org/10.3390/app132011214
Submission received: 18 September 2023 / Revised: 8 October 2023 / Accepted: 10 October 2023 / Published: 12 October 2023
(This article belongs to the Special Issue Raman Spectroscopy: Novel Advances and Applications: 2nd Edition)

Abstract

:
In this paper, a novel distributed optical fiber temperature sensor based on Raman anti-Stokes scattering light is proposed and experimentally demonstrated. The Raman anti-Stokes scattering light is sensitive to temperature parameters that are detected by the fiber under test conditions (FUT), and this allowed the temperature demodulation algorithm to be obtained through the relationship between the temperature and the power of the back-scattered Raman anti-Stokes light. In addition, we propose a new temperature calibration method to ensure accurate temperature measurement, which is greatly affected by the stability of a pulse laser. The experimental system is constructed with an optical fiber length of approximately 3.5 km. The proposed system obtains a 24 dB dynamic range with a pulse width of 20 ns and temperature testing ranges of 30.0 °C to 80.0 °C. The results demonstrate that the maximum temperature deviation range is −1.5 °C to +1.6 °C and the root mean square (RMS) error of the whole temperature range is 0.3 °C, which means it has the potential for practical engineering applications. More importantly, it avoids the walk-off effect that must be corrected in commonly used temperature demodulation schemes adopting both Raman Stokes light and anti-Stokes light. It also saves a signal channel, which is more suitable for the integration of hybrid distributed optical fiber sensing systems for multi-parameter monitoring.

1. Introduction

Distributed optical fiber sensors have been used in practical engineering for temperature, strain, vibration, corrosion monitoring, and so on. Generally, it is based on the optical time domain reflecting structure [1,2]. A light pulse is injected into the fiber under test conditions (FUT), and this generates scattering light as it propagates along the FUT. The scattering light in the fiber contains Rayleigh light, Brillouin light, and Raman light. By extracting the different scattering lights, corresponding sensing parameters can be demodulated [3,4,5]. In addition, the position where the light scattering happens relates to the round-trip time from when the light pulse sends to the scattering light receives, so it is based on the radar principle for locating a position where an event happens. This optical time domain reflecting technology is called LiDAR (light detection and ranging) [6]. Amongst these, Raman optical time domain reflectometry (OTDR) is widely used for temperature measurement in power cable hot spot monitoring [7], partial discharge detection in voltage transformers [8], the early warning of fire in oil or gas pipe lines [9,10,11,12], etc. As the Raman scattering light is only sensitive to the temperature detected by the FUT, it is relatively simple to demodulate the temperature information compared to the Rayleigh light or the Brillouin light-based schemes, which are sensitive to both temperature and strain [13,14,15]. Although, in optical fiber, the power of Raman scattering is approximately 30 dB lower than that of Rayleigh scattering and about 15 dB lower than that of Brillouin scattering, it can also be used in most application scenarios with a relatively short range (~20 km), such as power cable lines, oil pipe lines, buildings, and warehouses for temperature monitoring and fire early warning. Generally, the Raman OTDR adopts both the Raman Stokes light and the anti-Stokes light for temperature demodulation. As the wavelength of the Raman Stokes light is approximately 200 nm apart from the anti-Stokes light, the walk-off effect is unavoidable. The walk-off effect is caused by the fact that different light wavelengths correspond to different light speeds in the FUT, so the same time recorded corresponds to different scattering positions along the FUT for the Raman Stokes light and anti-Stokes light, respectively [16,17,18]. Therefore, it is necessary to correct the positional information along the OTDR traces before using the temperature demodulation formula, or else, the obtained temperature information may be completely wrong. In other words, the Raman Stokes data and anti-Stokes data should correspond to the same light scattering position, whereupon, by the temperature demodulation formula, feasible results can be obtained.
However, it is very difficult to correct the positional information from the obtained OTDR trace data. That is because the data acquisition card (DAQ) only records times with the same time interval (time point). The total number of time points indicates the round-trip time. Furthermore, as the walk-off effect exists, the round-trip time for Raman Stokes light and Raman anti-Stokes light is not the same, which means they have different time point numbers. To correct the data points that contain the positional information and light power value, the data fitting method must be adopted, but the fitted data are not the true data. When temperature events happen at the fitted positions, the obtained temperature information can be unreliable. In addition, to achieve long sensing distance and avoid the walk-off effect, pulse coding methods [19,20,21] and corresponding data demodulation algorithms [22,23] are adopted; however, this will increase the difficulty of the pulse modulation module and the digital processing unit. Recently, hybrid optical fiber sensing technology has become an important issue. It makes full use of the light scattering spectra to obtain multiple sensing parameters [24,25,26], so the integration of optical structure and optimization of signal channels should definitely be considered. For this, the traditional Raman OTDR scheme by Raman Stokes and anti-Stokes double channels are not suitable. Therefore, we proposed a novel scheme that only adopts the Raman anti-Stokes light for distributed temperature demodulation. Actually, reference-free distributed anti-Stokes Raman thermometry was also proposed, but it adopts a fiber loop for temperature demodulation [27,28], which shortens the sensing distance to half the length of the fiber loop, and it is also a two-signal channel-based demodulation method. To simplify the system structure and the temperature demodulation algorithm, a new temperature calibration method is proposed, and this new sensing system facilitates integration with other systems based on the OTDR structure.
Notably, the traditional Raman OTDR scheme has obvious advantages. The temperature demodulation formula by Raman Stokes and the anti-Stokes trace data can overcome the instability of the output power of the pulse laser and the fluctuation of the gain factor in the two avalanche photo-detectors (APDs) because the ratio between the Raman Stokes data and the Raman anti-Stokes data eliminates the above two problems. However, by using the single-channel method using the Raman anti-Stokes data, the data should be calibrated first. That is, at a fixed position or calibration zone, in the same temperature condition (value), the Raman anti-Stokes data should be the same for any measurement. If the output power of the pulse laser changes or the gain factor of the APD fluctuates by multiplying a coefficient, the newly sampled data can be calibrated entirely in theory. Hence, a temperature calibration zone is set in front of the FUT, and corresponding temperature information and the Raman anti-stokes scattering values are recorded for reference. Then, based on the relationship between temperature and Raman anti-Stokes scattering power, the temperature demodulation formula is obtained. Compared with the traditional double channel-based scheme, the proposed distributed optical fiber temperature sensing system is much simpler in structure, and it also saves one signal channel, which benefits the integration of hybrid distributed optical fiber sensors for multi-parameter monitoring with Rayleigh and Raman scattering spectra. More importantly, the proposed system avoids the walk-off effect of the traditional scheme, so the data processing algorithm is much easier and the temperature measurement results should be more reliable.

2. Principle of the Commonly Used Temperature Demodulation

When a light pulse propagates along the FUT, it interacts with the optical fiber material, and Raman scattering light is generated. For Raman OTDR, the power of the Raman scattering light received at the fiber front end can be expressed as follows (Formula (1)):
P s ( L , T ) = P 0 K s ν s 4 R s ( T ) exp [ ( α R + α s ) L ) ]
where  P s ( L , T )  is the power of the Raman Stokes light from position L; the temperature value is T P 0  is a coefficient that linearly relates to the power of the light pulse and the fiber capturing factor of the back-scattering light;  ν s  is the frequency of the Raman Stokes light;  R s ( T )  is the factor that indicates the relationship between temperature and light power; and  α R  and  α s  are the fiber attenuation coefficients relating to the Rayleigh light and Raman Stokes light, respectively. The  R s ( T )  is described in Formula (2), where  h  is Plank’s constant;  Δ ν  is the bandwidth of the Raman scattering spectrum (approximately 13.2 THz); and  k B  is the Boltzmann’s constant.
R s ( T ) = 1 1 exp ( h Δ ν / k B T )
Similarly, the Raman anti-Stokes light can be expressed as the Formula (3),
P a ( L , T ) = P 0 K a ν a 4 R a ( T ) exp [ ( α R + α a ) L ) ]
where  P a ( L , T )  is the power of the Raman anti-Stokes light from position L; the temperature value is T ν a  is the frequency of the Raman anti-Stokes light; and  R a ( T )  is the factor that indicates the relationship between temperature and Raman anti-Stokes light power. The  R a ( T )  is described in Formula (4).
R a ( T ) = 1 exp ( h Δ ν / k B T ) 1
To demodulate the temperature T at each position L along the FUT, the power and temperature information should be calibrated first, meaning the data corresponding to  P s ( L , T 0 )  and  P a ( L , T 0 )  should be obtained with temperature fixed at  T 0 . Moreover,  P s ( L , T 0 )  and  P a ( L , T 0 )  are described in Formulas (5) and (6).
P s ( L , T 0 ) = P 0 K s ν s 4 R s ( T 0 ) exp [ ( α R + α s ) L ) ]
P a ( L , T 0 ) = P 0 K a ν a 4 R a ( T 0 ) exp [ ( α R + α a ) L ) ]
By using Formulas (1), (3), (5) and (6), the Formulas (7) and (8) can be obtained as the following.
r ( T , L ) = P a ( L , T ) P s ( L , T ) = K a K s ( ν a 4 ν s 4 ) exp ( h Δ ν K B T ) exp [ ( α s α a ) L ]
r ( T 0 , L ) = P a ( L , T 0 ) P s ( L , T 0 ) = K a K s ( ν a 4 ν s 4 ) exp ( h Δ ν K B T 0 ) exp [ ( α s α a ) L ]
The ratio between Formulas (7) and (8) is described in expression (9).
I = r ( L , T ) r ( L , T 0 ) = exp [ h Δ ν K B ( 1 T 1 T 0 ) ]
Finally, by Formula (9), the temperature T at each position L along the FUT can be demodulated as shown in expression (10).
1 T = 1 T 0 K B h Δ ν ln [ r ( L , T ) r ( L , T 0 ) ]
Hence, from the above description, it is known that the traditional temperature demodulation method needs two data channels: the Raman Stokes data and the Raman anti-Stokes data. However, as the wavelengths of the Raman Stoke light and the Raman anti-Stokes light are approximately 200 nm apart, the walk-off effect is unavoidable. Therefore, the positional information L in Formulas (7)–(10) is not the same because the Raman Stokes signal and the Raman anti-Stokes signal collected directly by the DAQ are marked by the same time intervals, and the speed of light multiplied by the time represents the position. If the walk-off effect is not corrected before the temperature demodulation by the above formula, the measured results may be wrong, especially at positions far from the fiber front end. To completely overcome this problem, a new scheme that just adopts the Raman anti-Stokes light is proposed.

3. The Optimized Raman anti-Stokes Light-Based Demodulation Method

As the output power of the pulse laser may not be stable, a calibration zone should be set first. A fiber front end with a length of approximately 100 m was chosen, and a thermometer was adopted to measure the temperature value for reference. Thus, the calibration data  P a ( L c , T c )  can be described as Formula (11).
P a ( L c , T c ) = P 0 K a ν a 4 R a ( T c ) exp [ ( α R + α a ) L c ) ]
where  L c  is a fixed position, for example, 80 m from the fiber front end, and  T c  is the temperature value in real measurement. Moreover, by using the fiber attenuation coefficient measured from the OTDR trace, the calibrated data can be obtained and saved as a reference, which is described in Formula (12).
P a ( L , T c ) = P 0 K a ν a 4 R a ( T c ) exp [ ( α R + α a ) L ) ]
However, in the next measurement, the Raman anti-Stokes signal obtained is marked as  P a R ( L , T ) . In the calibration zone, the temperature  T c  may change to be  T 1 , and the output power of the pulse laser may change by a factor R, so the corresponding Raman anti-Stokes signal at the calibrated position  L c  can be expressed by Formula (13).
P a R ( L c , T 1 ) = R P 0 K a ν a 4 R a ( T 1 ) exp [ ( α R + α a ) L c ) ]
Moreover, by Formulas (11) and (12), the factor R can be computed by expressions (14) and (15).
P a ( L c , T c ) P a R ( L c , T 1 ) = 1 R R a ( T c ) R a ( T 1 ) = 1 R exp ( h Δ ν / k B T 1 ) 1 exp ( h Δ ν / k B T c ) 1
R = exp ( h Δ ν / k B T 1 ) 1 exp ( h Δ ν / k B T c ) 1 P a R ( L c , T 1 ) P a ( L c , T c )
In Formulas (3) and (12), the temperature T at each position L along the FUT can be obtained. This process is shown in expressions (15) and (16).
P a R ( L , T ) P a ( L , T c ) = R R a ( T ) R a ( T c ) = R exp ( h Δ ν / k B T c ) 1 exp ( h Δ ν / k B T ) 1
1 T = K B h Δ ν ln { [ R ( exp ( h Δ ν / k B T c ) 1 ) ] P a ( L , T c ) P a R ( L , T ) + 1 }
From expression (16), it can be seen that the new scheme completely avoids the complex issue of walk-off effect correction in traditional double-channel-based methods. What is more, it saves a data channel, which has benefits for the integration of hybrid distributed optical fiber sensing systems.

4. Experiment and Results Discussion

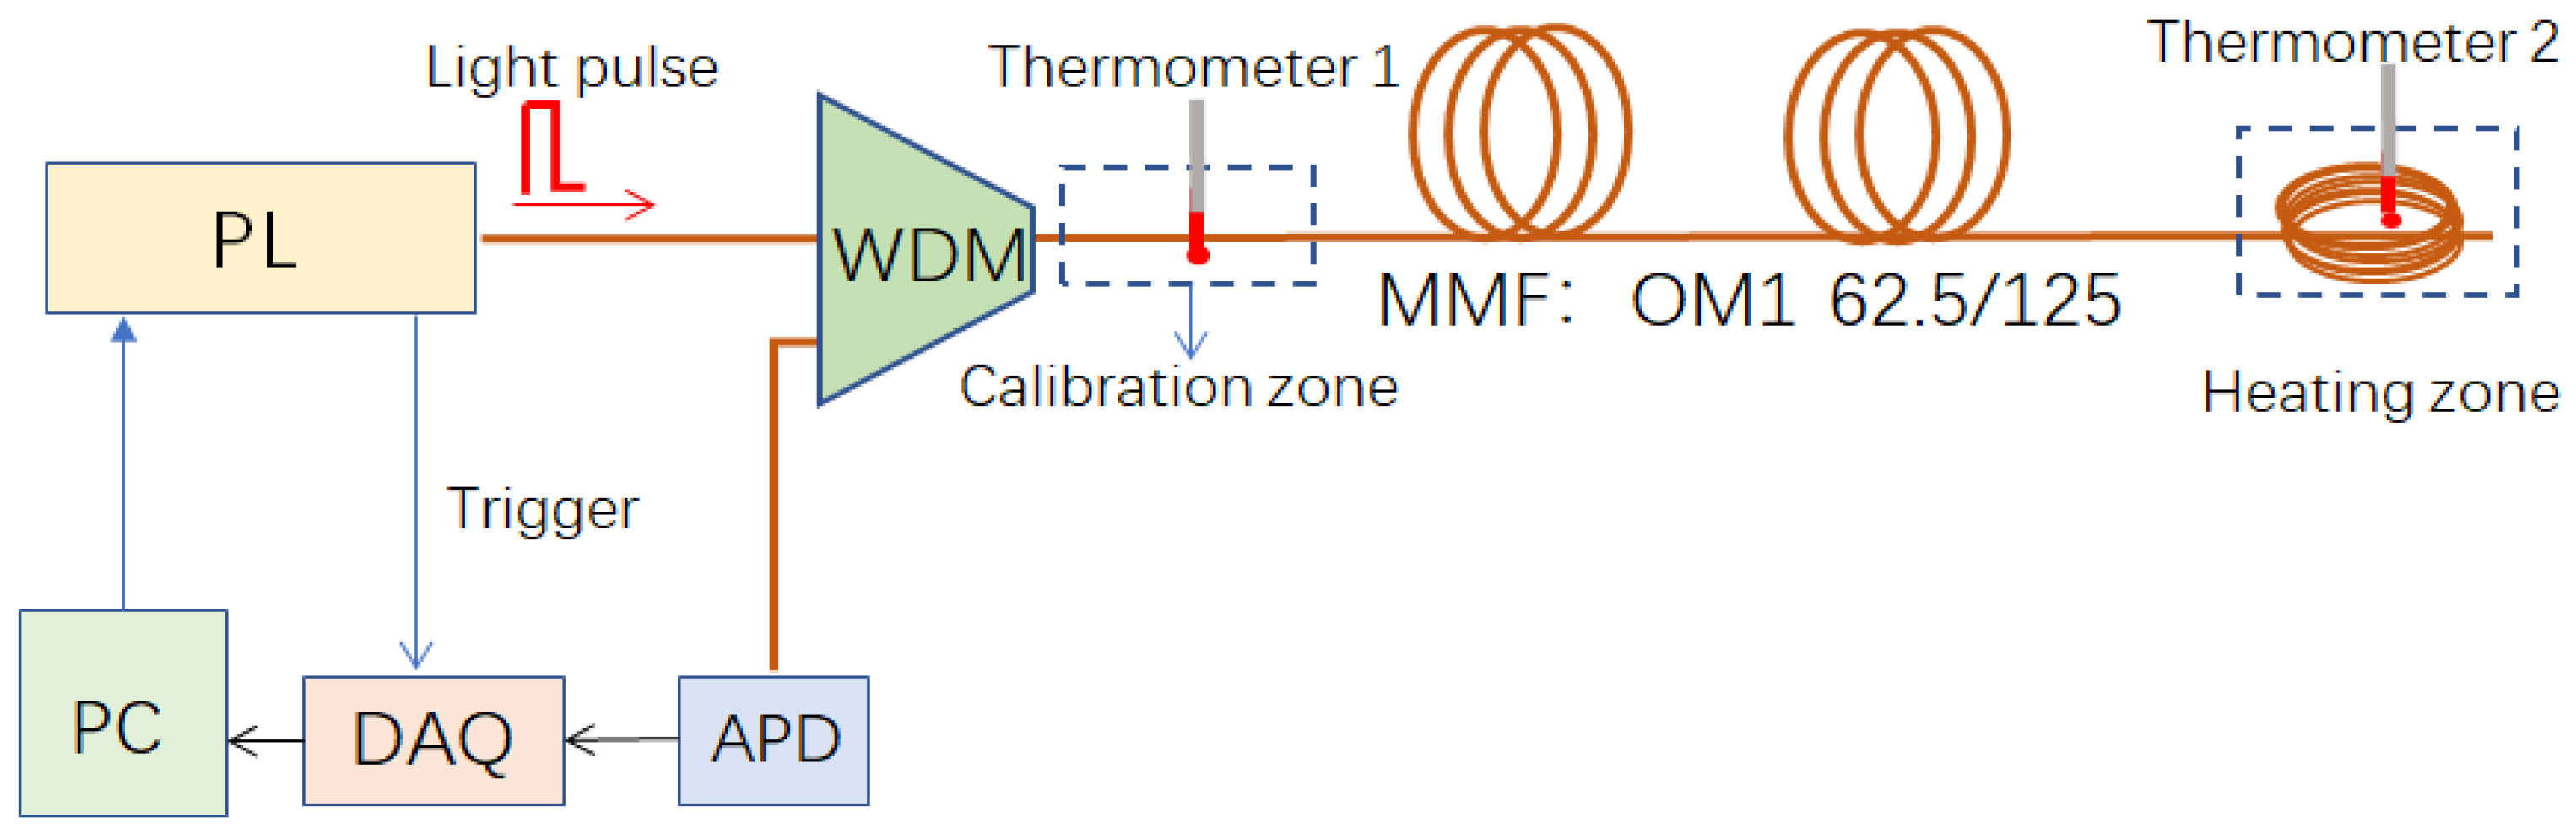
4.1. Experimental Set-Up

The experimental set-up is shown in Figure 1. The pulse laser (PL) generates probe pulse light with a pulse width of 20 ns, which is launched into the wavelength division multiplexer (WDM). Through the output port of the WDM, the light pulse comes into the FUT, which is a multi-mode fiber (MMF) of type OM1 62.5/125. The MMF is silica fiber with a gradient index distribution; the fiber core’s group refractive index is approximately 1.496 at 1550 nm, and the refractive index of the cladding is approximately 1.472. The wavelength of the PL source is 1550.12 nm. The peak power of the pulse light is approximately 33 dBm. The back-scattered Raman anti-Stokes light goes through the WDM, and it is de-multiplexed in the 1450 nm channel. Following this, the Raman anti-Stokes light is converted to an electric signal by the APD. The data acquisition card (DAQ) with a sampling rate of 100 Msps collects and averages the corresponding voltage signal from the APD. The OTDR trace was obtained with an average of 10,000 times and is shown in Figure 2. The two peaks in Figure 2 correspond to the fiber front end and the fiber back end because a strong reflection phenomenon occurs when the pulse light interacts with the fiber ends. As the peaks represent the fiber’s front end and back end, respectively, they are generally adopted to correct the walk-off effect in the traditional double-channel-based temperature demodulation method for positional marking. The personal computer (PC) also controls the PL and sets the parameters for the probe’s pulse, such as the pulse width and the peak pulse power. The calibration zone is set within a range of approximately 100 m at the fiber front end. The function of the calibration zone is to obtain reference data at a known temperature  T c  (21.2 °C) for temperature demodulation along each position in the FUT. In addition, it helps to correct the variance caused by changes to the output power of the PL and the gain factor fluctuation of the APD.
In the experiment, a thermometer is used to record temperature information in the calibration zone, so the data  P a ( L c , T c )  and  P a R ( L c , T 1 )  in Formulas (11) and (13) can be obtained, whereupon the correction coefficient R can be computed by Formula (15). In Figure 1, a heating zone is set at the end of the FUT for measuring temperature within a certain range. In the heating zone, a fiber section with a length of approximately 50 m is wound into a bundle and soaked in hot water. Another thermometer is set in the heating zone to record the water temperature. The temperature values recorded are then compared with the values measured by the sensing system to estimate its performance. To analyze the dynamic range (DR) of the Raman anti-Stokes temperature sensing system, the unit of the signal power information (in volts) is converted to logarithmic units in dB, as shown in Figure 3. It can be seen from Figure 3 that the DR is approximately 24 dB and the fiber attenuation coefficient is 0.703 dB/km. The fiber attenuation coefficient corresponds to the factor  ( α R + α a )  in formula (11). It consists of two processes: the first is the attenuation of the light pulse propagation, which corresponds to the Rayleigh light attenuation coefficient  α R  as the wavelength of the pulse light is the same with Rayleigh light; and the second is the Raman anti-Stokes light back-propagation, which relates to the attenuation coefficient of the Raman anti-Stokes light  α a . In addition, an MMF with a larger fiber core can be adapted to work with fiber scattering spectra-based distributed optical fiber sensing technology, and the modal attenuation and mode coupling should be analyzed before its application [29].
For the proposed sensing system, the fiber range for temperature measurements in theory is approximately 34.1 km, which is computed by the ratio between DR (24 dB) and the fiber attenuation coefficient (0.703 dB/km). For a sensor, the distance covered by the measurement is a very important parameter. Generally, the parameter in distributed optical fiber sensors is described by DR. Another important parameter is spatial resolution; for example, a pulse light with a pulse width of 20 ns corresponds to a spatial resolution of 2 m [30]. As the power of Raman scattering is approximately 30 dB lower than that of Rayleigh scattering, the DR cannot be very high, and in most cases, the measurement range is lower than 30 km. The peak pulse power of the pulse light can be improved so that a higher DR can be obtained, but the peak pulse power is limited by the nonlinear optical effects, such as stimulated Brillouin scattering, stimulated Raman scattering, self-phase modulation, and so on [31]. In addition, to improve the sensitivity of the APD, the DR can be enhanced, but this increases the cost of the sensing system. Generally, the DR is improved by increasing the average OTDR trace number; however, this extends the measurement time of the system [30].
The fiber attenuation coefficient is indicated by the slope of the trace between the two peaks in Figure 2. This is an important parameter because, with it and the power value  P a ( L c , T c )  at position  L c , reference data or a trace with the calibration temperature at  T c  can be reconstructed by the linear attenuation characteristics (in dB) of the FUT, so that  P a ( L , T c )  in Formula (15) is obtained. Of course, for simplicity, the whole FUT can be set to room temperature, which is also marked by  T c , and the data sampled by the DAQ in this condition is  P a ( L , T c ) . Then, after putting the fiber heating zone into hot water, the  P a R ( L , T )  in Formula (15) can be obtained by the DAQ in the next sampling program.

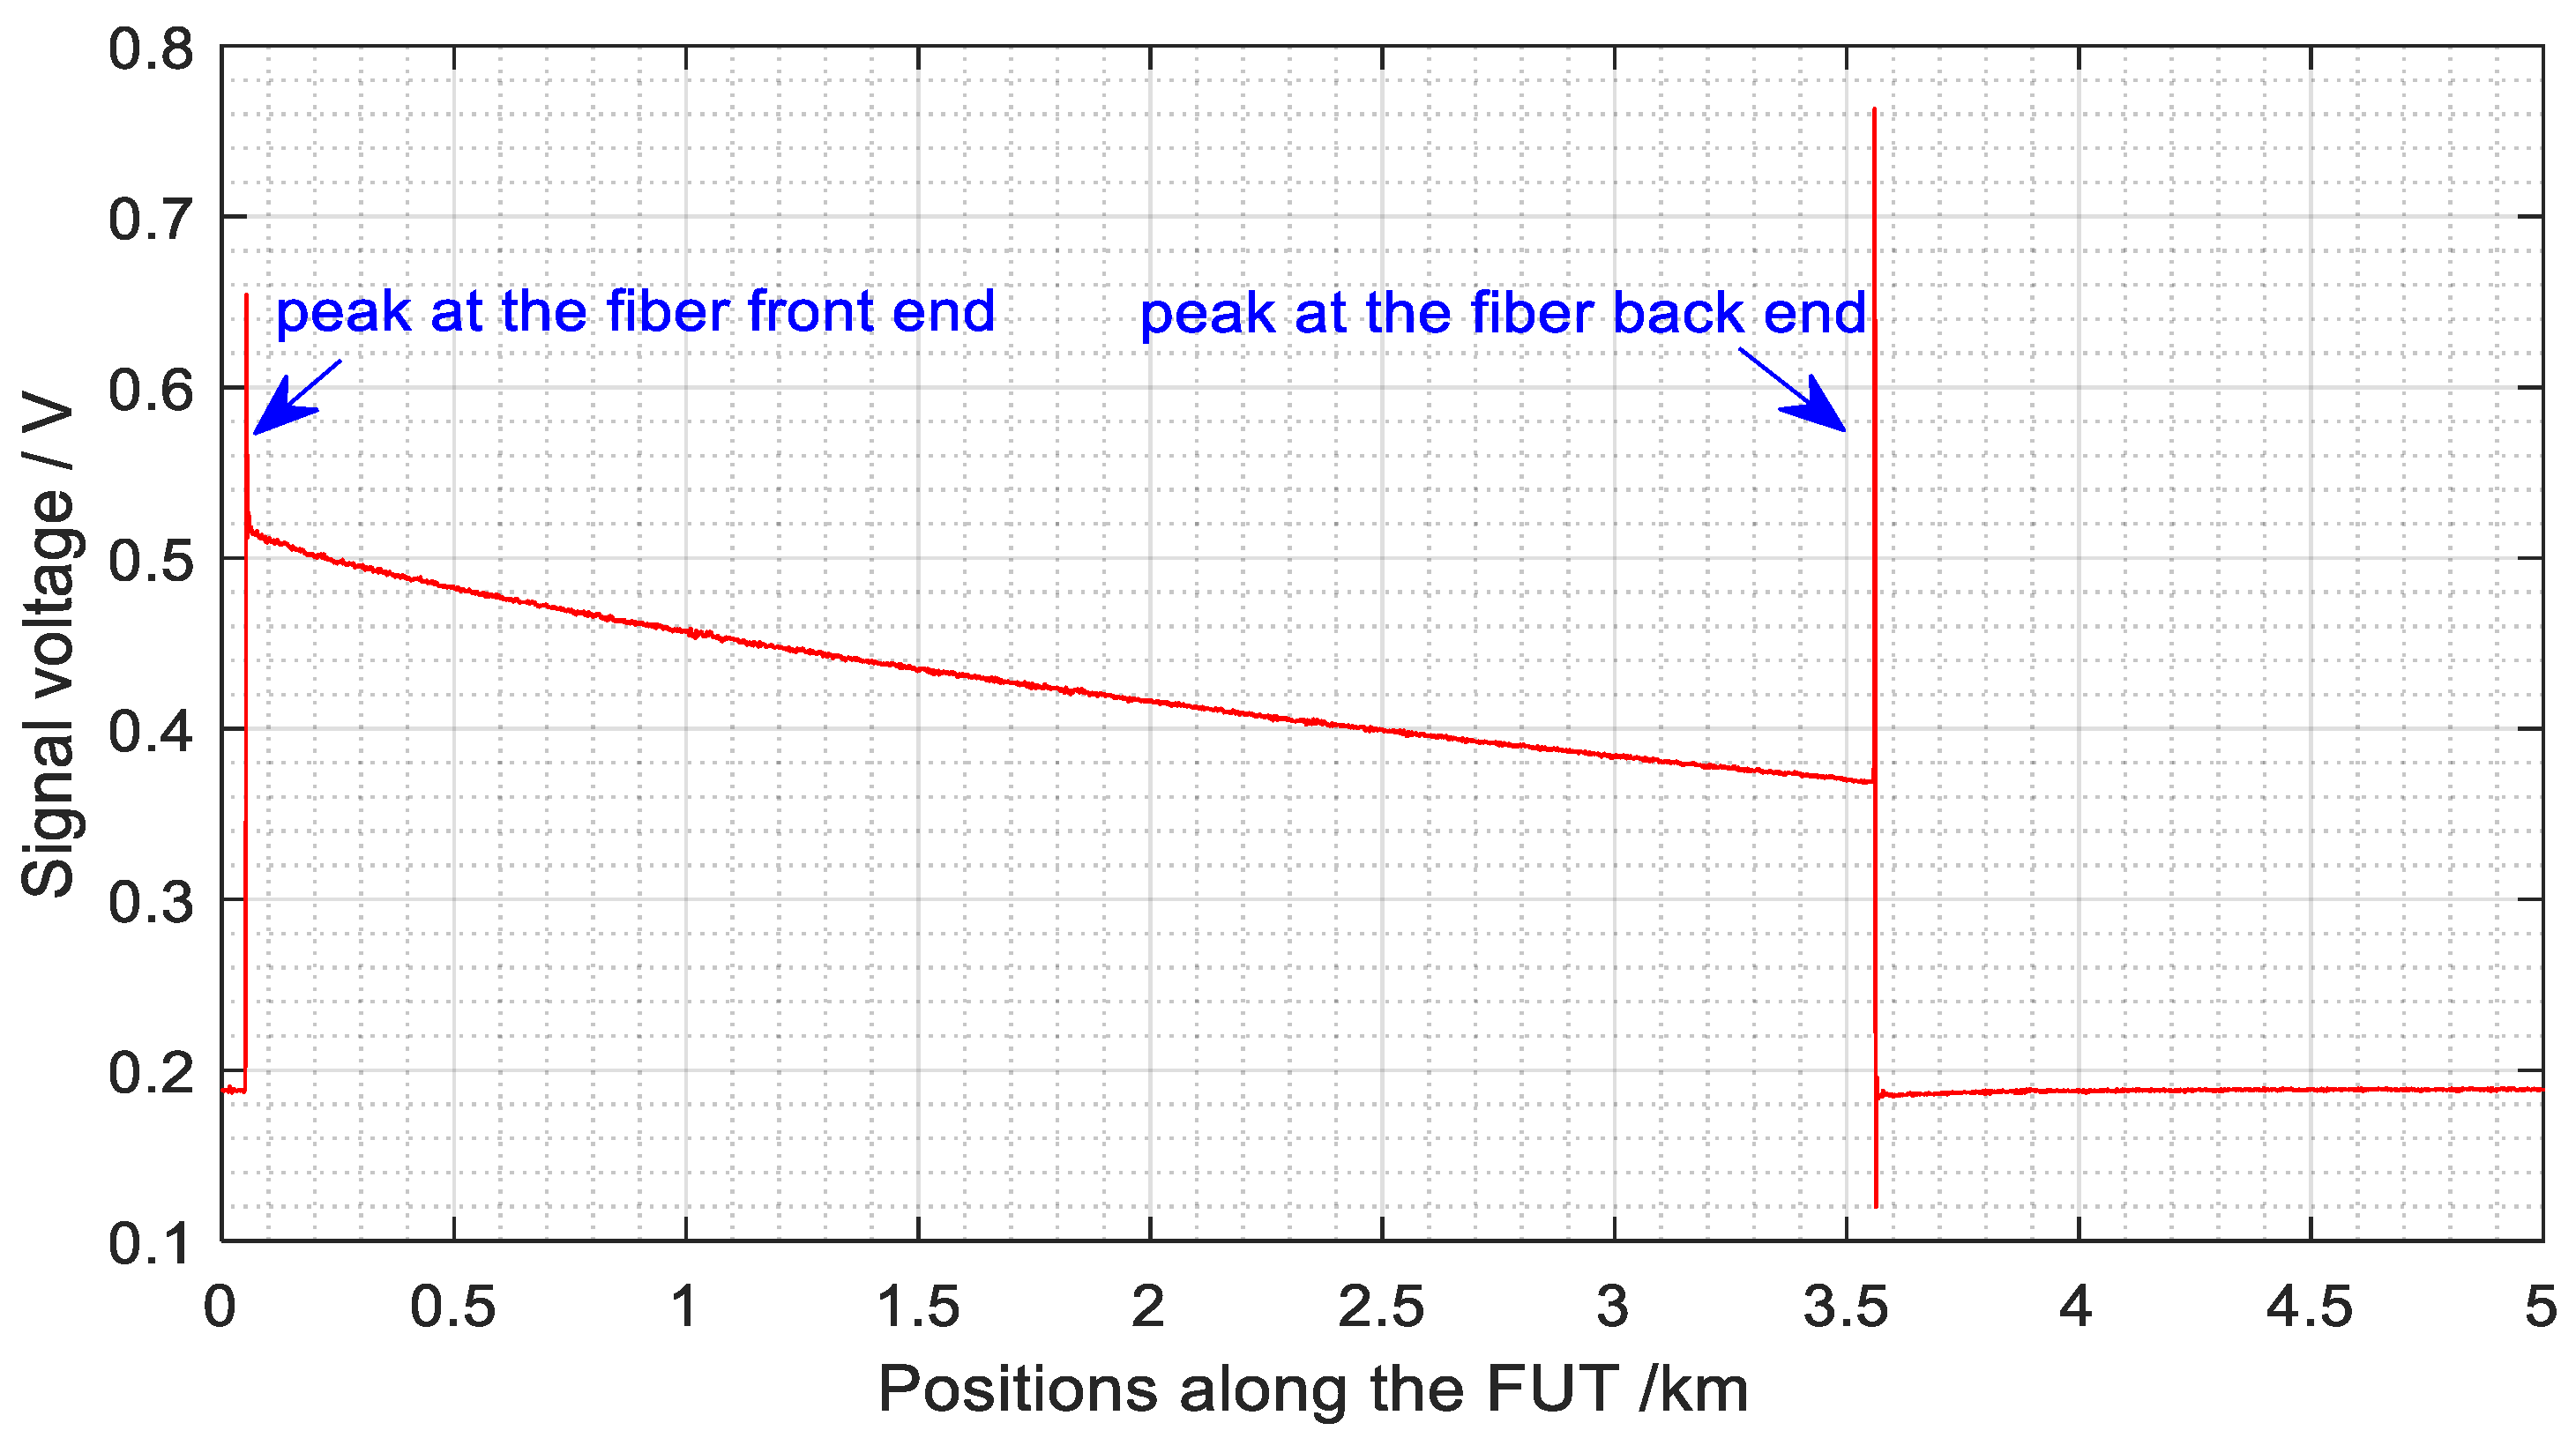
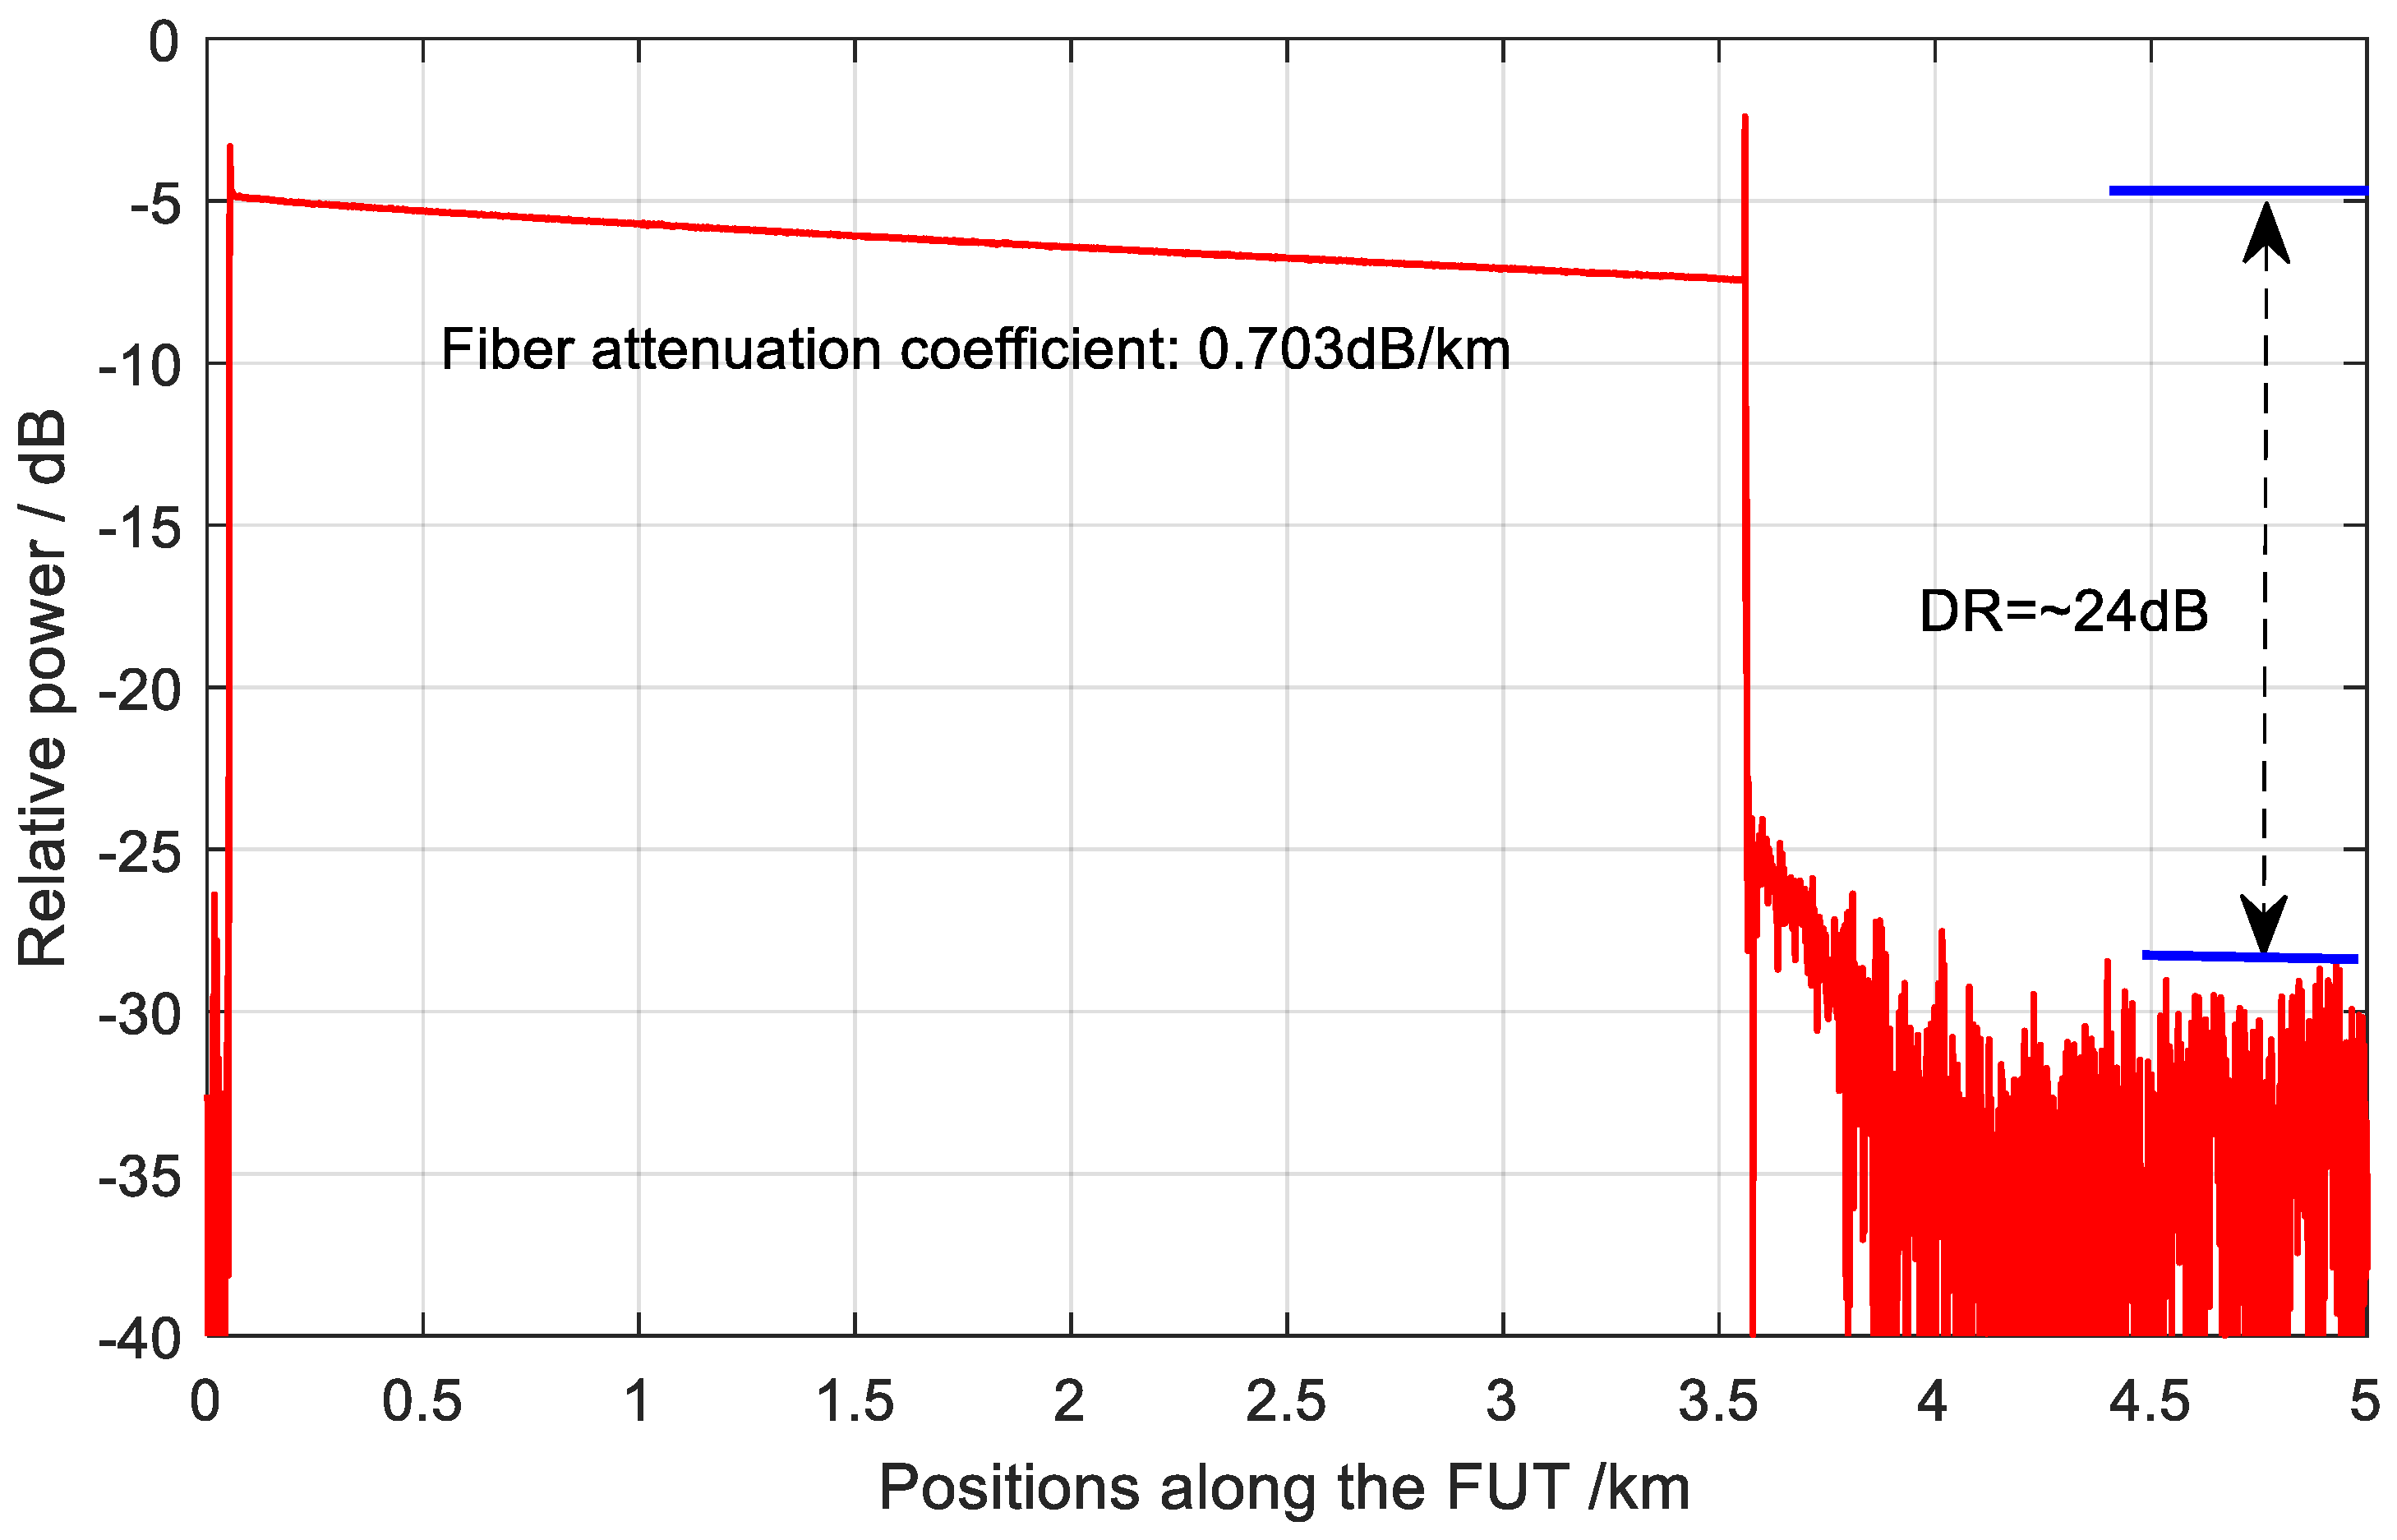
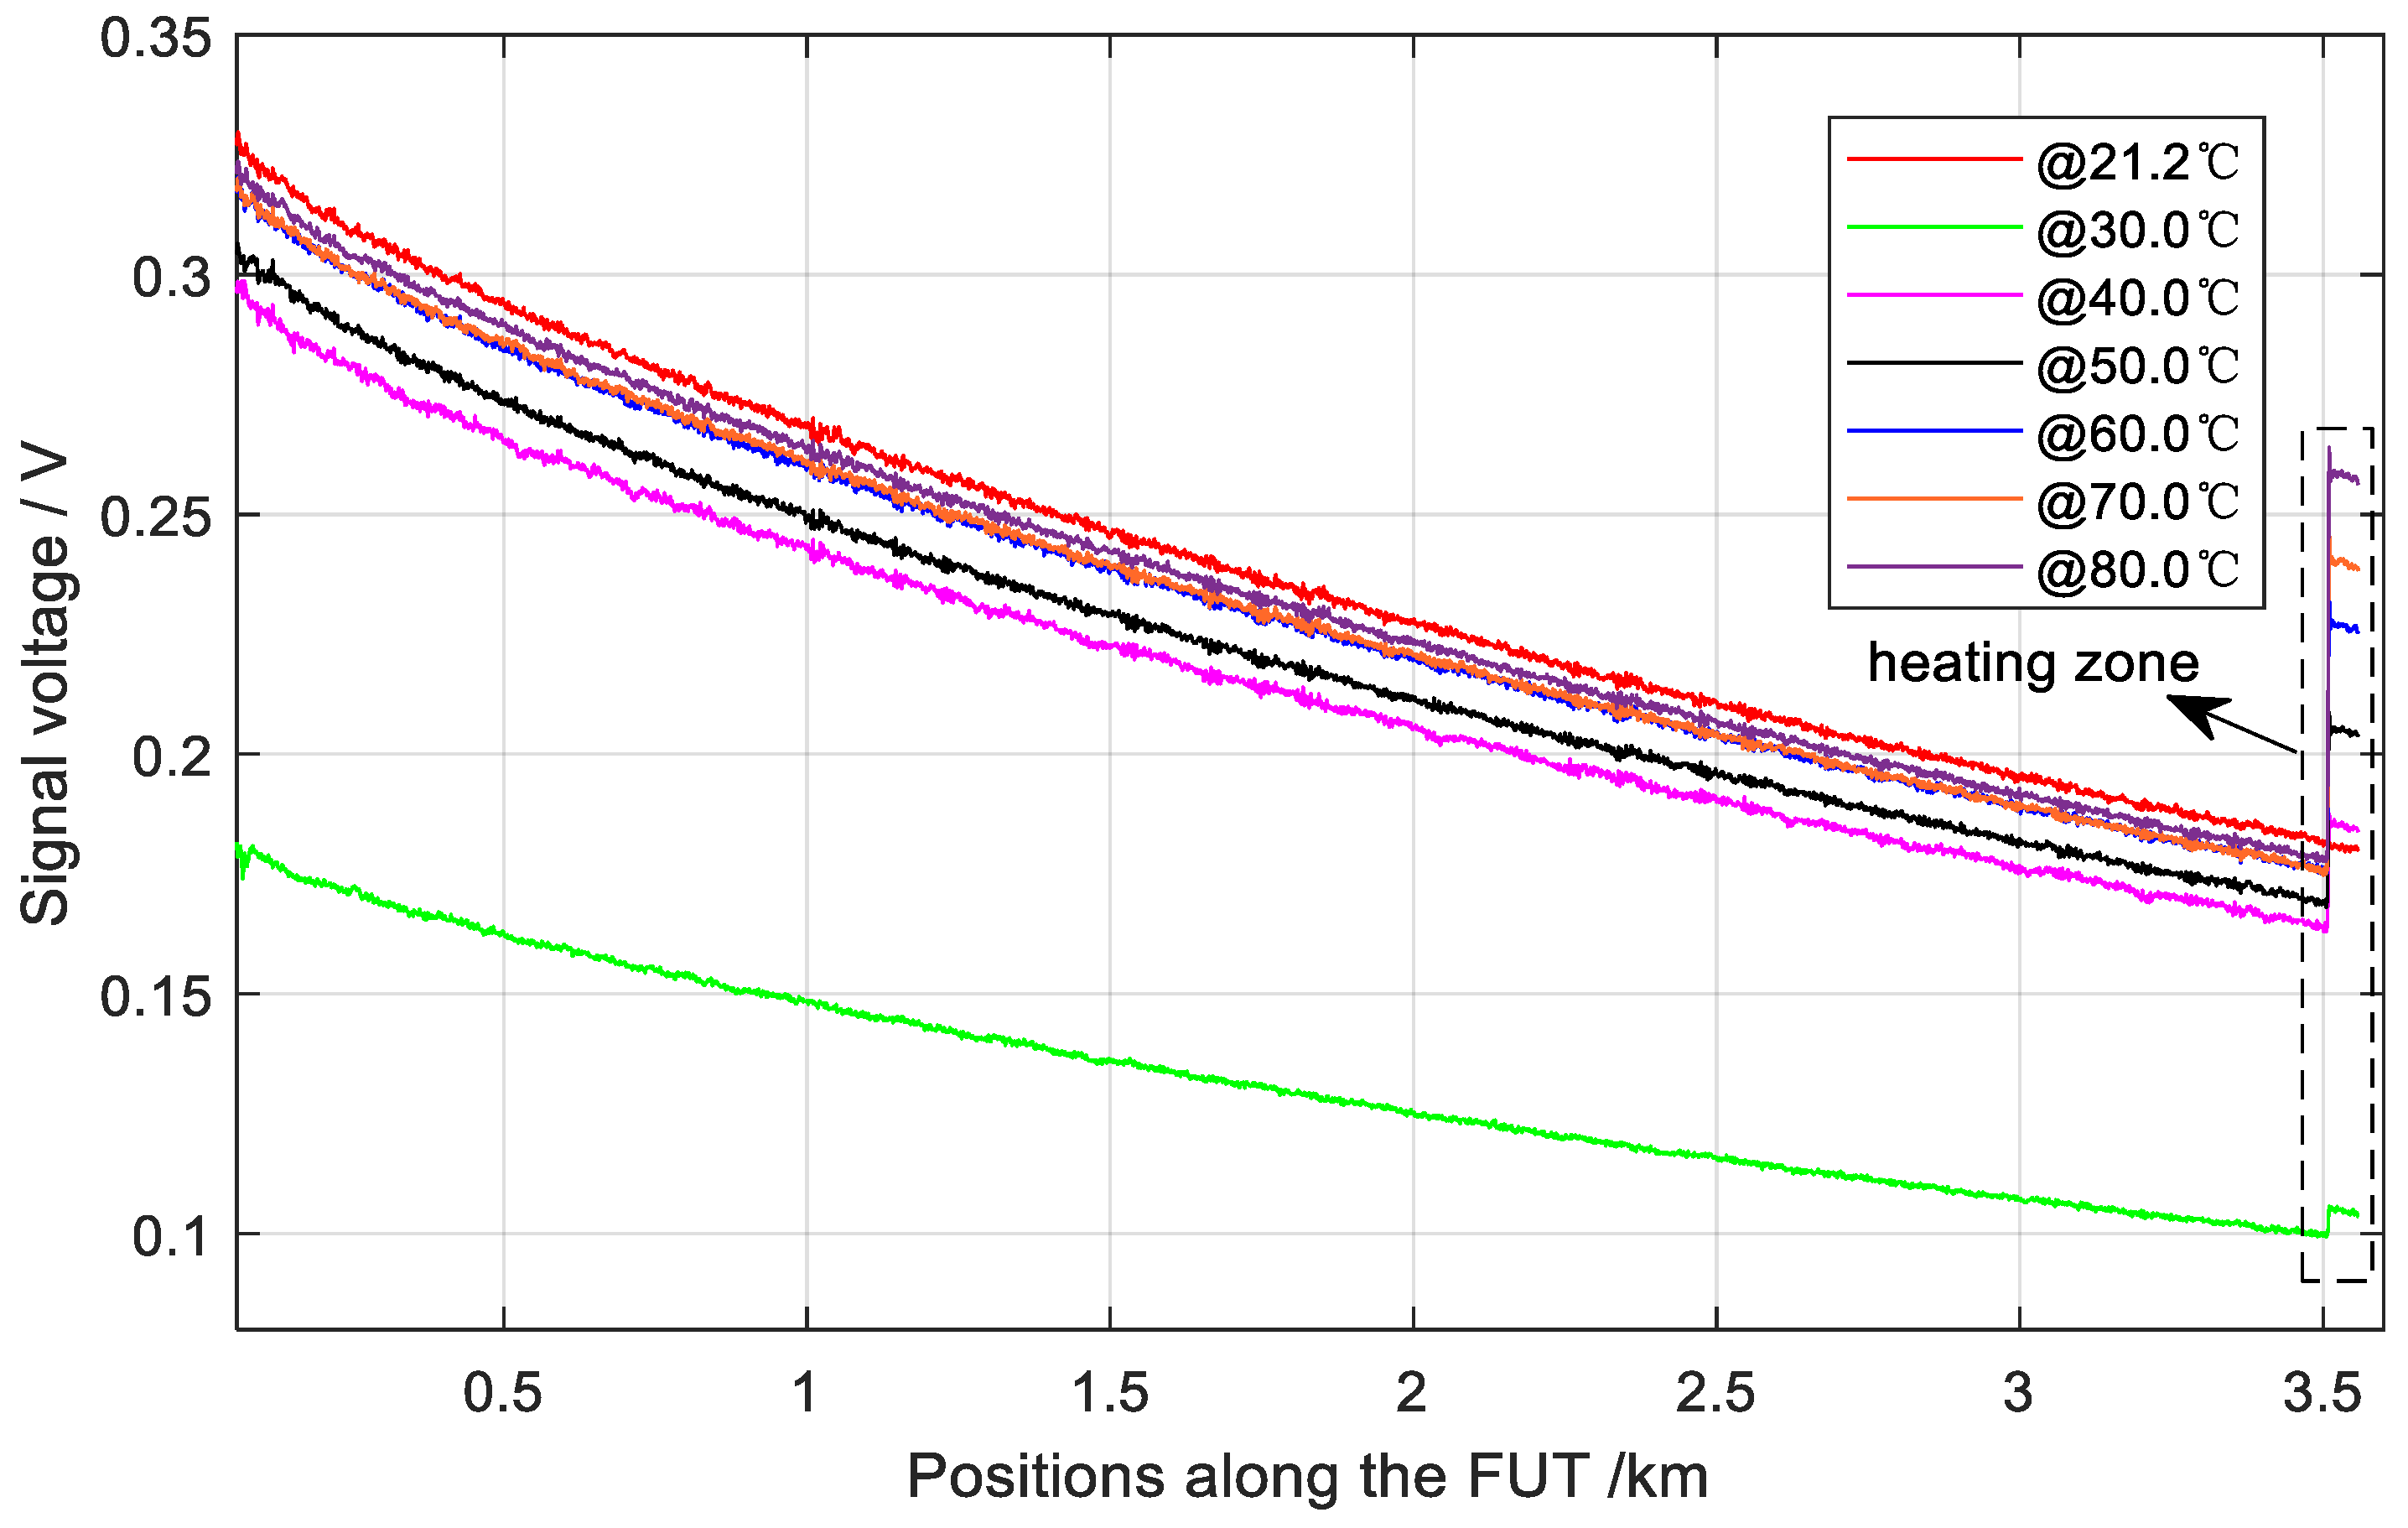
4.2. Results and Discussions

To conduct the temperature measurement experiment, we first placed the whole FUT at room temperature (21.2 °C) to obtain the calibration trace data. Then the fiber section for the heating zone was put into hot water, and the temperature, which ranged from 30.0 °C to 80.0 °C, was tested. OTDR traces of the Raman anti-Stokes light are shown in Figure 4. It was found that the OTDR traces corresponding to the fiber section at room temperature are not coincident, which means that the output power of the PL or the gain factor of the APD is instable. In particular, the OTDR trace with the temperature of the heating zone at 30.0 °C is far below the others. We infer that the PL is the key problem because it contains a directly modulated laser diode (LD) and an erbium-doped fiber amplifier (EDFA) module, which makes it quite difficult to control the pulse shape and stabilize the gain of the EDFA. Therefore, with the temperature measurement method that only adopts the Raman anti-Stokes light, it is essential to correct the coefficient R in Formula (13).
Next, the temperature measurement results along the whole FUT are computed, as shown in Figure 5, where the room temperature in the experiment is nearly kept stable at 21.2 °C. The temperature traces (except the heating zone) are almost coincident; however, there is a fluctuation of approximately ±1.0 °C, which is caused by the randomness of light scattering and can be reduced by increasing the OTDR trace average number.
The details of the temperature measurement result in the heating zone are shown in Figure 6. At the transition positions between the heating zone and non-heating zone, there is a temperature peak that is caused by light scattering with simultaneous light pulses in two different temperature zones. This disturbs the temperature-power relationship  R a ( T )  in Formula (4). The average values of temperature measurement are marked on the right side in Figure 6. The maximum temperature deviation range is −1.5 °C to +1.6 °C, and the root mean square (RMS) error within the whole temperature measurement range is 0.3 °C. Considering the accuracy of the thermometer (approximately ±0.5 °C), we believe that the measurement results are reliable and the scheme proposed is feasible for practical use.
In the experiment, the temperature measurement range adopted is just within 30.0 to 80.0 °C, which is relatively small for a practical temperature measurement application. However, we think that it also possesses the performance for temperature measurement with large temperature ranges, such as −30.0 °C to 120.0 °C, because the basic principle originates from temperature sensitivity Formulas (3), (4), (6) and (8) in the traditional dual-channel-based scheme. Moreover, the newly proposed scheme based on Raman anti-Stokes light shall possess the same temperature measurement range in theory. In our work, the reliability of the temperature demodulation algorithm that simply adopts the data of Raman anti-Stokes signals has been experimentally demonstrated, so we believe that the temperature measurement range of the proposed sensing system should be the same as the commonly used Raman Stokes and anti-Stokes light-based scheme. As the distributed optical fiber temperature sensing scheme only adopts one channel for the Raman anti-Stokes light signal sampling and processing, it brings two advantages. The first advantage is that it can completely overcome the walk-off effect in traditional dual-channel-based schemes. The second is that it has benefits for the integration of hybrid distributed optical fiber sensing systems for multi-parameter monitoring using different light spectra, for example, both Raman scattering light and Rayleigh scattering light [25].

5. Conclusions

A Raman anti-Stokes scattering light-based distributed optical fiber temperature sensor is proposed and experimentally demonstrated. A calibration zone is set at the front end of the sensing fiber, which helps to obtain and correct the Raman anti-Stokes power value and temperature information. In addition, a calibration algorithm is proposed to correct the power variance of the scattering light caused by the fluctuation of output power in the pulse laser and the instability of the gain factor of the APD. Moreover, a reference about the power and temperature information along the sensing fiber is obtained, and, according to the derived temperature demodulation formula, the temperature value along the sensing fiber can be computed. In the experiment, the new sensing system is constructed with a sensing fiber length of approximately 3.5 km; a 24 dB dynamic range is achieved; temperature testing in a range from 30.0 °C to 80.0 °C achieves a maximum temperature deviation range of −1.5 °C to +1.6 °C; and the RMS error in the whole temperature range is 0.3 °C. The new temperature sensor avoids the walk-off effect that must be corrected in commonly used temperature demodulation schemes adopting both Raman Stokes light and anti-Stokes light. Therefore, it saves a signal sampling channel and some photo-electric devices, such as an APD, which has benefits for the integration of hybrid distributed optical fiber sensing systems for multi-parameter monitoring by using different light spectra.

Author Contributions

Conceptualization, L.L. and C.L.; methodology, L.L. and Y.W.; software, Y.W.; validation, L.L. and M.H.; formal analysis, L.L.; investigation, J.F., X.S. and C.L.; resources, L.L.; data curation, Y.W.; writing—original draft preparation, L.L. and C.L.; writing—review and editing, L.L.; funding acquisition, L.L. All authors have read and agreed to the published version of the manuscript.

Funding

This work was funded by the Natural Science Foundation of China with Grant No. 51977001.

Institutional Review Board Statement

Not applicable.

Informed Consent Statement

Not applicable.

Data Availability Statement

Not applicable.

Conflicts of Interest

The authors declare no conflict of interest.

References

  1. Dakin, J.; Pratt, D.; Bibby, G.; Ross, J. Distributed optical fibre Raman temperature sensor using a semiconductor light source and detector. Electron. Lett. 1985, 21, 569–570. [Google Scholar] [CrossRef]
  2. Dakin, J.; Pratt, D.; Bibby, G.; Ross, J. Temperature distribution measurement using Raman ratio thermometry. In Proceedings of the SPIE Fiber Optic and Laser Sensors III, San Diego, CA, USA, 3 January 1986. [Google Scholar]
  3. Seabrook, B.; Ellmauthaler, A.; LeBlanc, M.; Jaaskelainen, M.; Maida, J.; Wilson, G. Comparison of Raman, Brillouin, and Rayleigh Distributed Temperature Measurements in High-Rate Wells. Petrophysics 2022, 63, 685–699. [Google Scholar]
  4. Pendão, C.; Silva, I. Optical Fiber Sensors and Sensing Networks: Overview of the Main Principles and Applications. Sensors 2022, 22, 7554. [Google Scholar] [CrossRef]
  5. Lu, L.; Su, X.; Zhang, C.; Gao, Q.; Bu, X. Study on the Efficiency of Temperature/Strain Measurement for Ultra-Long-Distance Optical Fiber Composite Overhead Power Transmission Lines. Appl. Sci. 2022, 12, 11043. [Google Scholar] [CrossRef]
  6. Philen, D.; White, I.; Kuhl, J.; Mettler, S. Single-Mode Fiber OTDR: Experiment and Theory. IEEE Trans. Microw. Theory Tech. 1982, 30, 1487–1496. [Google Scholar] [CrossRef]
  7. Gunes, Y.; Sait, E. A distributed optical fiber sensor for temperature detection in power cables. Sens. Actuators A Phys. 2006, 125, 148–155. [Google Scholar]
  8. Ma, G.; Wang, Y.; Qin, W.; Zhou, H.; Yan, C.; Jiang, J.; Ju, Y. Optical sensors for power transformer monitoring: A review. High Voltage 2021, 6, 367–386. [Google Scholar] [CrossRef]
  9. Lalam, N.; Syed, I.; Karki, D.; Weisenberg, K.; Wright, R.; Ohodnicki, P. Robotic fiber optic internal deployment tool for pipeline integrity monitoring. In Proceedings of the Fiber Optic Sensors and Applications XVIII 2022, Orlando, FL, USA, 3–7 April 2022. [Google Scholar]
  10. Yin, J.; Li, Z.; Liu, Y.; Liu, K.; Chen, J.; Xie, T.; Shi, B. Toward establishing a multiparameter approach for monitoring pipeline geohazards via accompanying telecommunications dark fiber. Opt. Fib. Technol. 2022, 68, 102765. [Google Scholar] [CrossRef]
  11. Silva, M.; Alves, H.; Oliveira, H.; Leão, L.; Nascimento, J.; Martins-Filho, J. Temperature, Refractive Index, and Corrosion Simultaneous Monitoring Using Raman Anti-Stokes Reflectometric Optical Fiber Sensor. IEEE Trans. Instrum. Meas. 2023, 72, 3277928. [Google Scholar] [CrossRef]
  12. Zhao, F.; Zhang, S.; Zhao, H.; Yu, L.; Feng, Q.; He, J. An intelligent optical fiber-based prewarning system for oil and gas pipelines. Opt. Fib. Technol. 2022, 71, 102953. [Google Scholar] [CrossRef]
  13. Kikuchi, K.; Naito, T.; Okoshi, T. Measurement of Raman scattering in single-mode optical fiber by optical time-domain reflectometry. IEEE J. Quan. Electron. 1988, 24, 1973–1975. [Google Scholar] [CrossRef]
  14. Li, J.; Zhang, M. Physics and applications of Raman distributed optical fiber sensing. Light Sci. Appl. 2022, 11, 128. [Google Scholar] [CrossRef]
  15. Ip, E.; Fang, J.; Li, Y.; Wang, Q.; Huang, M.; Salemi, M.; Huang, Y. Distributed fiber sensor network using telecom cables as sensing media: Technology advancements and applications. J. Opt. Commun. Netw. 2022, 14, 61–68. [Google Scholar] [CrossRef]
  16. Soto, M.; Bolognini, G.; Di Pasquale, F. Analysis of optical pulse coding in spontaneous Brillouin-based distributed temperature sensors. Opt. Expr. 2008, 16, 19097–19111. [Google Scholar] [CrossRef] [PubMed]
  17. Li, J.; Zhou, X.; Yin, Z.; Wang, C.; Xu, Y.; Zhang, J.; Zhang, M. Reconstruction compression correlation demodulation for Raman optical time domain reflection. Adv. Photonics Res. 2021, 2, 2100047. [Google Scholar] [CrossRef]
  18. Li, J.; Wang, C.; Cao, K.; Fan, B.; Zhou, X.; Xu, Y.; Cheng, Z.; Zhang, Q.; Qiao, L.; Xue, X.; et al. Breakthrough the physical barrier on spatial resolution in Raman distributed fiber sensing using chaotic correlation demodulation. APL Photonics 2023, 8, 076105. [Google Scholar] [CrossRef]
  19. Bolognini, G.; Park, J.; Soto, M.; Park, N.; Di Pasquale, F. Analysis of distributed temperature sensing based on Raman scattering using OTDR coding and discrete Raman amplification. Meas. Sci. Technol. 2007, 18, 3211. [Google Scholar] [CrossRef]
  20. Park, J.; Bolognini, G.; Lee, D.; Kim, P.; Cho, P.; Di Pasquale, F.; Park, N. Raman-based distributed temperature sensor with simplex coding and link optimization. IEEE Photonics Technol. Lett. 2006, 18, 1879–1881. [Google Scholar] [CrossRef]
  21. Xu, Z.; Ling, J.; Ye, W.; Xu, Z.; Wang, W. Spatial Resolution Optimization technology of Raman OTDR Using Variable Sampling Rate. IEEE Sens. J. 2023, 23, 10500–10508. [Google Scholar] [CrossRef]
  22. Zhu, W.; Wu, H.; Chen, W.; Zhou, M.; Yin, G.; Guo, N.; Zhu, T. Submetric Spatial Resolution ROTDR Temperature Sensor Assisted by Wiener Deconvolution. Sensors 2022, 22, 9942. [Google Scholar] [CrossRef]
  23. Ghafoori, Y.; Vidmar, A.; Kryžanowski, A. A Dynamic Calibration of Optical Fiber DTS Measurements Using PEST and Reference Thermometers. Sensors 2022, 22, 3890. [Google Scholar] [CrossRef]
  24. Amira, Z.; Mohamed, B.; Tahar, E. Monitoring of temperature in distributed optical sensor: Raman and Brillouin spectrum. Optik 2016, 127, 4162–4166. [Google Scholar] [CrossRef]
  25. Lu, L.; Yong, M.; Wang, Q.; Bu, X.; Gao, Q. A hybrid distributed optical fiber vibration and temperature sensor based on optical Rayleigh and Raman scattering. Opt. Commun. 2023, 529, 129096. [Google Scholar] [CrossRef]
  26. Song, Y.; Chen, W.; Wan, F.; Zhang, Z.; Du, L.; Wang, P.; Li, J.; Wu, Z.; Huang, H. Online multi-parameter sensing and condition assessment technology for power cables: A review. Electr. Power Syst. Res. 2022, 210, 108140. [Google Scholar] [CrossRef]
  27. Datta, A.; Sankar, V.; Srinivasan, B. Challenges and opportunities in distributed anti-Stokes Raman thermometry. ISSS J. Micro Smart Syst. 2022, 11, 179–206. [Google Scholar] [CrossRef]
  28. Datta, A.; Mamidala, H.; Venkitesh, D.; Srinivasan, B. Reference-free real-time power line monitoring using distributed anti-Stokes Raman thermometry for smart power grids. IEEE Sens. J. 2019, 20, 7044–7052. [Google Scholar] [CrossRef]
  29. Savović, S.; Djordjevich, A.; Simović, A.; Drljača, B. Equilibrium mode distribution and steady-state distribution in 100–400 µm core step-index silica optical fibers. Appl. Opt. 2011, 50, 4170–4173. [Google Scholar] [CrossRef] [PubMed]
  30. King, J.; Smith, D.; Richards, K.; Timson, P.; Epworth, R.; Wright, S. Development of a coherent OTDR instrument. J. Light. Technol. 1987, 5, 616–624. [Google Scholar] [CrossRef]
  31. Izumita, H.; Koyamada, Y. The performance limit of coherent OTDR enhanced with optical fiber amplifiers due to optical nonlinear phenomena. J. Light. Technol. 1994, 12, 1230–1238. [Google Scholar] [CrossRef]
Figure 1. Schematic diagram of the experimental set-up. PL: pulse laser; WDM: wavelength division multiplexer; MMF: multi-mode fiber; APD: avalanche photo-detector; DAQ: data acquisition card; PC: personal computer.
Applsci 13 11214 g001
Figure 2. The OTDR trace of the Raman anti-Stokes light.
Applsci 13 11214 g002
Figure 3. The DR of the temperature measurement system.
Applsci 13 11214 g003
Figure 4. The OTDR traces of the Raman anti-Stokes light at different heating temperatures.
Applsci 13 11214 g004
Figure 5. The temperature measurement results along the whole FUT.
Applsci 13 11214 g005
Figure 6. The temperature measurement results in a heating zone.
Applsci 13 11214 g006
Disclaimer/Publisher’s Note: The statements, opinions and data contained in all publications are solely those of the individual author(s) and contributor(s) and not of MDPI and/or the editor(s). MDPI and/or the editor(s) disclaim responsibility for any injury to people or property resulting from any ideas, methods, instructions or products referred to in the content.

