
Effects of Dry Density and Moisture Content on the Kaolin–Brass Interfacial Shear Adhesion


Abstract
:1. Introduction
2. Materials and Methods
2.1. Materials
2.2. Preparation
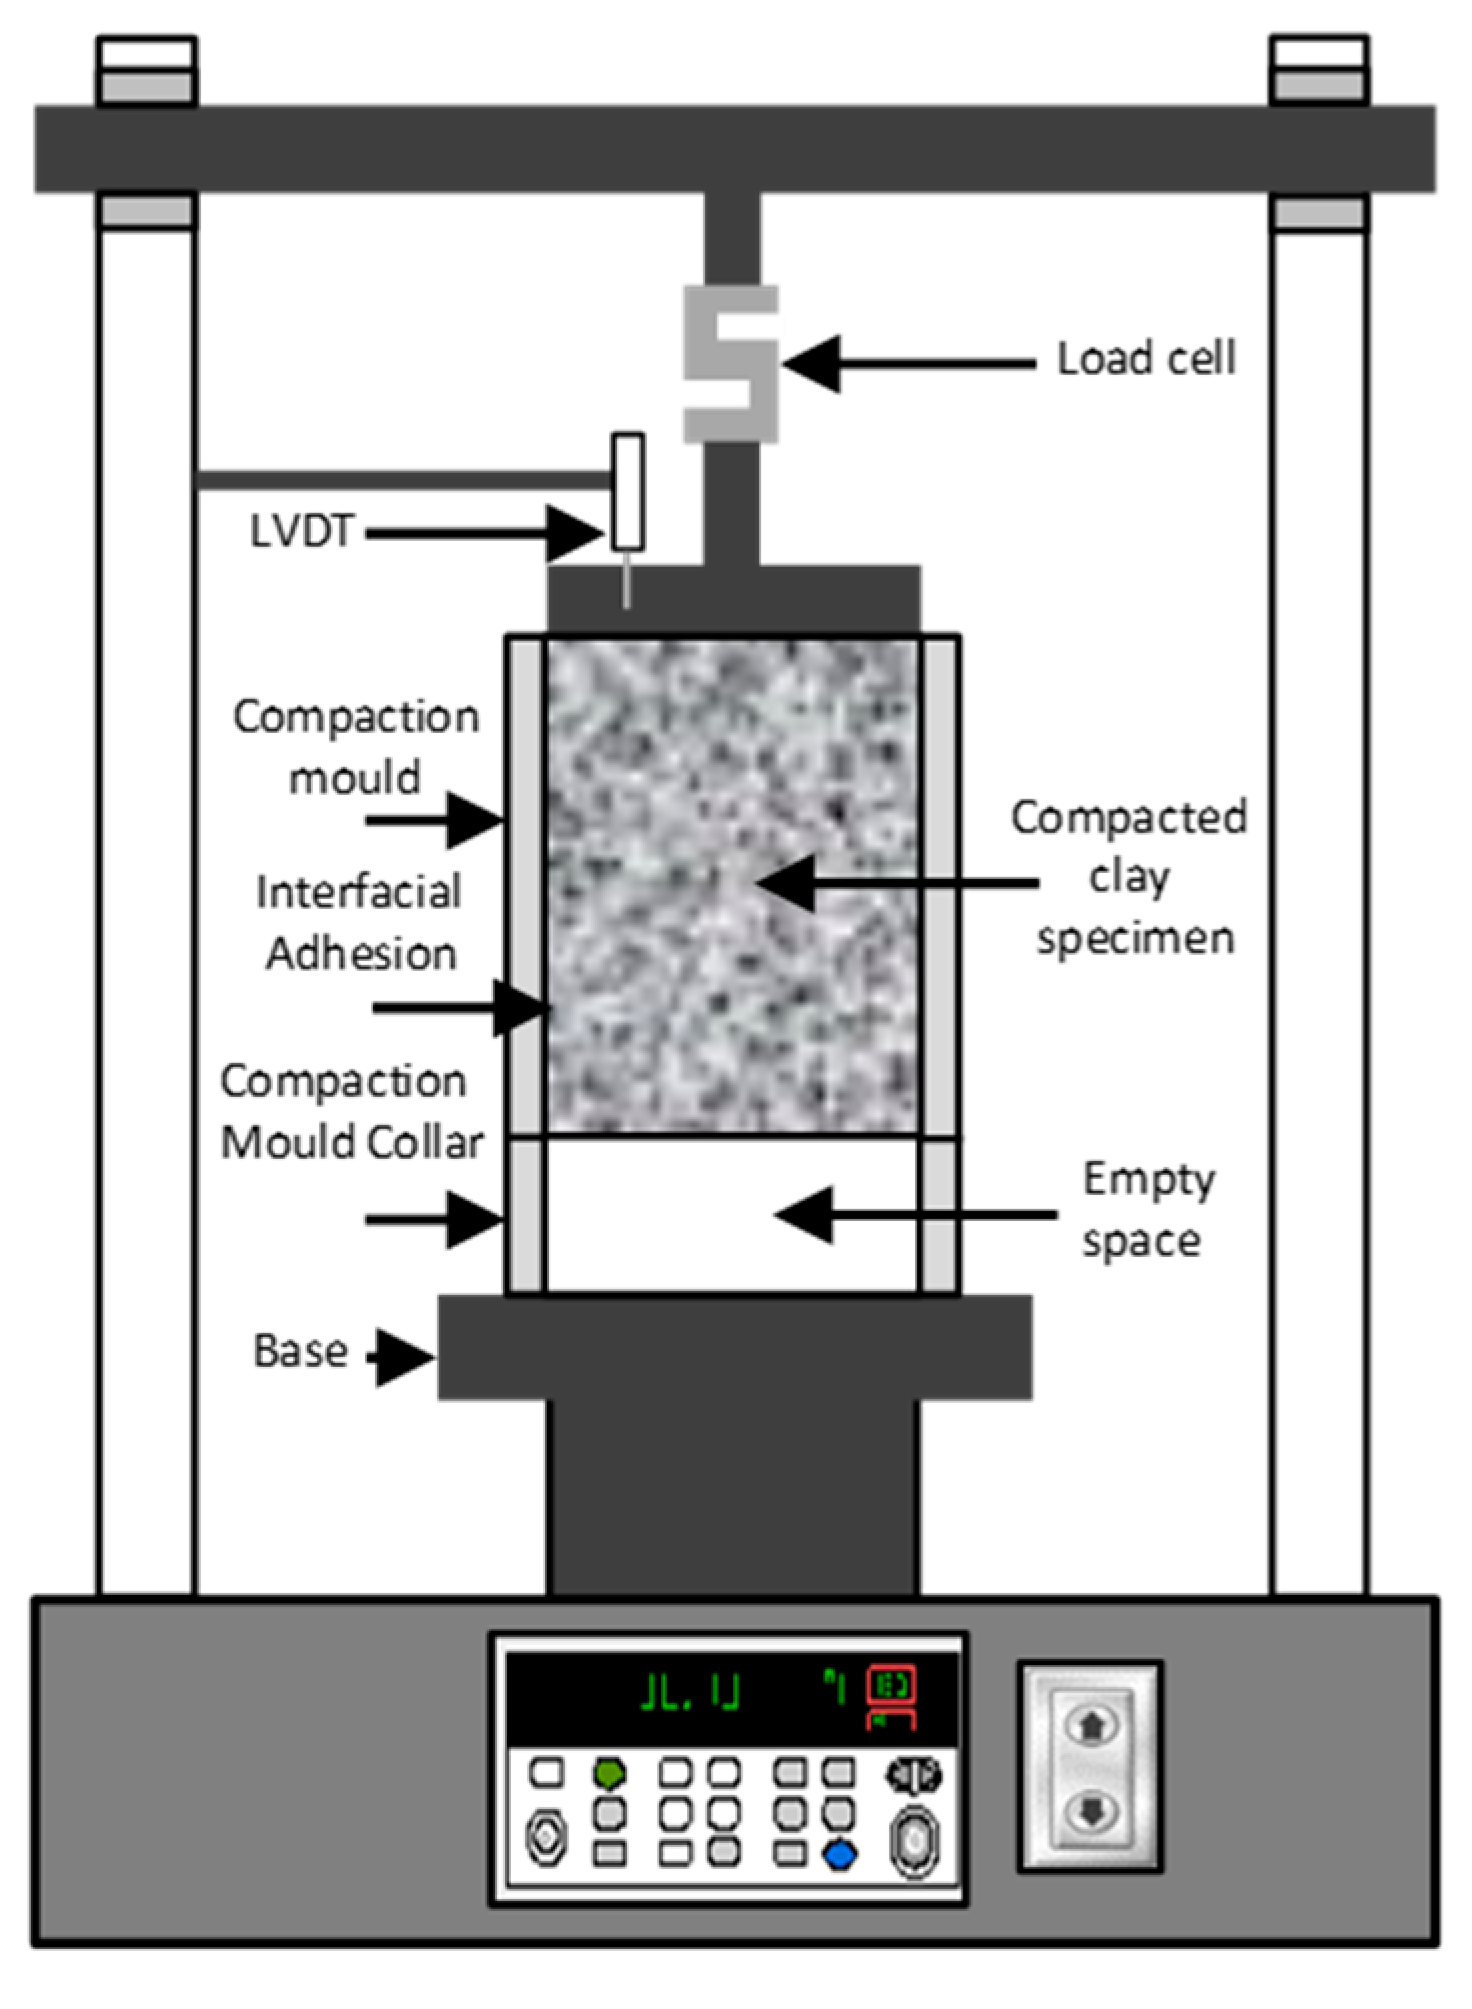
2.3. Approach
3. Results
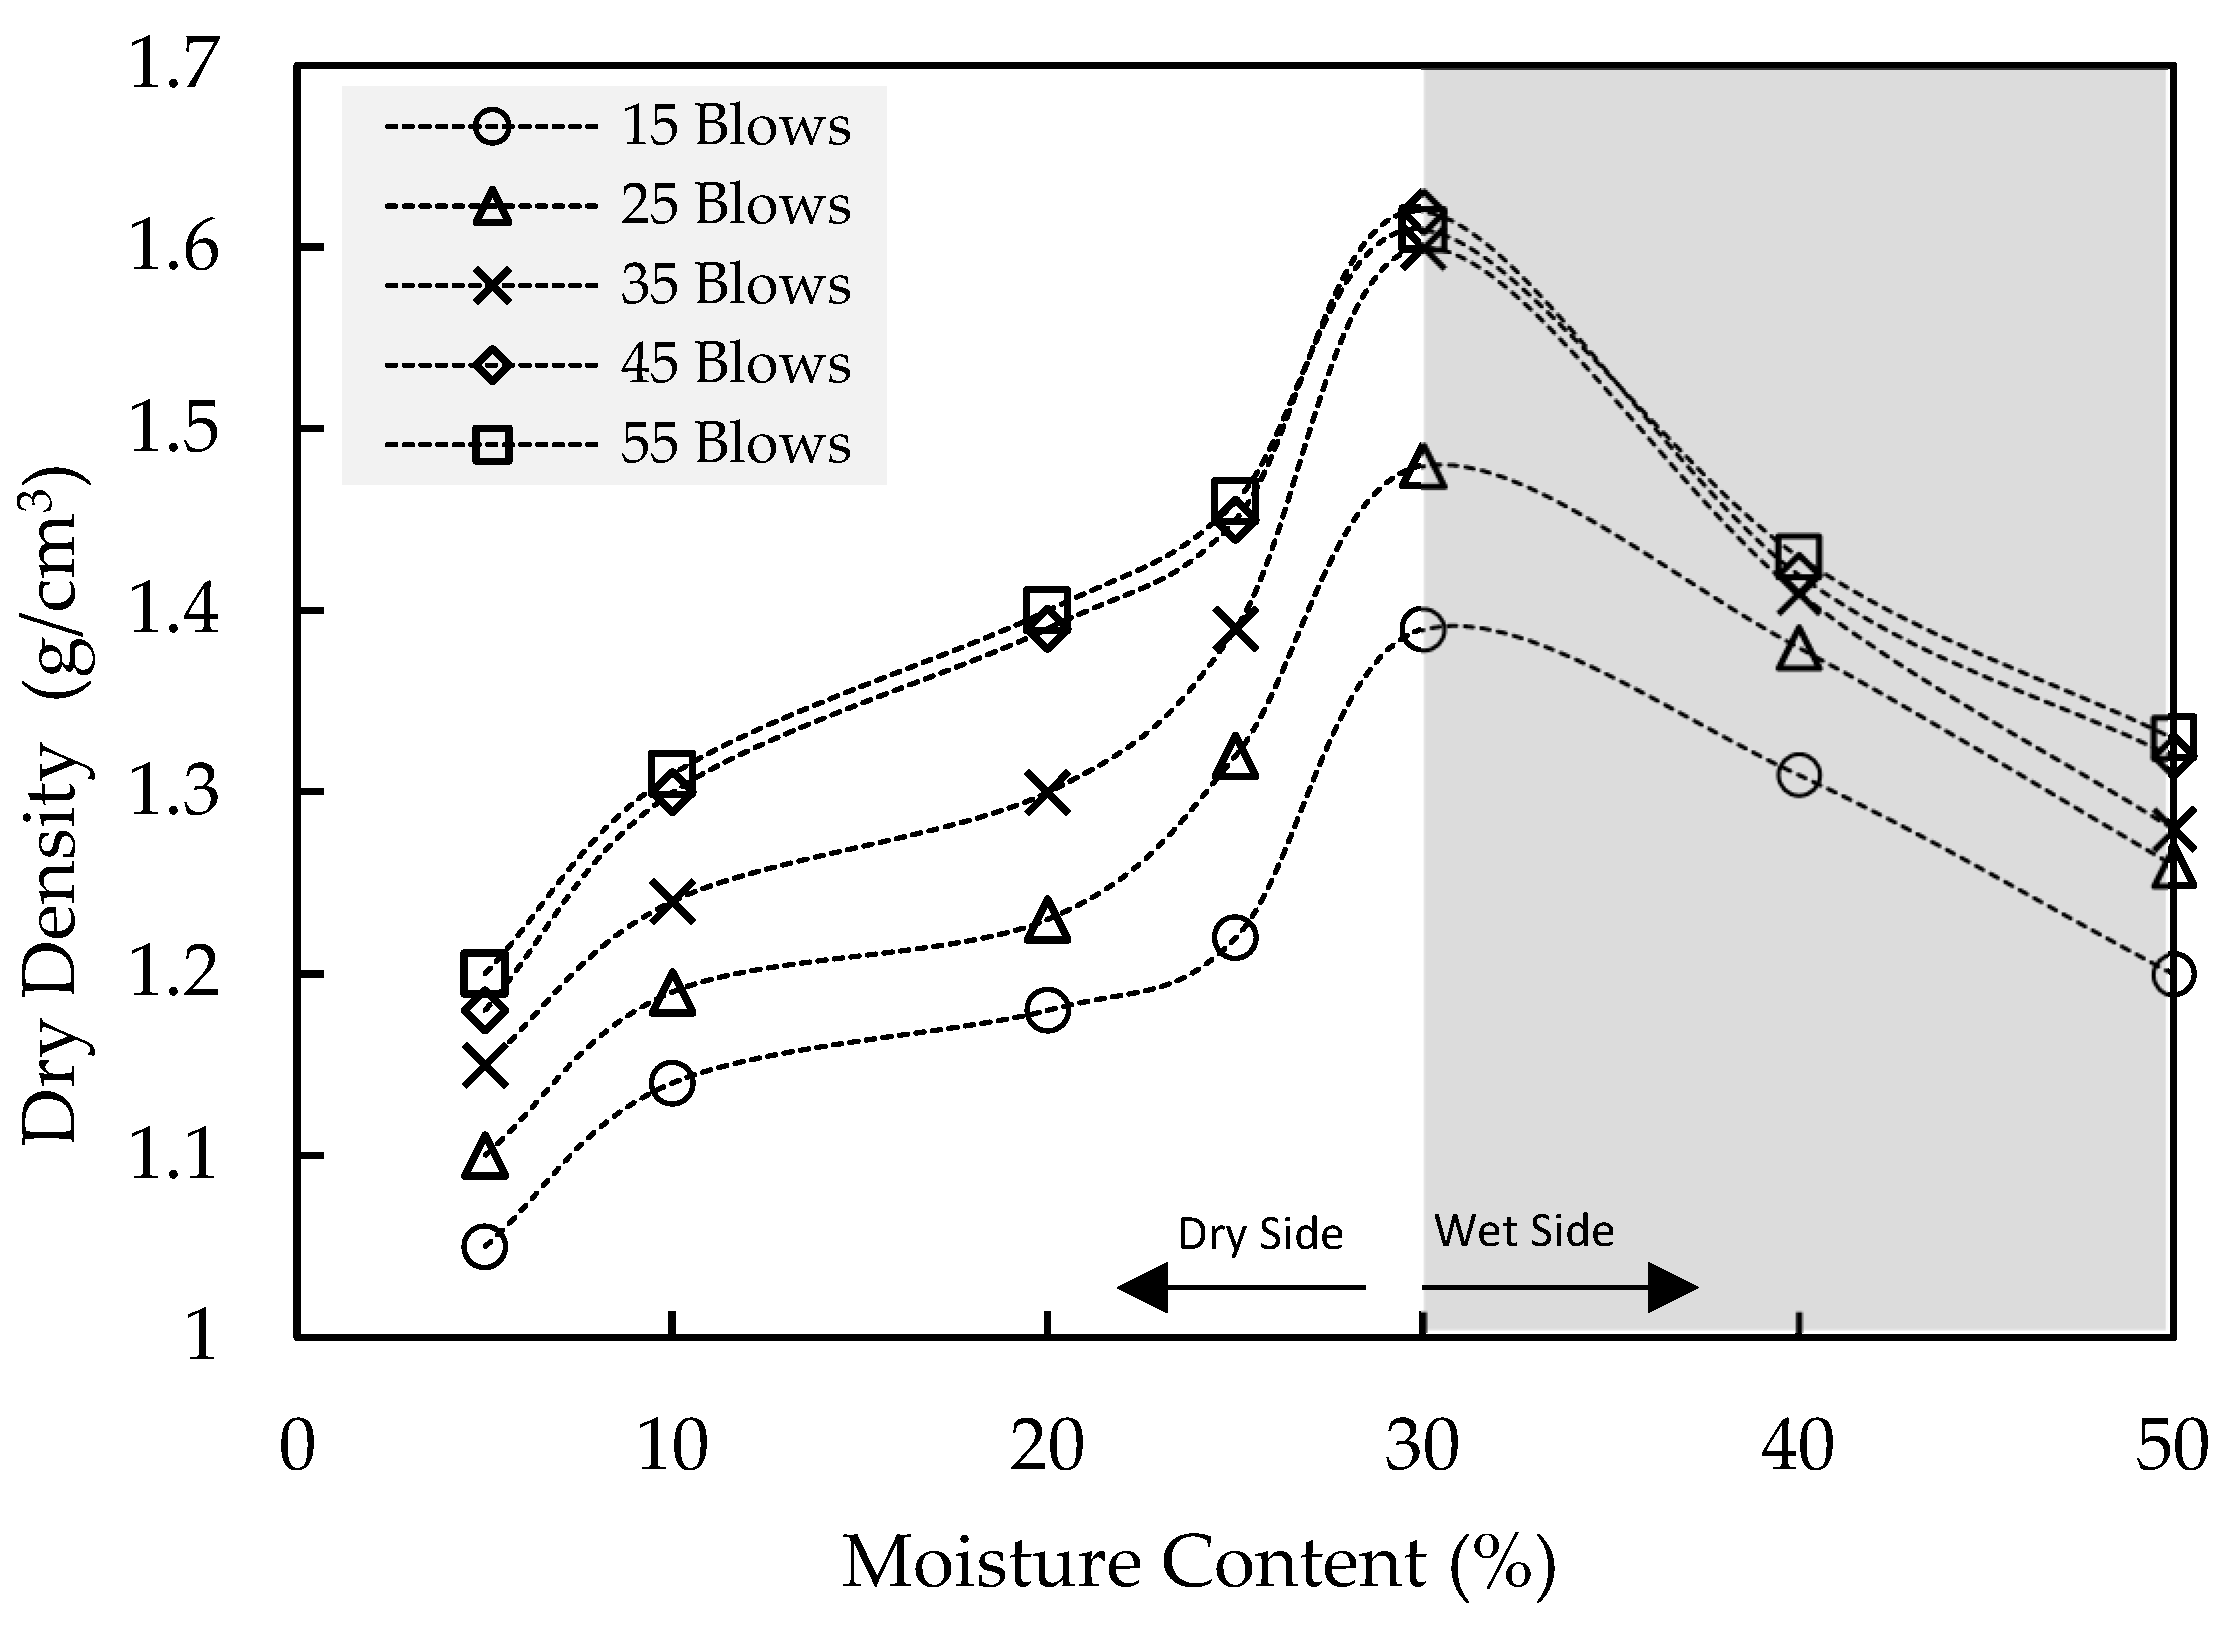
3.1. Compaction Curve
3.2. Dry Density
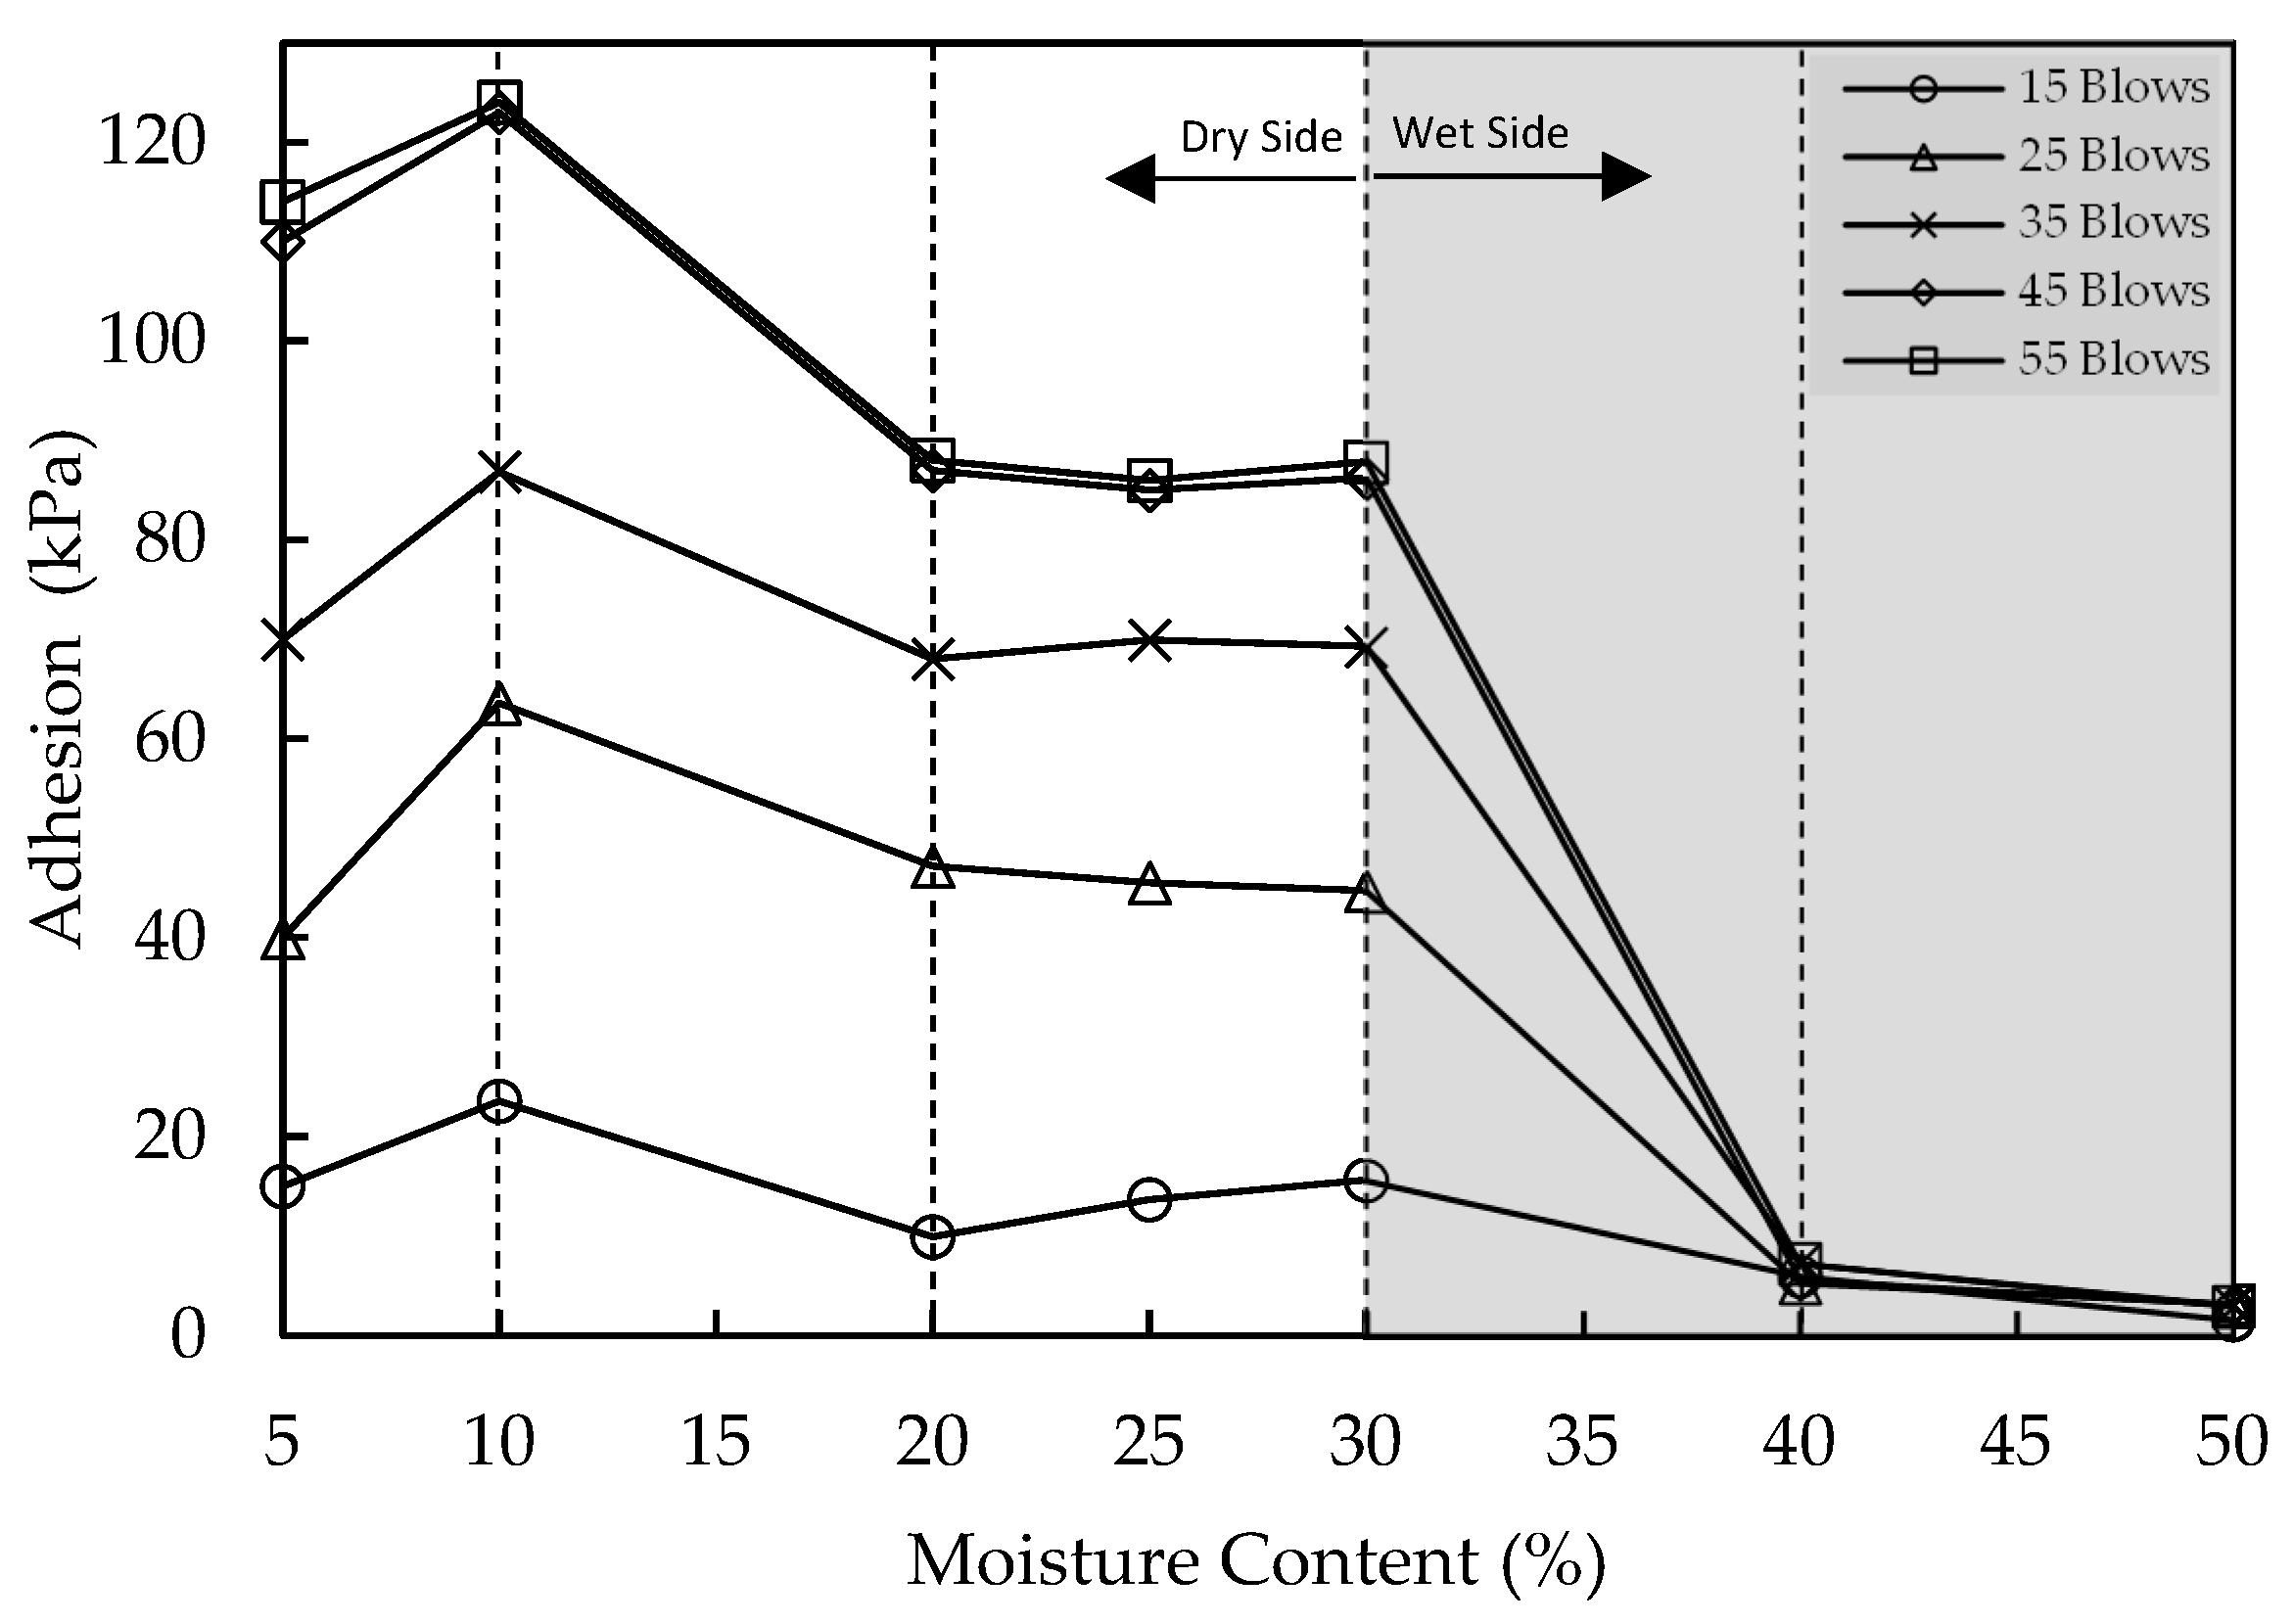
3.3. Moisture Content
3.4. Coupling Effect of Dry Density and Moisture Content
4. Discussion
4.1. Mechanism of Adhesion on the Dry Side
4.2. Mechanism of Adhesion on the Optimum Moisture Content
4.3. Mechanism of Adhesion on the Wet Side
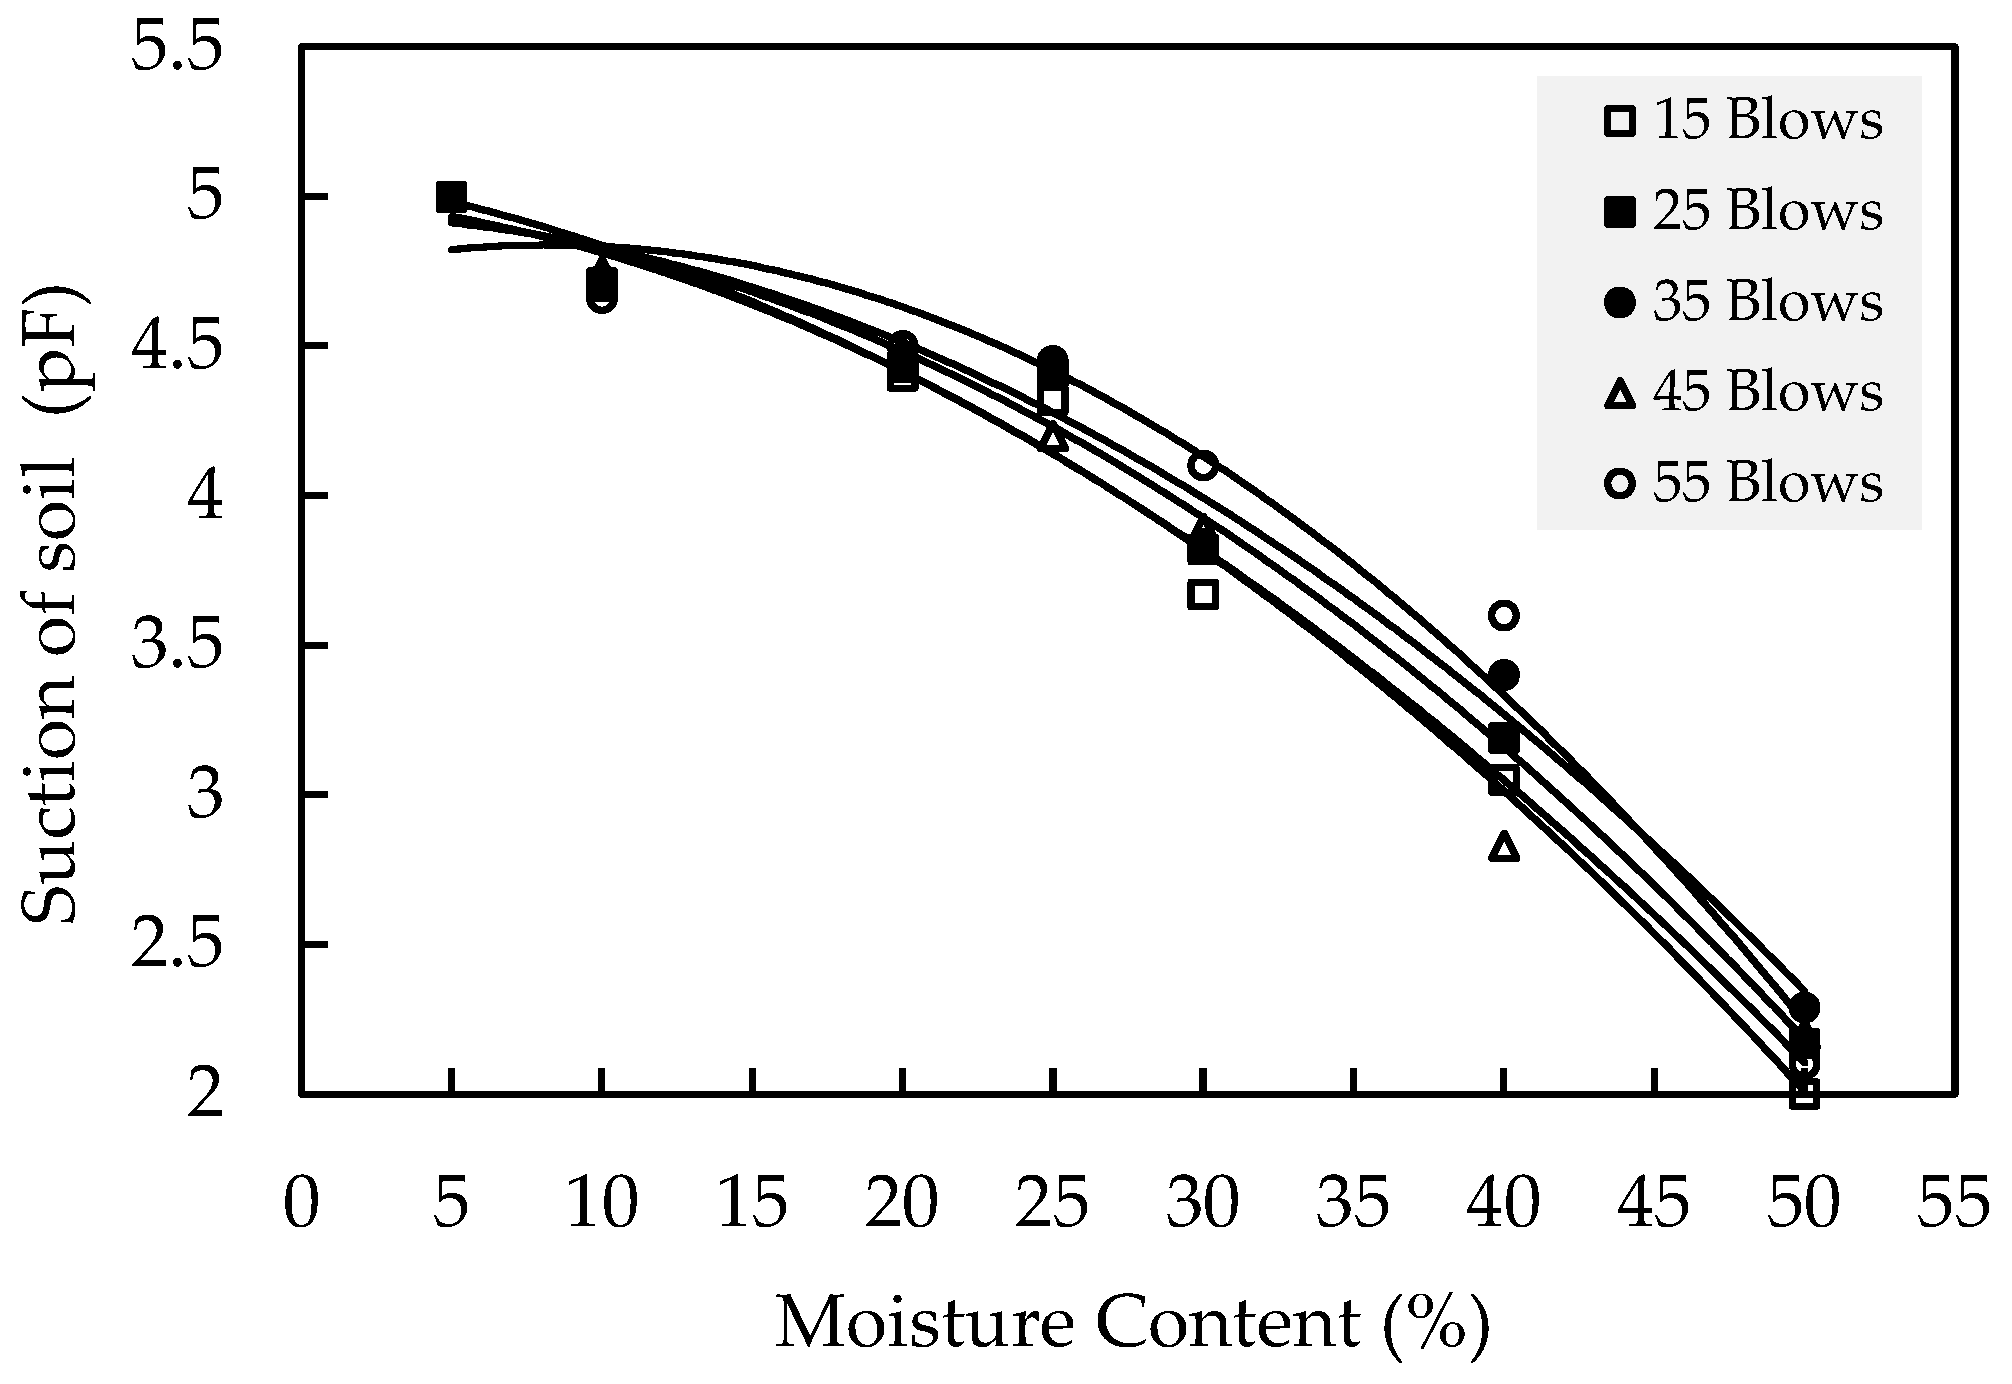
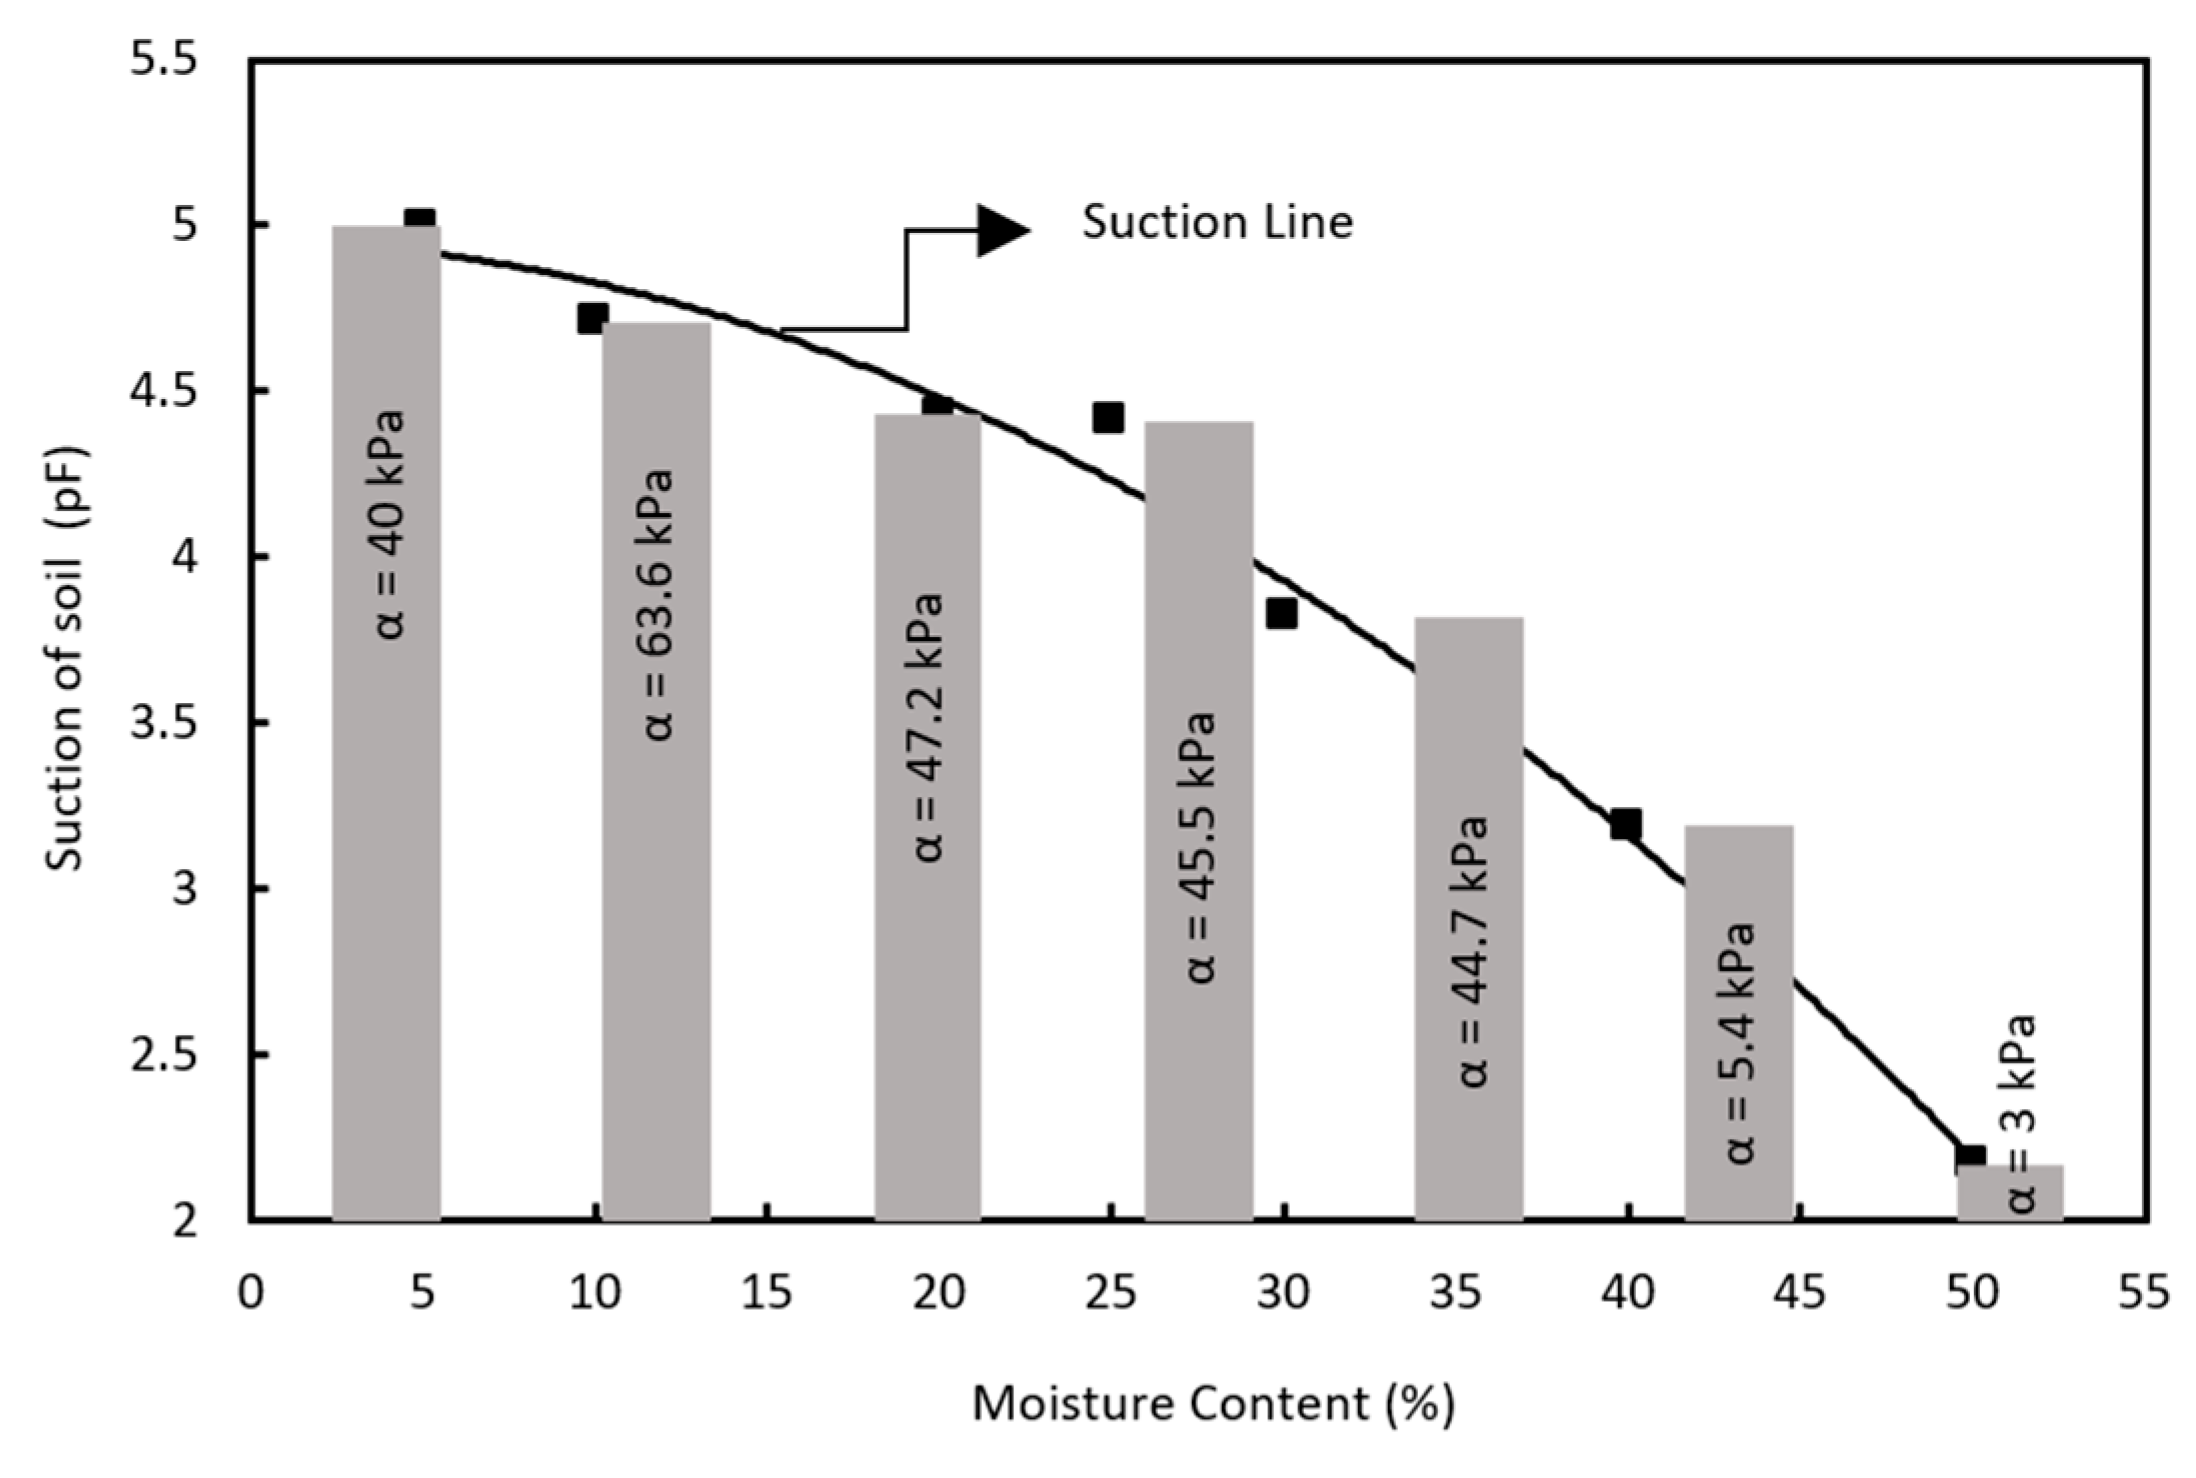
4.4. Matric Suction Role
4.5. Limitation
5. Conclusions
- With an increase in moisture content in kaolin, the dry density increases until it reaches a maximum value and then decreases. The maximum dry density of the used kaolin is observed at an OMC of 30%.
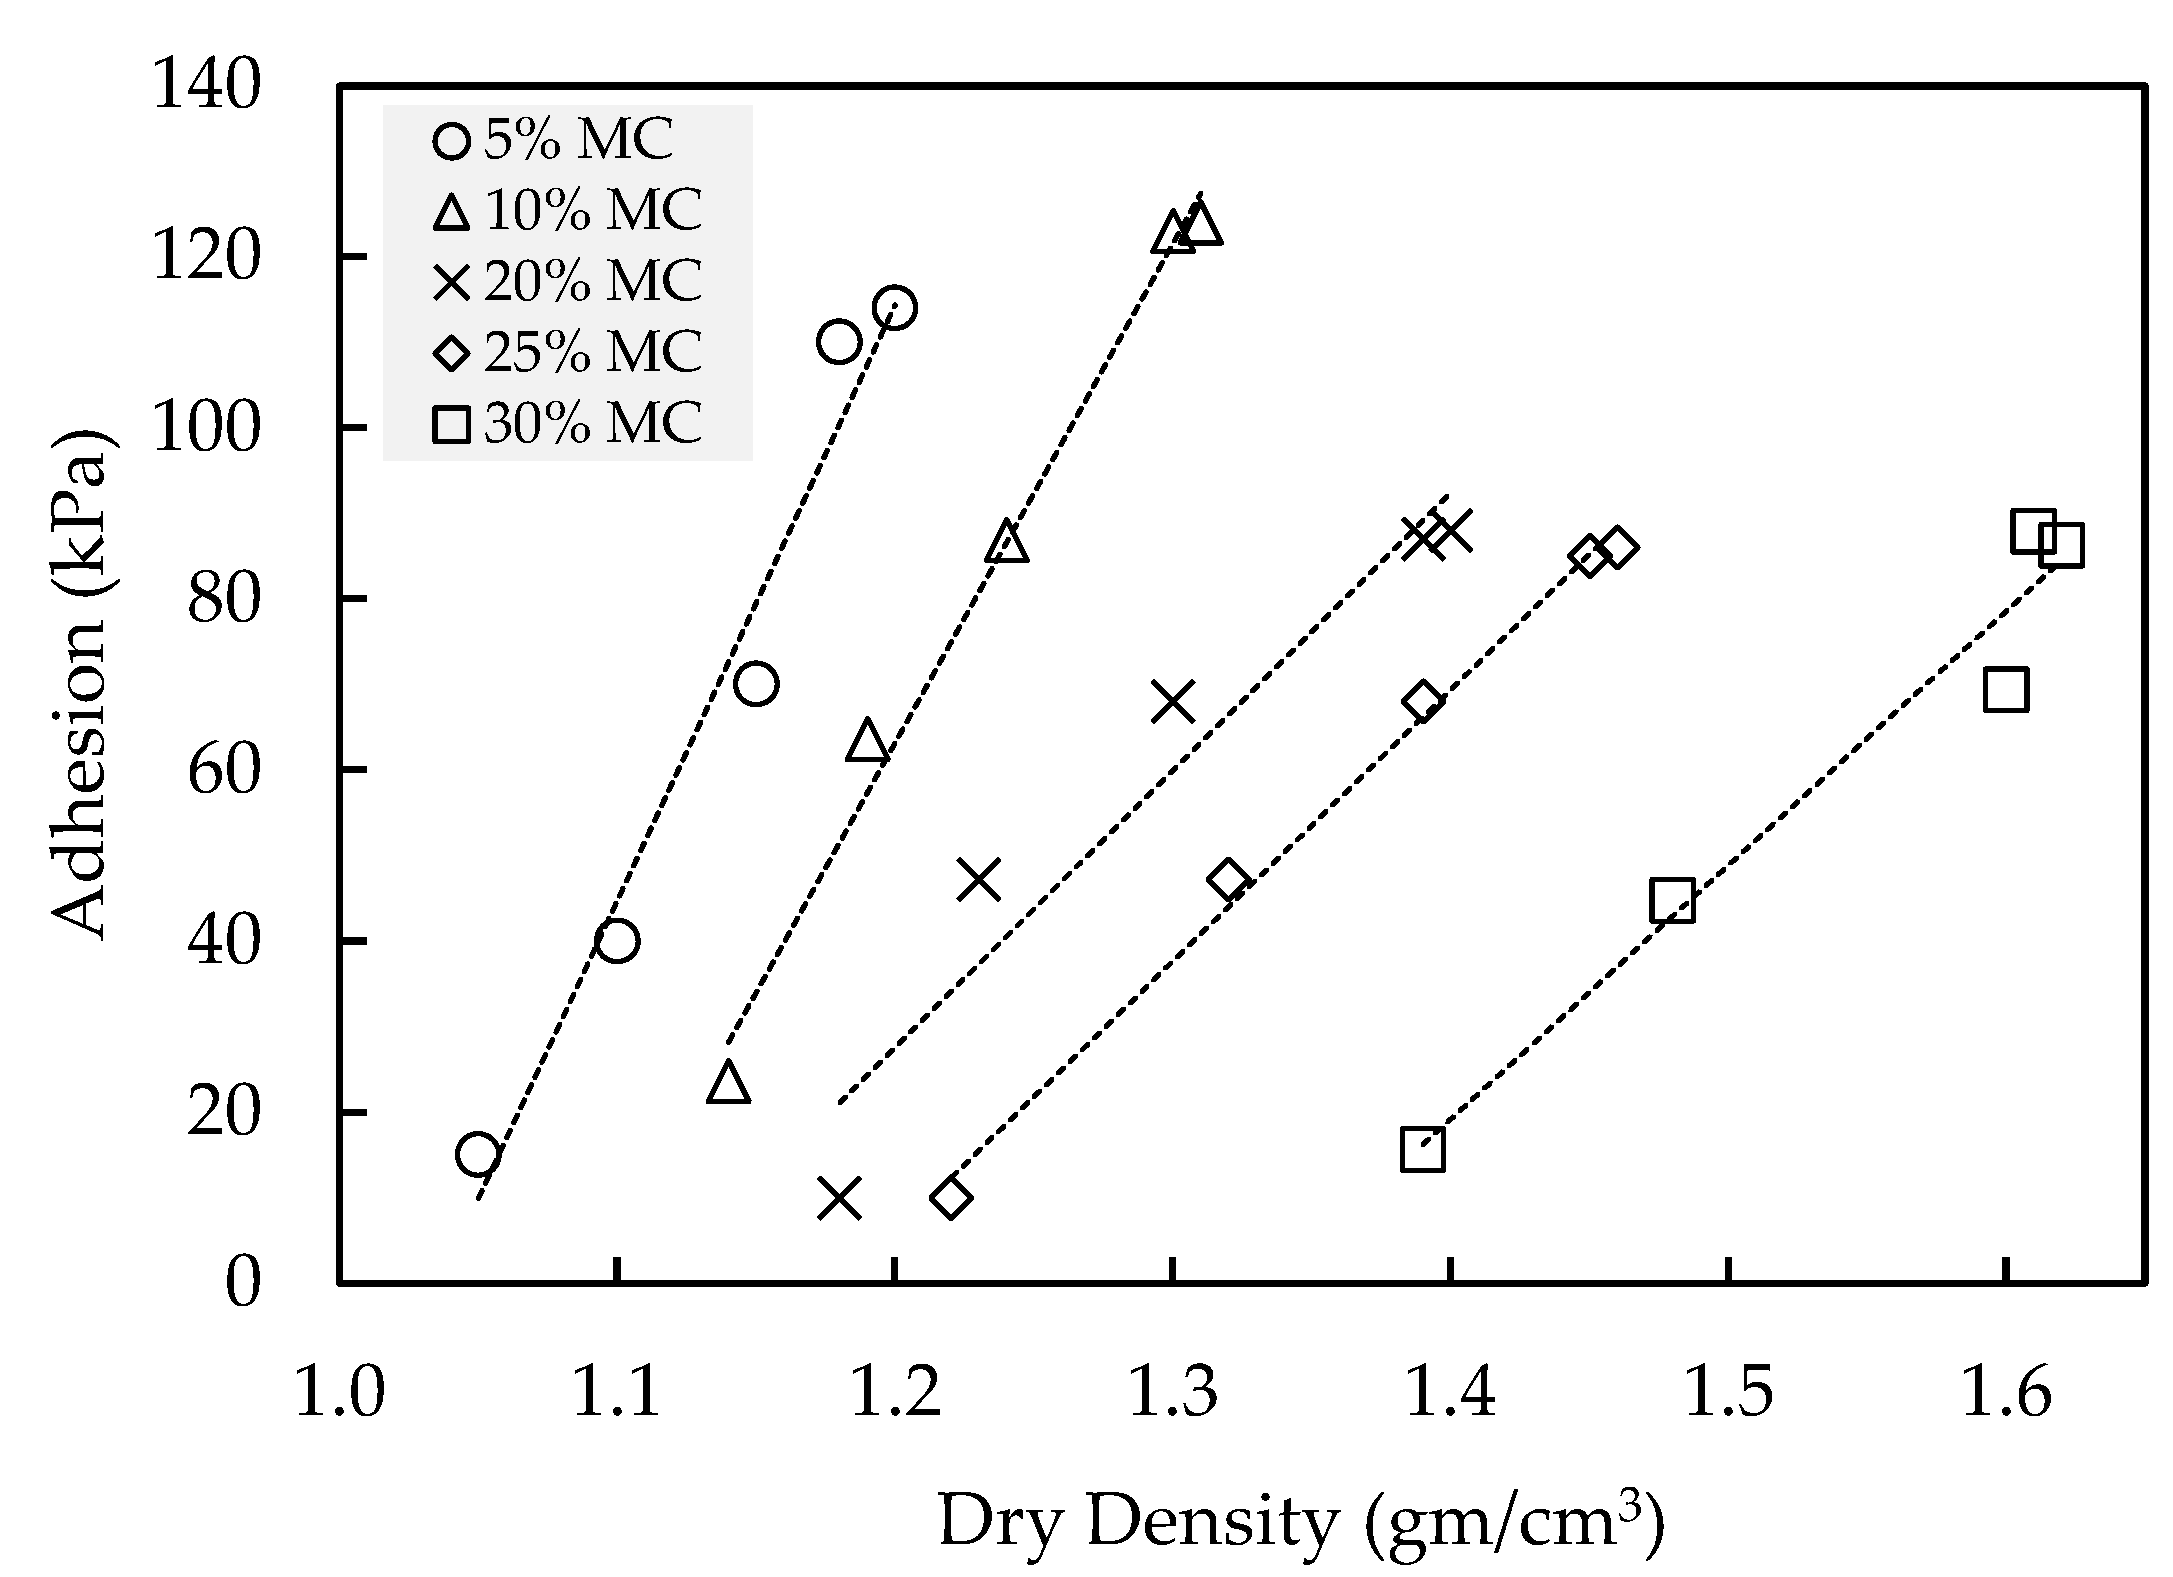
- There is a linear relationship between dry density and shear adhesion on the dry side of the compaction curve, where higher dry density leads to higher shear adhesion due to the larger area of contact with the mould surface.
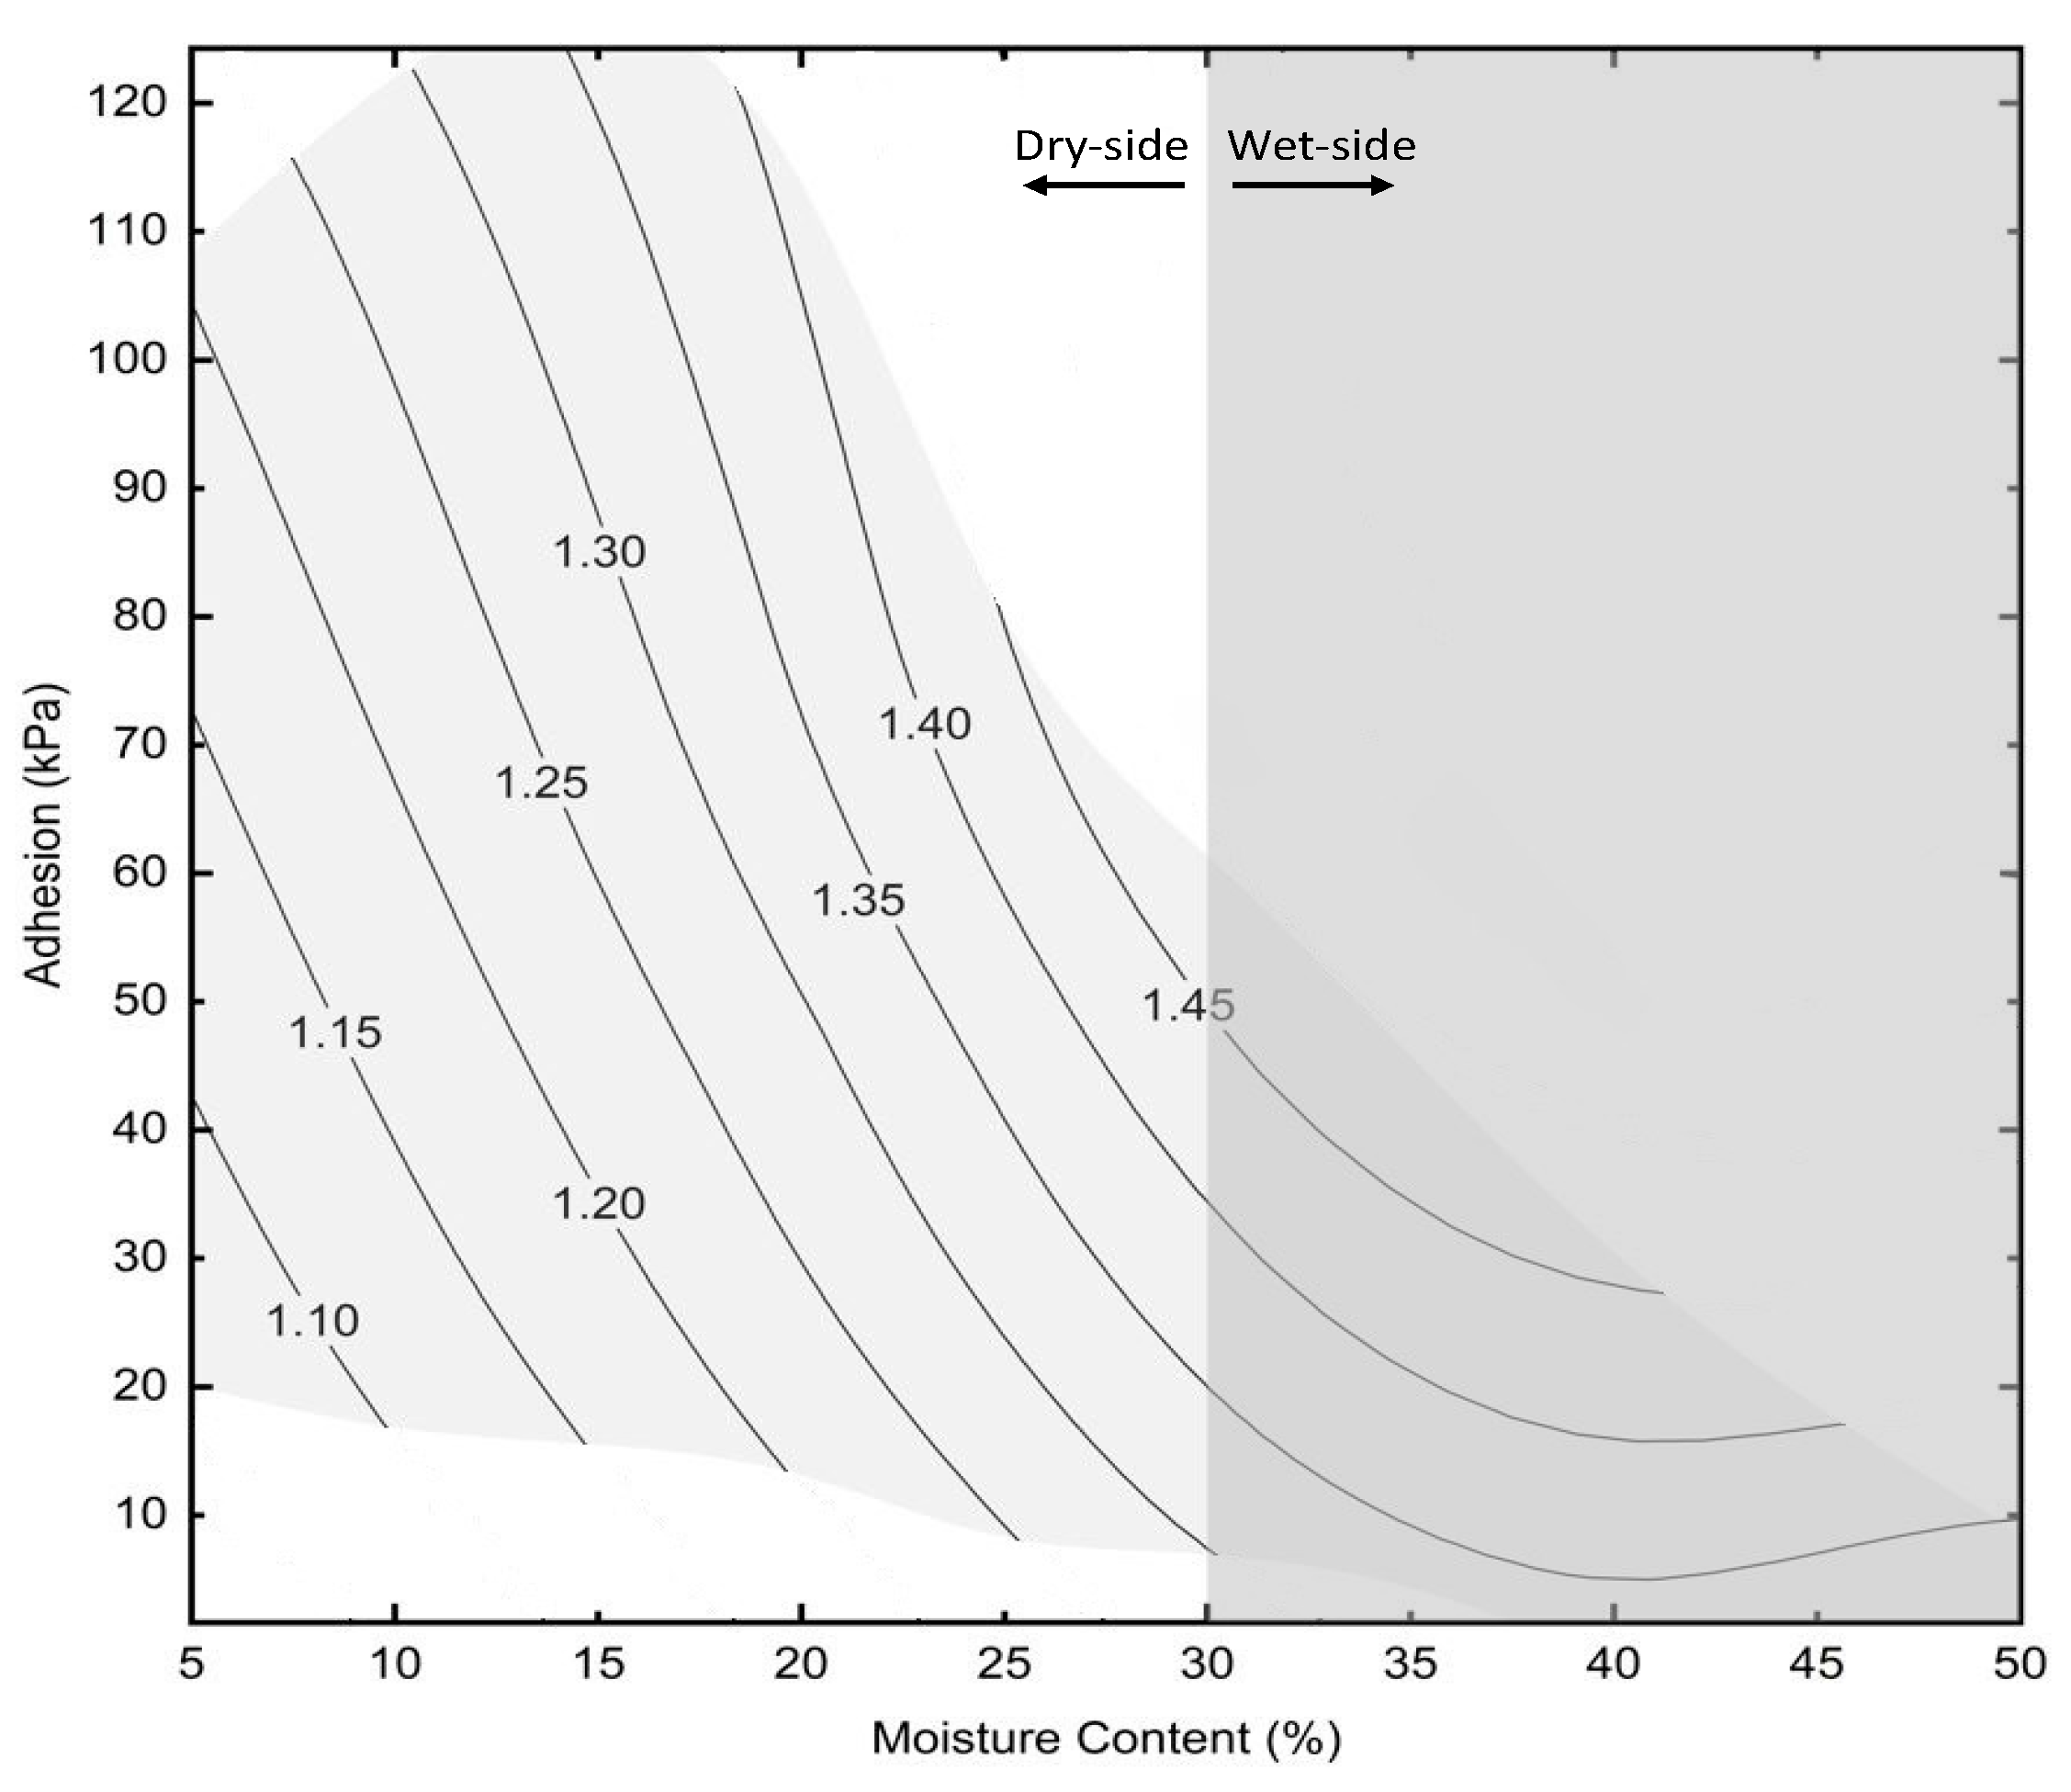
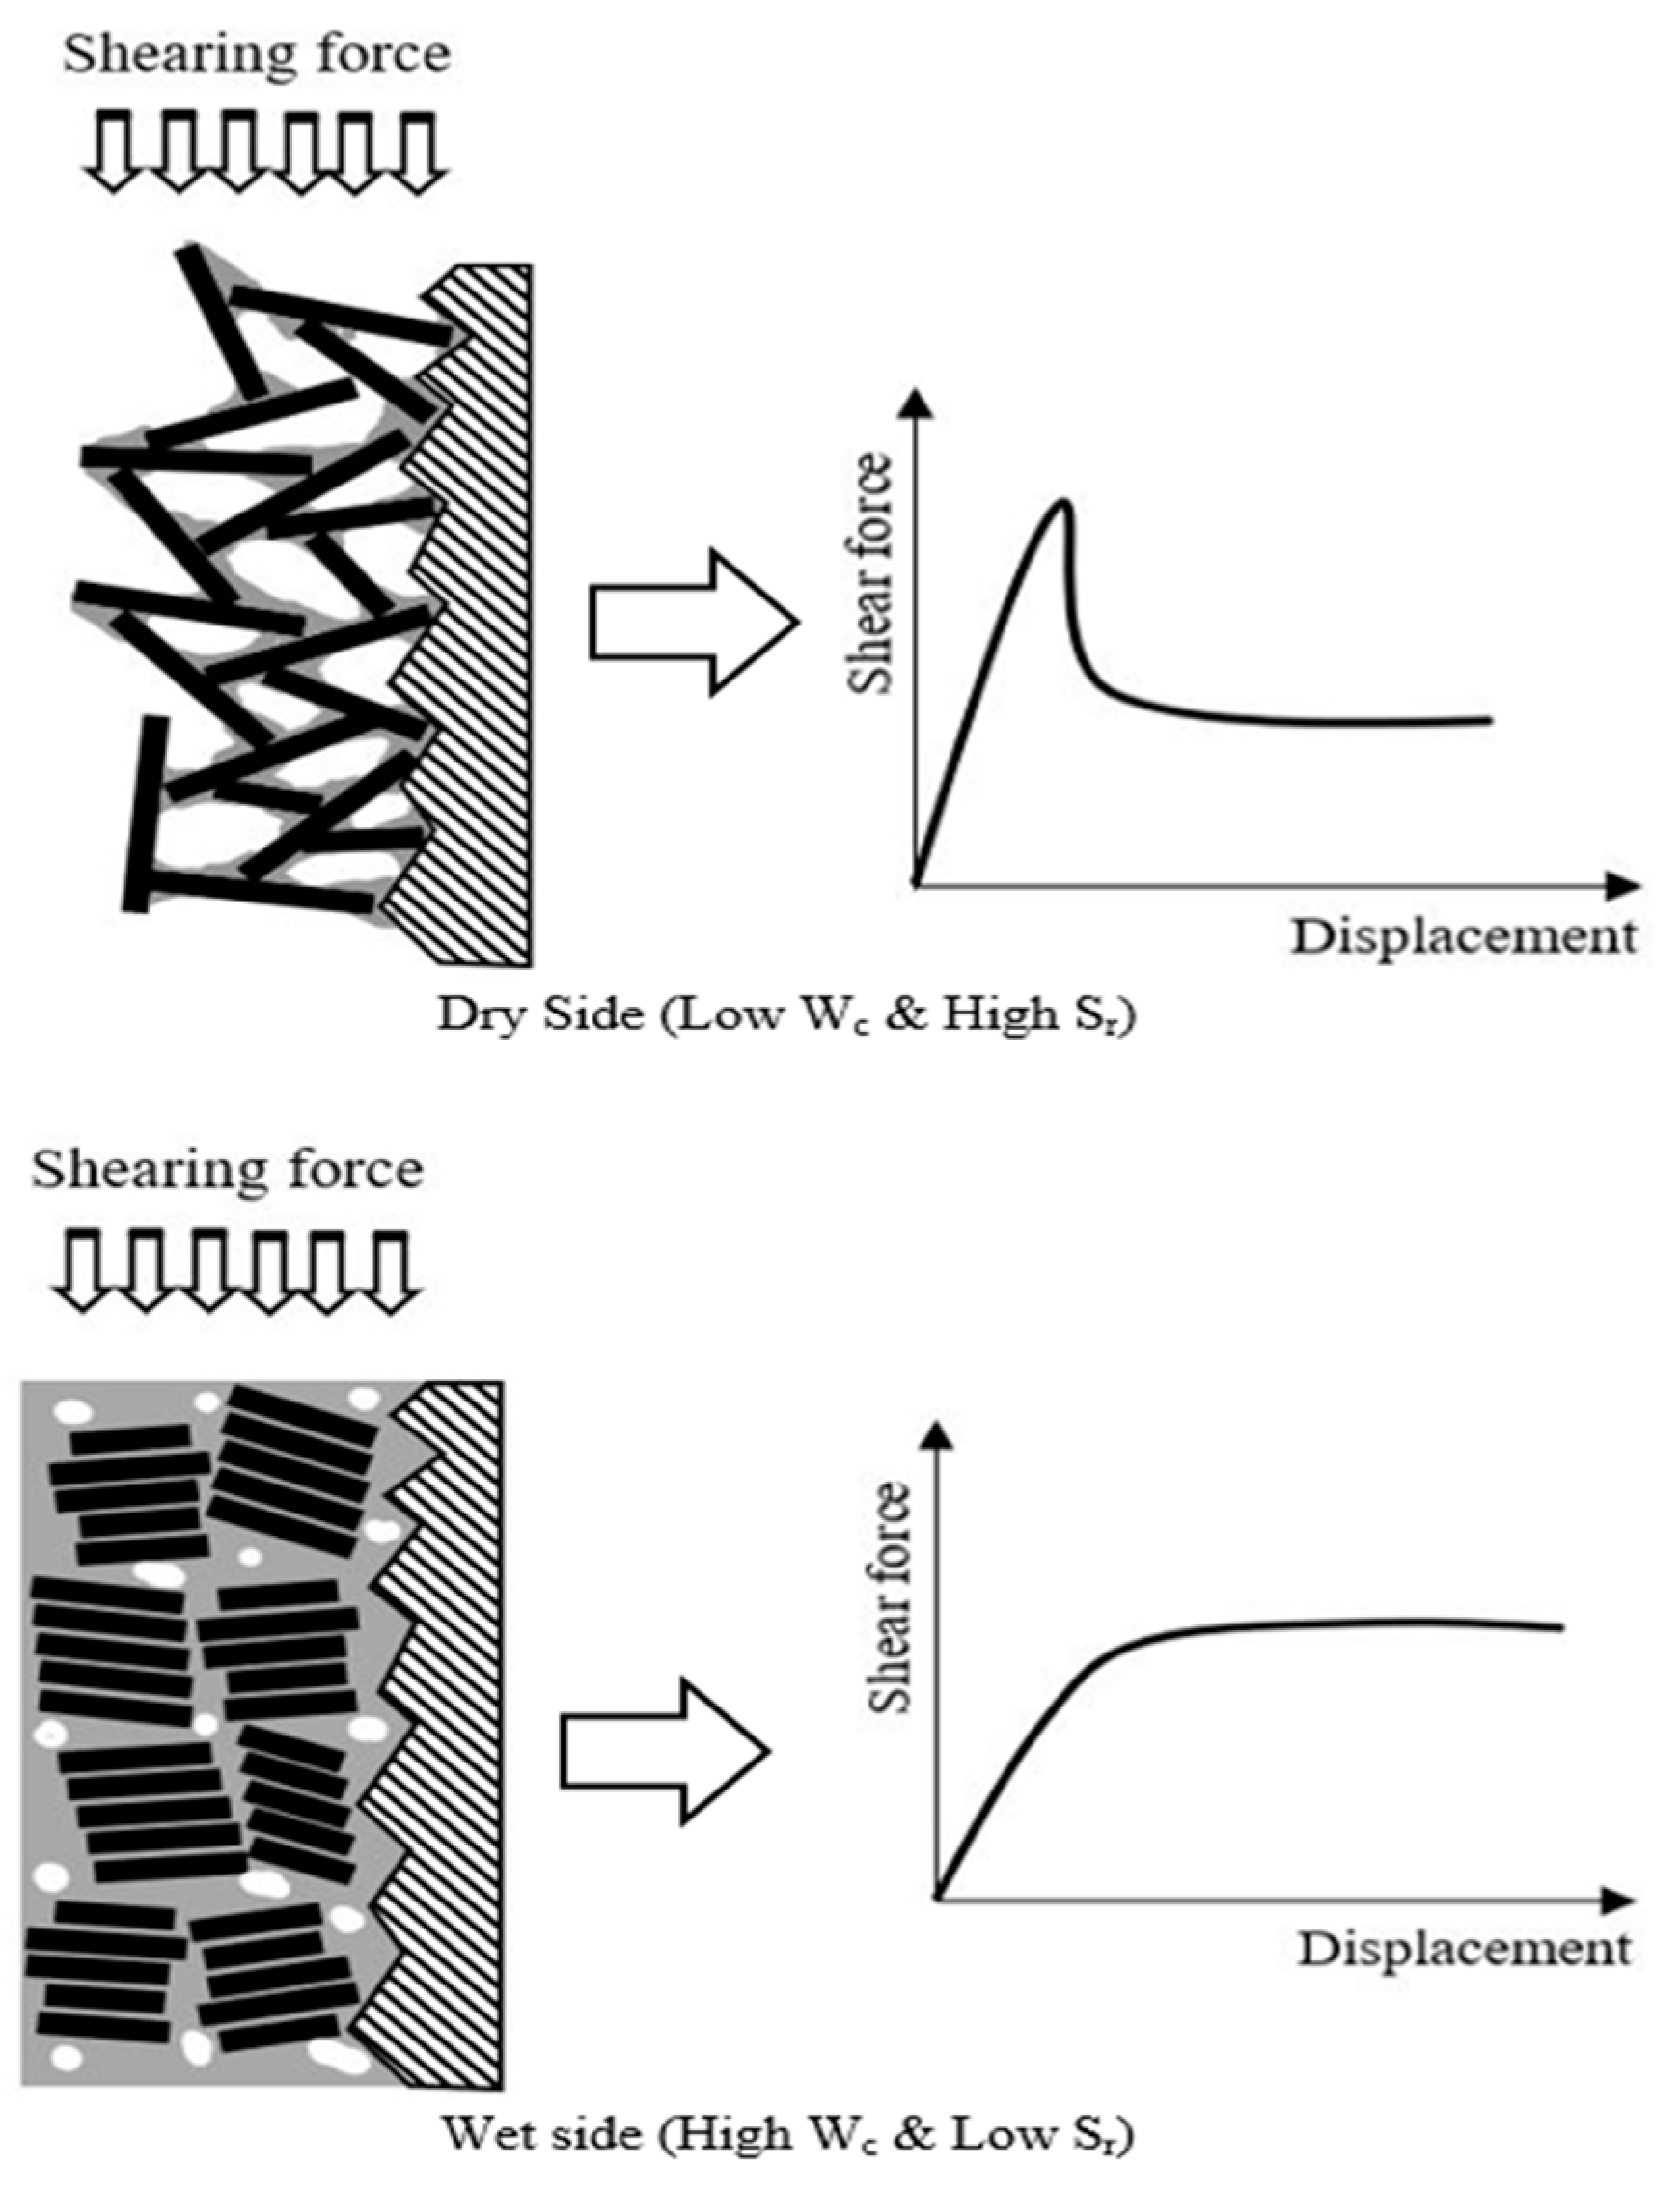
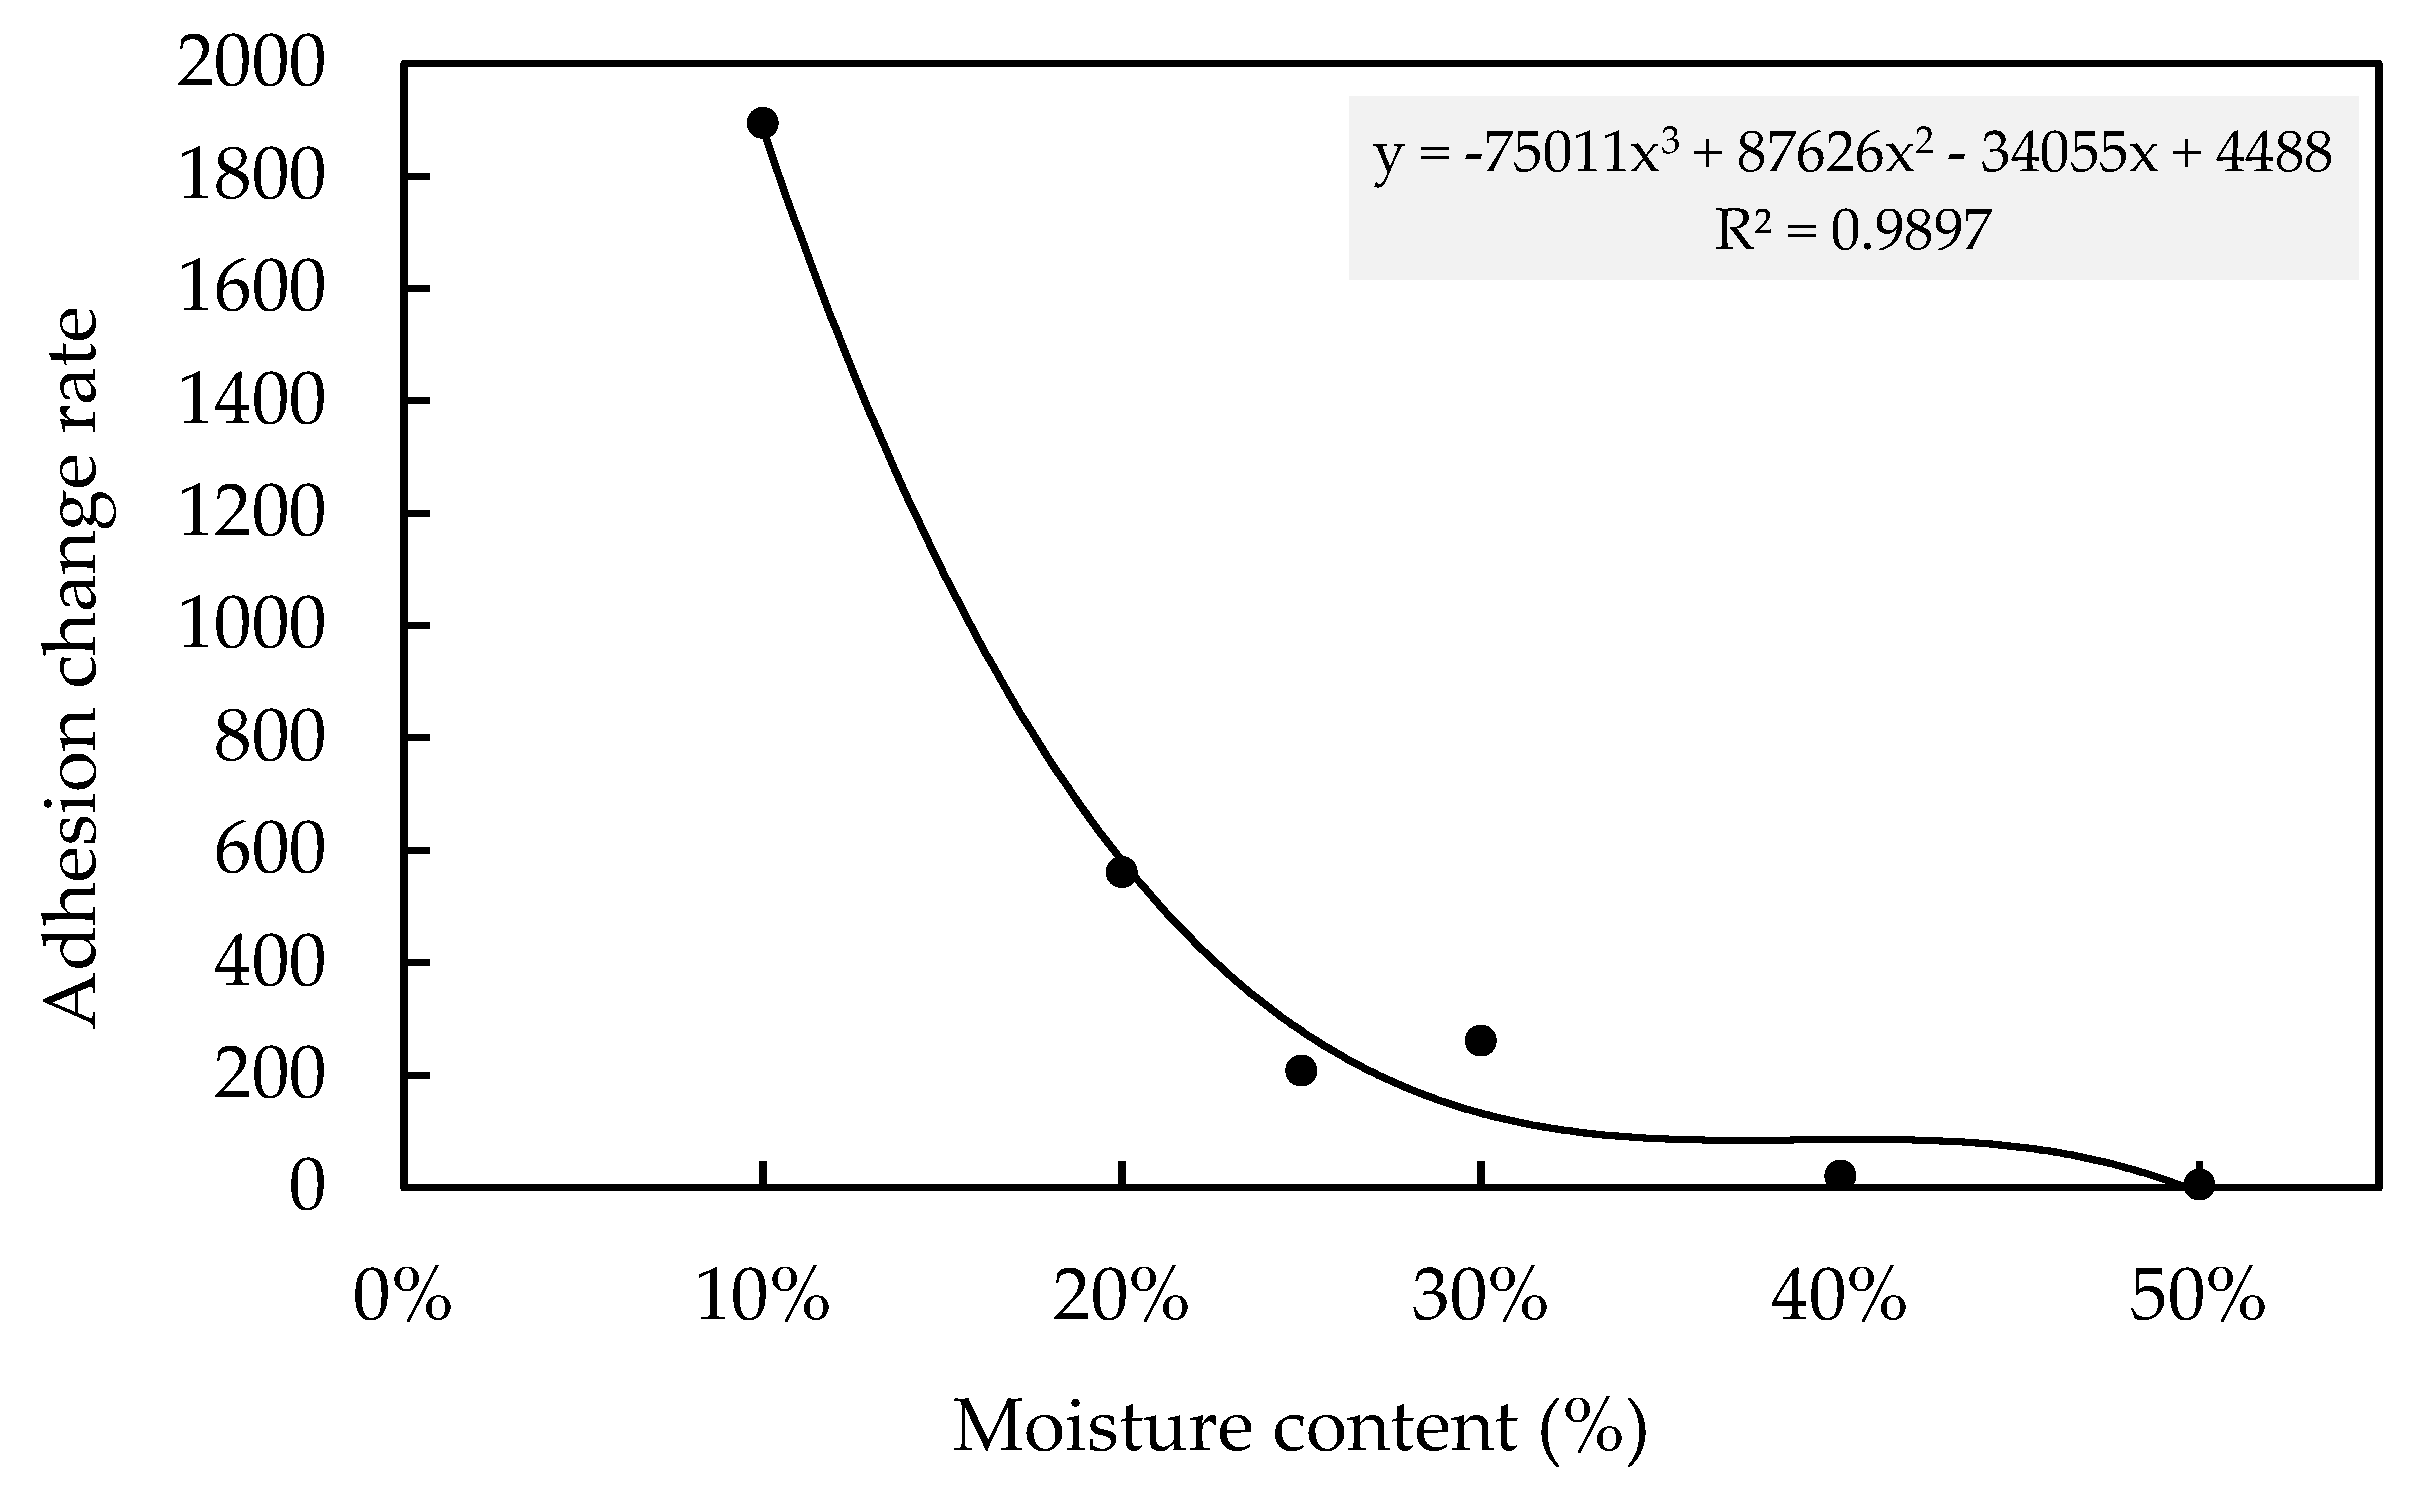
- As moisture content initially increases up to 10% MC, the shear adhesion also increases. Beyond that point, the increase in MC results in a slight decrease in adhesion on the dry side of the compaction curve up to the OMC. Beyond the OMC, on the wet side of the compaction curve, there is a significant decrease in shear adhesion.
- The adhesion behaviour can be further explained by considering the role of matrix suction. High suction on the dry side improves adhesion, while low suction on the wet side weakens adhesion.
- Future research can consider different types of soil and mixtures, as well as tests performed under various shear rates and temperatures.
Author Contributions
Funding
Institutional Review Board Statement
Informed Consent Statement
Data Availability Statement
Conflicts of Interest
Nomenclature
| Ic | Consistency index |
| PI | Plasticity index |
| PL | Plastic limit |
| LL | Liquid limit |
| α | Interfacial adhesion |
| ρ | Dry density |
| P | Peak load |
| A | Internal surface area of the mould |
| Sr | Saturation degree of clay |
| Su | Suction of clay |
| Gs | Specific gravity |
| OMC | Optimum moisture content |
| MC | Moisture content |
| ACR | Adhesion change rate |
| CEC | Cation exchange capacity |
| TBM | Tunnel boring machine |
References
- Fountaine, E. Investigations into the mechanism of soil adhesion. J. Soil Sci. 1954, 5, 251–263. [Google Scholar] [CrossRef]
- Tong, J.; Ren, L.; Chen, B.; Qaisrani, A. Characteristics of adhesion between soil and solid surfaces. J. Terramech. 1994, 31, 93–105. [Google Scholar] [CrossRef]
- Alberto-Hernandez, Y.; Kang, C.; Yi, Y.; Bayat, A. Clogging potential of tunnel boring machine (TBM): A review. Int. J. Geotech. Eng. 2018, 12, 316–323. [Google Scholar] [CrossRef]
- Jia, X. Theoretical analysis of the adhesion force of soil to solid materials. Biosyst. Eng. 2004, 87, 489–493. [Google Scholar] [CrossRef]
- Soni, P.; Salokhe, V.M. Theoretical analysis of microscopic forces at soil-tool interfaces: A review. Agric. Eng. Int. CIGR J. 2006, 8, 1–25. [Google Scholar]
- Sass, I.; Burbaum, U. A method for assessing adhesion of clays to tunneling machines. Bull. Eng. Geol. Environ. 2009, 68, 27–34. [Google Scholar] [CrossRef]
- Zhang, J.; Sang, Z.; Gao, L. Adhesion and friction between soils and solids. Nung Yeh Chi Hsieh Hsueh Pao Trans. Chin. Soc. Agric. Mach. 1986, 17. [Google Scholar]
- Liu, P.; Wang, S.; Shi, Y.; Yang, J.; Fu, J.; Yang, F. Tangential adhesion strength between clay and steel for various soil softnesses. J. Mater. Civ. Eng. 2019, 31, 04019048. [Google Scholar] [CrossRef]
- Bhushan, B. Adhesion and stiction: Mechanisms, measurement techniques, and methods for reduction. J. Vac. Sci. Technol. B 2003, 21, 2262–2296. [Google Scholar] [CrossRef]
- Satomi, T.; Nihei, H.; Takahashi, H. Investigation on characteristics of soil adhesion to metallic material surface and soil animal’s cuticle. In Proceedings of the 15th International Conference on Experimental Mechanics, Online, 7–9 September 2021; pp. 1–9. [Google Scholar]
- Sladen, J. The adhesion factor: Applications and limitations. Can. Geotech. J. 1992, 29, 322–326. [Google Scholar] [CrossRef]
- Thewes, M.; Burger, W. Clogging of TBM drives in clay–identification and mitigation of risks. In Underground Space; CRC Press: Boca Raton, FL, USA, 2005. [Google Scholar]
- Atkinson, J.H.; Fookes, P.G.; Miglio, B.F.; Pettifer, G.S. Destructuring and disaggregation of Mercia Mudstone during full-face tunnelling. Q. J. Eng. Geol. Hydrogeol. 2003, 36, 293–303. [Google Scholar] [CrossRef]
- Jancsecz, S.; Krause, R.; Langmaack, L. Advantages of soil conditioning in shield tunnelling: Experiences of LRTS Izmir. In Challenges for the 21st Century; A.A. Balkema: Rotterdam, The Netherlands, 1999; pp. 865–875. [Google Scholar]
- Basmenj, A.K.; Mirjavan, A.; Ghafoori, M.; Cheshomi, A. Assessment of the adhesion potential of kaolinite and montmorillonite using a pull-out test device. Bull. Eng. Geol. Environ. 2016, 76, 1507–1519. [Google Scholar] [CrossRef]
- Zumsteg, R.; Puzrin, A.M. Stickiness and adhesion of conditioned clay pastes. Tunn. Undergr. Space Technol. 2012, 31, 86–96. [Google Scholar] [CrossRef]
- Azadegan, B.; Massah, J. Effect of temperature on adhesion of clay soil to steel. Cercet. Agron. Mold. 2012, 45, 21–27. [Google Scholar] [CrossRef]
- Burbaum, U.; Sass, I. Physics of adhesion of soils to solid surfaces. Bull. Eng. Geol. Environ. 2017, 76, 1097–1105. [Google Scholar] [CrossRef]
- Alshameri, B. Maximum dry density of sand–kaolin mixtures predicted by using fine content and specific gravity. SN Appl. Sci. 2020, 2, 1693. [Google Scholar] [CrossRef]
- Li, H.; Zhang, Z.; Zhai, J.; Yang, L.; Long, H. Correlation between Soil Structural Parameters and Soil Adhesion Based on Water Film Theory. Coatings 2022, 12, 1743. [Google Scholar] [CrossRef]
- Daghistani, F.; Baghbani, A.; Abuel Naga, H.; Faradonbeh, R.S. Internal Friction Angle of Cohesionless Binary Mixture Sand–Granular Rubber Using Experimental Study and Machine Learning. Geosciences 2023, 13, 197. [Google Scholar] [CrossRef]
- Daghistani, F.; Baghbani, A.; Abuel Naga, H. Shear strength characteristics of binary mixture sand-carpet fibre using experimental study and machine learning. Int. J. Geotech. Eng. 2023, 1–15. [Google Scholar] [CrossRef]
- Li, C.; Kong, G.; Liu, H.; Abuel-Naga, H. Effect of temperature on behaviour of red clay–structure interface. Can. Geotech. J. 2019, 56, 126–134. [Google Scholar] [CrossRef]


| Mineral | Mass Percentage |
|---|---|
| Kaolinite | 83.7 |
| Muscovite | 14.0 |
| Quartz | 2.3 |
| Properties | Values |
|---|---|
| Specific gravity (Gs) | 2.58 |
| LL (%) | 74 |
| PL (%) | 32 |
| PI (%) | 42 |
| Cation exchange capacity (CEC) (meq/100 g) | 0.075 |
| Total surface area (m2/g) | 20 |
| Surface charge density (µC/m2) | 0.36 |
| Silicate SiO2 | 45.2 |
| Aluminium Al2O3 | 38.8 |
| MC (%) | 10 | 20 | 25 | 30 | 40 | 50 |
|---|---|---|---|---|---|---|
| Number of blows | 15 | 15 | 15 | 15 | 15 | 15 |
| 25 | 25 | 25 | 25 | 25 | 25 | |
| 35 | 35 | 35 | 35 | 35 | 35 | |
| 45 | 45 | 45 | 45 | 45 | 45 | |
| 55 | 55 | 55 | 55 | 55 | 55 |
| Number of Blows | MC (%) | (g/cm3) | Su (pF) | α (kPa) |
|---|---|---|---|---|
| 15 | 5 | 1.05 | 5.00 | 15.00 |
| 10 | 1.14 | 4.70 | 23.59 | |
| 20 | 1.18 | 4.40 | 9.92 | |
| 25 | 1.22 | 4.32 | 13.66 | |
| 30 | 1.39 | 3.67 | 15.62 | |
| 40 | 1.31 | 3.05 | 6.02 | |
| 50 | 1.20 | 2.00 | 1.63 | |
| 25 | 5 | 1.10 | 5.00 | 40.00 |
| 10 | 1.19 | 4.71 | 63.60 | |
| 20 | 1.23 | 4.43 | 47.17 | |
| 25 | 1.32 | 4.41 | 45.55 | |
| 30 | 1.48 | 3.82 | 44.73 | |
| 40 | 1.38 | 3.19 | 5.37 | |
| 50 | 1.26 | 2.17 | 3.25 | |
| 35 | 5 | 1.15 | 5.00 | 70.00 |
| 10 | 1.24 | 4.72 | 86.86 | |
| 20 | 1.30 | 4.45 | 68.00 | |
| 25 | 1.39 | 4.44 | 69.95 | |
| 30 | 1.60 | 3.84 | 69.30 | |
| 40 | 1.41 | 3.40 | 7.32 | |
| 50 | 1.28 | 2.29 | 3.09 | |
| 45 | 5 | 1.18 | 5.00 | 110.00 |
| 10 | 1.30 | 4.75 | 123.00 | |
| 20 | 1.39 | 4.48 | 87.00 | |
| 25 | 1.45 | 4.20 | 85.00 | |
| 30 | 1.62 | 3.89 | 86.21 | |
| 40 | 1.42 | 2.83 | 5.69 | |
| 50 | 1.32 | 2.20 | 3.20 | |
| 55 | 5 | 1.20 | 5.00 | 114.00 |
| 10 | 1.31 | 4.66 | 124.00 | |
| 20 | 1.40 | 4.50 | 88.00 | |
| 25 | 1.46 | 4.45 | 86.00 | |
| 30 | 1.61 | 4.10 | 87.84 | |
| 40 | 1.43 | 3.60 | 7.32 | |
| 50 | 1.33 | 2.10 | 3.00 |
Disclaimer/Publisher’s Note: The statements, opinions and data contained in all publications are solely those of the individual author(s) and contributor(s) and not of MDPI and/or the editor(s). MDPI and/or the editor(s) disclaim responsibility for any injury to people or property resulting from any ideas, methods, instructions or products referred to in the content. |
© 2023 by the authors. Licensee MDPI, Basel, Switzerland. This article is an open access article distributed under the terms and conditions of the Creative Commons Attribution (CC BY) license (https://creativecommons.org/licenses/by/4.0/).
Share and Cite
Almasoudi, R.; Abuel-Naga, H.; Daghistani, F. Effects of Dry Density and Moisture Content on the Kaolin–Brass Interfacial Shear Adhesion. Appl. Sci. 2023, 13, 11191. https://doi.org/10.3390/app132011191
Almasoudi R, Abuel-Naga H, Daghistani F. Effects of Dry Density and Moisture Content on the Kaolin–Brass Interfacial Shear Adhesion. Applied Sciences. 2023; 13(20):11191. https://doi.org/10.3390/app132011191
Chicago/Turabian StyleAlmasoudi, Rayed, Hossam Abuel-Naga, and Firas Daghistani. 2023. "Effects of Dry Density and Moisture Content on the Kaolin–Brass Interfacial Shear Adhesion" Applied Sciences 13, no. 20: 11191. https://doi.org/10.3390/app132011191
APA StyleAlmasoudi, R., Abuel-Naga, H., & Daghistani, F. (2023). Effects of Dry Density and Moisture Content on the Kaolin–Brass Interfacial Shear Adhesion. Applied Sciences, 13(20), 11191. https://doi.org/10.3390/app132011191