Article

A Petri Net Approach for Business Process Modeling and Simulation

by
Samuel Medina-Garcia
1,
Joselito Medina-Marin
1,*,
Oscar Montaño-Arango
1,
Manuel Gonzalez-Hernandez
1 and
Eva Selene Hernandez-Gress
2
1
Academic Area of Engineering, Autonomous University of Hidalgo, Pachuca-Tulancingo Road Km. 4.5, City of Knowledge, Mineral de la Reforma 42184, Mexico
2
School of Engineering and Sciences, Tecnológico de Monterrey, Hidalgo, Pachuca 42083, Mexico
*
Author to whom correspondence should be addressed.
Appl. Sci. 2023, 13(20), 11192; https://doi.org/10.3390/app132011192
Submission received: 11 June 2023 / Revised: 29 August 2023 / Accepted: 29 August 2023 / Published: 11 October 2023

Abstract

:
A business process is a set of activities executed in a specific sequence involving various actors. This relationship between actors, activities, and sequence is crucial for achieving the goals and objectives of organizations. Business process modeling involves determining the actors, activities, and execution sequence necessary to accomplish the organization’s objectives, permitting analysis of the overall process in order to identify and rectify potential failures, improve operations, or eliminate activities that do not generate value. In this study, Petri nets have been selected as the modeling tool due to their ability to provide graphical and mathematical representations of business processes, which offers a significant advantage over other tools. The objective of this research is to develop a BP modeling algorithm using Petri nets. It aims to simulate the behavior of each activity within a case study in which the mathematical representation of Petri nets is utilized to measure process performance. Additionally, a software artifact is created to assess the algorithm’s functionality and compare the performance of two different business process that share the same goal.

1. Introduction

Business Processes (BPs) are defined as a sequence of structured or semi-structured activities that are related to each other and executed in series or parallel to ensure the proper operation of an enterprise. Various areas or departments are involved in executing this set of activities considering different professional profiles. Organizations strive to become more competitive; therefore, they need to improve their business processes [1]. BP modeling can be used to represent essential aspects of a process for analysis, automation, and simulation of business behavior. The complexity of BPs can increase, and a process may consist of multiple subprocesses. Therefore, a recommended practice for improving or creating new BPs is the use of modeling tools or techniques. Representing organizational behavior in this manner provides competitive advantages and is a requirement for implementing the ISO 9001 standard (Quality Management standard focused on customer satisfaction), as organizations need to prioritize their processes. Two key points in this standard are: “Maintaining documented information to support process operations” and “Preserving documented information to support the operation of their processes” [2].
The changes or implementation of new BPs can bring tangible or intangible benefits. The measurement of tangible benefits is done immediately and quantitatively, mainly in terms of money or time. Intangible benefits can be measured quantitatively after a considerable period of time. The context of this article is directed towards the modeling of BPs with tangible benefits. For this reason, it is necessary to use tools aimed at statistics and the analysis of time and motion, among others. A complete analysis of entities with their properties is a mandatory requirement for BP designers. When this condition is met, it is possible to organize all the operations in a logical and orderly way in order to subsequently model the process [3].
In most cases, BPs represent complex systems, as several entities are involved in their development. In the process of billing a car, there are probably six or seven entities involved, while in the process of assembling a car there are many more. Key aspects of business processes include the Activity Sequence, in which business processes consist of a series of steps or activities that are performed in a specific order to achieve a desired result, and Workflow, in which activities in a business process are often connected in a continuous workflow and the output of one activity becomes the input of the next.
Environmental changes in a business or organizational context can cause imbalances in the operation, and their effects can directly impact competitive aspects, such as a decrease in profit margins or loss of market share, among others. Therefore, it is important to have methodologies that allow organizations to respond quickly to changes and adapt to them in order to remain competitive in the market. Hence, changes or the implementation of new BPs must be considered with a methodology that enables informed decision-making.
Therefore, the use of a process modeling algorithm is proposed to enable organizations to timely react to changes in the environment by establishing the related entities and attributes.
There are a large number of business process modeling techniques available to represent the various elements that comprise them, with the purpose of understanding and analyzing them from an operational perspective [4]. Furthermore, the representation and analysis of business process models serves as a foundation for the development of information systems that support the value chain of organizations [5]. The technique employed in this research is Petri net (PN) modeling, which utilizes a methodology characterized by two main aspects: (a) schematic modeling methodology, and (b) formal methodology with mathematical representation [6]. By implementing the business process modeling using PNs, tangible benefits can be achieved.
Business process management is an activity that has been strengthened over time by incorporating different concepts, such as process modeling, process mining, and process representation; a description of these elements is provided below.
Business processes must somehow be raised in a context that can be understood by people; if the definition of process is “a list of related activities that seek to obtain the objectives of the organization”, then a list of activities could describe the process. If this list is shown as a workflow in which the order of their execution is indicated, then the process can be made more understandable, leaving abstraction aside. Consequently, we understand that a model is a representation and that modeling is the creation of a model. This concept is significantly important, as a clear understanding of the process is the starting point for the creation of IT systems, simulation studies, and ways to improve or implement processes for an organization, for example sales control, collection, storage, etc. These issues have led to interest in the study of BPM. Process modeling differs from process design in that design must consider the organizational scheme in assigning tasks, the technology being used, and even the budget that must be allocated for its operation. For this reason, it is important to clarify that design is not modeling [7].
The concept of process mining is related to data mining, and is used to discover, validate, and improve workflow behaviors. By combining data mining and process analysis, organizations can extract information from the registry of their information systems and understand their performance, thereby discovering areas for improvement. Mining uses a data-based approach for process optimization, which allows leaders to make decisions without ambiguity in the understanding that their information is current, reliable, and trustworthy.
One of the functions of process mining is model discovery. This implies the implementation of certain algorithms that convert an event record into a model that is capable of representing the recorded behavior. However, in the present work we do not try to create or discover a new process, as the focus is that a graphic model is obtained starting from a process described in natural language and with certain writing rules that allow the behavior of each one of its activities to be simulated.
Process mining has several discovery algorithms, including the Alpha algorithm, which produces a Petri net from a record of events that, in theory, should be able to represent the record in question. This was one of the first algorithms able to contemplate the concurrency of activities in its model. This Alpha algorithm processes the record following a series of rules, from which it searches for a series of relationship patterns between activities. The algorithm proposed in this work, in general terms, reads the records of a database, reads whether it is a square or a transition, and uses existing connections to later draw a Petri net on a plane. Its operation is described and explained later [8].
There are several opportunities in the field of process mining [9]:
  • Finding the behavior pattern of a process based on organizational structures.
  • Designing processes to facilitate the agile use of data.
  • Using process mining to create a balance between automation and human participation in business processes.
  • Investigating reference models for value creation in the context of best practices.
This project tries to bring system designers closer to obtaining business improved process models that are aimed at ensuring better practices.
Petri nets are a tool to model workflows; when modeling them, users tend to draw nodes that represent tasks or activities, with arcs between the nodes representing the sequence of activities. Petri nets (PN) belong to a technique that is gaining popularity in different industrial sectors, such as automotive, computing, information technology, and more.
They first gained popularity in the 1990s for simulating more common systems, for example, production lines, banking service processes, and supply chains, among others. PNs have an elegant and simple mathematical foundation. Its explicit graphical representation allows the visualization of the dynamic behavior of the results in the process simulation. Generalized Networks (GN) are a tool for describing adaptive, flexible, and structured business models of complex systems with many different and interacting components that are not necessarily homogeneous and may have parallel and simultaneous arrangements.
Generalized nets represent a significant extension and generalization of the concept of Petri nets. While PNs and GNs both contain places, transitions, and tokens, the positions are of a more complex structure in GNs. The input and output in the transitions of the GN contain the moment of activation. When entering a new place, the token changes its characteristics. This constitutes a very important difference, as the movement of the token represents the change of state of the network; thus, GNs allow more complex systems to be modeled [10].
Regarding the theory of Service Systems, in which a service can be considered as the provision of assistance and experience through a supplier–client interaction to create and capture value in business, in terms of resources, services can be understood as a series of activities in which resources of various kinds (employees, physical resources, goods, service provider systems) are used in interaction with the customer to find a solution to a problem or need.
From this perspective, a service system is not simply the sum of its parts; rather, the interactions form a higher-order construct. The service can be understood as the results of value co-creation under a win–win logic within interrelated processes. One approach to the results of process mining has revealed that it is possible to obtain a system of transitions in which these are comparable to the activities of the processes. Essentially, to derive a process in transitions means to obtain a PN. In this context, a well-known area of PN theory is called Petri net synthesis [11].
Among the advantages of using Petri nets as a business process modeling tool are the graphic way in which they are handled (i.e., squares, transitions, arcs), which makes them a very light tool, the high precision of the mathematical syntax, and the possibility of simulating states due to the implicit handling of tokens.
This article begins with an introduction to the conceptual framework of business process modeling highlighting the advantages of utilizing PNs for modeling purposes. The second section provides an overview of the current state of the field and describes the fundamental form of PNs. In the third section, a case study is presented, specifically focusing on the workflows of a Water Operating Agency and employing elementary PN structures to model them. Finally, the article concludes by summarizing the findings and discussing how business process modeling with PNs can enhance the competitiveness of organizations.

2. Fundamental Concepts

This section consolidates the key fundamental concepts that are utilized in this work.

2.1. Supply Chain

The Supply Chain (SC) refers to the interconnectedness of the various actors involved in fulfilling a consumer’s needs through the acquisition of a product or service. This cycle commences with the production of raw materials, which are then transformed into supplies used in the manufacturing or assembly of goods or delivery of services [12].
The fundamental element of a supply chain is the collaboration and joint effort of two or more companies with the aim of creating a competitive advantage and generating profits that would be difficult to achieve if each company acted independently. This collaboration involves inter-company relationships in which information, resources, rewards, risks, and responsibilities are shared among the participating entities. By working together, companies can leverage their combined strengths and resources to achieve mutual benefits and improve overall performance [12].
The supply chain involves various business processes that are essential for the smooth operation of the chain. These processes include transportation, storage, transformation, rental of services, sales, and more. Each organization participating in the supply chain performs these processes to ensure the efficient flow of goods and services throughout the chain. Transportation processes ensure the movement of products from one location to another, while storage processes involve the proper handling and management of inventory. Transformation processes may involve manufacturing or value-added activities, while rental of services can include leasing or outsourcing certain functions. Sales processes are responsible for promoting and selling products to customers. Each organization within the supply chain contributes to these processes in order to fulfill customer needs and drive the overall success of the chain [12].
Effective supply chain management is essential to ensure the availability and timely delivery of products, keep costs in check, reduce waste, and improve customer satisfaction. To achieve this, different strategies and tools such as demand planning, inventory management, forecasting, optimization of transport routes, and use of information technologies are used to improve visibility and coordination throughout the chain [13].
A well designed and managed supply chain can provide competitive advantages to companies by allowing them to quickly respond to market demands and adapt to changes in economic and business conditions. In addition, an efficient supply chain can have a positive impact on sustainability and corporate social responsibility by reducing waste and improving energy efficiency in production and distribution processes [13].

2.2. Enterprise Resource Planning (ERP)

An ERP is a set of software modules integrated with a common central database. The database collects information from many divisions and departments of the company, intervening in a large number of key business processes related to manufacturing and production, finance and accounting, sales and marketing, human resources, etc. The application layout supports most of an organization’s BPs [14].
The main characteristic of an ERP is that the database is centralized, meaning that all the modules that make it up (sales, finance, accounting, production control, payroll, etc.) record and take information from the same database. In addition, as they are network-based systems, the information is available immediately.
The advantages of using an ERP include the following [15]:
  • Unification: allows all the functions and departments of the company to be unified in a single framework, which facilitates communication and collaboration between the different teams.
  • Automation: although it is not a feature of ERPs, repetitive and well-structured tasks can be automated, avoiding errors and saving time in their execution.
  • Information in real time: because ERPs are systems that work in a network, information can be updated in real time to facilitate decision making.
  • Efficiency and productivity: ERPs are based on the best practices of the industry; thus, when a company implements a system of this type, it can anticipate improved efficiency and increased productivity.
  • Cost reduction: costs can be reduced through improved efficiency.
  • Control and visibility: management decision-making is optimized, along with issues related to different business processes, thanks the availability of reliable, timely, and truthful information.
  • Regulatory Compliance: compliance with applicable laws and regulations is assured by maintaining accurate and up-to-date records.
  • Scalability: ERP systems are scalable and can be adapted as the company grows or changes.
The use and implementation of these systems requires the necessary infrastructure for its application and training for personnel in the correct obtaining, use, administration, and interpretation of the information contained in it. Each implementation is unique, and may require modifications in order to meet particular business requirements [14].

2.3. Value Chain

The conceptual model designed by Michael E. Porter (1985) distinguishes between primary activities and support activities. This general model categorizes primary activities as those that add value to the manufacturing of a product or the offering of a service. On the other hand, while support activities are essential for the production process, they do not directly add value; without these support activities, it would not be possible to achieve the organization’s objectives [16].
The value chain can serve as a tool to analyze a business by breaking it down into its main activities, which helps to identify potential sources of competitive advantage. The relationship between the value chain and business process (BP) concepts is significant. The primary activities in the value chain correspond to the primary business processes, while the supporting activities in the value chain align with supporting business processes [17].

2.4. Petri Nets

Petri nets (PNs) are a powerful tool for modeling events in a process; they combine visual representation with an underlying mathematical framework. PNs offer a suitable graphical language for modeling concurrent systems. They comprise two types of nodes, namely, places and transitions. Over time, PNs have been modified and extended to provide more advanced modeling capabilities. Variations of Petri nets include timed Petri nets, stochastic Petri nets, colored Petri nets, and hierarchical Petri nets [18].
Petri nets allow the behavior of processes to be modeled. The model is itself a representation of reality, and a representation does not imply real construction with all of its technical and financial drawbacks. In business processes, the intervention of two or more areas of the organization in parallel is frequent; for example, in the process of enrolling students in a university, the activities involved could include consolidation of debts to the treasury, library, and sports store, all of which can be done in parallel despite involving three different areas. Petri nets were specifically designed to model this type of system.

2.5. Water Operator Agency (WOA)

According to [19], the Water Operator Agency used in the case study is responsible for maintaining and managing drinking water, sewage, and sanitation systems. Their primary goal is to provide these essential services to the population of a municipality or a federal entity.

3. Related Work

In the 1990s, numerous industries developed workflow management systems and created languages for modeling business processes. Many of these languages utilized graphical syntax. However, despite the apparent simplicity of defining such languages, it is a complex undertaking due to the dynamic semantics of processes. Examples of these languages include ARIS, BPEL, BPMN, and UML. However, these modeling languages encountered issues with their formal semantics. For instance, BPEL lacks graphical modeling capabilities, while the semantics of UML and BPMN activity diagrams converge towards PNs [6]. The ease and flexibility offered by graphical modeling languages provides the possibility of introducing control flow anomalies into process specifications [20].
A process is a series of related and structured activities, and Petri nets (PNs) can effectively reflect this process by simulating the changes of state involved. PN modeling is distinguished by being a formal tool with available support to analyze and verify systems, thereby increasing reliability and detecting errors during the design phase [21]. However, classical PNs have limitations when it comes to describing multiple tokens within BP modeling, as they become indistinguishable. To overcome this limitation, it is recommended to use Colored Petri Nets (CPNs), which allow for the integration of different types of data with complex manipulation. CPNs provide the advantage of enhanced flexibility and versatility in modeling business processes [22]. In this case, it is necessary to establish the rules or policies of the business process. One approach to accomplish this is by using the Event-Condition-Action (ECA) concept to represent the main rules found in the workflow. These ECA rules are assigned strictly based on full CPNs, allowing for a clear representation of the rules and corresponding actions within the process [22]. A CPN is a graphical language used for constructing models of concurrent systems and analyzing system properties [22], including the establishment of various business rules. These rules can represent policy agreements or definitions related to the criteria applied by organizations in their interactions with customers, partners, or employees, typically expressed in natural language. Additionally, a decision table can be utilized to describe a set of interconnected decision rules using the “If–Then” structure [23].
Describing a BP using natural language presents a significant challenge due to the inherent ambiguity, semantic nuance, sentence composition, word relevance, and contextual connections between sentences [24]. It can be configured as a flow consisting of numerous sub-operations aimed at fulfilling a commercial function or adapting to changing business requirements. The objective is to simulate the operational granularity of the process. However, it is important to note that as the granularity of operations becomes smaller, the system becomes more costly and challenging to operate and maintain. Therefore, achieving the correct decomposition of a system becomes a crucial goal in supporting changes to the business process. This ensures that the final process operations can effectively support the overall business operation and accommodate potential changes [25].
It is common for organizations to have multiple variations of a specific business process, such as different sales processes for various products or distinct accounting processes for different countries. However, traditional business process modeling languages do not explicitly support the representation of such process variants. This challenge has prompted significant research efforts in the past decade, resulting in various approaches to business process variability modeling.
These approaches typically extend conventional process modeling languages by introducing constructs that can capture customizable process models. A customizable process model represents a family of process variants; each variant can be derived by adding or removing specific fragments based on customization options or a predefined domain model. By incorporating these constructs, organizations can effectively model and manage their diverse process variants, providing flexibility and adaptability to address specific business requirements and customization needs [26].
Around the year 1990, BPs gained significant attention in the industry as managers recognized that computer systems were not fully leveraging their potential. Information systems were developed to support data-oriented business processes, which involved capturing and recording the state of objects within those processes in a database. Consequently, database technology became widely utilized during the early 1990s.
Indeed, the purpose of information systems is to automate tasks and replicate human work using computers with the ultimate goal of supporting and enhancing business processes. These systems are designed to streamline and optimize the execution of tasks, leading to improved efficiency and effectiveness in various organizational activities. By leveraging information technology, companies aim to enhance their operational capabilities and harness the power of computer systems to drive their business processes forward [27].
Workflow management systems have become counterparts to database management systems. Database management systems are configured by a data scheme and a set of constraints, while a workflow management system is configured by a process model. A workflow engine can be integrated into a larger information system in the same way as a database engine. From 1995 to around 2005, there was a strong focus on supporting business processes with workflow engines, after which interest shifted to business process systems such as Business Systems Planning and Supply Chains [6].
BPs problems share similarities with those encountered in project management, and simulation has proven to be a successful approach in solving them. Simulation provides a structured environment for understanding, analyzing, and improving business processes. It is particularly effective for stable processes, though less suitable for dynamic systems that do not reach equilibrium. The key advantage of simulation-based analysis is the ability to predict process performance using quantitative measures such as lead time, resource utilization, and cost. This enables the identification of inefficient behavior in process execution. By utilizing simulation tools that leverage mathematical models, business process execution data can be used to optimize and redesign processes. Dynamic process models allow for the analysis of alternative scenarios through simulation, providing quantitative metrics such as cost, cycle time, serviceability, and resource utilization. These metrics serve as a basis for evaluating options and selecting the most promising scenario for implementation. However, despite their potential for measuring performance and conducting experiments, analytical models (often mathematical) have not received significant attention due to their complexity [4].
Building complex systems can be challenging due to their inherent complexity. However, capturing user requirements in a rigorous and comprehensive manner can help to alleviate this problem. Unfortunately, this task is often difficult to accomplish, as customers and developers may not use the same terminology or vocabulary when discussing requirements. In behavior-intensive applications, dynamic behavior becomes a critical aspect to consider. This is in contrast to database systems, where the focus is on the relationship between data types. Scenarios play a crucial role in understanding system behavior, as they depict specific sequences of actions that illustrate behaviors in response to external stimuli starting from a well-defined system configuration. Petri nets are utilized to formalize the behavior of components, systems, or applications that exhibit complex behavior. As a formal model, Petri nets eliminate ambiguity and allow for validation of the specified behavior [28].
BPs plays crucial roles in the functioning of a company. However, traditional software architecture is primarily designed for relatively static BPs, which leads to certain limitations. Notably, the process logic is tightly coupled and embedded within application implementations, making it challenging to extract the standalone process logic. Consequently, if changes are required in the BP, it becomes extremely difficult to establish a clear traceability between the business requirements and the system implementation [25]. In this paper, we discuss two software tools that can serve as a frame of reference for the explanation of the proposed application: ProM (Process Mining Workbench) and DISCO (DISCOver your process). These examples of software tools used in process mining are compared below.

3.1. ProM

Process Mining Workbench is an open source framework used in the field of process mining to analyze and visualize business process data. Its characteristics include [29,30,31]:
  • Extensibility and Modularity: ProM is designed in a modular way, which means that it is possible to add and combine different plugins to adapt it to specific needs.
  • Variety of Process Mining Algorithms: ProM includes a wide range of algorithms for process discovery and analysis, including model discovery, conformance checking, and rule discovery, among others.
  • Process Visualization: ProM offers visualization tools to graphically represent business processes, which helps to better understand the flow of activities and events.
  • Model Discovery: ProM can help to create process models from event logs. This includes the generation of flowcharts and Petri net models, among others.
  • Performance Analysis: certain versions of ProM include tools to assess process performance, such as bottleneck detection and identification of areas for improvement.
However, as with any tool or software there are features that certain users might consider to be drawbacks or limitations; for example [32,33]:
  • Learning Curve: ProM may have a steep learning curve for users unfamiliar with process mining or the software itself, and advanced functionalities may require a solid understanding of the underlying concepts.
  • Data Format Compatibility: ProM can be picky with regard to the data formats it can handle. Users may need to prepare their data in a specific way before they can be used in the tool.
  • Process Log Generator: ProM randomly generates models based on user-supplied criteria and can provide a related simulated event log; however, it does not provide a way to modify the generated model or change simulation options.

3.2. DISCO

DISCO (DISCOver your process) is a process mining software used to analyze and visualize business process data. Its characteristics include [34,35]:
  • Intuitive User Interface: DISCO has a friendly and easy-to-use user interface, making it easy to load data, perform analysis, and view results.
  • Process Analysis: DISCO offers a variety of tools to analyze business processes, including workflow visualization, pattern identification, and deviation detection.
  • Model Discovery: DISCO can generate process models from event data, allowing users to understand how activities in a process unfold.
  • Conformance Analysis: DISCO can be used to compare event records with a previously defined process model to identify discrepancies and deviations.
  • Process Visualization: DISCO offers different types of visualization, such as flow charts, Gantt charts, and process maps, to help understand and communicate the flow of activities.
  • Performance Analysis: DISCO can help to identify bottlenecks, wait times, and other areas for process improvement.
  • Large Data Set Support: DISCO can handle large event datasets, which is essential for analyzing complex processes.
  • Complex Events Support: DISCO provides event handling with attributes and properties, allowing for more detailed analysis.
While DISCO is a widely used and appreciated tool, it has features that might be considered disadvantages as well, for example [33]:
  • Cost: DISCO is a commercial tool, which means that it may have costs associated with its acquisition and licensing. This may be a limitation for individual users or small organizations with limited financial resources.
  • Learning Curve: as with any specialized tool, DISCO can have a steep learning curve for those who are new to process mining or to the tool itself. Understanding advanced functionality can require considerable time and effort.
  • Hardware Requirements: DISCO may require significant hardware resources to handle large event datasets and perform complex analysis, which could limit its use on systems with insufficient capabilities.
  • Quality Data Dependency: as with any process mining tool, the results are highly dependent on the quality of the input data. If the data are incomplete, inconsistent, or poorly recorded, the results could be less accurate or useful.
  • Data Format Support: as with many tools, support for specific data formats could be a challenge. Users may need to adjust or transform their data before use.

4. PN Basics

In the current project, PNs are utilized as the modeling tool. A PN is defined as a graph consisting of two main components, denoted as N = < P , T , R > . There are two distinct types of elements in a PN: places ( P ) and transitions ( T ) . The connections between places and transitions are represented by components called arcs ( R ) . Places are visually represented by circles, while transitions are depicted as bars. According to the principles of PN theory, elements of the same type cannot be directly connected.
Places (circles) can hold tokens, which are movable entities within the network. Tokens can traverse the network by crossing transitions (bars). The configuration of tokens in the places is determined by a set of marks M, which assigns an integer value to each place: M = < M ( p 1 ) , , M ( p i ) > . Here, i represents the total number of places in the network and M ( p i ) denotes the number of tokens present in place p i . Therefore, the quantity and arrangement of tokens throughout the network governs the execution of the PN and indicates the state of the system.
PNs serve as a solid mathematical foundation for constructing process models. They possess a modeling formalism characterized by precise graphical representation, well-defined syntax, and clear semantics.
The marks in a PN serve as a representation of the states within a dynamic system. These states change dynamically as tokens move between places. The activation of transitions in the network triggers state changes by removing tokens from input places and adding them to output places. This dynamic behavior of PNs allows for effective modeling of parallel processes and solving real-life tasks.
In a theoretical context, PNs offer significant advantages, including their formalism and intuitive representation of process elements, events, and their interactions. This facilitates the construction of accurate process models that closely correspond to real-world objects and their dynamics. PNs enable the visualization of process components and their interactions, making it easier to understand the dynamics of the system.
One of the key strengths of PNs is the ease of handling network parameters and observing state changes through immediate visualization. This makes them a powerful tool for modeling and simulating various processes in order to provide insights into their behavior that can aid in decision-making [36].

4.1. Relevant Aspects of the Construction of Petri Nets [37]

A formal definition of a PN is presented below [38].
A Petri net is a 5 t u p l e , P N = ( P , T , F , W , M 0 )  where:
  • P = { p 1 , p 2 , , p m } is a finite set of places,
  • T = { t 1 , t 2 , , t n } T is a finite set of transitions
  • F { P × T } { T × P } is a set of arcs
  • W = F { 1 , 2 , 3 , } is a weight function
  • M 0 = P { 1 , 2 , 3 , } is the initial marking
  • P T =  and  P T .
The set of places connected to a transition is known as the input places, which is denoted as t . On the other hand, the places connected from a transition are known as output places, and the set of output places is represented by t . The movement of tokens through the PN represents the dynamic behavior of the system. To change the token position, the following transition firing rule is used [38]:
  • A transition t T is enabled if every input place p P of t has w ( p , t ) tokens or more, with w ( p , t ) being the weight of the arc from p to t.
  • When an enabled transition t fires, the event represented by t takes place.
  • When an enabled transition t fires, w ( p , t ) tokens are removed from every input place p of t and w ( p , t ) tokens are added to every output place p of t, with w ( p , t ) being the weight of the arc from t to p.

4.2. Analysis Methods

In this paper, we apply the matrix equation approach as the analytical method of PN theory to calculate the makespan of the modeled FMS.

4.3. Incidence Matrix and State Equation

A PN with n transitions and m places can be mathematically expressed as an n × m matrix of integers, denoted as A = [ a i j ] . The values for each element of the matrix are provided by a i j = a i j + a i j , where a i j + represents the weight of the arc from transition t to place p i j and a i j represents the weight of the arc from place p j to transition t i .
The state equation is used to determine the marking of a PN after a transition firing, and can be written as follows:
M k = M k 1 × A T U k , k = 1 , 2 ,
where U k is an n × 1 column vector with n 1 zero entries and one non-zero entry, representing the transition t j that will fire. The non-zero entry is located in position j of U k , A T represents the transpose of the incidence matrix, M k 1 denotes the marking before the firing of t j , and M k represents the resulting marking after the firing of t j indicated by u k .

5. Basic Structures of Petri Nets Applied to Business Process

In this section, we propose four Petri net structures for BP modeling. These structures are designed to represent the relationships among processes, and model various scenarios and behaviors within organizations.
The simplest structure, depicted in Figure 1, represents a single activity. It consists of a transition ( t 1 ) and its corresponding output place ( p 1 ).
When two activities are executed sequentially, they are connected in the required order, as depicted in Figure 2.
Figure 3 illustrates the PN for selecting an activity based on a certain condition. The token positioned in P1 can be moved either to place 3 or place 4 (disjunction). The choice of the activity to be carried out is determined by the process itself. For example, the process description could be as follows:
  • First Activity: “generate invoice (1)”.
  • Next Activity: “deliver the invoice to the client personally (2)” or “send the invoice to the client via email (3)”.
Figure 4 depicts the PN for executing activities in parallel. The token is initially placed in P1, and can be moved to both P3 and P4 simultaneously (conjunction). The activities are executed concurrently. For example, the process description could be as follows:
  • First Activity: “buyer arrives at the checkout (1)”.
  • Following Activities: “cashier registers the sale of items (2)” and “ the inventory in the system is updated (3)”.
Figure 5 illustrates the Petri net for executing an activity triggered by different preceding activities. The token is observed in Activity 3, and can originate from either Activity 1 or Activity 2. The execution of Activity 3 occurs when the trigger comes from either Activity 1 or Activity 2. For example, the process description could be as follows:
  • Activity 1: “buyer buys online”.
  • Activity 2: “buyer buys in-store”.
  • Activity 3: “finance department generates invoice”.
The execution of Activity 3 is triggered by either Activity 1 or Activity 2.
Figure 6 depicts the PN for the synchronization of activities in parallel. In this structure, the token is present in both Activity 1 and Activity 2. Both activities must be completed in order for Activity 3 to be executed. For example, the process description could be as follows:
  • Activity 1: “client pays the advance payment of a car”.
  • Activity 2: “financial company approves credit for car purchase”.
  • Activity 3: “manufacturing department assembles automobile”.
Activity 3, which involves assembling the automobile, can only be executed when both Activity 1 (client payment) and Activity 2 (credit approval) have been completed.
BPs can be broken down into subprocesses, and these subprocesses can be modeled using the six basic PN structures. Depending on the number of subprocesses, the resulting network may be more or less complex.

5.1. Applications

Petri nets have been proposed for a wide variety of applications due to their generality and permissiveness. They can be applied to almost any area of engineering or system that can be represented graphically, for example, flowcharts to show sequential, parallel, or concurrent activities. In this type of representation it is important to take into account that a model represented in a very general way can lose analytical capacity. As the model becomes more general, there are fewer elements available for analysis; in fact, one of the disadvantages of Petri nets is that as the systems or processes to be modeled grow more complex the PNs likewise become more complex and difficult to understand, which can make analysis difficult even for a system of modest size. As an example, a graphic model of fouling and scoring in basketball is provided later in this section [38].
The application areas of Petri nets according to Murata are: modeling and analysis of distributed software systems, distributed database systems, concurrent and parallel programs, flexible manufacturing/industrial control systems, discrete event systems, multiprocessor memory, data flow computer systems, fault tolerant systems, programmable logic, asynchronous circuits and structures, compilers and operating systems, office information systems, formal languages, and logic programs. Other interesting applications considered in the literature are local area networks, legal systems, human factors, neural networks, digital filters, and decision models. The use of computer-aided tools is a necessity for practical applications of Petri nets. Most Petri net research groups have their own software packages and tools to assist in drawing, analysis, and/or simulation of various applications; in the case of the present investigation, a system for the simulation of Petri net processes is included [38].
As already mentioned, a Petri net is a directed graph that includes an initial state called the initial mark or M0. The underlying graph is a bipartite, weighted, and directed graph consisting of two types of nodes, called places and transitions, with the arcs joining from a place to a transition or from a transition to a place. In the graphic representation, places are drawn as circles, while transitions are drawn as bars or boxes.
In modeling, using the concept of conditions and events, places represent conditions and transitions represent events. A transition (event) has a number of entry and exit locations that represent the pre- and post-event conditions, respectively.
The presence of a token in a place is interpreted as holding the truth of the condition associated with the place. In another interpretation, k tokens in one place indicate that k data items or resources are available.
Typical interpretations of transitions and their entry and exit places are provided here as an example.
Table 1 shows typical input and output connotations applied to transitions.
In general, the behavior of systems can be described in terms of the states of the system and their changes. To simulate the dynamic behavior of a system, a state or token in a Petri net is changed according to the following transition (trigger) rule:
  • A transition t is enabled if each input location p of t is marked with at least w(p, t) tokens, where w(p, t) is the weight of the arc from p to t.
  • A transition may or may not enabled the firing of a token, depending on the event that is to be fired.
  • A trigger on an enabled transition t moves w(p, t) tokens from each input location p of t, where w(t, p) is the weight of the arc from t to p.
A transition with no place of entry is called a source transition, while one with no place of exit is called a well transition. A source transition is unconditionally enabled, while activating a pool transition consumes tokens without producing any.
A pair of places p and a transition t is called a self-loop if p is both an entry and exit place of t. A Petri net is said to be pure if it does not have any self-loops; moreover, a Petri net is said to be ordinary if all the weights of its arcs are one.
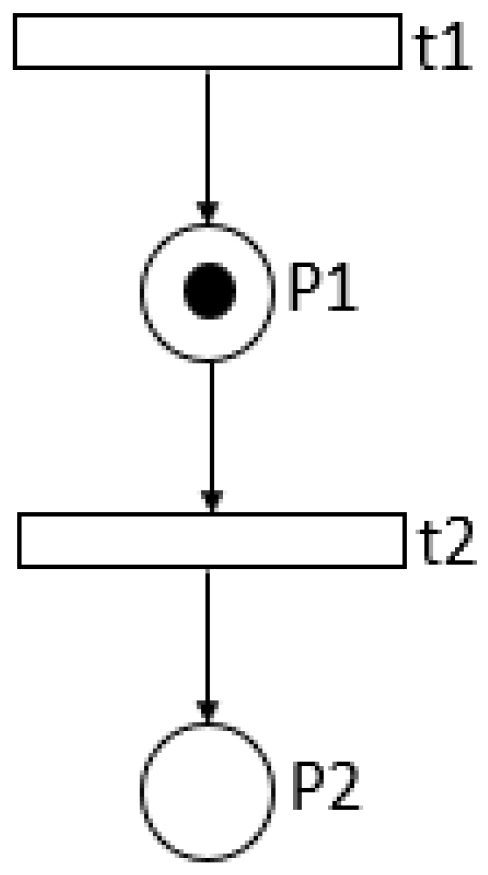
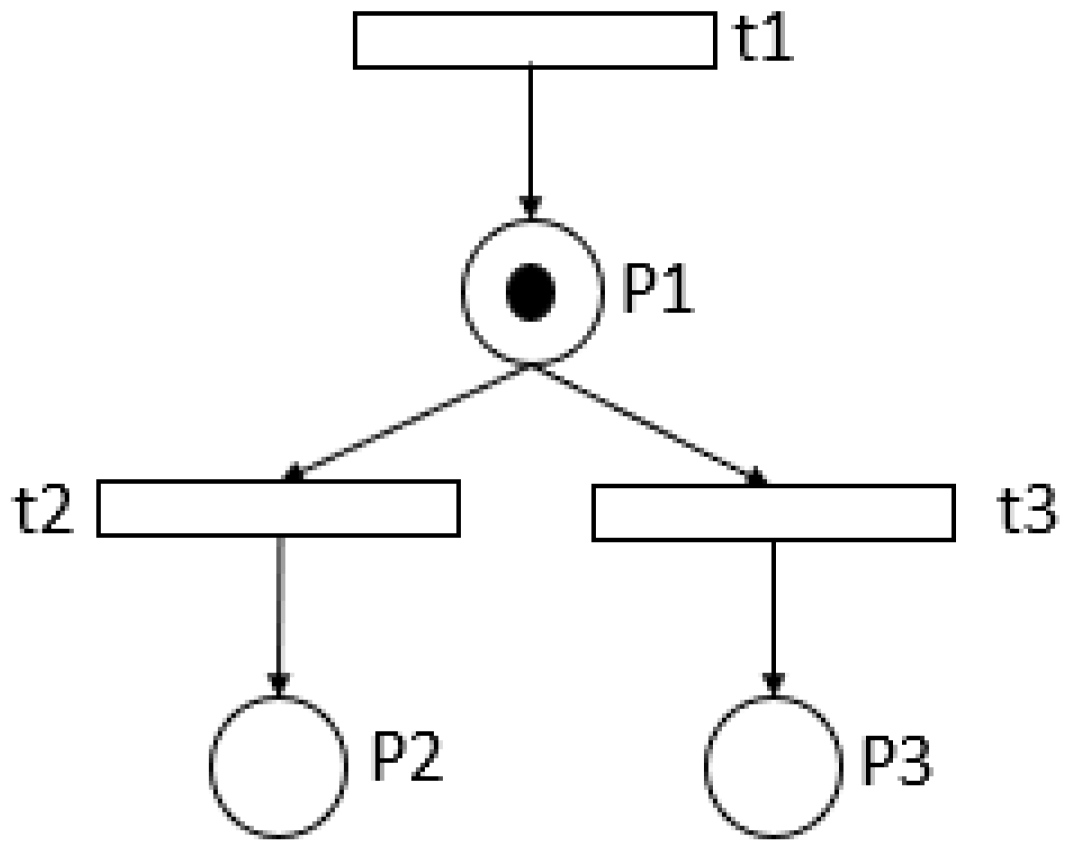
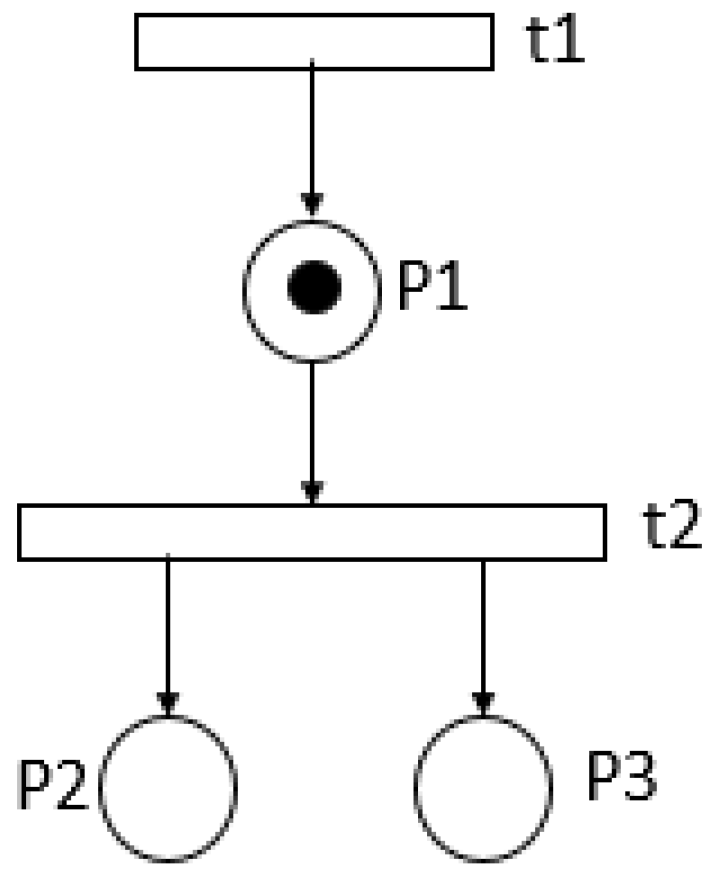
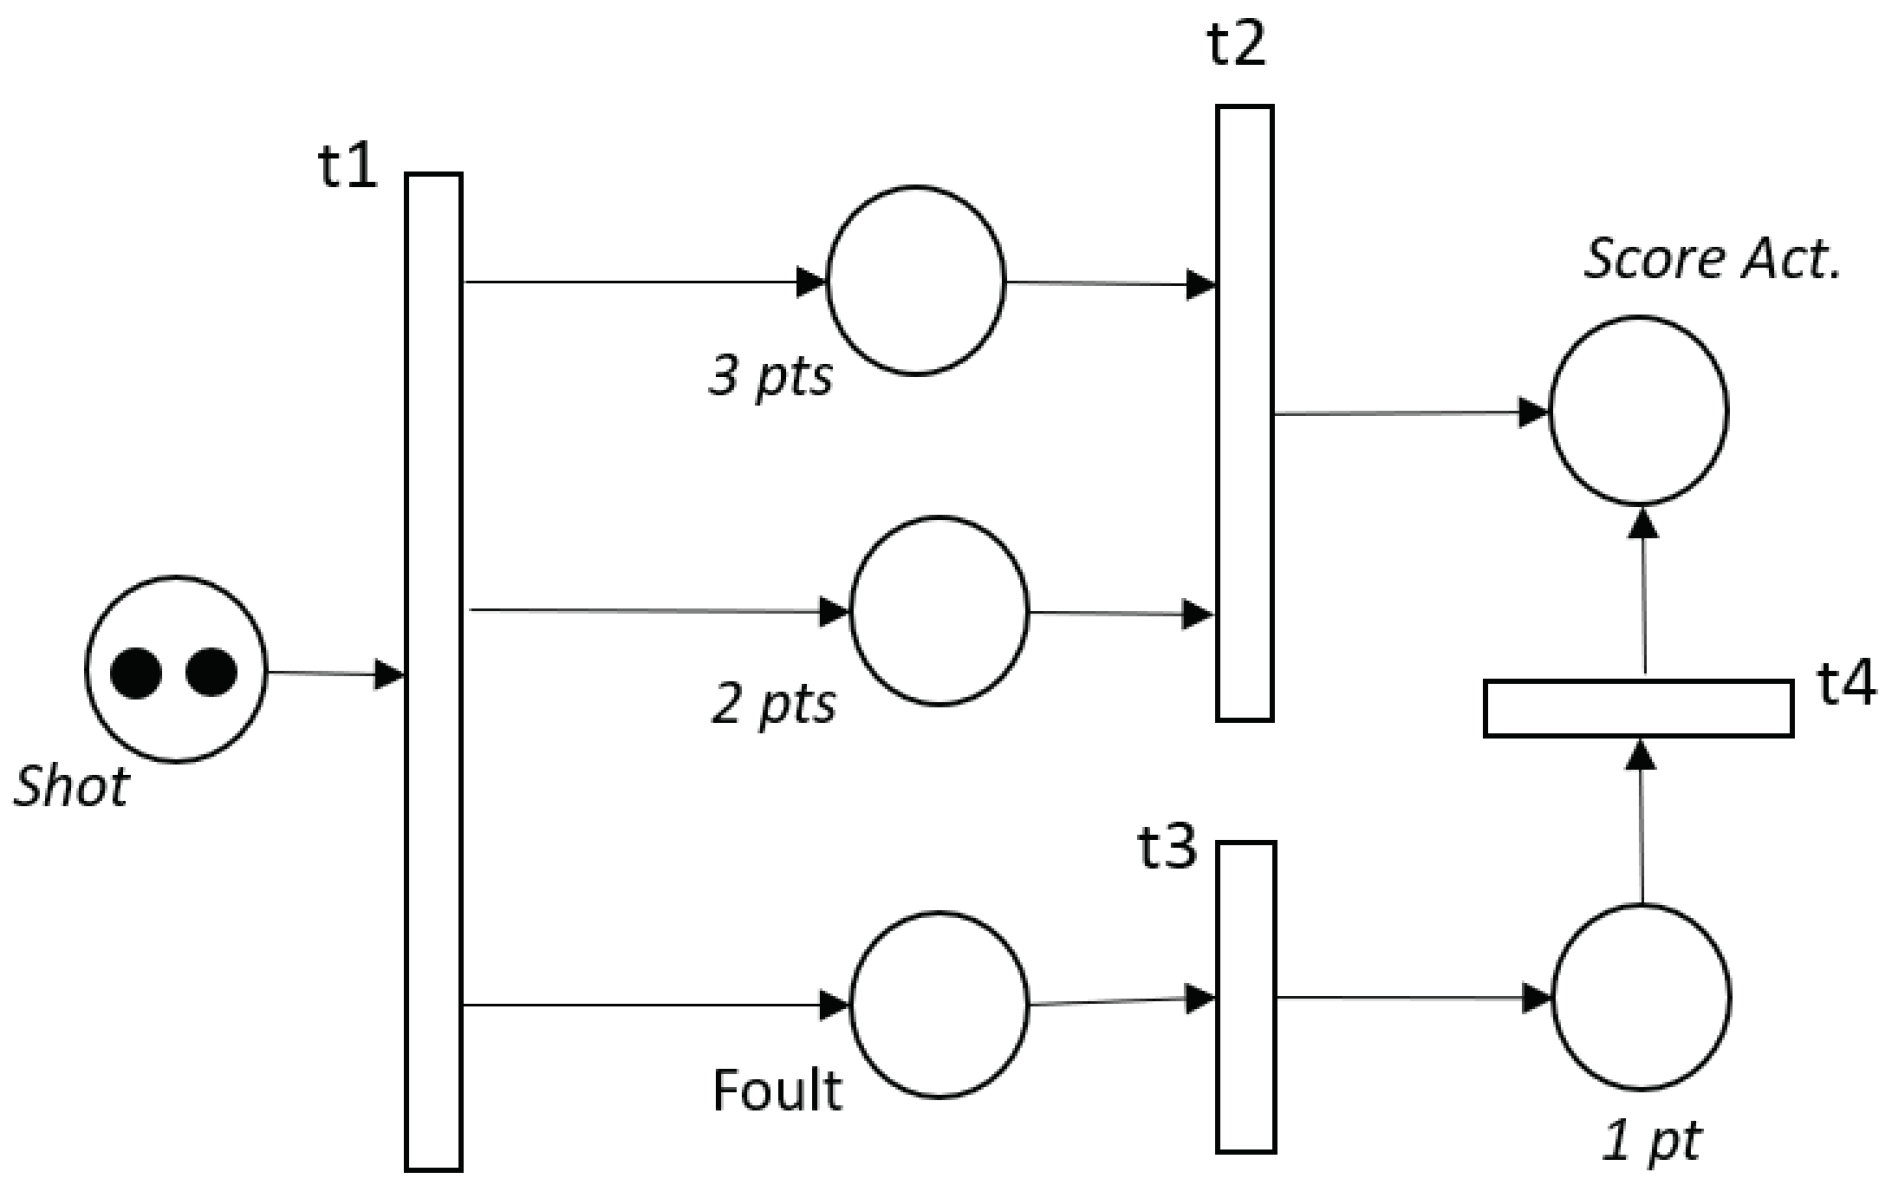
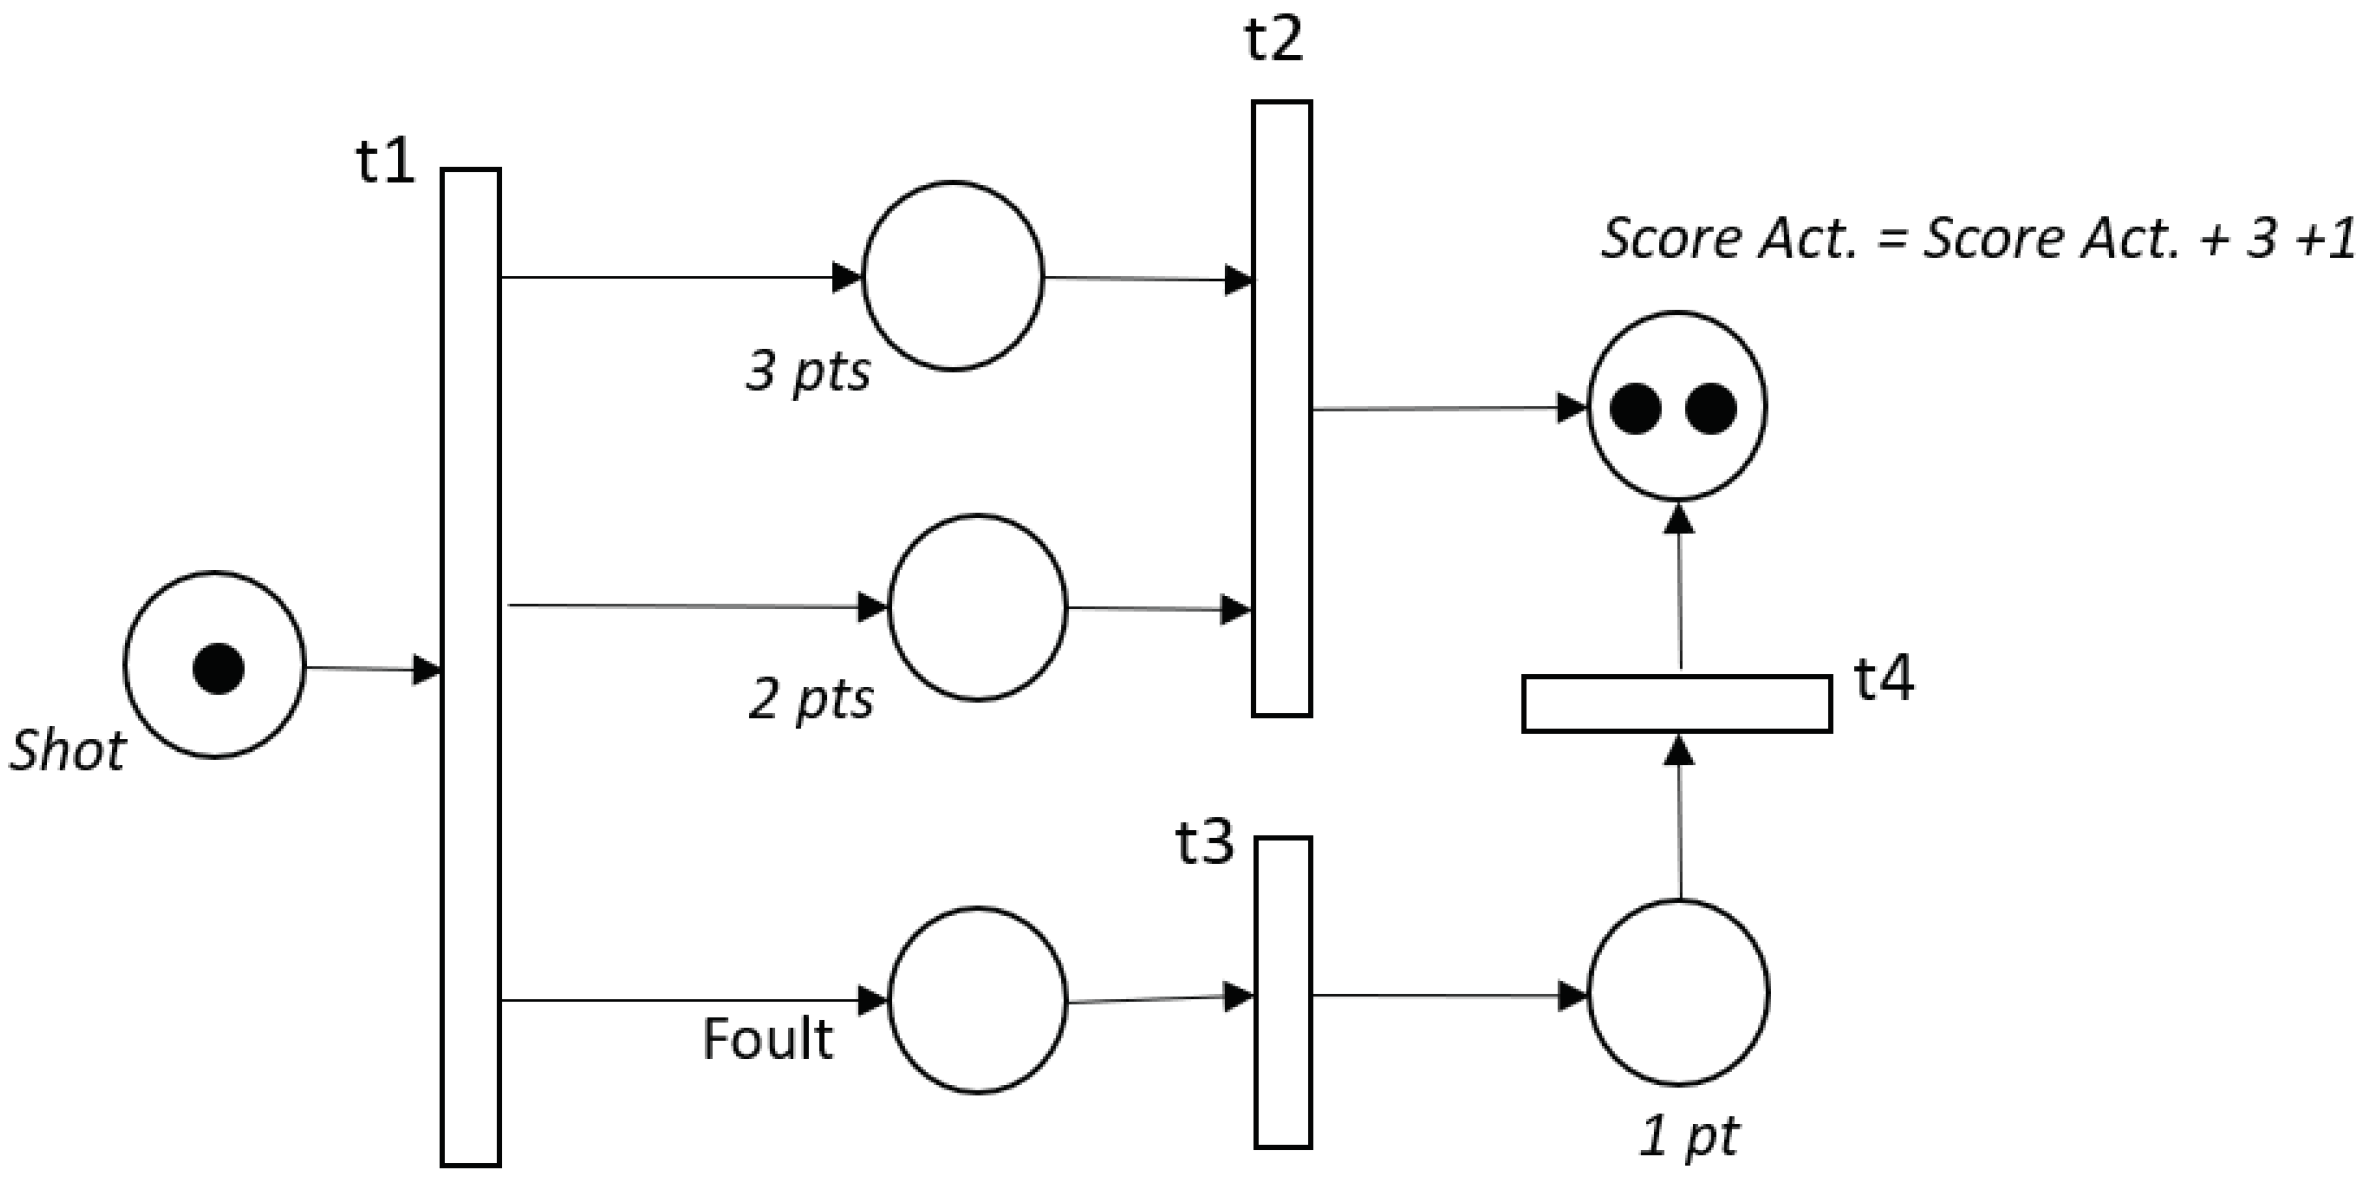
The above transition rule is illustrated in the Figure 7, Figure 8, Figure 9, Figure 10 and Figure 11 using the event called “foul and score” in basketball. For this, it must be clarified that the shot place refers to a basketball player who has the possibility of shooting on the basket; in this example we start with two tokens (two shots), although we know that any player can have the opportunity to shoot on the basket n times within the regulation game time.
The player shoots on the basket and two events occur: he scores on a three-point shot and is fouled on the same play, as shown in Figure 8.
Thus, in Figure 9 we have three points: w(3 pts, t2) = 3.
In Figure 10, the player shoots the free throw resulting from the foul and scores one point.
In Figure 11, one point is added to the score: w(1 pt, t4) = 1.
Petri nets provide a mathematical foundation for the construction of process models, incorporating a modeling formalism with a precise graphical representation, syntax, and semantics.
Petri net tokens characterize the states of a dynamic system, and the dynamics of state changes are modeled by the movement of tokens around locations. The state of the network can be changed as its transitions are activated. When a transition is triggered, a token is removed from each input location and added to each output location. PNs have fundamental advantages for modeling parallel processes and solving real-life practical tasks. In the theoretical context, they have essential benefits such as formalism and intuitively clear facilities that correspond to real objects (process elements), events, and their interaction, which encourages the construction of real process models. In addition, Petri nets allow for demonstration of the interaction of the components of the process in terms its dynamics that can be visualized in the computer interpretation of the network. The facilities for handling the parameters of the networks and their change of state with immediate visualization make them powerful instruments for modeling and simulating various processes [36].

5.2. Relevant Aspects of the Construction of Petri Nets [37]

Objects
  • Places are represented with circles.
  • Transitions are represented by straight line segments.
  • Arcs join transitions and places.
Rules
  • Place p is the input to a transition t if there is an arc from p to t.
  • Place p is the output of a transition t if there is an arc from t to p.
  • A place can contain a positive or null number of tokens or marks, which are represented by a dot inside the circle that represents a square.
  • The marking of a Petri net is the set of tokens associated with each of the squares at a given instant, and defines the state of the Petri net.

6. Business Processes of a Water Operating Agency

A Water Operating Agency (WOA) is tasked with operating, conserving, and managing the drinking water, sewage, and other service systems in a city or region, ensuring their availability to the local population. These agencies are dynamic entities that must adhere to distribution standards, including maintaining appropriate quality, quantity, pressure, and consistency. The systems they oversee distribute drinking water to communities and treat wastewater for disposal from both urban and rural areas.
To achieve optimal performance, companies need to consider various pieces of information related to suppliers, customers, employees, invoices, payments, and their products and services. The activities within the organization should be organized in a manner that promotes efficiency and enhances overall performance. Business processes (BPs) encompass the organization, coordination, and orientation of work towards the production of goods or services. They involve the flow of materials, information, and knowledge, ensuring that the right resources are utilized effectively to achieve desired outcomes.
A selection of the business processes for an example WOA are established below using the Value Chain concept [19].
The primary activities to be considered for this WOA are as follows:
  • Customer registration
    Refers to the registration process of new users to use the services of the operating agency. This implies providing basic information, a feasibility study, and creating an account. This process is a key component of the growth strategy. The main objective is to increase the user base, which leads to an increase in revenue.
  • Installation of water intakes
    After hiring, the water intake is installed, which essentially consists of making a connection from the general conduction line to the internal conduction line of the residence in question. The objective is to ensure that the water supply is granted without interruption.
  • Taking readings of the water consumption measuring device
    The process of measuring and recording the amount of water consumed by a user. This activity allows for the billing of water services and monitoring the water usage on a property. In most cases, the water reading is taken using a water meter installed on the property that measures the flow of water entering the property and records the consumption in units of cubic meters.
  • Calculation of amounts to be paid for use of the service
    The reading information is used to calculate the amount that the user must pay for water consumption. Rates may vary depending on the amount of water consumed and the policies of the operating agency. Consumption is calculated by subtracting the current month’s reading minus the previous month’s reading.
  • Delivery of invoices
    The process of providing a (physical) document with the details of water consumption and the amount to be paid for the service. The water bill includes additional information such as the expiration date and rate applied.
  • Receipt of payment for the service
    The process by which users make the corresponding payment for the consumption of water they have used. This process allows the operating agency to receive the necessary funds to operate and maintain the water supply system. After making their payment, users receive confirmation of a successful transaction. Payment can be made at different financial institutions, convenience stores, or the agency’s own offices. The agency updates the user’s records to reflect the payment having been made.
  • Debt agreement
    This is the formal agreement between the WOA and a user who has an outstanding debt for water consumption. This agreement is generally established to recognize the debt accumulated by the user to allow them to regularize their financial situation while continuing to receive water supply services. A detailed payment plan is established describing how the amount owed is to be divided into smaller payments and in what terms they are to be made.
  • Hiring agreement
    Formal agreement between the WOA and the user that establishes the terms and conditions under which the water supply is provided. This type of agreement is used when a user wishes to obtain regular and continuous access to drinking water services and wishes to pay the contract amount in installments.
  • Debt adjustments
    Agreement between the WOA and the user to correct or modify the previous measurement of water consumption registered in a previous receipt. This is required when discrepancies in billing for water consumption are detected and adjustments need to be made to accurately reflect actual consumption. The specific reason why the water consumption adjustment is being carried out is recorded. This could be due to an incorrect meter reading, a previous billing error, or any other factor resulting in inaccurate billing.
  • Feasibility studies
    Analytical and evaluative process with the objective is to determine the technical, economic, social, and environmental feasibility of providing a drinking water supply service to a certain area or community. These studies are normally requested by subdivision builders or by companies that use water as a raw material, and are crucial before undertaking any project related to water supply, as they help to ensure that informed decisions are made and that resources are used efficiently and sustainably.
  • Water extraction and storage
    The process of capturing water from natural sources (underground wells or springs) to treat it and make it suitable for human consumption, along with later storage in suitable facilities for distribution to the population. This process ensures access to clean and safe water for domestic, commercial, and industrial use.
  • Maintenance of pipelines
    The set of regular activities that ensure the pipes and systems that transport drinking water from the supply sources to the distribution points are in optimal operating condition and meet the required quality and safety standards. This includes repairs and replacement carried out on damaged or worn pipe sections.
  • Attention to emergencies (i.e., flooding)
    The set of actions and protocols designed to guarantee the continuity and quality of the drinking water supply service during crisis situations, natural disasters, or unforeseen events that may affect the normal operation of the WOA and the availability of water for the population. This emergency care is essential to ensure that communities have access to safe drinking water at all times, even in adverse circumstances.
  • Control of measuring devices
    This refers to the procedures used to efficiently manage and supervise the water meters installed on users’ properties to ensure accurate and reliable measurement of water consumption. This implies the proper installation of meters and adequate supervision to prevent leaks as well as fraud or manipulation by users.
  • Control of nonconformities
    The process of effectively manage complaints, claims, and problems reported by users in relation to the supply of drinking water and associated services. The main objective of complaint control is to address customer concerns in a timely manner, resolve problems satisfactorily, and continuously improve the quality of service. Each complaint is recorded in detail in a computer system and assigned a unique tracking number to facilitate follow-up and resolution.
  • Street repair
    The process of repair and maintenance of paved surfaces, such as streets, highways, and sidewalks which have developed potholes due to WOA activities such as the installation of water intakes or maintenance of conduction lines. The objective of patching is to restore the paved surface to a safe and functional state.
In addition, the supporting activities that are considered in the model are as follows:
  • Accounting
    This refers to the systematic process of recording, classifying, analyzing, and summarizing the financial and economic transactions of the WOA to provide managers with accurate and relevant information on the financial situation, performance, and cash flows, which in turn allows for decision-making and assessment of the WOA’s financial health.
  • Accounts payable
    The process of managing and supervising the outstanding financial obligations of the WOA towards its suppliers and creditors. Accounts payable are debts that the WOA must pay to other parties for goods and services received that have not yet been settled.
  • Warehouse Control
    In this process, activities related to the storage, monitoring, and distribution of WOA materials and stocks are managed and supervised. The main objective of control is to ensure the adequate availability of products at the required time and place while minimizing storage costs and maintaining an accurate record of inventory levels.
  • Recruitment
    These are the activities and steps that the WOA follows to identify, recruit, evaluate, select, and incorporate new employees into the work team. In the process, suitable candidates are chosen for vacant roles to ensure that the organization has a competent and committed talent pool.
  • Shopping
    This refers to the set of steps and procedures established by legislation and government regulations to acquire goods, services, and supplies in a transparent, efficient, and legal manner. Because the WOA uses public funds, purchases are made responsibly and in accordance with the principles of competition, equity, and transparency. To this end, a budget is assigned for purchases while ensuring that expenses are within the established limits and that the availability of funds is respected.
  • Payroll
    These are the activities that the WOA performs to calculate, process, and distribute salaries and benefits to its employees. This process ensures that employees are properly compensated for their work in an accurate and timely manner. The relevant activities in the process are the registration of attendance and hours worked, calculation of salaries, calculation of deductions and withholdings, calculation of taxes, and printing of payment receipts.
  • Budget
    This is the process of planning, assigning, monitoring, and evaluating the financial resources used to carry out the activities programmed by the WOA. This process seeks to guarantee the efficient and transparent use of public funds while complying with the objectives and priorities established by the WOA. The budget is approved by the Governing Board of the WOA to guarantee supervision and control over the use of public funds. In addition, regular monitoring of income and expenses is carried out in order to ensure that they are aligned with the budget, which is approved through internal or external audits that evaluate efficiency, effectiveness, and transparency in the use of public funds.
  • Vehicle Control
    These are the measures, policies, and procedures implemented to regulate and supervise the circulation and use of vehicles of an WOA. Because these are public resources, they must be used in a rational and transparent manner. The vehicles are registered, and aspects such as the payment of tenures, use of fuel, insurance, logging of infractions, and both preventive and corrective maintenance are controlled.
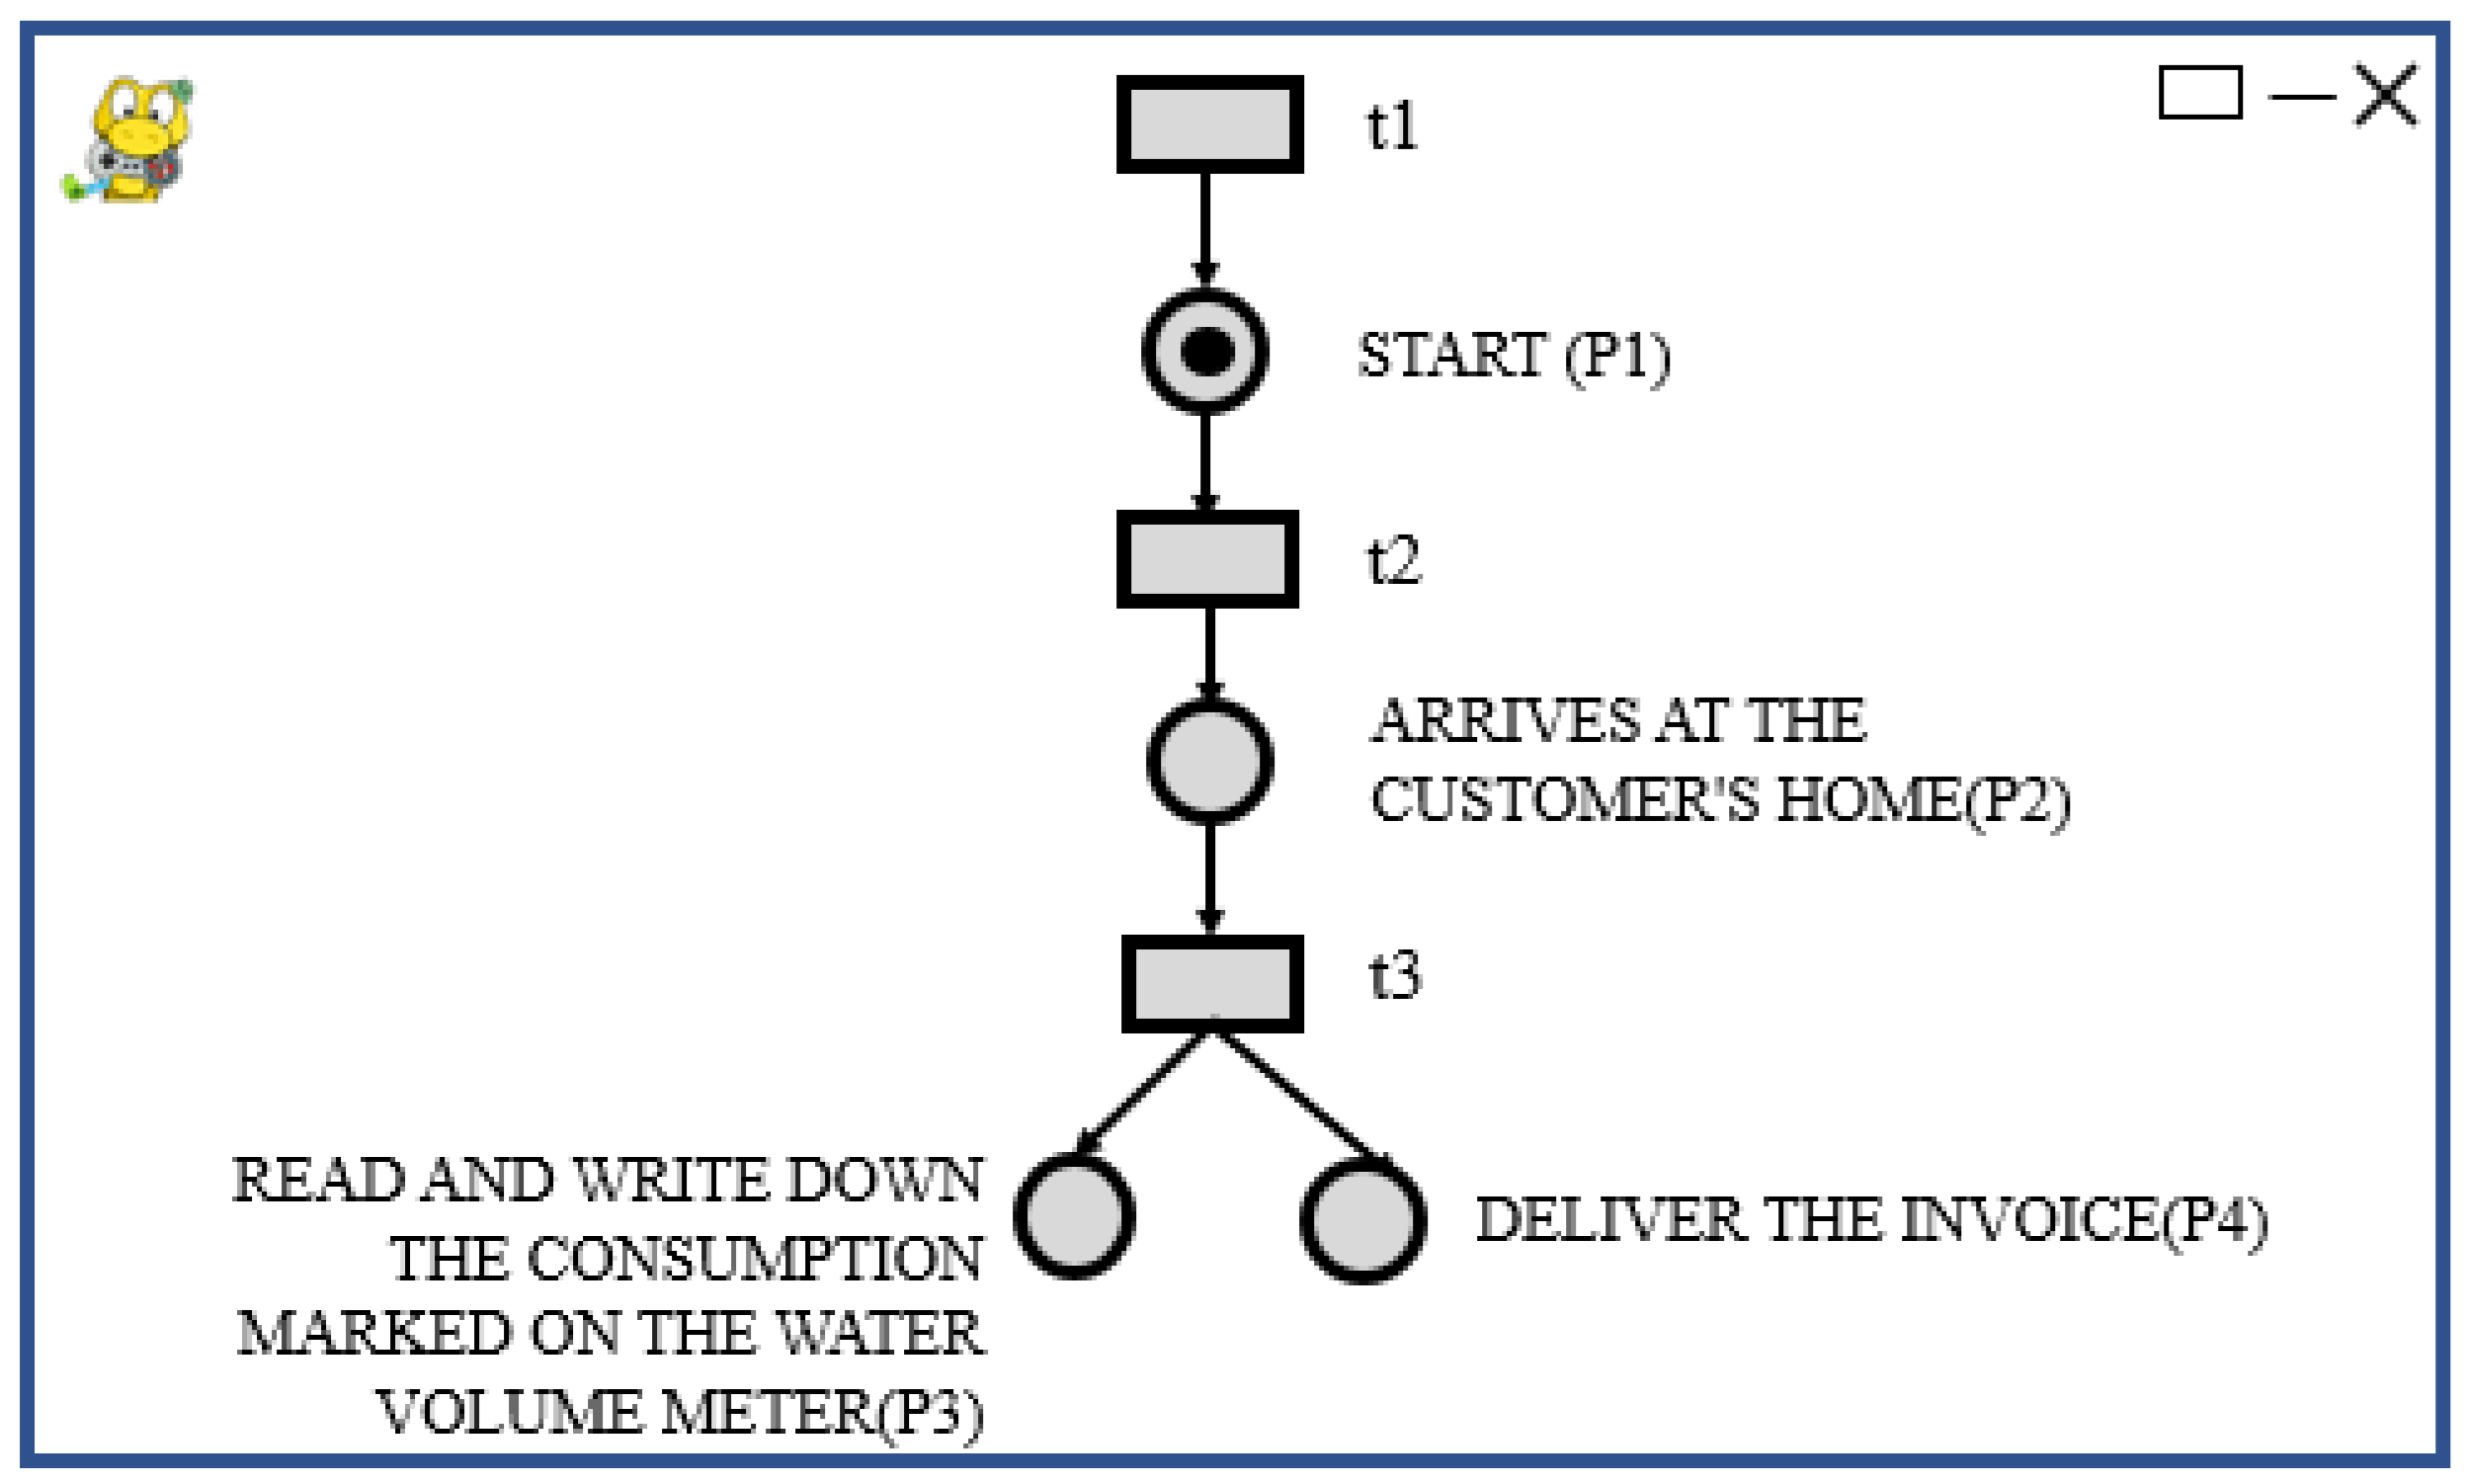
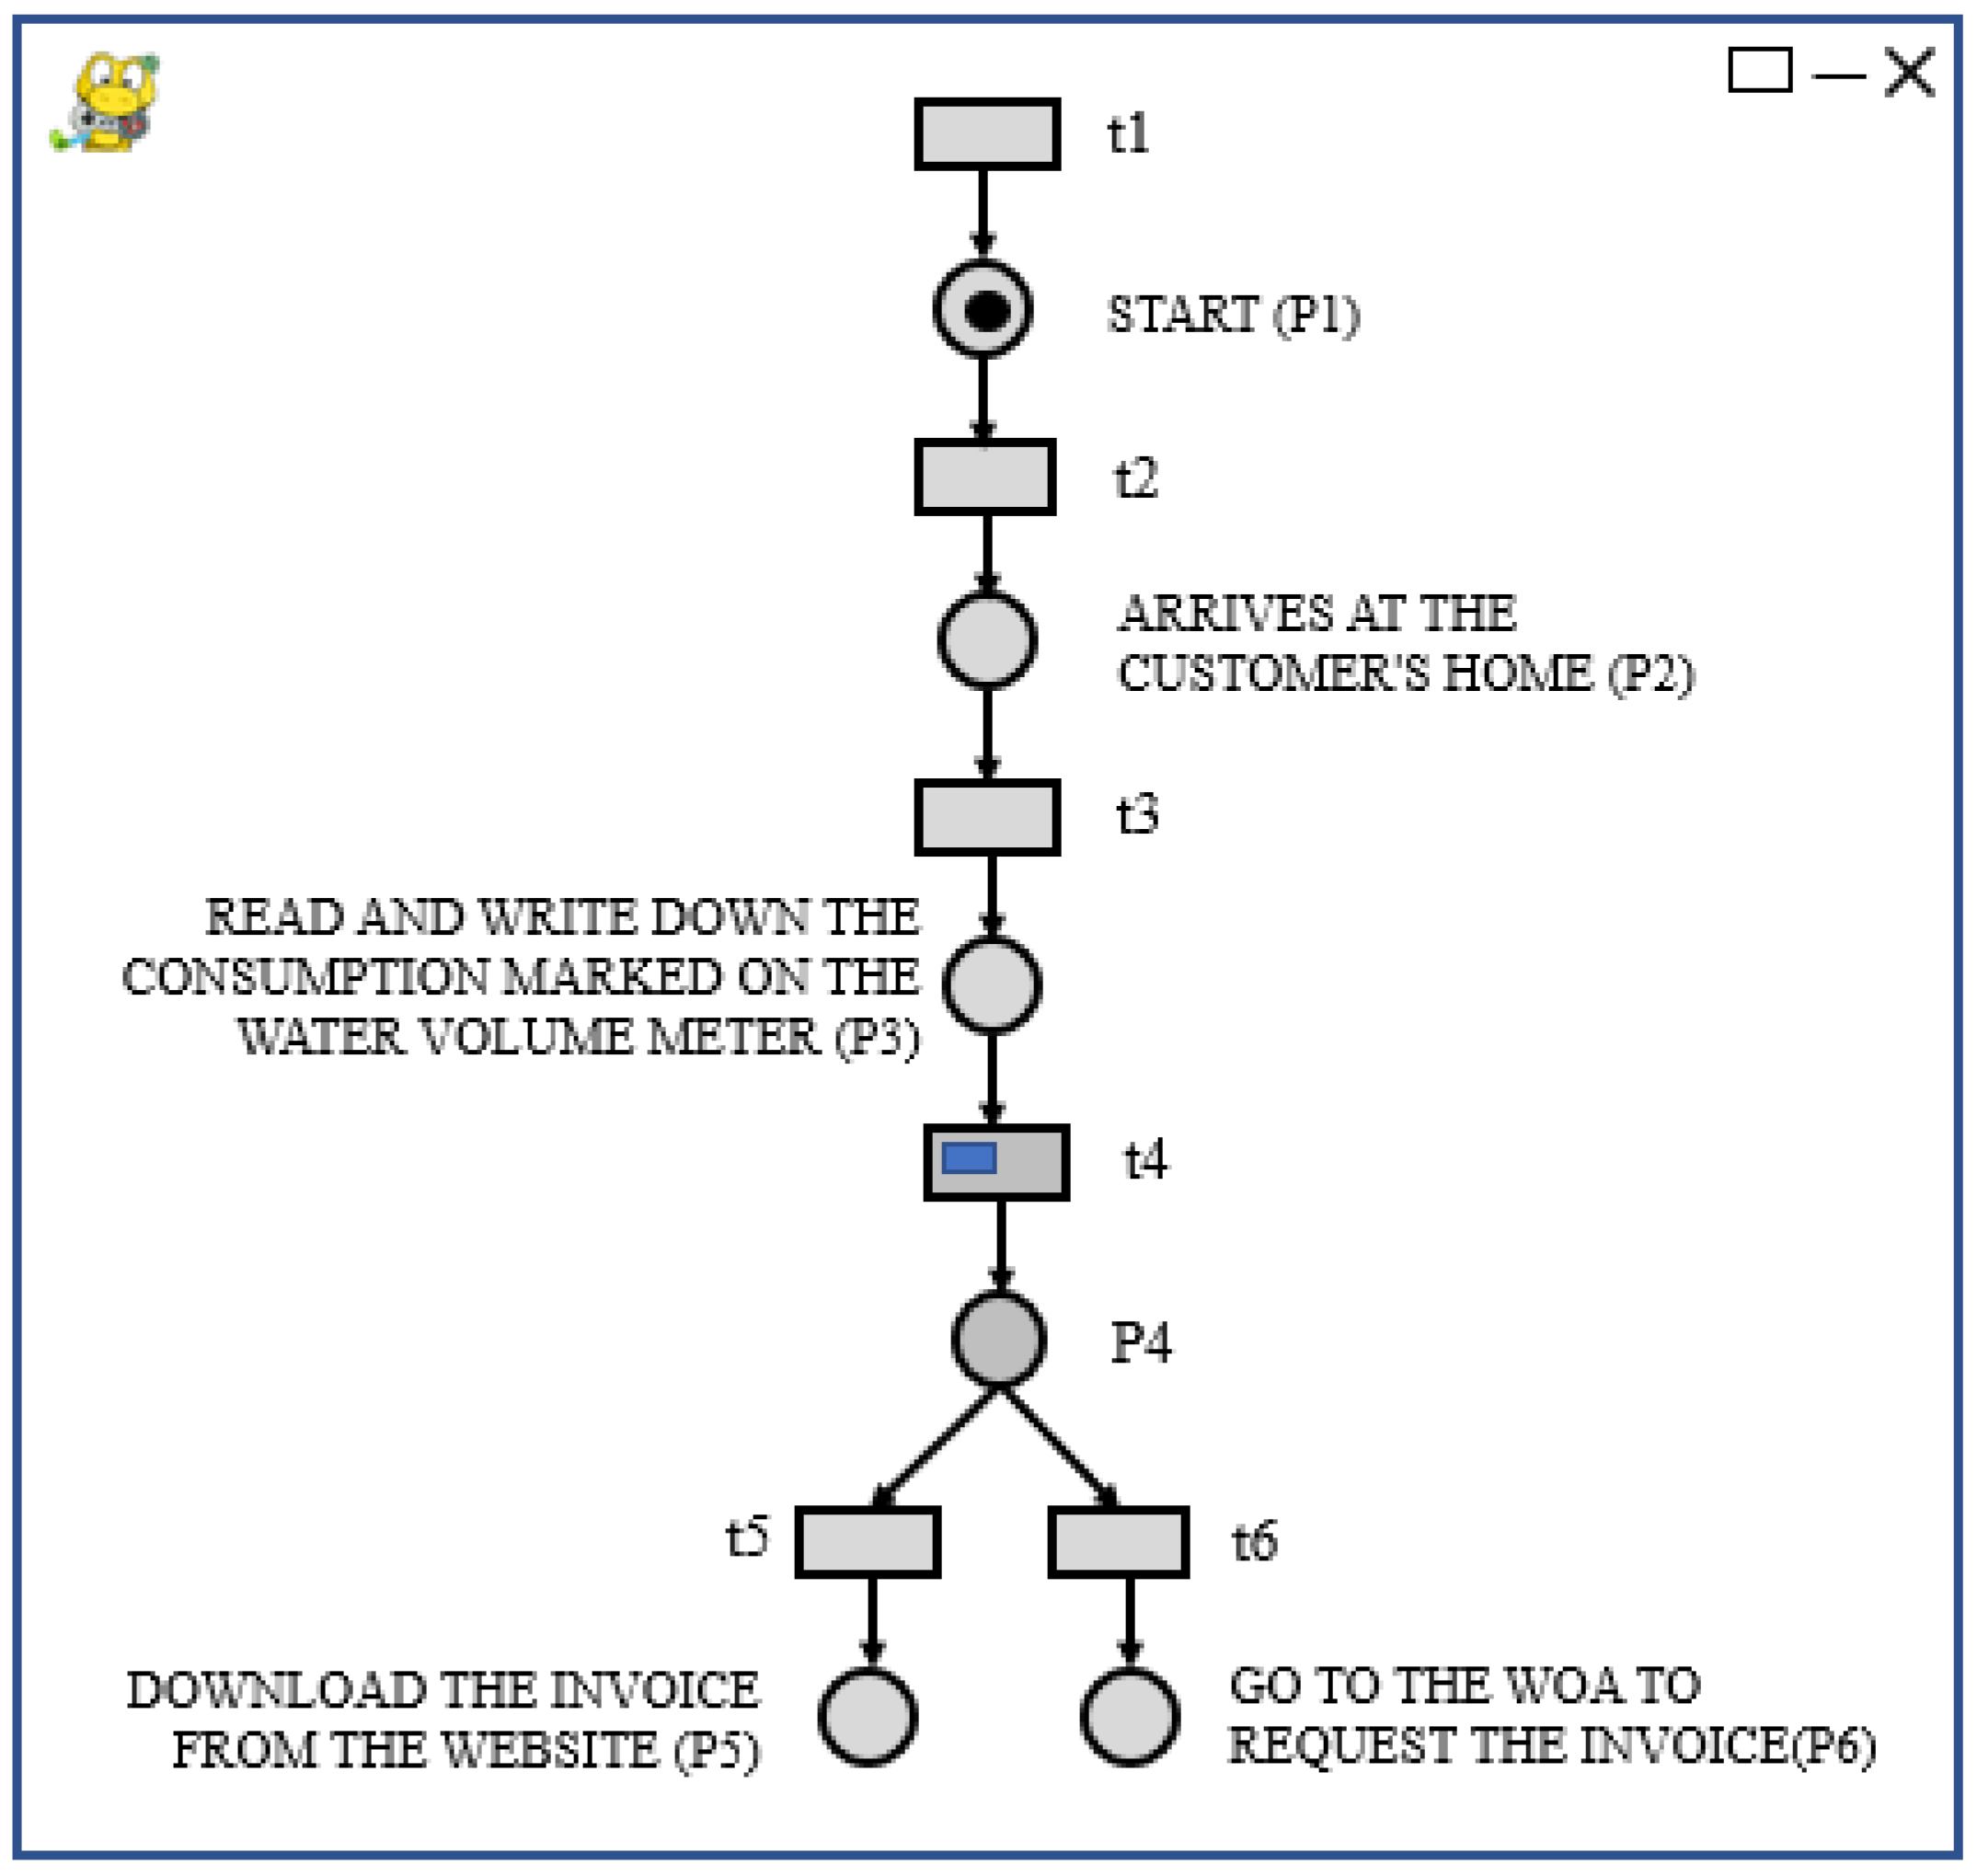
For our case study, we selected the receipt delivery process, which includes the following three activities: first, the meter reader travels to the user’s home (arrives at the customer home); second, they read and take note of the meter reading (read and write down the consumption marked on the water volume meter); third, they deliver the invoice at the same time. For the purposes of simulating this process, the real times of each activity were recorded. Table 2, Table 3 and Table 4 show the records (126 per activity).

7. Algorithm to Create PNs from Writing a BP

A business process is a series of activities that are combined to achieve the goals of an organization. The measurement of the performance of the process is related to the critical success factor selected for such measurement. Factors may be tangible, such as execution time, profits, savings (money), and productivity ,or intangible, such as customer satisfaction and better decision-making. The objective of this research is to create an algorithm to generate Petri nets based on the written description of the business processes of a WOA, with the ultimate aim of analyzing and improving them. The algorithm operates as follows:
  • Read the activities related to BPs.
  • For each activity, create a new single structure with place p i P and t T // Sequence
  • If p i has an activity p j before it, then create an arc connection from p j to t p i . // Selection
  • If p i belongs to a selection structure, create an arc connection from place p j that represents the decision phase to t p i . // Distribution
  • If p i denotes an activity that must be executed in parallel with activity p j , then t x p i is removed and t y p j is also connected to p i . // Disjunction
  • If p i is already connected with a previous activity p j and can also be executed after activity denoted by p k , a new transition t is created and the connections from p k to t and from t to p i are established. // Conjunction
  • If the execution of p i depends on two activities denoted by p j and p k , create connections from p j and p k to t p i .
With the PN model generated, the simulation phase begins, which involves emulating the execution time of each activity and selecting the probability distribution that best represents their behavior. The simulation results provide a mathematical representation of the process, including the incidence matrix, trigger vector, and time vector. The time vector is particularly useful for identifying the duration of each activity in different scenarios and determining the optimal option for the studied business process.

7.1. Operation Verification

To verify the operation of the algorithm, a program was developed using the Python programming language. The program consists of several elements and performs various operations, which are described below.
Database. The database for the program is composed of the following entities:
  • C A T _ R P N : the business processes catalog (Table 5).
  • T R N _ R S T : the register of the simulation of process times (Table 6).
The initial screen of the interface is shown in Figure 12.
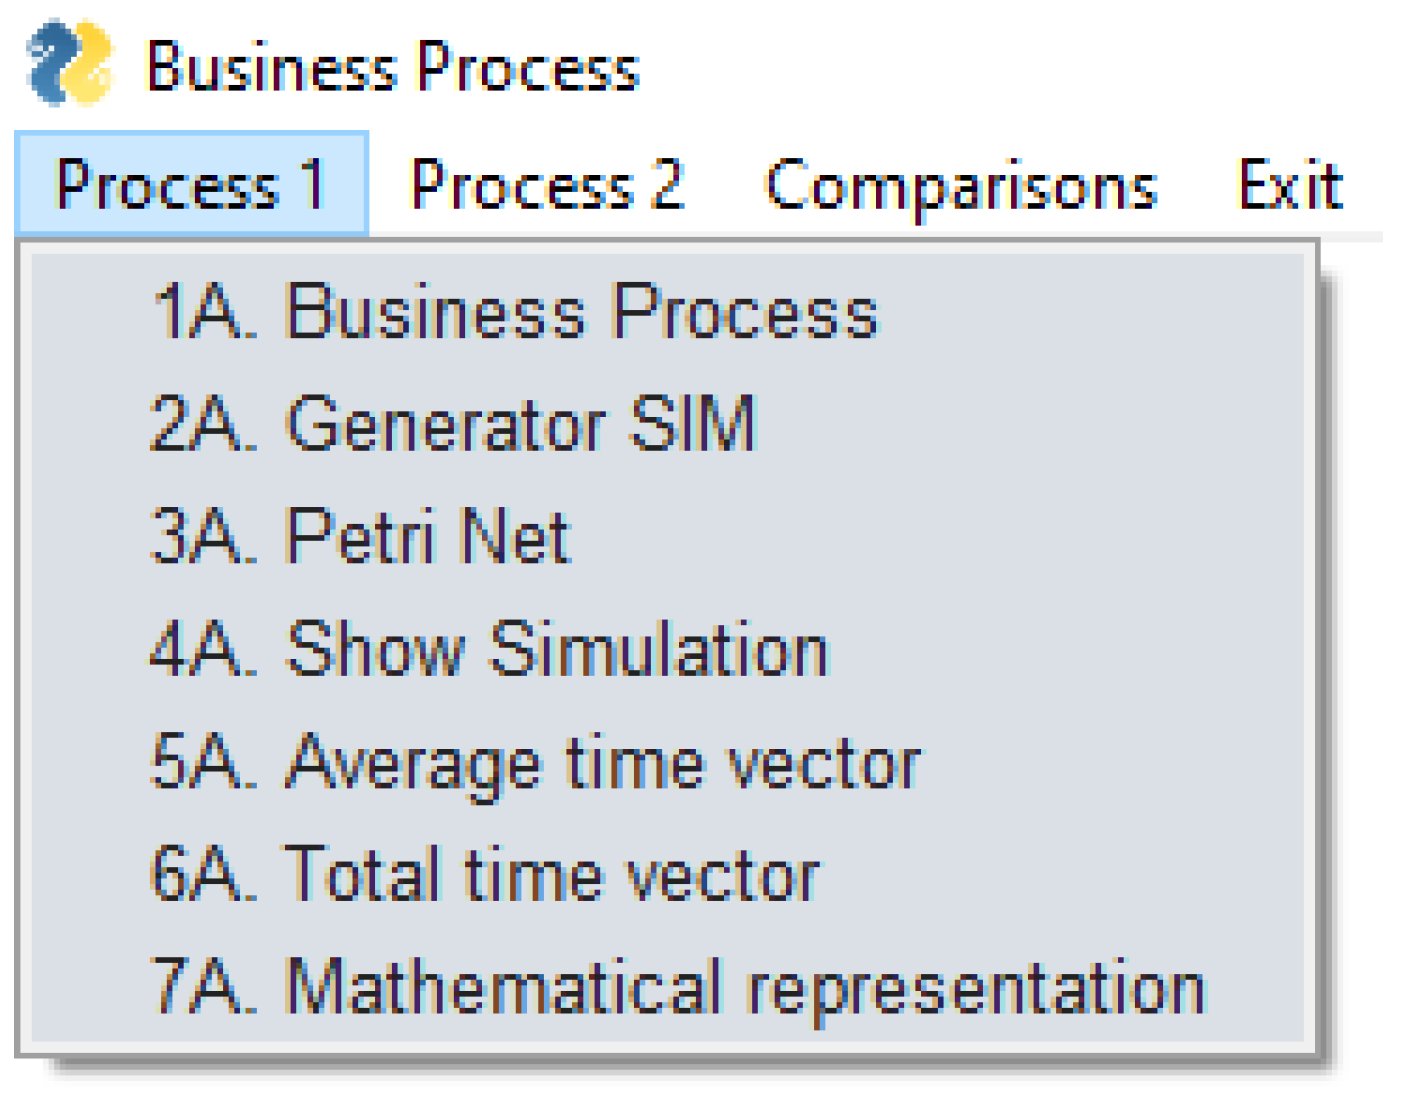
Figure 13 shows the main menu of the system. It provides different options to perform the BP analysis, which are described below.

7.2. Sequence of Operation

  • Op.1A. Business process. Registration in C A T _ R P N of the activities involved in the business process, indicating in each of these whether it will be connected to the next registered activity by either conjunction or disjunction (Figure 14).
  • Op.3A. Petri net. Reading all the records of the C A T _ R P N table (Figure 15) determines which of the basic PN structures will be presented (selection of activity to be executed, execution of activities in parallel, execution of an activity that precedes two or more processes, or synchronization of parallel activities). Figure 16 shows the PN formed by its different places, transitions, and arcs. By clicking on the image, the user can see the token game animation.
  • Op.2A. Simulation of the process. In the interface shown in Figure 17, the type of probability distribution is selected to generate the time used per activity (for this case, we use the NORMAL probability distribution), in addition to indicating the amount of random numbers to be generated. The cost field is not used here, as it is not a variable considered in this case study. The simulation information is recorded in T R N _ R S T , which is used to generate the mathematical representation of the PN by adding and averaging the execution times of each of the activities involved in the process. Figure 18 shows a fragment of the generated data; the “type-distribution” field contains the data N, corresponding to a normal distribution.
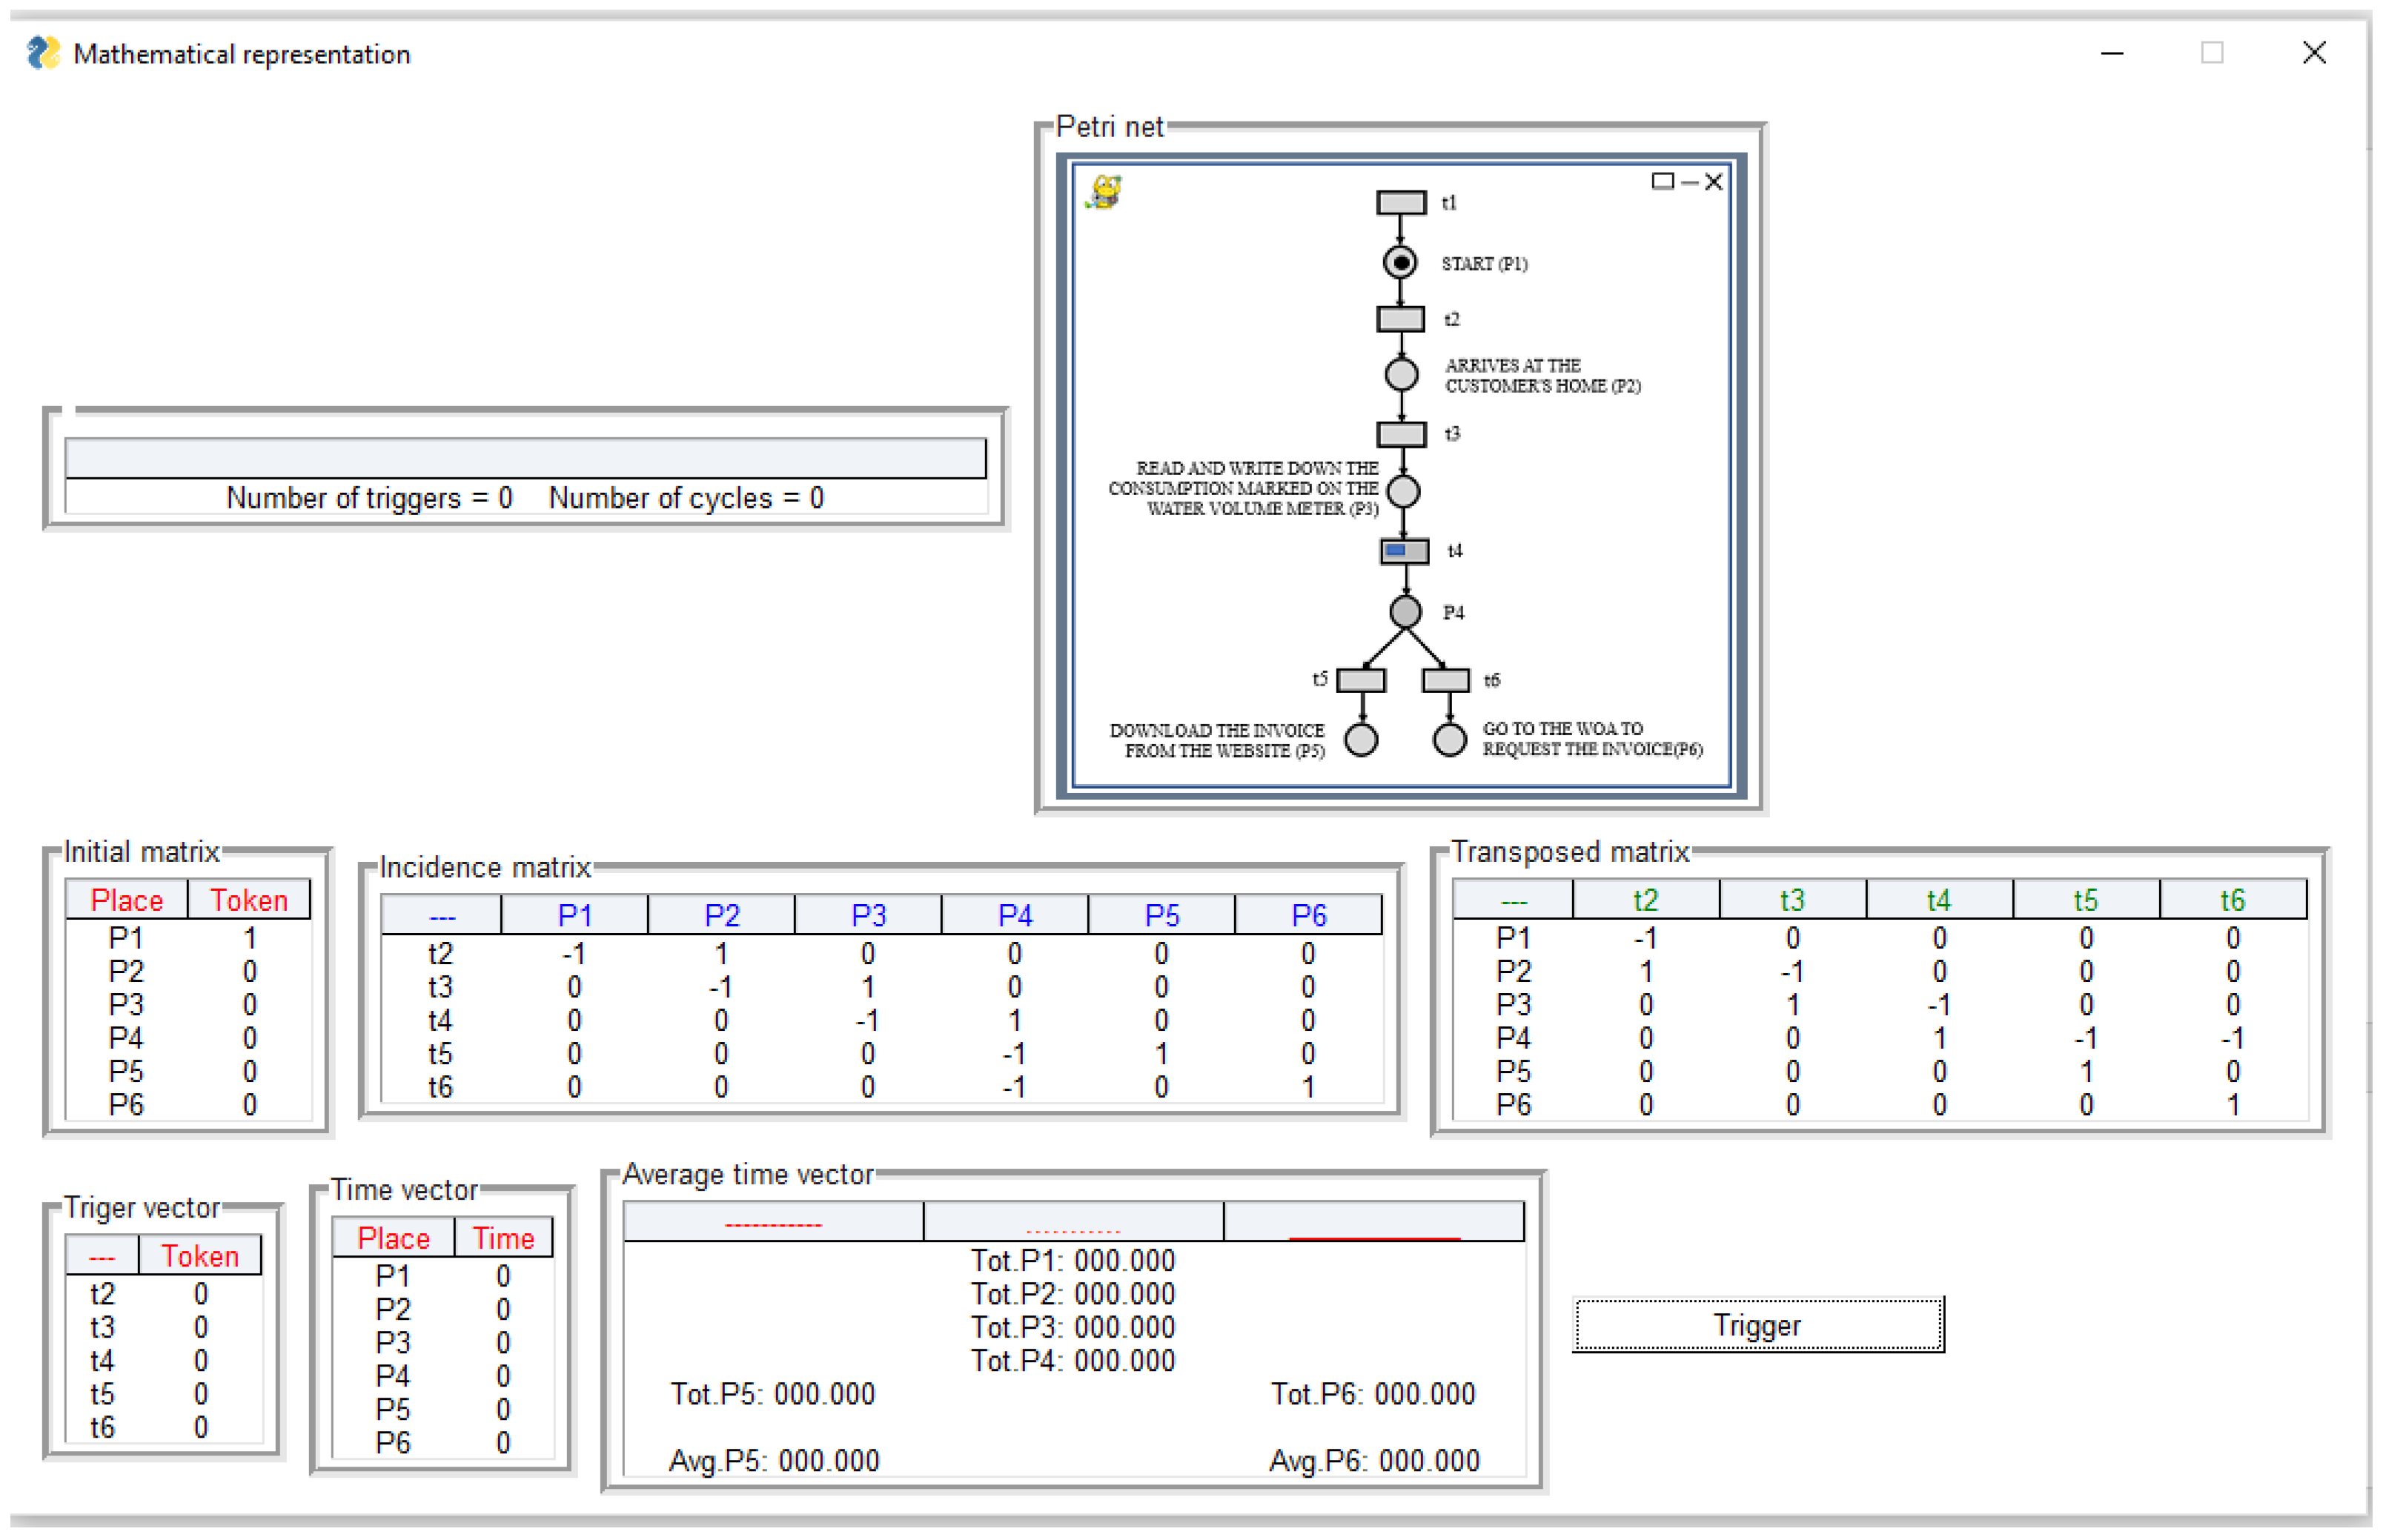
  • Op.7A. Mathematical Representation. When clicking on this option, the Initial and Incidence matrices, Trigger Vector, Type Vector, and Average Time Vector are displayed on the screen. Pressing the fire button shows the PN with the movement of the token, the values of the times in that state of the process, and the generated average (see Figure 19).
    The algorithm measures the performance of the BPs by calculating the total time used in each activity, which represents the overall time of the process. This information is valuable for making informed decisions regarding process optimization and improvement.
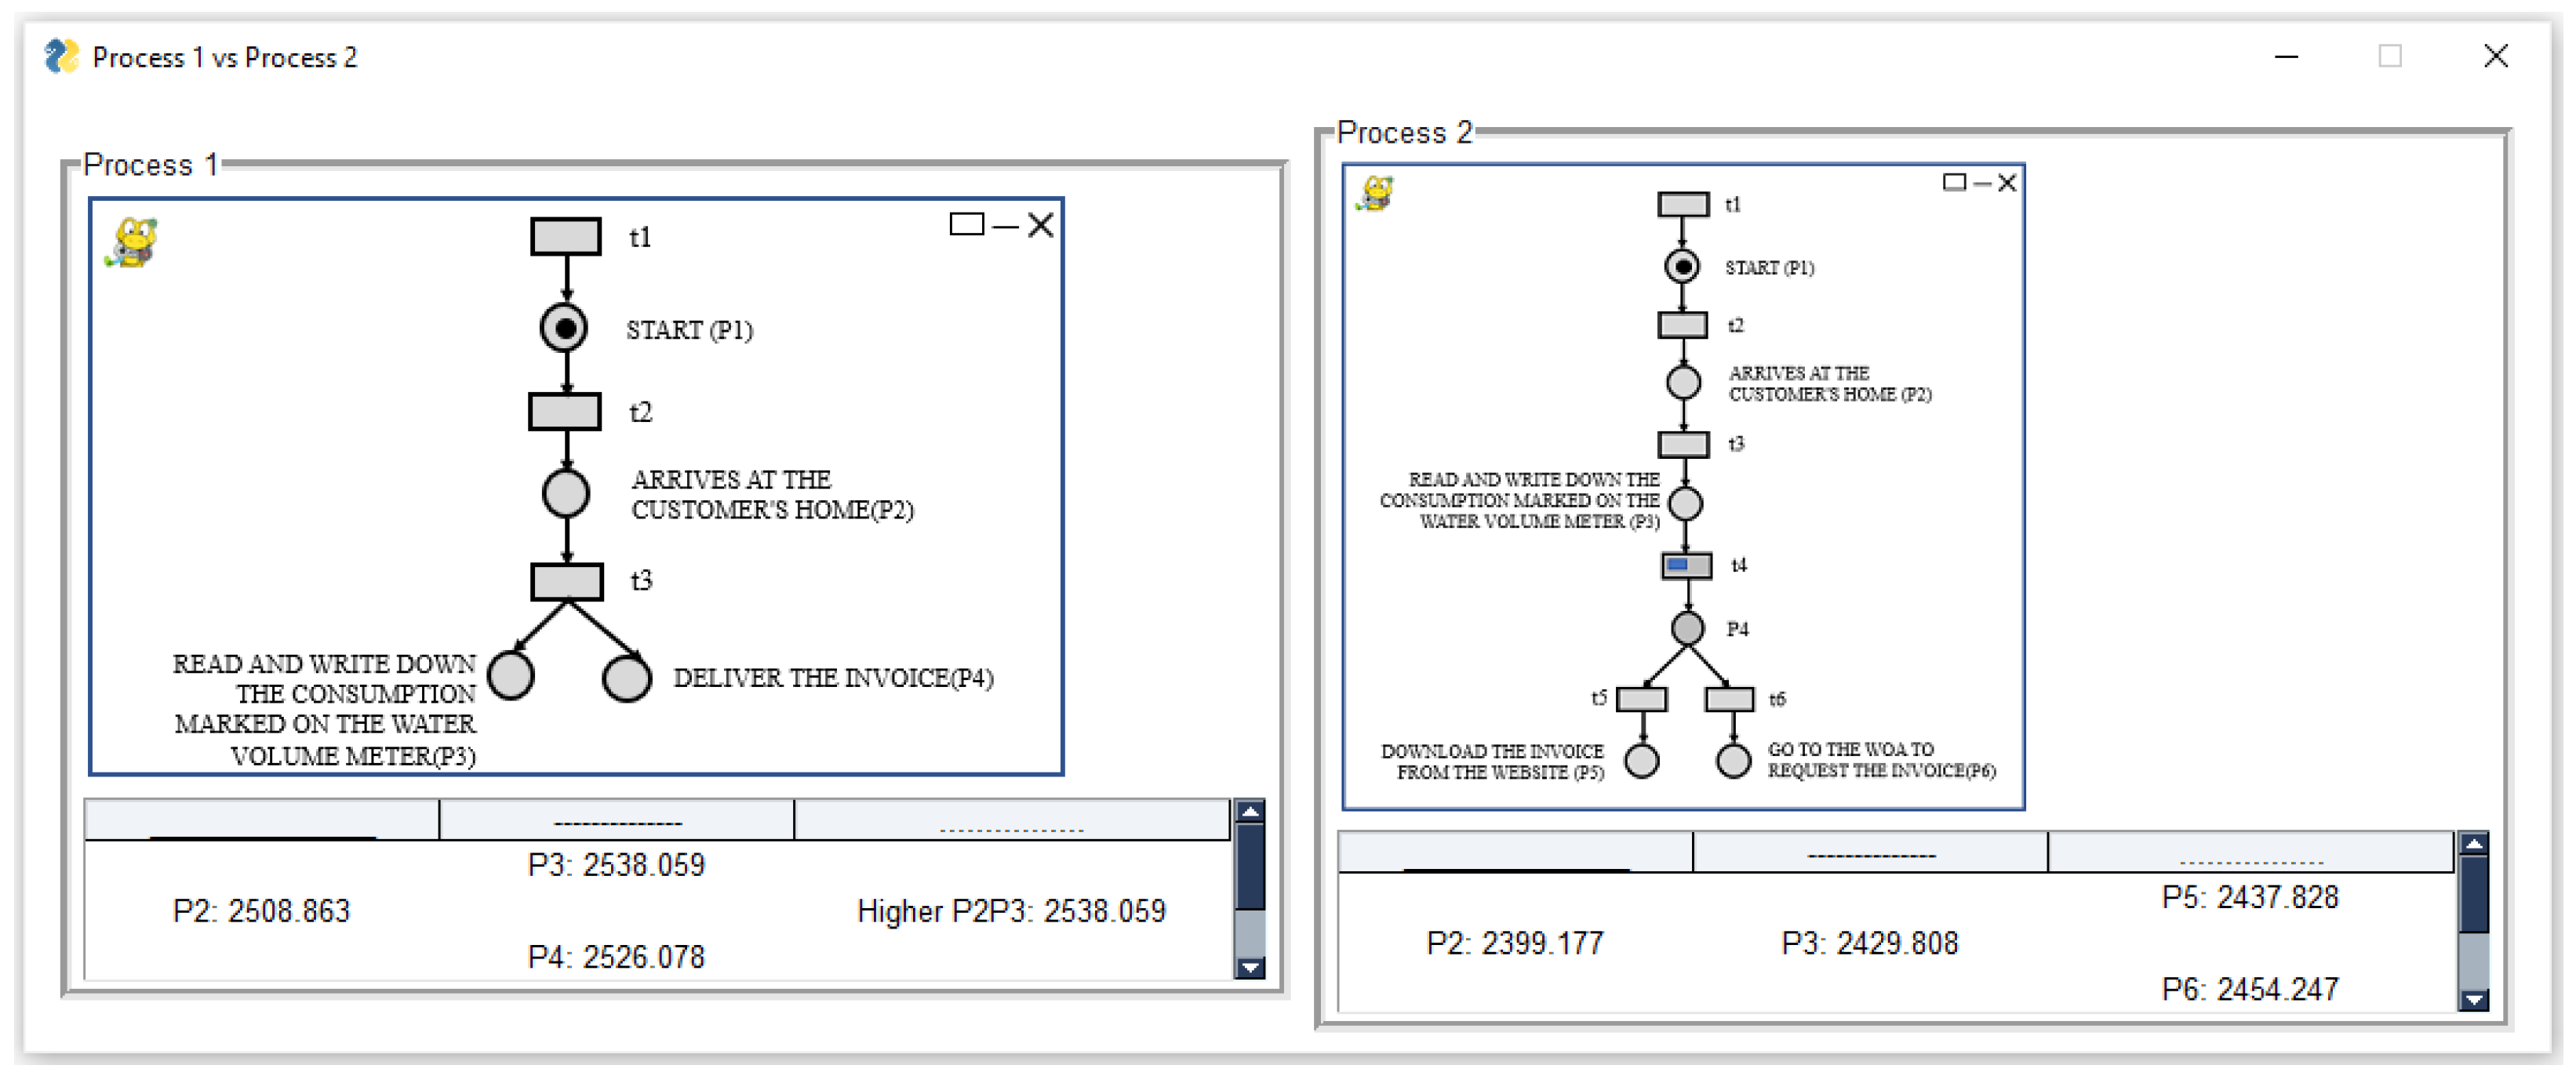
  • Comparison of processes. The PN is derived from the process description, allowing for multiple iterations and modifications of the same process. By measuring the performance of each proposed process, it becomes possible to select the most optimal one and make necessary adjustments within the organization. Figure 20 displays a different PN for a business process that is distinct from the one depicted in Figure 16 while having essentially the same objective. The difference lies in the approach taken for delivering the invoice to the client; the first approach involves a courier, while the second approach allows the client to download the invoice from the website or request it at the WOA. Figure 21 presents the mathematical representation of the second process.
    Comparison of Process 1 vs. Process 2. Figure 22 displays the matrices of the average times for Process 1 and Process 2. According to the simulated times, it can be seen that Process 2 in place 5 is more efficient.

8. Conclusions

This research work has presented several key contributions in the field of BP modeling using PNs. The following results were achieved:
  • Development of a BP modeling algorithm. The algorithm utilizes PNs to schematize and represent business processes, providing a structured approach for modeling and analyzing the flow of activities within an organization.
  • Description of basic structures of Petri nets. This study introduces the concept of basic structures, which can help in defining the arrangement of places, transitions, and arcs in a Petri net representation of business processes. These structures facilitate the understanding and analysis of process flows.
  • Software platform development. A software platform was created to demonstrate the functionality of the algorithm. The platform allows users to register the activities of a business process, visualize the Petri net graph, simulate the movement of tokens, and analyze the behavior of the process through mathematical representations derived from simulation data.
  • Compared to ProM and Disco, the application proposed in this document has a flatter learning curve, as the concepts handled are reduced to the following:
    (a)
    Record the time of a sample that occupies the activities related to a process (1) in any database or spreadsheet with an objective X and determine its probability distribution (Appendix A). Simulate process (1) in the proposed application.
    (b)
    Record the time of a sample that occupies the activities related to a process (2) in any database or spreadsheet with the same objective X and determine its probability distribution (Appendix A). Simulate process (2) in the proposed application.
    (c)
    After the respective simulations have been executed, compare the times of the simulations for processes (1) and (2) in order to determine which is better.
    (d)
    Notably, it is not necessary to capture the times of the activities or import them into the application’s database. The only activity necessary is to indicate the type of probability distribution and its necessary parameters.
  • Performance measurement and comparison. The simulation capabilities of the software platform enable the measurement of performance for different business processes. By analyzing factors such as execution time and selecting the appropriate probability distribution, the platform provides insights into process efficiency and effectiveness. Furthermore, the mathematical representations of business processes allows for direct comparison and identification of better- and worse-performing processes.
  • Comparison study. A comparison is provided between the Petri nets-based approach to modeling business processes and the generalized nets-based approach.
The use of PNs in business process modeling contributes to objective and mathematical analysis, thereby reducing subjectivity. The practical impact of this research work lies in its ability to support organizations in improving their processes by enhancing efficiency, effectiveness, flexibility, cost reduction, quality improvement, and execution times.

Author Contributions

Conceptualization, S.M.-G. and J.M.-M.; methodology, S.M.-G., J.M.-M., O.M.-A., M.G.-H. and E.S.H.-G.; software, S.M.-G.; investigation, S.M.-G. and J.M.-M.; writing-original draft preparation, S.M.-G.; writing—review and editing, J.M.-M., O.M.-A., M.G.-H. and E.S.H.-G.; project administration, J.M.-M.; funding acquisition, J.M.-M. All authors have read and agreed to the published version of the manuscript.

Funding

This study was supported by the Autonomous University of Hidalgo (UAEH) and the National Council for Humanities, Sciences and Technologies (CONAHCYT) with project number CB-2017-2018-A1-S-43008. Samuel Medina-Garcia was supported by CONAHCYT grant number 1008908.

Institutional Review Board Statement

Not applicable.

Informed Consent Statement

Not applicable.

Data Availability Statement

The data presented in this study are available in this paper.

Conflicts of Interest

The authors declare that they have no known competing financial interest or personal relationships that could have appeared to influence the work reported in this paper.

Appendix A. Probability Distributions

Probability distributions definition.
-Describes how the results are expected to vary. Because these distributions are based on the expectation of something happening, they turn out to be useful models for making inferences and making decisions under conditions of uncertainty.
-A mathematical function that describes how the possible values of a random variable are distributed over a set of possible outcomes; in other words, it shows the probabilities associated with different values that a random variable can take on in a given experiment or phenomenon [39].
Types of probability distributions [39].
Several different types of probability distributions are mentioned below.
Normal Distribution (Gaussian). Known as the Gaussian bell, it is widely used due to the central limit theorem. This distribution is used to model data that are continuous and symmetric about the mean.
For a sample of random numbers to follow a normal distribution, it must have the following characteristics:
  • Symmetry: in a normal distribution, the probability density curve is symmetric about its mean. This means that the values above the mean are equally symmetric to the values below the mean.
  • Mean, median, and mode coincide: in a normal distribution, the mean, median, and mode are equal and lie at the center of the distribution. This contributes to the symmetry of the distribution.
  • Bell shape: the shape of a normal distribution resembles a smooth and continuous bell.
Uniform Distribution. This distribution is used to model equally likely events in a continuous range; all values within the range have the same probability of occurring.
For a sample of random numbers to follow a uniform distribution, it must have the following characteristics:
  • Equal probability: all values in the range have the same probability of occurring. This means that there is no bias towards any specific value.
  • Defined range: the uniform distribution is defined in a specific range. All possible values within this range have the same probability.
  • Mean value rule: in a uniform distribution, the mean (average) value of the distribution is equal to the sum of the endpoints of the interval divided by 2, that is, if a and b are the endpoints of the interval, then the mean value is (a + b)/2.
  • Linear transformations: when taking a random variable that follows a uniform distribution and applying a linear transformation (for example, multiplication or addition), the result is a uniform distribution in the new range.
Triangular Distribution. This distribution models random variables with values that are restricted to a specified interval, and is approximately triangular in shape. This distribution is narrowly skewed in situations where there is a lack of data.
For a sample of random numbers to follow a triangular distribution, it must have the following characteristics:
  • Triangular shape: the triangular distribution is characterized by having a triangular shape in its probability density graph, meaning that the probability density is at its maximum at a point within an interval and decreases linearly towards the ends of the interval.
  • Defined minimum, maximum, and mode value: in a triangular distribution, three main parameters must be defined: the minimum value (a), the maximum value (b), and the mode (c). These parameters determine the shape and range of the distribution.
  • Optional symmetry: a triangular distribution can be symmetric or asymmetric depending on the location of mode (c) in relation to the interval (min, max). If c is in the center of the interval, the distribution is symmetric, while if c is closer to one of the extremes, the distribution is skewed.
Gamma Distribution. This is a generalization of the exponential distribution, and is used to model more general wait times.
For a sample of random numbers to follow a gamma distribution, it must have the following characteristics:
  • Form of the gamma distribution: the gamma distribution is a continuous probability distribution that is generally used to model the time between events in Poisson processes or to describe wait times. It has a shape that can be asymmetric and that varies depending on the parameters of the distribution.
  • Parameters of the gamma distribution: the gamma distribution is defined by two parameters, namely, the shape parameter ( κ ) and the scale parameter ( θ ). These parameters control the shape and scale of the distribution. The shape parameter determines the shape of the curve (higher values of κ produce a more skewed distribution to the right), while the scale parameter adjusts the scale of the values.
  • Definite probability density function: the probability density function (PDF) of the gamma distribution is defined as a function of the parameters κ and θ , and is a mathematical function that describes the probability that a random variable takes a value in a specified interval.
  • Positive values: the gamma distribution is defined only for positive values. This is due to the nature of the application, as it is typically used to model event times or rates.
  • Independence: the values in a sample that follow a gamma distribution are independent of each other. This means that the occurrence of one value does not affect the occurrence of other values.
  • Applications in waiting processes: the gamma distribution is useful for modeling the time between events in situations where events occur in a Poisson process, such as time between phone calls, queue arrivals, or equipment failures, among others.
Exponential Distribution. This distribution models the time between events in a Poisson process, such as the time between failures in a system.
For a sample of random numbers to follow an exponential distribution, it must have the following characteristics:
  • Waiting process model: the exponential distribution is commonly used to model the time between events in a Poisson process. Therefore, it is especially applicable for modeling events that occur independently at a constant rate.
  • Exponential decay: the probability density function (PDF) of the exponential distribution has an exponential decay form. This means that the probability of an event occurring in a given interval decreases exponentially as time passes.
  • Rate parameter: the exponential distribution is defined by a single parameter, often denoted as λ (lambda), which represents the average rate of occurrence of events. Its inverse value is known as the scale parameter ( β = 1 / λ ).
  • Positive values: as with other time-related distributions, the exponential distribution is defined only for positive values, as it is designed to model wait times between events.
  • Independence: the times between events in an exponential distribution are independent. The occurrence of one event does not affect the occurrence of future events.
  • Lack of memory: lack of memory means that the probability of an event occurring in a future interval does not depend on how much time has elapsed since the last event. In other words, the exponential distribution has no “memory” of past events.

References

  1. Dumas, M.; Fournier, F.; Limonad, L.; Marrella, A.; Montali, M.; Rehse, J.R.; Accorsi, R.; Calvanese, D.; De Giacomo, G.; Fahland, D.; et al. Augmented business process management systems: A research manifesto. arXiv 2022, arXiv:2201.12855. [Google Scholar]
  2. Kartono, A.; Soediantono, D. Application Suggestion of ISO 9001: 2015 Quality Management System in the Defense Industry: A Literature Review. Int. J. Soc. Manag. Stud. 2022, 3, 27–38. [Google Scholar]
  3. Rahman, A.; Ratnawati, Y. Justifying enterprise resource planning (ERP) investment: A case study using technology, organization, and environment (TOE) framework. J. Contemp. Account. 2021, 3, 130–138. [Google Scholar] [CrossRef]
  4. Vergidis, K.; Tiwari, A.; Majeed, B. Business process analysis and optimization: Beyond reengineering. IEEE Trans. Syst. Man Cybern. Part C (Appl. Rev.) 2007, 38, 69–82. [Google Scholar] [CrossRef]
  5. van der Aalst, W.M. Business process management as the “Killer App” for Petri nets. Softw. Syst. Model. 2015, 14, 685–691. [Google Scholar] [CrossRef]
  6. van Hee, K.M.; Sidorova, N.; van der Werf, J.M. Business process modeling using petri nets. In Transactions on Petri Nets and Other Models of Concurrency VII; Springer: Berlin/Heidelberg, Germany, 2013; pp. 116–161. [Google Scholar]
  7. Reijers, H.A. Business Process Management: The evolution of a discipline. Comput. Ind. 2021, 126, 103404. [Google Scholar] [CrossRef]
  8. van der Aalst, W.M.; Carmona, J. Process Mining Handbook; Springer Nature: Berlin/Heidelberg, Germany, 2022. [Google Scholar]
  9. Beerepoot, I.; Di Ciccio, C.; Reijers, H.A.; Rinderle-Ma, S.; Bandara, W.; Burattin, A.; Calvanese, D.; Chen, T.; Cohen, I.; Depaire, B.; et al. The biggest business process management problems to solve before we die. Comput. Ind. 2023, 146, 103837. [Google Scholar] [CrossRef]
  10. Atanassov, K.; Andonov, V. Generalized nets and intuitionistic fuzzy pairs as tools for modelling of flexible manufacturing systems. Notes Intuition. Fuzzy Sets 2020, 26, 40–69. [Google Scholar] [CrossRef]
  11. Kindler, E.; Rubin, V.; Schäfer, W. Process Mining and Petri Net Synthesis. In Proceedings of the Business Process Management Workshops, Vienna, Austria, 4–7 September 2006; Eder, J., Dustdar, S., Eds.; Springer: Berlin/Heidelberg, Germany, 2006; pp. 105–116. [Google Scholar]
  12. Reitsma, E.; Hilletofth, P.; Johansson, E. Supply chain design during product development: A systematic literature review. Prod. Plan. Control 2021, 34, 1–18. [Google Scholar] [CrossRef]
  13. García, L.A.M. Gestión Logística Integral-2da Edición: Las Mejores Prácticas en la Cadena de Abastecimiento; Ecoe Ediciones: Bogotá, Colombia, 2016. [Google Scholar]
  14. Hamilton, S. Maximizing Your ERP System: A Practical Guide for Managers; McGraw Hill Professional: New York, NY, USA, 2003. [Google Scholar]
  15. Al Jafa, H. Improving ERP software selection process by integrating QFD with AHP approach. Netw. Intell. Stud. 2020, 8, 157–167. [Google Scholar]
  16. Heredia, D.A.V.; Ceballos, F.; Sanchez-Torres, G. Simulation-Based Improvement Procedure for Small-Scale Shoe Manufacturing Companies. J. Adv. Manuf. Syst. 2018, 17, 23–33. [Google Scholar] [CrossRef]
  17. Zamora, E.A. Value chain analysis: A brief review. Asian J. Innov. Policy 2016, 5, 116–128. [Google Scholar] [CrossRef]
  18. Jyotish, N.K.; Singh, L.K.; Kumar, C. A state-of-the-art review on performance measurement petri net models for safety critical systems of NPP. Ann. Nucl. Energy 2022, 165, 108635. [Google Scholar] [CrossRef]
  19. México, G. Portal Interactivo de Gestión del Agua. 2021. Available online: https://agua.org.mx/ (accessed on 11 May 2023).
  20. Sivaraman, E.; Kamath, M. On the use of Petri nets for business process modeling. In Proceedings of the IIE Annual Conference; 2002; p. 1. Available online: https://citeseerx.ist.psu.edu/doc/10.1.1.19.2334 (accessed on 11 May 2023).
  21. Deesukying, J.; Vatanawood, W. Generating of business rules for Coloured Petri Nets. In Proceedings of the 2016 IEEE/ACIS 15th International Conference on Computer and Information Science (ICIS), Okayama, Japan, 26–29 June 2016; pp. 1–6. [Google Scholar]
  22. Sintoris, K.; Vergidis, K. Extracting business process models using natural language processing (NLP) techniques. In Proceedings of the 2017 IEEE 19th Conference on Business Informatics (CBI), Thessaloniki, Greece, 24–27 July 2017; Volume 1, pp. 135–139. [Google Scholar]
  23. ElMadany, H.; Alfonse, M.; Aref, M. Forecasting in Enterprise Resource Planning (ERP) Systems: A Survey. In Digital Transformation Technology; Springer: Singapore, 2022; pp. 395–406. [Google Scholar]
  24. Qin, J.; Zhao, N.; Xie, Z.; Mo, Q. Business Process Analysis Method Based on Petri Nets. In Proceedings of the 2017 4th International Conference on Information Science and Control Engineering (ICISCE), Changsha, China, 21–23 July 2017; pp. 218–223. [Google Scholar]
  25. Yao, Q.; Zhang, J.; Wang, H. Business process-oriented software architecture for supporting business process change. In Proceedings of the 2008 International Symposium on Electronic Commerce and Security, Guangzhou, China, 3–5 August 2008; pp. 690–694. [Google Scholar]
  26. Rosa, M.L.; Aalst, W.M.V.D.; Dumas, M.; Milani, F.P. Business process variability modeling: A survey. ACM Comput. Surv. (CSUR) 2017, 50, 1–45. [Google Scholar] [CrossRef]
  27. ZareRavasan, A.; Jeyaraj, A. Evolution of Information Systems Business Value Research: Topic Modeling Analysis. J. Comput. Inf. Syst. 2022, 63, 555–573. [Google Scholar] [CrossRef]
  28. Ouardani, A.; Esteban, P.; Paludetto, M.; Pascal, J.C. A Meta-modeling Approach for Sequence Diagrams to Petri Nets Transformation within the requirements validation process. In Proceedings of the European Simulation and Modeling Conference, Toulouse, France, 23–25 October 2006; pp. 345–349. [Google Scholar]
  29. Verbeek, H.; Buijs, J.; Van Dongen, B.; van der Aalst, W.M. Prom 6: The process mining toolkit. Proc. BPM Demonstr. Track 2010, 615, 34–39. [Google Scholar]
  30. Kalenkova, A.A.; De Leoni, M.; Van Der Aalst, W.M. Discovering, analyzing and enhancing BPMN models using ProM. In Proceedings of the 12th International Conference on Business Process Management, BPM 2014, Haifa, Israel, 7–11 September 2014; pp. 36–41. [Google Scholar]
  31. van Dongen, B.F.; Van der Aalst, W.M. A Meta Model for Process Mining Data. In Proceedings of the EMOI-INTEROP 2005, Porto, Portugal, 13–14 June 2005; Volume 160, p. 30. [Google Scholar]
  32. Vanden Broucke, S.; Vanthienen, J.; Baesens, B. Straightforward Petri Net-based Event Log Generation in ProM. SSRN Electron. J. 2014. [Google Scholar] [CrossRef]
  33. Gomes, A.F.D.; Wanzeller, C.; Fialho, J. Comparative Analysis of Process Mining Tools. In Proceedings of the CAPSI 2021, 12–16 October 2021. [Google Scholar]
  34. Günther, C.W.; Rozinat, A. Disco: Discover Your Processes. BPM (Demos) 2012, 940, 40–44. [Google Scholar]
  35. Fluxicon. Process Mining for Professionals. 2023. Available online: https://fluxicon.com/disco/ (accessed on 11 May 2023).
  36. Bilousova, L.; Gryzun, L.; Sivochka, I. Petri Nets Android application as a mobile aid for students’ mastering modelling. J. Phys. Conf. Ser. 2021, 1840, 012033. [Google Scholar] [CrossRef]
  37. Wang, X.; Zhang, X.; Li, T.; Liu, J.; Chen, Q. Correctness of aspect-oriented business process modeling. Bus. Process. Manag. J. 2018, 24, 537–566. [Google Scholar] [CrossRef]
  38. Murata, T. Petri nets: Properties, analysis and applications. Proc. IEEE 1989, 77, 541–580. [Google Scholar] [CrossRef]
  39. Levin, R.I.; Rubin, D.S. Statistics for Management; Prentice Hall: Kent, OH, USA, 1991. [Google Scholar]
Figure 1. PN structure for a single process.
Applsci 13 11192 g001
Figure 2. PN structure for two chained process.
Applsci 13 11192 g002
Figure 3. PN structure for the selection of the activity to be executed.
Applsci 13 11192 g003
Figure 4. PN representing the execution of activities in parallel or concurrently.
Applsci 13 11192 g004
Figure 5. Attribution, showing independent execution of an activity triggered by a different activity.
Applsci 13 11192 g005
Figure 6. Conjunction, showing synchronization of activities in parallel.
Applsci 13 11192 g006
Figure 7. Process initial state.
Applsci 13 11192 g007
Figure 8. The player’s shot has been taken.
Applsci 13 11192 g008
Figure 9. The score increases by three points.
Applsci 13 11192 g009
Figure 10. The player successfully shoots a free throw.
Applsci 13 11192 g010
Figure 11. The score increases by one point.
Applsci 13 11192 g011
Figure 12. Initial screen.
Applsci 13 11192 g012
Figure 13. Main menu.
Applsci 13 11192 g013
Figure 14. Description of the business process.
Applsci 13 11192 g014
Figure 15. Data in DB of description of the business process ( C A T _ R P N ).
Applsci 13 11192 g015
Figure 16. Representation of business process with PNs.
Applsci 13 11192 g016
Figure 17. Simulation of activity behavior.
Applsci 13 11192 g017
Figure 18. Fragment of the data generated by the simulation process.
Applsci 13 11192 g018
Figure 19. Mathematical representation of the PN.
Applsci 13 11192 g019
Figure 20. Modified business process representation with PN.
Applsci 13 11192 g020
Figure 21. Mathematical representation of the PN for Process 2.
Applsci 13 11192 g021
Figure 22. Comparison between Process 1 and Process 2.
Applsci 13 11192 g022
Table 1. Typical connotations of transitions and places.
Input PlacesTransitionExi Places
PreconditionsEventPostconditions
Input DataCalculation StepOutput Data
Input SignalsSignal ProcessorOutput Signals
Required resourcesTask or workReleased resources
ConditionsClause in logicConclusion(s)
Store (Buffer)RendererStore (Buffer)
Table 2. Time recorded and distribution type for Activity 1.
The Meter Reader Arrives at the Customer’s Home
MINUTES
R13943484741414040
R24837493742363937
R34846504345364241
R44738494740394248
R54642403640373947
R64845454439504145
R73845494342434839
R83643354839435038
R94537453747365049
R103844434344384941
R115039414146493541
R124740424049473637
R133739364441504835
R145038374338373746
R154048464343394948
R16464840404937
Determination of Probability Distribution Act. 1
Refer to Appendix A
Mean:42.466 min2547.972 seg
Standard Dev.:04.478 min0268.681 seg
Median:43.000 min2580.000 seg
Mode39.000 min2340.000 seg
Type of distribution:NORMAL
Table 3. Time recorded and distribution type for Activity 2.
Read and Write Down the Consumption
Marked on the Wáter Volumen Meter
SECONDS
R13138323238233820
R23242284320242937
R32130374425422522
R41729291619274045
R53032412635394545
Marked on the Water Volume Meter
SECONDS
R61632164416323435
R72937254430443845
R83142434027272327
R94517211627184443
R103524442932302834
R111842354421353715
R124039264029304036
R132617193337162736
R143637381932153630
R154416454236453334
R16303040292629
Determination of Probability Distribution Act. 2
Refer to Appendix A
Mean:30.066 seg
Standar Dev.:08.786 seg
Median:32.000 seg
Mode32.000 seg
Type of distribution:NORMAL
Table 4. Time recorded and distribution type for Activity 3.
Deliver the Invoice
SECONDS
R11917171925242410
R22416222214232118
R31518201121102220
R41019132014131012
R51425191114221517
R62012171612202118
R72421131916232521
R81324171622191521
R92124241817252524
R101810151019231721
R111723222323181313
R121611121314222215
R131813112419131310
R142016172114121010
R151722182124221318
R16231615241324
Determination of Probability Distribution Act. 3
Refer to Appendix A
Mean:17.380 seg
Standar Dev.:04.516 seg
Median:18.000 seg
Mode24.000 seg
Type of distribution:NORMAL
Table 5. ( C A T _ R P N ) : business process catalog.
FieldTypeDescription
id_actNumericRegistration number
tip_symbolTextPetri net symbol (square, transition)
des_actTextDescription of the activity
end_actTextConnection or end of process
Table 6. ( T R N _ R S T ) : fields for recording the time simulation of BPs.
FieldTypeDescription
id_numberNumericSimulation cycle number
activityTextDescription of the business process activity
costNumericActivity cost (not used for this algorithm)
timeNumericActivity development time (generated by the simulator according to the probability distribution)
type_distributionTextInitial letter of the type of probability distribution used
Disclaimer/Publisher’s Note: The statements, opinions and data contained in all publications are solely those of the individual author(s) and contributor(s) and not of MDPI and/or the editor(s). MDPI and/or the editor(s) disclaim responsibility for any injury to people or property resulting from any ideas, methods, instructions or products referred to in the content.