
Effects of Solvents Used for Conservation/Restoration Treatments on Damaged Linden Panels of Cultural Heritage Assets


Abstract
1. Introduction
2. Materials and Methods
- ρw = moisture density at the time of testing;
- mw = mass of the sample at the set humidity at the time of testing, in g;
- vw = volume of the sample at the set humidity at the time of testing, in cm3.
- ρy = conventional density;
- mi = mass of the dry/conditioned specimen, initially, in g;
- vu = the volume of the sample at the set humidity, at the moment of extraction from the immersion in cm3.
- MC = moisture content, as a percentage;
- mu = wet mass of the sample extracted from immersion, in g;
- mi = initial mass, in g.
- αTG = swelling on the tangential section (TG), expressed as a percentage;
- lmax = size of the wet samples when extracted from immersion solvents, in mm;
- lmin = is the size of the dry samples, before immersion, in mm.
- MABS = amount absorbed, expressed in g;
- mu = wet mass, after extraction from the solvent, in g;
- mi = initial mass, before treatment, in g.
- VABS = absorbed volume, expressed in cm3;
- MABS = amount absorbed, expressed in g;
- ρsolvent = solvent density, expressed in g.
- Δ = variation, in mm;
- lu = value of the measured point on the measuring axis after immersion, in mm;
- li = value of the measured point on the initial measurement axis (before immersion), in mm.
3. Results
3.1. Fluid Absorption and Swelling Dimensional Changes
3.2. Dimensional Changes—Wood Deformation Produced by Solvents
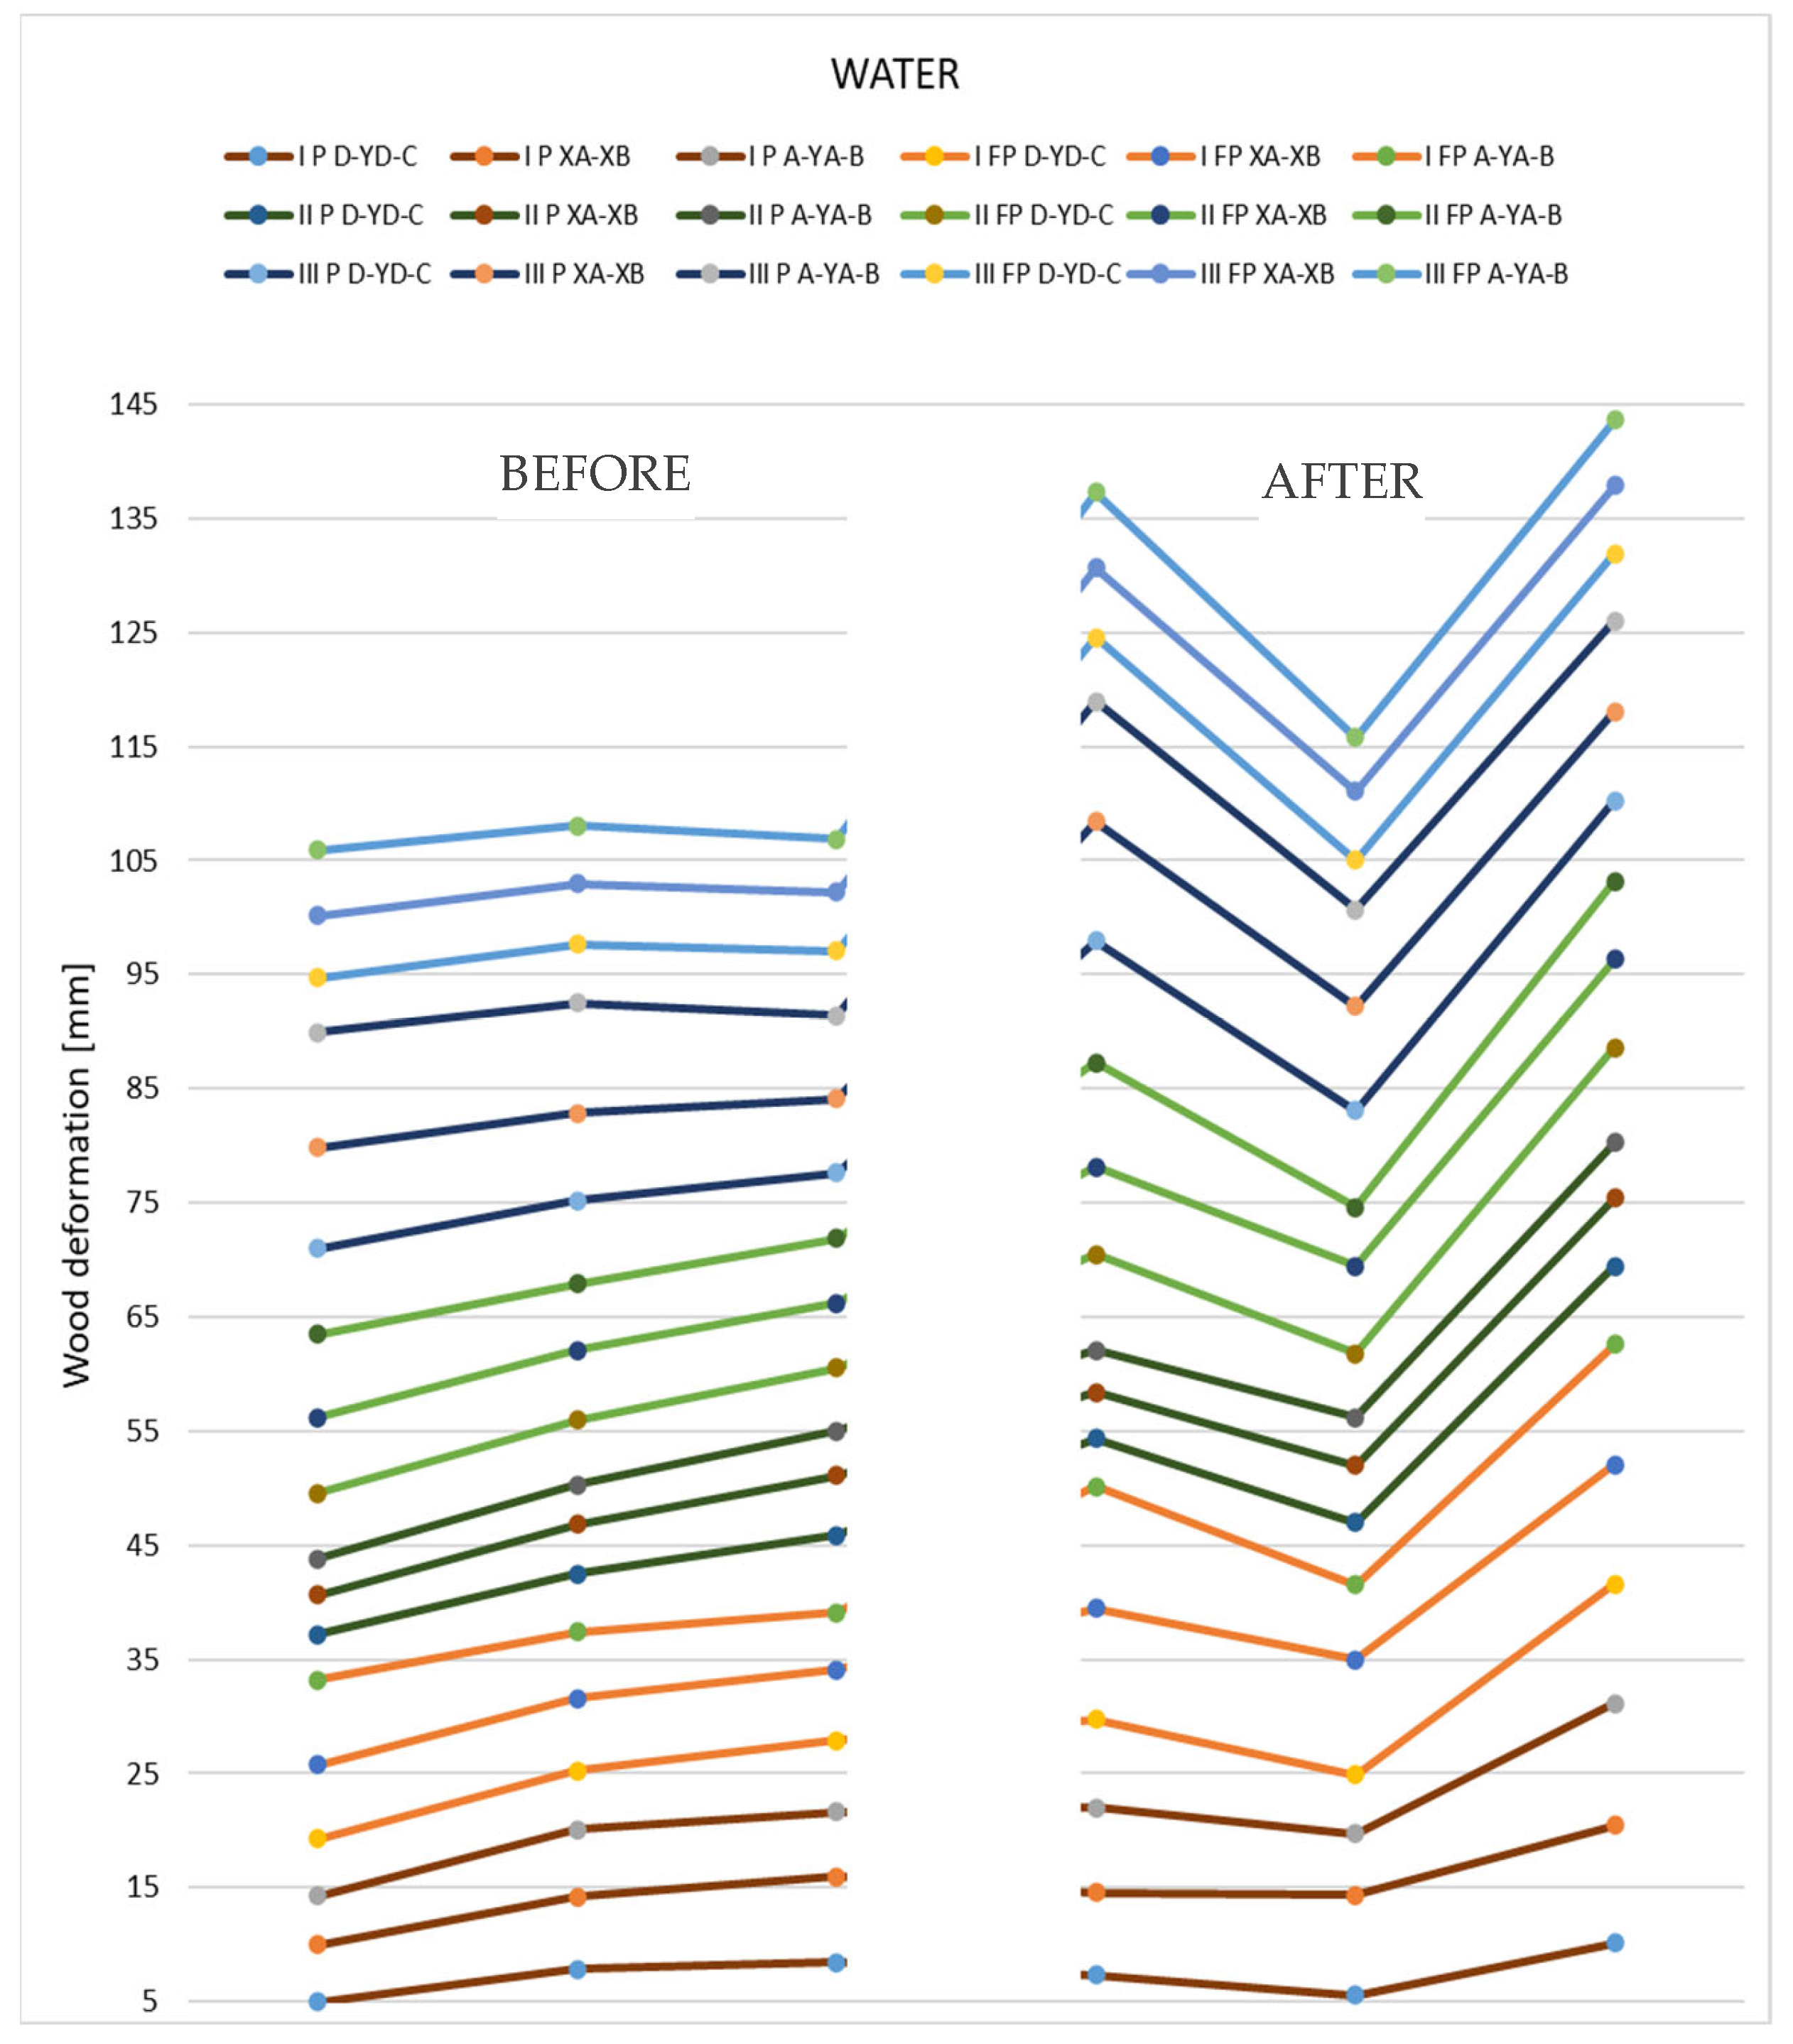
3.2.1. Results for Water Samples
3.2.2. Results Obtained with White Spirit
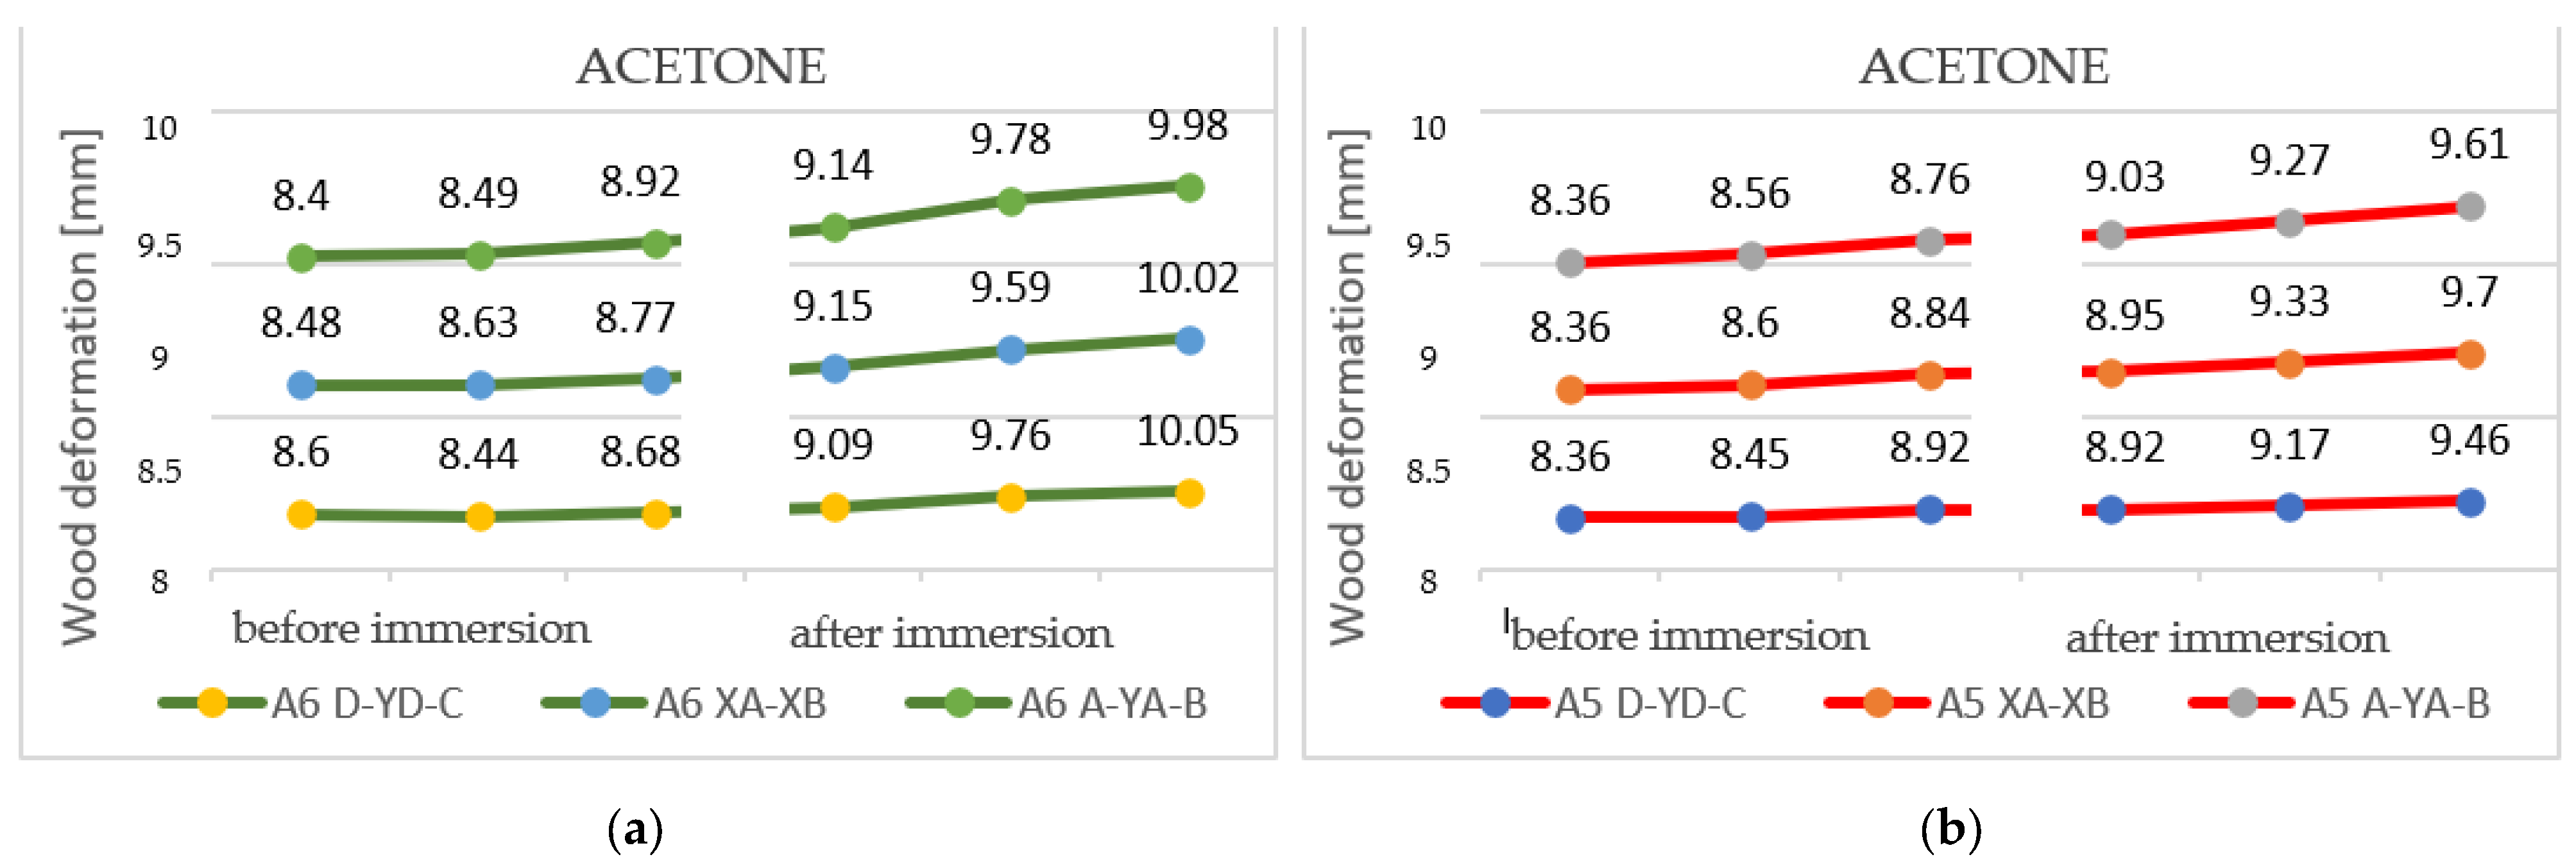
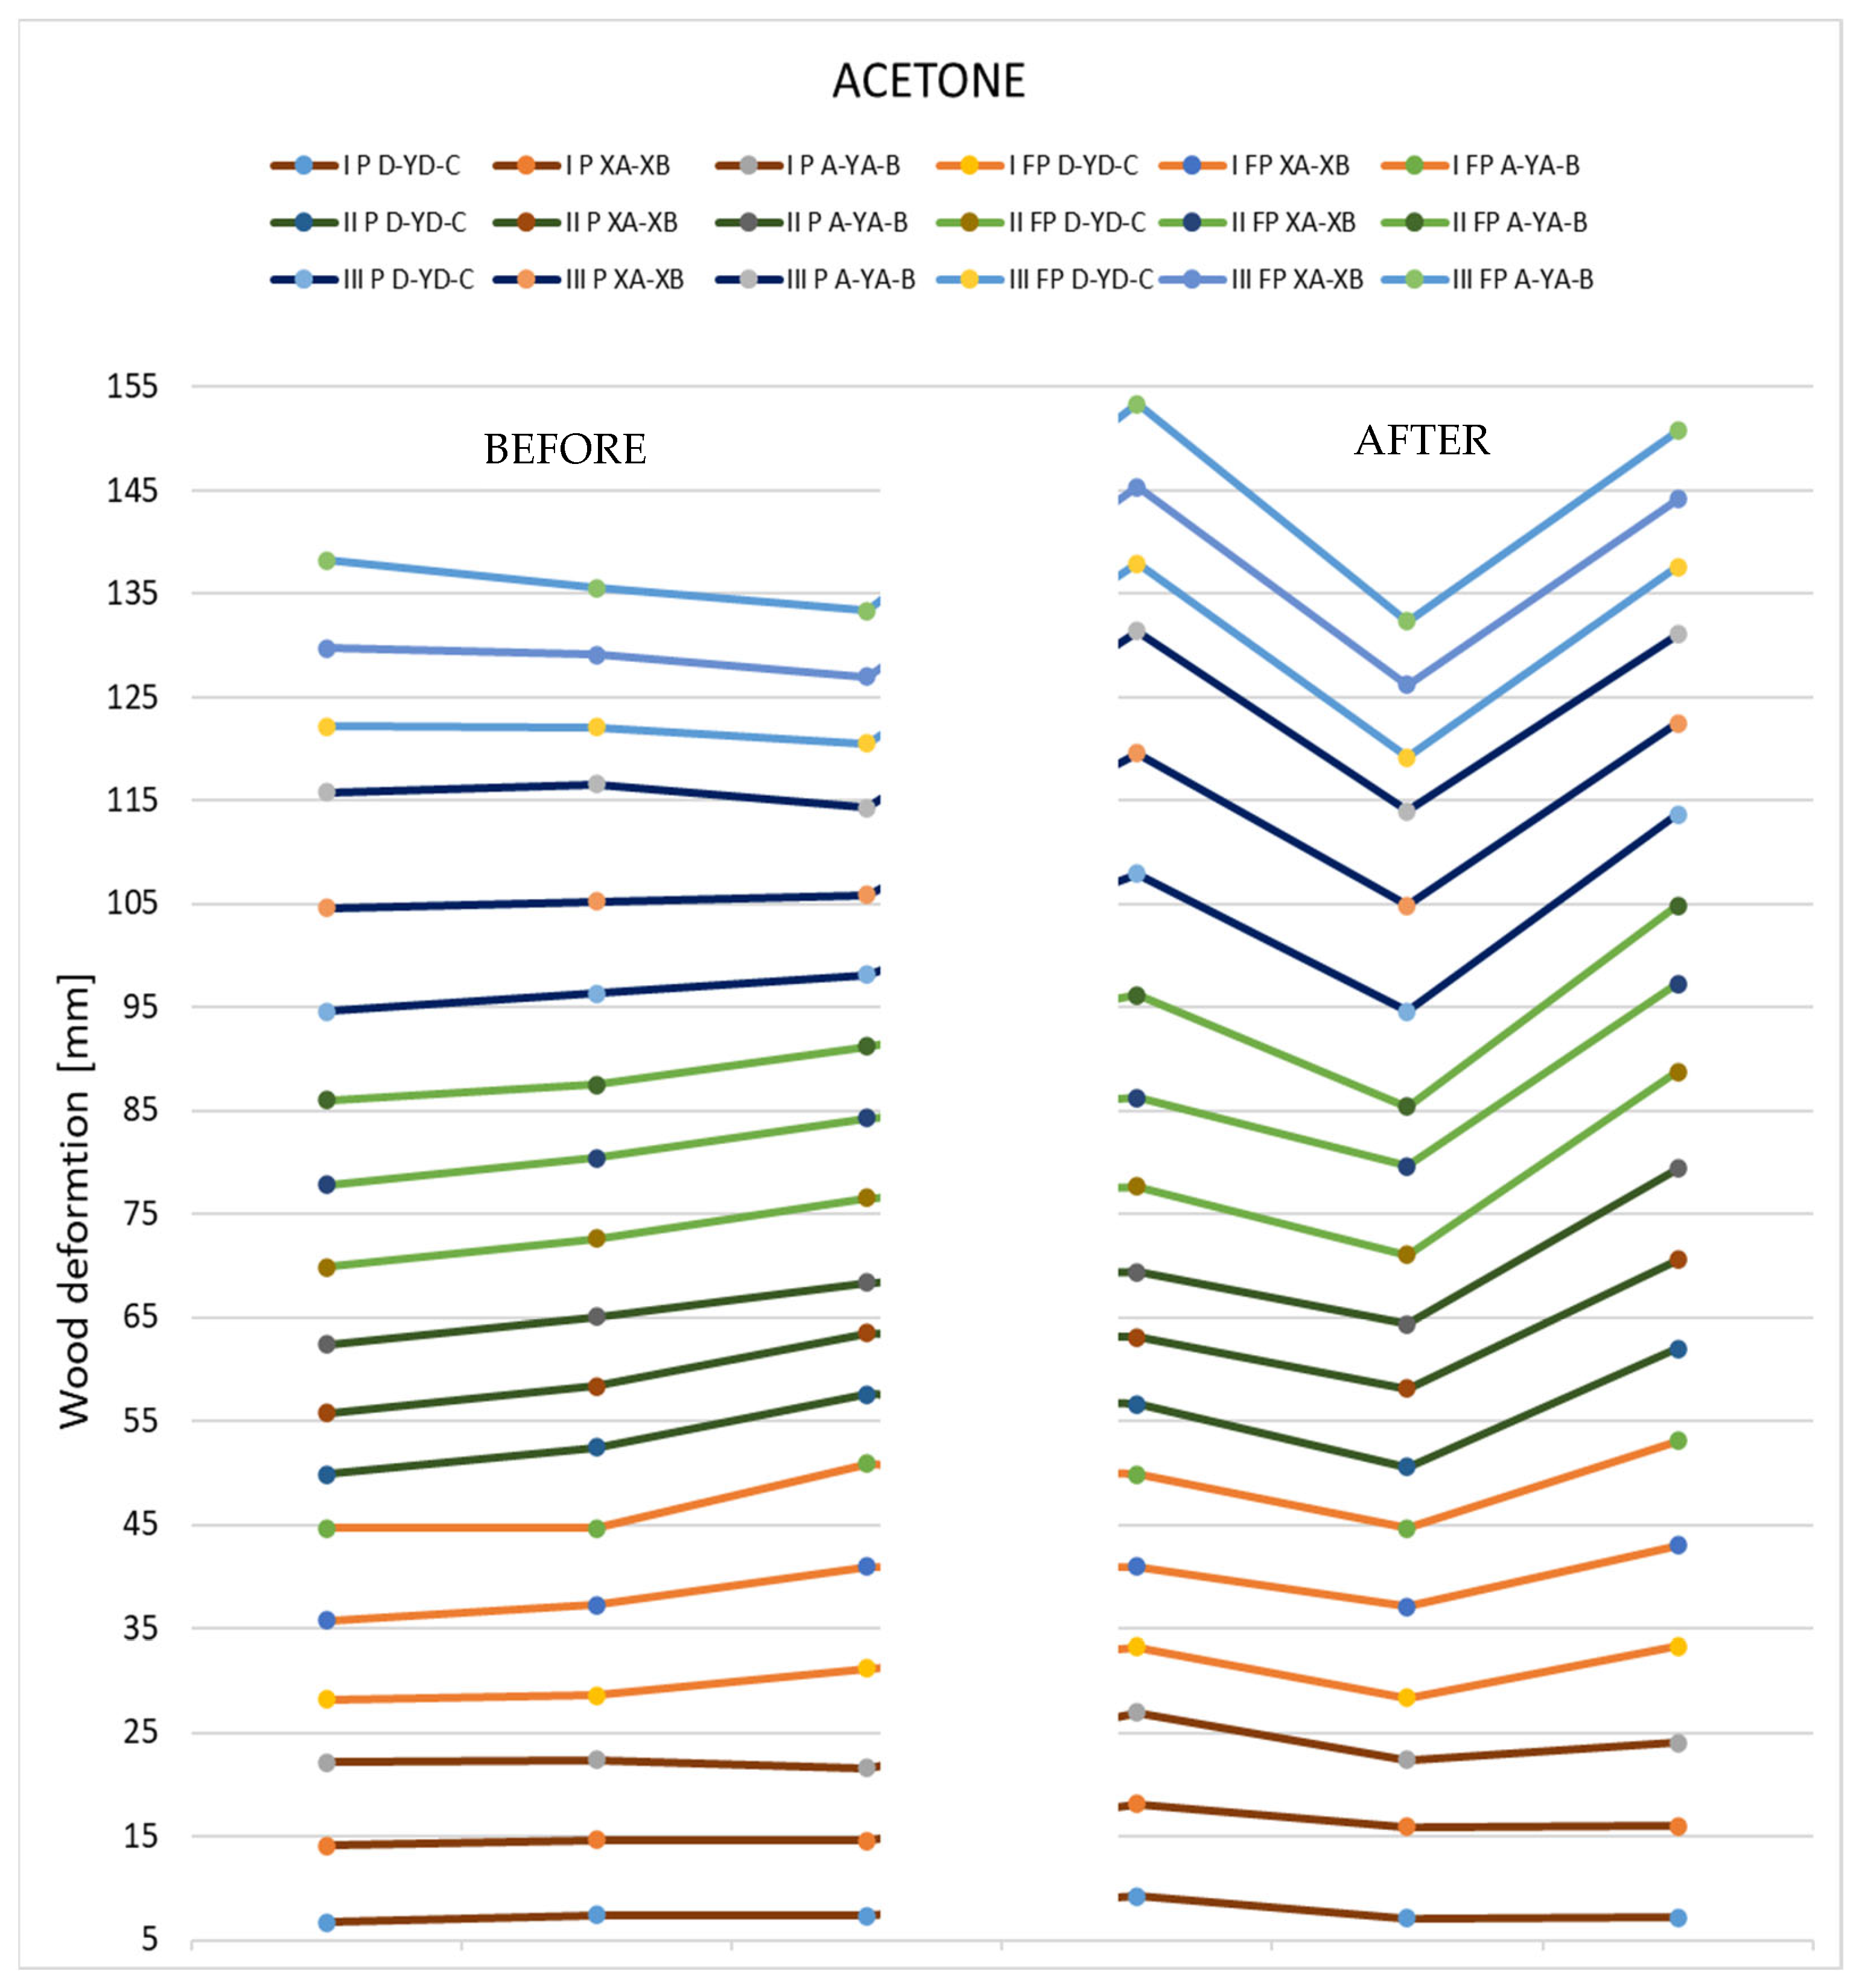
3.2.3. Results Obtained for Acetone
4. Discussion
4.1. Fluid Absorption and Swelling Dimensional Changes
4.2. Dimensional Changes—Wood Deformations Produced by Solvents
5. Future Research Directions
6. Conclusions
- Dimensional changes—swelling during treatment and contraction after the evaporation and drying of the wood.
- Deformations—concave/convex curvature and twists.
Author Contributions
Funding
Institutional Review Board Statement
Informed Consent Statement
Data Availability Statement
Acknowledgments
Conflicts of Interest
References
- Parliament of Romania—Law No. 182 of 25 October 2000 Regarding the Protection of the National Cultural Heritage Object. Published in the Official Gazette Number 10 of 8 January 2007. Available online: https://en.unesco.org/sites/default/files/rom_lege_182_romorof.pdf (accessed on 29 September 2023).
- Code of Ethics Document Promoted by the European Confederation of Conservator-Restoration Organizations and Adopted by the General Assembly, Brussels, 03/01/2002 Professional Guide (II) Promoted by the European Confederation of Conservator-Restorer Organizations and Approved in Its General Assembly of 7 March 2003. Available online: https://www.academia.edu/2905696/Cod_deontologic_E_C_C_O_E_C_C_O_PROFESSIONAL_GUIDELINES (accessed on 20 April 2022).
- Castelli, C. The Restoration of Panel Painting Supports Some Case Histories în Current Approaches to the Structural Conservation of Panel Paintings. In The Structural Conservation of Panel Paintings: Proceedings of a Symposium at the J. Paul Getty Museum, 24–28 April 1995; Getty Publications: Los Angeles, CA, USA, 1998; pp. 316–340. [Google Scholar]
- Caggiani, M.C.; Cosentino, A.; Mangone, A. Pigments Checker version 3.0, a handy set for conservation scientists: A free online Raman spectra database. Microchem. J. 2016, 129, 123–132. [Google Scholar] [CrossRef]
- Janas, A.; Fuster-López, L.; Andersen, C.K. Mechanical properties and moisture-related dimensional change of canvas paintings–canvas and glue sizing. Herit. Sci. 2022, 10, 160. [Google Scholar] [CrossRef]
- Sargent, R. Evaluating dimensional stability in solid wood: A review of current practice. J. Wood Sci. 2019, 65, 36. [Google Scholar] [CrossRef]
- Filipovici, J. Studiul Lemnului, 1st ed.; Didactică și Pedagogică: București, Romania, 1964; Volume 1, pp. 68–96. [Google Scholar]
- Pescăruș, P. Proprietățile Fizice ale Lemnului. In Tehnologia Prelucrării Lemnului; Râmbu, I., Ed.; Tehnică: București, Romania, 1978; pp. 64–89. [Google Scholar]
- Wadum, J. Microclimate Boxes for Panel Paintings in Approaches to the Structural Conservation of Panel Paintings. In The Structural Conservation of Panel Paintings: Proceedings of a Symposium at the J. Paul Getty Museum, 24–28 April 1995; Getty Publications: Los Angeles, CA, USA, 1998; pp. 497–524. [Google Scholar]
- Ionescu, C.Ș. Stabilizarea și Consolidarea Suportului Lemnos Pentru Obiectele de Patrimoniu, Utilizând Materiale Clasice și Modern/Stabilization and Consolidation of Wooden Support for Heritage Objects, Using Classic and Modern Materials. Ph.D. Thesis, Transilvania University of Brașov, Brașov, România, 2020. [Google Scholar]
- Avram, A.; Ionescu, C.S.; Lunguleasa, A. A consolidation of degraded lime wooden support from heritage objects using two types of consolidant. BioResources 2023, 18, 4580–4597. [Google Scholar] [CrossRef]
- Arzola-Villegas, X.; Lakes, R.; Plaza, N.Z.; Jakes, J.E. Wood Moisture-Induced Swelling at the Cellular Scale—Ab Intra. Forests 2019, 10, 996. [Google Scholar] [CrossRef]
- Zhan, T.; Lyu, J.; Eder, M. In situ observation of shrinking and swelling of normal and compression Chinese fir wood at the tissue, cell and cell wall level. Wood Sci. Technol. 2021, 55, 1359–1377. [Google Scholar] [CrossRef]
- Callum, A.S. Hill Wood Modification: Chemical, Thermal and Other Processes; John Wiley & Sons Ltd.: Chichester, UK, 2006; pp. 19–44. [Google Scholar]
- Rowell, R.M. Handbook of Wood Chemistry and Wood Composites; CRC Press: Boca Raton, FL, USA, 2005; Chapter 4; pp. 77–97. [Google Scholar]
- Lunguleasa, A. Wood Physics and Mechanics; Editura Universiatii Transilvania: Brasov, Romania, 2007; pp. 18–43. [Google Scholar]
- Tiryaki, S.; Bardak, S.; Aydin, A.; Nemli, G. Analysis of volumetric swelling and shrinkage of heattreated woods: Experimental and artificial neural network modeling approach. Maderas Cienc. Technol. 2016, 18, 477–492. [Google Scholar] [CrossRef]
- Filipovici, J. Studiul Lemnului, 2nd ed.; Didactică și Pedagogică: București, Romania, 1965; Volume 2, p. 77. [Google Scholar]
- Ispas, M. Experimental investigations on swelling pressure of natural and heat-treated ash wood. Bull. Transilv. Univ. Brasov. Ser. II For. Wood Ind. Agric. Food Eng. 2013, 6, 55. [Google Scholar]
- Krauss, A. Swelling Pressure of Wood Determined from Hygro-Mechanical Creep Measurements. 2004. Available online: http://www.ejpau.media.pl/volume7/issue2/wood/art-01.html (accessed on 21 February 2023).
- Zelinka, S.L.; Altgen, M.; Emmerich, L.; Guigo, N.; Keplinger, T.; Kymäläinen, M.; Thybring, E.E.; Thygesen, L.G. Review of Wood Modification and Wood Functionalization Technologies. Forests 2022, 13, 1004. [Google Scholar] [CrossRef]
- Zelinka, S.L.; Glass, S.V.; Jakes, J.E. A solution thermodynamics definition of the fiber saturation point and the derivation of a wood–water phase (state) diagram. Wood Sci. Technol. 2016, 50, 443–462. [Google Scholar] [CrossRef]
- Thybring, E.E.; Fredriksson, M. Wood Modification as a Tool to Understand Moisture in Wood. Forests 2021, 12, 372. [Google Scholar] [CrossRef]
- Maher, Z.A. Evaluation of Moisture Content in Wood Fiber and Recommendation of the Best Method for Its Determination, Submitted in Partial Fulfillment of the Requirements for the Degree of Master of Science at Helwan University Ain Helwan, Cairo. 2006. Available online: https://maher2100.tripod.com/msc1.pdf (accessed on 21 February 2023).
- Lahtela, V.; Kärki, T. Effects of impregnation and heat treatment on the physical and mechanical properties of Scots pine (Pinus sylvestris) wood. Wood Mater. Sci. Eng. 2016, 11, 217–227. [Google Scholar] [CrossRef]
- Wu, G.; Shah, U.D.; Janeček, E.-R.; Burridge, H.C.; Reynolds, T.P.S.; Fleming, P.H.; Linde, P.F.; Ramage, M.H.; Scherman, O.A. Predicting the pore-filling ratio in lumen-impregnated wood. Wood Sci. Technol. 2017, 51, 1277–1290. [Google Scholar] [CrossRef]
- Ionescu, C.Ş.; Lunguleasa, A.; Avram, A.; Spîrchez, C. Evaluation of the efficiency of the consolidation treatment with Paraloid B72, performed on artworks with degraded wood support. MATEC Web Conf. 2021, 343, 1–10. [Google Scholar] [CrossRef]
- Avram, A.; Ionescu, C.Ș.; Lunguleasa, A. Some Methods for the Degradation-Fragility Degree Determination and for the Consolidation of Treatments with Paraloid B72 of Wood Panels from Icon-Type Heritage Objects. Forests 2022, 13, 801. [Google Scholar] [CrossRef]
- Darwish, S.S.; El-Hadidi, N.M.N. The effect of solvents on the chemical composition of archaeological wood. In Proceedings of the International Conference on Giza through the Ages, Giza, Egypt, 4–6 March 2008. [Google Scholar]
- Bossu, J.; Le Moigne, N.; Corn, S.; Trens, P.; Di Renzo, F. Sorption of water–ethanol mixtures by poplar wood: Swelling and viscoelastic behaviour. Wood Sci. Technol. 2018, 52, 987–1008. [Google Scholar] [CrossRef]
- Chang, S.S.; Quignard, F.; Di Renzo, F.; Clair, B. Solvent polarity and internal stresses control the swelling behavior of green wood during dehydration in organic solution. BioResources 2012, 7, 2418–2430. [Google Scholar] [CrossRef]
- Mantanis, G.I.; Young, R.A.; Rowell, R.M. Swelling of wood, Part 1. Swelling in water. Wood Sci. Technol. 1994, 28, 119–134. [Google Scholar]
- Mantanis, G.I.; Raymond, A.Y.; Rowell, R.M. Swelling of compressed cellulose fiber webs in organic liquids. Cellulose 1995, 2, 1–22. [Google Scholar] [CrossRef]
- Meier, P.; Kaps, T.; Kallavus, U. Swelling of pinewood (Pinus sylvestris) in binary aqueous solutions of organic substances. Mater. Sci.-Medzg. 2005, 11, 140–145. [Google Scholar]
- Rowell, R.M.; Dale, E.W. Determination of dimensional stabilization of wood using the water soak method. Wood Fiber Sci. 1978, 2, 104–111. Available online: https://wfs.swst.org/index.php/wfs/article/view/1004/1004 (accessed on 24 September 2023).
- Rafsanjani, A.; Stiefel, M.; Jefimovs, K.; Mokso, R.; Derome, D.; Carmeliet, J. Hygroscopic swelling and shrinkage of latewood cell wall micropillars reveal ultrastructural anisotropy. J. R. Soc. Interface 2014, 11. [Google Scholar] [CrossRef]
- International Standard ISO 3131-1975; Wood Determination of Density for Physical and Mechanical Tests. International Organization for Standardization: Geneva, Switzerland, 1975.
- European Standard EN 13183-1/2002; Moisture Content of a Piece of Sawn Timber. European Committee for Standardization: Brussels, Belgium, 2002.
- International Standard ISO 4859-1982; Wood Determination of Radial and Tangential Swelling. International Organization for Standardization: Geneva, Switzerland, 1982.


| Cleaners | Density (g/cm3) | Quantity Used/Container/Specimen Set (g) | Quantity Used/Container/Specimen Set (mL) |
|---|---|---|---|
| Water | 1.00 | 150/300 | 150/300 |
| Acetone | 0.7899 | 118.49/237.97 | 150/300 |
| White spirit (D40) | 0.789 | 118.35/236.7 | 150/300 |
| Determinations | Sample Code | Solvent Used | ||
|---|---|---|---|---|
| Water | White Spirit | Acetone | ||
| The mass before the immersion [g] | I.FP | 56.93 | 56.55 | 57.33 |
| II.P | 63.14 | 62.88 | 62.33 | |
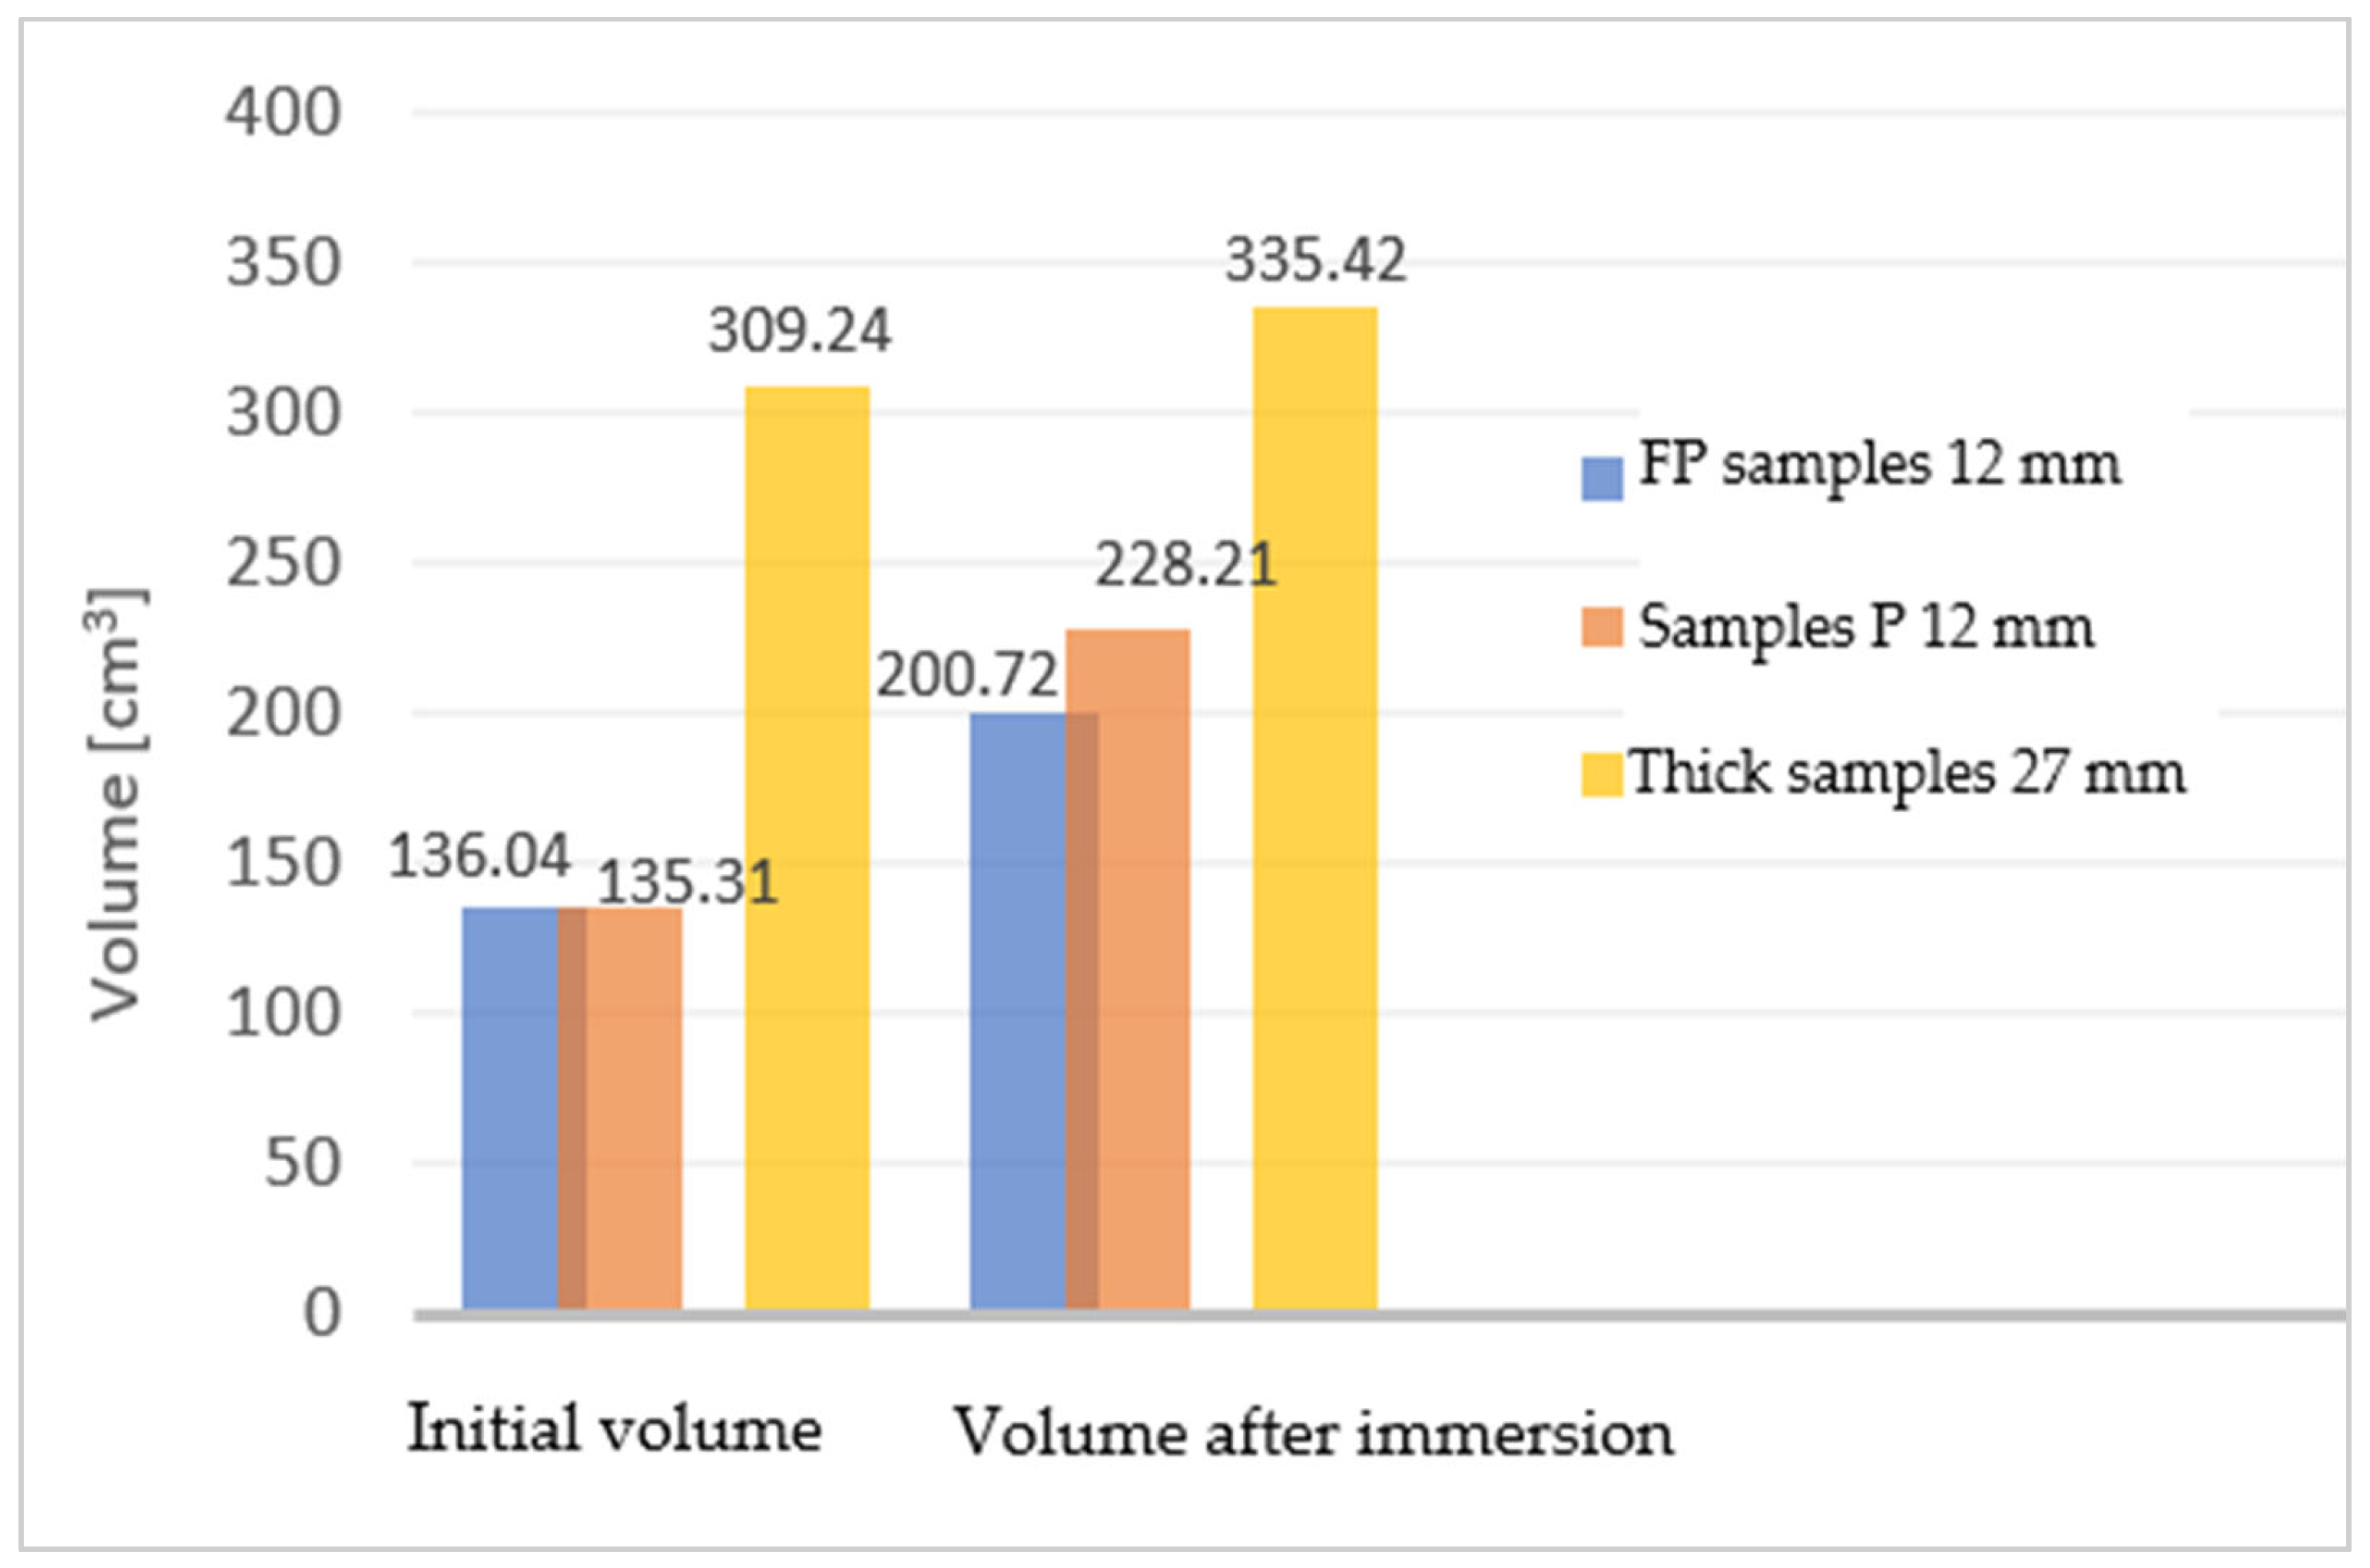
| Initial volume [cm3] | I.FP | 137.95 | 140.15 | 136.04 |
| II.P | 138.01 | 143.5 | 135.31 | |
| The mass after immersion [g] | I.FP | 96.06 | 87.69 | 92.97 |
| II.P | 111 | 95.52 | 100.46 | |
| Volume after immersion [cm3] | I.FP | 151.1 | 145.23 | 200.72 |
| II.P | 156.99 | 144.87 | 228.21 | |
| Solvent absorption [g] | I.FP | 39.13 | 31.14 | 35 |
| II.P | 47.86 | 32.64 | 38.13 | |
| Solvent absorption [cm3] | I.FP | 39.13 | 39.92 | 44.30 |
| II.P | 47.86 | 41.85 | 48.27 | |
| Absorption from the total used (150 mL) [%] | I.FP | 26.09 | 26.62 | 29.54 |
| II.P | 31.91 | 27.90 | 32.18 | |
| Solvent content/test tube, relative to the initial volume and the volume of solvent absorbed [%] | I.FP | 28.365 | 28.486 | 32.567 |
| II.P | 34.679 | 29.161 | 35.671 | |
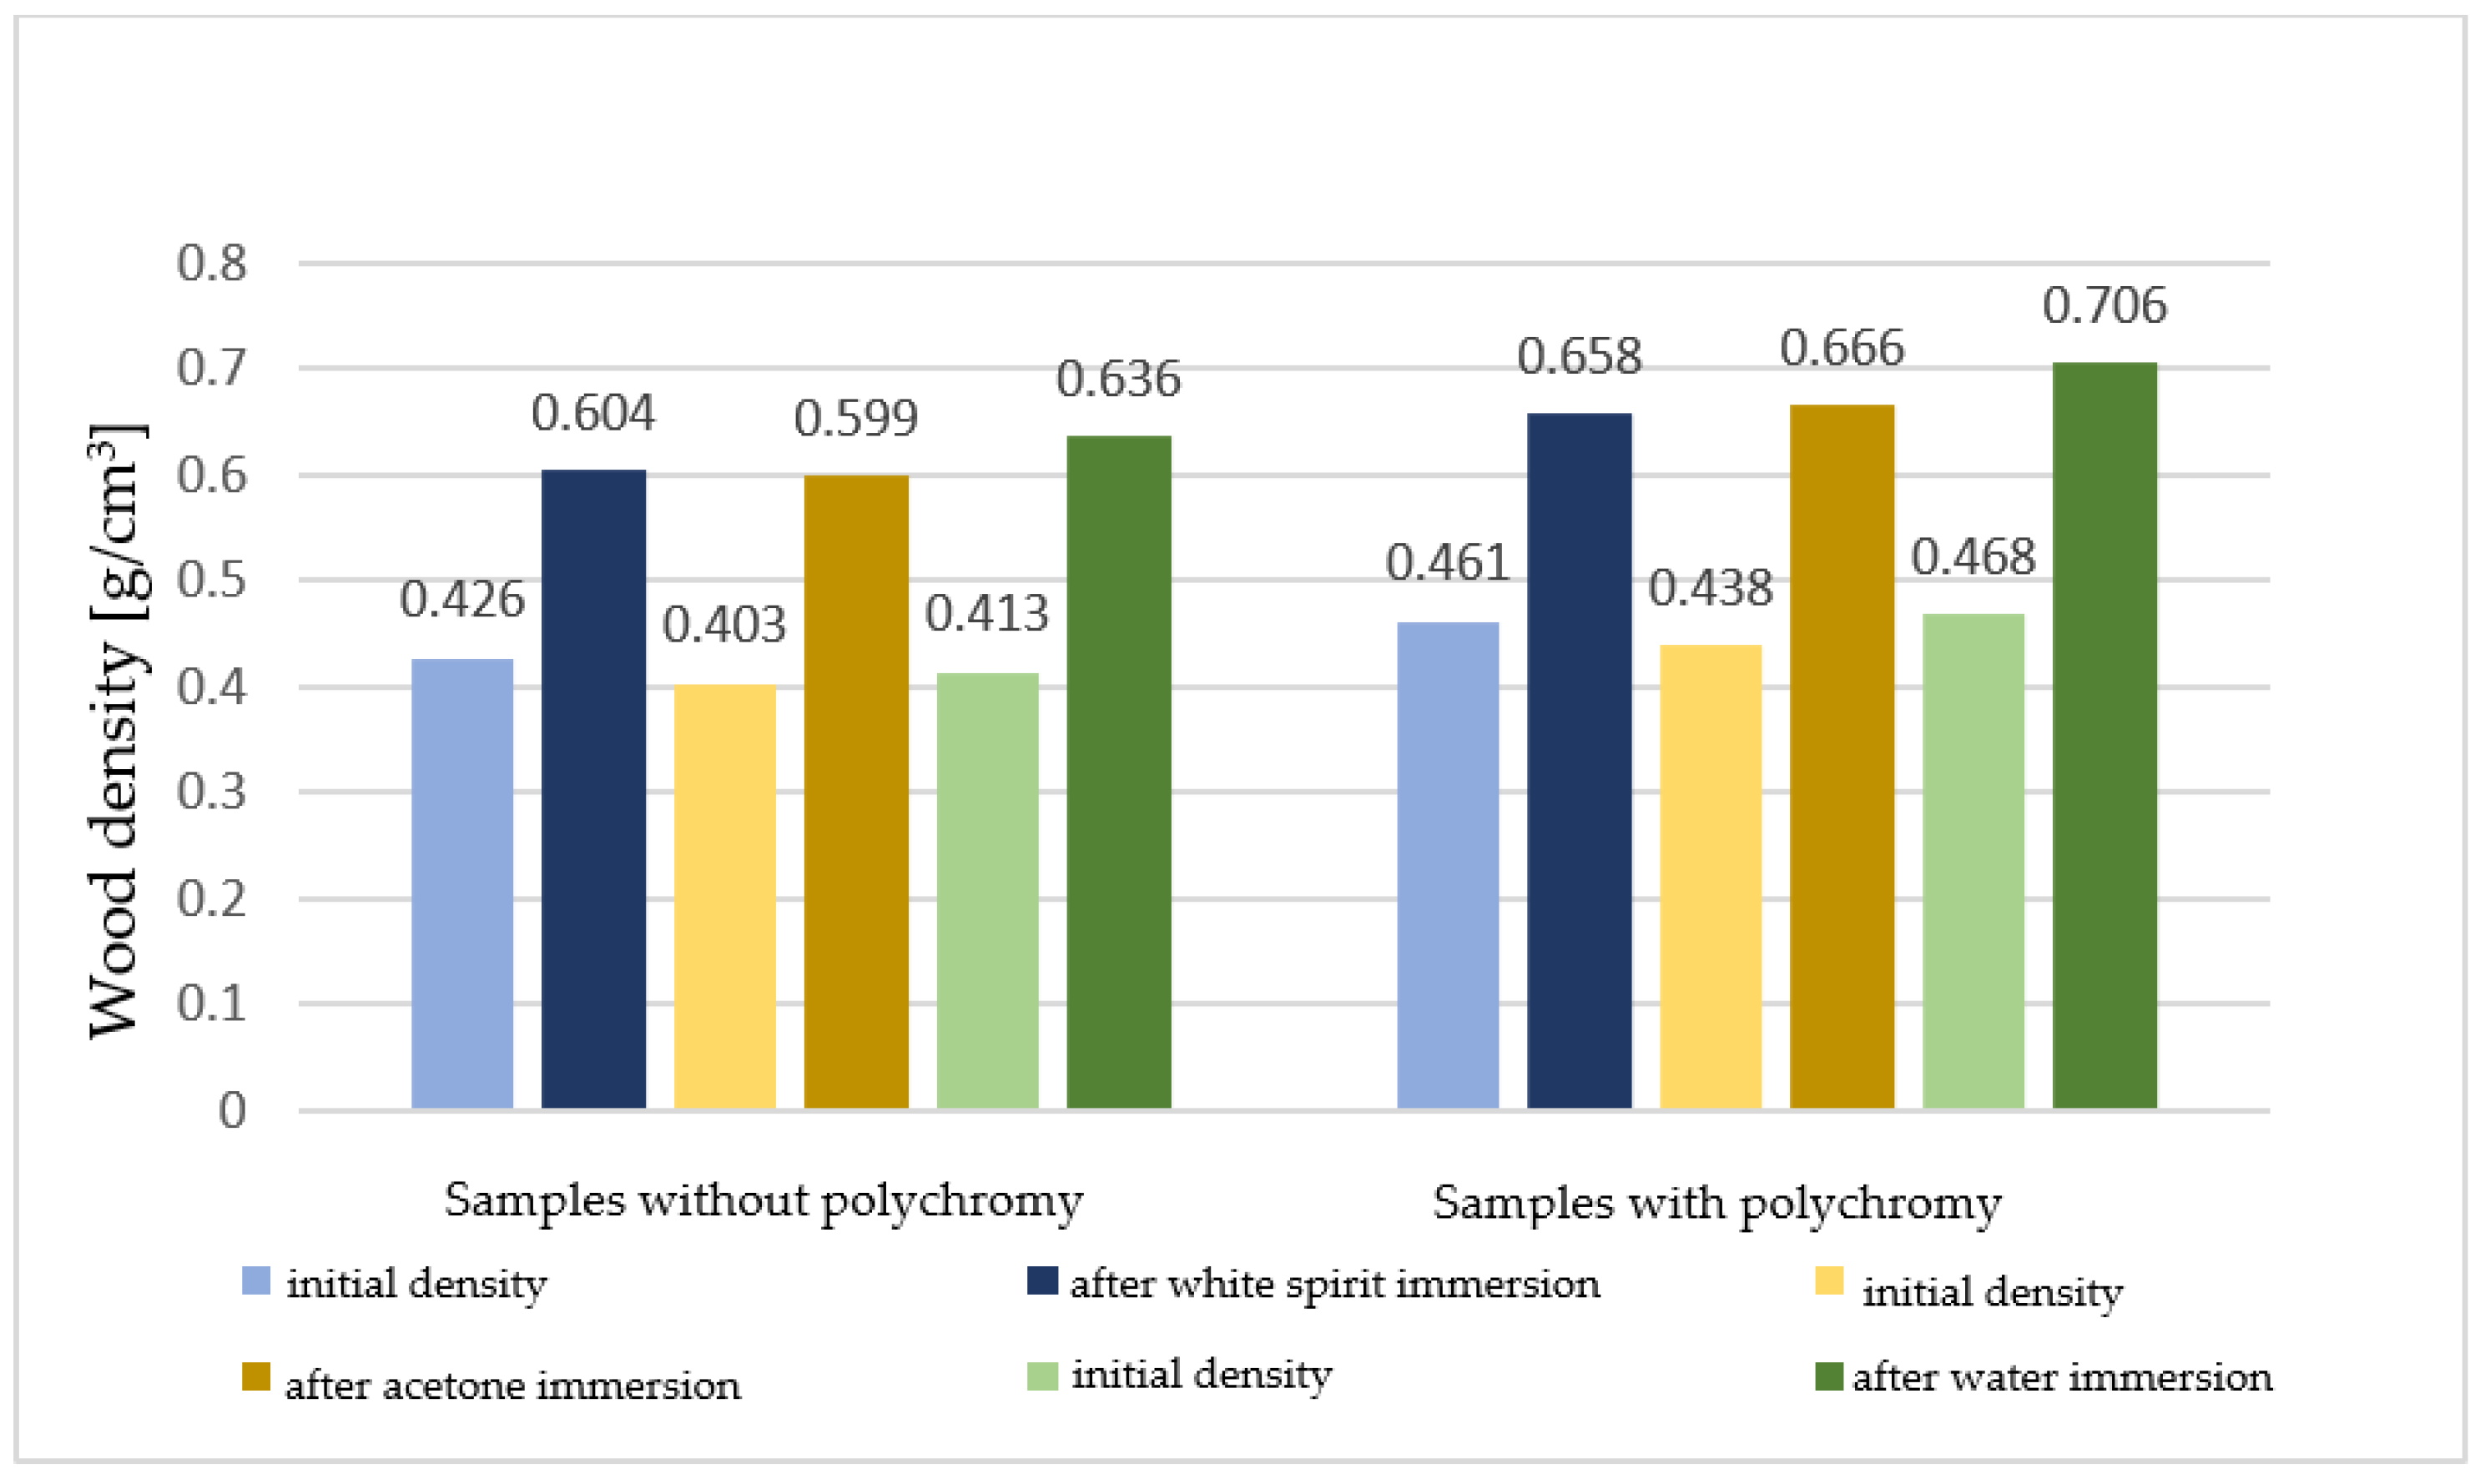
| Initial density [g/cm3] | I.FP | 0.413 | 0.403 | 0.426 |
| II.P | 0.458 | 0.438 | 0.461 | |
| Density after immersion [g/cm3] | I.FP | 0.6357 | 0.6038 | 0.4632 |
| II.P | 0.7071 | 0.6593 | 0.4402 | |
| Apparent density [g/cm3] | I.FP | 0.3768 | 0.3894 | 0.2856 |
| II.P | 0.4022 | 0.4340 | 0.2731 | |
| The growth in volume [%] | I.FP | 9.532 | 3.625 | 47.545 |
| II.P | 13.753 | 0.955 | 68.657 | |
| Determinations | Solvent Used | ||
|---|---|---|---|
| Water | White Spirit | Acetone | |
| Sample code | 1P | 3P | 5P |
| Mass before the immersion [g] | 125.32 | 134.11 | 130.48 |
| Initial volume [cm3] | 284.87 | 308.74 | 309.24 |
| Mass after immersion [g] | 176.84 | 210.245 | 224.7 |
| Volume after immersion [cm3] | 301.72 | 312.33 | 335.42 |
| Solvent absorption [g] | 51.52 | 76.135 | 94.22 |
| Solvent absorption [cm3] | 51.52 | 97.61 | 119.27 |
| Absorption from total used (300 mL) [%] | 17.17 | 32.54 | 39.76 |
| Solvent content/test tube, relative to initial volume and volume of solvent absorbed [%] | 18.085 | 31.615 | 38.567 |
| Initial density [g/cm3] | 0.439 | 0.434 | 0.421 |
| Density after immersion [g/cm3] | 0.586 | 0.673 | 0.669 |
| Apparent density [g/cm3] | 0.415 | 0.429 | 0.389 |
| Increase in volume [%] | 5.91 | 1.16 | 8.46 |
| Solvent Sample Code | Swelling Difference between Initial Measurements and after Partial Immersion (15 min) | ||||
|---|---|---|---|---|---|
| Initial Tangent Dimensions (mm) | Tangential Dimensions after Immersion (mm) | Swelling (mm) | Dimensional Variation (Δα) (%) | ||
| Water | I.FP ** | 130.88 (0.97) * | 136.26 (0.83) * | 5.38 | 4.11 |
| II.P *** | 130.83 (0.72) * | 137.54 (0.97) * | 6.71 | 5.13 | |
| White spirit | I.FP ** | 132.06 (0.67) * | 132.46 (0.67) * | 0.4 | 0.30 |
| II.P *** | 132.84 (0.81) * | 132.89 (0.24) * | 0.05 | 0.04 | |
| Acetone | I.FP ** | 130.04 (0.86) * | 138.95 (2.60) * | 8.91 | 6.85 |
| II.P *** | 130.04 (0.86) * | 140.26 (0.89) * | 10.22 | 7.86 | |
| Solvent Sample Code | Swelling Difference between Initial Measurements and after Partial Immersion (15 min) | ||||
|---|---|---|---|---|---|
| Initial Tangent Dimensions (mm) | Tangential Dimensions after Immersion (mm) | Swelling (mm) | Dimensional Variation (Δα) (%) | ||
| Water | 1P (A1) | 130.39 | 133.03 | 2.64 | 2.02 |
| 2P (A2) | 129.14 | 131.54 | 2.40 | 1.86 | |
| White spirit | 3P (A3) | 128.93 | 129.64 | 0.71 | 0.55 |
| 4P (A4) | 129.82 | 130.20 | 0.38 | 0.29 | |
| Acetone | 5P (A5) | 129.60 | 134.70 | 5.10 | 3.94 |
| 6P (A6) | 129.45 | 134.62 | 5.17 | 3.99 | |
| Code | Before Treatment | After Immersion | The Difference between Points on the Horizontal Axis | |||||||
|---|---|---|---|---|---|---|---|---|---|---|
| Sample | ||||||||||
| Solvent | Axis of Determination | Points on the Axis | Δμ = l after immersion − l before immersion | |||||||
| Water | D | YD | C | D1 | YD1 | C1 | ||||
| SECTIONAL SAMPLES 12 mm | ||||||||||
| I P | D-YD-C | 5 | 7.88 | 8.43 | 7.35 | 5.59 | 10.15 | 2.35 | −2.29 | 1.72 |
| XA-XB | 5 | 7.55 | 7.2 | 10.31 | 2.2 | 0 | 2.76 | |||
| A-YA-B | 4.3 | 5.94 | 5.64 | 7.44 | 5.38 | 10.71 | 3.14 | −0.56 | 5.07 | |
| I FP | D-YD-C | 5 | 5.18 | 6.27 | 7.78 | 5.15 | 10.4 | 2.78 | −0.03 | 4.13 |
| XA-XB | 6.43 | 6.2 | 9.67 | 10.48 | 3.24 | 0 | 4.28 | |||
| A-YA-B | 7.47 | 5.8 | 5 | 10.7 | 6.61 | 10.56 | 3.23 | 0.81 | 5.56 | |
| II P | D-YD-C | 4 | 5.1 | 6.75 | 4.23 | 5.4 | 6.8 | 0.23 | 0.3 | 0.05 |
| XA-XB | 3.45 | 5.27 | 4 | 6 | 0.55 | 0 | 0.73 | |||
| A-YA-B | 3.19 | 3.45 | 3.88 | 3.7 | 4.21 | 4.84 | 0.51 | 0.76 | 0.96 | |
| II FP | D-YD-C | 5.7 | 5.65 | 5.55 | 8.39 | 5.58 | 8.35 | 2.69 | −0.07 | 2.8 |
| XA-XB | 6.66 | 5.63 | 7.65 | 7.73 | 0.99 | 0 | 2.1 | |||
| A-YA-B | 7.27 | 5.78 | 5.68 | 9.15 | 5.18 | 6.85 | 1.88 | −0.6 | 1.17 | |
| III P | D-YD-C | 7.51 | 7.35 | 5.77 | 10.68 | 8.44 | 7.09 | 3.17 | 1.09 | 1.32 |
| XA-XB | 8.82 | 6.49 | 10.51 | 7.78 | 1.69 | 0 | 1.29 | |||
| A-YA-B | 10.13 | 9.66 | 7.31 | 10.51 | 8.48 | 7.96 | 0.38 | −1.18 | 0.65 | |
| III FP | D-YD-C | 4.79 | 5.1 | 5.65 | 5.62 | 4.35 | 5.92 | 0.83 | −0.75 | 0.27 |
| XA-XB | 5.44 | 5.17 | 6.1 | 5.93 | 0.66 | 0 | 0.76 | |||
| A-YA-B | 5.77 | 5.12 | 4.64 | 6.64 | 4.77 | 5.74 | 0.87 | −0.35 | 1.1 | |
| SECTIONAL TESTS 27 mm | ||||||||||
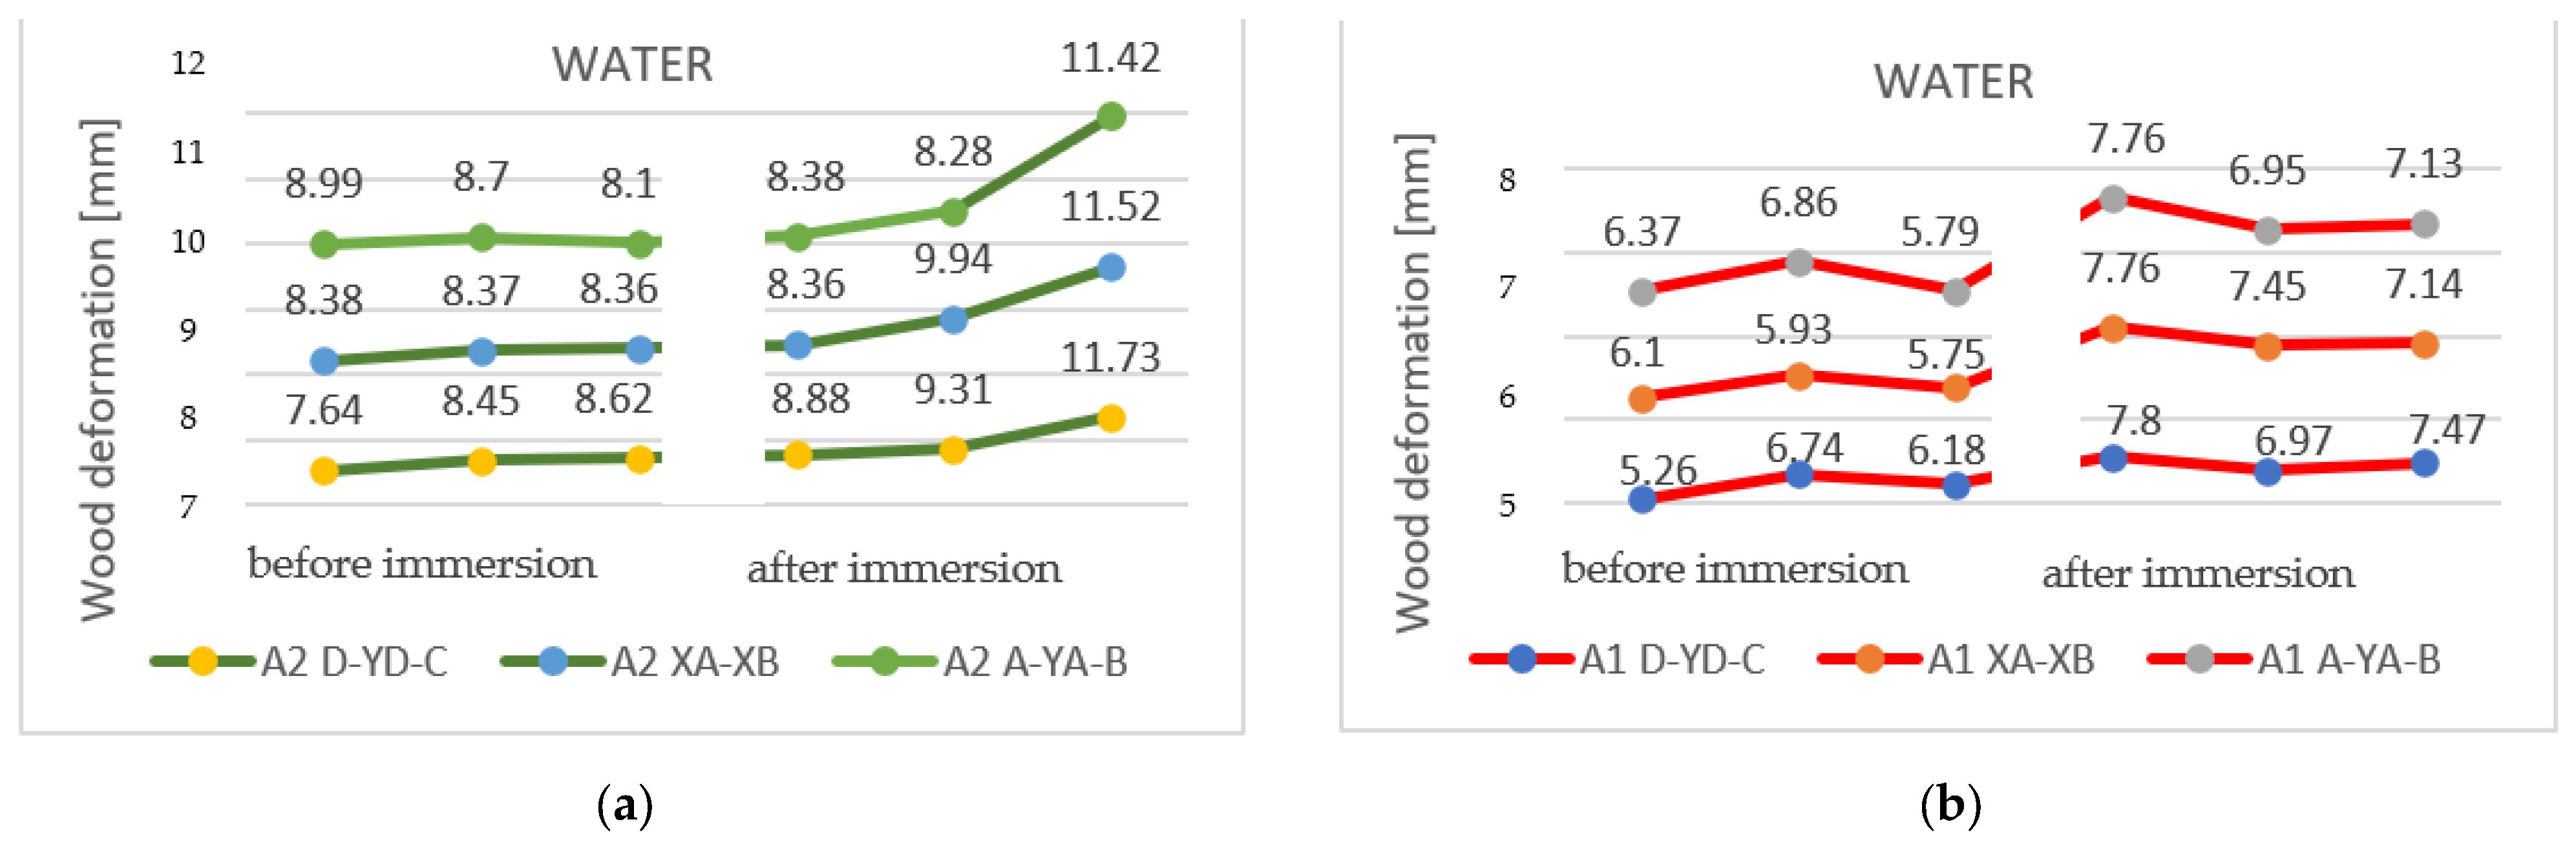
| A1 (1P) | D-YD-C | 5.26 | 6.74 | 6.18 | 7.8 | 6.97 | 7.47 | 2.54 | 0.23 | 1.29 |
| XA-XB | 6.1 | 5.75 | 7.76 | 7.14 | 1.66 | 0 | 1.39 | |||
| A-YA-B | 6.37 | 6.86 | 5.79 | 7.76 | 6.95 | 7.13 | 1.39 | 0.09 | 1.34 | |
| A2 (2P) | D-YD-C | 7.64 | 8.45 | 8.62 | 8.88 | 9.31 | 11.73 | 1.24 | 0.86 | 3.11 |
| XA-XB | 8.38 | 8.36 | 8.36 | 11.52 | −0.02 | 0 | 3.16 | |||
| A-YA-B | 8.99 | 8.7 | 8.1 | 8.38 | 8.28 | 11.42 | −0.61 | −0.42 | 3.32 | |
| Code | Before Treatment | After Immersion | The Difference between Points on the Horizontal Axis Δμ = l after immersion − l before immersion | |||||||
|---|---|---|---|---|---|---|---|---|---|---|
| Sample | ||||||||||
| Solvent | Axis of Determination | Points on the Axis | ||||||||
| White Spirit | D | YD | C | D1 | YD1 | C1 | ||||
| SECTIONAL SAMPLES 12 mm | ||||||||||
| I P | D-YD-C | 5.69 | 7.94 | 8.55 | 5.9 | 7.63 | 8.86 | 0.21 | −0.31 | 0.31 |
| XA-XB | 5.38 | 7.32 | 5.4 | 7.7 | 0.02 | 0 | 0.38 | |||
| A-YA-B | 4.6 | 6.08 | 5.9 | 4.58 | 5.65 | 6.09 | −0.02 | −0.43 | 0.19 | |
| I FP | D-YD-C | 5.08 | 4.95 | 7.47 | 5.78 | 5.33 | 8.74 | 0.7 | 0.38 | 1.27 |
| XA-XB | 6.47 | 7.94 | 6.91 | 9.2 | 0.44 | 0 | 1.26 | |||
| A-YA-B | 7.68 | 6.17 | 8.08 | 8.1 | 6.6 | 9.09 | 0.42 | 0.43 | 1.01 | |
| II P | D-YD-C | 4.72 | 7.29 | 5.54 | 4.75 | 7.34 | 6.06 | 0.03 | 0.05 | 0.52 |
| XA-XB | 5.71 | 4.66 | 5.36 | 5.06 | −0.35 | 0 | 0.4 | |||
| A-YA-B | 6.53 | 6.6 | 4.04 | 6.28 | 6.49 | 4.17 | −0.25 | −0.11 | 0.13 | |
| II FP | D-YD-C | 6.13 | 6.29 | 8.5 | 6.31 | 6.42 | 8.8 | 0.18 | 0.13 | 0.3 |
| XA-XB | 5 | 7.62 | 6.04 | 8.09 | 1.04 | 0 | 0.47 | |||
| A-YA-B | 5.54 | 5.06 | 6.38 | 5.81 | 5.16 | 6.66 | 0.27 | 0.1 | 0.28 | |
| III P | D-YD-C | 7.8 | 8.31 | 6.32 | 8.1 | 8.33 | 6.55 | 0.3 | 0.02 | 0.23 |
| XA-XB | 9.76 | 6.96 | 9.67 | 7.22 | −0.09 | 0 | 0.26 | |||
| A-YA-B | 10.41 | 11.82 | 7.79 | 10.56 | 10.75 | 8.11 | 0.15 | −1.07 | 0.32 | |
| III FP | D-YD-C | 5.25 | 5.86 | 7.23 | 5.46 | 5.75 | 6.85 | 0.21 | −0.11 | −0.38 |
| XA-XB | 5.29 | 6.39 | 5.83 | 6.25 | 0.54 | 0 | −0.14 | |||
| A-YA-B | 5.2 | 4.95 | 5.26 | 5.98 | 5.32 | 5.74 | 0.78 | 0.37 | 0.48 | |
| SECTIONAL SAMPLES 27 mm | ||||||||||
| A3 (3P) | D-YD-C | 8.23 | 9.43 | 10.02 | 8.35 | 9.45 | 10.12 | 0.12 | 0.02 | 0.1 |
| XA-XB | 8.24 | 9.46 | 8.3 | 9.62 | 0.06 | 0 | 0.16 | |||
| A-YA-B | 7.92 | 8.69 | 8.56 | 8.03 | 8.75 | 8.71 | 0.11 | 0.06 | 0.15 | |
| A4 (4P) | D-YD-C | 8.34 | 8.64 | 8.97 | 8.32 | 8.53 | 8.94 | −0.02 | −0.11 | −0.03 |
| XA-XB | 8.13 | 8.75 | 8.25 | 8.79 | 0.12 | 0 | 0.04 | |||
| A-YA-B | 8.3 | 8.64 | 8.29 | 8.3 | 8.64 | 8.33 | 0 | 0 | 0.04 | |
| Code Sample | Before Treatment | After Immersion | The Difference between Points on the Horizontal Axis Δμ = l after immersion − l before immersion | |||||||
|---|---|---|---|---|---|---|---|---|---|---|
| Solvent | Axis of Determination | Points on the Axis | ||||||||
| Acetone | D | YD | C | D1 | YD1 | C1 | ||||
| SECTIONAL SAMPLES 12 mm | ||||||||||
| I P | D-YD-C | 6.75 | 7.41 | 7.31 | 9.23 | 7.1 | 7.2 | 2.48 | −0.31 | −0.11 |
| XA-XB | 7.39 | 7.24 | 8.88 | 8.84 | 1.49 | 0 | 1.6 | |||
| A-YA-B | 7.98 | 7.75 | 7.08 | 8.86 | 6.45 | 7.98 | 0.88 | −1.3 | 0.9 | |
| I FP | D-YD-C | 6.06 | 6.21 | 9.6 | 6.29 | 5.98 | 9.27 | 0.23 | −0.23 | −0.33 |
| XA-XB | 7.59 | 9.74 | 7.73 | 9.73 | 0.14 | 0 | −0.01 | |||
| A-YA-B | 8.9 | 7.38 | 9.91 | 8.91 | 7.55 | 10.1 | 0.01 | 0.17 | 0.19 | |
| II P | D-YD-C | 5.2 | 7.79 | 6.7 | 6.74 | 5.92 | 8.87 | 1.54 | −1.87 | 2.17 |
| XA-XB | 5.87 | 5.95 | 6.48 | 8.62 | 0.61 | 0 | 2.67 | |||
| A-YA-B | 6.65 | 6.7 | 4.85 | 6.31 | 6.18 | 8.82 | −0.34 | −0.52 | 3.97 | |
| II FP | D-YD-C | 7.51 | 7.61 | 8.21 | 8.27 | 6.76 | 9.31 | 0.76 | −0.85 | 1.1 |
| XA-XB | 7.92 | 7.66 | 8.55 | 8.51 | 0.63 | 0 | 0.85 | |||
| A-YA-B | 8.18 | 7.02 | 6.99 | 9.89 | 5.75 | 7.55 | 1.71 | −1.27 | 0.56 | |
| III P | D-YD-C | 8.56 | 8.86 | 6.9 | 11.73 | 9.22 | 8.82 | 3.17 | 0.36 | 1.92 |
| XA-XB | 10.04 | 7.69 | 11.73 | 8.83 | 1.69 | 0 | 1.14 | |||
| A-YA-B | 11.2 | 11.39 | 8.49 | 11.74 | 9.14 | 8.61 | 0.54 | −2.25 | 0.12 | |
| III FP | D-YD-C | 6.38 | 5.51 | 6.22 | 6.54 | 5.15 | 6.5 | 0.16 | −0.36 | 0.28 |
| XA-XB | 7.52 | 6.41 | 7.42 | 6.56 | −0.1 | 0 | 0.15 | |||
| A-YA-B | 8.52 | 6.52 | 6.4 | 8.03 | 6.15 | 6.62 | −0.49 | −0.37 | 0.22 | |
| SECTIONAL SAMPLES 27 mm | ||||||||||
| A5 (5P) | D-YD-C | 8.36 | 8.45 | 8.92 | 8.92 | 9.17 | 9.46 | 0.56 | 0.72 | 0.54 |
| XA-XB | 8.36 | 8.84 | 8.95 | 9.7 | 0.59 | 0 | 0.86 | |||
| A-YA-B | 8.36 | 8.56 | 8.76 | 9.03 | 9.27 | 9.61 | 0.67 | 0.71 | 0.85 | |
| A6 (6P) | D-YD-C | 8.6 | 8.44 | 8.68 | 9.09 | 9.76 | 10.05 | 0.49 | 1.32 | 1.37 |
| XA-XB | 8.48 | 8.77 | 9.15 | 10.02 | 0.67 | 0 | 1.25 | |||
| A-YA-B | 8.4 | 8.49 | 8.92 | 9.14 | 9.78 | 9.98 | 0.74 | 1.29 | 1.06 | |
Disclaimer/Publisher’s Note: The statements, opinions and data contained in all publications are solely those of the individual author(s) and contributor(s) and not of MDPI and/or the editor(s). MDPI and/or the editor(s) disclaim responsibility for any injury to people or property resulting from any ideas, methods, instructions or products referred to in the content. |
© 2023 by the authors. Licensee MDPI, Basel, Switzerland. This article is an open access article distributed under the terms and conditions of the Creative Commons Attribution (CC BY) license (https://creativecommons.org/licenses/by/4.0/).
Share and Cite
Moraru-Avram, A.; Ionescu, C.Ș.; Lunguleasa, A. Effects of Solvents Used for Conservation/Restoration Treatments on Damaged Linden Panels of Cultural Heritage Assets. Appl. Sci. 2023, 13, 11148. https://doi.org/10.3390/app132011148
Moraru-Avram A, Ionescu CȘ, Lunguleasa A. Effects of Solvents Used for Conservation/Restoration Treatments on Damaged Linden Panels of Cultural Heritage Assets. Applied Sciences. 2023; 13(20):11148. https://doi.org/10.3390/app132011148
Chicago/Turabian StyleMoraru-Avram, Anamaria, Constantin Ștefan Ionescu, and Aurel Lunguleasa. 2023. "Effects of Solvents Used for Conservation/Restoration Treatments on Damaged Linden Panels of Cultural Heritage Assets" Applied Sciences 13, no. 20: 11148. https://doi.org/10.3390/app132011148
APA StyleMoraru-Avram, A., Ionescu, C. Ș., & Lunguleasa, A. (2023). Effects of Solvents Used for Conservation/Restoration Treatments on Damaged Linden Panels of Cultural Heritage Assets. Applied Sciences, 13(20), 11148. https://doi.org/10.3390/app132011148