Article

Machine Learning Algorithm Accuracy Using Single- versus Multi-Institutional Image Data in the Classification of Prostate MRI Lesions

1
Department of Biomedical Engineering, School of Engineering and Applied Science, George Washington University, Washington, DC 20052, USA
2
Department of Medicine, School of Medicine and Health Sciences, George Washington University, Washington, DC 20052, USA
*
Author to whom correspondence should be addressed.
Appl. Sci. 2023, 13(2), 1088; https://doi.org/10.3390/app13021088
Submission received: 21 December 2022 / Revised: 10 January 2023 / Accepted: 12 January 2023 / Published: 13 January 2023
(This article belongs to the Special Issue Applications of Radiomics and Deep Learning in Medical Image Analysis)

Abstract

:

Featured Application

The purpose of this study was to determine the efficacy of highly accurate ML classification algorithms trained on prostate image data from one institution and tested on image data from another institution.

Abstract

(1) Background: Recent studies report high accuracies when using machine learning (ML) algorithms to classify prostate cancer lesions on publicly available datasets. However, it is unknown if these trained models generalize well to data from different institutions. (2) Methods: This was a retrospective study using multi-parametric Magnetic Resonance Imaging (mpMRI) data from our institution (63 mpMRI lesions) and the ProstateX-2 challenge, a publicly available annotated image set (112 mpMRI lesions). Residual Neural Network (ResNet) algorithms were trained to classify lesions as high-risk (hrPCA) or low-risk/benign. Models were trained on (a) ProstateX-2 data, (b) local institutional data, and (c) combined ProstateX-2 and local data. The models were then tested on (a) ProstateX-2, (b) local and (c) combined ProstateX-2 and local data. (3) Results: Models trained on either local or ProstateX-2 image data had high Area Under the ROC Curve (AUC)s (0.82–0.98) in the classification of hrPCA when tested on their own respective populations. AUCs decreased significantly (0.23–0.50, p < 0.01) when models were tested on image data from the other institution. Models trained on image data from both institutions re-achieved high AUCs (0.83–0.99). (4) Conclusions: Accurate prostate cancer classification models trained on single-institutional image data performed poorly when tested on outside-institutional image data. Heterogeneous multi-institutional training image data will likely be required to achieve broadly applicable mpMRI models.

1. Introduction

Over the last decade, there have been significant advancements in multi-parametric prostate MRI (mpMRI) [1,2] and machine learning (ML) applications in mpMRI [3,4,5]. While mpMRI has high sensitivity and specificity for the detection of prostate cancer, accurate discrimination between high-risk prostate cancer (hrPCA, defined as Gleason grade ≥4 + 3 in this study and others [6,7]) and low-grade/benign prostate lesions remains challenging and is paramount for clinical management [8,9]. Methods to distinguish hrPCA from low-grade/benign PCA are important as low-grade/benign prostate lesions can be managed with active surveillance instead of invasive treatment. Many recent publications report highly accurate machine learning algorithms for the classification of prostate lesions on MRI that appear to successfully address this diagnostic obstacle, with areas under the receiver operating characteristic curve (AUCs) of 80–98% [10].
Recently, a consortium of the American Association of Physicists in Medicine (AAPM), the SPIE (the International Society for Optics and Photonics), and the National Cancer Institute (NCI) conducted ProstateX and ProstateX-2 Challenges [11]. They published publicly available image datasets of annotated mpMRI lesions (as identified by radiologist) and their subsequent MRI-guided biopsy results [12], asking challenge participants to classify lesions as hrPCA or “benign” and to predict the lesion Gleason grade. Top-trained algorithms (models) developed using the challenge image data also reached accuracies of >90% in the classification of hrPCA versus “benign” lesions [11,13,14].
While ProstateX and other mpMRI ML results appear promising, caution is warranted as the majority of these studies are single-institutional studies, often using a single MRI scanner manufacturer [15,16,17]. A systematic review of ML algorithms in mpMRI noted the paucity of multi-institutional studies [18]. The need for multi-institutionally trained models using heterogeneous image data is being recognized [19,20], spurring the development of the field of federated learning [21]. The purpose of this study was to determine the efficacy of highly accurate ML classification models trained on prostate image data from one institution and tested on image data from another institution. The highly accurate model used was a subset of a machine learning algorithm called a convolutional neural network: the Residual Neural Network (ResNet). The broader impact of single- and multi-institutional training data on model performance was also assessed.
This study tested the effects of single- and multi-institutional studies by training a series of models to classify high risk Prostate Cancer (hrPCA) on the open-source ProstateX-2 dataset, local institutional dataset, and combined dataset including data from both. Models were then tested on corresponding data from each of the three subsets and compared to one another through statistical testing. Sub-analysis was performed on the PZ and TZ regions of the prostate. Finally, the results were analyzed and discussed in the broader context of the need for heterogeneous datasets.
The results of this study serve to identify the need for heterogeneous or multi-institutional training datasets for broadly applicable clinical models. Additionally, this study draws attention to an important concern, which is the potential lack of generalizability of models trained on single-institutional or homogeneous datasets.

2. Materials and Methods

2.1. ProstateX-2 Patient Population

The ProstateX-2 Challenge was a subset of the ProstateX challenge [22], conducted by the American Association of Physicists in Medicine (AAPM), the SPIE (the International Society for Optics and Photonics), and the National Cancer Institute (NCI), to develop machine learning algorithms that could predict the Gleason Grade (GG) of prostate lesions identified by radiologists on multi-parametric Magnetic Resonance Imaging (mpMRI) exams. The patient cohort originated from a single institution (Radboud University Medical Centre (Nijmegen, The Netherlands)) in 2012. The magnetic resonance images (MRIs) were read or supervised by a radiologist with 20 years of experience using the Prostate Imaging Reporting and Data System (PIRADS) version 1. Lesions with a PIRADS score ≥3 underwent MRI-guided biopsy, yielding 112 MRI lesions for this study. The Gleason grade of these lesions and zonal distribution are summarized in Table 1. The ProstateX-2 subset of patients was used from the ProstateX dataset due to the availability of their Gleason grade.

2.2. ProstateX-2 MR Imaging and Image Data

The ProstateX-2 data was obtained from the Cancer Imaging Archive (TCIA) [22,23], and included MR images, lesion centroid coordinates, and MR-guided biopsy Gleason scores (GS). The PIRADS scores of these lesions were not included in the dataset. MRI exams were performed on two Siemens 3T MR scanners (Magnetom Trio and Skyra, Siemens, Munich, Germany) without an endorectal coil. Image data included: (a) small field-of-view (FOV) axial T2 (Transverse Relaxation Time) turbo spin-echo sequence with 0.5 mm resolution and 3.6 mm slice thickness; and (b) single-shot echo-planar diffusion-weighted imaging (DWI) with 2 × 2 × 3.6 mm resolution, and b-values of 50, 400, 800 s/mm2; the Apparent Diffusion Coefficient (ADC) map was calculated by the scanner software. Additional multiplanar T2 and dynamic contrast-enhanced sequences were included in the dataset but were not used in this study. The three-dimensional centroid Digital Imaging and Communications in Medicine (DICOM) coordinates of the prostate lesions were provided for lesion localization. The axial T2 and ADC map image containing the centroid of the lesion were utilized in this study.

2.3. Local Institutional Patient Population

This was a HIPAA-compliant, IRB-approved retrospective study. The electronic medical records (EMR) were used to identify patients with prostatectomy and pre-operative prostate MR imaging between 2016–2020; 153 such patients were identified. These patients had MRIs that were interpreted by one of two abdominal radiologists (with 4 and 7 years of experience) using PIRADS version 2 criteria at the time of acquisition; PIRADS scores from the original MRI report were used in this study.
Since whole-mount pathology–radiology correlation was unavailable at our institution, MRI exams, pre-surgical MR–US fusion-guided biopsy results, and final prostatectomy surgical pathology results were retrospectively reviewed by a single radiologist (SHM) to determine if the index cancer (defined as the dominant cancerous lesion with the highest GS in the gland) from the pathology report could be clearly localized and correlated with a reported MRI lesion. MRI lesions were only enrolled into the study if: (a) pre-surgical targeted MR–US fusion-guided biopsy of the lesion confirmed the lesion as the index cancer in the gland with lower GS and/or benign pathology in the rest of the targeted and systematic biopsies; and (b) surgical pathology report noted the index cancer to be within 1 GS of the targeted biopsy (to allow for minor up- and down-grading) and within the same side and relative location of the gland (anterior, posterior, lateral, base, mid, apex). Patients were excluded if: (a) MR–US fusion-guided biopsy demonstrated (i) >1 targeted lesion with the index cancer GS, or (ii) the presence of the index cancer GS in the systematic biopsy in areas non-adjacent to the MRI lesion; or (b) surgical pathology reported multi-focal or bilateral areas of prostate cancer with the index cancer GS. Only one MRI lesion correlating with the gland’s index cancer was enrolled from each prostate gland. These criteria lead to the identification of patients with a single or dominant ipsilateral lesion on MRI, with both biopsy and surgical pathology confirming the lesion and area as containing the index cancer, and the absence of other ipsilateral or contralateral lesions/areas with similar GS as the index cancer. Based on these stringent criteria, the index cancer of 41 of the 153 prostatectomy patients was confidently correlated with surgical pathology results and entered into this study. Tumor volume for the local dataset ranged from 0.00–82.90 cc (Mean 10.63 ± 15.31). The patient demographics and tumor GG and zonal distribution are summarized in Table 1.
The Gleason score and location of the index cancer, defined as the dominant cancerous lesion with the highest GS in the gland, was obtained from the surgical pathology report.
Given the low number of low-risk/benign MRI lesions in our prostatectomy cohort, additional “benign” lesions were sought to augment the image dataset. The EMR was used to identify patients with two PIRADS 2 MRI exams at least 2 years apart, to confirm benignity of the initial PIRADS 2 MRI. Three or four lesions were traced within each gland, on different sides, several slices from one another, in areas of low to intermediate T2 signal and minimal to no restricted diffusion. This produced 22 additional lesions (from seven patients with a mean interval of 2.9 years between the first and second PIRADS 2 MRI exams) to serve as “benign” pathology within our local institutional image dataset. There were 25 PIRADS 5, 14 PIRADS 4, 2 PIRADS 3, and 22 PIRADS 2 lesions in the final local institutional cohort.

2.4. Local Institutional MR Imaging and Image Data

The mpMRI performed at our institution was performed on a single 3T scanner (Siemens Skyra) without an endorectal coil. Our institutional protocol included (a) small FOV axial T2 turbo spin-echo sequence with 0.3 mm resolution and 3.0 mm slice thickness, and (b) single-shot echo-planar diffusion-weighted imaging (DWI) with 1.7 mm resolution and 3 mm slice thickness, and b-values of 50, 800 and 1400 s/mm2; the ADC map was calculated by the scanner software. Additional multiplanar T2 and dynamic contrast-enhanced sequences were performed but not used in this study. The axial T2 and ADC map images containing the largest cross-sectional area of the lesion were exported from the picture archiving and communication system (PACS) system in a 2-Dimensional (2D) lossless imaging format (.tiff). The perimeter of the index cancer of the 41 enrolled lesions was traced in the Picture Archiving and Communication System (PACS) on the axial T2 sequence by a single body-fellowship trained radiologist (SHM) with 7 years of prostate MRI experience; this data was also exported. The overview of this process is detailed in Figure S1.

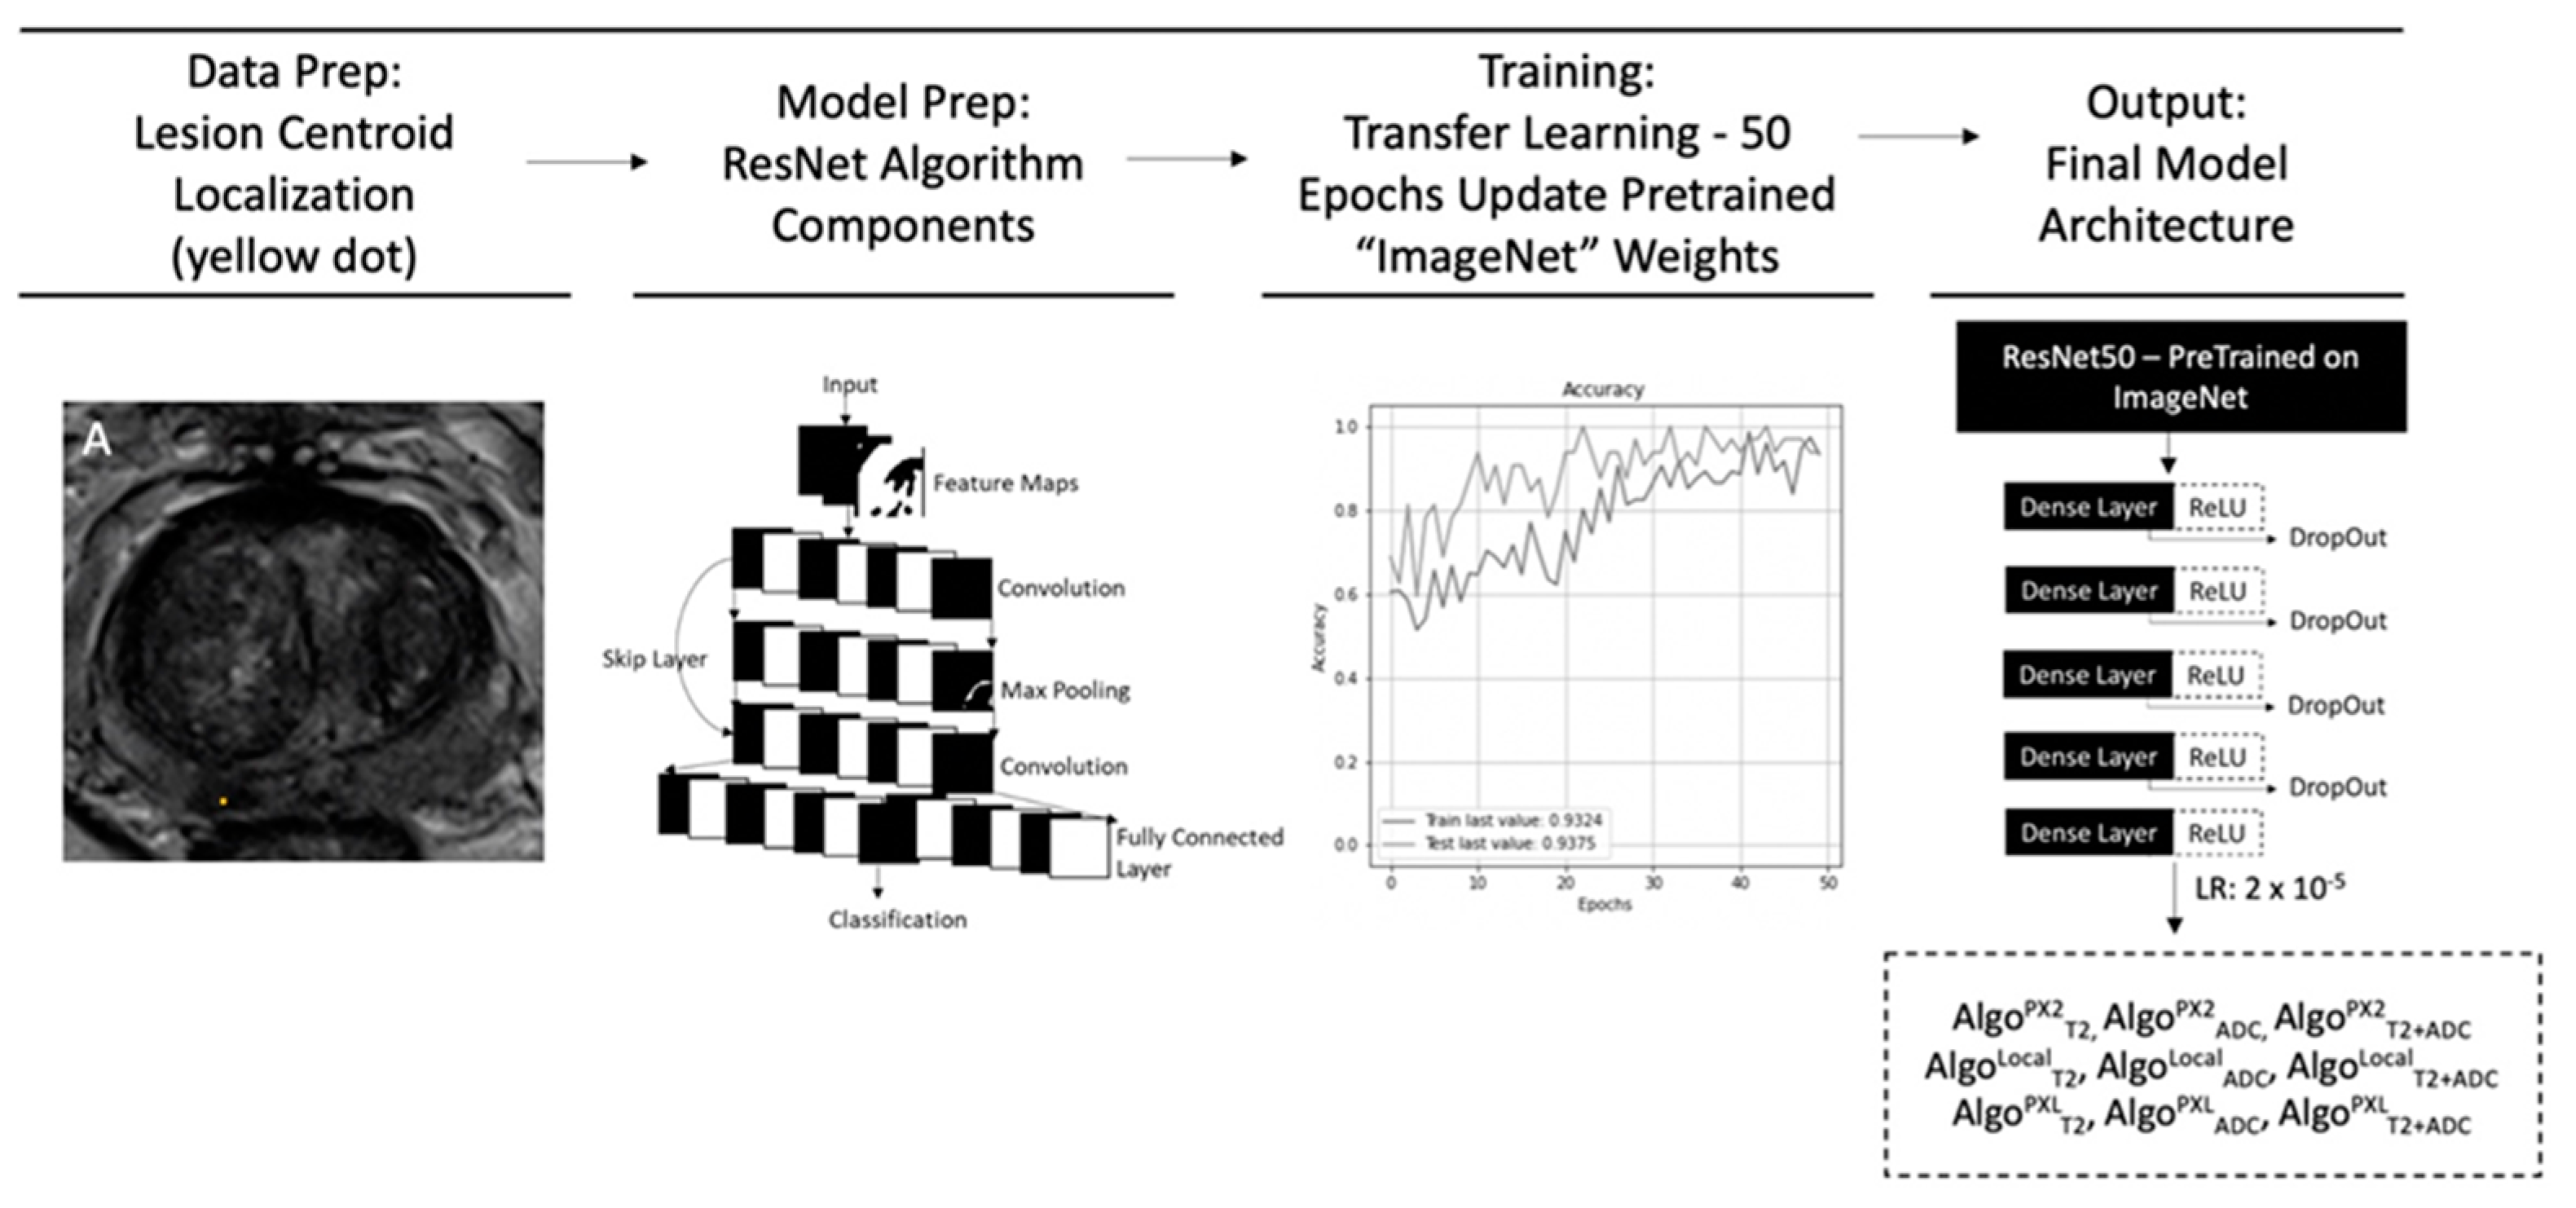
2.5. Image Preparation and Lesion Segmentation

The axial T2 and ADC map DICOM and corresponding .bmp images (from the ProstateX-2 dataset) and .tiff images (from our institution) were loaded into 512 × 512 Python pixel matrices. The default matrix size (512 × 512) for DICOM images that can be fed into the algorithm within TensorFlow was used to reduce the need to use resizing algorithms. The centroid of our institution’s lesions was calculated using the segmented T2 images in Python. The coordinates of the centroids of all lesions provided in the ProstateX metadata was used to identify the location of lesions in Python. Centroid identification of ProstateX lesions was confirmed prior to data processing through custom Python script and manual verification.

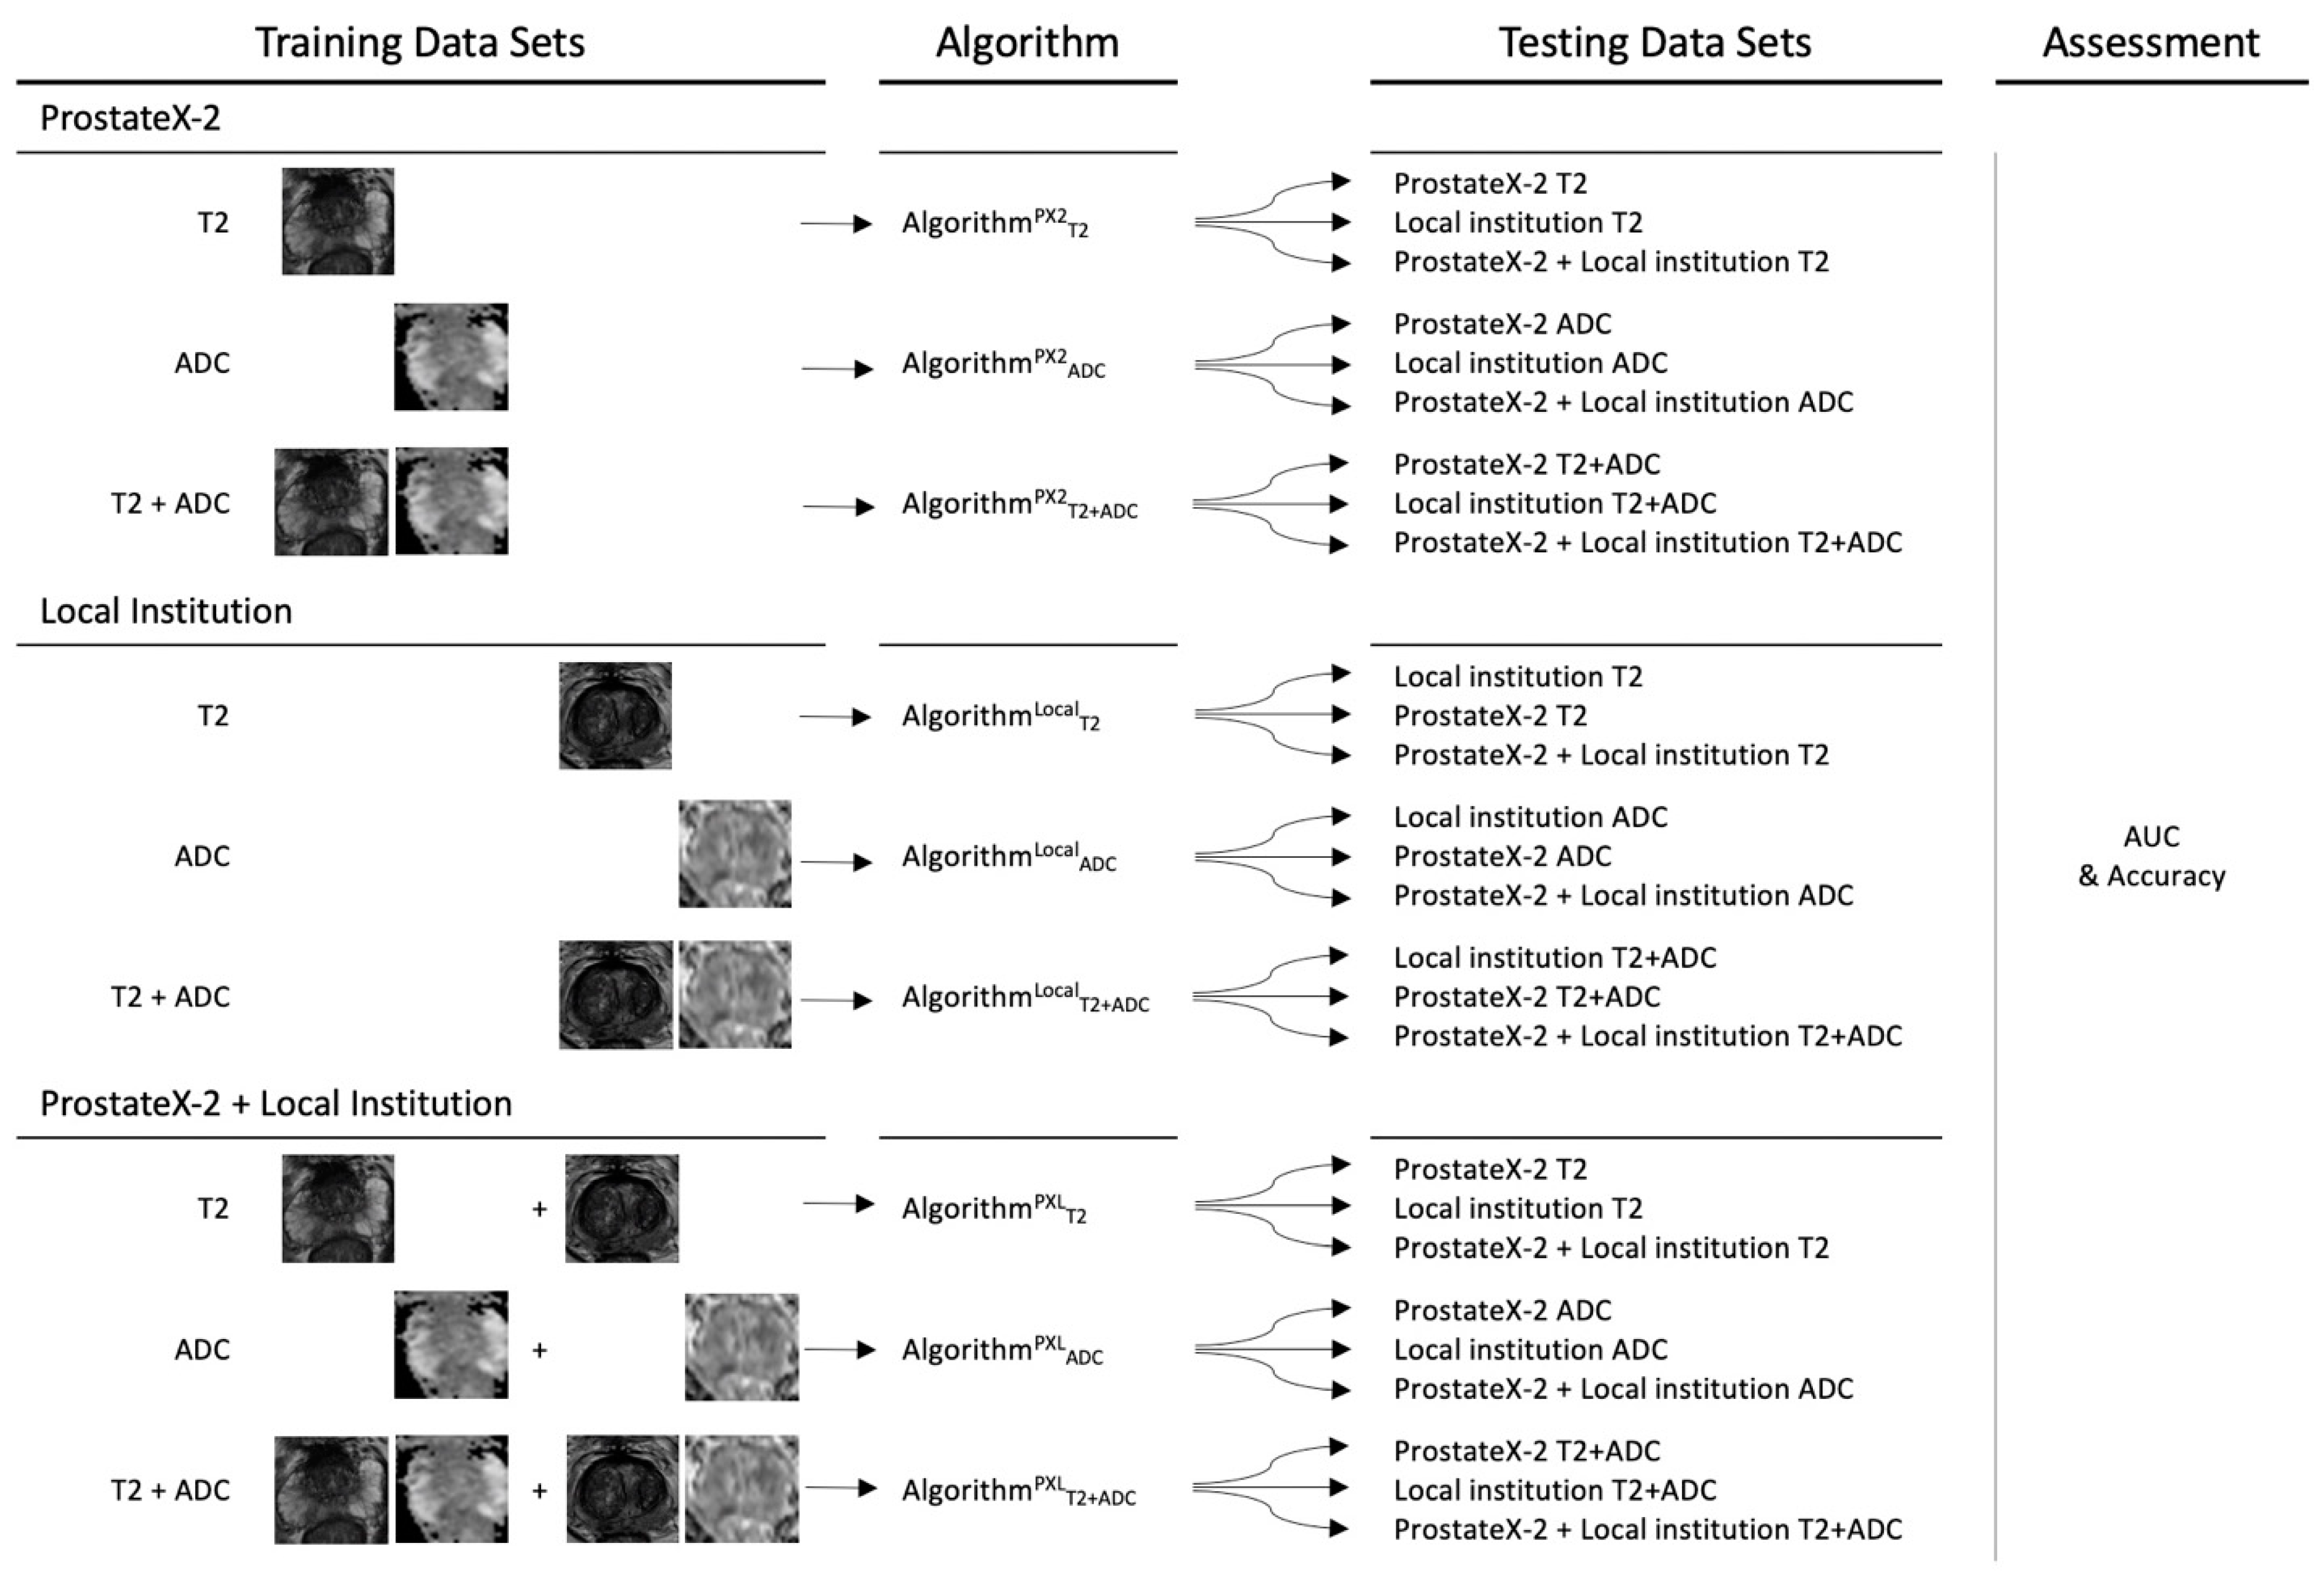
2.6. Convolutional Neural Network Training and Testing

A residual neural network (ResNet), a type of convolutional neural network (CNN), was used in this study. The ResNet model was selected after training and testing several other common ML frameworks due to its increased performance and speed. ResNets utilize “skip connections” between the blocks of convolutional, max-pooling, and fully connected layers that function to mute upstream layers within the neural network framework and amplify the subsequent downstream layers [24]. This functions to reduce the occurrence of vanishing gradients and accuracy saturation, and allow for faster, deeper models to be created with lower training error [24]. ResNet50 architecture from the TensorFlow Python package was used to implement the ResNet model [25]. A transfer learning process, which allows for a pretrained network with weights from another dataset to quickly and more accurately build new models, was used with initial weights created from the 14-million-image “ImageNet” dataset [26]. The top layer of the ImageNet model network was removed, and additional dense and dropout layers were added to yield a total of 269,224,449 trainable parameters out of 292,812,161 parameters. Model layers were activated using the Rectified Linear Unit (ReLU) activation function. A learning rate, which controls how much each model weight can be changed during each training epoch, of 2 × 10⁻⁵ was applied. The algorithm was trained for 50 epochs (one epoch is one pass through all of the data.) The ResNet algorithm architecture and parameters are summarized in Figure 1 and Tables S1 and S2. All equations used for training and validation are detailed in Table S3.
Algorithms were trained and tested first for 50 epochs to find the frameworks that best fit the data. Each trained model was then validated using 5-fold cross-validation, where an 80% sample of the data was used to train the model and the remaining 20% was used to test the model across 5 different folds. The algorithms were trained to classify prostate MRI lesions as hrPCA or low-risk/benign. hrPCA was defined as a Gleason score of greater than or equal to 4 + 3 (Gleason Grade 3). Algorithms were trained on: (a) ProstateX-2 image data alone; (b) local institutional image data alone; and (c) combined ProstateX-2 and local institutional image data using (i) T2, (ii) ADC map, and (iii) combined T2 and ADC map images. This process yielded nine trained models: modelPX2T2, modelPX2ADC, modelT2+ADC, modelLocalT2, modelLocalADC, modelLocalT2+ADC and modelPXLT2, modelPXLADC, and modelPXLT2+ADC. The nine trained models were then tested on (a) ProstateX-2; (b) local institutional; and (c) combined ProstateX-2 and local institutional image data using (i) T2, (ii) ADC, and (iii) combined T2 and ADC map images. The combination of algorithm training and testing sets are summarized in Figure 2. The total numbers of patients included in each model are listed in Table 2. Mean accuracy and areas under the receiver operating characteristic curve (AUCs) were calculated across five (cross-validated) runs. Algorithm parameters and performance are reported in accordance with the CLAIM checklist criteria [27].
The statistical significance of the results of the trained models were also evaluated. “Randomization” or “shuffle” testing was performed, where the labels on the training data are shuffled and passed through the modeling process 100 times to determine if any randomly shuffled dataset could achieve the same results as the final model. A p < 0.01 was considered significant, indicating that no shuffled runs achieved the same accuracy and AUC as the final reported result.
The statistical significance of the differences in the performance of the models was also tested using a 2-tailed t-test. The AUCs and accuracies of models trained and tested on image data from the same institution(s) were compared to those trained at one institution(s) and tested on image data from different institution(s), e.g., modelPX2T2 trained and tested on ProstateX image data was compared to modelPX2T2 trained on ProstateX image data and tested on combined ProstateX and local institutional image data. p-values < 0.01 were deemed significant.
Sub-analysis of model performance was also tested as above using lesions from only the peripheral (PZ) or transitional zones (TZ) across institutions, with similar statistical t-testing for differences in performance of the trained models.

3. Results

3.1. Model Results for Classification of hrPCA on PX2, Local, and PXL Data

Initial randomization testing of all nine models confirmed that model AUC and accuracy results were not the product of chance (p < 0.01). Using T2 image data alone, modelPX2T2 had an AUC of 0.93 when tested on ProstateX-2 image data; its AUC dropped significantly to 0.49 when tested on the local institutional image data (p < 0.01). Similarly, modelLocalT2 had an AUC of 0.96 when trained and tested on local T2 image data; its AUC dropped to 0.50 when tested on ProstateX-2 T2 image data (p < 0.01). These results and corresponding model accuracies are summarized in Table 3. Standard deviations for each cross-validated model run are available in Supplementary Table S4.
Using ADC map image data alone, modelPX2ADC and modelLocalADC had AUCs of 0.91 and 0.82, respectively, when tested on image data from their respective institutions. Their AUCs decreased (0.23–0.49) significantly when tested on the other institution’s image data (p < 0.01). Using both T2 and ADC map image data, modelPX2T2+ADC and modelLocal T2 + ADC had AUCs of 0.95 and 0.98, respectively, when tested on image data from their respective institutions. Their AUCs also decreased (0.41–0.46) significantly when tested on the other institution’s image data (p < 0.01).
ModelPXLT2, representing the multi-institutionally trained model, had an AUC of 0.83 when tested on T2 image data from both institutions, and higher AUCs (0.92–0.96) when tested on single-institution image data (p < 0.01). ModelPXLADC and modelPXLT2 + ADC had even higher AUCs (0.96–0.98) when tested on multi-institutional image data using ADC and combined T2 and ADC sequences; their performance slightly decreased (0.85–0.99) when tested on single-institution image data.
The single-institutionally trained and tested models (modelPX2 and modelLocal) tended to have higher AUCs when using T2 images compared with ADC map images; the use of combined T2 and ADC map images did not improve the performance of these models. The multi-institutionally trained model (modelPXL) had a higher AUC using ADC map images compared with T2 (0.98 vs. 0.83) when testing on multi-institutional image data; the use of combined T2 and ADC map images did not improve its performance.

3.2. Sub-Analysis Results on PZ or TZ Lesions

Further sub-analysis of model AUCs was performed using lesions from only the PZ or TZ, with a similar pattern of results as above. ModelPX2 and modelLocal had high AUCs (0.81–0.99) when tested on image data from their respective institutions using only PZ or TZ lesions; their AUCs decreased when tested on data from the other institution (0.23–0.61). ModelPXL had comparable AUCs when tested on multi- or single-institutional image data using only PZ or TZ lesions; nonetheless, some small but statistically significant differences were noted. These results are summarized in Table 4. Standard deviations for each cross-validated model run are available in Supplementary Table S5. Assessment of differences in model performance based on lesion zonal was deferred given the purpose of this study.

4. Discussion

ModelPX2 had high accuracies and AUCs (88–91% and 0.91–0.95) when trained and tested on image data from the ProstateX-2 Challenge, similar to published results in the challenge (AUCs of 0.81–0.84) [28,29,30,31]) and in a subsequent study (AUC of 0.91) [18]). ModelLocal, which was trained on image data from our institution, had similarly high AUCs (0.82–0.98) when tested on local image data. While these results appear very promising and highly diagnostic, they should be regarded with reservation. The AUCs of these models decreased significantly (0.23–0.50) when trained on image data from one institution and tested on image data from the other institution. A similar pattern was also demonstrated when model performance was assessed using lesions only from the peripheral or transitional zones (PZ: 0.91–0.44, TZ: 0.93–0.61). Homogeneous image data used in the training of models can result in “overfitting”, where the model is finely customized to the training data and cannot be generalized to “new” data [32,33,34].
Homogeneity in training image datasets can be a function of MRI institutional protocols and parameters. In this study, both institutions used 3T MRI scanners from the same vendor without an endorectal coil. ProstateX images were obtained on Siemens 3T Skyra and Trio scanners; images at our institution were obtained on a Siemens 3T Skyra. There were differences in the image resolution and slice thicknesses (3.6 mm vs. 3 mm) and in the b-values used in the construction of the ADC map (50/400 vs. 50/800). Buch et al. demonstrated quantitative variations in texture analysis features based on sequence parameters in a phantom model [35]. Small differences in sequence parameters, receiver coils, body habitus, and local magnetic fields, can result in slightly different image quality, signal, and contrast-to-noise ratios.
MRI signal intensity values also vary within and across institutions l. MR signal intensity is not correlated with an absolute standard reference, and is dependent on MR hardware, tissue characteristics, pulse sequence, method of k-space filling, etc. Standardization of MRI signal intensity scales may be able to further minimize multi-scanner and multi-institutional image differences, but this has been an ongoing challenge [36]. Signal intensity normalization techniques have been shown to impact prostate cancer radiomics [37]. Sunoqrot et al. also reported improved prostate MRI lesion classification (as benign or malignant) in multi-institutional image data following an automated T2-weighted image normalization using both fat and muscle [38]. This MR signal-intensity normalization was not performed in this study given the already high performance of the models.
Many of the published machine learning studies with highly accurate models are based on single-institution/single-scanner or single-institution/multi-scanner studies. One systematic review on the performance of machine learning applications in the classification of hrPCA found that 66% (18/27) of studies were performed at a single institution on a single scanner [39]. In this same study, 4/27 studies were performed on more than one scanner from the same vendor, 2/27 were performed on scanners by two vendors, and only one study used multi-institutional image data. Another meta-analysis of 12 studies using machine learning for the identification of hrPCA similarly showed that all studies originated from a single institution or image data repository (the Cancer Imaging Archive) [40]. The large majority of the machine learning prostate MRI papers cited in this paper used Siemens 3T scanner systems. Given our results, it is likely that the accuracy of these models would decrease if tested on image data from a different scanner; further training and testing of these models on image data from other scanners would likely be required.
Homogeneity in training image datasets will also be a function of patient population cohorts, including race, gender, and disease prevalence. It is well-recognized that the performance of a medical diagnostic test can vary in a subgroup of patients according to the severity and clinical presentation of the disease (spectrum effect) [41,42]. As such, homogeneous patient racial, gender, socioeconomic status (which are known to impact disease prevalence) within training sets will also impact the broader performance of these models. The local institutional patient population consisted of approximately 40% African Americans; African Americans have a higher incidence of prostate cancer and present with more advanced disease [43]. While the ProstateX dataset did not include patient racial demographics, it is unlikely that the Dutch medical center had such a patient cohort. Racial bias within medical models is recognized [44], with various medicolegal avenues for mitigation [45].
All these factors have led to the development of the field of federated machine learning, which provides the computing architecture for the construction of multi-institutional models using de-centralized and de-identified patient data [46]. Federated learning in medical algorithms is in its early stages and requires additional inter-institutional computing infrastructure or use of commercial platforms [47,48,49]. Despite the multitude of differences between the two institutional image datasets in our study, the multi-institutionally trained modelPXL regained high AUCs (0.83–0.96) when it was trained and tested on image datasets from both institutions. In effect, the algorithm was able to “learn” around the differences between the two image datasets and classify lesions with high accuracy.
The multi-institutionally trained models (modelPXL) maintained relatively high AUCs (0.85–0.99) when tested on single-institutional image data, although there were statistically significant differences in performance between multi- and single-institutional testing sets (p < 0.01). ModelPXLT2 had higher AUCs when tested on single-institution image data compared to multi-institutional data (0.92–0.83). ModelPXLADC had higher AUCs when tested on multi-institutional image data compared with single-institutional data (0.98–0.85). Additionally, it is important to note these increases in performance occurred with only a small amount of additional data (50 Local lesions added to the 89 PX2 lesions), which showcases that even a small proportion of heterogeneous training data serves to make a model more generalizable. These findings also have important implications for federated learning: it suggests that training on heterogeneous multi-institutional image data may have associated cost or benefits for model performance when tested on single-institution image data. A few published studies using algorithms with federated learning models have outperformed local institutional algorithms in prostate segmentation [21,50]. These results do not aim to limit the development of models on one or two datasets; however, they hope to encourage consideration for the heterogeneity and patient population when applying clinical models.
Additionally, the models had high predictive accuracy when using a single sequence, regardless of whether it was the T2 or ADC map alone. The single-institutionally trained models’ AUCs were slightly higher when using the T2 sequence compared with the ADC map, which could be a function of its higher resolution (0.93–0.96 vs. 0.91–0.82). There were minimal to no gains in performance when both sequences were used and integrated by the algorithm, suggesting that a single sequence may be sufficient. While most prostate ML studies have used both T2 and ADC images in some manner, their optimized independent or integrated utilization in prostate ML has yet to be determined. The mpMRI consists of multiple sequences in multiple planes; there would be significant time and cost savings if MR exams could be shortened to fewer sequences with such models.
There are several limitations to this study given some differences between the datasets obtained from the two institutions. The Gleason score of the ProstateX-2 lesions came from MRI-guided in-bore biopsy, while the local institutional GS came from surgical pathology of prostatectomy specimens. MRI-guided biopsy was unavailable at our institution, and lesions initially underwent MR–US fusion-guided biopsy. Given the risk of tumor under-sampling and Gleason under-scoring with US-fusion biopsies, we used prostatectomy specimens to obtain the “ground truth.” While a MRI-guided in-bore biopsy overcomes many of the shortcomings of a MR–US fusion-guided biopsy and is recognized as being superior to US-guided-MRI fusion biopsy [51], it nevertheless has the potential risk of under-sampling.
Another limitation is that the sample size of both the original publicly available dataset and our local dataset are small. Ideally, thousands of scans, if not every scan potentially available at the time, would be used to train the model. However, due to practical limitations, the cohort was limited by the scan availability of each institution.
The Gleason score of the prostatic lesions were also assigned by different pathologists at different institutions. While each Gleason score has defined features, some inter-observer variability and subjectivity is recognized in the pathology literature [52]. This study defined hrPCA as GS ≥ 4 + 3, similar to other major studies [6,7], in order to identify patients who would definitively benefit from treatment; however, other studies have defined clinically significant prostate cancer as GS ≥ 3 + 4 [53].
By using prostatectomy patients, the local institutional cohort had a higher initial incidence of hrPCA and likely had more skew towards higher PIRADS lesions; the PX2 dataset consisted of lesions ≥ PIRADS 3, but lesion-specific PIRADS scores were not included in the dataset. PIRADS 2 pseudo-lesions were introduced into the local cohort to augment the low-risk/benign subset of lesions in this group. Such truly benign lesions were unlikely to be within the ProstateX-2 image dataset and modelPX2 was not trained on them, which also likely impacted modelPX2′s performance on local institutional image data (T2 AUC 0.44). ProstateX-2 lesions were identified by a radiologist using PIRADS version 1, while local institutional lesions were identified using PIRADS version 2.0. ProstateX-2 lesions consisted of 3.6 mm thick T2 sequences, while the local institutional exams had 3 mm thick T2 slices. The ratio of peripheral to transitional zone tumors at the two institutions could not be balanced, although sub-analysis was performed and demonstrated similar results when compared to the full cohort analysis.
While these differences between the two institutional groups also likely had an impact on the results, these differences will also be encountered by other single-institutionally trained models in the future should they be applied to multi-institutional image data. PIRADS scoring criteria should be revised and models trained on PIRADS versions 2 and 2.1 may be applied to image data interpreted using the future version 3. The distribution of PIRADS lesions differs across radiologists [54] and the positive predictive value of PIRADS scores vary across institutions [55]. The incidence of hrPCA also differs geographically across different populations [56,57].
These results are not only important for the classification of hrPCA but also for the broader context of machine learning for clinical medicine. Machine learning has been applied to many other problems in medicine [58,59]. The use of heterogeneous training data is important to improve the generalizability and utility for these clinical models.

5. Conclusions

Accurate prostate cancer classification algorithms that were trained on single-institutional image data performed poorly when tested on outside-institutional image data; they required training on both image datasets to re-achieve high accuracy. While recent publications have reported high-performing ML models for the classification of hrPCA, most utilize models trained on “homogeneous” single-institution-trained image data. This study has demonstrated that generalizable models require heterogeneous and ideally multi-institutional datasets. Heterogeneous multi-institutional training image data, perhaps through a federated learning system, will likely be required to achieve broadly applicable models. Future work for the classification of hrPCA from prostate MRIs should focus on the use of heterogeneous training data to create and validate new models.

Supplementary Materials

The following supporting information can be downloaded at: https://www.mdpi.com/article/10.3390/app13021088/s1, Figure S1: Overview of prostate cancer screening and Radiologist evaluation methodology on the local dataset; Table S1: Overview of total parameters and description of model layers for the model developed on ProstateX-2 using transfer learning on the ResNet model with Imagenet weights from the TensorFlow applications package. The ReLU activation function was used for each layer with a binary cross-entropy loss function. The “optimizers RMSprop” optimizer was used with a learning rate of 2 × 10⁻⁵; Table S2: Overview of code used to create algorithms for each training set; Table S3: Overview of equations used within the ResNet model and validation tests; Table S4: Table 3 including Standard Deviations; Table S5: Standard Deviations for Table 4.

Author Contributions

Conceptualization, S.H.-M., M.W. (Michael Whalen), M.L. and D.P.; methodology, S.H.-M., M.W. (Michael Whalen), M.L. and D.P.; software, D.P.; validation, D.P., O.M., M.W. (Michael Whalen), Y.J.R., M.L. and S.H.-M.; formal analysis, S.H.-M., M.L. and D.P.; investigation, S.H.-M., M.W. (Michael Whalen), M.L. and D.P.; resources, D.P., O.M., D.I., B.M., D.N., M.W. (Michael Wynne), M.W. (Michael Whalen), Y.J.R., M.L. and S.H.-M.; data curation, D.P., O.M., D.I., B.M., D.N., M.W. (Michael Wynne), M.W. (Michael Whalen), Y.J.R., M.L. and S.H.-M.; writing—original draft preparation, D.P.; writing—review and editing, D.P., O.M., D.I., B.M., D.N., M.W. (Michael Wynne), M.W. (Michael Whalen), Y.J.R., M.L. and S.H.-M.; visualization, D.P.; supervision, M.W. (Michael Whalen), S.H.-M. and M.L.; project administration, M.W. (Michael Whalen), S.H.-M. and M.L. All authors have read and agreed to the published version of the manuscript.

Funding

This research received no external funding.

Institutional Review Board Statement

The study was conducted in accordance with the Declaration of Helsinki, and approved by the Institutional Review Board (or Ethics Committee) of George Washington University (IRB NCR-191470).

Informed Consent Statement

Informed consent was obtained from all subjects involved in the study, except for the images listed in the publicly available ProstateX SPIE Challenge database for which this was not applicable.

Data Availability Statement

The data presented in this study for training of the algorithms are openly available and downloadable from the TCIA ProstateX SPIE Challenge website. https://doi.org/10.7937/K9TCIA.2017.MURS5CL (accessed on 1 June 2022).

Conflicts of Interest

The authors declare no conflict of interest.

References

  1. Bouchelouche, K.; Turkbey, B.; Choyke, P.L. Advances in imaging modalities in prostate cancer. Curr. Opin. Oncol. 2015, 27, 224–231. [Google Scholar] [CrossRef] [PubMed]
  2. Weinreb, J.C.; Barentsz, J.O.; Choyke, P.L.; Cornud, F.; Haider, M.A.; Macura, K.J.; Margolis, D.; Schnall, M.D.; Shtern, F.; Tempany, C.M.; et al. PI-RADS Prostate Imaging-Reporting and Data System: 2015, Version 2. Eur. Urol. 2016, 69, 16–40. [Google Scholar] [CrossRef]
  3. Litjens, G.; Debats, O.; Barentsz, J.; Karssemeijer, N.; Huisman, H. Computer-aided detection of prostate cancer in MRI. IEEE Trans. Med. Imaging 2014, 33, 1083–1092. [Google Scholar] [CrossRef] [PubMed]
  4. Mata, L.A.; Retamero, J.A.; Gupta, R.T.; Garcia Figueras, R.; Luna, A. Artificial Intelligence-assisted Prostate Cancer Diagnosis, Radiologic-Pathologic Correlation. Radiographics 2021, 41, 1676–1697. [Google Scholar] [CrossRef] [PubMed]
  5. Li, H.; Lee, C.; Chia, D.; Lin, Z.; Huang, W.; Tan, C. Machine Learning in Prostate MRI for Prostate Cancer. Curr. Status Future Oppor. 2022, 12, 289. [Google Scholar]
  6. Ahmed, H.U.; El-Shater Bosaily, A.; Brown, L.C.; Gabe, R.; Kaplan, R.; Parmar, M.K.; Collaco-Moraes, Y.; Ward, K.; Hindley, R.G.; Freeman, A.; et al. Diagnostic accuracy of multi-parametric MRI and TRUS biopsy in prostate cancer (PROMIS), a paired validating confirmatory study. Lancet 2017, 389, 815–822. [Google Scholar] [CrossRef] [Green Version]
  7. Siddiqui, M.M.; Rais-Bahrami, S.; Turkbey, B.; George, A.K.; Rothwax, J.; Shakir, N.; Okoro, C.; Raskolnikov, D.; Parnes, H.L.; Linehan, W.M.; et al. Comparison of MR/ultrasound fusion-guided biopsy with ultrasound-guided biopsy for the diagnosis of prostate cancer. JAMA 2015, 313, 390–397. [Google Scholar] [CrossRef] [Green Version]
  8. Wilt, T.J.; Jones, K.M.; Barry, M.J.; Andriole, G.L.; Culkin, D.; Wheeler, T.; Aronson, W.J.; Brawer, M.K. Follow-up of Prostatectomy versus Observation for Early Prostate Cancer. N. Engl. J. Med. 2017, 377, 132–142. [Google Scholar] [CrossRef]
  9. Hamdy, F.C.; Donovan, J.L.; Lane, J.; Mason, M.; Metcalfe, C.; Holding, P.; Davis, M.; Peters, T.J.; Turner, E.L.; Martin, R.M.; et al. 10-Year Outcomes after Monitoring, Surgery, or Radiotherapy for Localized Prostate Cancer. N. Engl. J. Med. 2016, 375, 1415–1424. [Google Scholar] [CrossRef] [Green Version]
  10. Sushentsev, N.; Moreira Da Silva, N.; Yeung, M.; Barrett, T.; Sala, E.; Roberts, M.; Rundo, L. Comparative performance of fully-automated and semi-automated artificial intelligence methods for the detection of clinically significant prostate cancer on MRI, a systematic review. Insights Imaging 2022, 13, 59. [Google Scholar] [CrossRef]
  11. Armato, S.G.; Huisman, H.; Drukker, K.; Hadjiiski, L.; Kirby, J.; Petrick, N.; Redmond, G.; Giger, M.L.; Cha, K.; Mamonov, A.; et al. PROSTATEx Challenges for computerized classification of prostate lesions from multiparametric magnetic resonance images. J. Med. Imaging 2018, 5, 044501. [Google Scholar] [CrossRef]
  12. Nolan, T.; Govindarajan, K. “SPIE-AAPM-NCI PROSTATEx Challenges (PROSTATEx).” The Cancer Imaging Archive (TCIA). Available online: https://doi.org/10.7937/K9TCIA.2017.MURS5CL (accessed on 23 August 2021).
  13. Abraham, B.; Nair, M.S. Automated grading of prostate cancer using convolutional neural network and ordinal class classifier. Inform. Med. Unlocked 2019, 17, 100256. [Google Scholar] [CrossRef]
  14. Chen, Q.; Hu, S.; Long, P.; Lu, F.; Shi, Y.; Li, Y. A Transfer Learning Approach for Malignant Prostate Lesion Detection on Multiparametric MRI. Technol. Cancer Res. Treat 2019, 18, 1533033819858363. [Google Scholar] [CrossRef] [PubMed]
  15. Hectors, S.; Cherny, M.; Yadav, K.K.; Beksaç, A.T.; Thulasidass, H.; Lewis, S.; Davicioni, E.; Wang, P.; Tewari, A.K.; Taouli, B. Radiomics Features Measured with Multiparametric Magnetic Resonance Imaging Predict Prostate Cancer Aggressiveness. J. Urol. 2019, 202, 498–505. [Google Scholar] [CrossRef]
  16. Schelb, P.; Kohl, S.; Radtke, J.P.; Wiesenfarth, M.; Kickingereder, P.; Bickelhaupt, S.; Kuder, T.A.; Stenzinger, A.; Hohenfellner, M.; Schlemmer, H.; et al. Classification of Cancer at Prostate MRI, Deep Learning versus Clinical PI-RADS Assessment. Radiology 2019, 293, 607–617. [Google Scholar] [CrossRef] [Green Version]
  17. Bernatz, S.; Ackermann, J.; Mandel, P.; Kaltenbach, B.; Zhdanovich, Y.; Harter, P.N.; Döring, C.; Hammerstingl, R.; Bodelle, B.; Smith, K.; et al. Comparison of machine learning algorithms to predict clinically significant prostate cancer of the peripheral zone with multiparametric MRI using clinical assessment categories and radiomic features. Eur. Radiol. 2020, 30, 6757–6769. [Google Scholar] [CrossRef]
  18. Castillo, T.J.M.; Arif, M.; Starmans, M.; Niessen, W.J.; Bangma, C.H.; Schoots, I.G.; Veenland, J.F. Classification of Clinically Significant Prostate Cancer on Multi-Parametric MRI, A Validation Study Comparing Deep Learning and Radiomics. Cancers 2021, 14, 12. [Google Scholar] [CrossRef] [PubMed]
  19. Cuocolo, R.; Cipullo, M.B.; Stanzione, A.; Ugga, L.; Romeo, V.; Radice, L.; Brunetti, A.; Imbriaco, M. Machine learning applications in prostate cancer magnetic resonance imaging. Eur. Radiol. Exp. 2019, 3, 35. [Google Scholar] [CrossRef]
  20. Purysko, A.S. Invited Commentary, Prostate Cancer Diagnosis-Challenges and Opportunities for Artificial Intelligence. Radiographics 2021, 41, E177–E178. [Google Scholar] [CrossRef]
  21. Sarma, K.V.; Harmon, S.; Sanford, T.; Roth, H.R.; Xu, Z.; Tetreault, J.; Xu, D.; Flores, M.G.; Raman, A.G.; Kulkarni, R.; et al. Federated learning improves site performance in multicenter deep learning without data sharing. J. Am. Med. Inform. Assoc. 2021, 28, 1259–1264. [Google Scholar] [CrossRef]
  22. Litjens, G.; Debats, O.; Barentsz, J.; Karssemeijer, N.; Huisman, H. ProstateX challenge data. Cancer Imaging Arch. 2017, 10, K9TCIA. [Google Scholar]
  23. Clark, K.; Vendt, B.; Smith, K.; Freymann, J.; Kirby, J.; Koppel, P.; Moore, S.; Phillips, S.; Maffitt, D.; Pringle, M.; et al. The Cancer Imaging Archive (TCIA), maintaining and operating a public information repository. J. Digit. Imaging 2013, 26, 1045–1057. [Google Scholar] [CrossRef]
  24. He, K.; Zhang, X.; Ren, S.; Sun, J. Deep Residual Learning for Image Recognition. In Proceedings of the IEEE Computer Society Conference on Computer Vision and Pattern Recognition (CVPR), Las Vegas, NV, USA, 27–30 June 2016; pp. 770–778. [Google Scholar]
  25. Abadi, M.; Agarwal, A.; Barham, P.; Brevdo, E.; Chen, Z.; Citro, C.; Corrado, G.S.; Davis, A.; Dean, J.; Devin, M.; et al. TensorFlow: Large-scale machine learning on heterogeneous systems. 2015. Available online: tensorflow.org (accessed on 23 August 2021).
  26. Deng, J.; Dong, W.; Socher, R.; Li, L.; Li, K.; Li, F. ImageNet, A large-scale hierarchical image database. In Proceedings of the 2009 IEEE Conference on Computer Vision and Pattern Recognition, Miami, FL, USA, 20–25 June 2009; pp. 248–255. [Google Scholar]
  27. Mongan, J.; Moy, L.; Kahn, C.E.J. Checklist for Artificial Intelligence in Medical Imaging (CLAIM), A Guide for Authors and Reviewers. Radiol Artif. Intell. 2020, 2, e200029. [Google Scholar] [CrossRef] [Green Version]
  28. Jarrel, C.Y.S.; Jennifer, S.N.T.; Kitchen, A. Detection of prostate cancer on multiparametric MRI. Proc. SPIE 2017, 10134, 585–588. [Google Scholar]
  29. Kitchen, A.; Seah, J. Support vector machines for prostate lesion classification. Proc. SPIE 2017, 10134, 577–580. [Google Scholar]
  30. Liu, S.; Zheng, H.; Feng, Y.; Li, W. Prostate cancer diagnosis using deep learning with 3D multiparametric MRI. Proc. SPIE 2017, 10134, 581–584. [Google Scholar]
  31. Mehrtash, A.; Sedghi, A.; Ghafoorian, M.; Taghipour, M.; Tempany, C.M.; Wells, W.M.; Kapur, T.; Mousavi, P.; Abolmaesumi, P.; Fedorov, A. Classification of Clinical Significance of MRI Prostate Findings Using 3D Convolutional Neural Networks. In Proceedings of the Medical Imaging 2017: Computer-Aided Diagnosis, Orlando, FL, USA, 3 March 2017. [Google Scholar]
  32. Park, S.H.; Han, K. Methodologic Guide for Evaluating Clinical Performance and Effect of Artificial Intelligence Technology for Medical Diagnosis and Prediction. Radiology 2018, 286, 800–809. [Google Scholar] [CrossRef]
  33. Aerts, H.J.W.L. The Potential of Radiomic-Based Phenotyping in Precision Medicine, A Review. JAMA Oncol. 2016, 2, 1636–1642. [Google Scholar] [CrossRef]
  34. Kohli, M.; Prevedello, L.M.; Filice, R.W.; Geis, J.R. Implementing Machine Learning in Radiology Practice and Research. AJR Am. J. Roentgenol. 2017, 208, 754–760. [Google Scholar] [CrossRef]
  35. Buch, K.; Kuno, H.; Qureshi, M.M.; Li, B.; Sakai, O. Quantitative variations in texture analysis features dependent on MRI scanning parameters, A phantom model. J. Appl. Clin. Med. Phys. 2018, 19, 253–264. [Google Scholar] [CrossRef] [Green Version]
  36. Nyul, L.G.; Udupa, J.K. On standardizing the MR image intensity scale. Magn. Reson. Med. 1999, 42, 1072–1081. [Google Scholar] [CrossRef]
  37. Isaksson, L.J.; Raimondi, S.; Botta, F.; Pepa, M.; Gugliandolo, S.G.; De Angelis, S.P.; Marvaso, G.; Petralia, G.; DE Cobelli, O.; Gandini, S.; et al. Effects of MRI image normalization techniques in prostate cancer radiomics. Phys. Medica 2020, 71, 7–13. [Google Scholar] [CrossRef]
  38. Sunoqrot, M.R.S.; Nketiah, G.A.; Selnaes, K.M.; Bathen, T.F.; Elschot, M. Automated reference tissue normalization of T2-weighted MR images of the prostate using object recognition. MAGMA 2021, 34, 309–321. [Google Scholar] [CrossRef]
  39. Castillo, T.J.M.; Arif, M.; Niessen, W.J.; Schoots, I.G.; Veenland, J.F. Automated Classification of Significant Prostate Cancer on MRI, A Systematic Review on the Performance of Machine Learning Applications. Cancers 2020, 12, 1606. [Google Scholar] [CrossRef]
  40. Cuocolo, R.; Cipullo, M.B.; Stanzione, A.; Romeo, V.; Green, R.; Cantoni, V.; Ponsiglione, A.; Ugga, L.; Imbriaco, M. Machine learning for the identification of clinically significant prostate cancer on MRI, A meta-analysis. Eur. Radiol. 2020, 30, 6877–6887. [Google Scholar] [CrossRef]
  41. Mulherin, S.A.; Miller, W.C. Spectrum bias or spectrum effect? Subgroup variation in diagnostic test evaluation. Ann. Intern. Med. 2002, 137, 598–602. [Google Scholar] [CrossRef] [PubMed]
  42. Leeflang, M.M.G.; Rutjes, A.W.S.; Reitsma, J.B.; Hooft, L.; Bossuyt, P.M.M. Variation of a test’s sensitivity and specificity with disease prevalence. CMAJ 2013, 185, E537–E544. [Google Scholar] [CrossRef] [Green Version]
  43. Koga, Y.; Song, H.; Chalmers, Z.R.; Newberg, J.; Kim, E.; Carrot-Zhang, J.; Piou, D.; Polak, P.; Abdulkadir, S.A.; Ziv, E.; et al. Genomic Profiling of Prostate Cancers from Men with African and European Ancestry. Clin. Cancer Res. 2020, 26, 4651–4660. [Google Scholar] [CrossRef] [PubMed]
  44. Obermeyer, Z.; Powers, B.; Vogeli, C.; Mullainathan, S. Dissecting racial bias in an algorithm used to manage the health of populations. Science 2019, 366, 447–453. [Google Scholar] [CrossRef] [Green Version]
  45. Kostick-Quenet, K.M.; Cohen, I.G.; Gerke, S.; Lo, B.; Antaki, J.; Movahedi, F.; Njah, H.; Schoen, L.; Estep, J.E.; Blumenthal-Barby, J. Mitigating Racial Bias in Machine Learning. J. Law Med. Ethics 2022, 50, 92–100. [Google Scholar] [CrossRef] [PubMed]
  46. Sheller, M.J.; Edwards, B.; Reina, G.A.; Martin, J.; Pati, S.; Kotrotsou, A.; Milchenko, M.; Xu, W.; Marcus, D.; Colen, R.R.; et al. Federated learning in medicine, facilitating multi-institutional collaborations without sharing patient data. Sci. Rep. 2020, 10, 12598. [Google Scholar] [CrossRef] [PubMed]
  47. NVIDIA Clara Imaging. Available online: https://developer.nvidia.com/clara-medical-imaging (accessed on 1 June 2022).
  48. Tensorflow. TensorFlow Federated, Machine Learning on Decentralized Data. Available online: https://www.tensorflow.org/federated (accessed on 1 June 2022).
  49. IBM. IBM Federated Learning. Available online: https://ibmfl.mybluemix.net/ (accessed on 1 June 2022).
  50. Meyer, A.; Chlebus, G.; Rak, M.; Schindele, D.; Schostak, M.; van Ginneken, B.; Schenk, A.; Meine, H.; Hahn, H.K.; Schreiber, A.; et al. Anisotropic 3D Multi-Stream CNN for Accurate Prostate Segmentation from Multi-Planar MRI. Comput. Methods Programs Biomed. 2021, 200, 105821. [Google Scholar] [CrossRef]
  51. Schimmöller, L.; Blondin, D.; Arsov, C.; Rabenalt, R.; Albers, P.; Antoch, G.; Quentin, M. MRI-Guided In-Bore Biopsy, Differences Between Prostate Cancer Detection and Localization in Primary and Secondary Biopsy Settings. AJR Am. J. Roentgenol. 2016, 206, 92–99. [Google Scholar] [CrossRef]
  52. Allsbrook, W.C.; Mangold, K.; Johnson, M.H.; Lane, R.B.; Lane, C.G.; Amin, M.B.; Bostwick, D.G.; Humphrey, P.A.; Jones, E.C.; Reuter, V.E.; et al. Interobserver reproducibility of Gleason grading of prostatic carcinoma, urologic pathologists. Hum. Pathol. 2001, 32, 74–80. [Google Scholar] [CrossRef] [PubMed] [Green Version]
  53. Kasivisvanathan, V.; Rannikko, A.S.; Borghi, M.; Panebianco, V.; Mynderse, L.A.; Vaarala, M.H.; Briganti, A.; Budäus, L.; Hellawell, G.; Hindley, R.G.; et al. MRI-Targeted or Standard Biopsy for Prostate-Cancer Diagnosis. N. Engl. J. Med. 2018, 378, 1767–1777. [Google Scholar] [CrossRef]
  54. Sonn, G.A.; Fan, R.E.; Ghanouni, P.; Wang, N.N.; Brooks, J.D.; Loening, A.M.; Daniel, B.L.; To’o, K.J.; Thong, A.E.; Leppert, J.L. Prostate Magnetic Resonance Imaging Interpretation Varies Substantially Across Radiologists. Eur. Urol. Focus 2019, 5, 592–599. [Google Scholar] [CrossRef] [Green Version]
  55. Westphalen, A.C.; McCulloch, C.E.; Anaokar, J.M.; Arora, S.; Barashi, N.S.; Barentsz, J.O.; Bathala, T.K.; Bittencourt, L.K.; Booker, M.T.; Braxton, V.G.; et al. Variability of the Positive Predictive Value of PI-RADS for Prostate MRI across 26 Centers, Experience of the Society of Abdominal Radiology Prostate Cancer Disease-focused Panel. Radiology 2020, 296, 76–84. [Google Scholar] [CrossRef] [PubMed]
  56. Jemal, A.; Kulldorff, M.; Devesa, S.S.; Hayes, R.B.; Fraumeni, J.F.J. A geographic analysis of prostate cancer mortality in the United States, 1970–1989. Int. J. Cancer 2002, 101, 168–174. [Google Scholar] [CrossRef]
  57. Baade, P.D.; Youlden, D.R.; Krnjacki, L.J. International epidemiology of prostate cancer, geographical distribution and secular trends. Mol. Nutr. Food Res. 2009, 53, 171–184. [Google Scholar] [CrossRef]
  58. Ben Ammar, L.; Gasmi, K.; Ben Ltaifa, I. ViT-TB, Ensemble Learning Based ViT Model for Tuberculosis Recognition. Cybern. Systems 2022, 1–20. [Google Scholar] [CrossRef]
  59. Karim, G. Hybrid deep learning model for answering visual medical questions. J. Supercomput. 2022, 78, 15042–15059. [Google Scholar]
Figure 1. Algorithm generation depicting data and model preparation, and ResNet model training and architecture used to develop the final models. Image A depicts T2W sequence with dot labeling the centroid of a Gleason 4 + 4 lesion. ReLU: Rectified linear unit activation function; LR: learning rate; Algo: algorithm.
Applsci 13 01088 g001
Figure 2. Schematic summarizing image datasets, algorithm training and testing.
Applsci 13 01088 g002
Table 1. Summary of patient demographics, MRI PIRADS scores, lesion Gleason grades, and lesion zonal distribution within the ProstateX-2 and local institutional datasets.
ProstateX-2Local Institution
Patients
Mean age66.063.6
Range48–8347–74
RaceNA51% white, 44% AA, 5% Other
MRI exams
Totaln = 112n = 63
PIRADS 5NA25
PIRADS 4NA14
PIRADS 3NA2
PIRADS 2022
Lesion pathology
hrPCATotaln = 35 (31%)n = 28 (44%)
GG579
GG484
GG3 (4 + 3)2015
“Benign”Totaln = 77 (69%)n = 35 (56%)
GG2 (3 + 4)4111
GG1362
<GG1-22 *
Lesion zonal distribution
hrPCAPZ1522
TZ206
“Benign”PZ3523
TZ4212
AA: African American, GG: Gleason grade, PZ: peripheral zone, TZ: transitional zone. * These were PIRADS 2 “pseudo-lesions” that were included to augment the benign subset of patients in the prostatectomy cohort from our institution. Biopsies were not performed, and these were presumed to be <GG1 based on stability of greater than two years in follow-up.
Table 2. Total patients included in each of the initial datasets trained and tested. The total included images for each imaging type (T2, ADC, or T2 + ADC) where the same imaging types were used for each training/testing combination for the model.
ResNet AlgorithmTraining Image SourceTesting Image SourceTotal Training ImagesTotal Testing Images
PX289 (80%)23 (20%)
ModelPX2PX2 Local89 (80%)13 (20% of 63 initial)
PXL89 (80%)36 (20%)
Local50 (80%)13 (20%)
ModelLocLocalPX250 (80%)23 (20%)
PXL50 (80%)36 (20%)
PXL139 (80%)36 (20%)
ModelPXLPXLPX2139 (80%)23 (20%)
Local139 (80%)13 (20%)
Table 3. Accuracy and area under the receiver operating characteristic curve for models trained on and tested with the entire ProstateX-2, local institutional, and combined ProstateX-2 and local institutional image data using 5-fold cross-validation. t-tests compared the AUC and accuracies of models trained and tested using the same image data source (labeled *) to those using different training and testing sources (labeled †). Statistically significant differences (p < 0.01) shown by 2-tailed t-test are underlined. PX2: ProstateX-2 data, Local: local institutional data, PXL: combined prostateX-2 and local institutional data.
ResNet ModelTraining Image SourceTesting Image SourceTraining & Testing Image Sequence
T2ADCT2 & ADC
AUCAccuracyAUCAccuracyAUCAccuracy
PX2 *0.930.910.910.880.950.90
ModelPX2PX2 (89)Local †0.490.530.230.480.460.55
PXL †0.870.790.800.780.780.80
Local *0.960.890.820.820.980.92
ModelLocLocalPX2 †0.500.540.490.490.410.51
PXL †0.770.710.840.840.940.87
PXL *0.830.890.980.920.960.93
ModelPXLPXLPX2 †0.920.920.850.910.850.93
Local †0.960.860.880.920.990.92
Table 4. Sub-analysis of accuracy and area under the receiver operating characteristic curve for models trained and tested on ProstateX-2, local institutional, and combined ProstateX-2 and local institutional image data using lesions from either the peripheral or transitional zones only, with 5-fold cross-validation. t-tests compared the AUC and accuracies of models trained and tested using the same image data source (labeled *) with those using different training and testing sources (labeled †); statistically significant differences are underlined (p < 0.01). PX2: ProstateX-2 data, Local: local institutional data, PXL: combined prostateX-2 and local institutional data.
ResNet AlgorithmTraining Image SourceTesting Image SourceTraining & Testing Image Sequence
T2ADCT2 & ADC
AUCAccuracyAUCAccuracyAUCAccuracy
PZTZPZTZPZTZPZTZPZTZPZTZ
PX2 *0.920.930.910.900.910.910.880.880.940.950.910.90
ModelPX2PX2Local †0.440.610.530.550.230.250.480.480.450.310.440.44
PXL †0.880.870.80.770.800.810.770.800.770.790.800.80
Local *0.880.990.860.890.820.810.840.800.950.960.900.94
ModelLocLocalPX2 †0.480.520.530.550.540.450.490.480.550.290.570.46
PXL †0.790.690.790.700.940.720.840.800.890.940.830.88
PXL *0.830.920.890.900.980.990.920.930.960.900.910.98
ModelPXLPXLPX2 †0.930.920.920.920.880.850.920.900.850.860.930.92
Local †0.960.950.940.780.900.880.920.910.990.970.920.92
Disclaimer/Publisher’s Note: The statements, opinions and data contained in all publications are solely those of the individual author(s) and contributor(s) and not of MDPI and/or the editor(s). MDPI and/or the editor(s) disclaim responsibility for any injury to people or property resulting from any ideas, methods, instructions or products referred to in the content.

