Article

Computational Study of the Physical Properties of a High Temperature Molten Salt Mixture of FLiNaK and CeF3

by
Alexander Galashev
1,2
1
Institute of High Temperature Electrochemistry, Ural Branch, Russian Academy of Sciences Academicheskaya Str., 20, Ekaterinburg 620990, Russia
2
Institute of Chemical Engineering, Ural Federal University Named after the First President of Russia B.N. Yeltsin, Mira Str., 19, Ekaterinburg 620002, Russia
Appl. Sci. 2023, 13(2), 1085; https://doi.org/10.3390/app13021085
Submission received: 14 December 2022 / Revised: 7 January 2023 / Accepted: 9 January 2023 / Published: 13 January 2023

Abstract

:
In this work, we study the diffusion characteristics and structure of the molten salt FLiNaK with dissolved CeF3 in the operating temperature range of the molten-salt reactor. The temperature dependence of the self-diffusion coefficients of the ions that make up the salt mixture is represented with good accuracy as a linear dependence, except for the case of self-diffusion of Ce ions. As a rule, Li and F ions are more mobile than Na and K ions and significantly more so than slow Ce ions. The coordination numbers and their increase upon dissolution of CeF3 in FLiNaK were determined based on the calculation of partial radial distribution functions. The detailed structure of the melt is studied based on the construction of Voronoi polyhedra. The obtained topological characteristics indicate a predominantly tetrahedral type of distribution of Ce ions over the bulk of the system. Rotational symmetry of the 5th order prevails in the structure of the Li and F subsystems, and symmetries of the 3rd and 4th orders prevail in the Na and K subsystems, respectively. The simulation results can be used to search for actinide, which can be replaced by cerium in real experiments.

Graphical Abstract

1. Introduction

Currently, two types of molten fluoride salt can be used as fuel solvent and coolant in a Molten Salt Reactor (MSR). These salts are FLiBe and FLiNaK. MSR refers to nuclear reactors of the IV generation, in which liquid fuel is used instead of solid fuel. The preparation of fuel for MSR involves the dissolving of fissile materials (235U, 233U, 239Pu) in molten salt, which must meet certain requirements, i.e., have the necessary physical and chemical properties. MSRs developed to date can use U, Pu, Th as fuel, and salt compositions for them can be chlorides, fluorides, or nitrides [1].
A fast-spectrum breeder reactor (MSFR) has the possibility for actinide burning. Thanks to this reactor, the reduction of the reprocessing requirements and a better breeding ratio becomes possible [2]. The inclusion of MSFR in the nuclear power system for burning transuranium elements from spent nuclear fuel will solve the problem of closing the nuclear fuel cycle. It is known [3,4] that CeF3 and NdF3 are chemically similar analogues of PuF3 and AmF3, respectively. It is more efficient to carry out experimental studies with safe analogues (Ce and Nd), rather than with the radioactive elements themselves (Pu and Am).
It was found that molten fluoride mixtures FLiBe and FLiNaK form strong and relatively weak associates, respectively [5,6]. On the basis of molecular dynamics (MD) calculations, it was shown that the value of the diffusion activation energy in the LiF-KF salt melt is commensurate with the strength of the anion–cation interaction in molten fluoride salts [7]. A stronger effect of temperature than the effect of the composition of the molten salt on the self-diffusion of anions and cations has been established. The thermokinetic properties (density, bulk modulus, thermal expansion coefficient, and self-diffusion coefficient) of FLiBe and FLiNaK, including those with dissolved Cr, were calculated at a high temperature using ab initio MD [8]. The behavior of Mo solvated in the molten FLiNaK salt was studied by the method of molecular dynamics [9]. The dependence of the nature of complex formation of Mo on the degree of its oxidation is shown. With the use of molecular dynamics modeling, it becomes possible to create a scientific prediction of the behavior of solutes in molten salts and to predict the effect of their presence on the properties of the salt [10].
The purpose of this work is to study the temperature dependence of ion diffusion in the molten FLiNaK salt with CeF3 salt dissolved in it and to study in detail the structure of this melt under conditions close to those for an operating molten salt reactor. The study of the behavior of lanthanide (cerium) in the molten salt FLiNaK is important from the point of view of its use in the laboratory tests as a substitute for radioactive actinide, the specific type of which can be determined in future studies.

2. Materials and Methods

A co-melt of FLiNaK and CeF3 was obtained by melting four fcc crystals: LiF (9300 ions), NaF (2300 ions), KF (8400 ions), and CeF3 (750 ions) at 3000 K for 1 million time steps ( Δ t = 0.1 fs). A system of this composition corresponded to the FLiNaK eutectic: LiF—46.5 mol.%, NaF—11.5 mol.%, and KF—42.0 mol.%, in which CeF3 (15 mol.%) is dissolved. Complete mixing of the melt was achieved after holding at the same temperature for another 2 million Δ t. All these calculations were performed in the NVT ensemble. At the next stage of the calculation in the NPT ensemble, molten salt from FLiNaK and CeF3 was brought to the experimental density corresponding to a temperature of 800 K and kept at this temperature. The duration of this stage was 3 million Δ t. The Nose–Hoover thermostat and barostat were used for keeping the simulated temperature and pressure constant [11,12]. The thermostat relaxation time was τ T = 400 Δt, and the barostat relaxation time was τ P = 1000 Δt. Exactly the same values of the parameters τ T and τ P were used in [13]. Subsequent calculations were carried out in the NVE ensemble by sequentially increasing the temperature by a certain value Δ T , keeping the system at a new temperature, and then calculating the physical properties. Each calculation at the new temperature took 2 million Δ t. In all cases, periodic boundary conditions acting in each of the three directions were used. Long-range interactions were taken into account on the basis of Particle–Particle Particle–Mesh (PPPM) summing [14]. The Poisson equations were solved using the fast Fourier transform.
The interaction of singly charged ions that make up FLiNaK was described by the rigid-ion potential of Born-Mayer-Huggins-Tosi-Fumi (BMHFT) [15]
ϕ = Z i Z j e 2 4 π ε 0 ε r + B i j exp [ r σ i j ρ i j ] C i j r 6 D i j r 8 ,
where i and j can represent positive or negative ion, Zi and Zj characterize ion charges; the last two terms in expression (1) reflect the dipole–dipole and dipole–quadrupole interaction; and ε 0 and ε are the permittivity of the free space and relative permeability of the studied environment, respectively. The parameters for the potential for FLiNaK represented by expression (1) are given in [16].
The QUANTUM ESPRESSO program [17,18] was used to calculate the parameters of the Ce–Ce and Ce–X interaction potential, where X is F, Li, Na, K. Projector-augmented wave GGA-PBE scalar relativistic pseudopotentials [19,20] were used. Moreover, the kinetic energy cutoff for wave functions and charge density corresponded to 100 and 400 Ry, respectively. The interaction of the Ce ion with other ions was created by the Coulomb and non-Coulomb contributions. When determining the Coulomb contribution, integer values of electric charges were used: +3 for Ce ion; +1 for Li, Na, and K ions; and −1 for F ions. The schematic diagrams of the complexes under study are shown in Figure 1. The complexes were placed in a simple cubic lattice with a large parameter a = 30 Å, so that the interaction between periodic cells was practically excluded. In other words, non-periodic isolated systems were studied. The geometric template for determining the Ce–F interaction was represented by a planar CeF3 molecule, in which the cerium atom is located at the center of a regular triangle. The Ce–F distance was varied while maintaining the symmetry of the system. To determine the Ce–Ce interaction, a 3D complex consisting of two Ce atoms and six F atoms was considered. All Ce–F distances in this system were assumed to be equal to the typical distance for melting salts (2.3 Å) while the Ce–Ce distance was varied. The combination of CeF3 and XF complexes (X = Li, Na, K) served as a geometric template for determining the interaction between the Ce ion and alkali metal ions. In this 3D complex, the Ce–F and X–F distances were fixed at 2.3 Å while the Ce–X distances varied. In all cases, the energy of non-Coulomb interactions was determined as the difference between the total energy and the energy of Coulomb interactions. The dependence of the non-Coulomb interaction energy on the distance between the ions was approximated by an exponential dependence. Grimme’s dispersion corrections D3 [21] were added for accurate accounting of non-covalent interactions.
The non-Coulomb contribution was determined by the second term in the expression (1), where the parameters B, ρ, and σ were determined using quantum mechanical DFT calculations and are presented in Table 1. The behavior of cerium ions with an electric charge of +3 in the FLiNaK salt melt is almost completely determined by the Coulomb interaction. The absence of explicit contributions describing the weak dipole–dipole and dipole–quadrupole interactions of cerium with other ions does not significantly change the ion dynamics in the molten salt. This is confirmed by the results of [22], where a similar form of the interaction potential was used for all ions present in pure FLiNaK.
To calculate the self-diffusion coefficient, the Eitstein relation was used:
D α = 1 6 t lim t | Δ r α ( t ) | 2 ,
where | Δ r α ( t ) | 2 is the mean square displacement of the element α and Δ r α is determined for each particle at various times t and then taking the average.
In [23], based on the hydrodynamic model of a particle surrounded by a solvent, an analytical correction was obtained to the effect of the system size on the diffusion coefficient. In this approach, it was assumed that particle diffusion depends not only on the hydrodynamic interaction with the solvent in the nearest environment, but also on periodic images of the particle itself and the solvent. An expression was obtained for the self-diffusion coefficient D of the particle in an infinite system
D = D P B C M D + k B T ξ 6 π η L ,
where D P B C M D is the self-diffusion coefficient obtained in the MD model with periodic boundary conditions (PBC), k B is the Boltzmann constant, η is the shear viscosity, L is an effective simulation cell length, constant ξ = 2.837297 [24].
In the case of unequal lengths of edges in an orthogonal cell, we can set L = L ¯ , where L ¯ is the average length of an edge of the cell. We used an orthogonal cell with one side significantly shorter than the other sides for two reasons. First, the initial stacking of the crystals of the constituent components (LiF, NaF, KF and CeF3) was carried out in pairs vertically on top of each other. In other words, the larger LiF and KF crystals were placed together at the bottom of the box while the CeF3 and NaF crystals were located above these crystals. Second, with such a shape of the cell, it was convenient to visually observe the mixing of ions in the system.
The radial distribution function between atoms i and j is defined as
g i j = d n i j ( r ) 4 π r 2 d r ρ i ,
where d n i j ( r ) is the number of atoms of sort j in a shell dr at the distance r of the atom of sort i, partial density of species i: ρ i = V N i = V / ( N x i ) , xi represents the concentration of atomic species i.
The first coordination number is defined as [25]
n i j = 4 π ρ x j 0 r m i n r 2 g i j ( r ) d r ,  
where ρ is the number density, x j is the concentration ( N j / N ) of species j, and r m i n is the first minimum of the g i j ( r ) function.
The structure of a salt melt can be studied by the method of statistical geometry based on the construction of Voronoi polyhedra (VP) [26]. As a rule, VPs are analyzed using the obtained topological and metric characteristics. Topological characteristics include the distribution of polyhedra by the number of faces and the distribution of faces by the number of sides. The first of them shows how the nearest geometric neighbors (NGNs) are distributed around the centers (ions) of the selected subsystem or the entire system, and the second gives information about cyclic formations (rings) that are visible from the centers in the NGN location directions. We also analyze the metric characteristics represented by the angular distribution of NGN defined for the selected subsystem. The angular distribution is constructed for the angles θ formed by the pair NGN with the center VP. The angular distribution shows a statistical picture of the relative angular placement of NGN in a subsystem. It can be used to determine whether a structure is regular. Statistical analysis generated by VPs reflecting a three-dimensional structure is more informative than an analysis performed based on the calculation of a one-dimensional radial distribution function.
All calculations were performed with the use of the open source program code for molecular dynamics simulation LAMMPS [27] on a URAN cluster-type hybrid computer at the N.N. Krasovskii Institute of Mathematics and Mechanics UB RAS with a peak performance of 216 Tflop/s and 1864 CPUs.

3. Results

3.1. Density of Molten FLiNaK

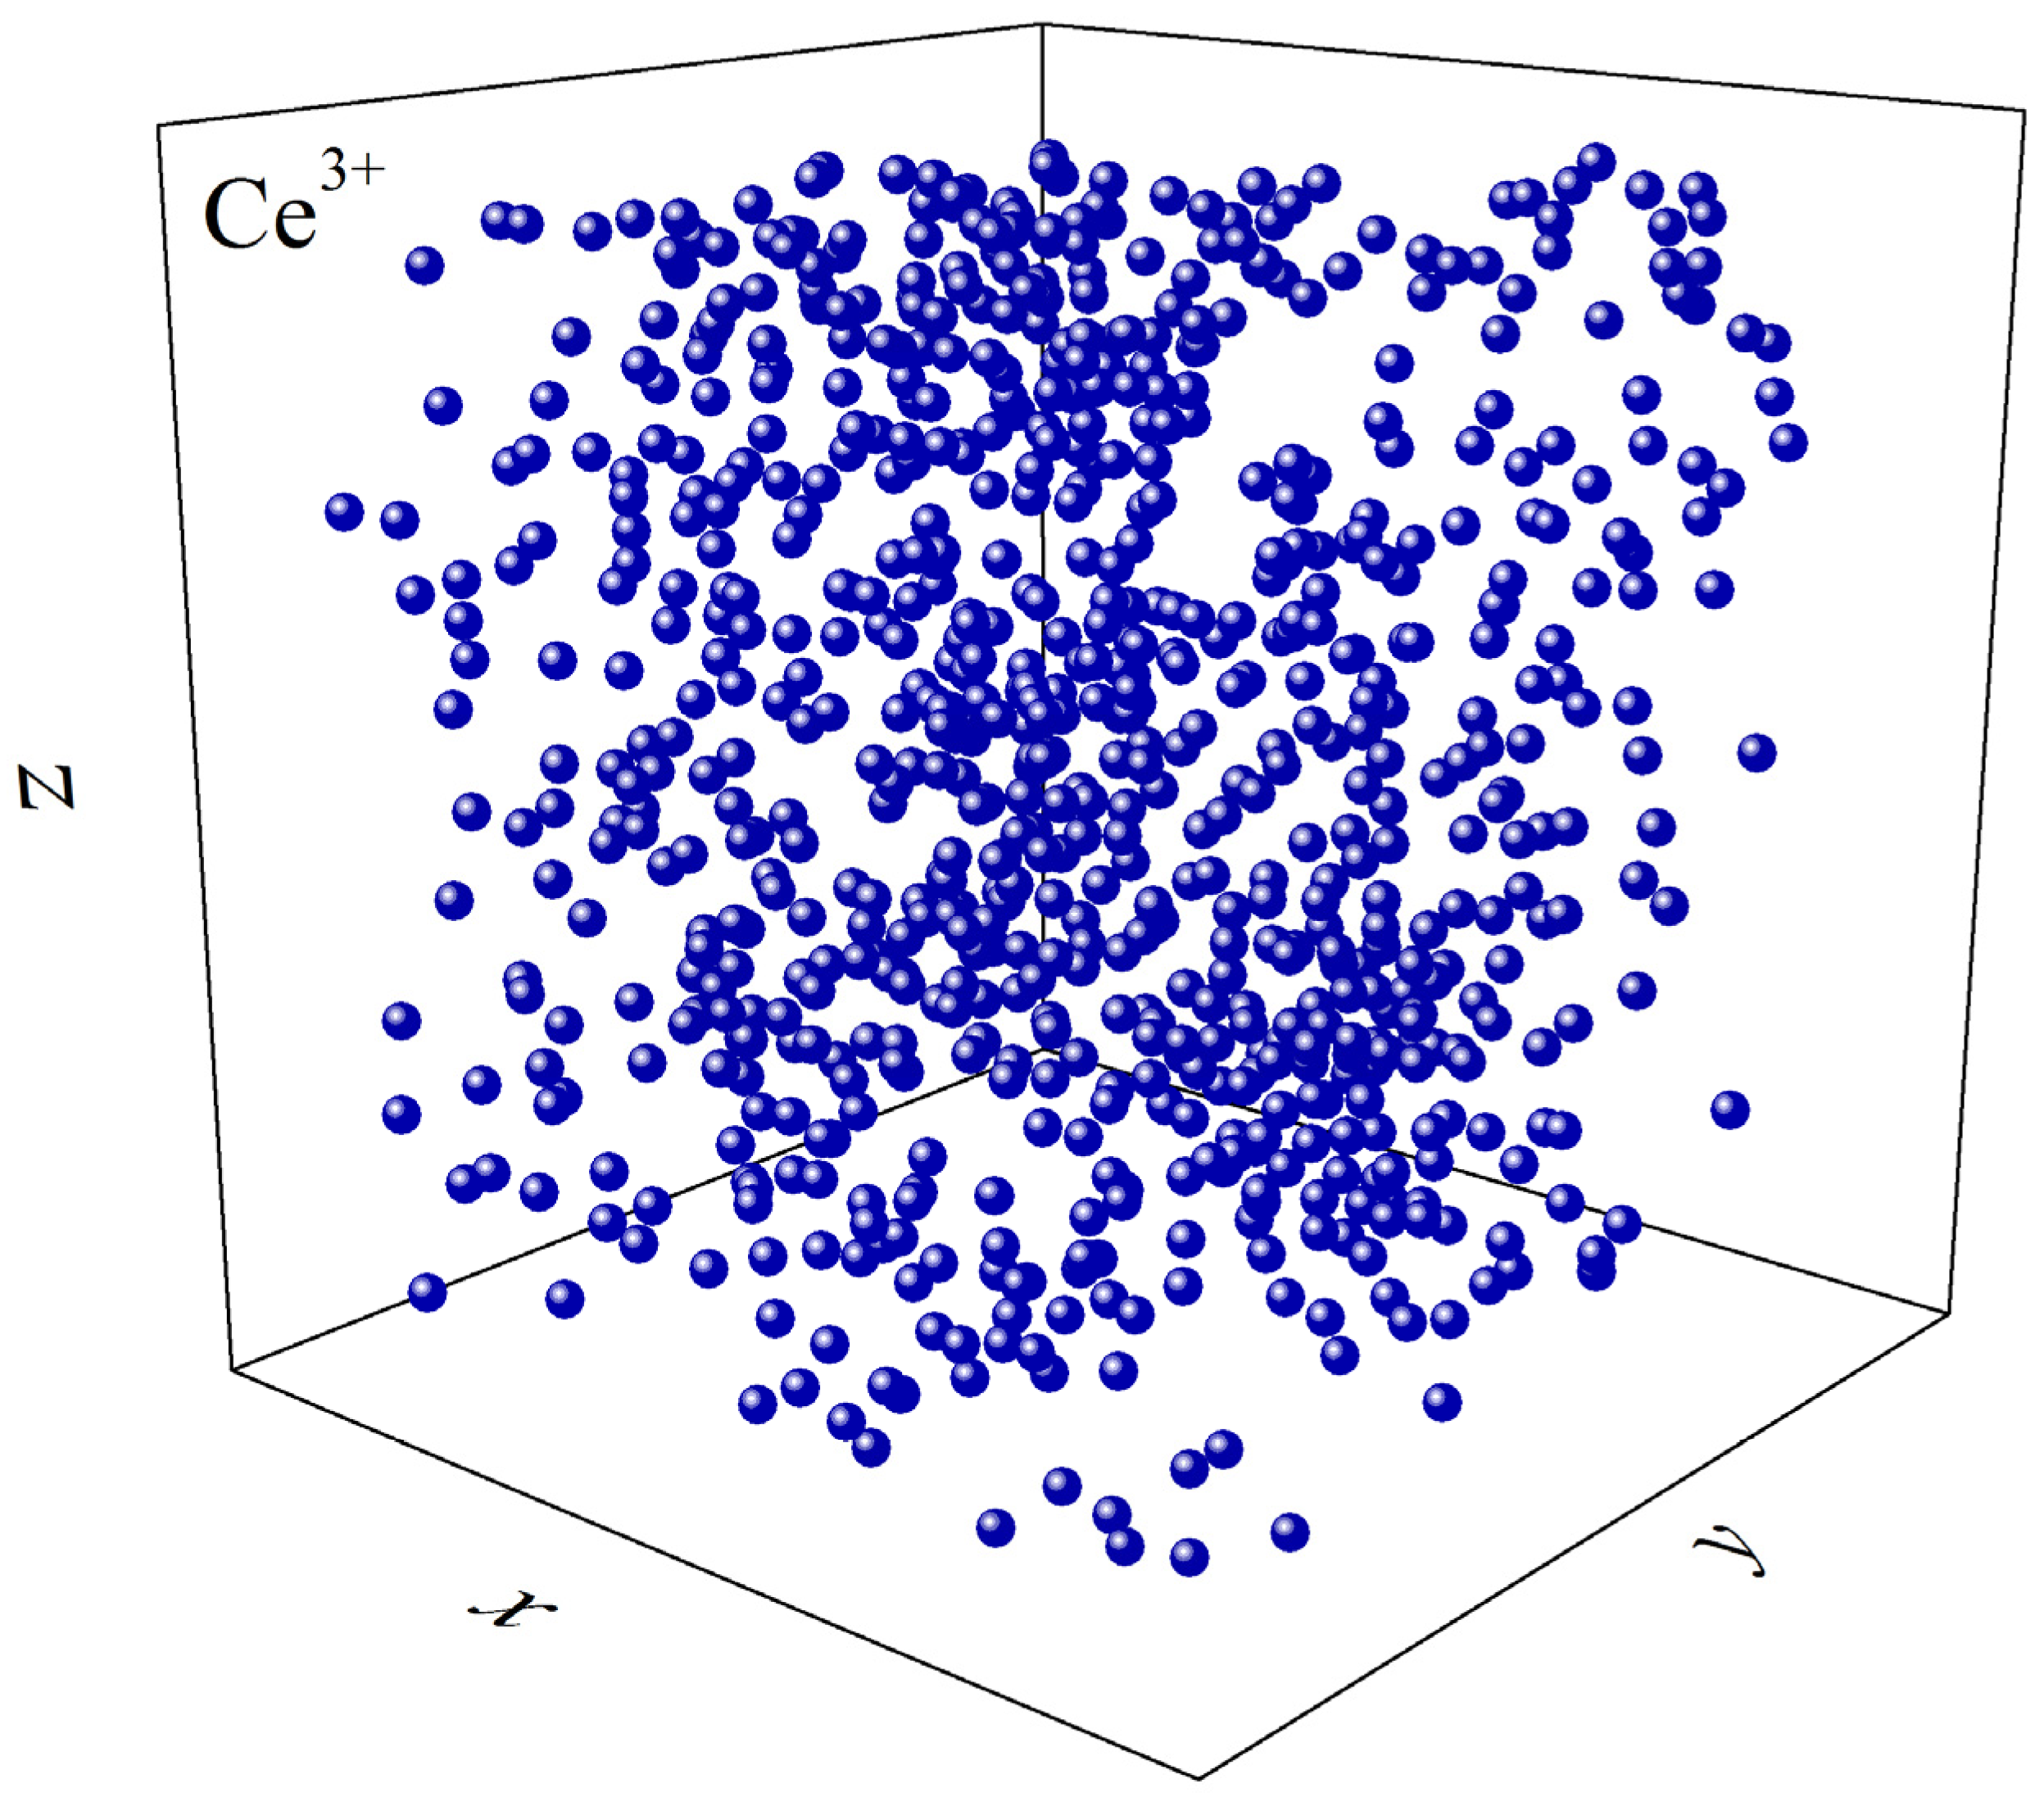
Figure 2 shows the configuration of the FLiNaK+CeF3 system obtained at a time of 0.2 ns at a temperature of 1000 K. It can be seen that the system with the dominant number of F ions has a high degree of mixing of different kinds of ions. This is due to the low viscosity of this salt melt and the developed diffusion of ions that make up the system. To more clearly represent the distribution of Ce ions over the volume of the system, Figure 3 shows the configuration formed by only these ions. As can be seen from the figure, the placement of Ce ions in the MD cell is not ideally uniform, although their presence extends over the entire available volume.
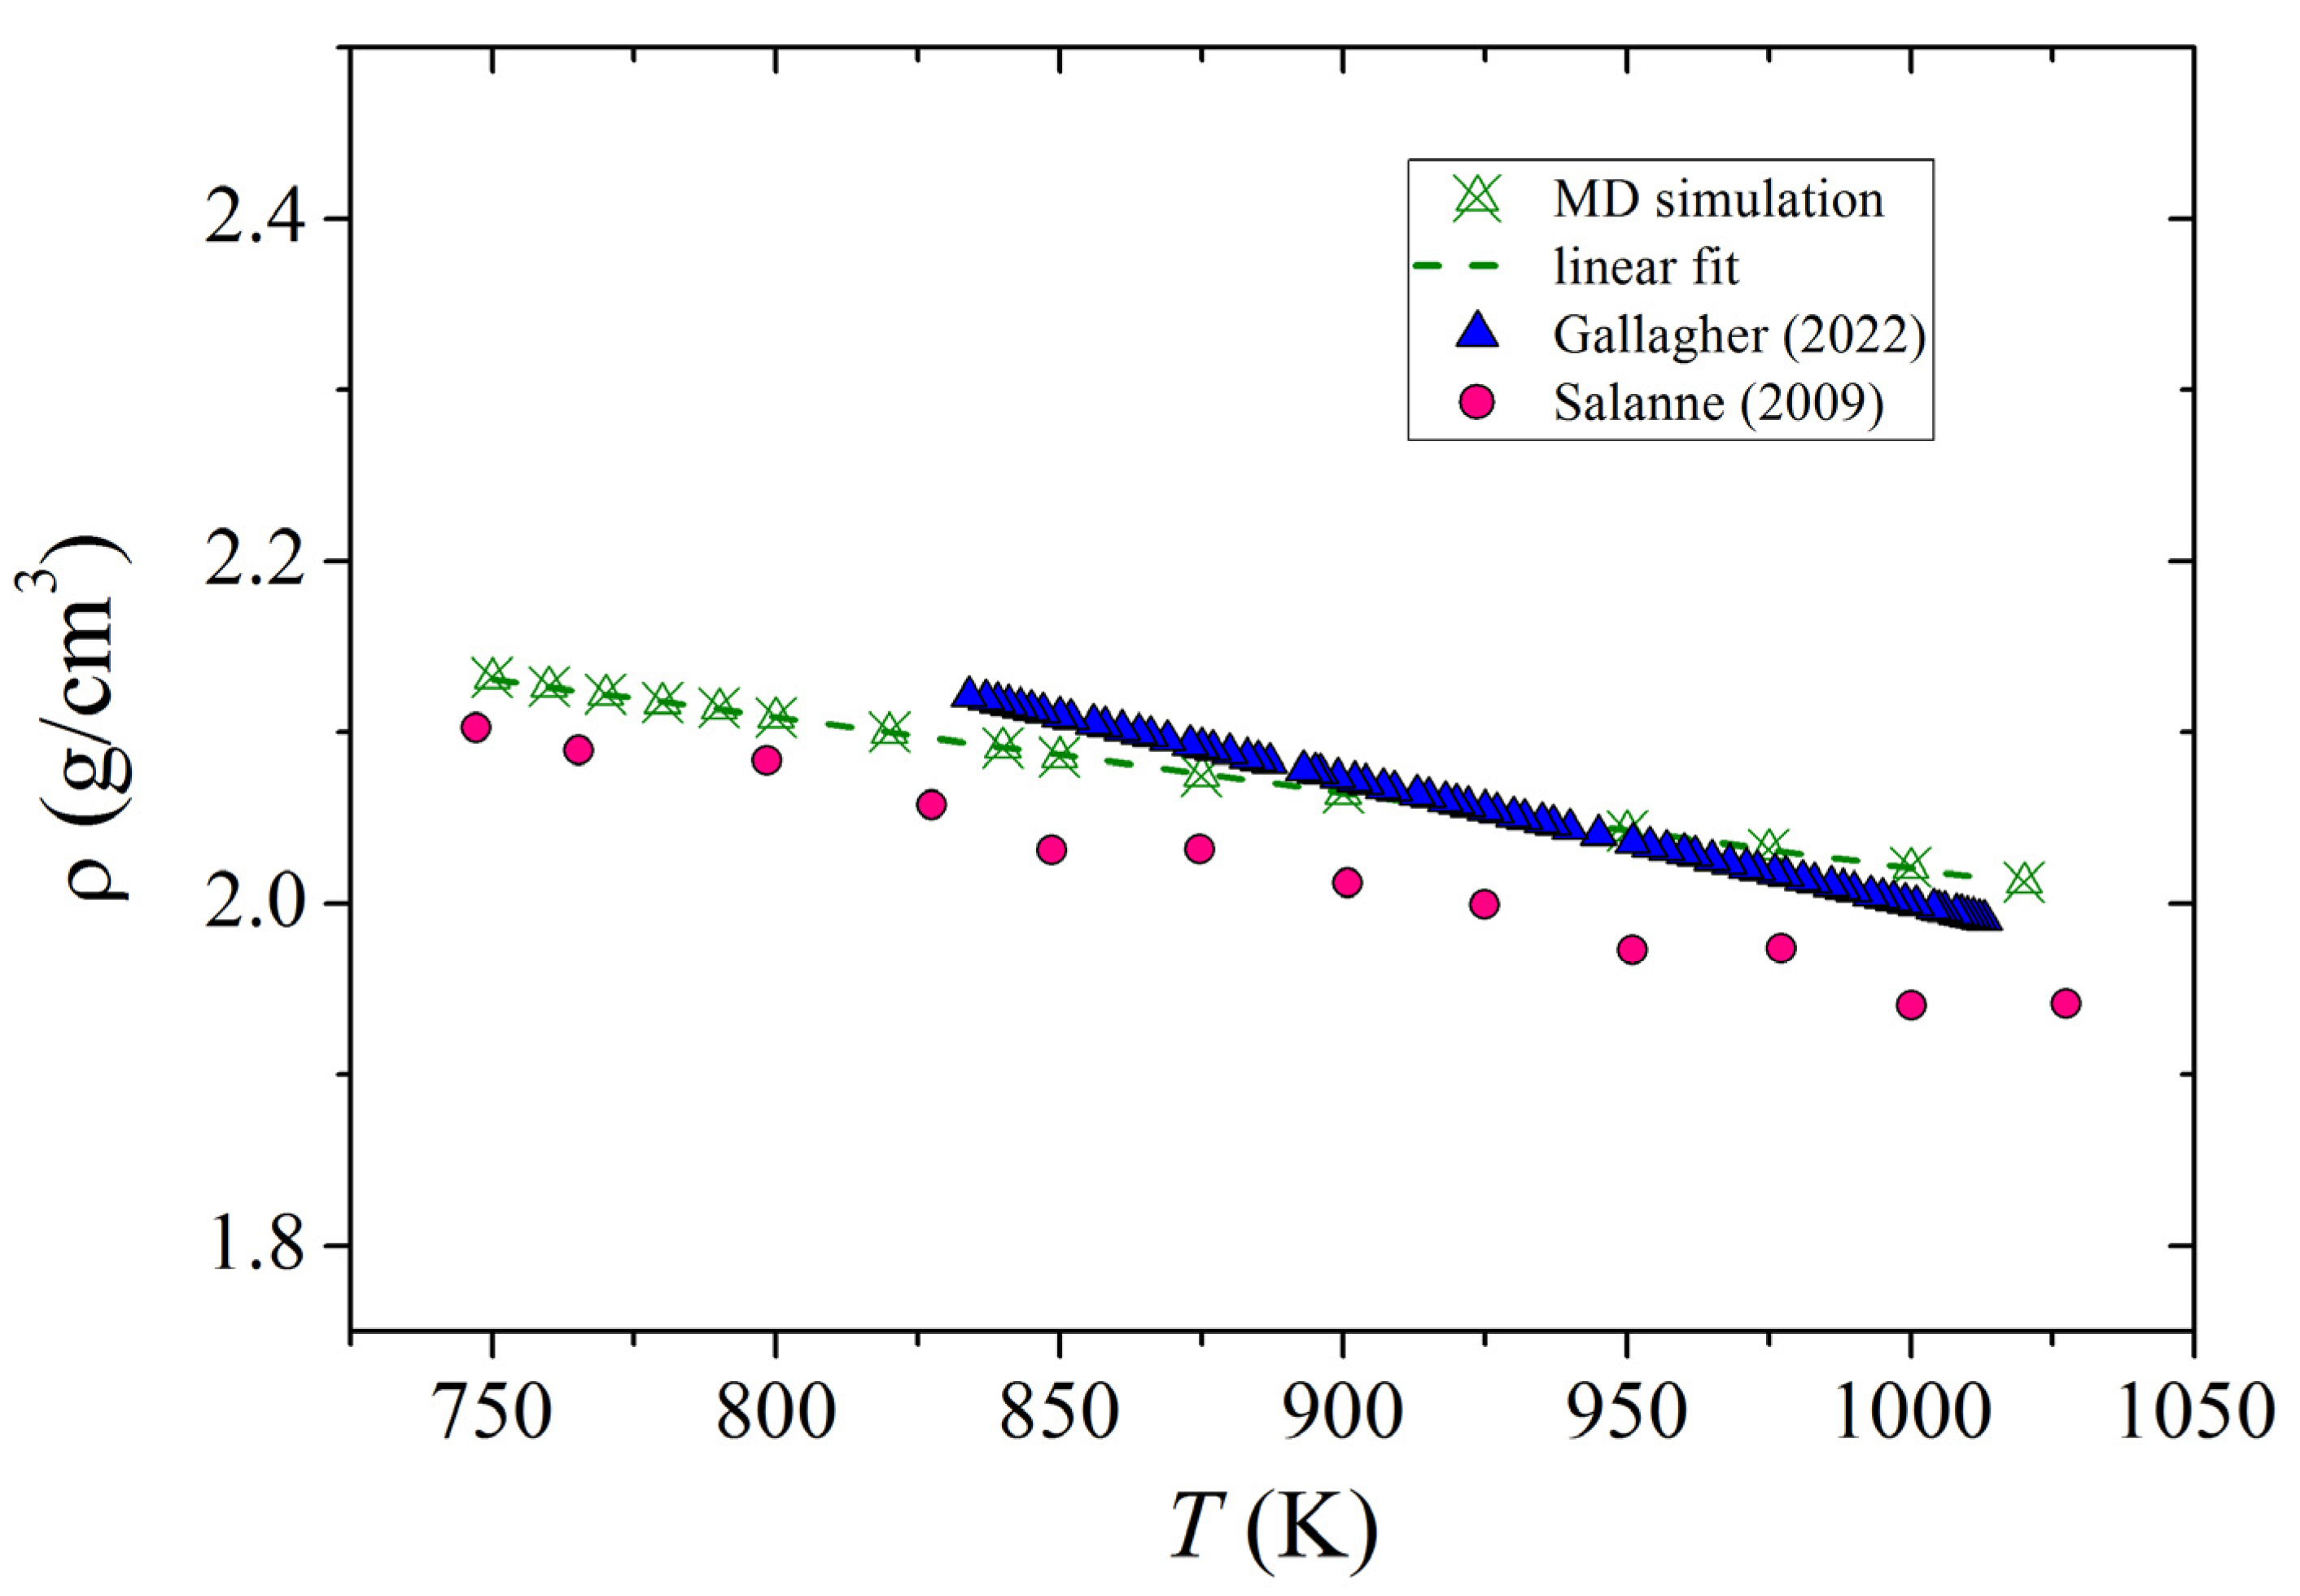
To characterize the model used, we calculated the density of pure FLiNaK in the temperature range studied here and compared the calculated density values with the available corresponding experimental data [28] and data from first-principle calculations [29]. The temperature dependence of the model and experimental density of FLiNaK melts (without additives) is shown in Figure 4. Our calculated densities differ from the corresponding model data of Salanne [29] (obtained with allowance for the polarizing effect) by no more than 3.4%, and from the experimental data [28] by less than 1.2%. The density of the “FLiNaK+15 mol.% CeF3” system determined by us at T = 975 K is 2.56091 g/cm3, while the experimental density at this temperature is 2.56179 g/cm3.

3.2. Self-Diffusion of Ions

The values of the self-diffusion coefficients of Li, Na, K, F, and Ce ions at different temperatures are presented in Table 2. In addition to the D values for the FLiNaK+CeF3 system, the values of the D coefficients for pure FLiNaK calculated by us as well as those obtained from the experiment [30] are also shown here. The experimental values of D determined at temperatures not exceeding 936 K are presented at two temperatures (800 and 880 K). According to our calculations, both for pure FLiNaK and for the FLiNaK+CeF3 system near the operating temperature (i.e., at T = 950 K) of MSR, F ions have the highest values of the coefficient D. The same result was obtained from MD ab initio calculations for pure FLiNaK in [8].
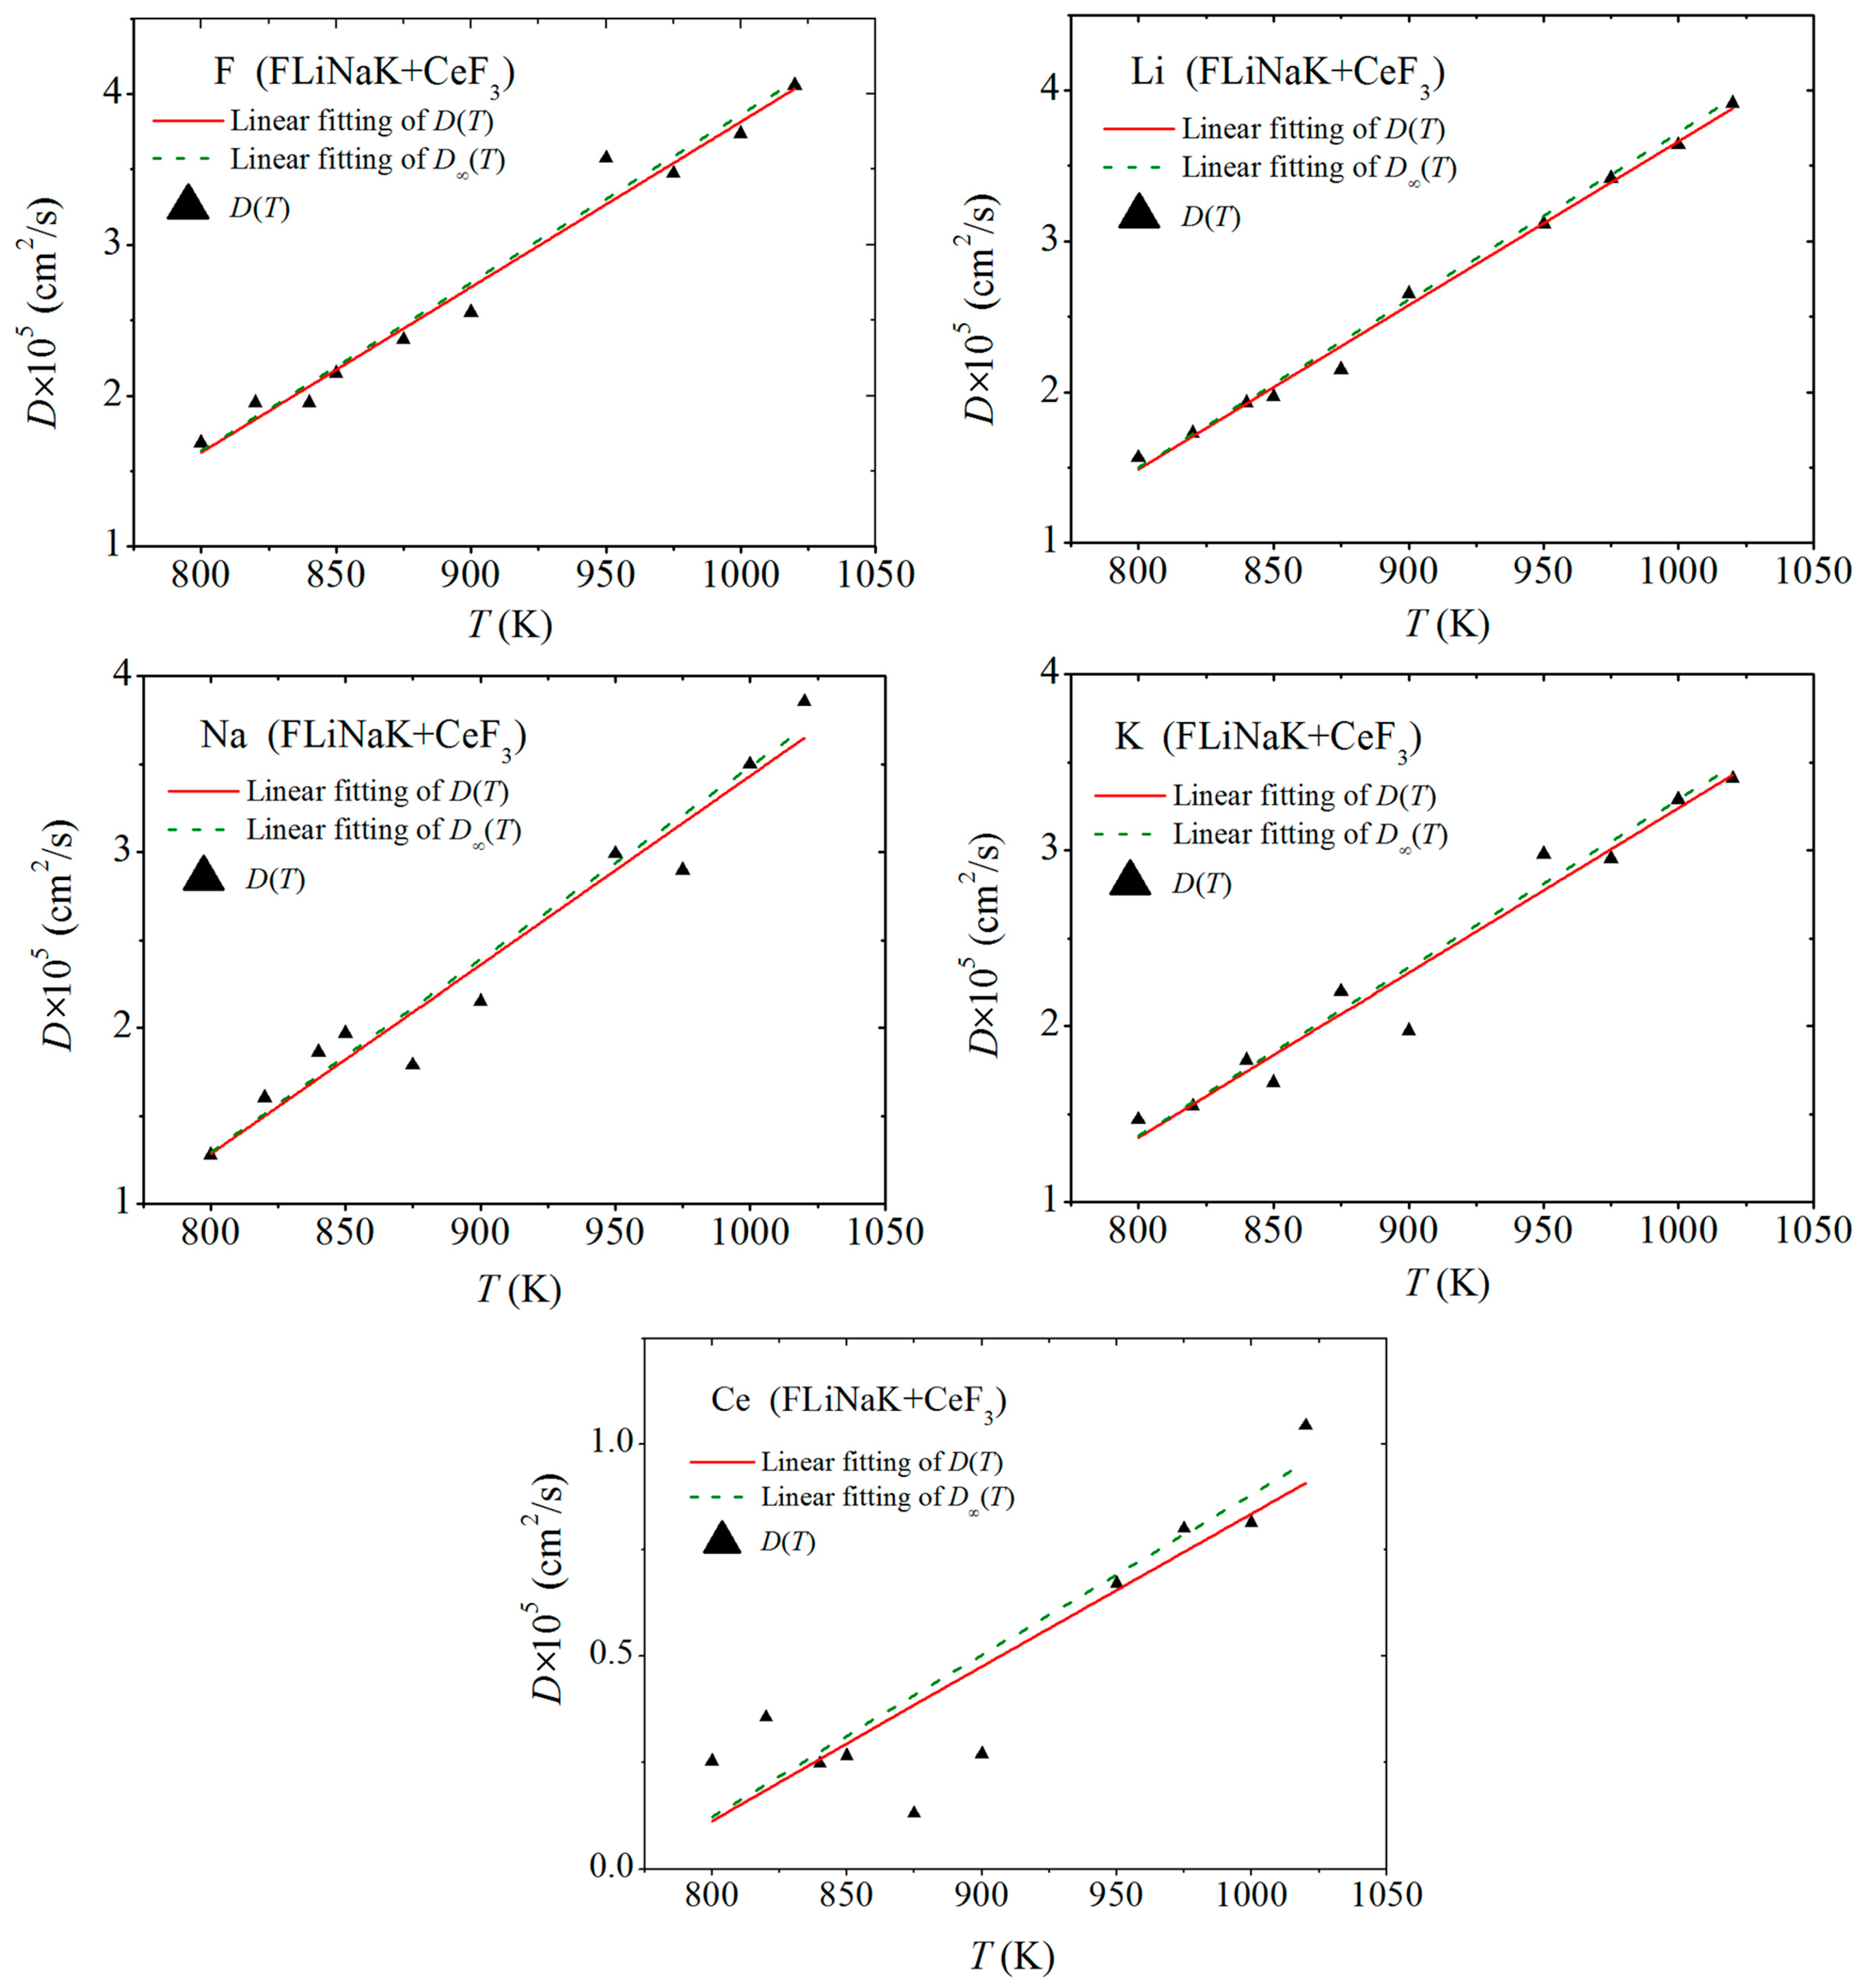
The temperature dependences of the calculated self-diffusion coefficients and their linear approximations for the FLiNaK+15 mol.% CeF3 system are shown in Figure 5. For the ions forming FLiNaK, there is good agreement between the calculated and approximated dependences D(T). However, in the case of Ce ions, the calculated values of the coefficient D have a strong scatter relative to the approximating straight line. For pure FLiNaK, the D values for the F and Li ions are similar over the entire temperature range under study. This may be due to the pairing of these ions and the joint motion of such pairs. However, when CeF3 is added to FLiNaK, this effect is not so noticeable due to the attraction of F ions to the trivalent Ce ions.
Approximation dependences D(T) for Li, Na, K, F и Ce ions are represented by an analytical expression:
D = aTb (10−5 cm2/s),
whose parameters a and b are listed in Table 3, and temperature T is expressed in K.
When passing from an MD system with PBC to an infinite system, a very slight increase (<2%) in the self-diffusion coefficients is observed, which are determined from the approximation dependence D(T) (relative to that of D(T)) for Li, Na, K, and F ions. For Ce ions, which have a much higher atomic weight, the coefficient D can increase up to 5% going to an infinite system. Here, the increase in the fraction of the correction is due to the low values of the coefficient D for heavy ions. It follows from [23] that electrostatic effects in an ionic system should reduce the D coefficient correction value that transforms the MD system with PBC into an infinite system.
In order to understand the origin of low D values for Ce ions, we performed two series of calculations in which the dependence of D on the charge and mass of the ion at T = 950 K was established. In the first series, Ce ions with a charge of +3 were assigned the mass of Li ions, Na or K. The charges and masses of the remaining ions remained unchanged. In the second series of calculations, the mass of Ce ions remained the same, but the charge of Ce ions changed in each of the calculations; these ions were given charge of +1, +2, +3, and +4. The calculations showed that the mass of the ion has very little effect on the value of the coefficient D. Thus, the discrepancy between D calculated with the minimum and maximum masses of the ion was only 37%. Moreover, at the minimum mass of the ion, the value of D turned out to be lower than at its maximum (i.e., ordinary) mass. At the same time, it was found that the charge of the ion strongly affects the D value. The lower the charge of heavy ions, the higher the D value obtained for them. Thus, the value of D at the charge of ions +1 was higher than the values of D for ions with charges +2, +3, and +4 by 1.6, 3.2, and 6.7 times, respectively.

3.3. Partial Radial Distribution Functions and Coordination Numbers

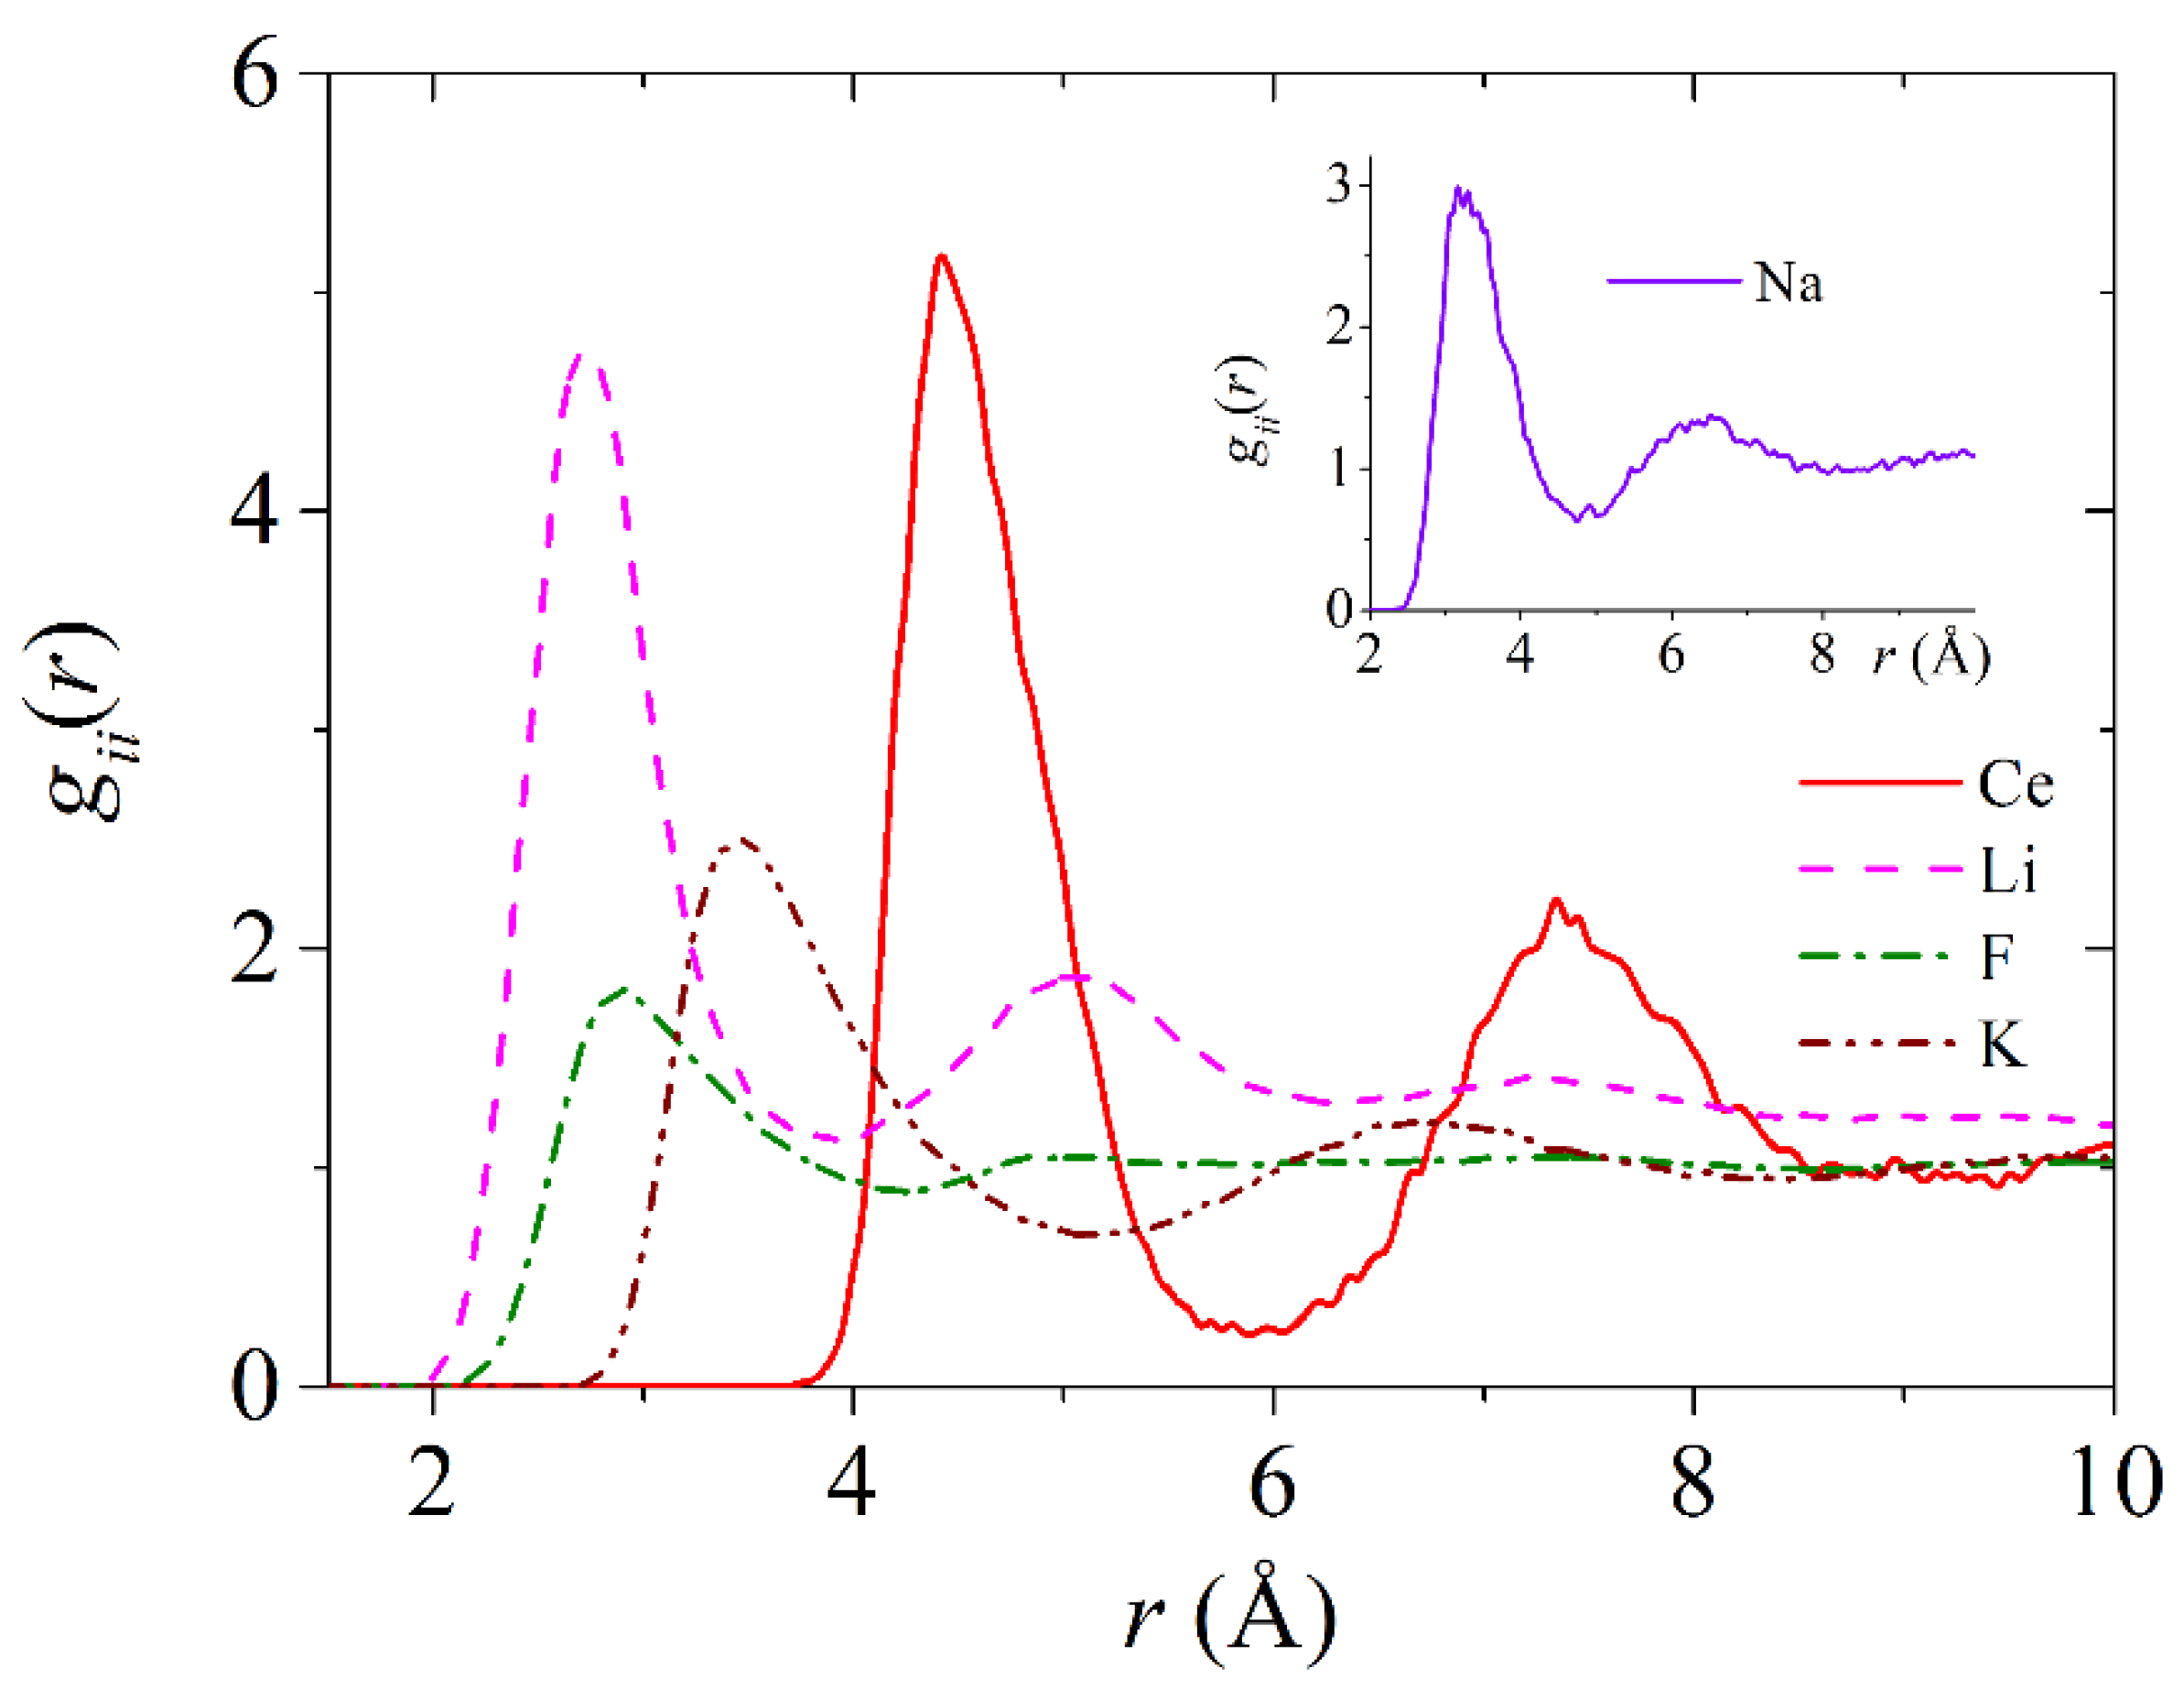
The average distribution of F ions around Li, Na, K, and Ce ions is characterized by the functions g i j ( r ) , shown in Figure 6. It can be seen that the location of the first maximum, which reflects the most probable distance from particle i to particles j of the first coordination sphere, shifts towards larger r as the values of i change from Li to Ce. This is due to the increase in particle diameter i when moving in this direction. A more clearly formed second order in the arrangement of F ions around Li ions is due to the greater abundance of the latter compared to other positive ions, and a similar order around Ce ions is associated with their large electric charge, due to which the attracted F ions slow down diffusion.
The cation–cation and anion–anion radial distribution functions for the FLiNaK+15 mol.% CeF3 system at a temperature of 950 K are shown in Figure 7. As can be seen from the figure, the maxima of the peaks of the functions corresponding to different components are localized at different distances, which are determined by both the size of the ions and the concentration of the components in the melt. The functions g Ce Ce (r) and g Li Li (r), have the highest peak intensities, which indicates a more “ordered” arrangement of like ions (Ce or Li) relative to each other. If in the first case, this can be due to the large electric charge of Ce atoms and, consequently, their large inertia, created by the surrounding F ions, then in the second case, this can be explained by the small size and mass of Li ions compared to other ions. The small size and mass of Li ions allows them to mix better and get stuck in the voids formed by larger ions.
The temperature dependence of the calculated coordination numbers for the molten salt mixture FLiNaK+0.15 mol.% CeF3 is shown in Figure 8. As can be seen from the figure, the coordination numbers for cations of the same name, as a rule, slightly decrease with increasing temperature. Moreover, a more significant decrease in n i i occurs for the lightest cations, i.e. when index i is defined as Li. A decrease in n i i with increasing temperature is practically not observed in the case of cation–anion pairs. Note that the F and Li ions, which have the highest representation in the molten salt under consideration, have the highest values of the coordination number n i i . Due to the low concentrations of Na and Ce ions in the system, the coordination numbers n i i were calculated in terms of the radial distribution functions g i i ( r ) , where i = Na or Ce, have very low values that do not adequately reflect the short-range order in the 3D subsystems of Na and Ce ions. The values of n i i for Na ions are also not given in [31,32], where the structure of pure molten FLiNaK was studied.
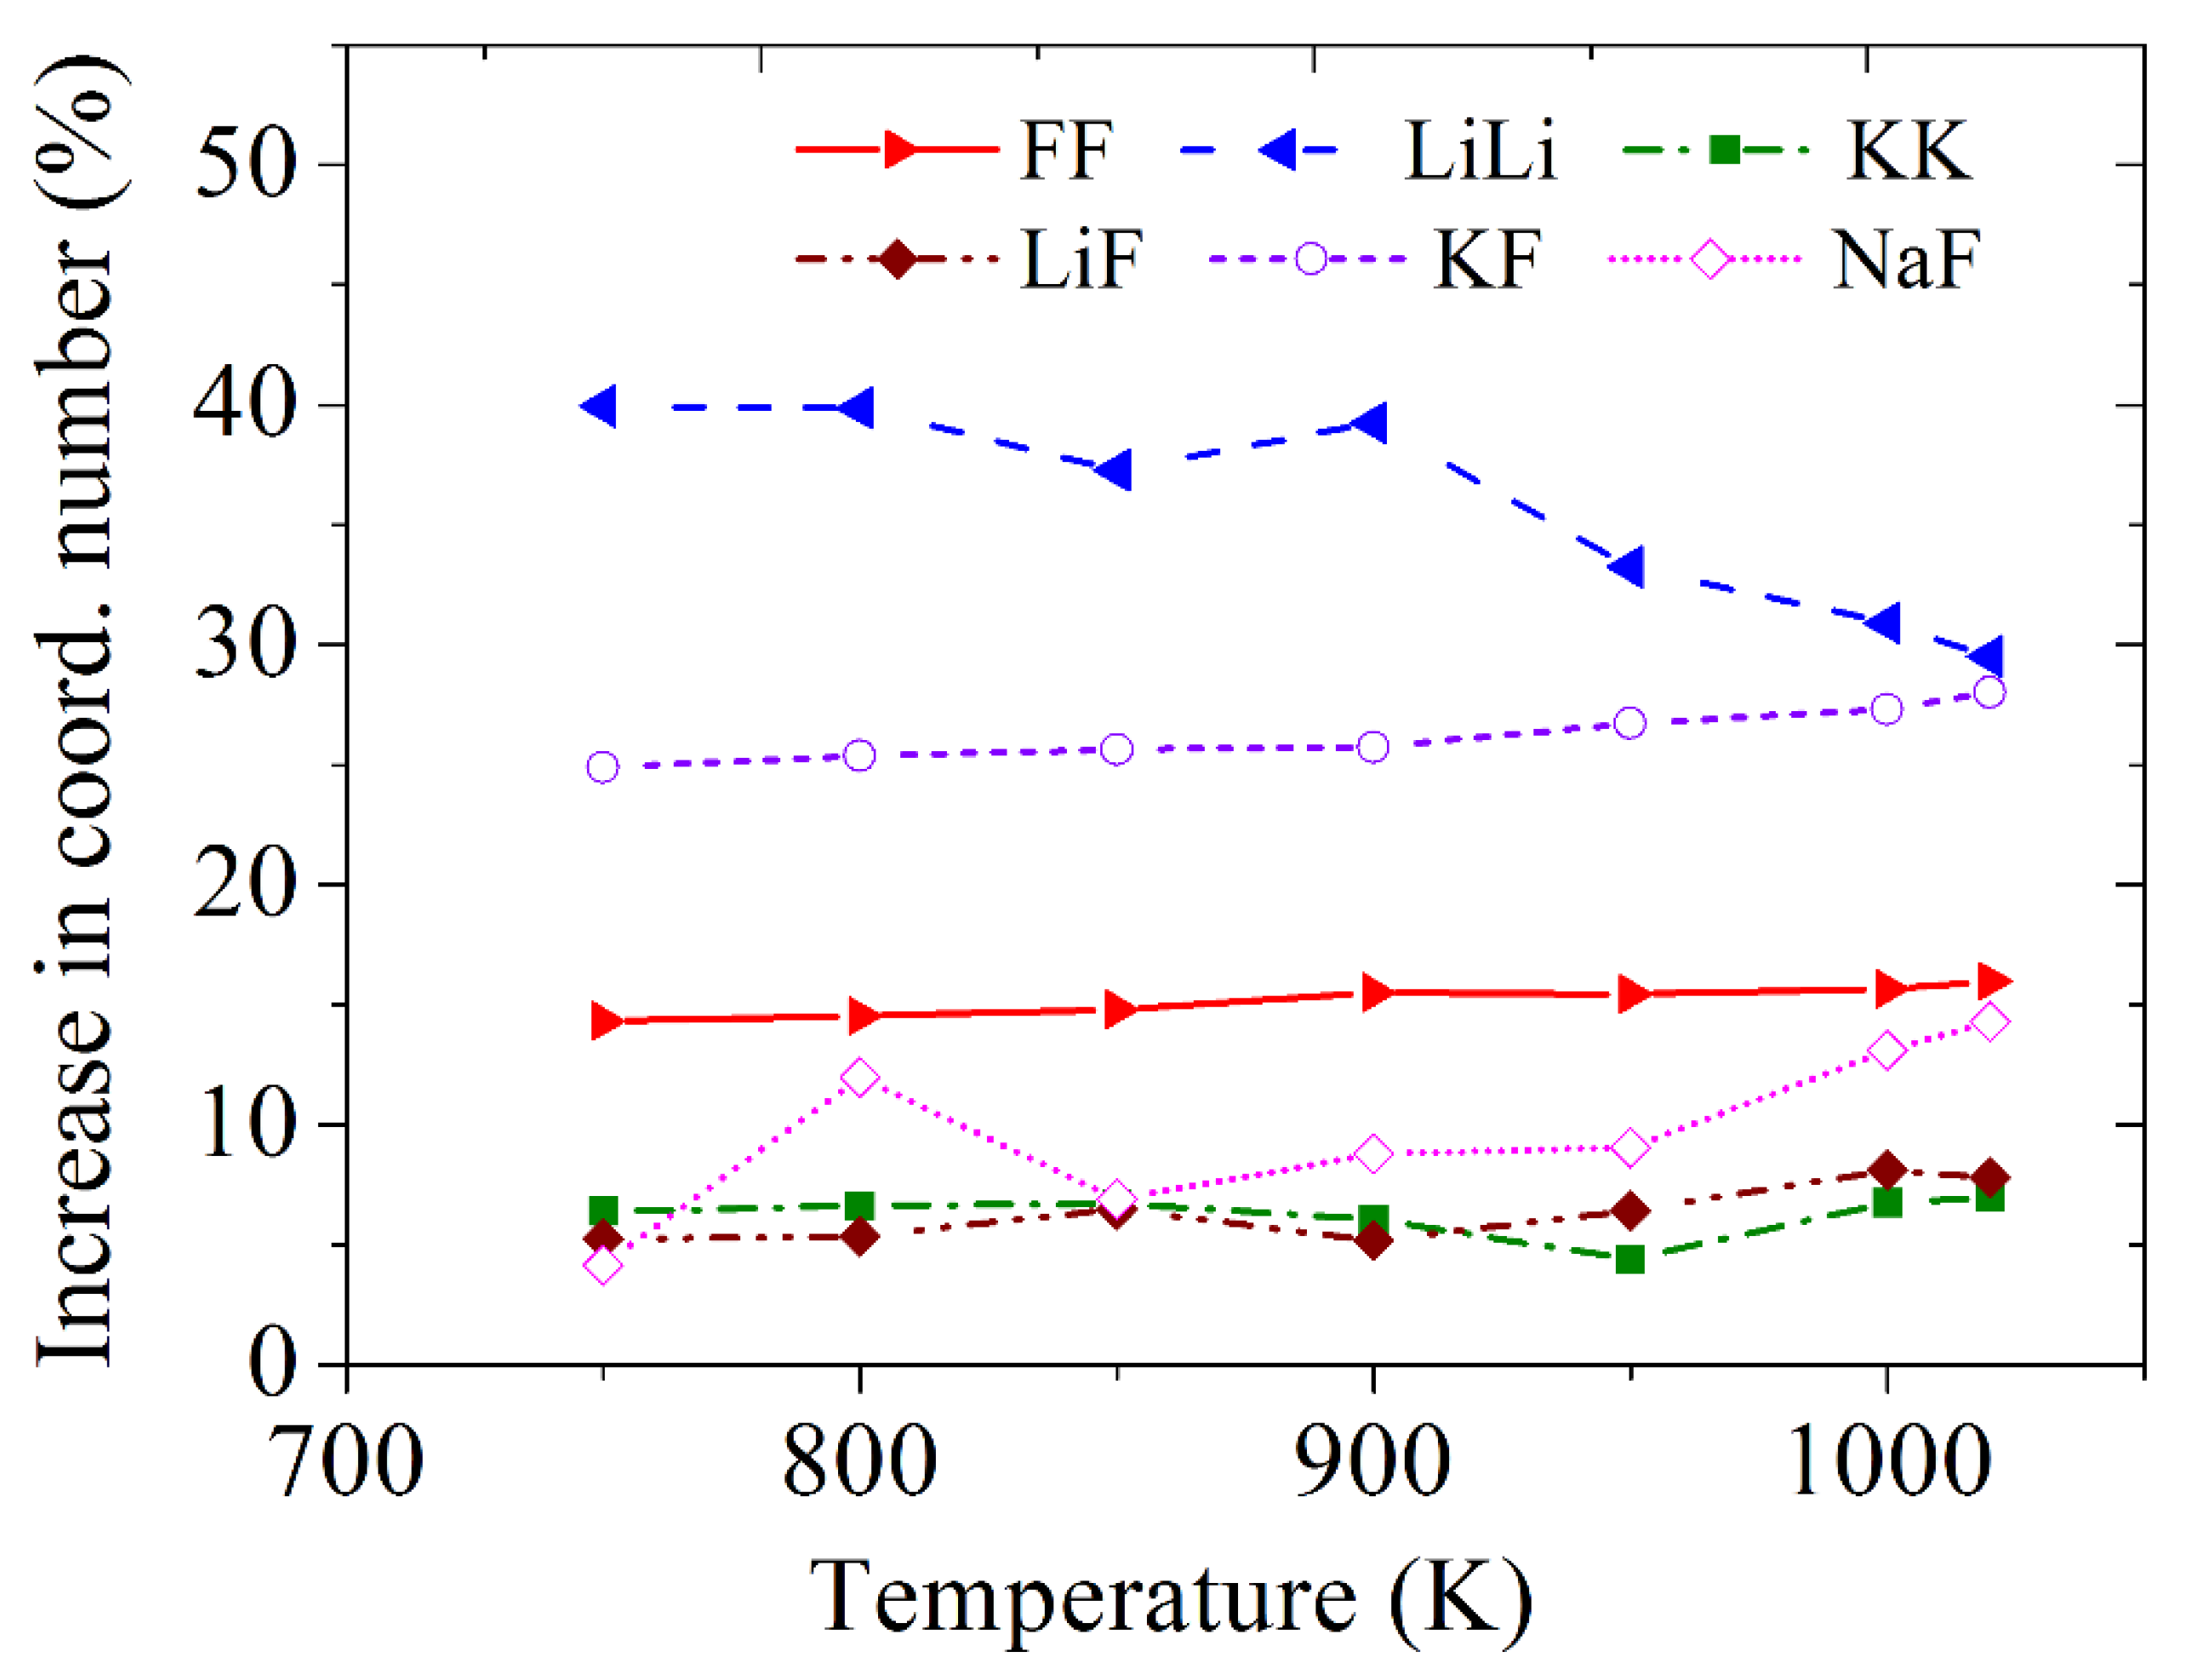
The increase in coordination numbers in FLiNaK+15 mol.% CeF3 relative to pure molten FLiNaK is shown in Figure 9. The addition of CeF3 to FLiNaK primarily increases the mole fraction of fluorine from 50% to 53.2% in the molten salt. As a result, an increase in the coordination numbers of the cation–anion (LiF, NaF, and KF) and anion–anion (FF) type seems quite natural. The smallest Li cation is able to surround itself with the largest number of Li cations. However, as the temperature increases, this short-range order is destroyed, which leads to growth retardation of the corresponding coordination number. It should be noted that not all coordination numbers increase in the molten salt FLiNaK+15 mol.% CeF3. The exception is the n i i numbers for Na, which decrease by 18–23% compared to the n i i of pure FLiNaK.

3.4. Statistical Geometry Method

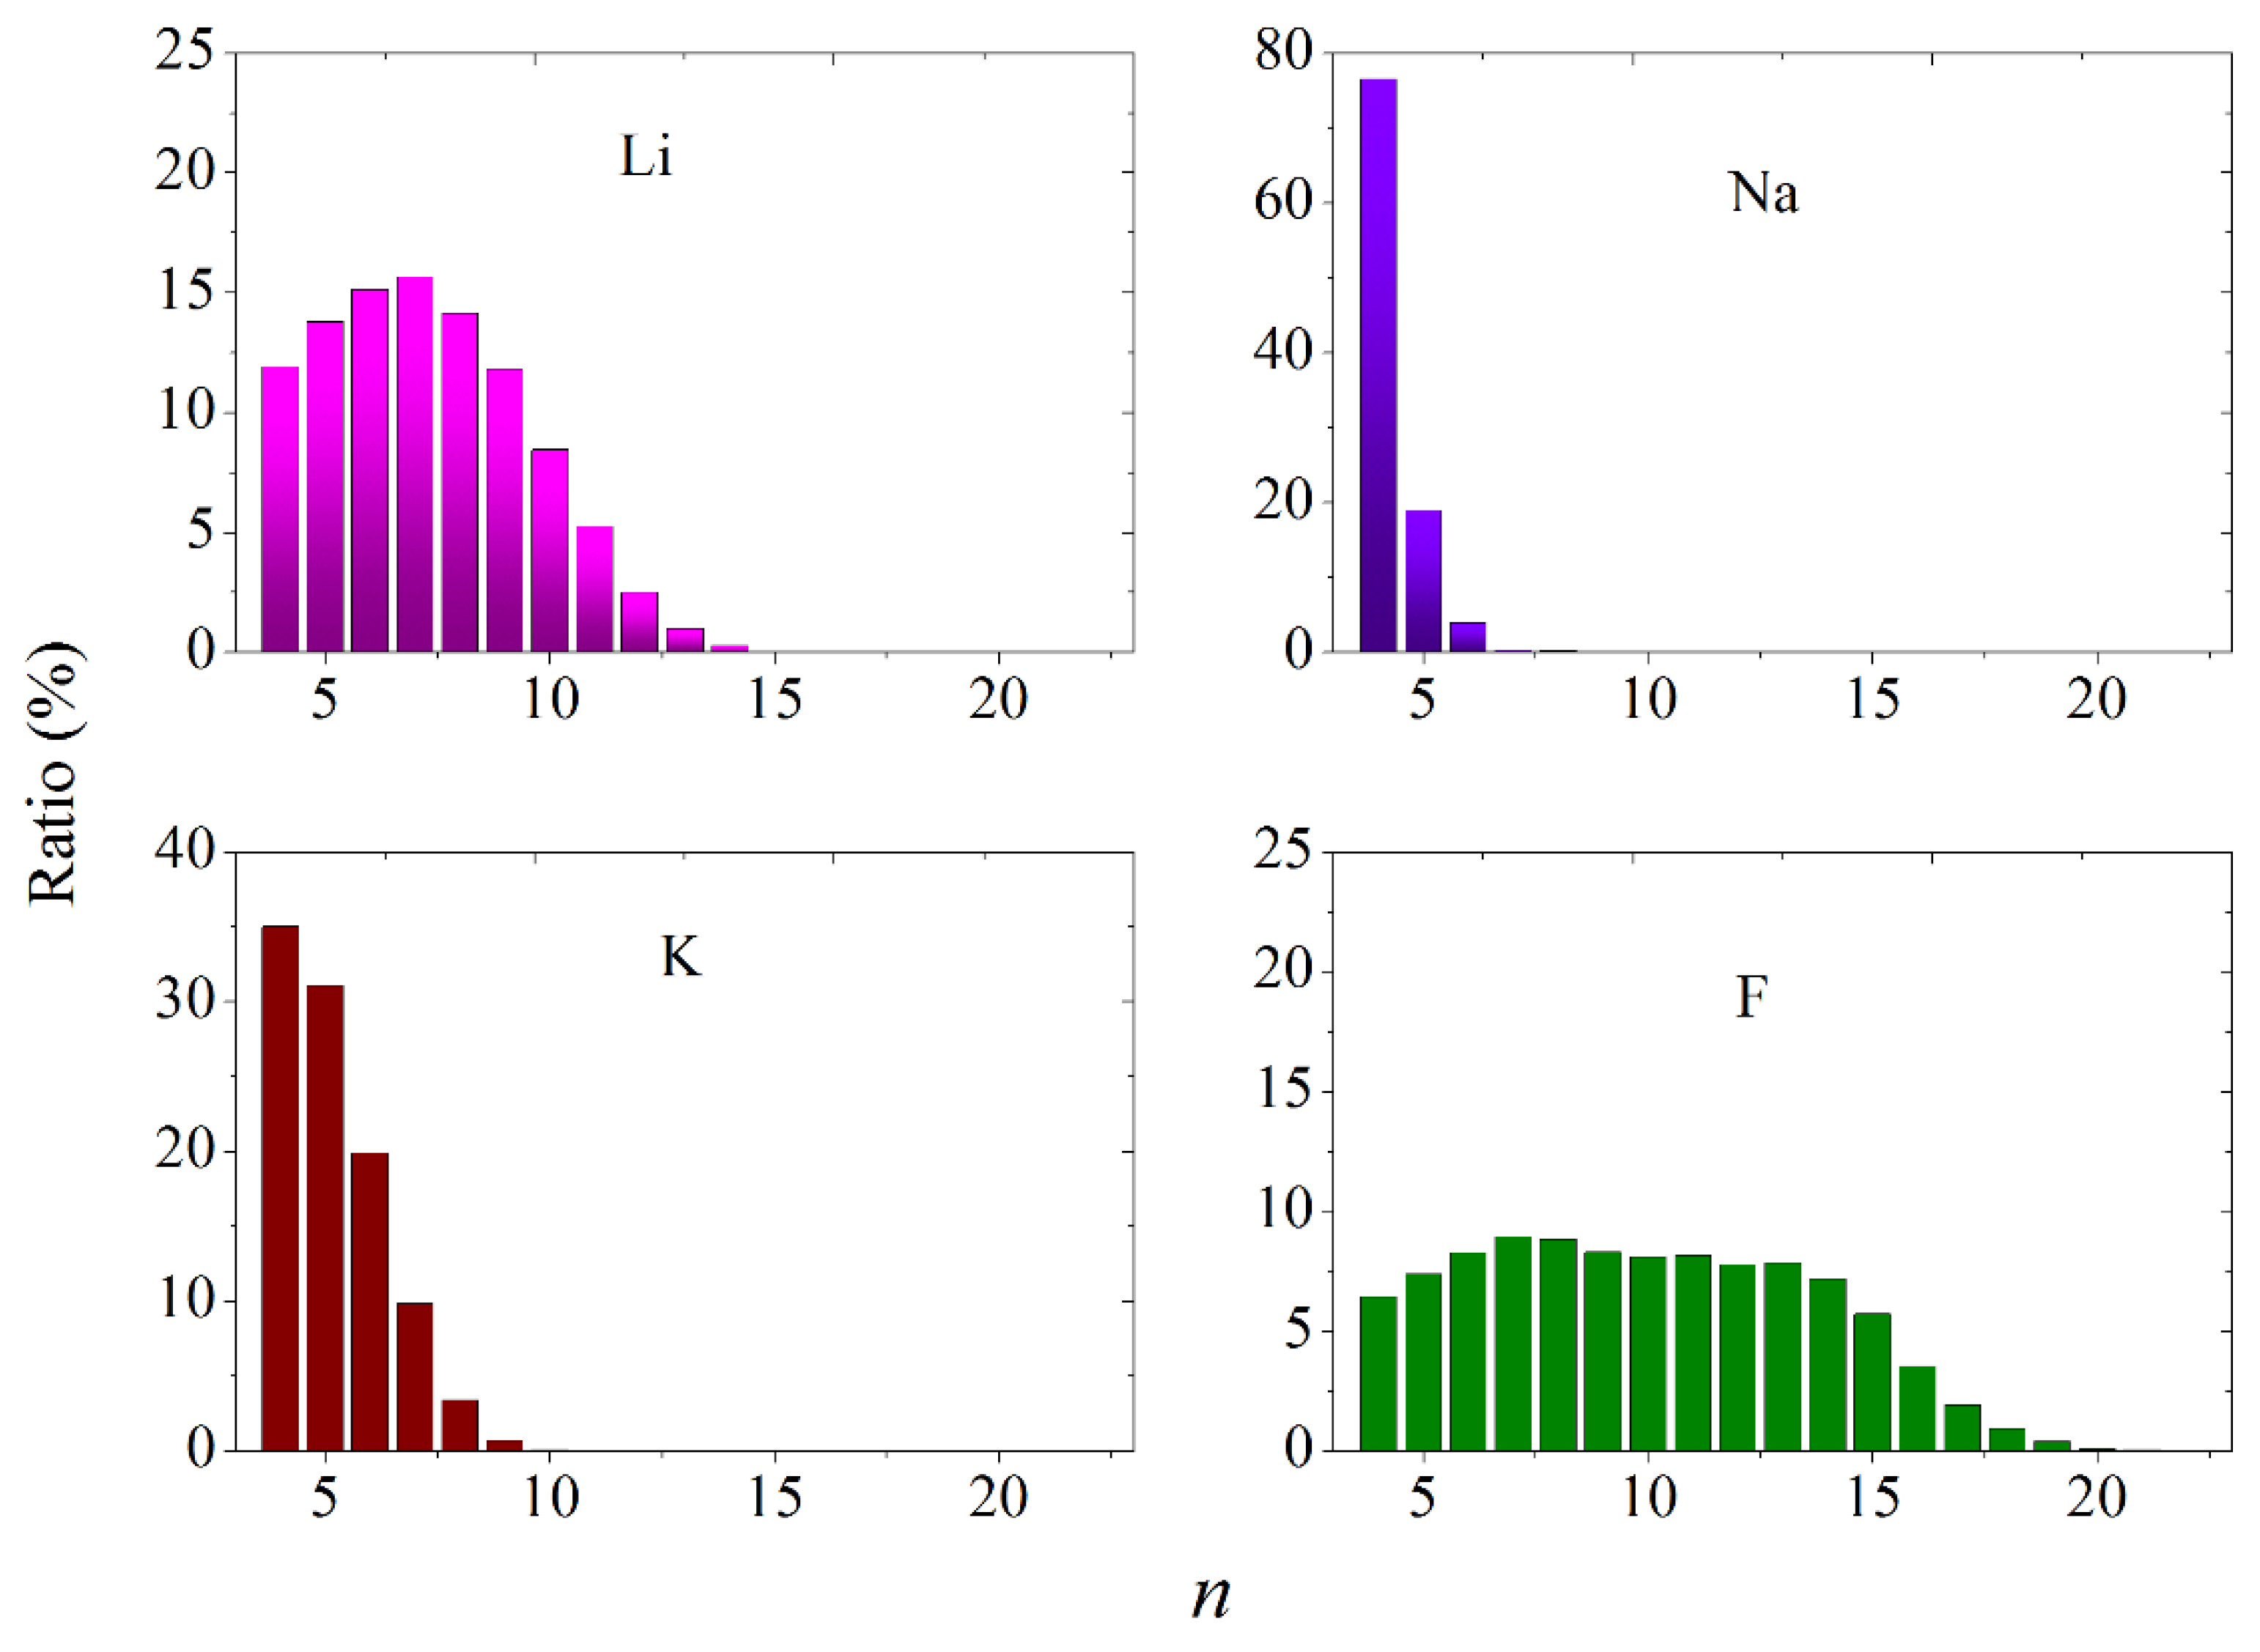
The VP distributions calculated at a temperature of 950 K for individual ionic subsystems by the number of faces (n distribution) are shown in Figure 10. Each of the subsystems has its own distinct form of the others’ n distribution. The most extended is the n distribution for the F ion subsystem. The maximum of this distribution is not clearly expressed and falls on n m = 7. This form of this distribution is due to the high mobility of F ions and their abundance. The subsystem of sodium ions, inferior to all in number, is characterized by the narrowest n distribution. The maxima of the n distributions for subsystems Na and K fall on n m = 4, and for the Li ion subsystem n m = 7.
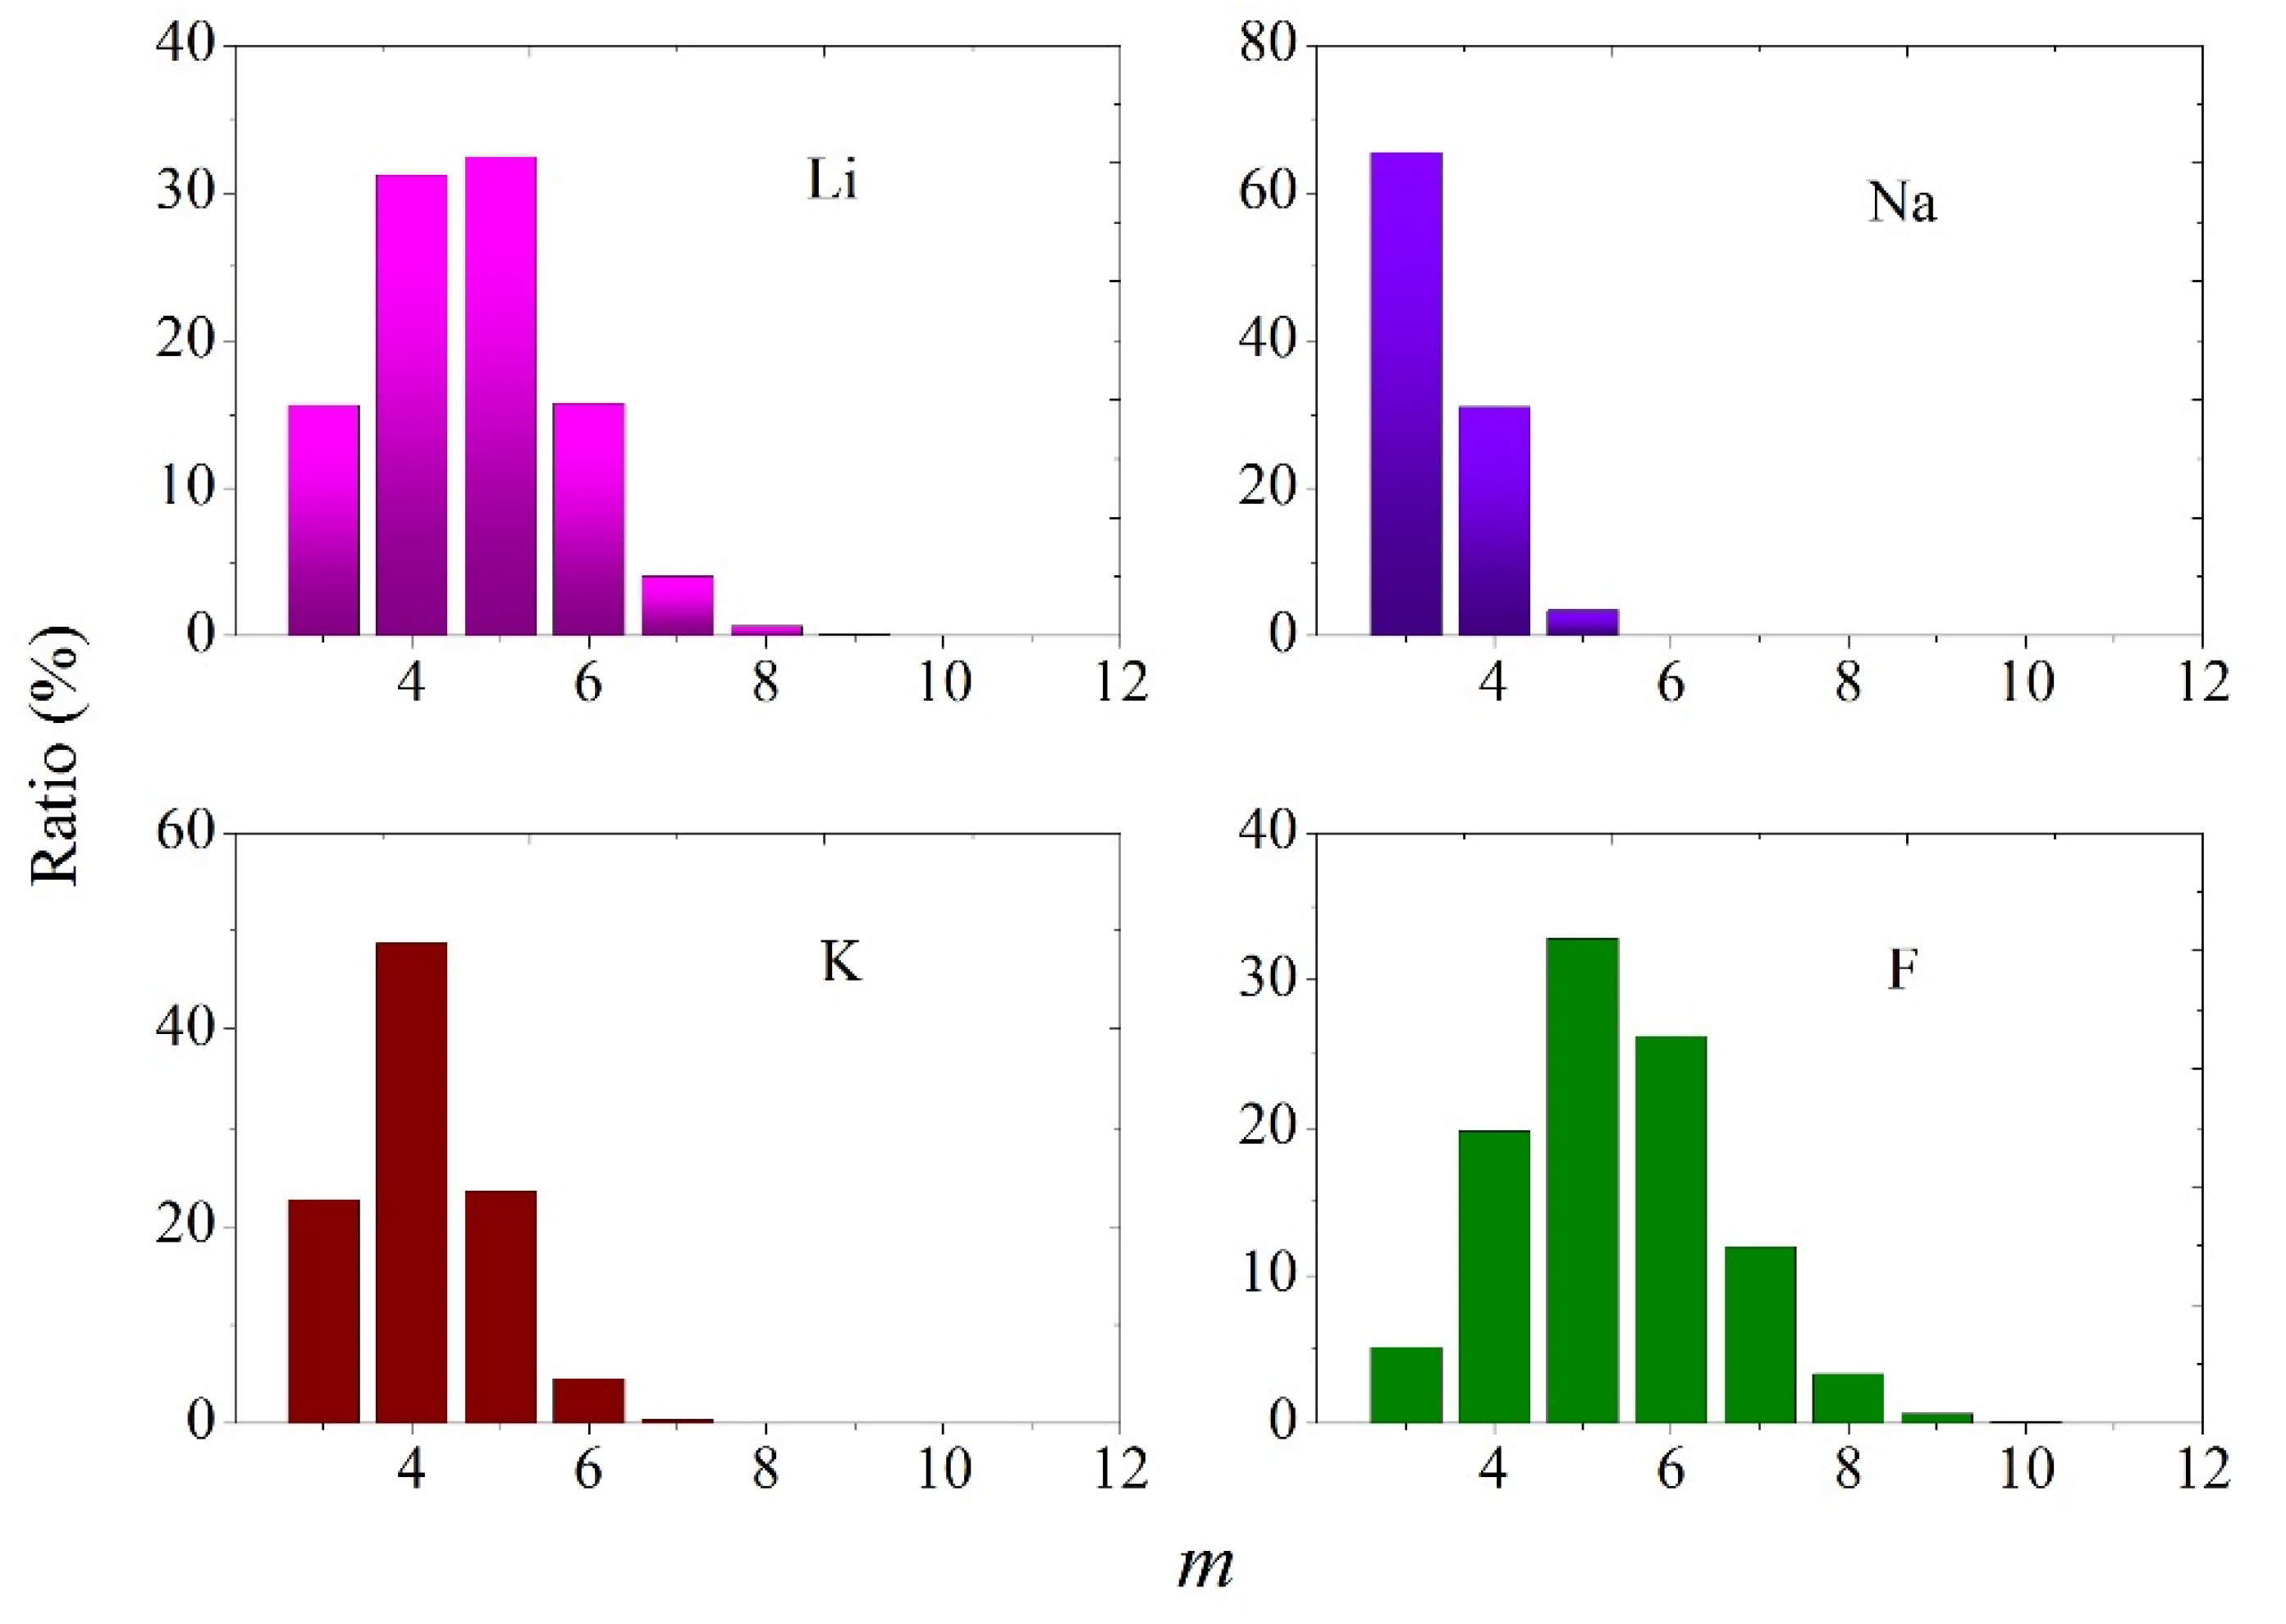
The distributions of VP faces by the number of sides (m distributions) are characterized by a wider representation of m-edge faces for the faster ion subsystems (F and Li) (Figure 11). Moreover, in these cases, the maximum m of the distribution falls on m m = 5 . For subsystems with slow diffusion and a small number of ions (K and Na), the locations of the maxima change to m m = 4 for K+ and to m m = 3 for Na+. The n and m distributions with n = 4 and m = 3 are seen in about 65% of the cases for the Na subsystem. This is an indication that for the sodium ion subsystem, in most cases, tetrahedral mutual arrangement of ions is observed.
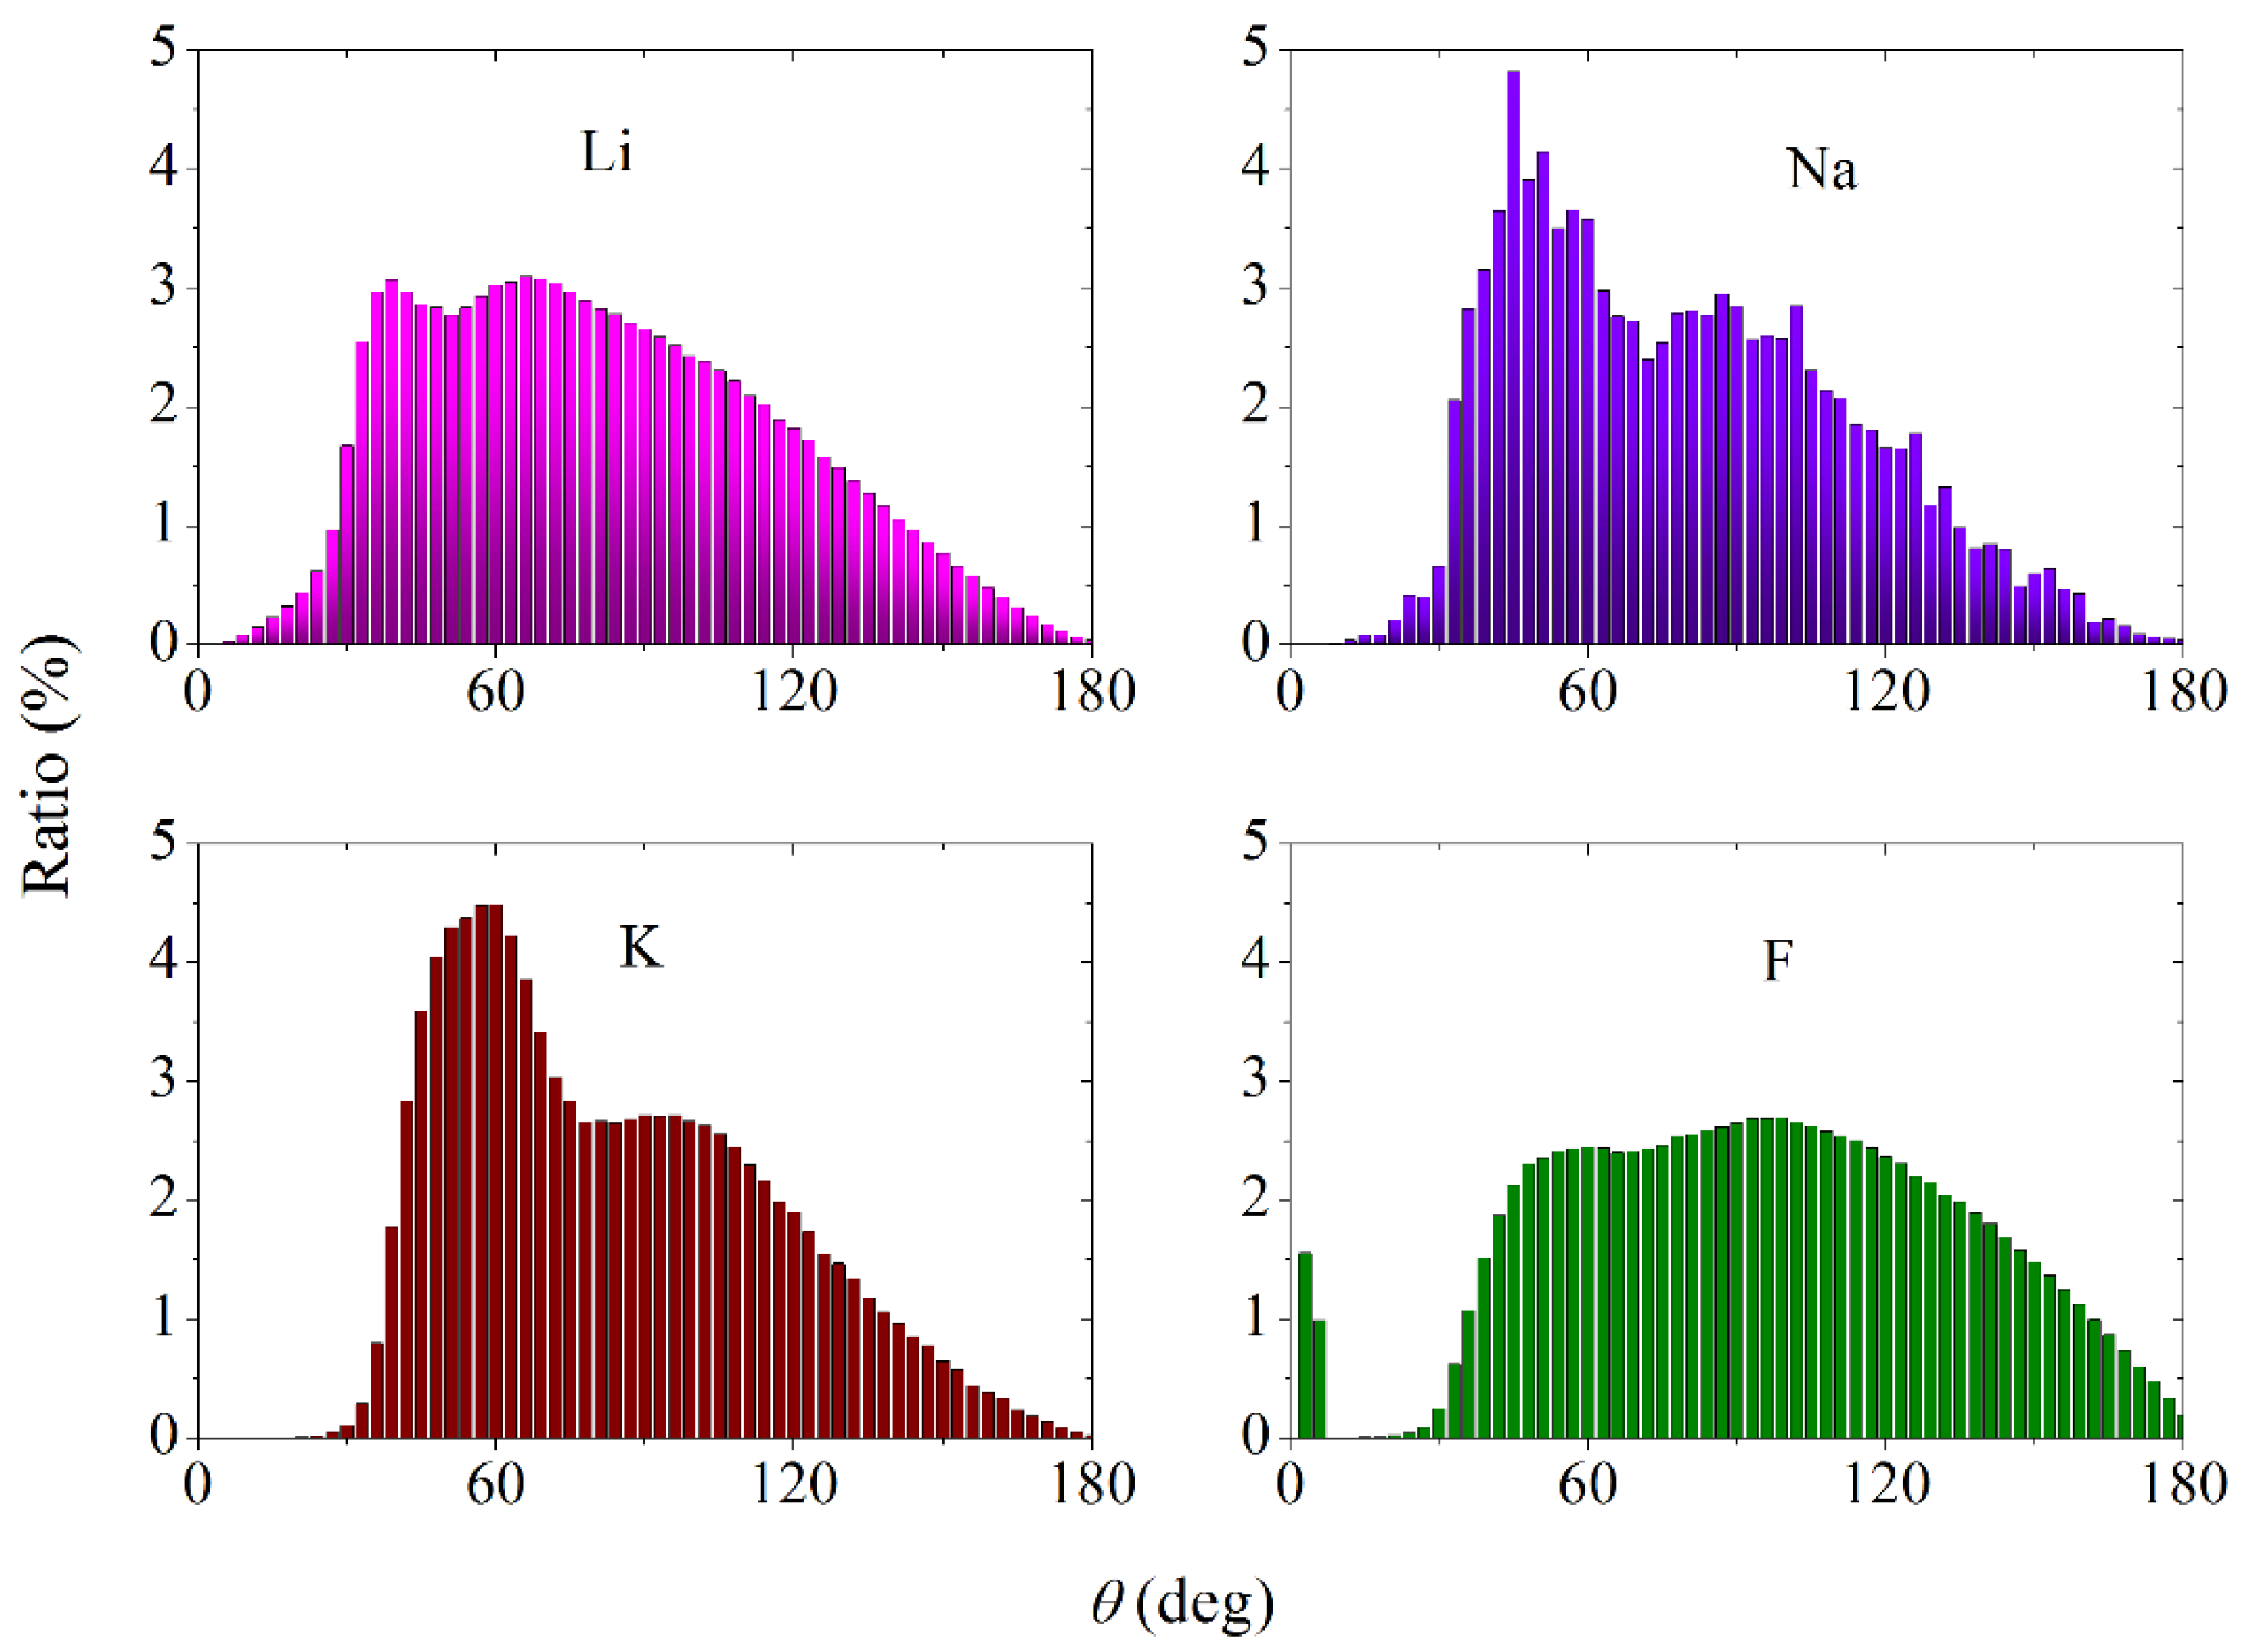
In four subsystems of different ions (Li, Na, K, F), the angular distribution of the nearest geometric neighbors (θ distribution) characteristic only for them (Figure 12) is found. The angular distribution for the lithium ion subsystem has two weakly resolved peaks of approximately the same intensity. In the case of subsystems of Na and K ions, the first peak has a high intensity, and the second peak has a low intensity and resolution. The difference between them is that in the first case, the global maximum of the spectrum falls at the angle θ = 45°, and in the second case, at θ = 60°. In addition, the θ spectrum for the Na subsystem is significantly jagged due to the small number of Na ions in the model. For the F ion subsystem, two peaks of the main part of the θ spectrum have an extremely poor resolution. Moreover, the intensity of the second peak is slightly higher than the intensity of the first peak. An important feature of this distribution is the appearance of a peak in the vicinity of the angle θ = 0°, which was not observed in any of the θ spectra obtained for systems of positive ions.
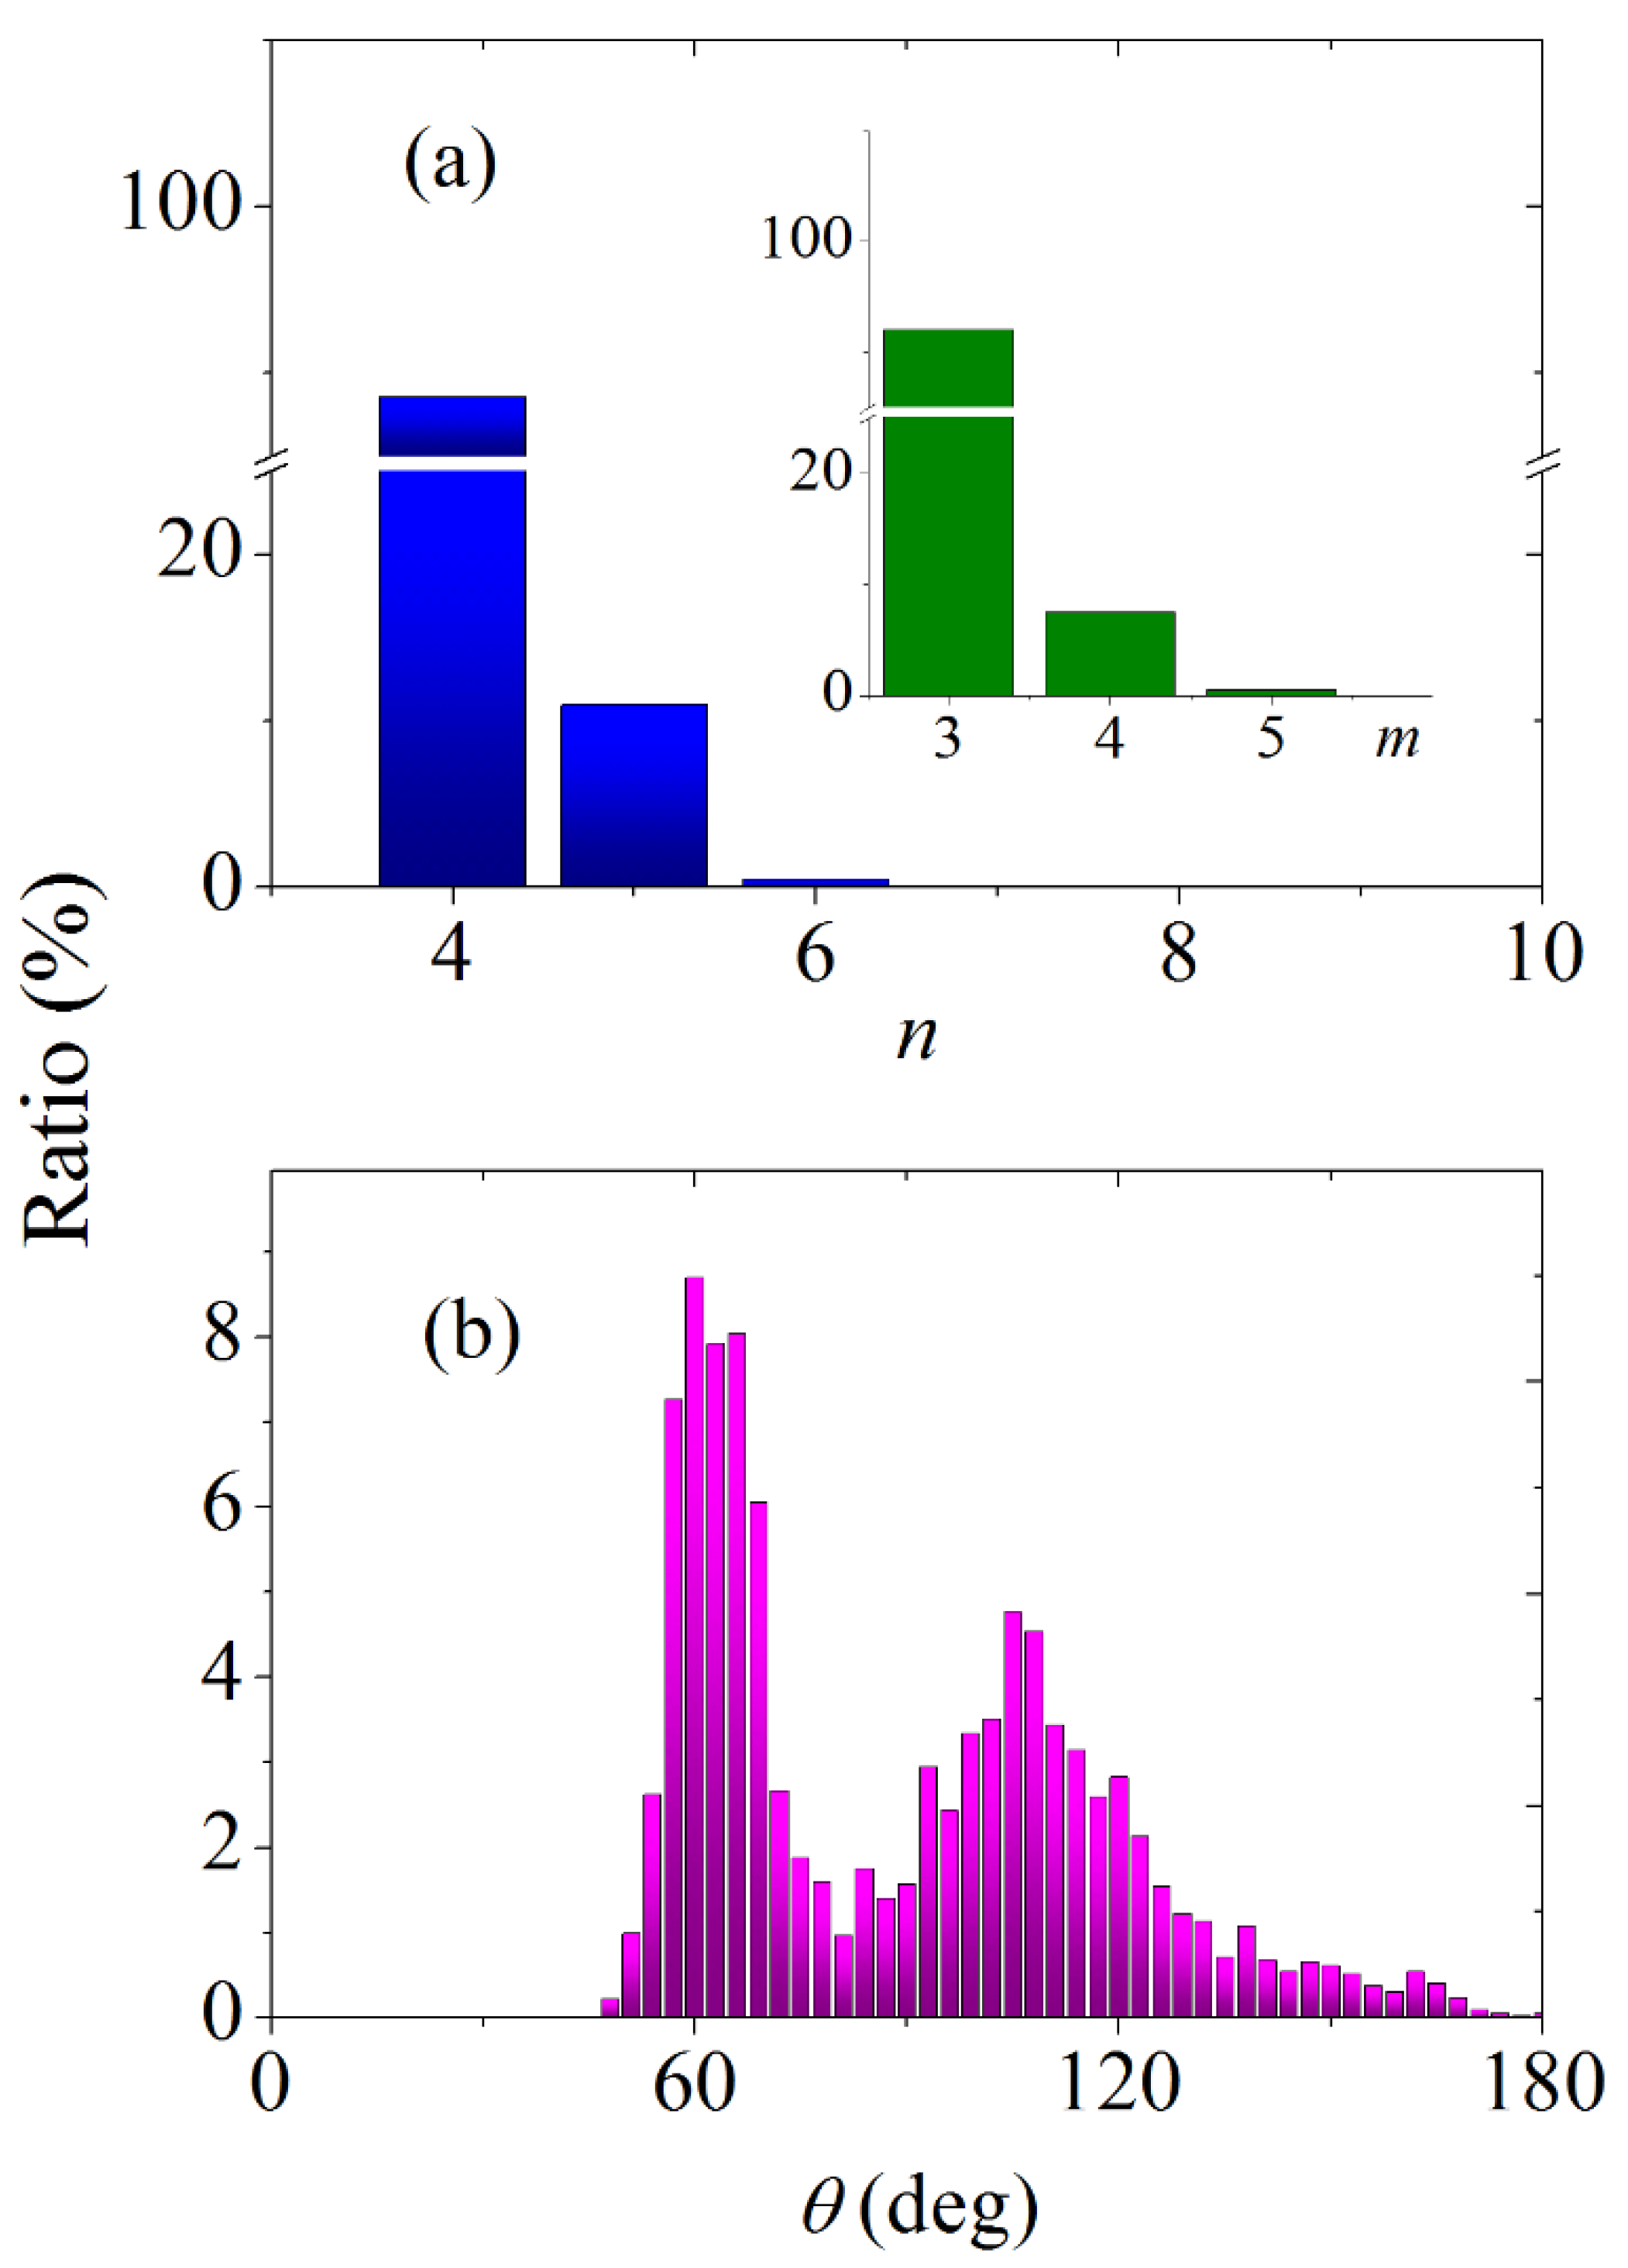
The behavior of Ce ions in the molten salt mixture FLiNaK–CeF3 is characterized by the distributions shown in Figure 13. As can be seen from the figure, 88.5% of all polyhedra characterizing the subsystem of Ce ions are 4-faced polyhedra. At the same time, it can be seen from the m distribution (inset) that the number of triangular faces in VPs is 92%. Therefore, with a high degree of probability, the packing of Ce ions in the considered subsystem is tetrahedral. The angular distribution of the nearest geometric neighbors for this subsystem has two well-resolved peaks with maxima localized at θm = 60° and 105°, respectively.

4. Discussion

Our calculation of the self-diffusion coefficients of ions in the molten salt mixture FLiNaK+CeF3 showed that in the entire temperature range under study, the F- and Li+ ions are more mobile than the Na and K ions. Such a ratio between the mobility values is primarily determined by the composition of the liquid–salt mixture and only then by the atomic weights of the components. The low self-diffusion coefficient of the Ce ion is mainly related to its binding by F ions [33]. The slowing down of dynamics by a local charge also exists in ionic liquids [34].
The partial radial distribution functions g Ce Ce ( r ) and g Li Li ( r ) have the most pronounced first and second peaks, which reflects the greater structural stability in these subsystems. The subsystems formed by ions, whose representation clearly dominates in the salt melt, are characterized by the largest coordination number (as is the case with FF indexing). However, when the concentrations of the components differ slightly, the size of the ion may be more important. Thus, the coordination number with the KK index slightly exceeds the corresponding characteristic with the LiLi index, although the molar concentration of Li ions is slightly higher than that of K ions. The form of the calculated partial radial distribution function g Ce F ( r ) , which has a high, well-resolved first peak, indicates the presence of a stable short-range order in the arrangement of F ions around Ce ions. The value of the coordination number, determined from the cation–anion radial distribution function, is mainly determined by the size of the cation. For the molten salt studied here, the value of this coordination number increases following the sequence LiF, NaF, KF, CeF.
For almost all ions present in the system, with the exception of K ions, the addition of CeF3 to the FLiNaK salt melt slows down the movement of these charge carriers and increases the cation–cation, anion–anion, and cation–anion coordination numbers. The amount of increase in each coordination number depends on such factors as the size of the ion, the concentration of the corresponding component in the salt melt, and the temperature of this melt. The combination of these factors makes the increase in the coordination number n Li Li the most noticeable, which, depending on temperature, can vary from 29 to 40%.
Topological characteristics (n, m distributions) point to the irregular nature of the distribution of particles in the subsystems of F and Li ions and the presence of a more stable short-range order (with a narrower n, m distribution) for the subsystems of Na and K ions. In addition, the fifth-order rotational symmetry inherent in a simple liquid dominates in the representation of the structure of subsystems with fluorine and lithium ions. At the same time, when describing the structure of subsystems of Na and K ions, the most important is the third and fourth-order rotational symmetry more inherent in the periodic crystal [35].
The breakdown of the system into subsystems of the same type of ions showed that the structures of these subsystems differ significantly. In particular, the shapes of the angular distributions of the nearest geometric neighbors for the subsystems of Li, Na, K, F, and Ce ions differ dramatically, and the maxima of these distributions are set at 66°, 45°, 60°, 99°, and 60°, respectively. Only in the case of the subsystem of cerium ions, the θ spectrum is represented by well-resolved peaks, which may indicate the presence of a certain regularity in the mutual arrangement of Ce ions.
A detailed study of the structure of molten salt and the temperature changes in its kinetic properties are important in the study of a dynamic system, such as MSR. In this system, phase transitions may not occur instantly, but within a few minutes. Moreover, in the presence of temperature jumps of about 100 K, precipitation and nonequilibrium phases appear. A decrease in the temperature of the salt melt is associated with such phenomena as the formation of complex ions and a change in the coordination of ions [36].

5. Conclusions

In the present work, the diffusion and detailed structure of a molten FLiNaK+CeF3 salt mixture are investigated at temperatures determined by the MSR operating temperature range. The calculation of the kinetic characteristics showed that, in the temperature range acceptable for MSR operation, the self-diffusion coefficients of the ions forming FLiNaK have a linearly increasing temperature dependence. However, the magnitude of these coefficients is not inversely proportional to the atomic weights of the ions and is largely determined by the quantitative composition of the salt melt. The representation of the system in the form of separate ionic subsystems made it possible to determine the partial coordination numbers and their change during the formation of this salt melt from a pure FLiNaK melt. It was found that non-crystallographic symmetry, i.e., fifth-order rotational symmetry predominates in the light ion subsystems, which are also the most numerous. In subsystems with heavier and less represented ions, rotational symmetry of the third or fourth order comes to the fore. Heavy inclusions in the form of Ce3+ ions in a well-mixed molten salt predominantly form a tetrahedral sparse network, in which each such ion is geometrically surrounded by four similar ions.
Thus, using molecular dynamics simulation, the temperature dependences of important physicochemical properties of the FLiNaK+CeF3 salt melt, which in experimental studies can replace the FLiNaK+PuF3 melt with similar properties, are determined.

Funding

This work is executed in the frame of the scientific theme of Institute of High-Temperature Electrochemistry UB RAS, number FUME-2022-0005, registration number 122020100205-5.

Institutional Review Board Statement

Not applicable.

Informed Consent Statement

Not applicable.

Data Availability Statement

The data presented in this study are contained within the article.

Acknowledgments

The author expresses gratitude to K.P. Katin and M.M. Maslov for help in designing interaction potentials. These calculations were performed on a hybrid cluster type computer “URAN” at the N.N. Krasovskii Institute of Mathematics and Mechanics of the Ural Branch of the Russian Academy of Sciences with a peak performance of 216 Tflop/s and 1864 CPU.

Conflicts of Interest

The author declare no conflict of interest.

References

  1. Serp, J.; Allibert, M.; Beneš, O.; Delpech, S.; Feynberg, O.; Ghetta, V.; Heuer, D.; Holcomb, D.; Ignatiev, V.; Kloosterman, J.L.; et al. The molten salt reactor (MSR) in generation IV: Overview and perspectives. Prog. Nucl. Energy 2014, 77, 308–319. [Google Scholar] [CrossRef]
  2. Rubiolo, P.R.; Retamales, M.T.; Ghetta, V.; Giraud, J. High temperature thermal hydraulics modeling of a molten salt: Application to a molten salt fast reactor (MSFR). ESAIM Proc. Surv. 2017, 58, 98–117. [Google Scholar] [CrossRef] [Green Version]
  3. Lizin, A.A.; Tomilin, S.V.; Gnevashov, O.E.; Gazizov, R.K.; Osipenko, A.G.; Kormilitsyn, M.V.; Baranov, A.A.; Zaharova, L.V.; Naumov, V.S.; Ponomarev, L.I. PuF3, AmF3, CeF3, and NdF3 solubility in LiF-NaF-KF melt. At. Energy 2013, 115, 11–17. [Google Scholar] [CrossRef]
  4. Ponomarev, L.I.; Seregin, M.B.; Mikhalichenko, A.A.; Parshin, A.P.; Zagorez, L.P. Validation of actinide fluoride simulators for studying solubility in fuel salt of molten-salt reactors. At. Energy 2012, 112, 417–422. [Google Scholar] [CrossRef]
  5. Winner, N.; Williams, H.; Scarlat, R.O.; Asta, M. Ab-initio simulation studies of chromium solvation in molten fluoride salts. J. Mol. Liq. 2021, 335, 116351. [Google Scholar] [CrossRef]
  6. Dewing, E.W. The effect of additives on activities in cryolite melts. Met. Mater. Trans. B 1989, 20, 675–677. [Google Scholar] [CrossRef]
  7. Sarou-Kanian, V.; Rollet, A.-L.; Salanne, M.; Simon, C.; Bessada, C.; Madden, P.A. Diffusion coefficients and local structure in basic molten fluorides: In situ NMR measurements and molecular dynamics simulations. Phys. Chem. Chem. Phys. 2009, 11, 11501–11506. [Google Scholar] [CrossRef]
  8. Nam, H.O.; Bengtson, A.; Vörtler, K.; Saha, S.; Sakidja, R.; Morgan, D. First-principles molecular dynamics modeling of the molten fluoride salt with Cr solute. J. Nucl. Mater. 2014, 449, 148–157. [Google Scholar] [CrossRef]
  9. Clark, A.D.; Lee, W.L.; Solano, A.R.; Williams, T.B.; Meyer, G.S.; Tait, G.J.; Battraw, B.C.; Nickerson, S.D. Complexation of Mo in FLiNaK Molten Salt: Insight from Ab Initio Molecular Dynamics. J. Phys. Chem. B 2020, 125, 211–218. [Google Scholar] [CrossRef]
  10. Maxwell, C.I. Molecular dynamics study of fission gas behaviour and solubility in molten FLiNaK salt. J. Nucl. Mater. 2022, 563, 153633. [Google Scholar] [CrossRef]
  11. Nosé, S. A unified formulation of the constant temperature molecular dynamics methods. J. Chem. Phys. 1984, 81, 511–519. [Google Scholar] [CrossRef] [Green Version]
  12. Nosé, S.; Klein, M. Constant pressure molecular dynamics for molecular systems. Mol. Phys. 1983, 50, 1055–1076. [Google Scholar] [CrossRef]
  13. Bussi, G.; Zykova-Timan, T.; Parrinello, M. Isothermal-isobaric molecular dynamics using stochastic velocity rescaling. J. Chem. Phys. 2009, 130, 074101. [Google Scholar] [CrossRef] [PubMed] [Green Version]
  14. Delpech, S.; Merle-Lucotte, E.; Heuer, D.; Allibert, M.; Ghetta, V.; Le-Brun, C.; Doligez, X.; Picard, G. Reactor physic and reprocessing scheme for innovative molten salt reactor system. J. Fluor. Chem. 2009, 130, 11–17. [Google Scholar] [CrossRef]
  15. Wu, J.; Wang, J.; Ni, H.; Lu, G.; Yu, J. The influence of NaCl concentration on the (LiCl-KCl) eutectic system and temperature dependence of the ternary system. J. Mol. Liq. 2018, 253, 96–112. [Google Scholar] [CrossRef]
  16. Adams, D.J.; McDonald, I.R. Rigid-ion models of the interionic potential in the alkali halides. J. Phys. C Solid State Phys. 1974, 7, 2761–2775. [Google Scholar] [CrossRef]
  17. Giannozzi, P.; Baroni, S.; Bonini, N.; Calandra, M.; Car, R.; Cavazzoni, C.; Ceresoli, D.; Chiarotti, G.L.; Cococcioni, M.; Dabo, I.; et al. QUANTUM ESPRESSO: A modular and open-source software pro-ject for quantum simulations of materials. J. Phys. Cond. Matt. 2009, 21, 395502. [Google Scholar] [CrossRef]
  18. Giannozzi, P.; Andreussi, O.; Brumme, T.; Bunau, O.; Nardelli, M.B.; Calandra, M.; Car, R.; Cavazzoni, C.; Ceresoli, D.; Cococcioni, M.; et al. Advanced capabilities for materials modelling with Quantum ESPRESSO. J. Phys. Condens. Matter 2017, 29, 465901. [Google Scholar] [CrossRef] [Green Version]
  19. Blöchl, P.E. Projector augmented-wave method. Phys. Rev. B 1994, 50, 17953–17979. [Google Scholar] [CrossRef] [Green Version]
  20. Kresse, G.; Joubert, D. From ultrasoft pseudopotentials to the projector augmented-wave method. Phys. Rev. B 1999, 59, 1758–1775. [Google Scholar] [CrossRef]
  21. Grimme, S. Semiempirical GGA-type density functional constructed with a long-range dispersion correction. J. Comput. Chem. 2006, 27, 1787–1799. [Google Scholar] [CrossRef] [PubMed]
  22. Zakiryanov, D.O. Applying the Born-Mayer model to describe the physicochemical properties of FLiNaK ternary melt. Comput. Theor. Chem. 2023, 1219, 113951. [Google Scholar] [CrossRef]
  23. Yeh, I.-C.; Hummer, G. System-Size Dependence of Diffusion Coefficients and Viscosities from Molecular Dynamics Simulations with Periodic Boundary Conditions. J. Phys. Chem. B 2004, 108, 15873–15879. [Google Scholar] [CrossRef]
  24. Nijboer, B.R.A.; Ruijgrok, T.W. On the energy per particle in three- and two-dimensional Wigner lattices. J. Stat. Phys. 1988, 53, 361–382. [Google Scholar] [CrossRef]
  25. Karki, B.B.; Bhattari, D.; Stixrude, L. First-principles calculations of the structural dynamical, and electrical properties of liquid MgO. Phys. Rev. B 2006, 73, 174208. [Google Scholar] [CrossRef] [Green Version]
  26. Galashev, A.Y. Numerical simulation of functioning a silicene anode of a lithium-ion battery. J. Comput. Sci. 2022, 64, 101835. [Google Scholar] [CrossRef]
  27. Plimpton, S. Fast Parallel Algorithms for Short-Range Molecular Dynamics. J. Comput. Phys. 1995, 117, 1–19. [Google Scholar] [CrossRef] [Green Version]
  28. Gallagher, R.C.; Agca, C.; Russell, N.; McMurray, J.W.; Bull Ezell, N.D. Assessment of molten eutectic LiF-NaF-KF density through experimental determination and semiempirical modeling. J. Chem. Eng. Data 2022, 67, 1406–1414. [Google Scholar] [CrossRef]
  29. Salanne, M.; Simon, C.; Turq, P.; Madden, P.A. Heat-transport properties of molten fluorides: Determination from first-principles. J. Fluor. Chem. 2009, 130, 38–44. [Google Scholar] [CrossRef]
  30. Umesaki, N.; Iwamoto, N.; Tsunawaki, Y.; Ohno, H.; Furukawa, K. Self-diffusion of lithium, sodium, potassium and fluorine in a molten LiF+ NaF+ KF eutectic mixture. J. Chem. Soc. Faraday Trans. 1 Phys. Chem. Condens. Phases 1981, 77, 169–175. [Google Scholar] [CrossRef]
  31. Igarashi, K.; Okamoto, Y.; Mochinaga, J.; Ohno, H. X-ray diffraction study of molten eutectic LiF-NaF-KF mixture. J. Chem. Soc. Faraday Trans. 1 Phys. Chem. Condens. Phases 1988, 84, 4407–4415. [Google Scholar] [CrossRef]
  32. Lam, S.T.; Li, Q.-J.; Mailoa, J.; Forsberg, C.; Ballinger, R.; Li, J. The Impact of Hydrogen Valence on Its Bonding and Transport in Molten Fluoride Salts, Electronic Supplementary Material (ESI) for Journal of Materials Chemistry A. The Royal Society of Chemistry 2021. Available online: https://www.rsc.org/suppdata/d0/ta/d0ta10576g/d0ta10576g1.pdf (accessed on 8 January 2023).
  33. Dočkal, J.; Lísal, M.; Moučka, F. Polarizable force fields for accurate molecular simulations of aqueous solutions of electrolytes, crystalline salts, and solubility: Li+, Na+, K+, Rb+, F, Cl, Br, I. J. Mol. Liq. 2022, 362, 119659. [Google Scholar] [CrossRef]
  34. Philippi, F.; Welton, T. Targeted modifications in ionic liquids—From understanding to design. Phys. Chem. Chem. Phys. 2021, 23, 6993–7021. [Google Scholar] [CrossRef] [PubMed]
  35. Oppenheim, J.J.; Skorupskii, G.; Dincă, M. Aperiodic metal–organic frameworks. Chem. Sci. 2020, 11, 11094–11103. [Google Scholar] [CrossRef] [PubMed]
  36. Li, Q.J.; Sprouster, D.; Zheng, G.; Neuefeind, J.C.; Braatz, A.D.; Mcfarlane, J.; Olds, D.; Lam, S.; Li, J.; Khaykovich, B. Complex structure of molten NaCl–CrCl3 salt: Cr–Cl octahedral network and intermediate-range order. ACS Appl. Energy Mater. 2021, 4, 3044–3056. [Google Scholar] [CrossRef]
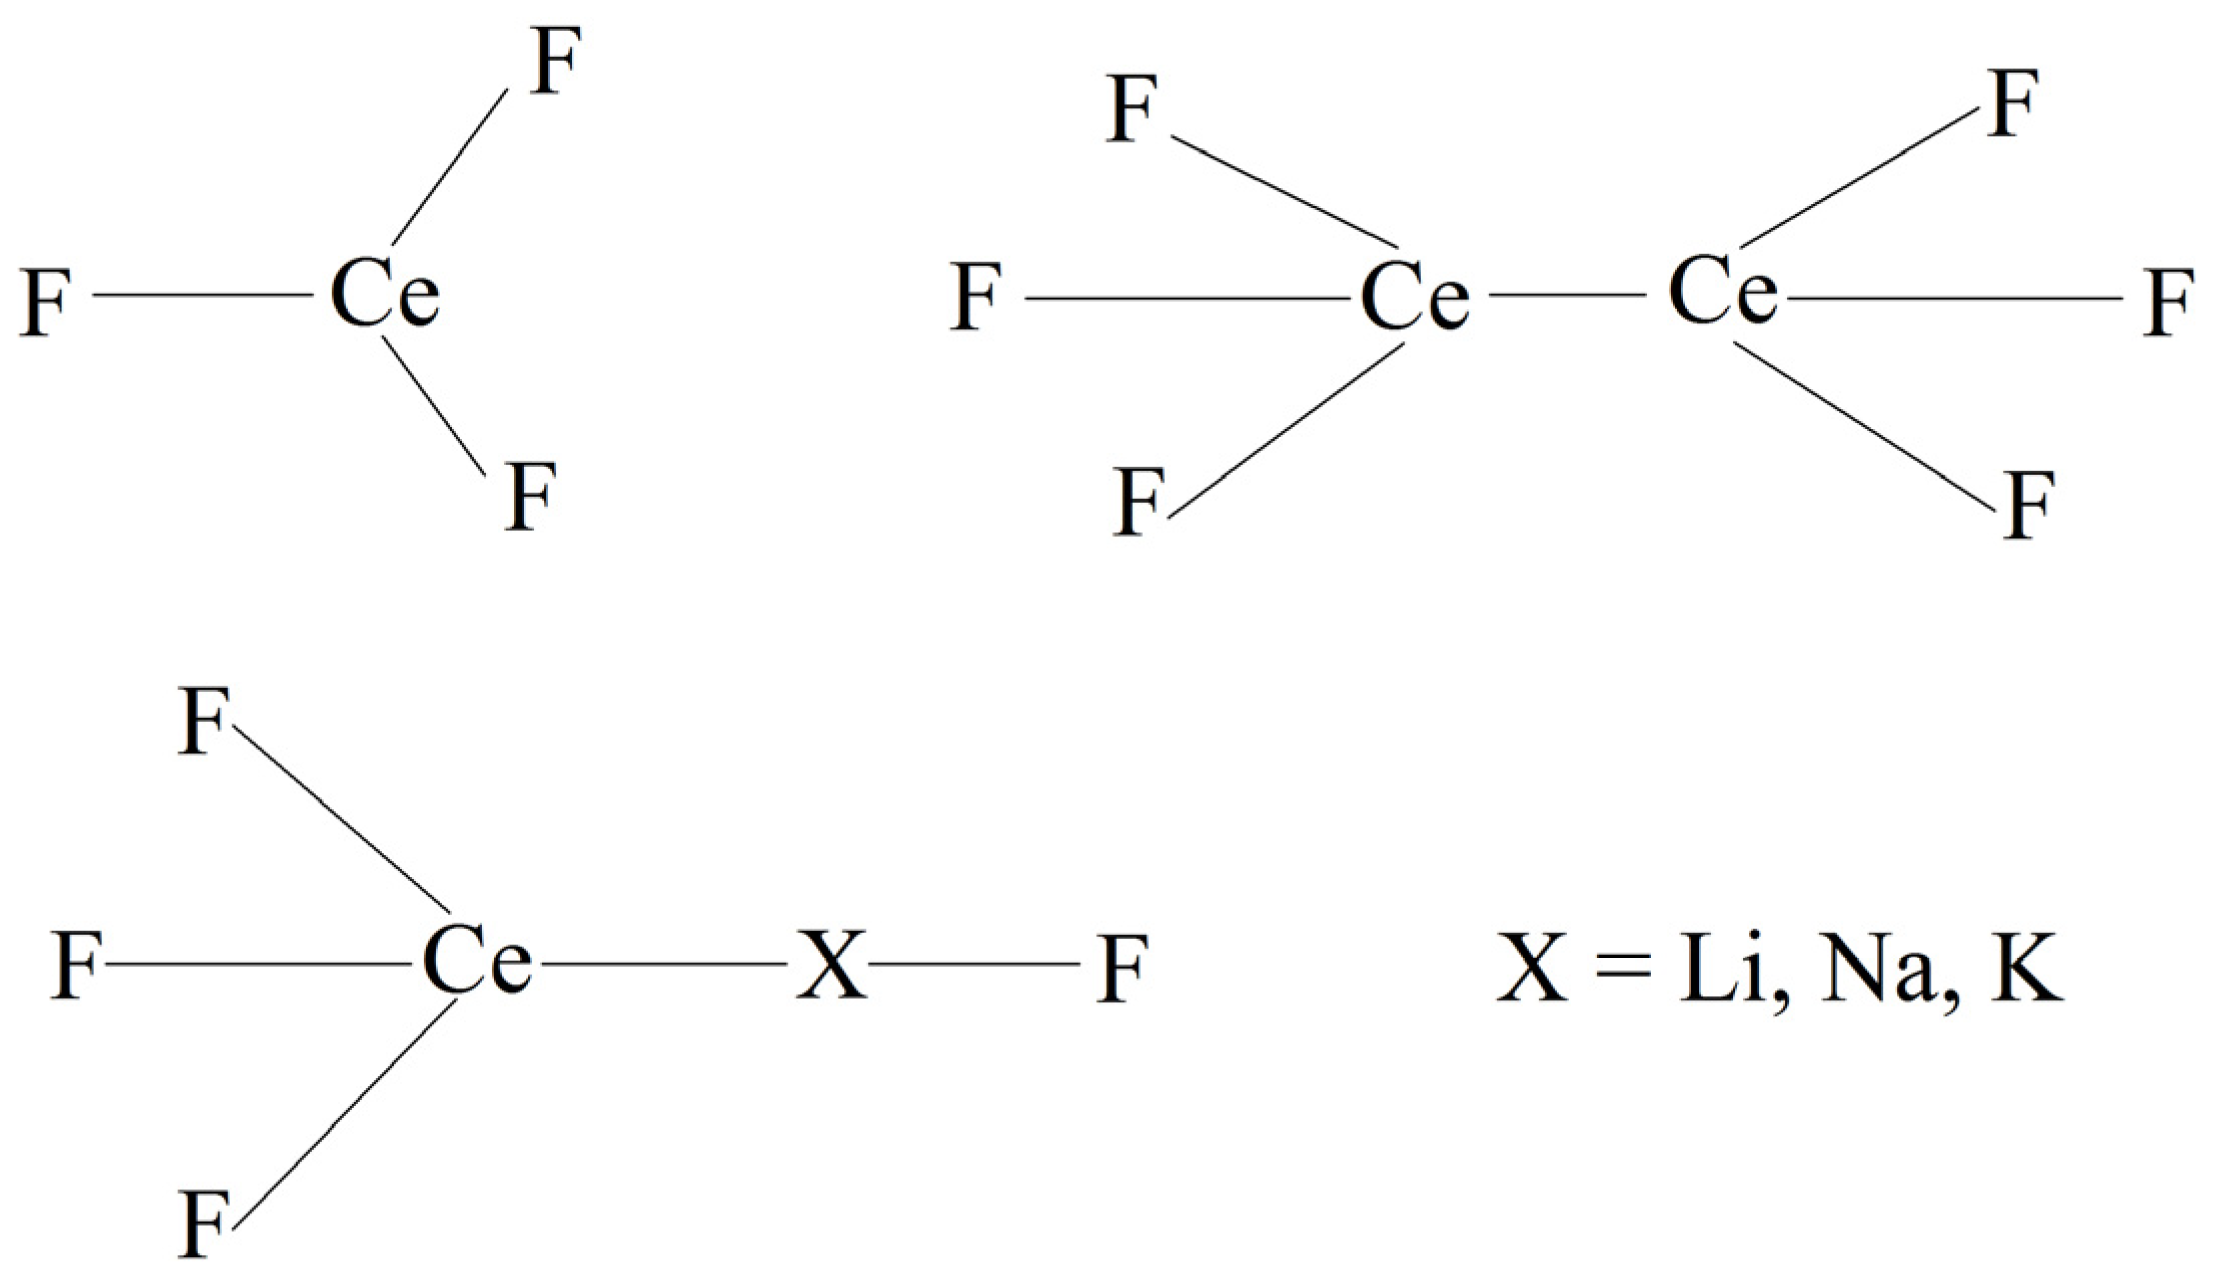
Figure 1. Principal scheme for determining the parameters of the interaction potential between Ce ions and other ions that form the FLiNaK salt mixture.
Applsci 13 01085 g001
Figure 2. FLiNaK+Ce system configuration corresponding to 200 ps time at 1000 K.
Applsci 13 01085 g002
Figure 3. Configuration of Ce subsystem extracted from the FLiNaK+Ce system at instant 200 ps at 1000 K.
Applsci 13 01085 g003
Figure 4. Simulated and experimental densities of FLiNaK system; dash line shows the linear fit of our MD data; blue triangles show results of experiment [28], pink dots represent the simulated data obtained in the polarizable MD model [29].
Applsci 13 01085 g004
Figure 5. Self-diffusion coefficients of molten salt mixture FLiNaK+CeF3 components; the linear approximation of the MD calculation of the D coefficient is presented as a solid line, and the linear approximation of the D ( T ) dependence is shown as a dashed line.
Applsci 13 01085 g005
Figure 6. The partial radial distribution functions of Li–F, Na–F, K–F and Ce–F at 950 K.
Applsci 13 01085 g006
Figure 7. The partial radial distribution functions of Li–Li, Na–Na (in the insert), K–K, F–F and Ce–Ce at 950 K.
Applsci 13 01085 g007
Figure 8. Temperature dependence of the first coordination numbers of ions in the molten salt mixture FLiNaK+15 mol.% CeF3.
Applsci 13 01085 g008
Figure 9. Temperature dependence of the increase (in %) in the values of the coordination numbers of ions in the molten salt mixture FLiNaK+15 mol.% CeF3 with respect to pure molten FLiNaK.
Applsci 13 01085 g009
Figure 10. The distribution of Voronoi polyhedra by the number of faces for the Li, Na, K and F subsystem of molten salt mixture FLiNaK+CeF3 at a temperature of 950 K.
Applsci 13 01085 g010
Figure 11. The distribution of faces of Voronoi polyhedra by the number of sides for the Li, Na, K and F subsystem of molten salt mixture FLiNaK+CeF3 at a temperature of 950 K.
Applsci 13 01085 g011
Figure 12. Angular distributions of nearest geometric neighbors for the Li, Na, K and F subsystem of molten salt mixture FLiNaK+CeF3 at a temperature of 950 K.
Applsci 13 01085 g012
Figure 13. Distributions for Ce subsystem of molten salt mixture FLiNaK+CeF3 at a temperature of 950 K in form of: (a) VP by number of faces and VP faces by number of sides (in the insert), (b) angles θ.
Applsci 13 01085 g013
Table 1. Parameters for interaction of Ce with other components of molten salt.
CeriumB, eVρ, Åσ, Å
Ce–Ce1.3570.1412.02
Ce–F1.6180.33242.34
Ce–Li0.0530.1371.77
Ce–Na0.0920.1462.03
Ce–K0.0780.1682.39
Table 2. Self-diffusion coefficients of ions (in units of 10−5 cm2/s) in FLiNaK and mixture FLiNaK+CeF3 calculated by the Arrhenius relation from data of MD calculation and experiment [28] *.
T (K)SystemLiNaKFCe
800Pure FLiNaK1.821.431.451.84-
Exp. FLiNaK1.431.841.661.72-
FLiNaK+Ce1.571.251.501.570.113
880Pure FLiNaK2.872.472.192.92-
Exp. FLiNaK2.393.032.572.62-
FLiNaK+Ce2.312.102.252.440.402
950Pure FLiNaK3.803.372.843.87-
Exp. FLiNaK(3.47)(4.36)(3.56)(3.57)-
FLiNaK+Ce2.952.852.913.200.656
1020Pure FLiNaK4.724.273.494.81-
Exp. FLiNaK(4.80)(5.48)(4.35)(4.34)-
FLiNaK+Ce3.603.603.573.970.909
* The values in parentheses correspond to the extrapolation to high temperatures of the Arrhenius dependence D(T) obtained in the experiment [28].
Table 3. Parameters a and b for linear Equation (6).
ParametersLiNaKFCe
a, 10−5 cm2/(s∙K)0.00920.01070.00940.01090.00362
b, 10−5 cm2/s5.7837.3096.0157.1472.783
Disclaimer/Publisher’s Note: The statements, opinions and data contained in all publications are solely those of the individual author(s) and contributor(s) and not of MDPI and/or the editor(s). MDPI and/or the editor(s) disclaim responsibility for any injury to people or property resulting from any ideas, methods, instructions or products referred to in the content.