Article

HS-YOLO: Small Object Detection for Power Operation Scenarios

1
School of Electrical Engineering and Automation, Xiamen University of Technology, Xiamen 361024, China
2
Xiamen Key Laboratory of Frontier Electric Power Equipment and Intelligent Control, Xiamen 361024, China
*
Author to whom correspondence should be addressed.
Appl. Sci. 2023, 13(19), 11114; https://doi.org/10.3390/app131911114
Submission received: 15 August 2023 / Revised: 21 September 2023 / Accepted: 8 October 2023 / Published: 9 October 2023

Abstract

:
Object detection methods are commonly employed in power safety monitoring systems to detect violations in surveillance scenes. However, traditional object detection methods are ineffective for small objects that are similar to the background information in the power monitoring scene, which consequently affects the performance of violation behavior detection. This paper proposed a small object detection algorithm named HS-YOLO, based on High-Resolution Network (HRNet) and sub-pixel convolution. First, to fully extract the microfeature information of the object, a small object feature extraction backbone network is proposed based on the HRNet structure. The feature maps of different scales are processed by multiple parallel branches and fused with each other in the network. Then, to fully retain the effective features of small objects, the sub-pixel convolution module is incorporated as the upsampling operator in the feature fusion network. The low-resolution feature map is upsampled to a higher resolution by reorganizing pixel values and performing padding operations in this module. On our self-constructed power operation dataset, the HS-YOLO algorithm achieved a mAP of 87.2%, which is a 3.5% improvement compared to YOLOv5. Particularly, the dataset’s AP for detecting small objects such as cuffs, necklines, and safety belts is improved by 10.7%, 5.8%, and 4.4%, respectively. These results demonstrate the effectiveness of our proposed method in detecting small objects in power operation scenarios.

Graphical Abstract

1. Introduction

Power operation sites often have potential hazards such as high-voltage power lines, equipment, and work at heights, which may cause serious injury or even endanger life in case of accidents. Violations by workers, such as failure to wear safety gear, crossing safety barriers, or making operational errors, are common causes of safety incidents [1]. Therefore, effective monitoring of workers’ violations is crucial to ensure the safety and stability of power operations. In this context, technologies in related fields such as image processing are progressively integrating into the domain of electric power operations [2]. Through methods such as object detection, object recognition, and behavioral analysis, these technologies enable real-time capture of personnel activities and analysis of real-time images. It helps to automatically identify and monitor the violations of operators.
The power industry is placing increasing demands on monitoring efficiency, accuracy, and intelligent capabilities, with a large number of intelligent monitoring technologies being applied to power operation scenarios [3]. The images collected from the power operation scenarios are automatically analyzed and processed by intelligent monitoring. Specific objects such as safety belts, safety helmets, and seines in the monitoring images are precisely located and classified after the critical information and features are extracted. This facilitates a more accurate analysis of personnel behavior involved in the operations [4,5]. It is evident that object detection is highly crucial in intelligent monitoring, but the existing methods may not be entirely suitable for power operation scenarios. The continuously changing distances and angles between surveillance cameras and detection objects result in varying sizes of detected objects in images. This requires the algorithm to be able to adaptively extract features suitable for different object sizes and maintain the capability to detect and locate objects across varying scales. This adaptability ensures the accuracy and stability of detection under diverse circumstances.
The growing attention on safety issues in the power industry has led many researchers to put forward deep-learning detection methods suitable for this industry. These methods have demonstrated varying degrees of success, but they also show certain limitations. For example, they may lack the necessary sensitivity to cope with the complex environment in small object detection scenarios, and in the face of small object scales may exhibit sub-optimal performance when changed. Addressing these shortcomings is critical to improving the effectiveness of such methods. Chen et al. [6] incorporated object relationship modules into the detection module, paying attention to the interconnection between different objects, and optimized the loss function design, resulting in more accurate segmentation of slender and flexible objects such as seines and safety belts in the context of power operation scenes. Wu et al. [7] proposed the R_YOLOV5 detection algorithm, which introduced rotated bounding boxes (RBB) into the detection network to address the issue of background aspect ratios and made targeted improvements to flexible objects in any direction in power operation scenes. However, these studies primarily aimed at improving the detection of certain types of regular-sized objects while overlooking the existence of small objects in power operation scenes. Zheng et al. [8] focused on the detection of insulators and defects in power systems. They compressed the model size using the Ghost module and added an attention module to focus on key information about small objects. Gu et al. [9] introduced an attention mechanism to adjust the network to pay more attention to the surrounding areas of the object, optimized the loss function according to the characteristics of the object, and proposed a lightweight network for detecting small transmission lines in aerial images. However, these methods are specifically designed for small object detection from an aerial perspective and may not be well-suited for the complex variations in small object features and background differences from a monitoring perspective.
Detecting small objects poses a challenging task within the domain of computer vision [10]. Existing object detection algorithm frameworks and loss functions are predominantly designed for large and medium-sized objects, leaving minimal focus on small objects. Most network detectors rely on anchor boxes, but fixed anchor sizes may inadequately match the scales of small objects, leading to imprecise localization and the omission of fine details. The loss functions designed for general objects might overlook the scale of small objects during loss computation. Loss functions that lack sensitivity to small objects are unable to accurately locate and classify these objects, resulting in a decline in detection performance. Small object detection in complex power operation monitoring scenes poses even greater challenges, mainly due to the following reasons:
  • The information expressed by the features of small objects in power operation scenes is limited. The limited pixel count of small objects in power operation monitoring images makes it challenging to precisely determine their boundaries and positions. This necessitates the utilization of more intricate detection algorithms to capture discriminative feature information for small object detection [11].
  • The object scale spans a large range. In power operation scenes, the scale of objects may vary significantly due to changes in camera angles. This variation hampers the localization accuracy and feature extraction capabilities of detection algorithms. Moreover, different scales of objects require the detector to adjust the search regions, impacting detection speed and reducing real-time performance [12].
  • The background of small objects is complex. In the electric power operation scenes, the environment typically comprises various intricate structures and facilities, including different equipment, towers, power lines, and trees, among others. The visual appearance and textural features of these objects bear a resemblance to small objects, and mutual occlusions may also occur among them. As a result, the complex environment of power operation scenarios tends to perturb the feature information related to small objects, making it more challenging to extract precise details and characteristics [13].
Based on the above-mentioned difficulties in detecting small objects in general scenarios and special power operation scenarios, this paper proposes a detection network called HS-YOLO for practical application needs, which combines a HRNet high-resolution network with sub-pixel convolution. This algorithm enhances the feature extraction for small objects in power operation scenes, capturing more detailed information and effectively addressing the issue of feature loss in small objects, and provides a more reliable guarantee for safe power operation. The primary contributions of this paper include:
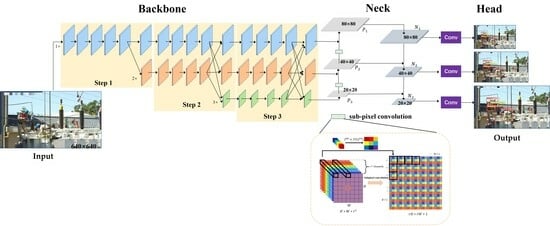
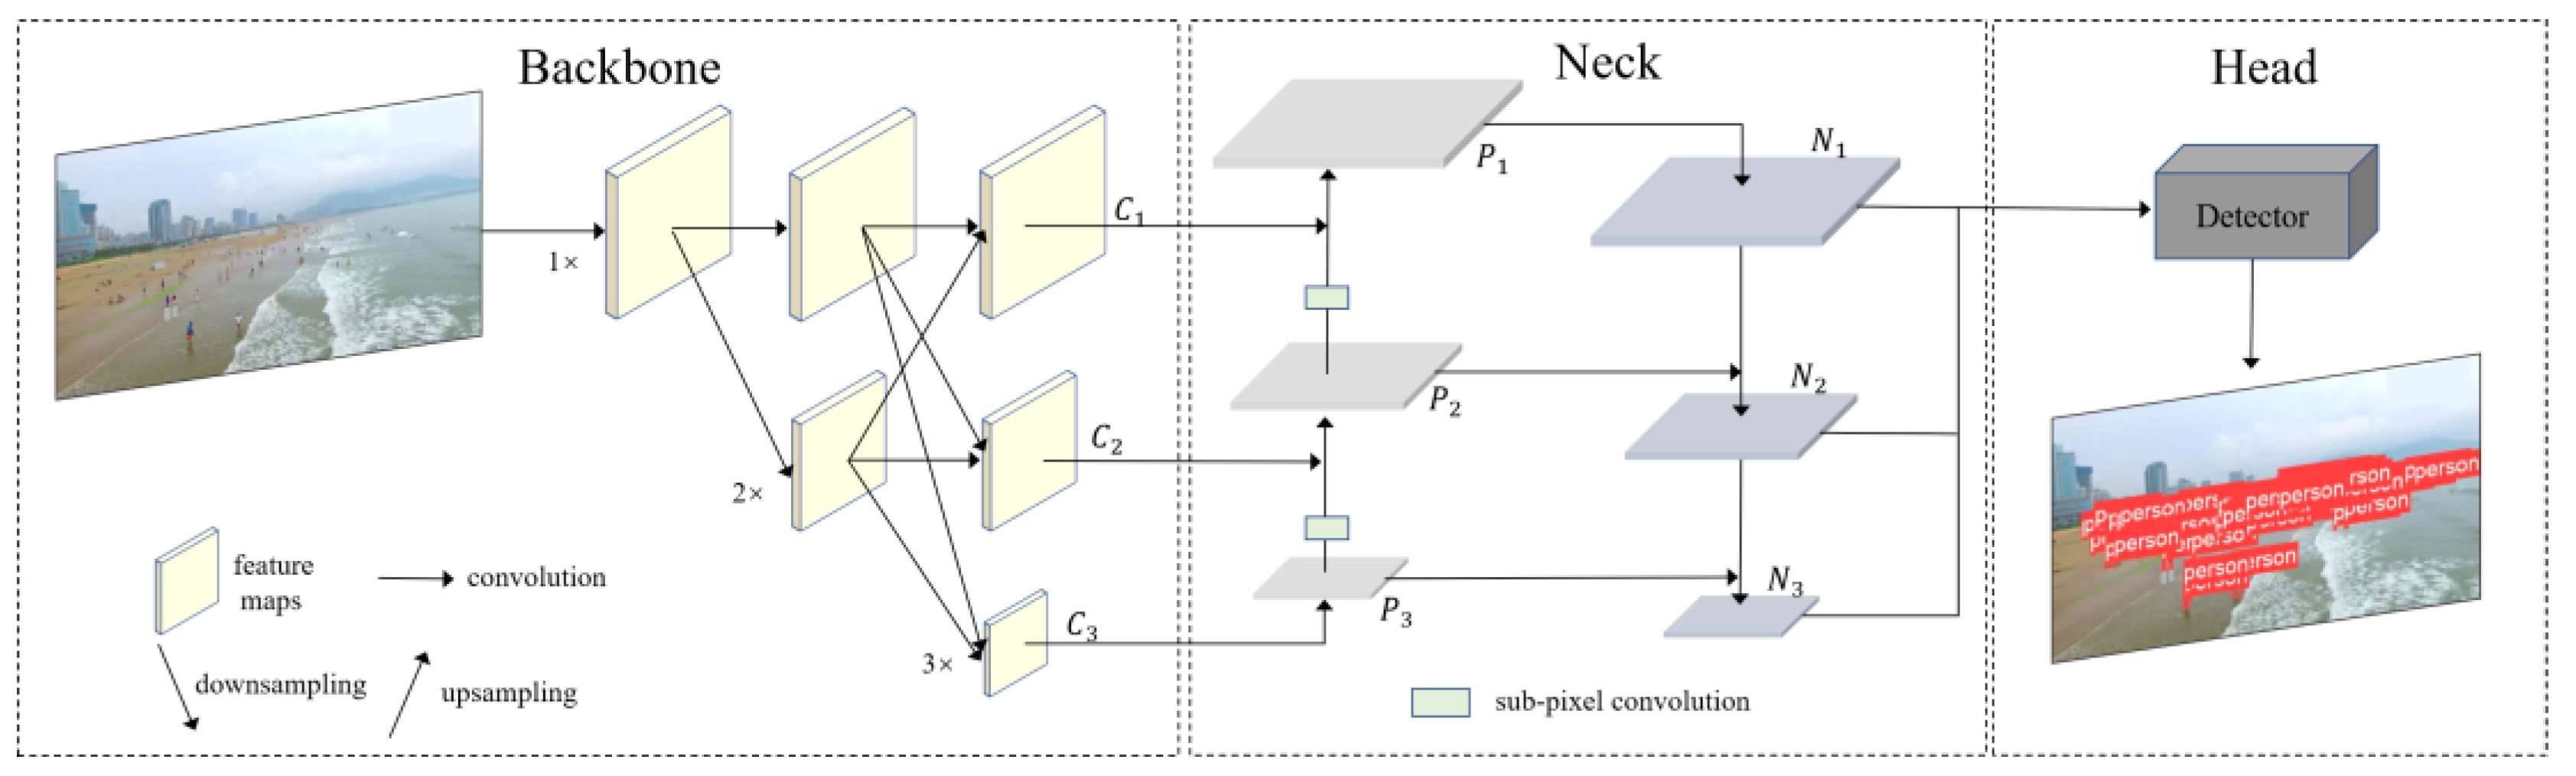
  • To solve the problem of weak feature expression ability of small objects, we designed a feature extraction backbone network based on HRNet. The feature maps originating from diverse scales are processed through distinct branches to retain abundant high-resolution feature information for small objects. Simultaneously, the feature maps from different scales are fused to enhance the perception ability of the network to the objects of different scales. This approach enables the preservation of fine-grained details while enhancing the overall object detection capabilities across different scales.
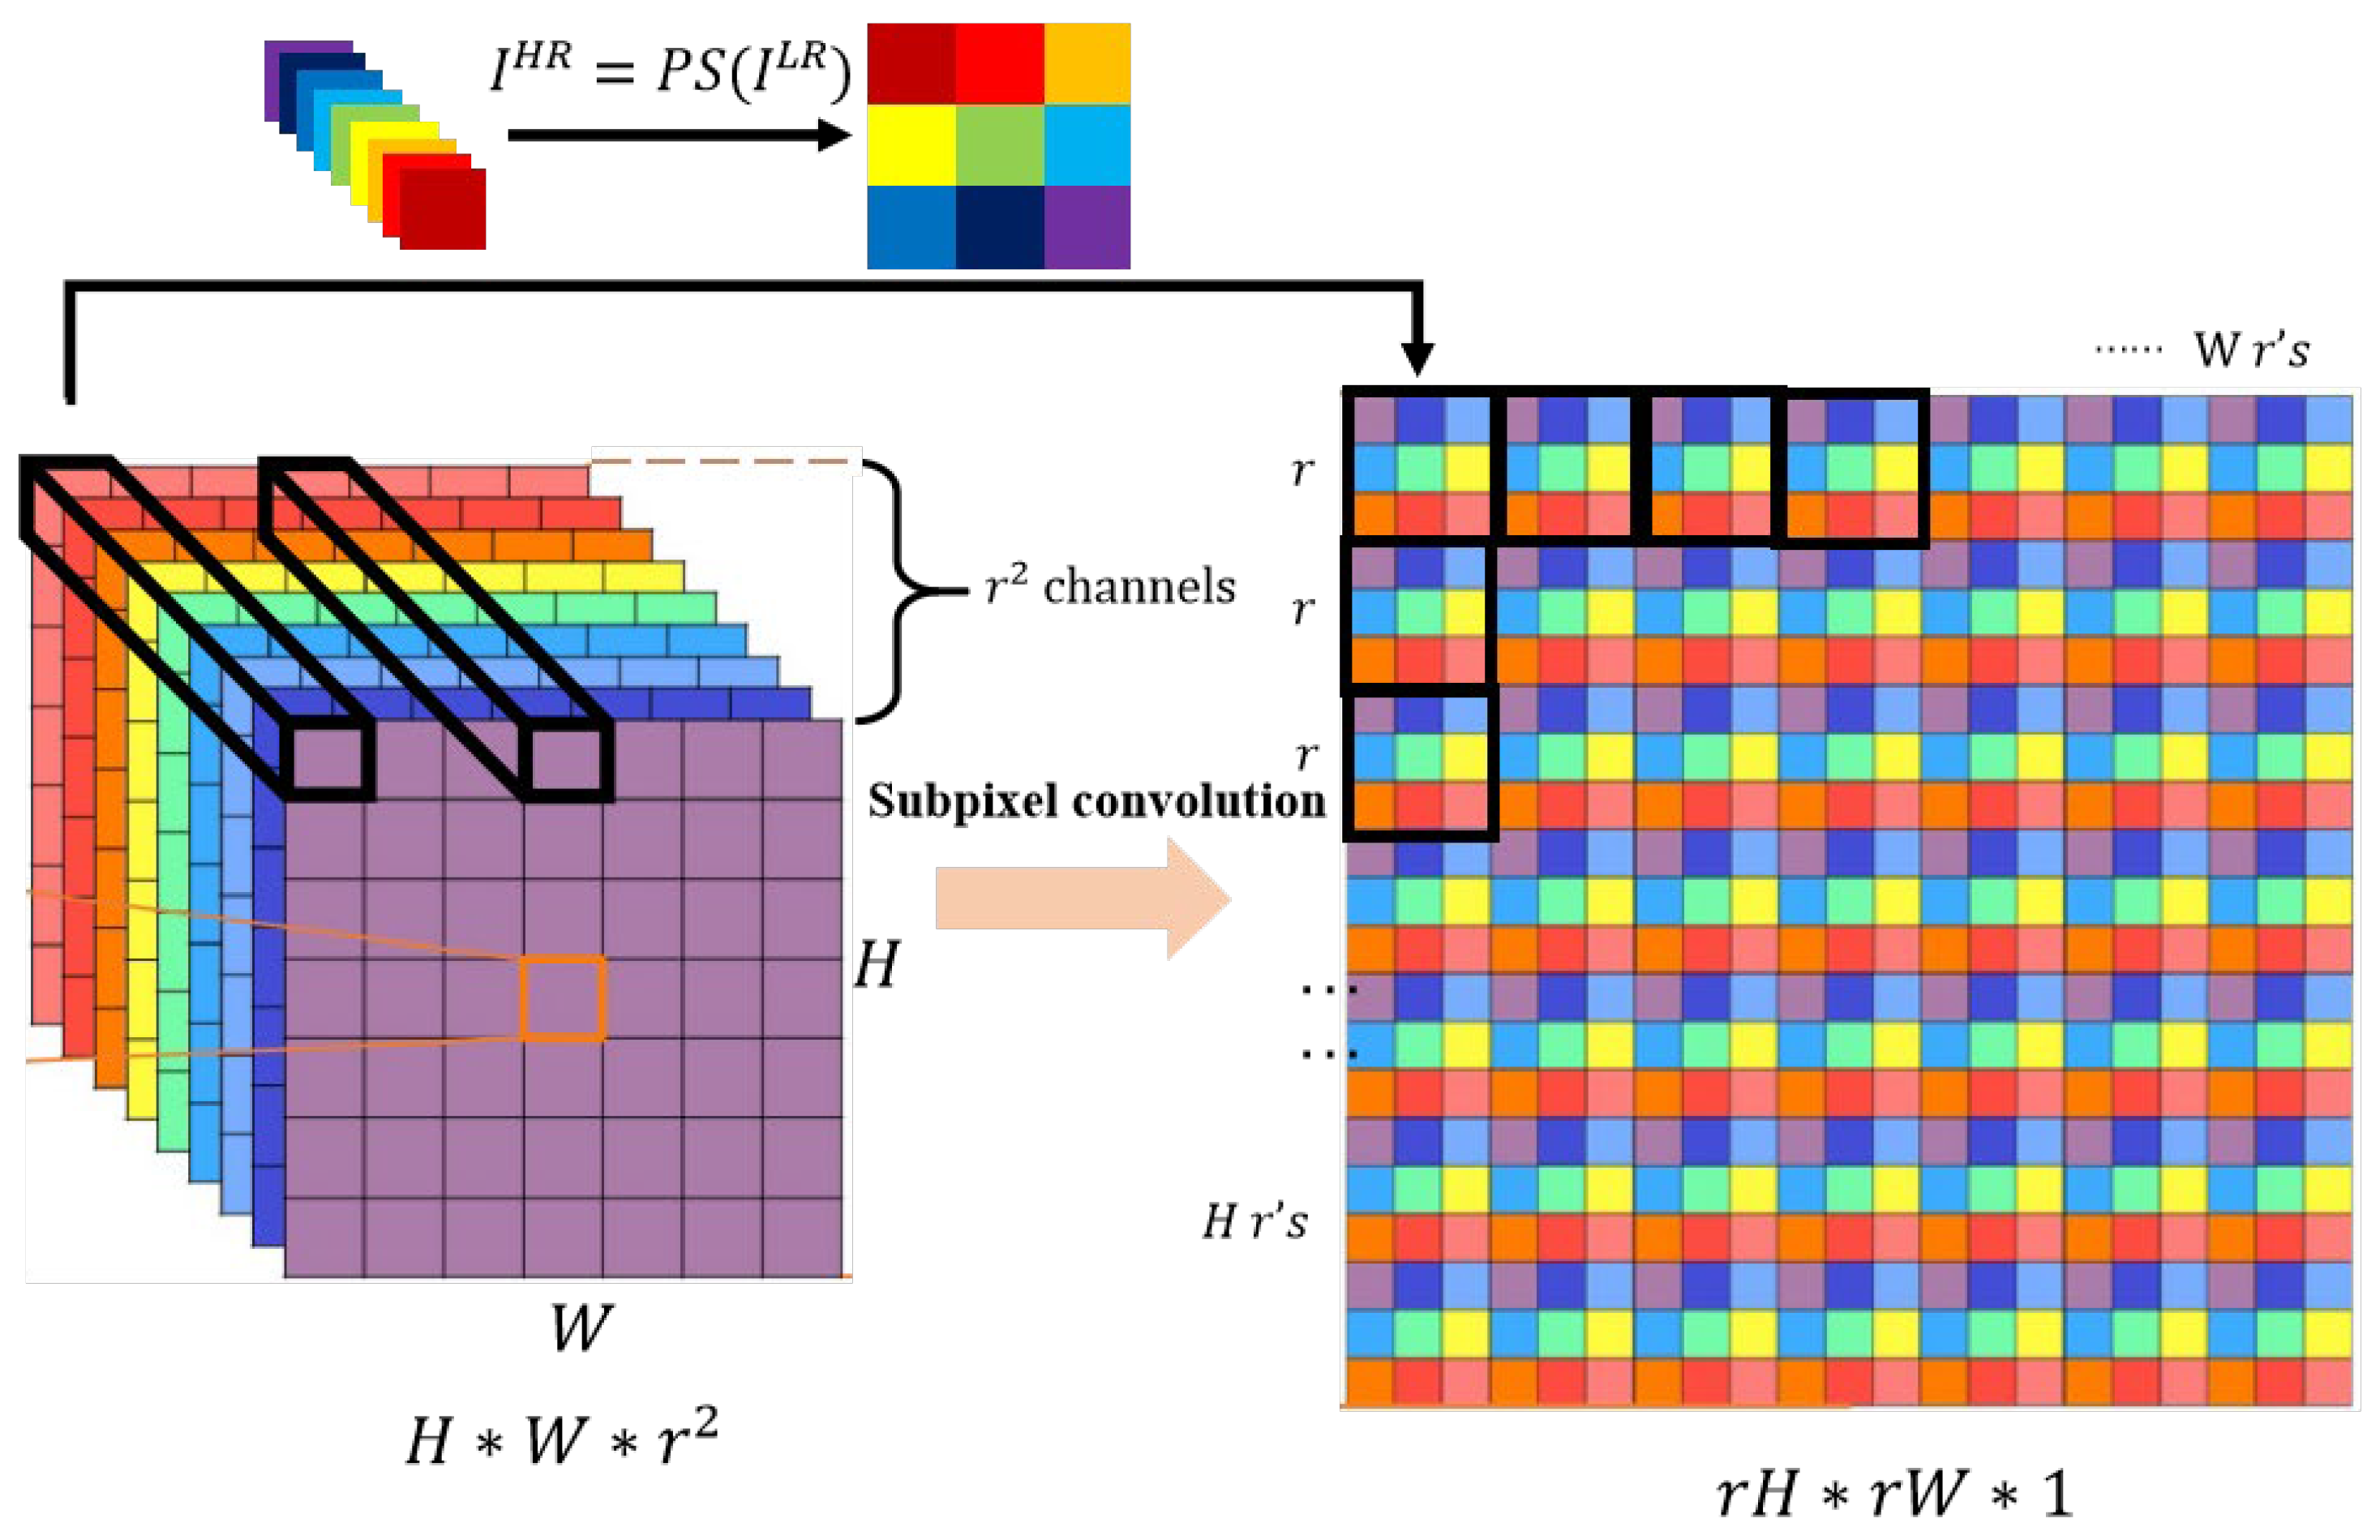
  • To reduce the loss of detailed information in the process of small object feature fusion, we introduced sub-pixel convolution into multi-scale feature fusion. The upsampling process is realized by reorganizing pixel values and performing padding operations, which fully preserve the feature information of small objects. This approach also introduces more contextual information, facilitating the distinction between small objects and the background.
  • According to the requirements of violation behavior detection, we created a data set of power operation scenarios. This power operation scenarios dataset is used to test the HS-YOLO model.

2. Related Works and Methods

2.1. Related Works

2.1.1. Small Object Detection

Small object detection is a vital undertaking studied in many practical applications, aiming to accurately identify and locate smaller objects in images or videos. Small object detection holds significant importance in various practical applications, such as traffic safety, remote sensing image analysis, medical image processing, and more [14,15,16]. Different scenarios have different interpretations of small objects, and existing definitions for small objects primarily rely on relative scale and absolute scale as two key perspectives [17]. The definition of relative proportions defines small objects by considering the size of the object relative to the image, classifying object instances with relative areas ranging from 0.08% to 0.58% as small objects. The definition from absolute proportions defines small objects by considering the pixel size of the objects, with the widely adopted definition from the MS COCO dataset [18] considering object instances with resolutions smaller than 32 × 32 pixels as small objects. Due to factors such as low pixel count, limited appearance information, and fewer representative features, small objects tend to exhibit poorer detection performance compared to larger objects. However, by continuously enhancing and optimizing small object detection algorithms through the incorporation of techniques such as multi-scale feature fusion and attention mechanisms, it is possible to greatly enhance the robustness and performance of the detection model. This is anticipated to expand the applicability of small object detection across a broader spectrum of scenarios [10].

2.1.2. Multi-scale Feature Fusion

Compared to regular-sized objects, small objects have lower resolutions and fewer distinctive features, making it challenging to detect them accurately using single-scale features alone. Lower-level feature maps capture more detailed information, while higher-level feature maps provide higher-level semantic information. By fusing features from multiple scales, it is possible to simultaneously obtain global and local information from each scale feature map of small objects, which helps to enhance the model’s perception.
Lin et al. [19] introduced the FPN in the network, which incorporates two propagation paths to fuse features from various levels, resulting in the provision of diverse multi-scale features. However, during the information propagation between different levels of feature maps, upsampling and downsampling operations may result in information blur or loss. Tan et al. [20] introduced the BiFPN in the network, which adaptively weights the importance of features during fusion, better integrating multi-scale information. However, the introduction of additional connections and feature fusion operations in the network increases computational complexity. Zhai et al. [21] proposed DF-SSD, which improves the feature extraction backbone network of SSD and introduces a fusion mechanism between feature layers of different scales and enhanced the applicability of the network to small objects. However, the detection speed is not ideal. Zeng et al. [22] introduced an improved feature fusion method called Adaptive Bilateral Feature Pyramid Network (ABFPN), which utilizes contextual information to achieve sufficient feature fusion. However, it may suffer from scale shifting and position deviation when locating small objects.

2.1.3. High Resolution Representation

When small objects in an image exhibit low resolution, the object details may lack clarity, and edge information can become hazy or unclear, posing challenges for object detection algorithms. Obtaining high-resolution images of small objects can enhance the details and clarity of these objects, making them more easily recognizable and locatable by the object detection algorithm.
Li et al. [23] addressed the issue of small traffic sign detection by utilizing GAN (Generative Adversarial Network) methods, generating super-resolution representations of these small objects to narrow the gap between small and general objects, thereby enhancing the detection of the former. Chen et al. [24] proposed a solution using GAN to restore high-resolution images for small objects that may be blurred in aerial images. However, the training of GANs requires an extensive dataset for effective adversarial training, imposing high requirements on the dataset size. Liu et al. [25] introduced HRDNet, a method that employed a high-resolution feature pyramid network to more effectively capture both the fine details and contextual information of small objects. However, its detection capability for small objects in different categories or complex scenes may be weak, affecting its generalization ability. Wang et al. [26] improved the input resolution of the detection network by adding a feature texture extraction module at the input stage. However, this method may not be suitable for objects with extremely low resolution.

2.2. Methods

2.2.1. HS-YOLO Algorithm

The current general detection algorithms do not perform well in detecting small objects when directly applied to power operation scenes. This requires improving the object detection algorithms according to the specific situation in the special electric power operation scenario. The YOLO [27] series of object detection algorithms have been widely applied due to their efficiency, high accuracy, strong scalability, and interpretability. YOLOv5 enhances the detection capabilities of small objects through the adoption of an anchor-free detection framework and the incorporation of operations such as the SPP module. Therefore, to address the challenge of achieving accurate detection in intricate power operation scenarios, we propose the HS-YOLO algorithm based on the YOLOv5 network. The HS-YOLO algorithm is illustrated in Figure 1.
The HS-YOLO algorithm introduces HRNet [28] and sub-pixel convolution [29] to target small objects in power operation scenes. Figure 1 illustrates the network architecture partitioned into three parts: Backbone, Neck, and Head, which are responsible for feature extraction, fusion, and final detection, respectively. The overall flow of the HS-YOLO algorithm is as follows: First, the algorithm utilizes HRNet to extract object features from the surveillance images. Distinct branches handle feature maps of diverse scales and subsequently amalgamate the features from those scales, yielding feature maps denoted as C1, C2, and C3, which preserve a wealth of feature information. Then, these three features are input into the Neck part, where subpixel convolution is introduced, and feature maps of different scales, N1, N2, and N3, are obtained. Finally, in the detection head, the model will perform final processing to obtain the coordinates, width, height, and category of the object, thereby achieving the objective of object detection.

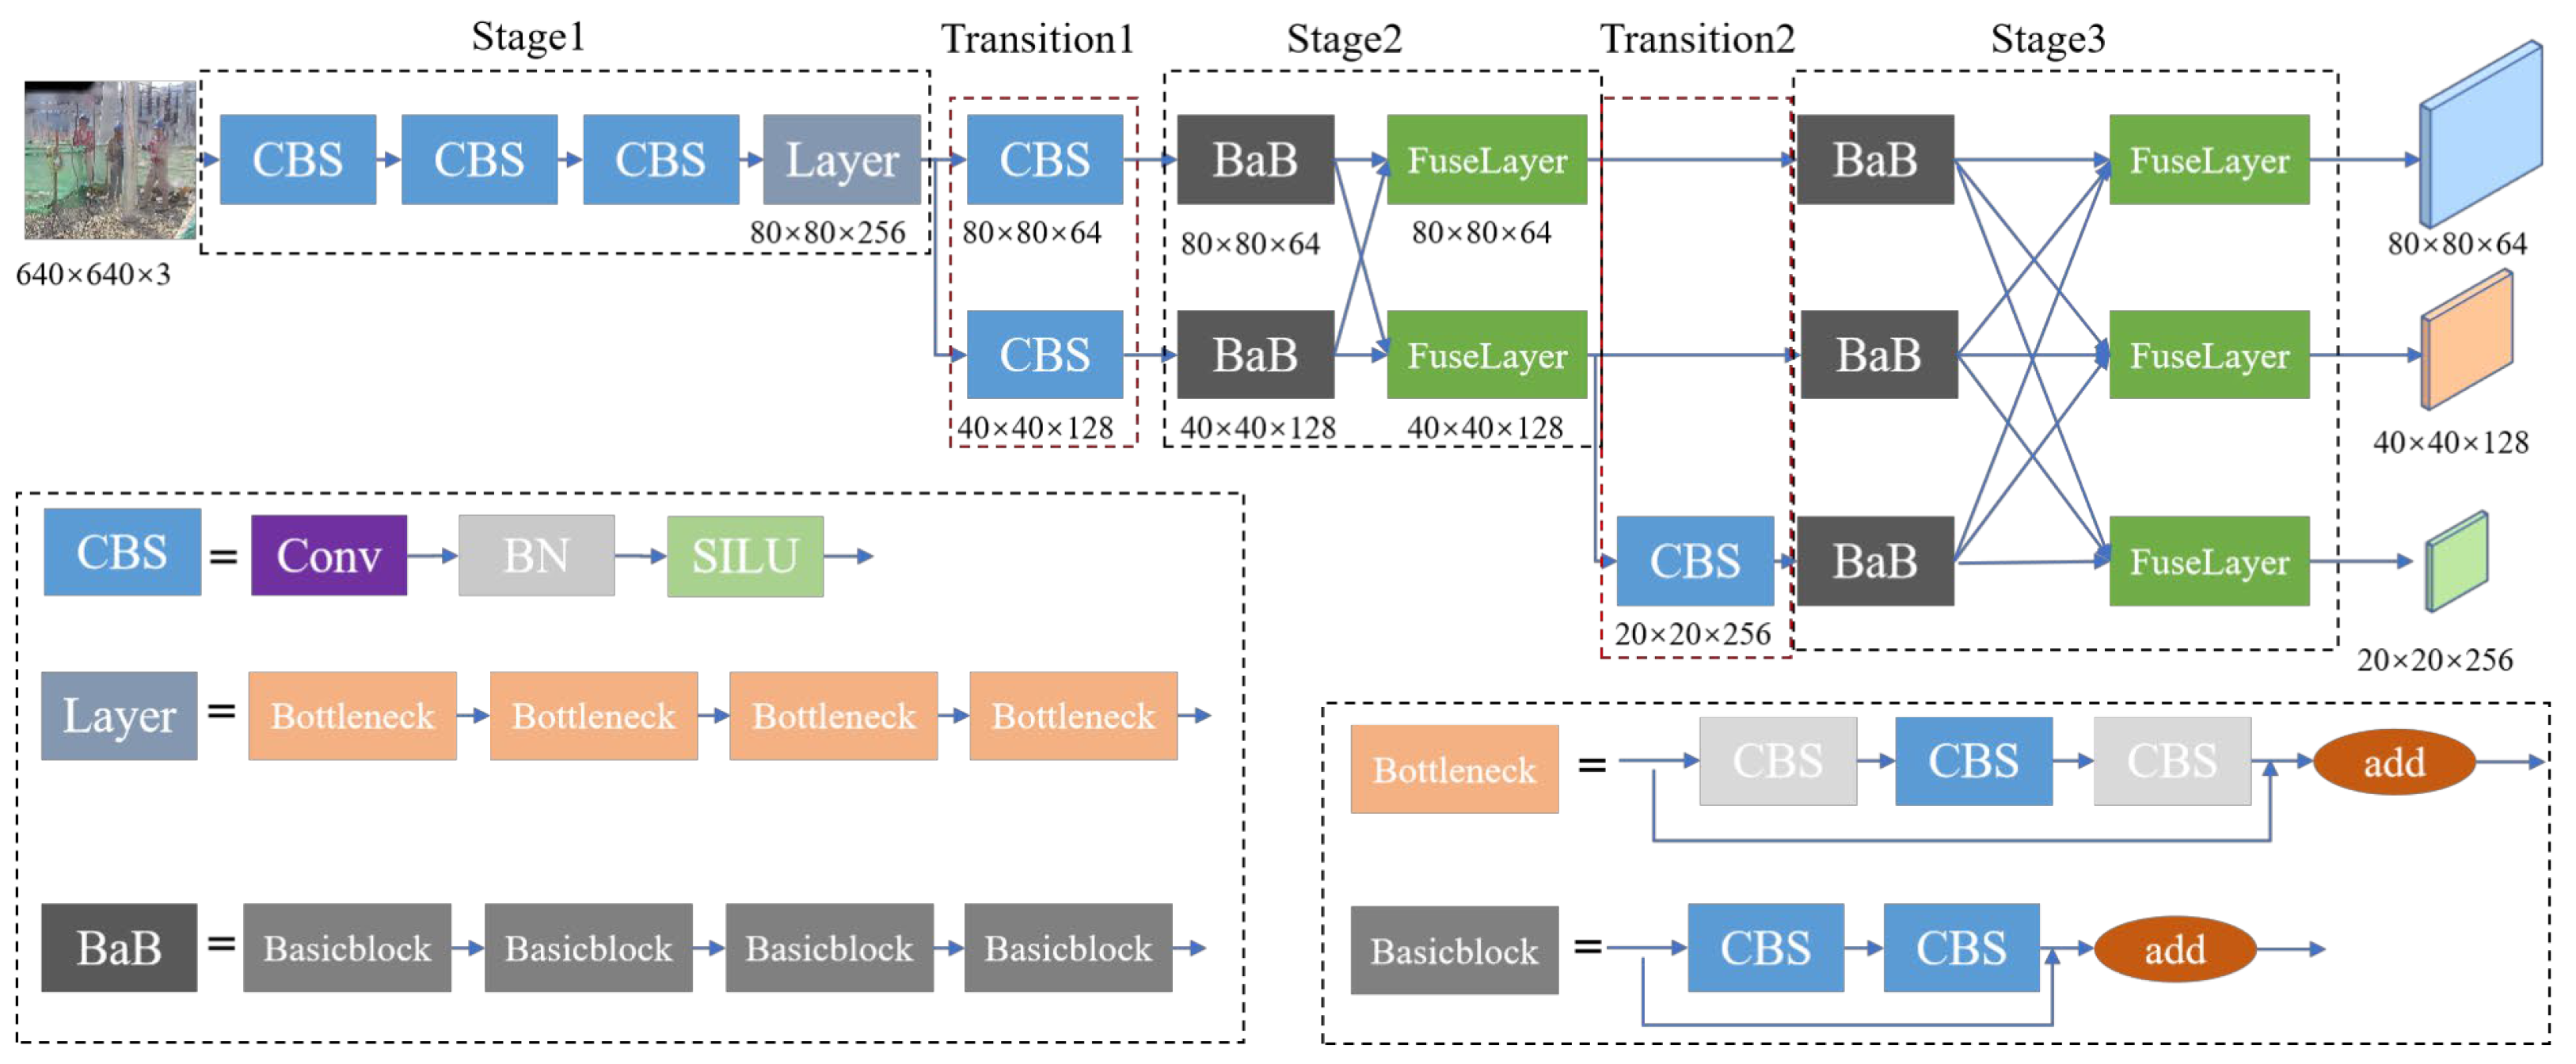
2.2.2. HRNet Feature Extraction Backbone Network

The feature extraction backbone network is a crucial component in object detection, responsible for transforming input images into high-dimensional feature vector representations that contain information about different objects in the image. The original feature extraction backbone network in YOLOv5 demonstrates excellent performance in most detection tasks due to its simple structure, low overfitting risk, rapid detection pace, and superior accuracy. However, it tends to overlook the fine details of small objects. Additionally, when detecting small objects in complex power operation scenes, the DarkNet53 structure may not be sufficiently complex and is prone to interference from complex background noise, resulting in false positives or missed detections.
When extracting features using the original backbone network in YOLOv5, strong semantic information is obtained through multiple downsampling operations, and the feature maps of different resolutions are connected in series. However, this approach results in a notable reduction in fine-grained information within the low-resolution feature maps of small objects. To mitigate the diminishment of feature details pertaining to small objects in power operation scenes, we designed a backbone network based on HRNet, as illustrated in Figure 2.
The backbone network of HS-YOLO begins with a high-resolution branch as its initial branch, progressively adding subnets from high to low resolutions. These branches corresponding to distinct resolution feature maps operate concurrently, continuously engaging in feature fusion across different branches. Each high and low-resolution feature benefits from repeated information extraction from other parallel connections, thereby enriching the feature details pertinent to small objects.
From the structure diagram, it can be observed that after the input of surveillance images from power operation scenes into the network, multiple-stage structures and transition structures are employed to obtain three sets of feature maps with resolutions of 1/8, 1/16, and 1/32 in relation to the original size. The stage structure is used to extract and compress image features and fuse processed features of different sizes, while the transition structure is used to add new branches of different scales in parallel.
The transition structure in the network consists of CBS layers. It includes a series of depthwise separable convolution layers, normalization layers, and activation function layers. Its main function is to add a new scale branch in parallel. Within Transition1, two convolutional layers are utilized in parallel, each with a kernel size of 3 × 3. One of these layers operates with a stride of 1, adjusting the channel count to yield a scale branch downsampled by a factor of 8. Meanwhile, the other convolutional layer employs a stride of 2, both modifying the channel count and altering feature dimensions, thus generating scale branches downsampled by a factor of 16. In Transition2, a convolution layer featuring a 3 × 3 kernel size and a stride of 2 is added on top of the smallest scale branch to obtain a new scale branch downsampled by a factor of 32. The transition structure controls the resolution and channel numbers to facilitate subsequent feature fusion. The adjustment of channel numbers helps reduce computational complexity and parameter count.
In the Stage structure of the backbone network, Stage1 is different from either Stage2 and Stage3. Stage1 includes three CBS modules and one Layer module. The Layer module is composed of stacked Bottleneck modules, enabling channel count adjustment without modifying the feature dimensions. In Stage2 and Stage3, feature extraction and compression are performed using four BasicBlock modules, followed by a FuseLayer fusion module for information interaction across different scale branches.
In each FuseLayer fusion module, the output result is the result of processing and fusing the features from all previous branches. The information interaction between different branches in our designed FuseLayer fusion layer is illustrated in the provided Figure 3. Taking the FuseLayer in Stage3 as an example. The feature maps with the same resolution are copied directly without processing. The feature maps that need to be upsampled first undergo a 1 × 1 convolution operation to unify their channels and then undergo nearest neighbor upsampling. The feature maps that need to be downsampled use stride 3 × 3 convolution for downsampling, adding a Conv module with a 3 × 3 kernel and stride 2 for every 2× downsampling required. Finally, all feature layers are fused so that low-resolution features can obtain the context information of high-resolution features while retaining more detailed information.

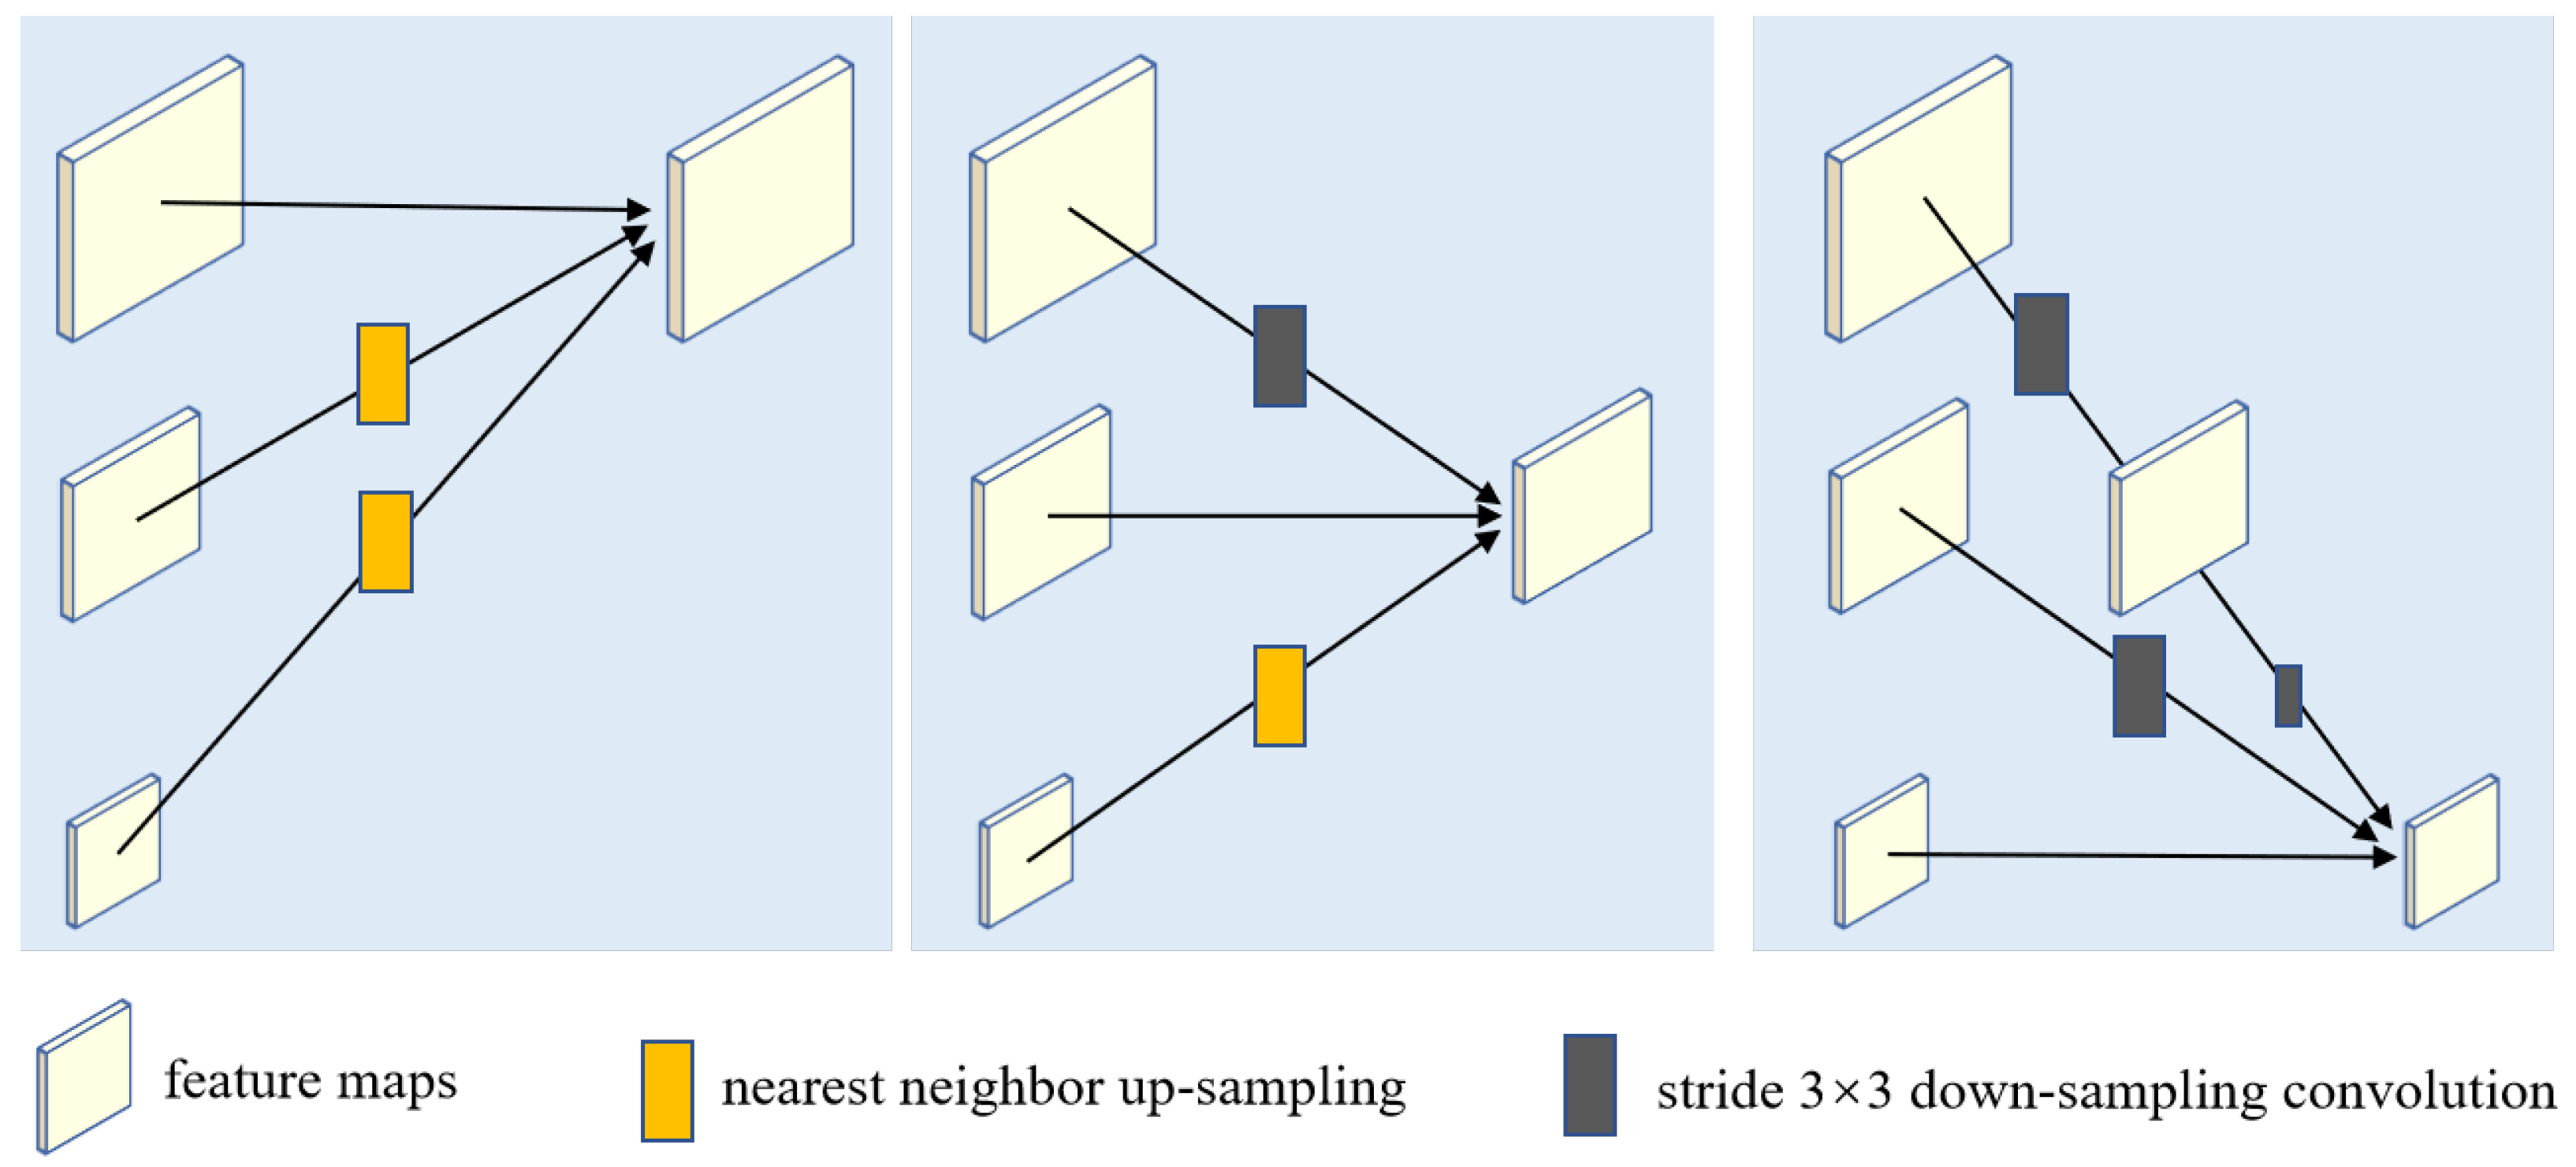
2.2.3. Feature Fusion Network

The Neck in YOLOv5s utilizes the structures of the Path Aggregation Network (PANet) to enhance semantic representation and localization capability across multiple scales. The network performs upsampling of feature maps using nearest neighbor interpolation, where each object pixel is individually copied and enlarged. However, since small objects occupy a limited number of pixels in the image, the feature information carried by each object pixel becomes sparse and insufficient after being individually replicated and enlarged. This may result in the loss of fine details around small objects. Furthermore, the nearest neighbor interpolation method only considers the closest pixel values and ignores the smooth transition between neighboring pixels. As a result, the upsampled feature maps may exhibit noticeable aliasing artifacts, leading to distorted or deformed shapes of small objects. This distortion increases the complexity of detection algorithms to accurately recognize and pinpoint small objects.
To address the aforementioned issue, we introduce sub-pixel convolution into the FPN structure. Sub-pixel convolution splits each pixel value into multiple sub-pixels and recombines them across channels, transforming the original low-resolution feature map with dimensions H × W × C· r 2 into a high-resolution feature map with dimensions rH × rW × C, achieving the effect of upsampling, as shown in Figure 4. More precisely, every low-resolution pixel is subdivided into smaller r × r grids. The pixel shuffle operations are applied to populate these grids with values from the corresponding positions in r × r feature maps. By applying the same pixel shuffle operation to fill each grid, the recombination process is completed. The calculation can be expressed as shown in Equations (1) and (2).
I HR   = PS ( I LR )
PS ( T ) x , y , c = T [ x / r ] , [ y / r ] , c · r · mod ( y , r ) + c · mod ( x , r )
where I LR represents the low-resolution feature map; I HR represents the high-resolution feature map; x and y represent the coordinates in the rH and rW dimensions of the high-resolution image; T represents the input feature; c represents the final number of channels after sub-pixel convolution; and r represents the upsampling factor; PS is a periodic pixel shuffle operation that cyclically inserts pixels from the channels into the image.
Compared to simple interpolation methods, sub-pixel convolutional upsampling can better reconstruct subtle variations in the image, making the boundaries and textures of small objects clearer. Additionally, sub-pixel convolutional upsampling can enlarge the receptive field, allowing the network to capture better contextual information in the vicinity of objects. This enhancement bolsters the model’s adaptability to small objects, particularly in intricate backgrounds, and aids in distinguishing small objects from the background.

2.2.4. Object Detection Head

The Head module serves as the final detection component of the HS-YOLO detection network. The Head consists of three detection branches corresponding to different scale feature maps obtained in the Neck. This structure effectively utilizes the feature information from different scales, enabling accurate detection of objects of various sizes. In the Head, the features from different branches are partitioned into grids of dimensions 80 × 80, 40 × 40, and 20 × 20, respectively. For each grid, the Head undertakes the task of predicting a set of parameters that encompass the bounding box coordinates, the confidence scores related to those boxes, and the probabilities associated with the object classes. These predictions represent the object’s position, presence, and category. By processing the grids, efficient and real-time object detection is achieved.
During model training, a comprehensive loss function composed of confidence loss L obj , classification loss L cls , and bounding box regression loss L box is designed to measure the accuracy of the detection head’s output. This integrated loss function allows for a comprehensive evaluation of both bounding box prediction and object class prediction accuracy, thereby promoting end-to-end optimization learning of the model.
The L obj plays a pivotal role in evaluating the trustworthiness of predicted boxes. It is computed through the utilization of the cross-entropy loss function, as shown in Equation (3).
L obj = i = 0 s 2 j = 0 B I i j obj C ^ i j log C i j + 1 C ^ i j log 1 C i j   i = 0 s 2 j = 0 B I i j noobj C ^ i j log C i j + 1 C ^ i j log 1 C i j
where s 2 represents the S × S grids that the features of different branches are divided into in the Head. B represents the number of anchor boxes assigned to each grid for prediction during the detection process. I ij obj and I ij nobj indicates whether the j-th anchor box in the i-th grid is a positive or negative sample, where I ij obj is 1 for a positive sample, while I ij nobj is 1 for a negative sample. C ^ i j represents the confidence of the ground truth label for the sample, which can take the values of 0 or 1. C i j represents the anticipated confidence score assigned to the sample produced by the detection head module.
The L cls calculates the classification error between the ground truth class labels and predicted class probabilities in each grid. L cls and L obj , use the same loss function to calculate, as demonstrated in Equation (4).
L c l s = i = 0 s 2 I i j obj C classes P ^ i j log P i j + 1 P ^ i j log ( 1 P i j )
where P ^ i j represents the true class and P i j represents the class probability value predicted by the model.
The L box serves the purpose of assessing the positional disparity between the predicted location and the true location. It adopts the CIOU loss function, which combines more factors, such as diagonal distance changes, thus providing a more accurate position estimation. The computation is shown in Equations (5)–(7).
Loss box = 1 IOU + ρ 2 ( b , b gt ) c 2 + α v
α = v ( 1 IOU ) + v
v = 4 π 2 ( arctan w gt h gt arctan w h ) 2
where b and b gt represent the center points of the two bounding boxes; ρ represents the normalized parameter corresponding to the distance between these two boxes; c represents the diagonal length of the minimum rectangular box surrounding the two bounding boxes; α is a balancing parameter that measures the similarity in aspect ratios; w gt h gt and w h represent the aspect ratios of the two bounding boxes, respectively.
The Head utilizes DIOU-NMS [30] to eliminate redundant bounding boxes in the output and merge multiple overlapping boxes into a single optimal result. DIOU is used as the evaluation criterion instead of IOU in NMS. It considers both the degree of bounding box intersection and the positional information of objects into the suppression process, enhancing the recognition capability for multiple objects and occluded objects. The calculation is shown in Equations (8) and (9).
S i = S i , I O U R DIOU ( M , B i ) < ε , 0 , I O U R DIOU ( M , B i ) ε ,
DIOU = IOU ρ 2 ( b , b gt ) c 2
where s i represents the classification score of the bounding box; ε represents the key parameters set for executing NMS; M represents the bounding box with the highest score; B i represents the other bounding boxes.

3. Results and Discussion

3.1. Dataset

There are currently no publicly available data sets for power operation scenarios. To evaluate the efficacy of HS-YOLO for detecting small objects in power operation scenarios, a custom dataset suitable for power operation scenes was constructed in this study.
(1) Data Collection: The images in the power operation dataset were collected from on-site inspections in a substation using two methods: photographs taken by inspection personnel and the images captured from the actual power operation scene surveillance video. A total of 6550 images were collected, capturing different angles of power operation scenes.
In the collected dataset, the dimensions of objects within the monitoring images exhibited variation in response to alterations in distance or shooting angles between the objects and the camera. Based on the variations in object sizes present in the monitoring images, the objects are divided into two categories: (1) Small objects that consistently maintain a diminutive presence within the image regardless of the distance and angle. As shown in Figure 5a,b, the object of detecting the neckline of a work uniform is considered a small object in the monitoring images regardless of the shooting angle and distance. (2) Objects whose size in the image varies greatly as the distance and angle shot change. As shown in Figure 5c,d, when the object of detecting a safety seine is close to the monitoring camera, it occupies a large proportion of the monitoring image and is considered a medium-to-large object. However, when the object is far from the monitoring camera, it occupies a small proportion of the monitoring image and is considered a small object.
(2) Data Cleaning, Augmentation, and Normalization: Firstly, the collected image data was cleaned by removing images that had no objects, severe object occlusions, or excessive blurriness, as these images would not contribute to effective model training. Secondly, diverse data augmentation methods, including but not limited to blurring, rotation, and Gaussian noise, are used to process the cleaned images, and the data set is further expanded. The expanded data set of plugging power operation scenarios contains 4950 images. Finally, the pixel sizes of the images obtained by different methods were inconsistent. To ensure consistent input for the model training, the image sizes were normalized. The commonly used input size for YOLOv5 is 640 × 640 pixels. However, the power operation scene images we collected mainly had three types of sizes: 5184 × 3888, 1280 × 720, and 1920 × 1080. In this experiment, the image sizes were normalized to 1280 × 800 pixels to expedite the model training process.
(3) Data Annotation and Dataset Split: Based on the detection task described in Section 1, we used the LabelImg 1.8.3 software to annotate seven detection objects in the images of the power operation scene dataset. The annotated objects include Human, Hat, Safetybelt, Seine, Fence, Noneckline, and Nocuff. According to the proportion of the objects in the images, we divided the seven objects into two categories: objects with small proportions and objects with large proportion spans. The objects with small proportions include Safetybelt, Noneckline, and Nocuff, while the objects with large proportion spans include Human, Hat, Seine, and Fence. The number of annotations for each category in the data set is shown in Table 1.

3.2. Training Details

The experimental setup for this study included an Intel® Core™ i9-9900K CPU and a GeForce RTX 2080 Ti 11G GPU. These experiments were executed on a Windows 10 operating system, employing PyTorch 1.8.0 as the deep learning framework and CUDA version 10.0.
We conducted training on a dataset comprising 3465 images. Based on the YOLOv5 template, the network was improved and optimized without using pre-trained weights. The training was conducted for 300 epochs with a batch size of four. The initial learning rate was set to 0.01 and a weight decay coefficient of 0.0005 was applied.

3.3. Evaluation Metrics

This experiment employed commonly used evaluation metrics in deep learning, including precision (P), recall (R), average precision (AP), and mean average precision (mAP).
P and R are widely used measures in detection and classification tasks. They are calculated as follows:
Precision = k N = TP TP + FP
Recall = k M = TP TP + FN
where TP represents true positives (correctly detected positive samples), FP represents false positives (incorrectly detected positive samples), and FN represents false negatives (missed positive samples).
AP and mAP are important metrics for evaluating model performance in object detection tasks. AP represents the average precision for a single object category, while mAP takes into account the average precision across all object categories. The calculation formulas are as follows:
AP = 0 1 P ( R ) d ( R )
mAP = 1 M j = 1 M AP j
where M represents the total number of object categories.
FPS [31] represents the number of image frames a detection model can process per second and is a crucial metric for evaluation. FPS directly influences the real-time capability and response speed of a detection. The calculation formulas are as follows:
FPS = N i T t
where N i represents the number of image frames processed in a certain period of time; T t represents the measurement interval.

3.4. Experiments on the Power Operation Dataset

3.4.1. Model Training

The training loss is an important metric during the model training process as it reflects the optimization performance of the model. We compared the training loss curves of the HS-YOLO and the original YOLOv5, as shown in Figure 6.
The training loss of the original YOLOv5 is depicted by the blue curve, whereas the training loss of the HS-YOLO is indicated by the orange curve. As shown in Figure 6a, the training loss of HS-YOLO is lower than that of the unchanged YOLOv5. From Figure 6b–d, we can observe that HS-YOLO exhibits lower losses across different categories compared to the original YOLOv5. Moreover, the losses are steadily decreasing, indicating that the model is gradually converging, and its performance is improving.
The newly added HRNet and sub-pixel convolution for small object detection offer several advantages, including enhanced spatial information and finer feature representation. These advantages aid the network in capturing object features and positions more effectively, resulting in reduced losses, accelerated convergence, and enhanced training efficiency.

3.4.2. Ablation Experiment

To assess the efficacy of the improvements introduced in the HS-YOLO algorithm for small object detection, ablation experiments were performed on each enhancement point using the created dataset of power operation scenes. The results are shown in Table 2. In the table, Experiment ① represents the results of the original YOLOv5 model. “A” indicates the improvement of using the HRNet network as the backbone, while “B” represents the improvement of using sub-pixel convolution as the upsampling operator in the feature fusion network.
Comparing Experiment ②, Experiment ③, and Experiment ④ with the original YOLOv5 network, we can observe that using the HRNet feature extraction backbone network only sacrifices 1% of the detection accuracy while improving the detection recall by 4.1%. Introducing sub-pixel convolution in the Neck leads to a 2% increase in detection accuracy and a 3.1% increase in detection recall. When the original network is improved using HRNet and sub-pixel convolution at the same time, the detection accuracy is improved by 1%, and the detection recall is improved by 3.9%. This indicates that the algorithm can identify objects more accurately and comprehensively, reducing false detections and missed detections.
HRNet’s multi-scale features enable a more comprehensive capture of object contextual information, while sub-pixel convolution upsampling can restore finer spatial details. This aids in reducing false detections and missed detections caused by background interference or blurring. HRNet is more complex than the original backbone network, the introduction of HRNet will bring relatively high computational costs. However, we can observe that improving model detection performance only sacrifices a small amount of FPS. In high-risk power operation scenarios, detection accuracy often takes precedence over speed.
The experiments in Table 3 show that when HRNet is used to improve the backbone network, only the AP of the Fence category decreases by 3.4%. Other objects showed slight improvements, and objects with consistently small proportions saw significant improvements in AP, with increases of 2.3%, 4.3%, and 11.8% for different objects. The mAP improved by 2.7% compared to before the improvement. After adding sub-pixel convolution to the original network, only the AP of the Human object slightly decreased, while other object categories showed varying degrees of improvement in AP. The mAP improved by 1% compared to before the improvement. When both HRNet and sub-pixel convolution were added to the network, the mAP reached 87.2%, a 3.5% improvement over the original network. There were improvements in AP for all seven object categories, with significant improvements of 4.4%, 5.8%, and 10.7% for the Safetybelt, Noneckline, and Nocuff objects, respectively. This validates that HS-YOLO can be applied to detection tasks in the context of power operation scenarios.

3.4.3. Comparative Experiments

To affirm the dependability of the HS-YOLO network as proposed, we partitioned the training process into three stages, each spanning 100 epochs. Within each stage, we randomly selected an epoch and conducted a comparative evaluation of detection performance between the baseline YOLOv5 network and the HS-YOLO network we proposed.
We selected the 100th epoch, 200th epoch, and 300th epoch for the comparative analysis of the three training stages. As shown in Table 4, after the first stage of training, both the YOLOv5 and HS-YOLO networks achieved near-optimal levels of AP for detecting Human, Hat, Seine, and Fence in the dataset, with little difference between them. However, for the Safetybelt, Noneckline, and Nocuff classes (all of which are all small objects), the AP can be greatly improved.
In the Epoch 100 experiment, both HS-YOLO and YOLOv5 had lower maps, but HS-YOLO outperformed YOLOv5 with a 5.2% higher mAP. Specifically, Noneckline and Nocuff categories had significantly improved AP, with increases of 10.3% and 24%, respectively. By the 200th epoch, after sufficient training, both HS-YOLO and YOLOv5 achieved high mAP values. However, HS-YOLO had a higher mAP of 83.4%, surpassing YOLOv5 by 5.3%. Notably, the Safetybelt, Noneckline, and Nocuff categories exhibited improved AP, with gains of 5.2%, 10.6%, and 19.8%, respectively. In the 300th epoch, HS-YOLO maintained its superiority with a 2.8% higher mAP than YOLOv5. Moreover, the Safetybelt, Noneckline, and Nocuff categories showed AP improvements of 3.8%, 3.7%, and 9.4%, respectively. Throughout the entire training stage, our proposed HS-YOLO consistently outperformed YOLOv5 in detecting various objects in the power operation scenarios, especially small objects.
HRNet processes images using a multi-resolution approach and is able to capture multi-scale features, which helps to retain details of small objects and provide richer feature representations. Sub-pixel convolution performs finer upsampling on the feature, and aids in achieving more precise object boundary localization. This significantly enhances the precision of detection, enabling the detection model to precisely recognize and pinpoint small objects.
To further evaluate the HS-YOLO algorithm, we conducted experiments on the power operation scene dataset and compared it with other classic algorithms.
The results in Table 5 demonstrate that our proposed HS-YOLO achieves higher AP for various object categories in the power operation scene compared to the original network and other classical networks. The mAP also shows significant improvement, with a 3.5% increase compared to the original network and a 13.5% increase compared to SSD. Particularly, there is a significant improvement in AP for small objects that are prone to be missed in the electric power operation scene, such as Safetybelt, Noneckline, and Nocuff categories. Even when compared to the latest YOLOv8, HS-YOLO exhibits similar detection accuracy on four large objects of Human, Hat, Seine, and Fence. Moreover, it shows varying degrees of improvement in the detection of three small objects of Safetybelt, Noneckline, and Nocuff, with respective increases in AP of 1.7%, 2.5%, and 4.3%. This demonstrates that our proposed HS-YOLO, when applied to the electric power operation scene, not only maintains high detection accuracy for large and medium-sized objects but also greatly improves it for small objects.

3.4.4. Visualize the Results

To provide a more direct analysis of the detection performance of HS-YOLO, we conducted tests on selected images from the electric power operation scene test set and compared the results with the network YOLOv5. Figure 7 shows the detection status of the model on the power operation scenarios test set before and after the improvement.
Figure 7a,b shows the detection results of the two methods. When detecting images from different monitoring angles (overhead, eye-level, upward) and indoor/outdoor electric power operation scenes, both YOLOv5 and HS-YOLO can accurately detect objects with large-scale variations, such as Human and Seine. However, HS-YOLO exhibits higher confidence scores in its detections. On the other hand, for small objects with minimal scale variations, such as Safetybelt, Noneckline, and Nocuff categories, YOLOv5 exhibits many missed detections, whereas HS-YOLO is capable of detecting these hard-to-find small objects. Our proposed HS-YOLO outperforms YOLOv5 in recognizing small objects in complex power operation scenarios.

3.5. Experiments on the COCO Dataset

To further provide an impartial and objective evaluation of the generality and generalization of the HS-YOLO algorithm, a comparison was made between the introduced HS-YOLO algorithm and the unaltered YOLOv5 on the publicly available COCO dataset.
Both HS-YOLO and the original YOLOv5 were trained for 100 epochs on the COCO dataset, and we compared their training processes. The training losses of the two models are shown in Figure 8. The training loss of the original YOLOv5 is depicted by the blue curve, whereas the training loss of the proposed HS-YOLO is indicated by the orange curve.
As shown in Figure 8, HS-YOLO exhibits lower overall training loss and various class-specific losses compared to YOLOv5 after 100 epochs of training, indicating that HS-YOLO performs better. Moreover, all class-specific losses steadily decrease during training, indicating that the model’s performance steadily improves over time.
In the COCO dataset, the objects are categorized into three size ranges based on their pixel areas. To gain a comprehensive understanding of the algorithm’s performance on objects of different sizes, we compared HS-YOLO and YOLOv5 in detecting objects of different sizes on COCO. The results are shown in Table 6, where AP small , AP medium , and AP large represent the average precision for small, medium, and large objects, respectively.
The experimental results in Table 6 demonstrate that when HS-YOLO is used as the detection network, the mAP is 63.0%, which is an improvement of 9.4% over the unmodified YOLOv5. Furthermore, for objects of different sizes in the COCO dataset, HS-YOLO achieves AP large , AP medium , and AP small of 56.2%, 48.6%, and 27.1%, respectively. Compared to the unmodified YOLOv5, HS-YOLO increases AP large , AP medium , and AP small by 11.4%, 9.3%, and 8.6%, respectively. These results indicate that HS-YOLO demonstrates better detection performance on objects of different sizes. Therefore, the proposed HS-YOLO algorithm not only performs well in small object detection in power operation scenes but also exhibits significant advantages on the COCO dataset. This demonstrates that HS-YOLO possesses strong generality and generalization capabilities.

4. Conclusions

Various factors influencing the detection of small objects in electric power operation scene monitoring include small object pixel size, complex background information, and image blurring. To address the challenges of small object detection in power operation scenarios, this paper proposes the HS-YOLO object detection algorithm based on HRNet and sub-pixel convolution. HRNet is utilized to extract features from small objects, alleviating the problem of significant feature loss during extraction. During the multi-scale feature fusion, sub-pixel convolution is employed to upsample the low-resolution feature maps, preserving more feature information of small objects. Experimental results indicate that compared to other classical methods, HS-YOLO performs better on various object categories. With the same number of training epochs, the proposed HS-YOLO achieves a mAP of 87.2% on the self-constructed electric power operation scene dataset, which is a 3.5% improvement over YOLOv5. Particularly, there is a notable improvement in the detection of small objects in the dataset. HS-YOLO greatly reduces the occurrence of missed detections for small objects in power operation scenarios compared to YOLOv5.
In future work, considering the practical deployment and application of the algorithm, we will further focus on lightweighting the algorithm and conduct research on real-time detection.

Author Contributions

Conceptualization, Z.L., W.C. and L.S.; methodology, Z.L. and W.C.; software, Z.L.; validation, Z.L., W.C. and Y.C.; formal analysis, Z.L.; investigation, W.C. and T.L.; resources, Z.L. and W.C.; data curation, Z.L.; writing—original draft preparation, Z.L.; writing—review and editing, Z.L.; visualization, Z.L.; supervision, L.S. and T.L.; project administration, Z.L.; funding acquisition, L.S. and T.L. All authors have read and agreed to the published version of the manuscript.

Funding

This research was funded by the Natural Science Foundation of the Department of Science and Technology of Fujian Province under Grant No. 2022J011255 and the Science and Technology Project of East China Branch of State Grid under Grant No. SGHD0000AZJS2310287.

Institutional Review Board Statement

Not applicable.

Informed Consent Statement

Not applicable.

Data Availability Statement

Data is not available for privacy reasons.

Acknowledgments

We thank Fujian Xiamen State Grid Corporation for the photos of power operators and FanYin of the State Grid East China Branch provided valuable help.

Conflicts of Interest

The authors declare no conflict of interest.

References

  1. Xiao, Y.; Chang, A.; Wang, Y.; Huang, Y.; Yu, J.; Huo, L. Real-time Object Detection for Substation Security Early-warning with Deep Neural Network based on YOLO-V5. In Proceedings of the IEEE IAS Global Conference on Emerging Technologies (GlobConET), Arad, Romania, 20–22 May 2022; pp. 45–50. [Google Scholar]
  2. Yan, X.; Jia, L.; Cao, H.; Yu, Y.; Wang, T.; Zhang, F.; Guan, Q. Multitargets joint training lightweight model for object detection of substation. IEEE Trans. Neural Netw. Learn. Syst. 2022, 2022, 3190139. [Google Scholar] [CrossRef] [PubMed]
  3. Xiang, X.; Zhao, F.; Peng, B.; Qiu, H.; Tan, Z.; Shuai, Z. A YOLO-v4-Based Risk Detection Method for Power High Voltage Operation Scene. In Proceedings of the IEEE International Conference on Signal Processing, Communications and Computing (ICSPCC), Xi’an, China, 17–19 August 2021; pp. 1–5. [Google Scholar]
  4. Hu, Q.; Bai, Y.; He, L.; Huang, J.; Wang, H.; Cheng, G. Workers’ Unsafe Actions When Working at Heights: Detecting from Images. Sustainability 2022, 14, 6126. [Google Scholar] [CrossRef]
  5. Oliveira, B.A.S.; Neto, A.P.D.F.; Fernandino, R.M.A.; Carvalho, R.F.; Fernandes, A.L.; Guimaraes, F.G. Automated Monitoring of Construction Sites of Electric Power Substations Using Deep Learning. IEEE Access 2021, 9, 19195–19207. [Google Scholar] [CrossRef]
  6. Chen, X.; Chen, W.; Su, L.; Li, T. Slender Flexible Object Segmentation Based on Object Correlation Module and Loss Function Optimization. IEEE Access 2023, 11, 29684–29697. [Google Scholar] [CrossRef]
  7. Wu, J.; Su, L.; Lin, Z.; Chen, Y.; Ji, J.; Li, T. Object Detection of Flexible Objects with Arbitrary Orientation Based on Rotation-Adaptive YOLOv5. Sensors 2023, 23, 4925. [Google Scholar] [CrossRef] [PubMed]
  8. Zhang, T.; Zhang, Y.; Xin, M.; Liao, J.; Xie, Q. A Light-Weight Network for Small Insulator and Defect Detection Using UAV Imaging Based on Improved YOLOv5. Sensors 2023, 23, 5249. [Google Scholar] [CrossRef] [PubMed]
  9. Gu, J.; Hu, J.; Jiang, L.; Wang, Z.; Zhang, X.; Xu, Y.; Zhu, J.; Fang, L. Research on object detection of overhead transmission lines based on optimized YOLOv5s. Energies 2023, 16, 2706. [Google Scholar] [CrossRef]
  10. Liu, Y.; Sun, P.; Wergeles, N.; Shang, Y. A survey and performance evaluation of deep learning methods for small object detection. Expert Syst. Appl. 2021, 172, 114602. [Google Scholar] [CrossRef]
  11. Lim, J.S.; Astrid, M.; Yoon, H.J.; Lee, S.I. Small object detection using context and attention. In Proceedings of the IEEE International Conference on Artificial Intelligence in Information and Communication (ICAIIC), Jeju Island, Republic of Korea, 13–16 April 2021; pp. 181–186. [Google Scholar]
  12. Arulprakash, E.; Aruldoss, M. A study on generic object detection with emphasis on future research directions. J. King Saud Univ.-Comput. Inf. Sci. 2022, 34, 7347–7365. [Google Scholar] [CrossRef]
  13. Zhang, Q.; Zhang, H.; Lu, X. Adaptive Feature Fusion for Small Object Detection. Appl. Sci. 2022, 12, 11854. [Google Scholar] [CrossRef]
  14. Li, Y.; Li, J.; Meng, P. Attention-YOLOV4: A real-time and high-accurate traffic sign detection algorithm. Multimed. Tools Appl. 2023, 82, 7567–7582. [Google Scholar] [CrossRef]
  15. Wang, Y.; Bashir, S.M.A.; Khan, M.; Ullah, Q.; Wang, R.; Song, Y.; Guo, Z.; Niu, Y. Remote sensing image super-resolution and object detection: Benchmark and state of the art. Expert Syst. Appl. 2022, 197, 116793. [Google Scholar] [CrossRef]
  16. Yang, R.; Yu, Y. Artificial convolutional neural network in object detection and semantic segmentation for medical imaging analysis. Front. Oncol. 2021, 11, 638182. [Google Scholar] [CrossRef] [PubMed]
  17. Tong, K.; Wu, Y.; Zhou, F. Recent advances in small object detection based on deep learning: A review. Image Vis. Comput. 2020, 97, 103910. [Google Scholar] [CrossRef]
  18. Tong, K.; Wu, Y. Rethinking PASCAL-VOC and MS-COCO dataset for small object detection. J. Vis. Commun. Image Represent. 2023, 93, 103830. [Google Scholar] [CrossRef]
  19. Lin, T.Y.; Dollár, P.; Girshick, R.; He, K.; Hariharan, B.; Belongie, S. Feature pyramid networks for object detection. In Proceedings of the IEEE Conference on Computer Vision and Pattern Recognition (CVPR), Honolulu, HI, USA, 21–27 July 2017; pp. 2117–2125. [Google Scholar]
  20. Tan, M.; Pang, R.; Le, Q.V. Efficientdet: Scalable and efficient object detection. In Proceedings of the IEEE/CVF Conference on Computer Vision and Pattern Recognition (CVPR), Seattle, WA, USA, 13–19 June 2020; pp. 10781–10790. [Google Scholar]
  21. Zhai, S.; Shang, D.; Wang, S.; Dong, S. DF-SSD: An improved SSD object detection algorithm based on DenseNet and feature fusion. IEEE Access 2020, 8, 24344–24357. [Google Scholar] [CrossRef]
  22. Zeng, N.; Wu, P.; Wang, Z.; Li, H.; Liu, W.; Liu, X. A small-sized object detection oriented multi-scale feature fusion approach with application to defect detection. IEEE Trans. Instrum. Meas. 2022, 71, 1–14. [Google Scholar] [CrossRef]
  23. Li, J.; Liang, X.; Wei, Y.; Xu, T.; Feng, J.; Yan, S. Perceptual generative adversarial networks for small object detection. In Proceedings of the IEEE Conference on Computer Vision and Pattern Recognition (CVPR), Honolulu, HI, USA, 21–27 July 2017; pp. 1222–1230. [Google Scholar]
  24. Xing, C.; Liang, X.; Bao, Z. A small object detection solution by using super-resolution recovery. In Proceedings of the IEEE 7th International Conference on Computer Science and Network Technology (ICCSNT), Dalian, China, 19–20 October 2019; pp. 313–316. [Google Scholar]
  25. Liu, Z.; Gao, G.; Sun, L.; Fang, Z. HRDNet: High-resolution detection network for small objects. In Proceedings of the IEEE International Conference on Multimedia and Expo (ICME), Shenzhen, China, 5–9 July 2021; pp. 1–6. [Google Scholar]
  26. Wang, Z.Z.; Xie, K.; Zhang, X.Y.; Chen, H.Q.; Wen, C.; He, J.B. Small-object detection based on yolo and dense block via image super-resolution. IEEE Access 2021, 9, 56416–56429. [Google Scholar] [CrossRef]
  27. Redmon, J.; Divvala, S.; Girshick, R.; Farhadi, A. You only look once: Unified, real-time object detection. In Proceedings of the IEEE Conference on Computer Vision and Pattern Recognition (CVPR), Las Vegas, NV, USA, 27–30 June 2016; pp. 779–788. [Google Scholar]
  28. Sun, K.; Xiao, B.; Liu, D.; Wang, J. Deep high-resolution representation learning for human pose estimation. In Proceedings of the IEEE/CVF Conference on Computer Vision and Pattern Recognition (CVPR), Long Beach, CA, USA, 16–17 June 2019; pp. 5693–5703. [Google Scholar]
  29. Shi, W.; Caballero, J.; Huszár, F.; Totz, J.; Aitken, A.P.; Bishop, R.; Rueckert, D.; Wang, Z. Real-time single image and video super-resolution using an efficient sub-pixel convolutional neural network. In Proceedings of the IEEE Conference on Computer Vision and Pattern Recognition (CVPR), Las Vegas, NV, USA, 27–30 June 2016; pp. 1874–1883. [Google Scholar]
  30. Zheng, Z.; Wang, P.; Liu, W.; Li, J.; Ye, R.; Ren, D. Distance-IoU loss: Faster and better learning for bounding box regression. In Proceedings of the AAAI Conference on Artificial Intelligence, New York, NY, USA, 7–12 February 2020; pp. 12993–13000. [Google Scholar]
  31. Huang, X.; Zhang, Y.J. 300-FPS salient object detection via minimum directional contrast. IEEE Trans. Image Process. 2017, 26, 4243–4254. [Google Scholar] [CrossRef] [PubMed]
Figure 1. Network structure of the HS-YOLO algorithm.
Applsci 13 11114 g001
Figure 2. HRNet Feature Extraction Backbone Network.
Applsci 13 11114 g002
Figure 3. Different resolution feature map fusion methods.
Applsci 13 11114 g003
Figure 4. Sub-pixel convolution implements the upsampling process.
Applsci 13 11114 g004
Figure 5. Object size under different shooting distance and angle. (a,b) represents objects that have always been small in the monitoring image; (c,d) represents objects that vary greatly in scale in the surveillance image.
Applsci 13 11114 g005
Figure 6. The training loss comparison between HS-YOLO and the original YOLOv5 on the dataset for power operation. (a) represents a comparison in total training loss; (b) represents a comparison in confidence loss; (c) represents a comparison of classified loss; (d) represents a comparison in bounding box regression loss.
Applsci 13 11114 g006
Figure 7. The detection results of the method before and after improvement on the power operation scenarios dataset. (a) the detection results of the YOLOv5 model; (b) the detection results of the HS-YOLO model.
Applsci 13 11114 g007
Figure 8. The training loss comparison between HS-YOLO and the original YOLOv5 on the COCO dataset. (a) represents a comparison in total training loss; (b) represents a comparison in confidence loss; (c) Represents a comparison of classified loss; (d) represents a comparison in bounding box regression loss.
Applsci 13 11114 g008
Table 1. Annotations for each category of the power operation scenario data set.
DatasetSumTraining SetValidation SetTesting Set
Number of images49503465990495
Number of annotations for ‘Human’33512384676291
Number of annotations for ‘Hat’27862005541240
Number of annotations for ‘Safetybelt’14781044238196
Number of annotations for ‘Seine’26181820512286
Number of annotations for ‘Fence’16631184312167
Number of annotations for ‘Noneckline’1358997229132
Number of annotations for ‘Nocuff’1245895213137
Table 2. Ablation Experiment Results.
OrderABRecall (%)Precision (%)mAP (%)FPS (t/n)
90.093.883.747.8
89.097.986.441.7
92.096.984.748.3
91.098.787.242.1
Table 3. Comparison of various types of AP in ablation experiments.
OrderABHuman (%)Hat (%)Safetybelt (%)Seine (%)Fence (%)Noneckline (%)Nocuff (%)
94.396.586.868.094.185.160.9
95.097.889.170.390.789.472.7
93.397.286.972.494.386.162.5
94.997.691.269.494.590.971.6
Table 4. Evaluation of HS-YOLO and YOLOv5 models at different stages.
100 Epoch200 Epoch300 Epoch
YOLOv5HS-YOLOYOLOv5HS-YOLOYOLOv5HS-YOLO
AP (%)Human93.393.593.994.094.394.4
Hat96.396.796.797.296.797.6
Safetybelt79.079.180.485.686.089.8
Seine63.064.666.767.068.368.8
Fence91.891.891.492.693.794.7
Noneckline67.978.273.584.185.889.5
Nocuff18.642.643.863.662.271.6
mAP (%)72.978.178.183.483.886.6
Table 5. Comparative experimental results.
ModelHuman (%)Hat (%)Safetybelt (%)Seine (%)Fence (%)Noneckline (%)Nocuff (%)mAP (%)
Faster-RCNN86.782.464.763.687.578.356.974.3
SSD85.980.665.860.888.479.554.873.7
YOLOv391.283.472.966.392.782.160.178.4
YOLOv491.885.577.465.193.683.959.879.6
YOLOv594.396.586.868.094.185.160.983.7
YOLOv895.397.489.570.594.988.467.386.2
HS-YOLO94.997.691.269.494.590.971.687.2
Table 6. Detection of objects of different sizes in the COCO dataset by Hs-YOLO and YOLOv5.
Model AP small (%) AP medium (%) AP large mAP (%)
YOLOv518.539.344.853.6
HS-YOLO27.148.656.263.0
Disclaimer/Publisher’s Note: The statements, opinions and data contained in all publications are solely those of the individual author(s) and contributor(s) and not of MDPI and/or the editor(s). MDPI and/or the editor(s) disclaim responsibility for any injury to people or property resulting from any ideas, methods, instructions or products referred to in the content.

