1. Introduction
All of our professional and personal activity is governed by computers and information technology, so ensuring that all people have reasonable access to them is a moral obligation. Preferences and special needs of users are becoming more and more important in the digital world [
1,
2,
3]. Information providers are progressively addressing the interaction needs of many different groups of population ranging from blind people, who number 285 million in the world and are expected to increase in the coming years [
4], to people with other types of disabilities, elder people with declining capacity, etc. The advances in accessibility are not only beneficial for people with permanent conditions but also for those who need to interact with systems in adverse situations (e.g., noisy places, places with bad illumination, and unstable workplaces). Terms like ”accessibility” and ”user modeling” pursue the same objective: the personalization and adaptation of systems to the specific needs of users to achieve an interaction adapted to the user. ISO 9241-171:2008 [
5], which provides ergonomics guidance and specifications for the design of accessible software, uses the term different capabilities, rather than disability. We also use this term throughout this article to align with this ISO standard.
International organizations have been working for decades on accessibility guidelines for providing adapted general interaction options to people with disabilities [
6,
7] and specifically in the educational area [
8]. Standardization organizations have developed standards that guide the application of accessibility principles to digital systems. For example, IMS AFA 3.0 [
9] and ISO/IEC 24751-1-2-3 [
10] provide technical requirements to adapt learning platforms to the personal needs and preferences of students.
People with different eyesight and/or motor abilities in the arms or hands need assistive technology [
11], such as screen readers, Braille devices, or personalized keyboards and mice, to access information. They also need transformations and adaptations for the presentation of data in different formats or different ways to access the data. For example, some tests are adapted for students with different visual capabilities. However, even the adaptation of these tests could not always satisfy the needs of students because of the short amount of time taken to operate it [
12]. Assistive technologies help blind people and people with motor problems to access information but the effort of interaction is higher than the that of those not needing such technologies; they generally require a longer time of interaction. This extra time is independent of both the previous knowledge of users and their motivation as it concerns mere interaction tasks, e.g., using a keyboard or a mouse to increase font size requires a more frequent use of the scroll bar. Using a Braille device or a screen reader also takes a longer time, as it requires compensation for the loss of perspective in information.
This extra time has a greater importance in education as students have limited allocated time for the completion of educational tasks. Therefore, students with different visual and motor capabilities actually spend a good part of the time during their learning activities interacting with assistive technology [
13]. This might have a negative impact on their education, especially if teachers and instructors are not aware of the amount of extra time they require for the tasks.
The characteristic of being computer-mediated is relevant because e-learning is frequently the only possible way to access education for people with different capabilities. It enables distance interaction and allows the presentation of information in different formats adapted to their needs, e.g., audio descriptions, subtitles, alternative options to non-textual content, etc.
The main objective of this article is to empirically analyze how much interaction time is required by people with different capabilities (blindness, reduced vision, and reduced motor skills) to complete a typical basic activity in e-learning like filling out a questionnaire in a context of adapted learning platforms. This objective leads to the two research questions as explained at the beginning of
Section 3. This is a task that students must frequently do in this type of environment. Questionnaires are a very frequent resource in e-learning for different purposes, such as assessment and self-assessment, feedback and opinion, etc. A study [
14] confirmed the use of questionnaires as an e-innovative ICT resource that allows teachers to use them with pedagogical criteria for improvement. This study highlighted varied advantages of questionnaires, e.g., objectivity, rigor, reliability in assessment and sustainability of monitoring and grading by teachers.
Studying the differences in the time required to answer questionnaires by people with different types of disability would help teachers in estimating the extra effort and time students need to complete learning tasks. This contribution represents an additional advance over previous research efforts like [
15] which already empirically analyzed the interaction time required by blind people, in comparison to sighted people, in an e-learning context.
2. Related Works
People with different capacities do not have the same opportunities as non-impaired persons in fields such as the educational field. Research work has aimed at providing solutions for equality of access to learning resources for impaired students, increasing the quality of education, and allowing society to benefit from the contributions of this group. There is an increasing interest in research in this area as expressed in recent contributions, e.g., medical education echoed this problem [
16], proposing a new educational system based on accessibility and the inclusion of impaired people using the stages of the Deming cycle. Alcaraz et al. [
17] opened the accessibility requirements to new resources like statistical graphs, facilitating their use by people with low-vision and color-vision conditions. Moreover, the study also addresses the future analysis of the feasibility of the evaluation methods by measuring the impact of the factor “time spent in each evaluation” on the learning results. Another work [
18] has studied the engagement in STEM of middle- and high-school visually impaired students through an outdoor immersion educational program focused on learning, collaboration, accessibility, and independence.
Although, in e-learning, some research works have assessed the accessibility of websites [
19,
20,
21], researchers have also devoted a great deal of effort to develop new methods to improve and implement web accessibility [
22,
23]. As mentioned above, standardization organizations have developed accessibility guidelines such as the WCAG (Web Content Accessibility Guidelines) [
24] presented as a set of recommendations for accessible web content. They are widely used in the field of web accessibility. These guidelines also represent the main reference for national and international regulation. The ISO (International Standardization Organization) standardized the WCAG [
25] and included 12 guidelines and 61 success criteria, classified according to three levels of accessibility: A (low priority), AA (medium priority), and AAA (high priority) [
26].
Accessibility in online educational environments has evolved slower than web accessibility, maybe because learning systems appeared a decade later. Relevant efforts in the area include several works on the adaptation of learning platforms to the preferences and needs of students, e.g., aTutor [
27] and Moodle [
28] according to the IMS specification v2.0 [
29] and the adaptation of Moodle according to the latest version of the IMS specification [
9,
30].
A good number of e-learning platforms still show a low level of accessibility, as observed in the analysis of websites in Jordan and the Arab region [
31]. An assessment of web content accessibility levels, using the international guidelines, in 21 Spanish official online educational environments [
32] found low accessibility levels despite the increasing number of legal and regulatory measures on accessibility: 97.62% and 54.76% of the websites in education portals evidenced non-conformance issues for accessibility levels A and AA. For example, the point “Text Resize” failed in 54.8% of the analyzed websites. However, a more recent study [
33] showed that technology is mature enough to develop educational systems that support students with different capabilities by combining institutional repositories and learning management systems.
Accessibility problems in educational contexts have an impact on results and the dedication of time and effort by students with different capabilities, e.g., one study also showed that bigger font size did not reduce reading time [
34] due to time spent scrolling [
35]. Students with motor problems also spend more time operating hardware devices. These findings suggest that a balanced learning process requires that teachers and tutors allocate more time to students with different capabilities to complete tasks or to read content.
The analysis of the impact of time spent on interaction within the educational context is not strange as the international recommendations also mention time as an essential aspect of accessibility. For example, two guidelines of the WCAG’s 3.0 recommendation [
24] emphasized the time factor as an important component in accessibility: guideline 1.2 “Time-based Media: provide alternatives for time-based media” and guideline 2.2 “Enough time: provide users enough time to read and use content”. This recommendation directly stresses the need to extend the slot of time in educational activities allocated to people with different capabilities.
The literature has considered the allocation of time in accessible learning environments. Roig-Vila et al. [
32] confirmed problems related to respecting accessibility guidelines such as allocating enough time to read and use content, something especially critical for students with different capabilities, e.g., blind users, low-vision users, deaf users, or users with cognitive or language limitations. A work in the e-learning context for visually impaired students [
36] and another one on the use of extended time [
37] highlighted the adaptation of reading time as a key factor for task completion by the different types of students. Evans and Douglas [
15] measured the time spent completing different online learning tasks by 10 blind participants and 10 sighted participants and determined the ratio of extra time required by blind students compared to sighted ones. Sloan et al. [
38] requested a holistic approach for multimedia to achieve more accessible learning environments and confirmed that time is a characteristic needed to be considered from the beginning. Another study [
39] presented the action plan of 52 European universities to integrate students with different capabilities and highlighted modifications of the predetermined timeframe of curricular objectives as part of the teaching and evaluation activities in academic programs.
Different studies went further into the analysis of the effects of lack of time on the speed of reading [
40] but also on the accuracy of results and comprehension [
41,
42,
43]. These works confirmed that providing enough time to students with different capabilities enables them to achieve an equivalent performance to that of students with no disability. For example, an analysis of 299 students compared the reading and comprehension rates between visually impaired and normally sighted school children [
43]. Results showed a statistical difference for the visually impaired students, concluding that the blind students took approximately two to three times more time to complete the tasks than the sighted learners: increasing the allocated time depending on the personal characteristics of each student works, although this is very difficult to implement. Another study [
40] established a slightly shorter time to be added: between 1.5 and 2 times longer than what sighted students need.
Some countries have policies for deciding how much additional time should be allowed for students with different capabilities, but it is usually the same fixed amount for all types of disabilities [
44]. Atkins [
45] also studied the advantages and disadvantages of the addition of fixed extra time for reading, completing tasks, and taking tests to solve some accessibility problems; the final recommendation was using time adapted to each individual depending on their level of visual impairment and their experience in using the adapted format. The big problem is how to estimate the recommended extra time required or at least how to provide guidelines to teachers to decide the amount of extra time required.
Some studies referring to time spent on learning activities provide some indications, but they are not conclusive, as they were not supported by relevant experimentation. McNear and Torres [
46] established that the time allocated to users with low vision should be 1.5 times longer than that allocated to sighted ones. Wetzel and Knowlton [
47] considered an increment of 50% in the time allocated to Braille readers to compensate for differences in reading rate and considered the possibility of adding more time to adjust other activities. Packer [
48] suggested a proportion between nearly two times for users with visual impairment using large fonts and more than two times longer for Braille users. Morris [
49] determined a ratio for people with different capabilities ranging from 1.5 times longer for users of large fonts and 2.5 times longer for Braille learners.
The most promising measurement study was the one in ref. [
15]. They used a strict method to measure the time required by one group of blind participants and one group of sighted participants while carrying out different learning activities, e.g., reading, listening, answering questions, etc. They determined a time twice longer for blind students than for the group without visual problems. However, they explained that blind students did not reach the same learning performance as the sighted group since they did not have the reference points to memorize content and they needed to read more times to keep everything in their mind. So, they extrapolated that the additional time required for understanding and answering questions was between 2 and 3 times the time of sighted participants and, for listening and reading, was between 1 and 1.25 times.
We can conclude, from all these studies, that a general trend of allocating a 1.5 to 3 times longer time to blind students than the time allocated to normally sighted students. However, this does not solve the problem of determining specific times for each type of student according to their type of capability: there are no more specific guides for visually impaired students as well as, e.g., students with motor problems. Together with the work with larger samples, this is the main motivation of our contribution: exploring the time estimation for blind students to compare it with the time described in the literature and extend the study to groups of students with low-vision and motor problems, collecting data from a more varied sample in specific online courses.
3. Method
3.1. Research Objectives
The objective of this study was to determine the amount of additional time needed by students with different capacities when using computers. We needed this information as a guide to be able to apply it in computer engineering and telecommunications degrees where the computer is a key tool in their daily tasks. The experiment was conducted in a continuing education course on digital technology in a project where people with different abilities were working in a virtual educational environment in contrast to the control group of students without visual and motor problems. Therefore, we formulated the following research questions:
RQ1. “How much additional time do students with vision and motor problems need to interact with hardware technology and typical e-learning resources, such as questionnaires and tests, compared to those without impairment?”
RQ2. “Are these times aligned with the ones reported in existing literature?”
We answered the research questions through the analysis of the measured times when the students filled out a questionnaire. As a result, we configured the objective with the subsequent specific conditions:
We used the Moodle learning platform that has good accessibility features and is widely used in the educational context around the world, ensuring its correct use by learners and providing a reliable measure of the total time taken to complete a task;
We conducted the experiment with a generic questionnaire, ensuring freedom from bias in answering questions, as previous knowledge or experience in a specific topic was not required nor did it depend on age, gender, or educational level. We used a questionnaire since they are common and efficient resources with pedagogical value for learning improvement [
14];
We worked with students with different types of capabilities: on one hand, we worked with groups of blind students in order to compare and validate the study with the above-mentioned research studies (it is the most advanced group in terms of accessibility and the one with the most related research in the literature); on the other hand, we extended the study, once validated, to groups of students with low vision and with reduced motor ability.
3.2. Participants in Experiment (Sample)
The sample of the experiment was based on 60 adult learners with different accessibility skills enrolled in four editions of online digital technology skills courses: the average age was 40 years old, 36 of them were women, and 17 were men. Although limited in size due to the feasibility of recruiting and involving enough students with disabilities in e-learning, the data analysis showed that the results from this sample were good enough to extract some initial conclusions. We recruited groups of students for the e-learning courses and we were able to attract groups of them who were blind, had low vision, and had reduced motor ability. We observed, in previous courses, that they experienced more difficulties than those without apparent limitations when interacting with the learning platform, requiring more time to complete activities. A small number of deaf students also attended the course, but we did not include them in this experiment since they did not experience more relevant problems when accessing the learning content in previous courses than the control group. There were two tutors in charge of the online courses. We categorized the students in the following four groups according to the type of different capability (their personal and professional data are synthesized in
Table 1):
Group 1 or control group: students without visual or motor problems;
Group 2: blind students;
Group 3: partially sighted students;
Group 4: reduced motor skill students.
The groups of students were homogeneous according to professional experience as well as in educational background as all of them had at least passed the secondary education level (European Qualification level EQF 4): the WCAG establishes this educational level as reference for content adaptation. Moreover, they also showed a similar level of technical interest in computer skills as demonstrated in the answers to the initial questionnaire of the courses. All blind students declared the use of the JAWS tool as a screen reader and the partially sighted students used a screen magnifier. All students with motor impairment suffered from limited capacity of arms and hands to use the mouse and/or keyboard.
3.3. Environment for the Experiment
Two different educational courses (with four editions in total) were the basis of the experiment. One focused on basic digital skills to train the students, following the ECDL (European Computer Driving License) certification syllabus. The topic for the second course was effective professional digital writing. We examined all the editions of the courses: three editions of the first one and one of the second. Both courses used the Spanish language and were tutored following a long-life learning style. There was a wide international representation of students as they came not only from Spain but also from several countries of Latin America (Colombia, Ecuador, Guatemala, etc.).
The courses used a Moodle learning management system with a platform with content designed to be accessible; the process described in
Section 3.4 confirmed its accessibility. The process took place in three phases: First, the environment was checked using the Wave plugin for interaction and for the learning platform. The learning content files were checked with PDF and office accessibility checkers. Secondly, a manual inspection was performed with a checklist to cover additional aspects not foreseen by the tools. Finally, a blind expert tested the system. The students worked with their usual computers and, for the purposes of the experiment, were only connected to a browser to access the platform. Before the beginning of the course, tutors specialized in accessibility confirmed with students with disability the environment of assistive technology they would use during the course. Tutors reviewed and validated its adequacy regarding the specific online training context.
Students answered a questionnaire on their personal profile at the beginning of the courses (see
Appendix A). The questions were typical multiple-choice ones: difficult to answer for people with visual problems as students must read and memorize every option before being able to answer correctly. This characteristic guaranteed that we were in unfavorable conditions in terms of time, so the measurement can be considered close to the upper limit of necessary time.
We also checked the satisfaction of students with the learning experience (see
Appendix B) using other final questionnaire at the end of the course (not used for the time measurement experiment). This questionnaire enabled us to compile their satisfaction to discard any possible impact on their time performance: an unsatisfactory course might cause a lack of interest in students when requested to complete tasks, thus possibly leading to longer times spent answering questions.
3.4. Procedure for Measurement and Data Collection
We considered the measurement of the additional time that students with different capabilities require to interact with computers to be particularly important for computer engineering and telecommunications students since computers are involved in most of their teaching activities, both at a theoretical level through the use of the virtual learning platform and at a practical level through the development of computer programs, computer networks, simulators, etc.
We investigated the usability of the Moodle learning platform in the literature, and we found a satisfactory usability referring to factors such as efficiency, memorability, ease of use, and satisfaction [
50]. Ivanovic et al. [
51] described the good characteristics of the Moodle platform as well its functionality as expressed by students and teachers while they also reported barriers such as a lack of time spent preparing resources and using the platform and the fact that few students used the resources offered by the platform. In our case, a blind computing engineer, a specialist in accessibility, usability, and online learning, conducted an expert review of the usability of our Moodle platform to confirm accessibility. The expert followed some of the methods described by [
52] such as heuristic evaluation, cognitive walkthroughs, and feature or standard inspection, corroborating the good results. Two tutors, also specialized in accessibility, guided the courses using debate fora, video conferencing, and e-mail as communication mechanisms.
The students completed a first questionnaire referring to their personal information prior to the effective start of the course. We measured the time that students took to answer this first questionnaire. We calculated the statistical results by comparing the times used by the three groups of students with different capabilities with that used by the control group (students without any limiting condition). Working with two different types of courses with several editions also contributed to greater soundness in conclusions.
Before starting the courses, students were informed of our research work and our goal of improving e-learning design for people with different capabilities. However, we did not disclose the relevance of the initial questionnaire for time measurement, avoiding a Hawthorne-like effect. All students participated in the study by taking the initial test before starting the course.
Time taken by students when answering the initial questionnaire was calculated by the Moodle platform using the time at which they began to answer the questionnaire and the time at which they completed it. Students did not have a time limit for the task. This may represent a risk as some students had breaks when answering the questionnaire. However, after reviewing duration data, we discarded clear outliers. Furthermore, data for blind students were aligned with times for blind people shown in ref. [
15], measured with a very precise manual time measurement method. This indicated confidence in the data and the reliability of the sample.
After conversing with those students, we assigned them an amount of extra time informally determined as the results of our research were not yet available to use as a guideline. The final satisfaction questionnaire at the end of the course showed positive results: we could not infer that students were demotivated or unsatisfied with the course, so we considered recorded times as representative of normal interaction of students during an online course.
The two main differences between our approach and the contributions of precedent methods in the literature are (a) the measurement of time through the system, avoiding manual methods that would add human errors, and (b) the use of a questionnaire on students’ personal profiles to avoid a possible bias due to the need for previous knowledge. Our approach also added a group of students with reduced motor capacity and this represents an additional contribution in comparison to previous works.
4. Data Analysis and Results
The collection of data resulted in a sample of 64 students who participated in the four online courses. As a first analysis to detect outliers, we realized that three values in the control group (group 1) (28 min, 14 s; 12 days, 9 h; 16 min, 10 s) and one value in group 2 (2 h, 35 min) were excessively larger than the median so they were removed from the dataset. These figures probably represent cases where the students did not answer the questionnaire in a single step and took breaks in between the activity. Therefore, the final dataset had a total of 60 students.
This section shows the results of the statistical analysis of the quantitative data.
Table 2 displays the main descriptive statistical elements for each group. One can observe differences between means and variability of the different groups. Group 2 presents the biggest mean (496.53 s) and SD (281.22 s) in contrast with group 1, where the mean (170.27 s) and SD (68.56 s) are the lowest.
The same applies to the maximum and minimum values. A comparative analysis of the mean between the control group or group 1 and groups 2, 3, and 4 shows the following relations: 2.92, 1.88, and 1.58, respectively, indicating the amount of supplementary time that students of groups 2, 3 and 4 needed to finish the questionnaire compared to students of the control group.
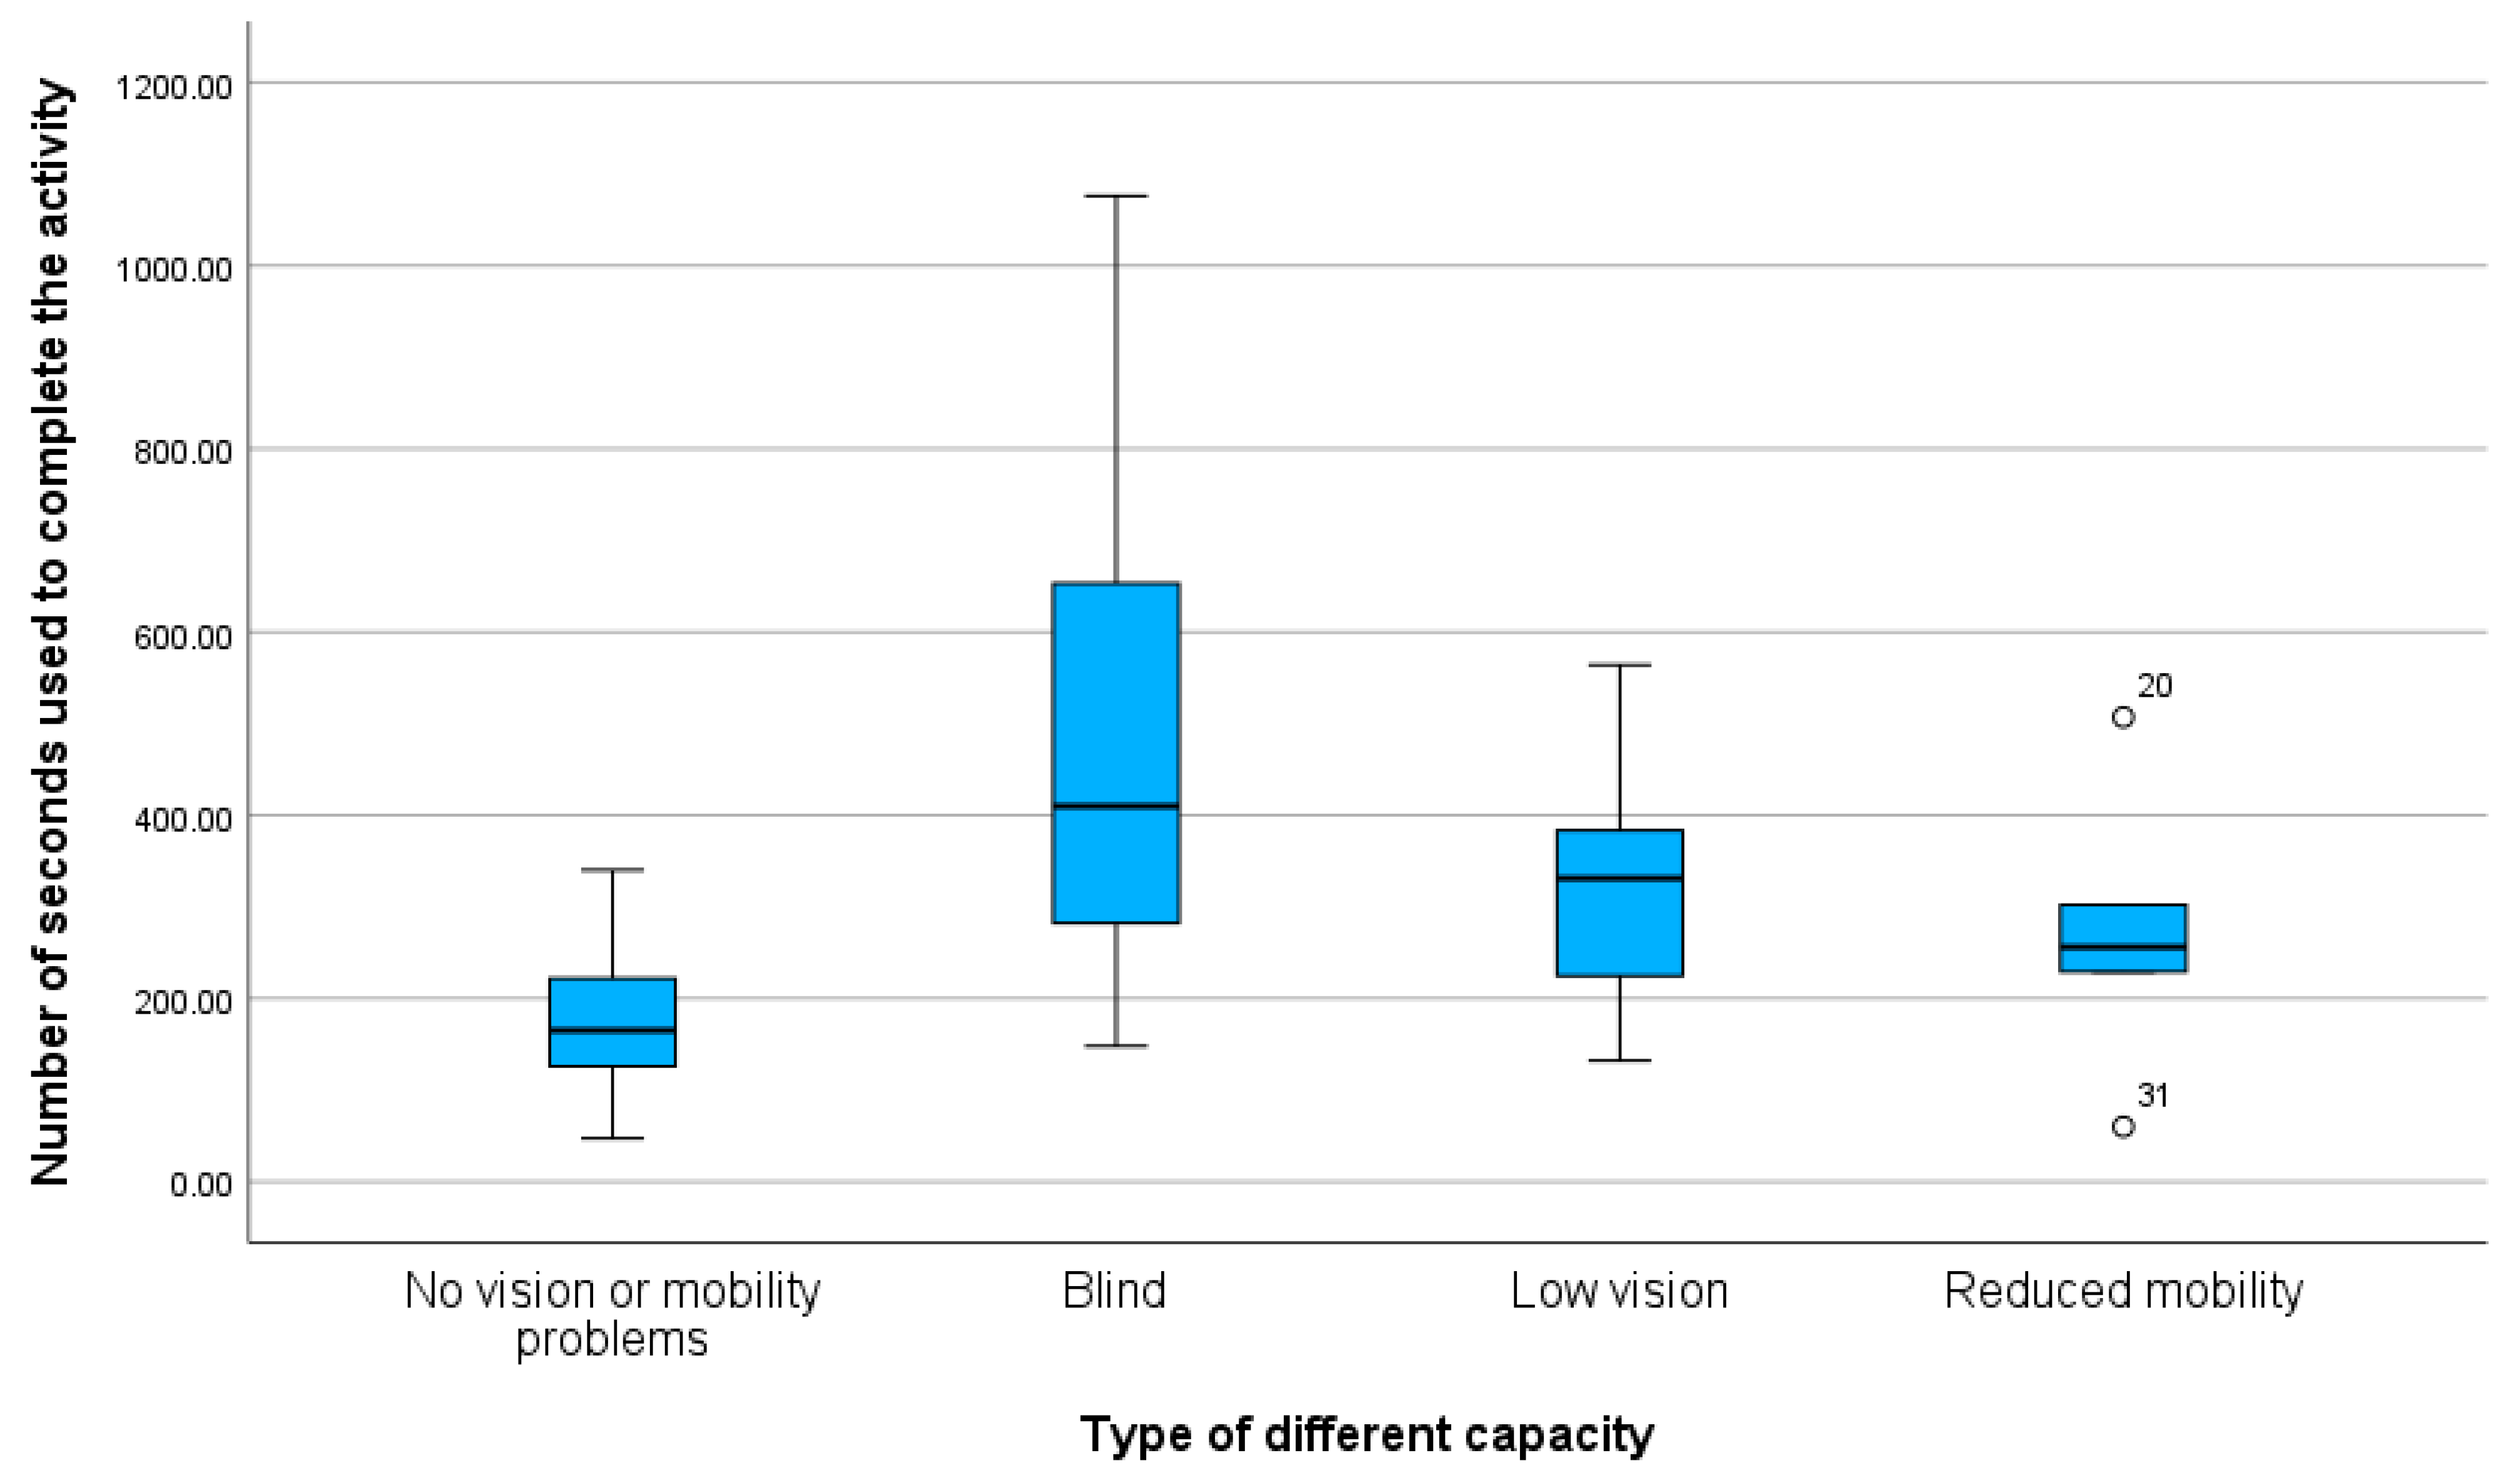
Figure 1 shows the variability and extreme values of the sample. Group 4 includes two outliers that possibly provide real information given the small sample for this group (6); these values are within the general range of the other observations. Therefore, we decided to keep them.
Logical statistical analysis in situations where a continuous variable exists together with samples classified in independent groups includes ANOVA tests that provide comparisons of dependent variables. However, ANOVA assumes a normally distributed sample and homogeneity of variance, meaning an approximated value of the variance among independent groups. A Shapiro–Wilk test,
Table 3, shows a significance larger than the benchmark 0.05 for each group. Therefore, the null hypothesis was accepted, indicating that the sample of all groups followed a normal distribution.
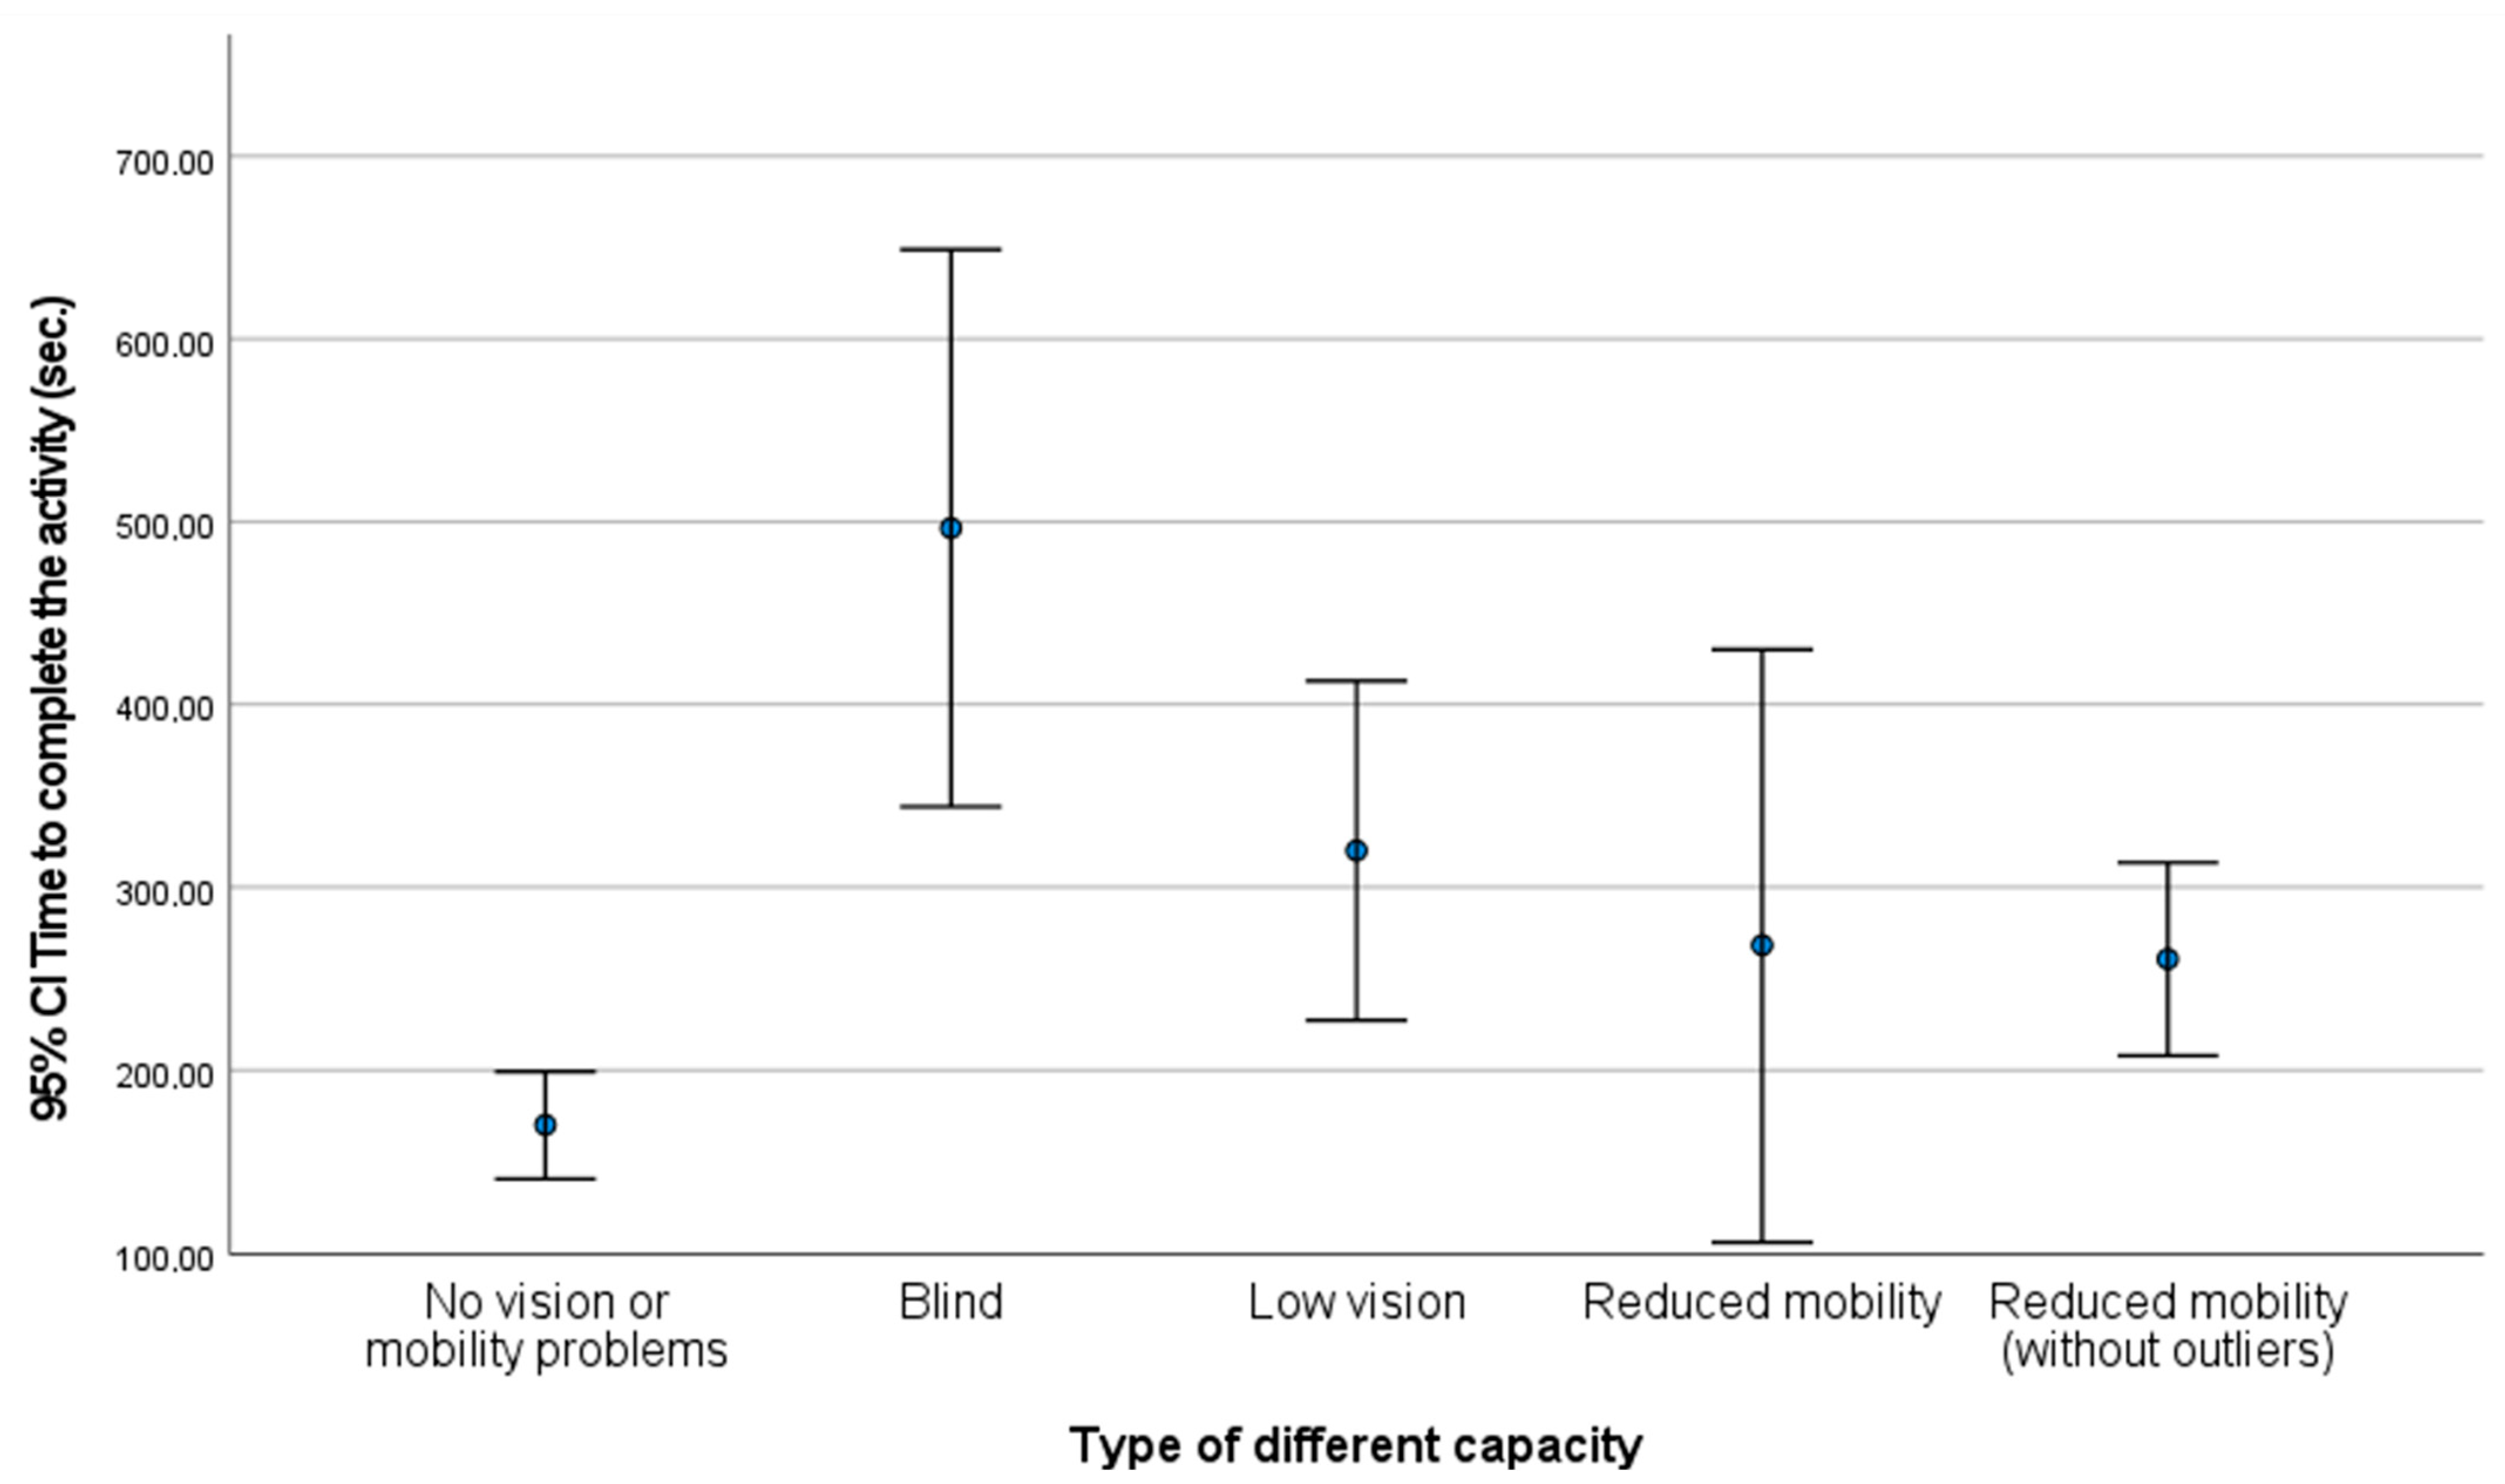
The picture of error bars (
Figure 2) demonstrates the great variability of groups 2, 3, and 4. A Levene test (
Table 4) confirmed this premise, revealing a significance of less than 0.05 in the four groups. All these reasons lead us to accept the alternative hypothesis establishing that there are variance differences in at least two groups, so it is consequently evidenced that it is not possible to implement the ANOVA test.
The existence of variability among the groups guided us in following the approach of applying non-parametric tests, so we used the Kruskal–Wallis system to confirm the existence of significant differences between the times of the groups. The null hypothesis establishes that the distribution of response times is the same for every group of individuals. A
p-value of 0.000 (<0.05) in the Kruskal–Wallis test (
Table 5) prompted us to reject the null hypothesis, affirming that there were significant differences in terms of distribution in the response time of the groups.
Inspection of
Figure 2 suggests differences between groups 1 and groups 2 and 3. The Wilcoxon–Mann–Whitney gives us the opportunity to conduct a more in-depth study by comparing groups to statistically confirm this conjecture (
Table 6).
The p-value (0.000) for groups 1 and 2 is less than both 0.05 and 0.01, if we consider the threshold of 5% and 1%, respectively. This indicates that there are remarkable differences between these groups. Also, important differences are reflected in groups 1 and 3 as their p-value is 0.001.
Groups 1 and 4 present a
p-value of 0.030, which is lower than 0.05 but larger than 0.01, showing differences if we consider the 5% level of significance and no differences if we consider the 1% level of significance. This indicates that differences are smaller among groups 1 and 4 than the differences between group 1 and groups 2 and 3. Values of 0.105, 0.080, and 0.481 as
p-values evidence the absence of differences at both 5% and 1% levels of significance between groups 2 and 3, 2 and 4, and 3 and 4, respectively.
Table 6 shows the summary of all comparative tests and shows differences between groups 1 and groups 2 and 3 (5% and 1% levels of significance) while differences between groups 1 and 4 exist at a 5% level of significance but not at a 1% level of significance.
Figure 2 shows the differences between group 1 and the other groups since the bar of group 1 is not overlapped with the bars of the other groups. Additionally, no differences are present between groups 2 and 3 and groups 3 and 4, as the bars are overlapped in the two cases. However, although bars for groups 2 and 4 do not overlap, showing differences in these groups, the Mann–Whitney test establishes that their difference is not statistically significant (
p-value = 0.080).
6. Conclusions and Future Work
Accessibility in virtual education is essential to ensure all people can benefit from it, no matter what their capabilities are. Although the technical work in contents, formats, and assistive technologies still needs to be improved in terms of practical real application, learning and evaluation processes also need additional consideration to ensure that students with different capabilities can properly complete learning tasks. As detected in several studies, learners with different capabilities require extra time. Results obtained can be applied to all students who interact with computers, but they have a more direct impact on computer engineering and telecommunications students who need to use the computer for most of their tasks, increasing the differences between students with different capacities and their peers without different capacities. Ideally, time must be adapted to the specific type of conditions of each user. The problem is that teachers do not have clear guidelines to adapt the given time to each type of student.
Our work was aimed at providing more information to solve this problem: we measured the time required by 60 students with different conditions (blind, visually impaired, and motor impaired, and students without any apparent limitation, acting as a control group) to complete a task in four different online courses using an accessible Moodle platform. The main difference between our approach and precedent methods in the literature is the measurement of time through the automated functionality of the platform, thus avoiding possible human errors when using manual methods. We have also used as reference task (the completion of a questionnaire on the user’s personal profile) to avoid possible bias due to the need for previous knowledge to answer questions. Our approach also adds a group of students with reduced motor capacity, representing an additional contribution in comparison to previous works. The sample of students was homogeneous in professional experience and educational background. Students expressed a homogeneous satisfaction and motivation with the courses, so there is no reason to suggest that measured times were impacted by demotivation or low interest of people in completing the task.
Comparing the times taken by the different groups of students to complete a questionnaire on their personal profile with the time spent by the control group, we found out that blind students required 192% more time, low-vision students required 88% more time, and reduced motor skill students required 58% more time. This suggests that low-vision students who required less than half the time of blind students are more agile, using the magnifier and screen scrolling, than blind students who need a screen reader. It is also probable that the students with reduced motor capacity who participated in the study had a relatively good degree of motor skill as the time required for the task was only slightly higher (50%) that that of the control group.
The results for blind students were like those previous in previous studies, that blind students require times up to three times longer to complete tasks. This suggests the consistency of our method for analyzing time with other more effort-intensive methods such as those previously used by Evans and Douglas [
15]. This consistency in the data for blind students supports the value of the results for other groups such as low-vision and reduced motor capability students. The extra time resulting from our study for students with low vision (1.88 times) is also aligned with the results of Packer [
48] and Gompel, Van Bon, and Schreuder [
40]. Therefore, we can now have guidelines for teachers for time allocation to blind and low-vision groups. This possibility enables a better planning of learning processes when working with students with different capabilities, not only in terms of allocated time in e-learning but also for the impact on the whole learning process. As a suggestion, the classical measures of requested effort for students like the ECTS (European Credit Transfer and Accumulation System) could be adapted for each group of students.
The comparative inspection of groups grouped in pairs using the Mann–Whitney statistical method revealed significant differences between control group (group 1) and the rest of the groups. Groups 2, 3, and 4 presented a high variability, probably due to the differences in interaction ability among students and the different levels of disability in groups 3 and 4. The sample of group 4 was small. It also presented a high variability that suggests, together with the absence of references in this field, that motor impairment is a less known disability in the educational area and requires additional studies to better determine the allocation of extra time.
Although our results already provide a solid determination of the average extra time required by different types of students such as blind, low-vision, and reduced motor skills students, the topic deserves a deeper exploration of the determination of the different degrees of capabilities in vision and motor impairment with a more detailed classification of impact during digital interaction. This would enable new experiments with larger samples of students from all groups of disability (especially from groups with motor impairment) to determine more precise guidelines for the allocation of extra time. Obviously, it is essential to avoid the influence of background effects in these experiments to isolate the measurement of time from the impact of non-homogeneous profiles of knowledge or skills.


 ,
, 


