Article

Sustainable Impact of Coarse Aggregate Crushing Waste (CACW) in Decreasing Carbon Footprint and Enhancing Geotechnical Properties of Silty Sand Soil

by
Gamil M. S. Abdullah
1,
Ahmed Abd El Aal
1,
Mabkhoot Al Saiari
2,3 and
Ahmed E. Radwan
4,*
1
Civil Engineering Department, College of Engineering, Najran University, Najran 61441, Saudi Arabia
2
Advanced Materials and Nano Technology Research Centre, Najran University, Najran 61441, Saudi Arabia
3
Empty Quarter Research Unit, Chemistry Department, Faculty of Science and Art at Sharurah, Najran University, Najran 61441, Saudi Arabia
4
Faculty of Geography and Geology, Institute of Geological Sciences, Jagiellonian University, Gronostajowa 3a, 30-387 Kraków, Poland
*
Author to whom correspondence should be addressed.
Appl. Sci. 2023, 13(19), 10930; https://doi.org/10.3390/app131910930
Submission received: 31 August 2023 / Revised: 28 September 2023 / Accepted: 29 September 2023 / Published: 2 October 2023
(This article belongs to the Special Issue Sustainability in Geotechnics)

Abstract

:
People are forced to use all types of soil, especially bad soils, as infrastructure demands grow. Different procedures must be used to ameliorate these poor soils, which are fragile during building. Natural resource depletion and the rising costs of available materials force us to consider alternative supplies. For several years, researchers have investigated the use of by-products from industry and associated approaches to improve the qualities of various soils. Coarse Aggregate Crushing Waste (CACW) is a waste product that results from the primary crushing of aggregates. Massive amounts of CACW are produced in the business, posing serious issues from handling to disposal. As a result, the widespread use of CACW for diverse purposes has been recommended in the civil engineering profession to address these concerns. Because some natural resources, such as gravel, are nonrenewable, it is vital to decrease their consumption and replace them with recycled, cost-effective, and ecologically acceptable alternatives. This research aimed to investigate the possibility of reusing CACW to improve the geotechnical properties of silty sand (SM) soil available in the Najran region. In this research, soil samples were collected from Najran city and subjected to a variety of lab experiments to determine their characterization. Mixes were designed for a parent soil with a range of percentages of CACW with/without 2% cement. The designed mixes were examined through a set of lab tests to obtain the optimum design for use in road construction. The findings of the tests showed that the optimum dosage is 10% CACW with 2% cement, raising the undrained shear strength of silty sand soil by 323%, CBR by 286%, and P-wave by 180%. The durability tests show that soil mixed with 10% CACW and 2% cement fulfills the requirements and stays within the 14% weight loss limit imposed by the Portland Cement Association (PCA). The microscopic investigation results confirmed the outcomes obtained by macro tests. As a result, the carbon footprint values decrease when CAWA is added, making this treatment approach almost carbon neutral. This study clarifies the long-term effects of CACW on improving the geotechnical characteristics of silty sand soil in the Najran Region of the Kingdom of Saudi Arabia and other comparable soils globally.

1. Introduction

There is a great deal of demand in Saudi Arabia’s construction industry to create the country’s essential infrastructure because of the country’s fast-expanding population and industrialization. The most recently constructed infrastructure is located in arid areas, mostly on brittle soils. These soils require chemical and/or mechanical stabilization techniques. Lime and Portland cement are often used for their chemical stability. For this function, various additional materials are also used, including Coarse Aggregate Crushing Waste (CACW). Due to the depletion of natural resources and the rising cost of accessible materials, it is critical to investigate alternative sources of supply because it is a critical issue in construction projects, particularly highways.
Because of the increased volume of waste materials in the environment in recent years, which has led to environmental contamination, the recycling of industrial waste materials in ground improvement applications has become increasingly important. Due to the growing amount of trash produced in nature, researchers have begun to utilize waste materials in a variety of sectors in order to limit the amount of industrial waste that is disposed of in nature [1,2,3,4,5]. Waste materials can be used in a variety of civil engineering applications [6,7]. Cement, which is widely utilized in practically all civil engineering projects, is made from natural resources such as chalk or limestone that have been heated to extremely high temperatures, utilizing enormous amounts of natural energy.
Industrial waste has been employed as aggregate or cement in concrete manufacturing in recent years [8]. Waste materials have also been employed in geotechnical engineering applications for soil improvement [1,2,3,4,5,6,7]. Researchers are currently faced with substantial difficulty in developing novel waste materials that may be employed as cement substitute materials in various civil engineering applications. Coarse aggregate crushing waste (CACW) dust appears to be one of the potential waste products for substituting cement in many engineering projects [9,10]. It is an environmentally benign and cost-effective material [11,12].
The by-product of the construction industry, with rising demand in the construction sector, is CACW. It is dumped in enormous quantities at crusher plants and quarry sites [13]. A non-plastic substance with good shear strength and no carbon emissions is CACW. Stone dust has a huge specific surface area due to its fine nature. Stone dust’s physical characteristics, chemical make-up, and mineralogy differ depending on the parent rock type but are consistent with the quarry on-site [14]. CACW is a commercial by-product that results from the first stage of crushing aggregates [15]. These are fine aggregates made from particles smaller than 4 mm in diameter [16].
The rock type, where it came from, and how it was processed all affect the stone dust’s quality. Every year, 1430 companies at various plants create 1.48 billion tons of stone dust globally. This huge quantity of stone dust and the large numbers of companies’ plants reflect the need for good handling of this waste in a good manner and as an environmental issue. The wealthy nations of the world are extremely interested in and have had success using recycled aggregates. For instance, the USA has many years of experience manufacturing concrete. Over 20 million tons of concrete refuse are currently treated annually [17]. A normal rock generates between 400 and 500,000 tons of aggregate annually on average [18]. About 20 to 25 percent of this is wasted material [19]. The annual production of quarry by-products in India is about 200 million tons [20]. From quarry locations, mined boulders and blasted rocks are hauled into a crusher bin and fed to crushers [18]. However, because there was not enough water for the pozzolanic reactions between the soil and lime, adding too much lime had a negative impact on the strength of the soil. According to [21], cement kiln dust by itself is insufficient for efficient soil stabilization.
Due to its significant location on the southern border of the Kingdom of Saudi Arabia, its large diversity of economic resources (Najran granite, industrial aggregates), and the current rapid expansion of civilization, the Najran area is a significant region in Saudi Arabia. The idea of conducting research to address difficulties that had arisen in the community as a result of the recent spreading of civilization in the area was significantly motivated by the establishment of Najran University in the city of Najran ten years ago. The foundation bed often consists of silt and clay. Many authors have conducted geotechnical studies for a variety of reasons, such as characterizing geohazards [22,23,24], identifying geotechnical parameters [25], and delineating subsurface rock types, weak zones, and/or clay layers. Significant amounts of industrial by-products (CACW) have also been produced as a result of industrialization.
They considered producing soil amendment material from some of the leftover coal. However, based on our observations, inter-sectoral cooperation has already helped the South African mining industry make rather efficient use of the recovered resources across the varied variety of ores that frequently contain many distinct metals [26] presented their attempts at using quarry wastes as fertilizer for growing tea crops. Moreover, [27,28] decomposed and eliminated organic and inorganic waste in soils through the vermicomposting process using earthworms. To adhere to environmental regulations, a lot of resources are used to dispose of the garbage. As a result, it is necessary to evaluate an alternative option for using waste products to improve silty sand soil. These options can meet the demands of both the economy and the environment. Although some research has been conducted to determine whether cement could be used to stabilize poor soils all over the world, more studies are required to determine whether these industrial by-products could be used to stabilize soil. In addition, there is a great need to reduce cement use through the efficient use of industrial waste products to lessen the greenhouse effect and environmental issues. The research above shows that silty sand soils are extremely variable materials with a reduced “natural” strength capacity, which causes a number of construction challenges when used [29] considered the processing of several minerals and materials found in soils and used by various companies in various parts of the world in 2022.
The primary purpose of this research is to investigate the potential of reusing CACW to enhance the geotechnical properties of silty sand soil in the Najran region.

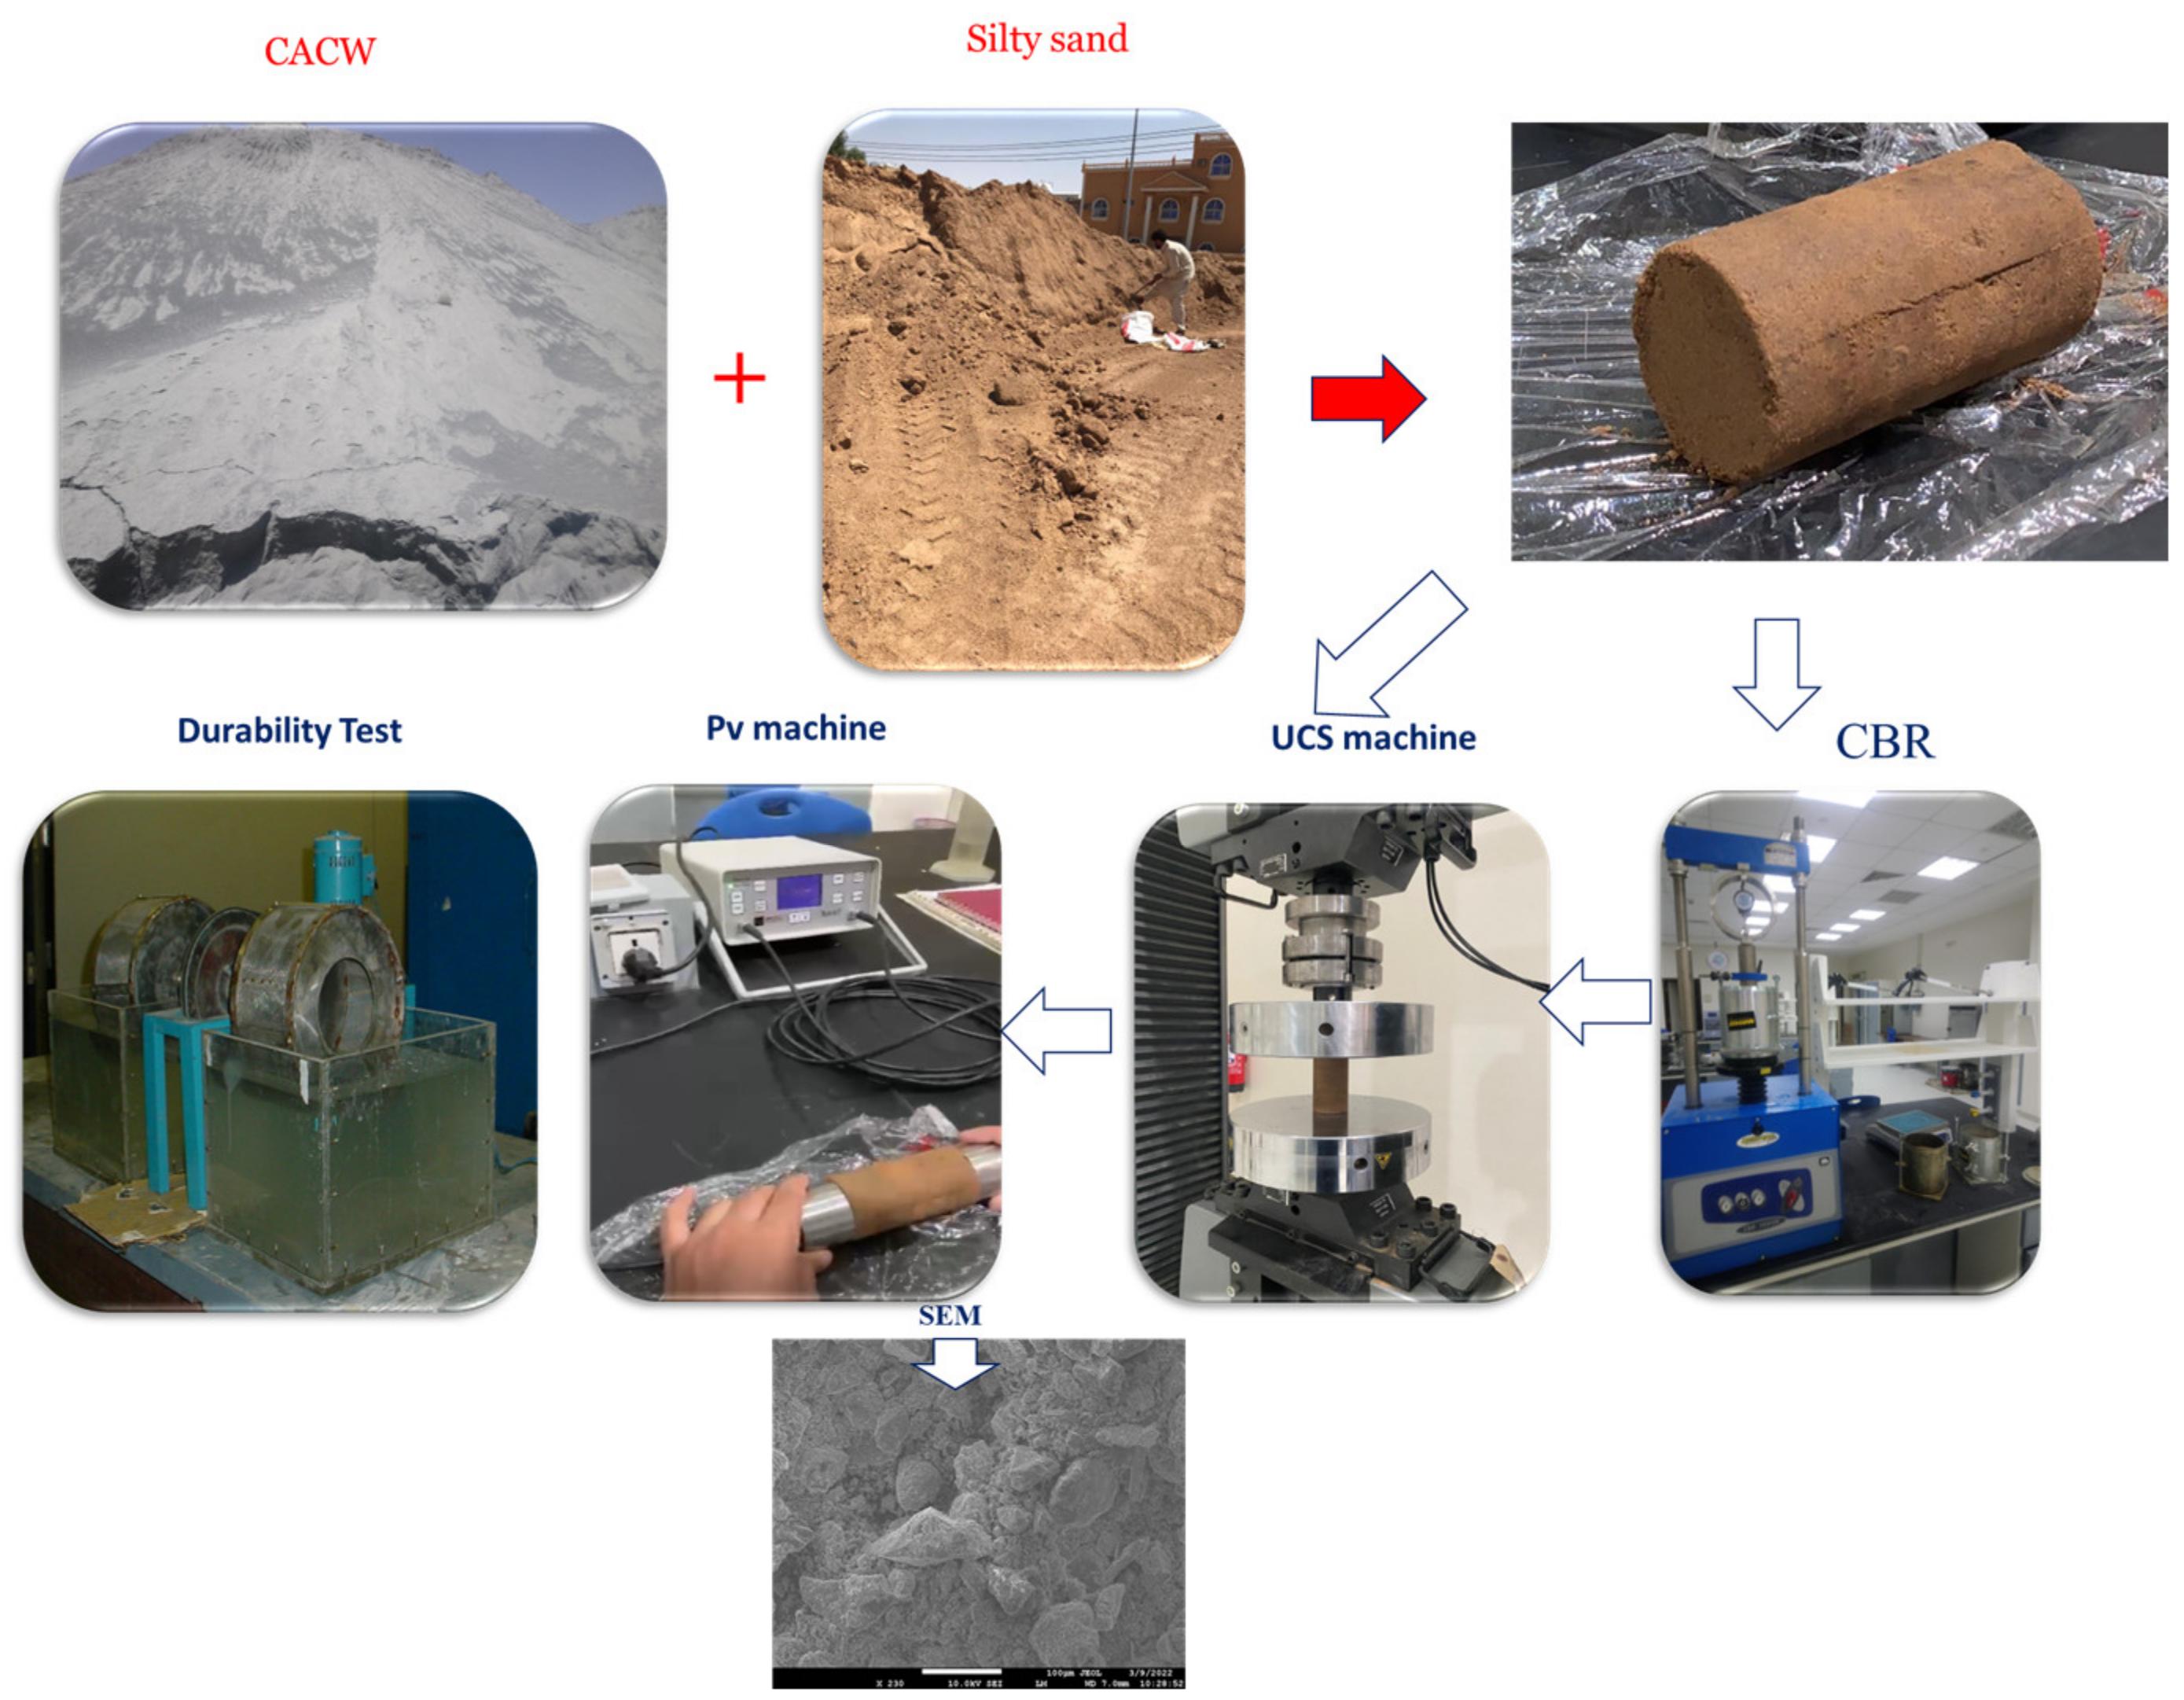
2. Research Methodology

The goal of this study is to determine how to improve the geotechnical properties of the silty sand soil that is readily available in the Najran area for use in road applications by reusing coarse aggregate crushing waste (CACW). The process used to accomplish this goal is divided into four stages: (i) material collection and characterization; (ii) laboratory experimentation; (iii) analysis of the laboratory test results and comparison of the results with native soils and (iv) research on the materials’ durability and environmental effects (Figure 1).

3. Experimental Work
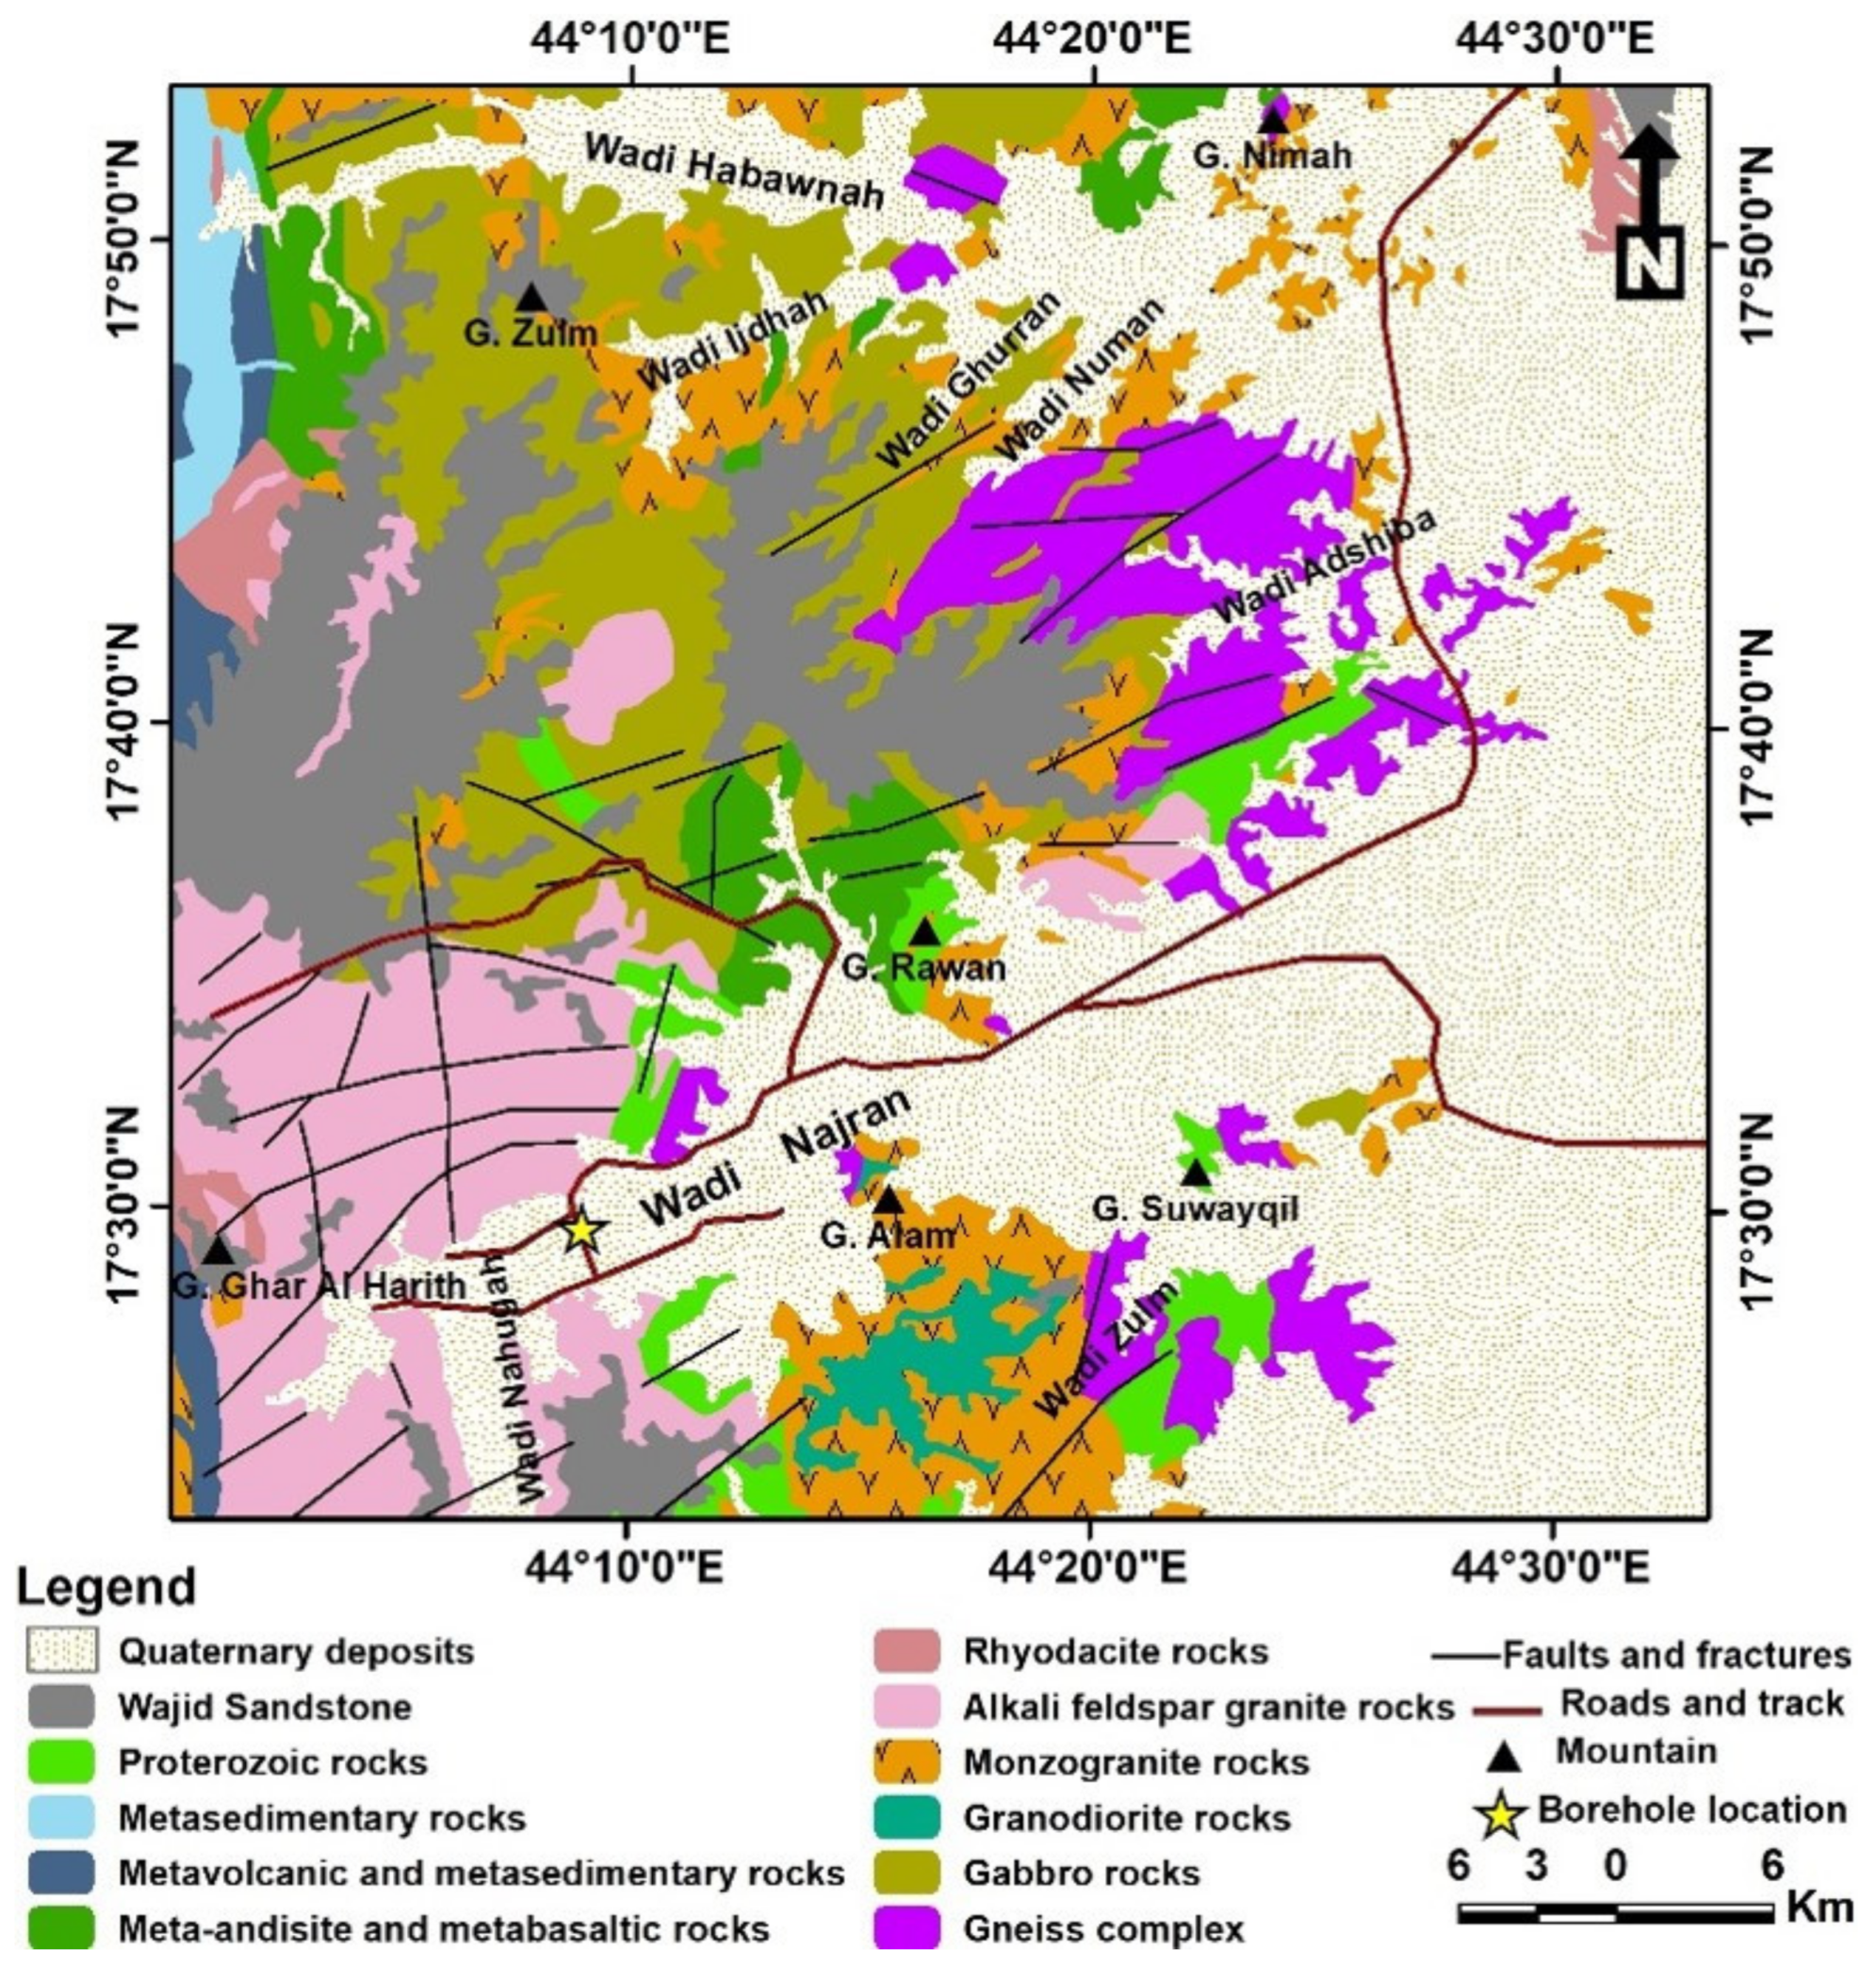
3.1. Materials

Samples of silty sand soil were collected from a location located in Najran City, Kingdom of Saudi Arabia. The methodology for collecting soil samples and conducting laboratory experiments for characterization consists of two stages. The first stage includes collecting two bags weighing 50 kg from a site on King AbdulAziz Street close to Jareer Library and then transporting them to the soil laboratory in the civil engineering department at Najran University. This quantity is considered sufficient to construct three lab samples for each designed mix. In the second stage, the soil was first air-dried for seven days in the open air before being properly blended for homogeneity. It was then pulverized with a plastic hammer and sieved with an ASTM sieve No. 4 after that. Finally, the crushed soil was oven-dried for 48 h at 70 °C to ensure moisture content elimination and then kept in a closed barrel until testing. The samples were then subjected to basic characterization such as grain size distribution, specific gravity, and Atterberg’s limits. The CACW stabilizer samples were collected from coarse aggregate crushing quarries located in Habuna governorate (about 63 km from Najran city) in the Najran region and subjected to grain size analysis and specific gravity determination as well. The CACW samples were taken from the same quarries as the aggregates. There is a huge amount of silty sand soil in Saudi Arabia and all over the world, so similar laboratory tests can be applied. Table 1 summarizes the Chemical composition of the stabilizer.

3.2. Soil Characterization

To examine the engineering characteristics and mineralogical phases of the soil specimens from the Najran area (Figure 2), primary characterization studies were carried out in accordance with ASTM standards. Specific gravity, Atterberg limits, and grain size distribution were used to classify the soil during the preliminary studies. The mineralogical composition of the soil was further assessed using XRD (X-ray diffraction) and SEM (scanning electron microscopy). According to [30], the specific gravity was calculated. A pair of “disturbed” specimens were used in the experiment and each specimen was put through ASTM sieve No. 4 before being used. The specific gravity was calculated using the average of both specimens. On specimens passing ASTM sieve No. 40, liquid and plastic limits were evaluated using [31]. All soil specimens were subjected to the [32] grain size distribution test.
According to [25], a material’s mineralogical distribution can be used to anticipate how it will behave and react in different situations. The mineralogical investigation employed only ten grams of the examined soil. The mineralogical compositions of the soil specimens were determined using SEM with Field- Electron (Tescan Lyra-3) and Powder X-ray Diffraction techniques (Ultima IV). The secondary electron mode was used for SEM. Before the experiments, the samples were covered with gold (Au) to boost their conductivity. In addition, the elemental compositions of the soil were measured using a dispersive energy X-ray (EDX) test and a scanning electron microscope (SEM) for all samples. Scanning electron microscopy (SEM) can be used to analyze the microstructural characteristics and the elemental composition of the carbonate samples, according to [28].
Soil specimens were ground into a powder using an agate mortar pestle for XRD examination. The specimens were then compressed into sample holders and inserted into the apparatus for examination. The powder method of X-ray diffraction is utilized, and the Powder XRD Ultima IV is the brand and model of the equipment used.
The sample’s crystals are organized in an arbitrary manner. A monochromatic (of a single wavelength) X-ray beam strikes a crystal. X-rays that hit the parallel surfaces that make up the crystal will reflect at an angle because of this, as shown by Miller indices (jkl). A series of reflections can be seen, depending on the type of minerals in the soil. The crystals in the sample are arranged in a random pattern. By comparing the intensity and angle of incidence with those of standard minerals, it is possible to determine the type and number of minerals present in the sample. The diffraction pattern is contrasted with normative diffraction patterns created by the Joint Committee of Powder Diffraction Standards (JCPDS) for various stages.

3.3. Tests and Methods

The procedure used to design soil-CACW mixes with or without containing 2% cement was as follows: A Hobort mixer with a capacity of 0.3 m3 was filled with the necessary amount of soil. The percentage of CACW (5%, 10%, 15%, and 20%) by the dry weight of the soil sample was added to the mixer. In the case of adding cement, 2% of Portland cement was added to the dry weight of the soil sample. Finally, the percent of water content determined by the dry weight of the soil samples was added, and the mixer was operated continuously to obtain a homogeneous mix after about three minutes of mixing.
To evaluate the designed mixes of silty sand soil with various percentages of CACW additive for road construction, specified mechanical tests should be followed. First, the mixes were subjected to a modified Proctor compaction test in order to obtain the optimum percentage of CACW and attain the maximum dry density. Thereafter, the mixes were further examined using ultrasonic pulse velocity (UPV), unconfined compressive strength (UCS), and the California bearing ratio (CBR) test. Following the trend of the results of these tests, we can conclude that the best percentage of CACW enhances the geotechnical engineering properties of silty sand soil. Based on the results of previous tests, the passed mix will continue to be subjected to the durability test. The advantages of these tests are that they can give a clear picture of the long-term engineering performance of the mixes of CACW-silty sand soil in the pavement structure as a material in the subbase or subgrade layers. The following sections briefly describe the procedure of each test.

3.3.1. Modified Proctor Compaction Test

The aim of the compaction test is to identify compaction-related parameters, particularly the optimal moisture content at which the soil reaches its maximum dry density. For a certain compaction technique, this test illustrates a link between dry density and water content. Several compaction testing methodologies are employed, depending on the grain size distribution of the soil material. As seen in the example below, the study employed the modified Proctor compaction test [34]. The procedure used to compact soil-CACW mixes containing 2% cement was as follows: A Hobort mixer with a capacity of 0.3 m3 was filled with the necessary amount of soil. The finished result was homogeneous after about three minutes of mixing, during which water was added. The modified Proctor compaction test’s large mold was compacted at five levels. There were 25 blows per layer. Triple specimens were used and tested under each condition, and the average of the results was reported.

3.3.2. Ultrasonic Pulse Velocity (UPV)

In line with [35], measurements of ultrasonic pulse velocity (UPV) were made to assess the homogeneity and structural integrity of diverse compacted soils. The longitudinal wave velocities were calculated using the pulse transmission method, which entails connecting two piezoelectric sensors positioned on opposite faces of a sample with a diameter of 6 cm and a length of 12 cm. The velocity of the ultrasonic waves was determined using a standard meter (Matest Company located in Italy). A viscoelastic gel was added to the sample’s flat surface. The samples were positioned between the transmitter and receiver, and until a constant velocity was measured, the faces of the transducers were firmly pressed against the compacted dirt samples. The UPV is measured using the pulse transmission method using a Panametrics Pulser-Receiver (Model 5058 PR) and an Agilent DSO-X-2014A Digital Storage Oscilloscope (100 MHz) manufacturered by Matest Company, Treviolo, Bergamo, Italy. Triple specimens were used and tested under each condition, and the average of the results was reported.

3.3.3. Unconfined Compressive Strength (UCS)

The UCS test is performed to find the undrained shear strength and stress-strain features of undisturbed, remolded, and/or compacted specimens. This test is appropriate for soils with some cohesiveness, as long as the sample is not allowed to expel water while being loaded. After eliminating the restriction provided by the mold walls for compacted samples, the soil sample must preserve its intrinsic strength. The preferred test for determining the strength of soils is the unconfined compressive strength (UCS) test. This test is normally performed using an unconfined compression machine with a variable maximum load. The UCS test is conducted in accordance with [36]. The UCS test is usually carried out for a period of 1, 3, 7, 14, 28, 90, and so on to track the influence of alterations in the mineralogical composition of stabilized products as time and environmental exposure increase. In this research, no treatment stabilizers are used, so we performed our test after 7 days for all types of soil samples. As recommended by [36], samples utilized in this study with a height-to-diameter (h/d) ratio of 2 were taken from a cylindrical mold with a height of 4 in. (101.6 mm) and a diameter of 2 in. (50.8 mm). The split-type mold was utilized to ensure that the samples extruded were as perfect as possible, as were the edges of the specimens. Triple specimens were used and tested under each condition, and the average of the results was reported.

3.3.4. California Bearing Ratio (CBR) Test

In the structural design and assessment of pavements, the California Bearing Ratio (CBR) of the materials used in the base and sub-base courses has been widely used. Because of its simplicity and usefulness, the exam is well-known around the world. As a result, the test can be easily adapted by engineers to assess materials for use in road construction and to experimentally determine the soil strength under regulated water content and density circumstances. In this test, the force necessary for a standard-area plunger to pierce a soil sample is determined. The pressure that must be applied to pierce a standard layer of crushed rock at the same depth is divided by the measured pressure. The ASTM Standard [37] outline the CBR test for laboratory-prepared specimens. Soaked CBR tests were carried out in this study in accordance with [37] to imitate field situations in which the soil is flooded with water, which can come from either groundwater or rainwater permeating the layers. All of the soil specimens were subjected to soaking CBR tests, similar to UCS testing, to determine their CBR correlation with the P-wave results. Triple specimens were used and tested under each condition, and the average of the results was reported.

4. Results and Discussion

4.1. Characterization of Soil and Stabilizer

CACW’s external characteristics vary depending on the topography. CACW exhibits mineralogy and morphological changes when analyzed using scanning electron microscopy (SEM) and X-ray diffraction. Magma is the source of the intrusive igneous rock known as granite. Its main colors are white, pink, or gray. Minerals, including feldspar, quartz, mica, and amphibole, are the major components of these rocks. Depending on the region, the CACW produced by aggregate crushing plants and granite quarries has a different physical appearance. Plants for crushing aggregate produce CACW. The majority of fines are classified as fine aggregate with a particle size less than 4 mm in diameter and pass through the No. 200 screen. The chemical makeup of CACW is a significant material property that is essential to stability. Location, rock formation, and type of rock accessible all affect how it varies.

4.1.1. Composition of CACW

The composition of a CACW is shown in Table 1, which gives an approximation of the amounts of different chemical components [38].

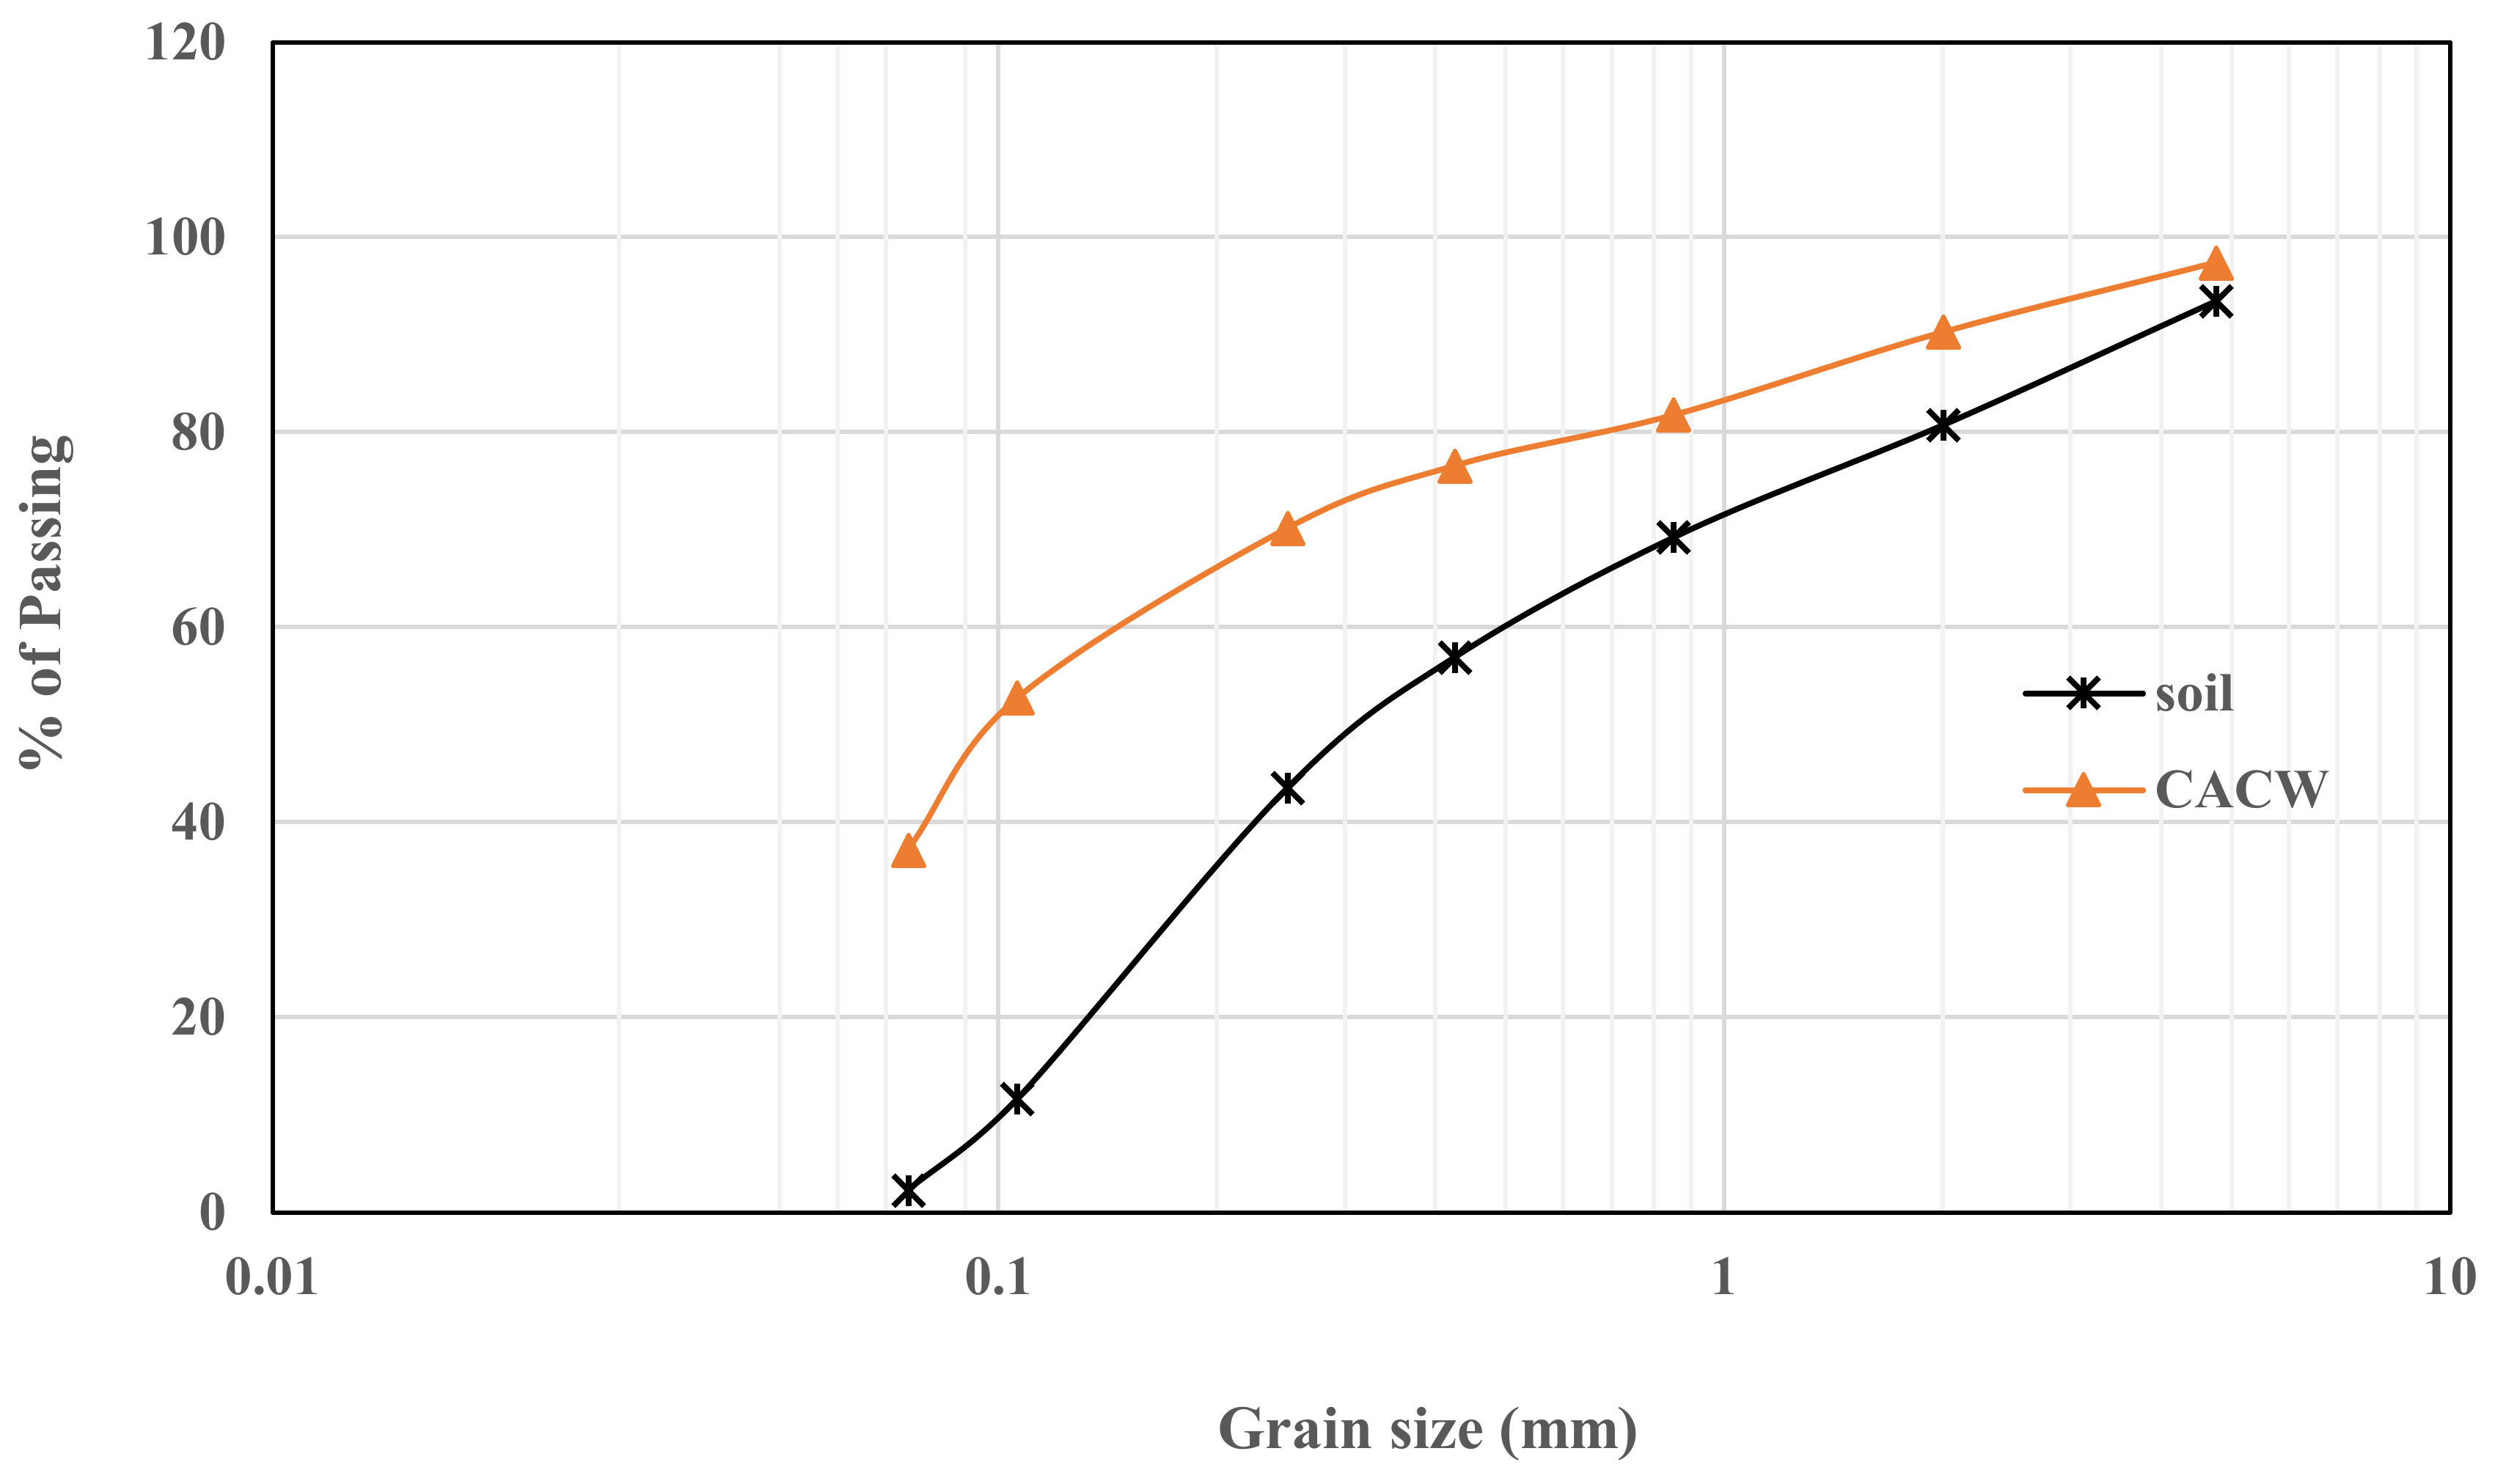
4.1.2. Grain Size Distribution of Soil and CACW

Through a series of geotechnical tests, including specific gravity, Atterberg limits, and sieve analysis, the fundamental geotechnical characterization of the soil employed in this study was determined. According to the results of the specific gravity test, the soil has a value of 2.67. Contrarily, the findings of the Atterberg test indicate that the soil is non-plastic, which prevents us from rolling it to a thread with a diameter of 3.18 mm and from calculating the number of blows required to reach the liquid limit. The findings of the sieve analysis are shown in Figure 3. According to the figure, 2.3% of the soils pass through sieve No. 200, and these soils are categorized as silty sand “SM” according to USCS and A-3 as well as the AASHTO soil classification system.

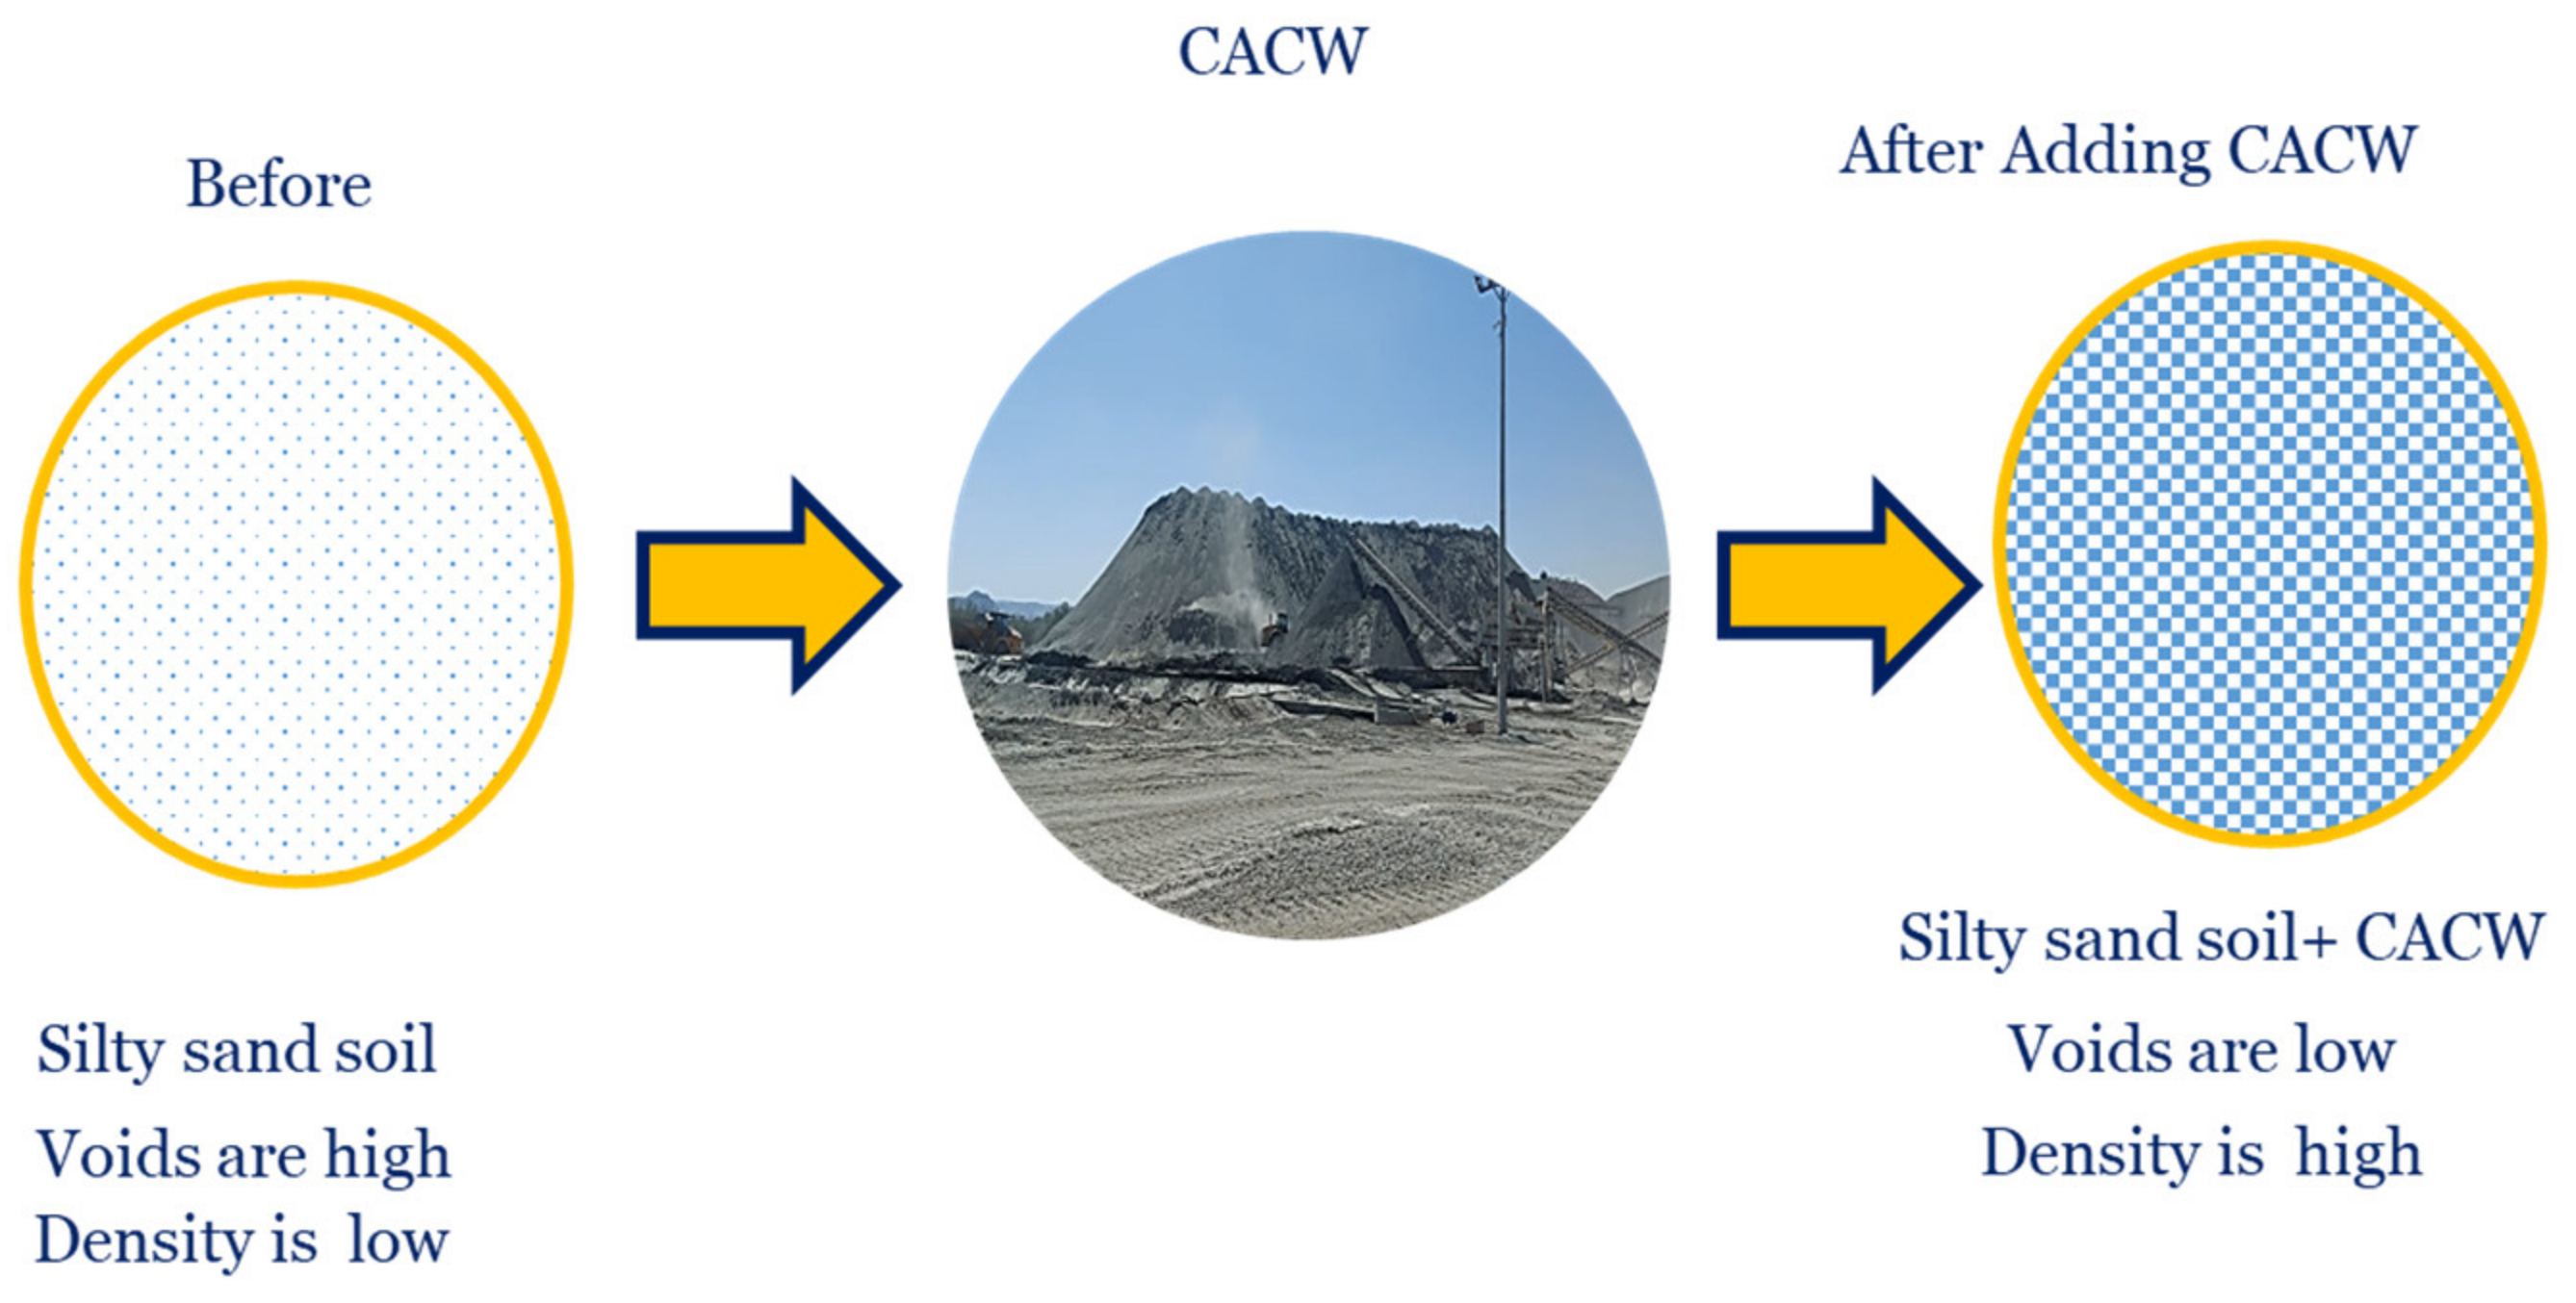
4.1.3. CAWA as a Sustainable Material

CACW is taken from the foreshore using a process called “waste mining”. Globally, mining produces between 47 and 59 billion tons of material. The use of CACW in a building leads to unacceptably large-scale waste mining, which is a result of the expansion of development activities. The sources of distinctive sand that are still present are running dry. High-quality sand may be transported over long distances, which has an impact on the economy. Therefore, a partial or complete material replacement is necessary to maintain the structural quality. The industry has financial and environmental costs as a result of the massive volume of CACW that is dumped. The excessive mining of river sand, which has negative environmental implications, can be avoided by using CACW [39]. Some geotechnical applications for CACW include embankments, backfills, materials for paving roads, fillers for underground cavities, materials for barrier walls, and sub-base.

4.2. Effect of CAWA on the Geotechnical Properties

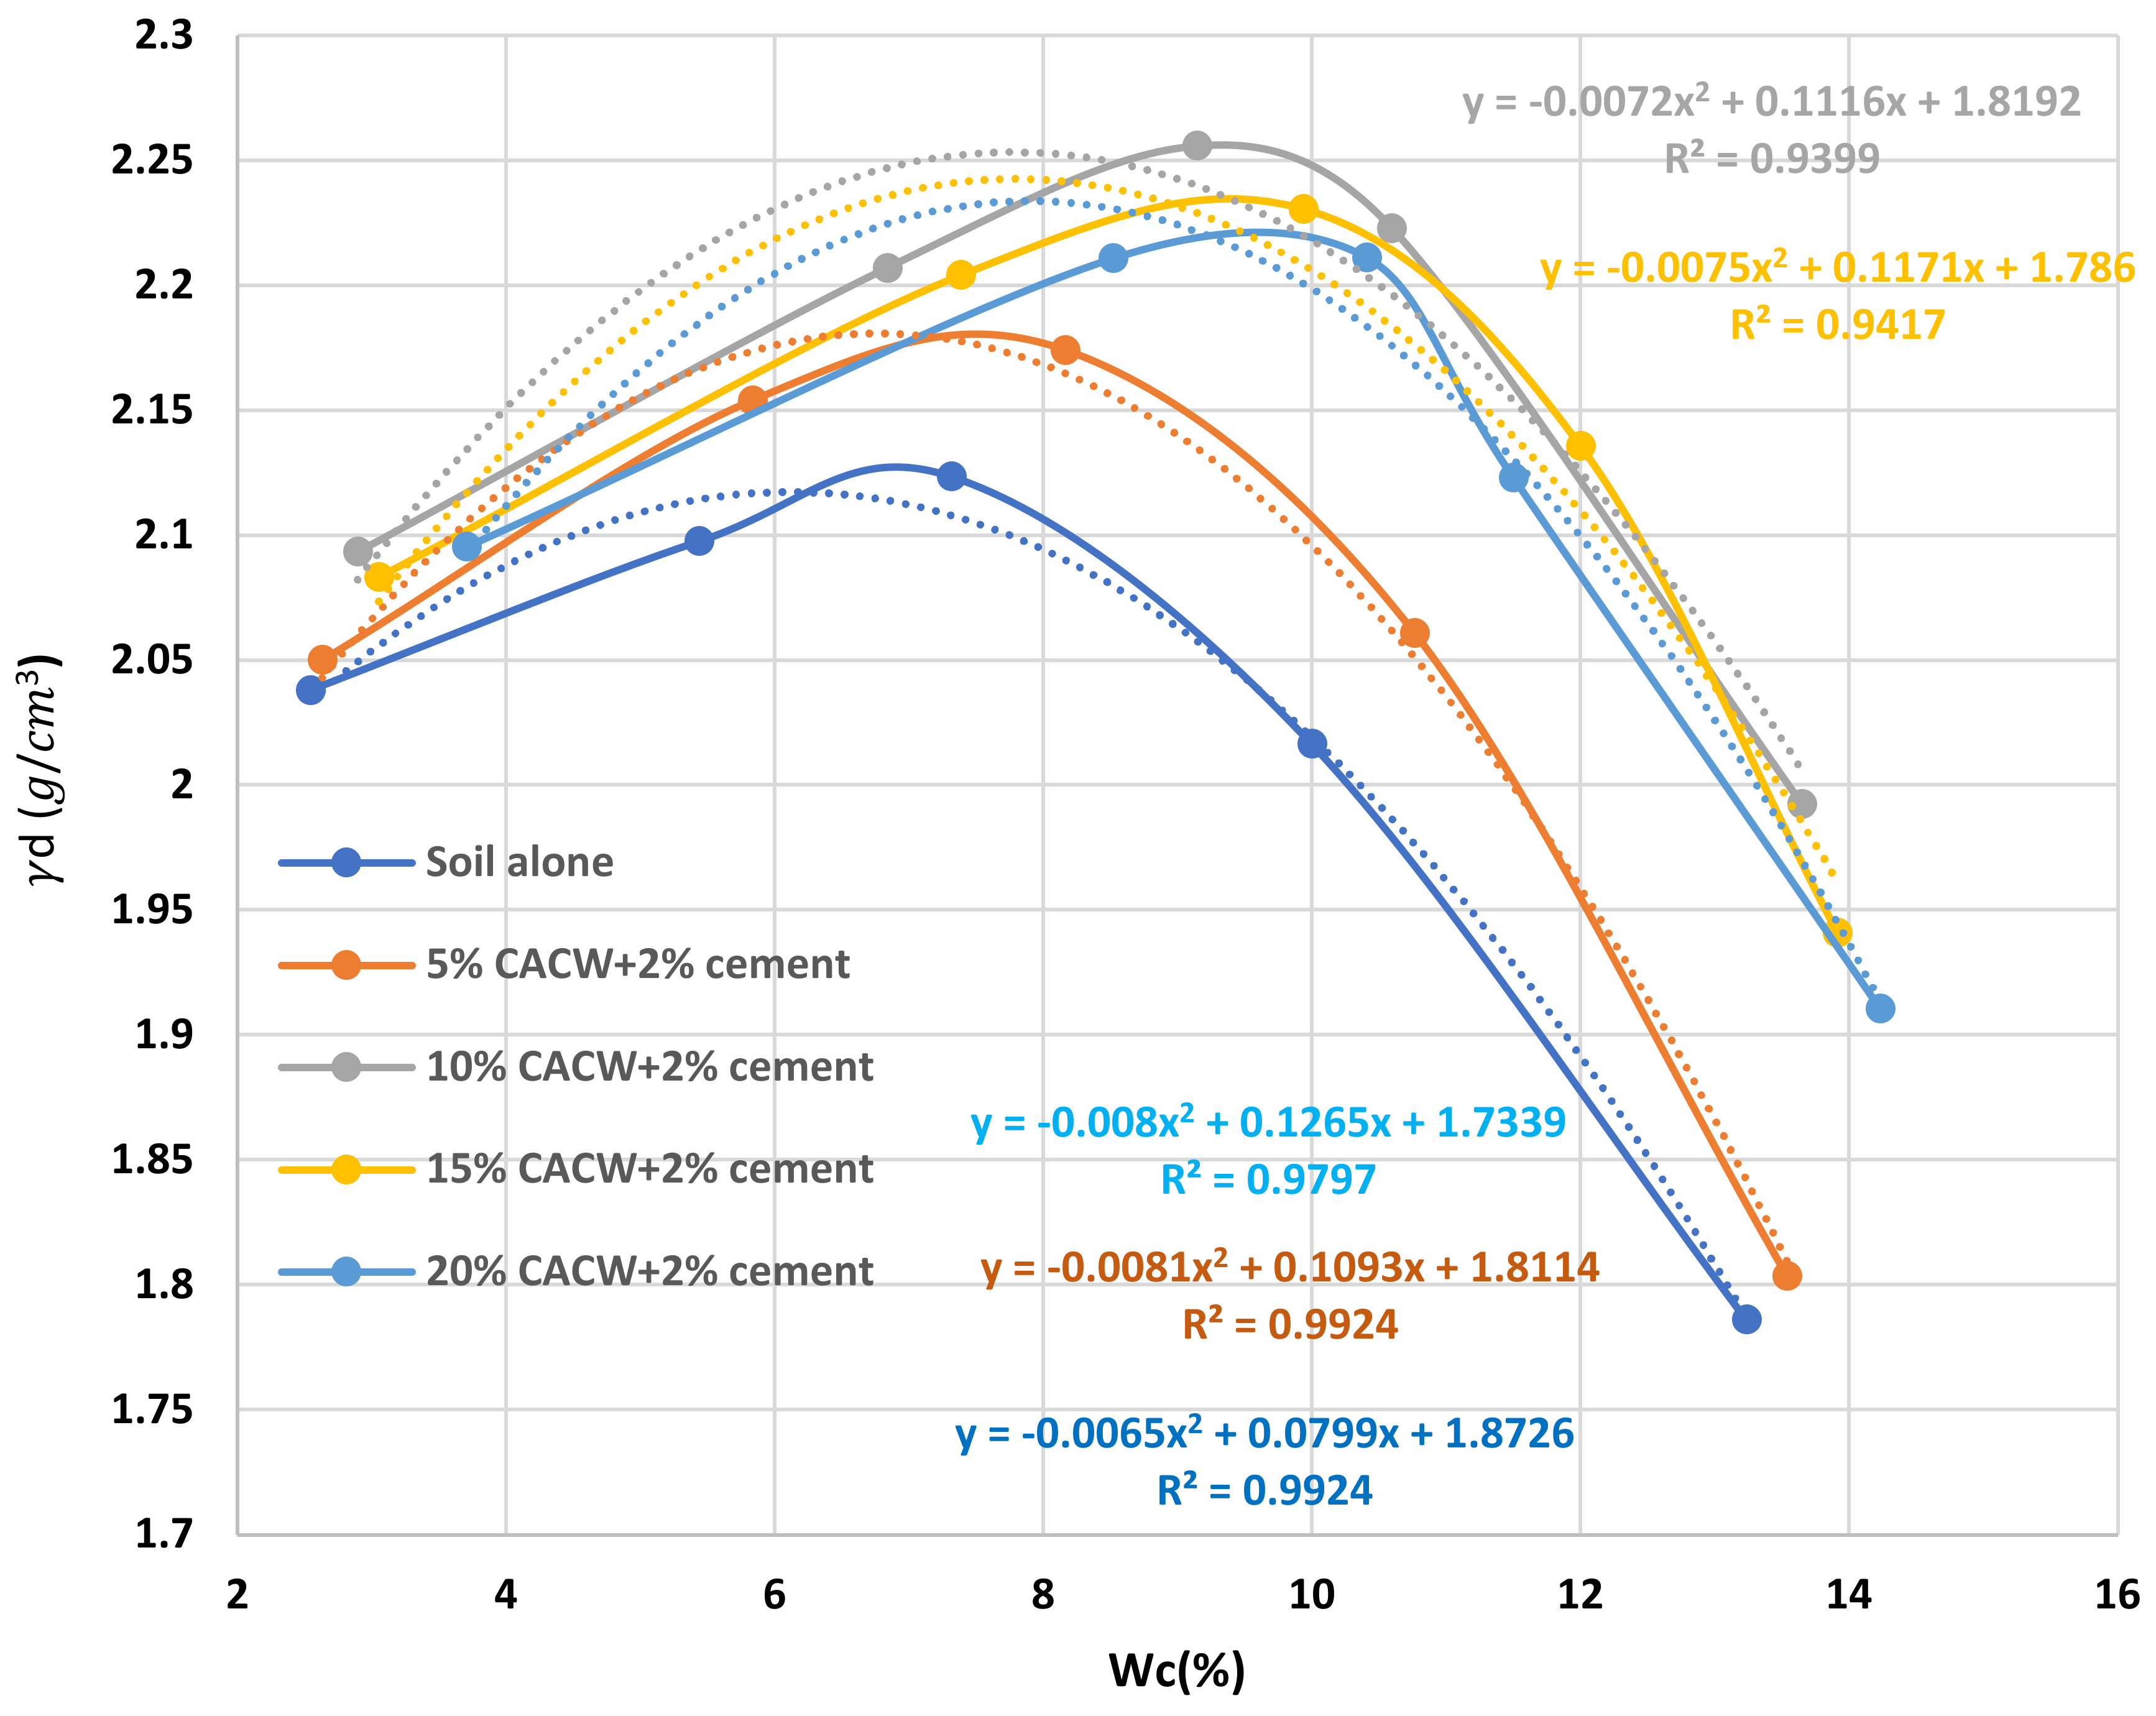
4.2.1. Modified Proctor Compaction Test Results

The maximum dry density (MDD) values of the CACW-soil mixes with the addition of 2% cement were in the range of 2.123–2.256 g/cm3, as shown in Figure 4. Considering the effect of CACW on the maximum dry density, it was observed that the effect of CACW on the maximum dry density was significant. The maximum dry density increased from 2.123 for plain soil to 2.174 and 2.256 g/cm3 for the 5 and 10% addition of CACW, respectively. Thereafter, the maximum dry density decreased to 2.231 and 2.211 g/cm3 with the further addition of 15% and 20% of CACW, respectively. This means that the addition of 10% of CACW filled the soil voids and enabled the production of extra-dense samples with robust strength characteristics, while at 10 and 20% of CACW, a decrease in the maximum dry density of the mix was detected (Figure 4).
The high concentration of CACW, which was more than that required to fill the pore space in the soil-CACW mixture, may be responsible for the reduction obtained with 15 and 20% CACW. The density of samples did not improve as the WMD proportion rose above 10%. Instead, a decrease in the sample density was found.
The influence of CACW content with 2% cement addition on the optimal moisture content (OMC) and the maximum dry density (MDD) is shown in Figure 5. The data in the figure clearly show that the increase in CACW percent was predominantly associated with an increase in the OMC. Due to the large surface area of CACW particles (i.e., high fineness) compared to soil; this behavior is expected, as it raises the water demand and, as a result, increases the optimal moisture content [40] (Figure 5).
According to the dependencies shown in Figure 4 and Figure 5, mathematical models for calculating and predicting the output parameters under consideration, which can be obtained in the course of regression analysis, are given as follows:
Y denotes the maximum dry density and x denotes water content in Figure 4;
For soil alone y = −0.0065x2 + 0.0799x + 1.8726 R² = 0.9924
For soil + 5% CACW + 2% cement y = −0.0081x2 + 0.1093x + 1.8114 R² = 0.9924
For soil + 10% CACW + 2% cement y = −0.0072x2 + 0.1116x + 1.8192 R² = 0.9399
For soil + 15% CACW + 2% cement y = −0.0075x2 + 0.1171x + 1.786 R² = 0.9417
For soil + 20% CACW + 2% cement y = −0.008x2 + 0.1265x + 1.7339 R² = 0.9797
Similarly, y represents the maximum dry density, and x represents the CACW percentage in Figure 5:
y = −0.0007x2 + 0.0188x + 2.1173 R² = 0.91
where y represents the optimum water content of the mix and x represents the CACW percentage in Figure 5 as well:
y = 0.1594x + 7.3986 R² = 0.9865

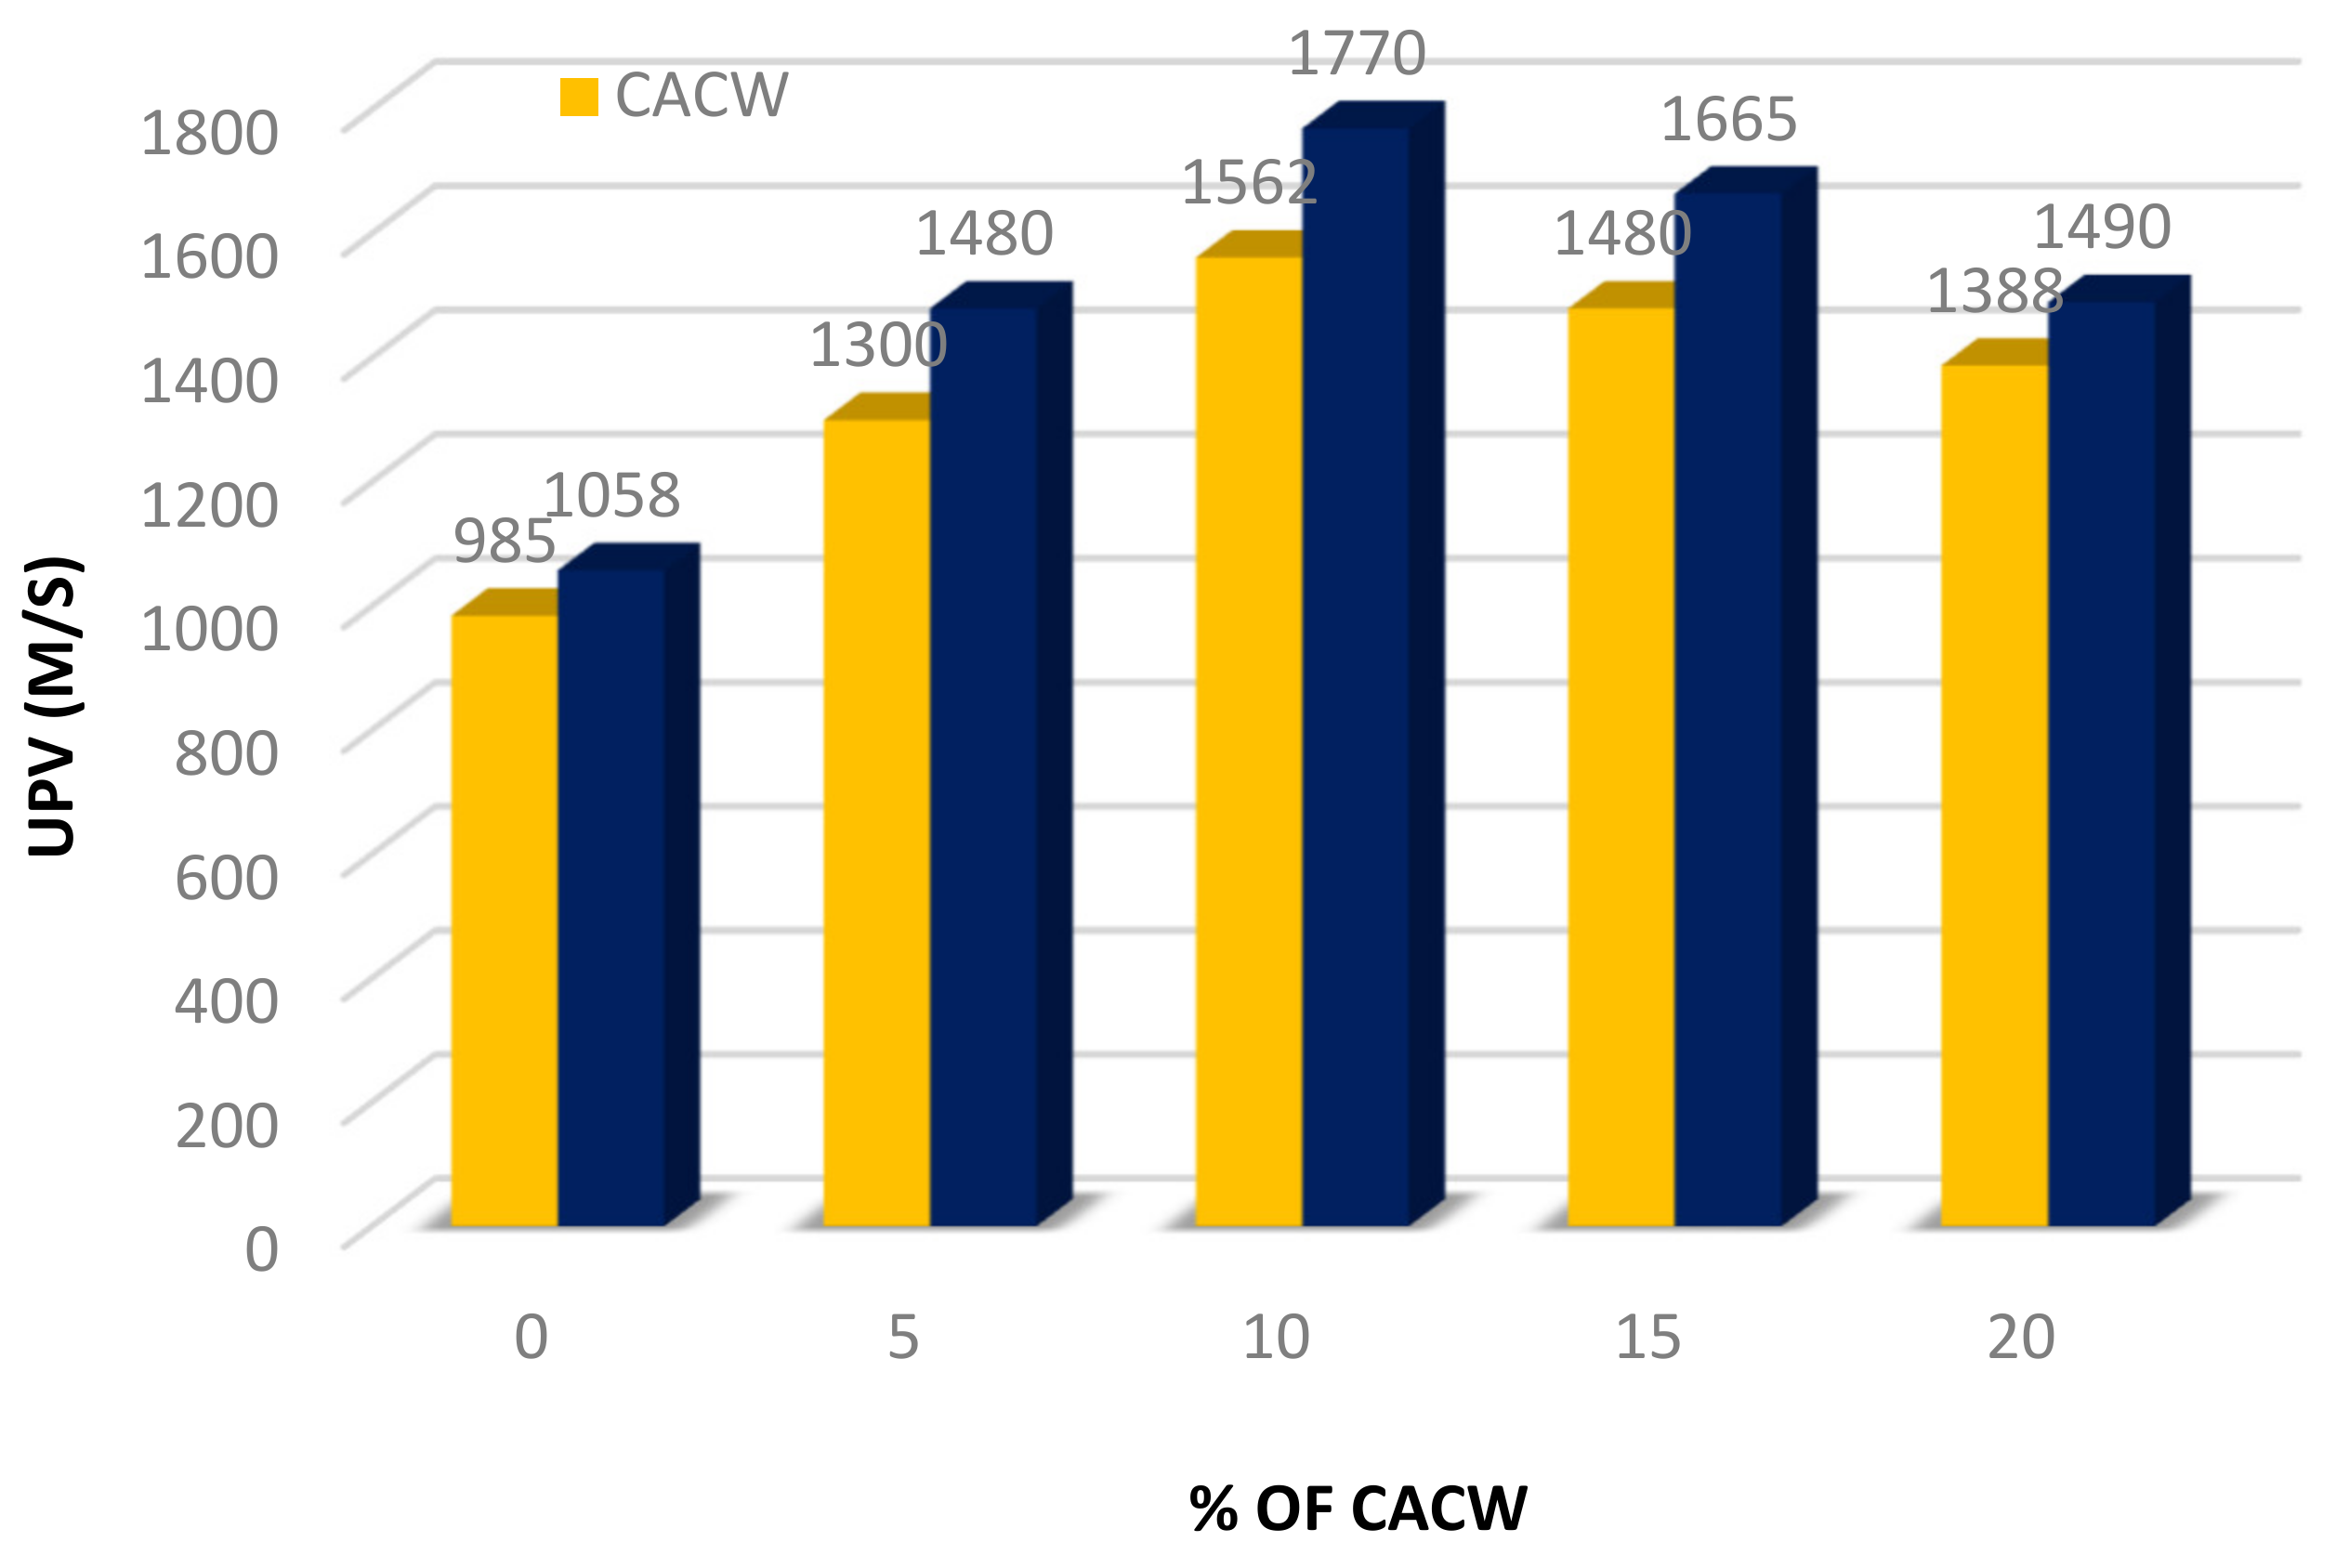
4.2.2. Ultrasonic Pulse Velocity (UPV)

After 7 days of curing, UPV tests were conducted on four separate samples (i.e., 0, 5, 10, 15, and 20% of CACW). The CACW had a substantial influence on the improvement in ultrasonic pulse velocities, as seen in Figure 6. It can be shown that samples with 10% CACW had greater UPV values than those with other CACW fractions; however, specimens with 15% and 20% CACW had a slight decrease in UPV values. The sample with 10% CACW in the soil mixture performed better than the other mixes in terms of UPV. This finding is consistent with the research’s earlier findings. The maximum UPV values were found at 10% of CACW due to the highest maximum dry density at the same percentage as indicated in the previous section. The improvement in UPV values is seen as a respectable indication of good densification in the soil-CACW mixture, particularly with 10% CACW and the soil-5% CACW-2% cement mixture as well. Greater UPV values are another excellent sign that the specimen’s structure has been homogenized, as this enables the applied waves to pass through the specimens more quickly and leads to greater UPV values. CACW, a finely graded granular material, has demonstrated its capability to operate as a good filler material by producing well-homogeneous mixtures and increasing particle bonding. Figure 6 shows that specimens with CACW greater than 10% had lower UPV values than those with 10% WMD. This demonstrated that 10% CACW is the ideal proportion for filling the pore space in the specimen and maintaining the continuity of the grain-to-grain connections.
As stated before, with a 10% CACW replacement, the specimens’ maximum dry density was increased, and the ultrasonic pulse velocity of the mixtures was increased. This was owing to the mixtures’ more homogeneous and uniform structures, which hastened the passage of ultrasonic waves in the mixtures, resulting in higher UPV values. The extra amount of CACW in the combination caused a more porous structure, which resulted in a reduction in the UPV of the specimens with a further increase in CACW replacement (Figure 6). The same trend is observed with a higher value of ultrasonic pulse velocity, as seen in Figure 6 when 2% cement is added to the mix.

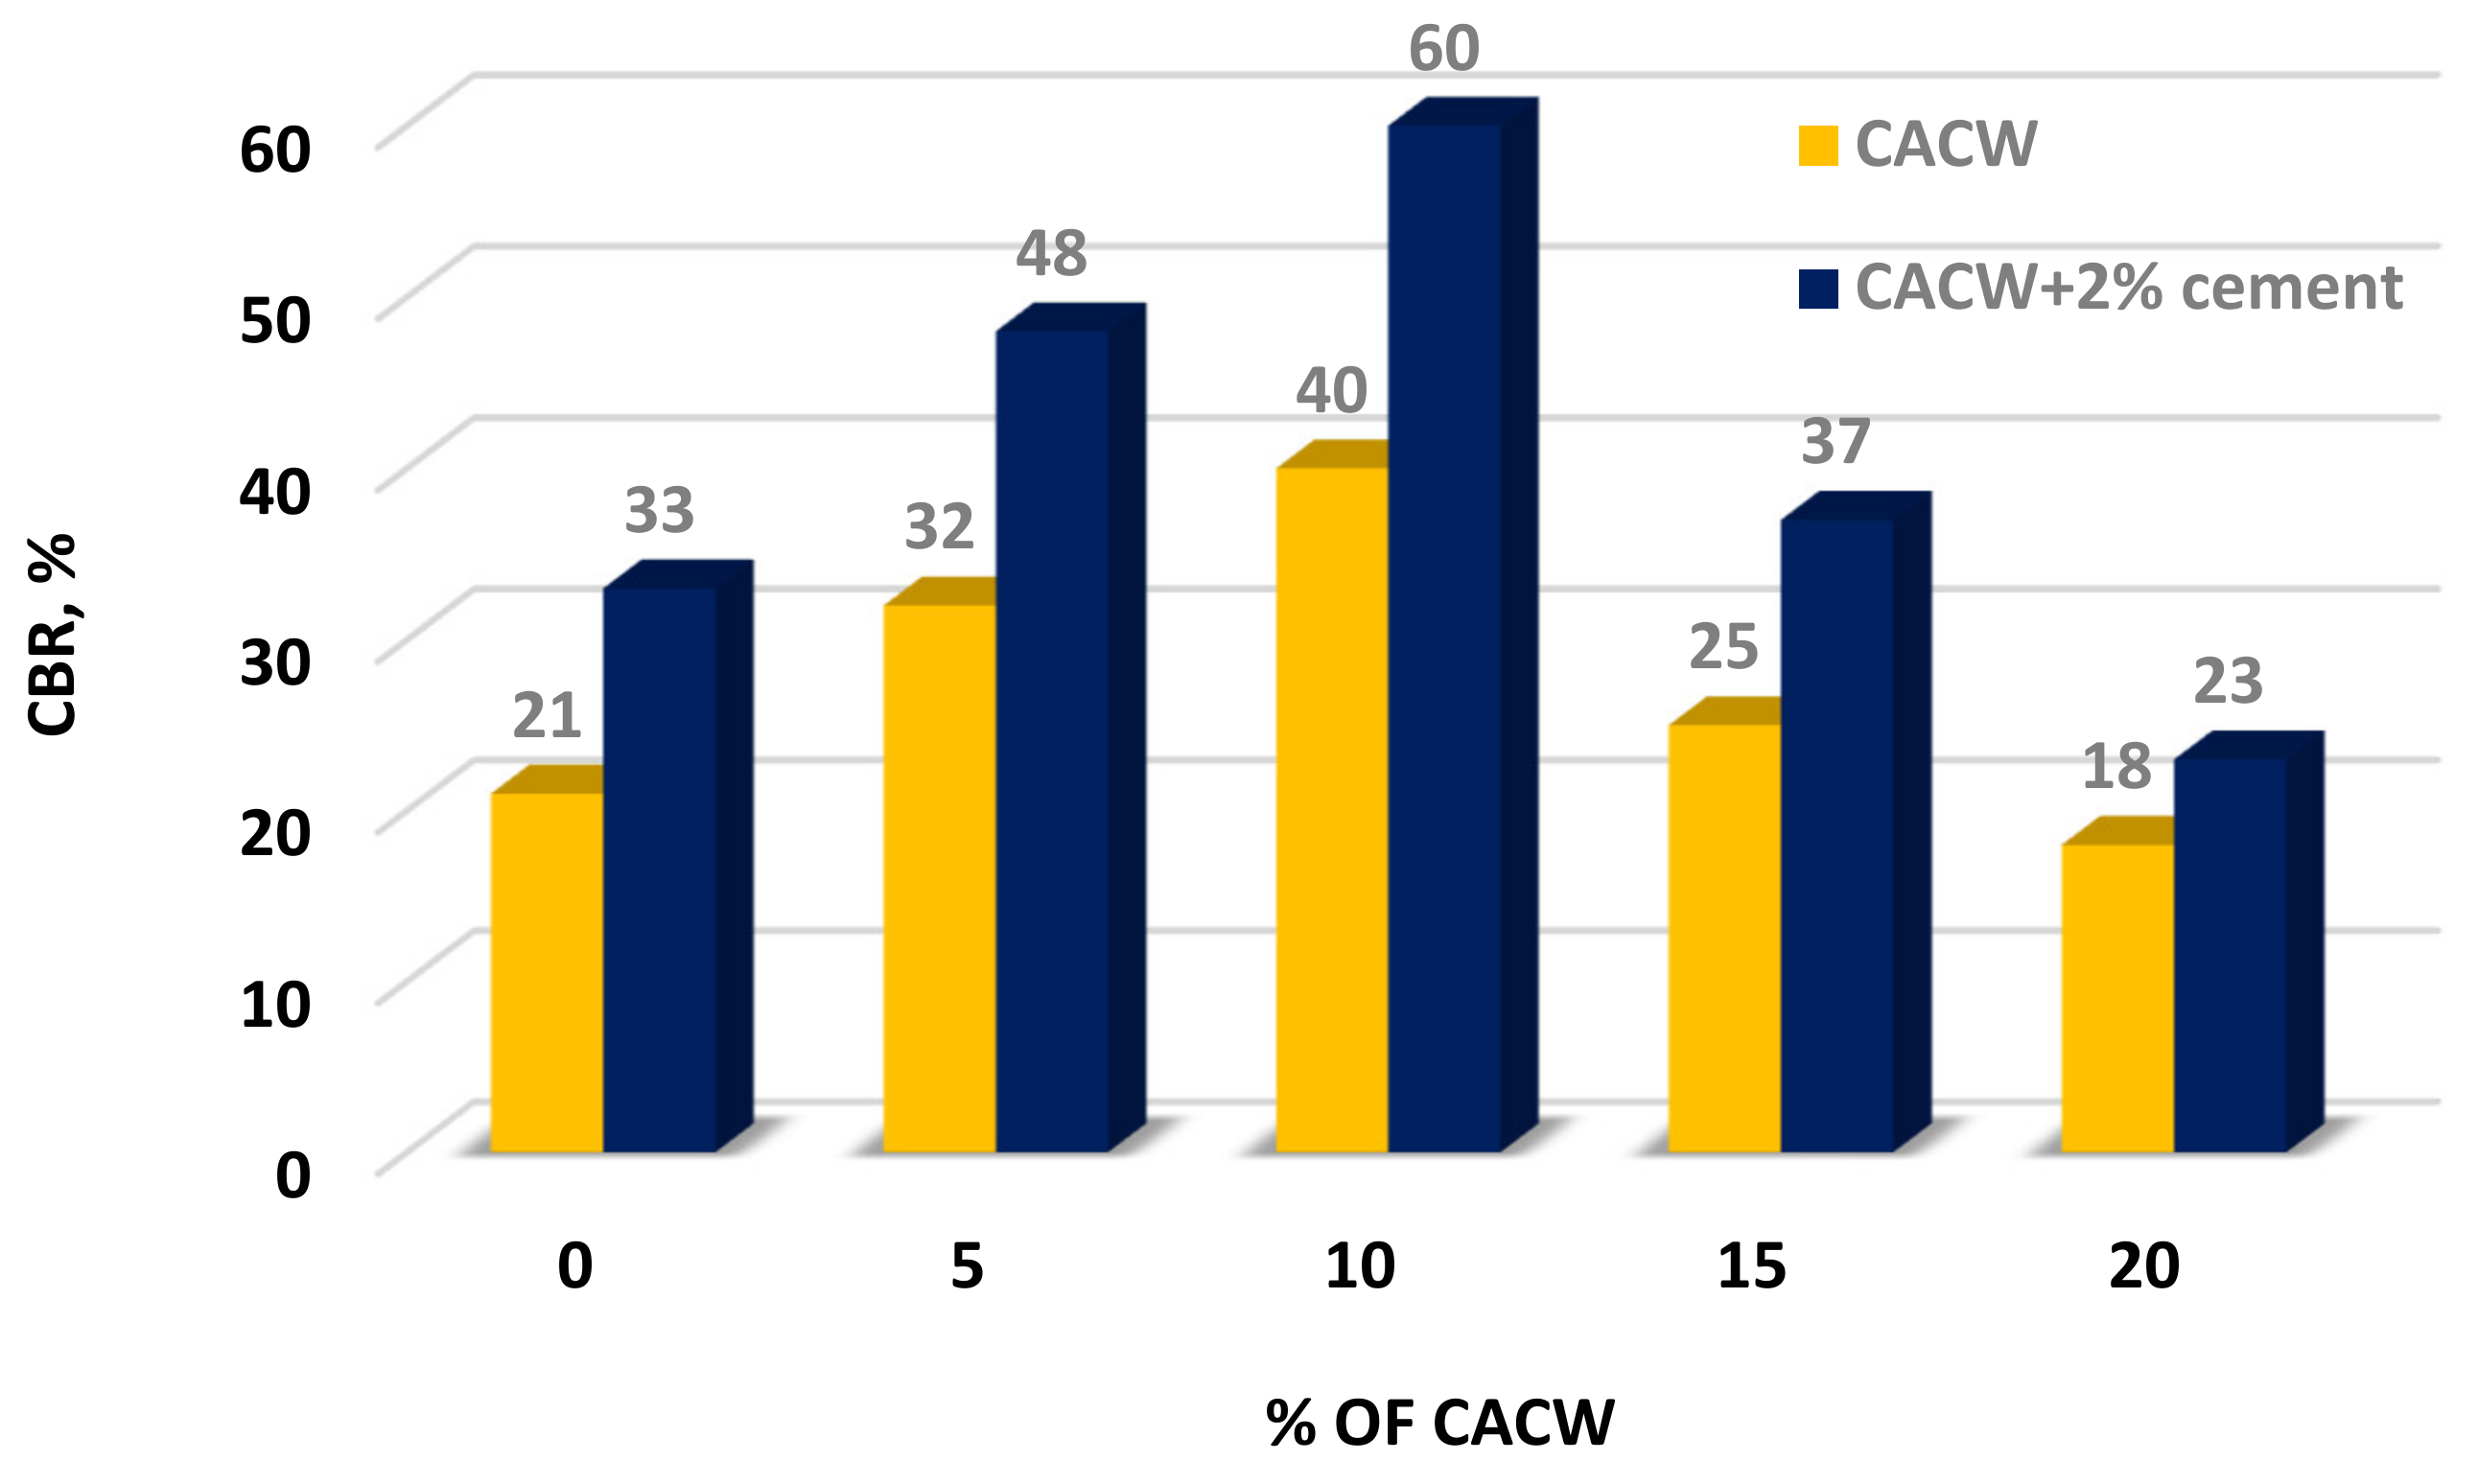
4.2.3. Results of California Bearing Ratio (CBR) Tests

It is critical to obtain CBR values for the materials used in a subgrade of pavement structure or subbase layer in order to evaluate their effectiveness under traffic loading. Soaked CBR tests on specimens of silty sand soil treated with varying proportions of CACW were undertaken to imitate the poorest field circumstances. The experiment was conducted three times, and the average is shown in Figure 7. From the figure, it is clear that when 10% of CACW is added, the CBR value increases from 21% to 40%. When the percentage of CACW increased to 15%, the CBR value dropped from 40% to 25%. The value of the CBR has dropped by roughly 37.5 percent. Additionally, the decrease in CBR value, which went from 25% to 18% when CACW addition increased from 15% to 20%, is strongly connected with the rise in CACW percentage. This is because when CACW concentrations rise, more water is absorbed during the soaking phase, leading to an increase in fine materials, which in turn, causes a loss in strength and consequently lower CBR values. The same trend is observed with a higher value of CBR, as seen in Figure 7 when 2% of cement was added to the mix. It is worth noting that during the soaking period, the swelling was tracked and recorded, and the results showed that the soaked CBR specimens had no swelling. It can be deduced that adding 10% CACW with 2% cement to the soaked CBR value produced the greatest value, i.e., 60% and that it may be utilized as a subbase layer in the construction of high-traffic loading highways in compliance with standards. The process of filling and densification introduced by 10% CACW in the soil structure provides this strength, as seen in Figure 7. As one can see, the CACW powder acts as a void filler, forming a dense structure beneath the loading plunger of the CBR machine; furthermore, since its ratio is low (10%), water absorption is also low, enhancing the soil-CACW mixture’s resistance to penetration and resulting in a higher CBR rating of 40%, which reached 60% when 2% of cement was added to the mix.

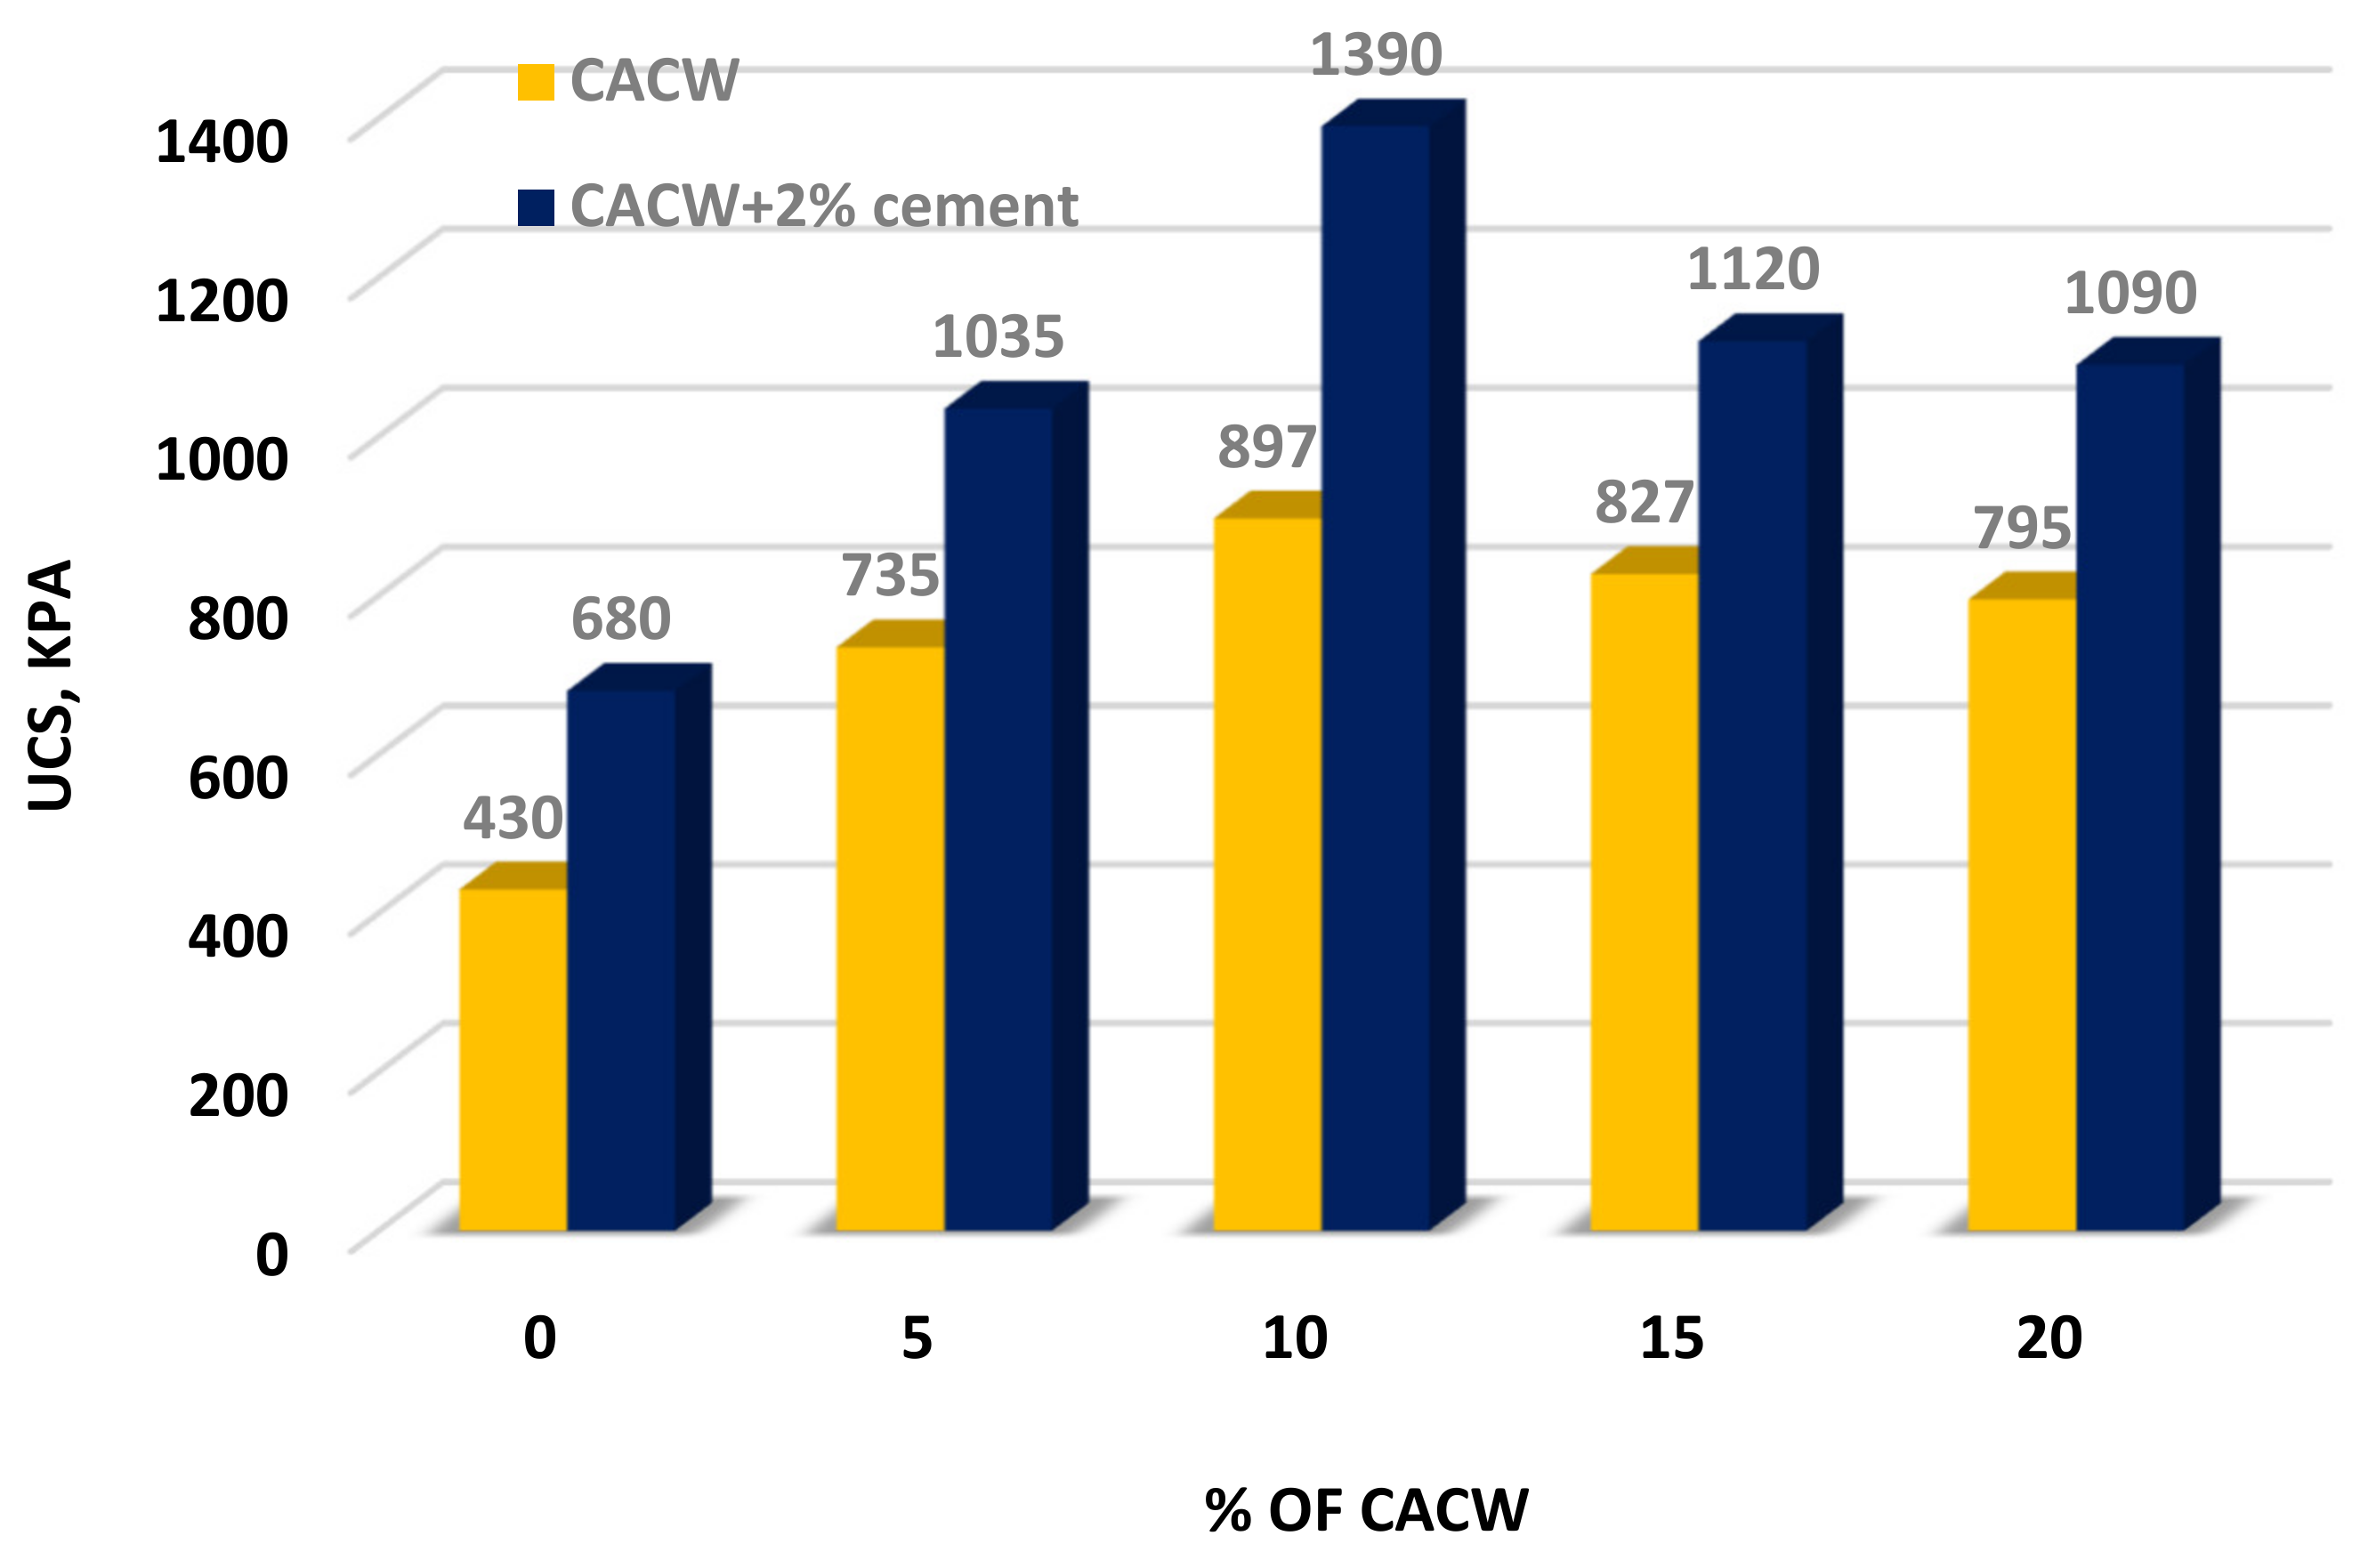
4.2.4. Results of Unconfined Compression Strength Tests

The specimens underwent an unconfined compression test to ascertain their compressive strength after 7 days of curing. As demonstrated in Figure 8, the addition of CACW to all mixes produced results that were better than the UCS value of the control specimen (soil only). With 10% CACW substitution, the greatest UCS value was attained. Figure 8 demonstrates that, in comparison to UCS values achieved with 10% CACW replacement, CACW replacement at a higher percentage than 10% led to lower UCS values. After a 7-day curing period, the UCS values of the specimens treated with 0, 5, 10, 15, and 20% CACW were 430, 735, 897, 827, and 795 KPa, respectively. The optimum concentration of CACW required to improve the compressive strength of the combinations was 10%. This suggested that for completely filling the pore space and producing efficient soil-binder reactions, 10% CACW with 2% cement is the optimal dosage. At a proportion above this cutoff, CACW completely fills all pore spaces, and extra CACW congregates on the grains in soil-binder mixtures. As a result, the amount of contact surface area required for chemical reactions was reduced. The same trend is observed when 2% cement is added to the soil-CACW mixes with higher values of UCS. The UCS values of the specimens treated with 0, 5, 10, 15, and 20% of CACW in addition to 2% of cement were 680, 1035, 1390, 1120, and 1090 KPa, respectively, after a 7-day curing period. These results are consistent with those obtained earlier from UPV and CBR tests. Figure 8 depicts the impact of various CACW percentages on UCS, and as can be observed from the graph, 10% CACW resulted in the greatest UPV and UCS values, as previously reported. When the CACW percentage was 10% higher than expected, both the UPV and the UCS values decreased.
In the construction of rigid pavement, the USA Army Corps of Engineers (USACE) has recommended a minimum 7-day qu of 1380 kPa (200 psi) for subbase and subgrade and 3450 kPa (500 psi) for base course layers, according to the ACI Committee 230 Report [33]. However, these values are 1725 kPa (250 psi) and 5175 kPa (750 psi), respectively, for the construction of flexible pavement. Based on this criterion, only soil mixes with 10% CACW and 2% Portland cement pass the ACI requirements for use in subgrade and subbase layers in rigid pavement construction. Thereafter, this mix (soil-10% CACW-2% cement) will be further evaluated for durability criteria.
The p-values and statistical results that support the trends described in Figure 8 are shown in Table 2. Based on the statistical results presented, it is seen that the differences are statistically significant since the p-values are very small compared to the reference p-value (i.e., 0.05). This indicates there is significant evidence against the null hypothesis.

4.3. Developed Research Methodology

Based on the research results shown in Figure 6, Figure 7 and Figure 8 a method of introducing CACW-stabilized soil comprises the steps:
  • Introducing the CACW additive with the optimum percentage of CACW, i.e., 10%, that shows the highest values of UPV, CBR, and UCS in the dry silty sand soil.
  • Adding the corresponding optimum water content (9.2%) and operating the mixer such that a CACW-soil mix forms.
  • Introducing the Portland cement (2%) into the mixer and operating the mixer such that the cement-CACW stabilized soil forms.
  • Constructing specimens for durability tests and microscopic investigation
  • Comparing the results with the rigid and flexible pavement layer structure requirements and making a decision.

5. Durability Tests (Wetting and Drying)

Temperature and moisture can cause cycles of wetness and dryness, or freezing and thawing. To withstand physical stresses under cyclical environmental loading and various exposure situations, stabilized soils must be robust and sustain stability and durability. The water table’s rise and fall, agricultural water use, septic tanks, leaks from surrounding utilities, and seasonal variations in rainfall all contribute to these soaking and drying cycles. These circumstances subject the stabilized soils to tensile and compressive stresses, which cause weight loss and/or volume change [41]. In this study, the durability of stabilized soils was evaluated using the proposed slake durability test and the standard [42,43]. The salke test was initially utilized for rock testing, but [44] recently adapted it to handle stabilized soil specimens of particular sizes. Triple specimens were used and tested under each condition, and the average of the results was reported.

5.1. Standard Durability Test [42]

For durability tests, silty sand soil samples stabilized with 10% CACW and 2% cement were created. The mold was 4 in. (101.6 mm) in diameter and 4.6 in. (116.8 mm) in height for the soil samples. Each specimen underwent six stages of compression to achieve its modified Proctor’s maximum dry density. To attain the modified Proctor’s maximum dry density, fewer blows were required. 39 strikes were determined to be the appropriate number after numerous tests were conducted for each layer. All samples were extruded from the molds after compaction. For each blend, four samples were created. These samples were chosen to indicate weight loss in two cases and volume change in two additional cases. The volume change samples’ height and diameter were noted. At 23 °C and 100% relative humidity in the lab, all samples were cured for seven days. The samples were moved to an oven and held there for 42 h at 71 °C after spending five hours at room temperature in a water tank. For stabilized soils, this procedure equals one cycle of wetting and drying. At the end of this cycle, the specimens designated for volume change were weighed and dimensioned using a vernier caliper. The other two specimens were brushed with a standard brush with two strokes and a force of about 3 Ib (1.36 kg). To apply the 3 Ib. (1.36 kg) force, each sample was balanced on a balance, and it was brushed while being observed on the balance scale. Weighing the samples both before and after brushing was performed. The remaining 11 cycles were measured similarly, subjecting each specimen to 12 cycles in accordance with [42]. At the end of each cycle, the respective specimens’ weight reduction and volume change were noted. After 12 cycles, the samples were dried at 110 °C to a constant weight. The two equations below [42] were used to compute the volume decrease and weight reduction as a result:
(1)
Change of Volume (Vc):
V c   % = V i V f V i × 100
(2)
Weight loss (Wl):
W l % = W i W f W i × 100
In which, Vc is the change in sample volume after n cycles; Vi = the first volume of the sample (cm3); Vf = the last volume of the sample (cm3), whereas Wl = the loss of weight of the sample after n cycles; Wi = initially computed oven-dry weight and Wf = last adjusted oven-dry weight.
It is also significant to note that the oven-dry weight was altered, and this weight may now be determined using the following equation [42]:
Oven-dry weight adjusted = C/D × 100
In which C is the weight after drying in an oven at 230 °F (110 °C), D is the percent of water left on the sample plus 100.

5.2. Durability Using Slake Test

This test’s primary objective is to determine how durable rocks are [43]. A 500-g sample of rock particles is weighed in a drum with a 2-mm stainless steel screen. The drum has a diameter of 140 mm and a length of 100 mm. 20 revolutions per minute are used to rotate the drum while it is half submerged in water. The amount of weight lost after 10 min of spinning indicates how durable the rock is. For the stabilized soil samples used in this investigation, this test was adopted and modified [44,45]. The drum was resized to 152.4 mm (6 inches) in length and 304.8 mm (12 inches) in diameter. The number of revolutions was altered to account for the change in dimensions so that the soil samples could go the same distance as the stone part in the first examination. Instead of 10 min, the revolution duration was cut to 4.6 min. A total trip distance of 88 m under the revised setup would be comparable to the original test. Figure 8 depicts the setup for the slake durability test.
Two additional samples were compacted using 10% CACW and 2% cement. These samples underwent the same wet and dry rounds as the materials tested using the [42] durability test when they were evaluated using the modified Slake durability apparatus. Before being weighed, the sample’s surface was cleaned using a dry absorbent towel after slaking. It was possible to determine the weight reduction for each sample by comparing the weight before and after each cycle of laziness. After 12 cycles, the specimens were dried in the oven at 110 °C to determine the amount of volume change and loss of weight using the [42] formulas that were previously discussed.

5.3. Durability Test Results

The two durability tests’ results show that for the [42] and slake tests, respectively the average weight losses of the evaluated mixes after 12 cycles are 8% and 10%. The findings demonstrate that the highest weight loss for the combinations did not go above the 14% maximum allowed weight loss for cement-soil mixtures specified by the [46]. A comparison of the durability test results showed that, for all the evaluated samples, the amount of weight drop recorded by the slake durability testing was consistently greater than the one obtained by [42]. This conclusion is consistent with findings made public by [6,35]. Figure 9 shows the durability tests for specimens and used equipment. The underlying mechanism for the improved durability is attributed to the high-density mixtures formed using a 10% CACW additive, which plays a filler role in the mix voids and increases the interlocking of the soil grains, which in turn increases the shear strength of the CACW-silty sand mixes. This result confirms the trend obtained through the previously mentioned tests (i.e., compaction, UCS, UPV, and CBR). Moreover, the microscopic analysis shows the dense mix formed at 10% CACW additive.
The quantitative statistical analysis of the durability results is presented in Table 3. The p-values and statistical results support the significant differences between the two test methods. Based on the statistical results presented, it is seen that the differences are statistically significant since the p-values are very small compared to the reference p-value (i.e., 0.05). This indicates there is significant evidence against the null hypothesis.

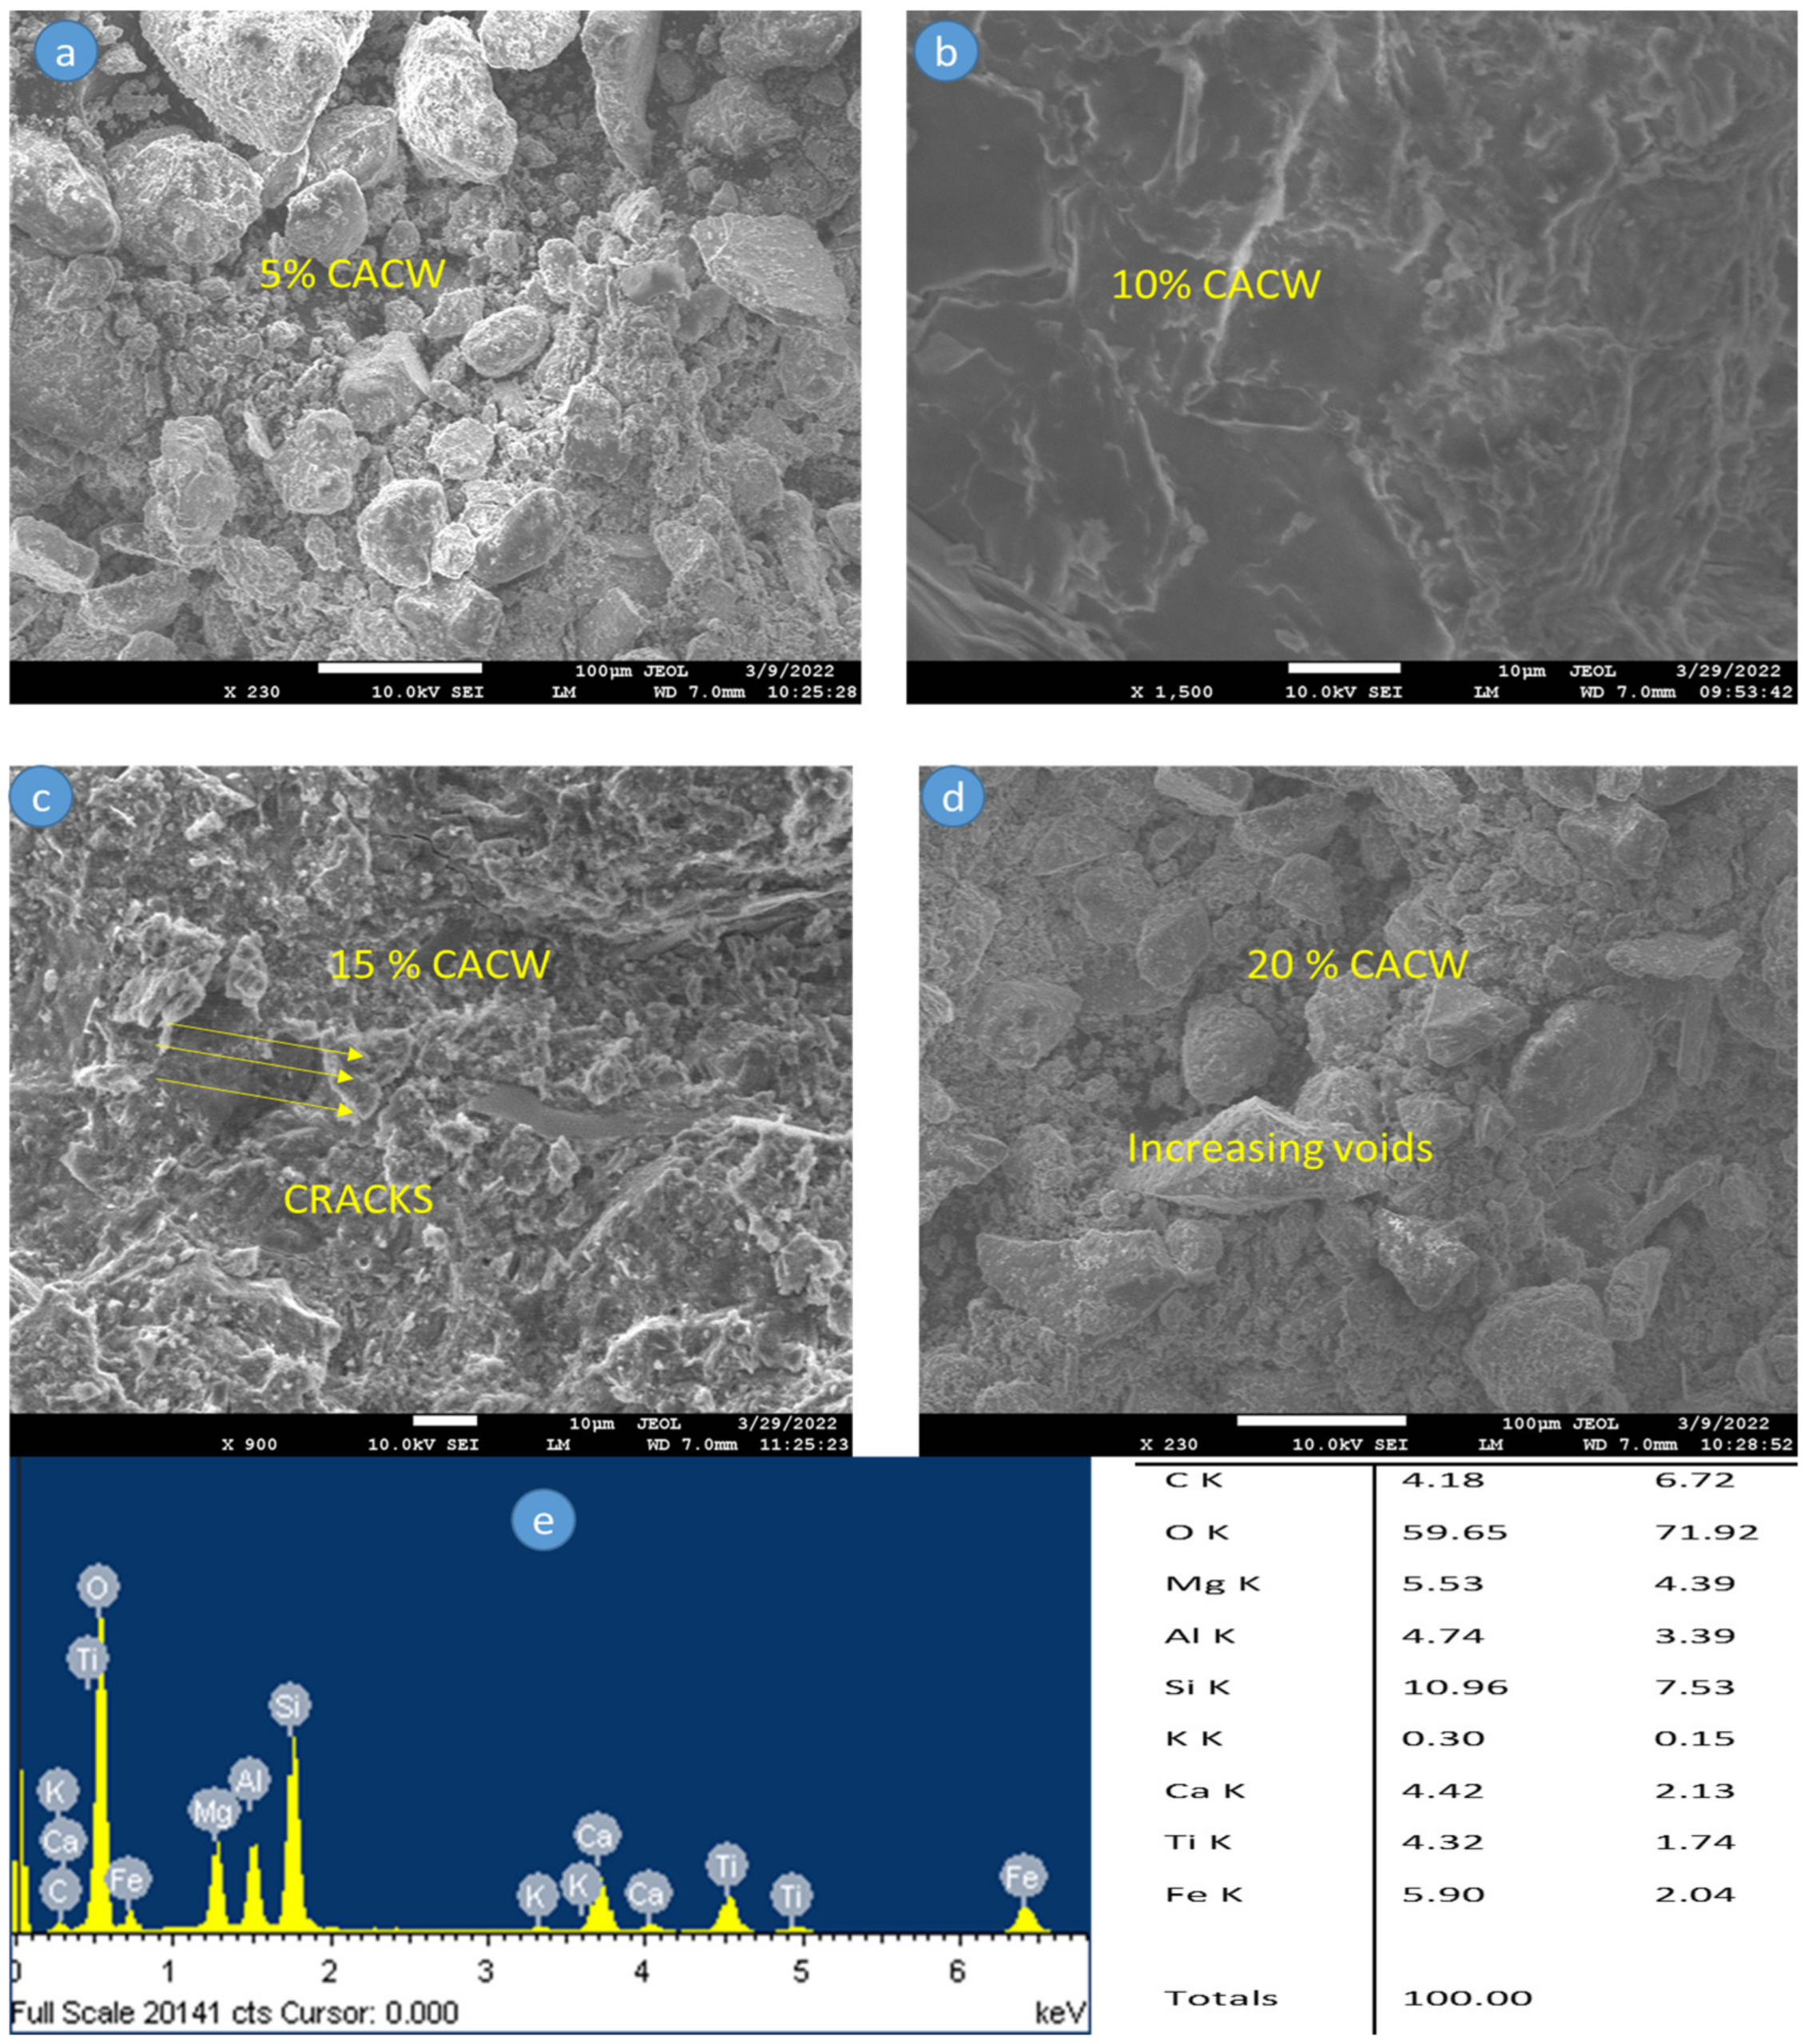
5.4. Microscopic Investigation

By using an SEM Hitachi S 3700, the morphology of the silt and soil and admixtures was examined. With reference to Figure 10 and Figure 11a–e, it is evident from the micrograph that silty sand, lime, and stone dust underwent pozzolanic reactions, resulting in stone dust and lime particles accumulating over the silty sand soil and generating the various cementitious compounds.
The SEM micrograph of silty sand soil stabilized with the optimal dose of 10% CACW and 2% cement in Figure 11b shows a significant amount of the white fibrous cloth-like cementing gel, C-S-H, coating the sand and/or silt particles. This improved the UCS of the stabilized silty sand soil. The system contains discrete sand and/or silt grains. Both direct interactions between particles and connectors are visible. The stabilized soil matrix had weight proportions of 4.18, 5.53, 10.96, 4.42, 0.30, and 5.90% for C, Mg, Si, Ca, K, and Fe, according to EDX results.
To keep soil stable, various fundamental stabilizing mechanisms are in operation. The direct cementitious effects of Portland cement strengthen sandy materials since they are less plastic and volumetrically unstable (as measured by their bearing capacity, unconfined compressive strength, etc.). In this case, the main reaction takes place when the C3S and C2S in cement combine with water to form calcium silicate hydrate. Cementation is considerably enhanced by the concentration of available alkali in solution [47]. By combining soil, cement, and water, cement stabilizes soils [12]. The size has been reduced. The resultant mixture is a novel building material that is heat, water, and frost resistant. Stabilized soils can be used for canal lining, building foundations, road paving, and other purposes.
The two most important phases for stabilizing soil are the calcium silicate phases (C3S and C2S). These two phases aid in the formation of calcium silicate hydrate, or C-S-H, which acts as a binder in the soil matrix. By making calcium available for cation exchange, flocculation, and agglomeration when those phases are hydrated, calcium hydroxide stabilizes the clayey soil [17,48]. Everywhere soil is used to make pavements, it is first dumped in a loose state and then compacted using rolling or vibrating machinery until the required amount of compaction is obtained. A technique for controlling soil compaction on the site is provided by field moisture-density tests. The soil’s field compaction is the sole purpose of the moisture-density test. The assumption is that a soil’s stability increases along with its dry density.

5.5. Environmental Impact Evaluation

In the building business, sustainability has been emphasized in terms of the substitution of natural materials with waste or ecologically friendly resources. The construction sector, which may need to deploy cost-cutting and green products, may profit from this work. In addition to conserving currently used resources, the usage of these abundantly available waste materials will help mitigate their possibly harmful environmental effects. CAWA is a wonderful material that is sustainable and has a low embodied energy level. For a particular scenario, a reduction in the consumption of locally available resources equals an offset to the quantity of CO2 generated as a result of adding CACW to native soil. As a result, adding CAWA reduces the carbon footprint values, making this treatment strategy nearly carbon neutral.
  • Dynamic studies using CACW-stabilized soil can be used to investigate future rail and road applications.
  • It is possible to test the stability of embankments and the endurance of highways built with soils treated with CACW.
  • It is planned to test the results obtained from this work in future projects operated by the city authorities.

6. Conclusions and Recommendations for Future Work

The current paper discussed the use of CACW and clarified how it affects silty sand soils with various mineralogies in terms of their engineering characteristics. The viability of soils supplemented with CACW in the presence of an additional stabilizer (2% cement) has been evaluated. Discussion is held over the effectiveness of CACW as a backfill and paving material. Each soil engineering property improvement caused by the addition of CACW has a mechanism that is detailed. The principal results of this paper are as follows:
  • The improvement in the corresponding maximum dry density and shear strength causes an increase in soaked CBR values.
  • Adding a small amount of additive (10%) to CACW improves the engineering properties of silty sand soils. This addition causes a net reduction in pore volume, aids in the quick development of dense mixes, and significantly increases compressive strength.
  • The test findings showed that the optimum dosage is 10% CACW with 2% cement, raising the undrained shear strength of silty sand soil by 323%, CBR by 286%, and P-wave by 180%.
  • The durability tests reveal that soil containing 10% CACW and 2% cement satisfies the specifications and stays within the 14% weight loss limit imposed by the Portland Cement Association (PCA).
  • For subgrade and subbase layers, only silty sand soil stabilized with 10% CACW and 2% cement is suitable, in accordance with the durability findings and strength criteria. The other, on the other hand, is applicable to other field activities, such as enhancing the carrying capacity of sandy marl soil on pavements and low to moderately high-rise buildings.
  • The microscopic investigation results confirmed the outcomes obtained by macro tests.
  • This study clarifies the long-term effects of CACW on improving the engineering properties of silty sand soil in the Najran Region of the Kingdom of Saudi Arabia and other comparable soils globally. The general implications of this research and its prospective benefits are those for improving the geotechnical qualities of silty sand soils for road pavement applications and enhancing the bearing capacity under foundations and embankments.
  • The authors recommend addressing the effects of adding CACW to other kinds of soil, such as clayey soils, which are distributed over large areas of Najran city as well as many other places overall in the Kingdom of Saudi Arabia.

Author Contributions

Conceptualization, G.M.S.A., A.A.E.A., M.A.S. and A.E.R.; methodology, G.M.S.A., A.A.E.A., M.A.S. and A.E.R.; software, G.M.S.A., A.A.E.A., M.A.S. and A.E.R.; writing—original draft preparation, G.M.S.A., A.A.E.A., M.A.S. and A.E.R.; writing—review and editing, G.M.S.A., A.A.E.A., M.A.S. and A.E.R.; visualization, G.M.S.A., A.A.E.A., M.A.S. and A.E.R.; supervision, G.M.S.A., A.A.E.A., M.A.S. and A.E.R.; funding acquisition, G.M.S.A. and A.E.R. All authors have read and agreed to the published version of the manuscript.

Funding

The authors are thankful to the Deanship of Scientific Research at Najran University for funding this work under the General Research Funding program grant code (NU/DRP/SERC/12/47). Radwan is thankful to the Priority Research Area Anthropocene under the program “Excellence Initiative—Research University” at the Jagiellonian University in Kraków.

Data Availability Statement

Data supporting the findings of this study are available from the corresponding author upon reasonable request.

Acknowledgments

The authors are thankful to the Deanship of Scientific Research at Najran University for funding this work under the General Research Funding program grant code (NU/DRP/SERC/12/47). Radwan is thankful to the Priority Research Area Anthropocene under the program “Excellence Initiative—Research University” at the Jagiellonian University in Kraków. Authors would like also to thank Bn Harkil for Granite rock for their logistic support during the research.

Conflicts of Interest

The authors hereby declare that they have no conflict of interest.

References

  1. Abdullah, G.M.; Wahhab, H.I.A.-A. Evaluation of foamed sulfur asphalt stabilized soils for road applications. Constr. Build. Mater. 2015, 88, 149–158. [Google Scholar] [CrossRef]
  2. Abdullah, G.M.S.; Al-Abdul Wahhab, H.I. Stabilisation of soils with emulsified sulphur asphalt for road applications. Road Mater. Pavement Des. 2019, 20, 1228–1242. [Google Scholar] [CrossRef]
  3. Abdullah, G.M.S. Performance of Enhanced Problematic Soils in Roads Pavement Structure: Numerical Simulation and Laboratory Study. Sustainability 2023, 15, 2595. [Google Scholar] [CrossRef]
  4. Abdullah, G.M.S.; Abd El Aal, A. Assessment of the reuse of Covid-19 healthy personal protective materials in enhancing geotechnical properties of Najran’s soil for road construction: Numerical and experimental study. J. Clean. Prod. 2021, 320, 128772. [Google Scholar] [CrossRef]
  5. Abdullah, G.M. Using Plaxis 2D finite element modeling to assess bearing capacity of Sultana’s soil in Najran Region, Kingdom of Saudi Arabia. Mater. Today Proc. 2021, 49, 2679–2687. [Google Scholar] [CrossRef]
  6. Abdullah, G. Stabilization of Eastern Saudi Soils Using Heavy Fuel Oil Fly Ash and Cement Kiln Dust. Master’s Thesis, King Fahd University of Petroleum & Minerals, Dhahran, Saudi Arabia, 2009. [Google Scholar]
  7. Abdullah, G. Modeling the Behavior of Sulfur Modified Foamed and Emulsified Asphalt Soils Mixes for Local Road Applications. Ph.D. Thesis, King Fahd University of Petroleum & Minerals, Dhahran, Saudi Arabia, 2014. [Google Scholar]
  8. Ashfaq, M.; Heera Lal, M.; Moghal, A.A.B. Static and Dynamic Leaching Studies on Coal Gangue. In Sustainable Environmental Geotechnics; Reddy, K.R., Agnihotri, A.K., Yukselen-Aksoy, Y., Dubey, B.K., Bansal, A., Eds.; Lecture Notes in Civil Engineering; Springer International Publishing: Cham, Switzerland, 2020; pp. 261–270. [Google Scholar]
  9. Moghal, A.A.B.; Lateef, M.A.; Mohammed, S.A.S.; Lemboye, K.; C. S. Chittoori, B.; Almajed, A. Efficacy of Enzymatically Induced Calcium Carbonate Precipitation in the Retention of Heavy Metal Ions. Sustainability 2020, 12, 7019. [Google Scholar] [CrossRef]
  10. Putra, H.; Yasuhara, H.; Kinoshita, N.; Hirata, A. Optimization of Enzyme-Mediated Calcite Precipitation as a Soil-Improvement Technique: The Effect of Aragonite and Gypsum on the Mechanical Properties of Treated Sand. Crystals 2017, 7, 59. [Google Scholar] [CrossRef]
  11. Amulya, G.; Moghal, A.A.B.; Almajed, A. A State-of-the-Art Review on Suitability of Granite Dust as a Sustainable Additive for Geotechnical Applications. Crystals 2021, 11, 1526. [Google Scholar] [CrossRef]
  12. Mohamedsalih, M.A.; El Aal, A.K.A.; Radwan, A.E.; Abdullah, G.M.S.; Al Saiari, M. Feasibility of Najran rocks crushing waste as manufactured sand in the sustainable concrete industry in the Kingdom of Saudi Arabia. Int. J. Geotech. Eng. 2023, 17. [Google Scholar] [CrossRef]
  13. Suits, L.; Sheahan, T.; Soosan, T.; Sridharan, A.; Jose, B.; Abraham, B. Utilization of quarry dust to improve the geotechnicalproperties of soils in highway construction. Geotech. Test. J. 2005, 28, 11768. [Google Scholar] [CrossRef]
  14. Sridharan, A.; Soosan, T.G.; Jose, B.T.; Abraham, B.M. Shear strength studies on soil-quarry dust mixtures. Geotech. Geol. Eng. 2006, 24, 1163–1179. [Google Scholar] [CrossRef]
  15. Birch, W.; Datson, H. Reducing the Environmental Effects of Aggregate Quarrying: Dust, Noise & Vibration. 2008. Available online: https://miningandblasting.files.wordpress.com/2009/09/blast_dust_and_noise_control.pdf (accessed on 5 November 2021).
  16. Saghafi, B.; Al Nageim, H.; Atherton, W. Mechanical behavior of a new base material containing high volumes of limestone waste dust, PFA, and APC residues. J. Mater. Civ. Eng. 2013, 25, 450–461. [Google Scholar] [CrossRef]
  17. Tayeh, B.A.; Akeed, M.H.; Qaidi, S.; Abu Bakar, B. Influence of sand grain size distribution and supplementary cementitious materials on the compressive strength of ultrahigh-performance concrete. Case Stud. Constr. Mater. 2022, 17, e01495. [Google Scholar] [CrossRef]
  18. Kumar, D.S.; Hudson, W.R. Use of Quarry Fines for Engineering and Environmental Applications. 1992. Available online: https://library.ctr.utexas.edu/digitized/iacreports/1992_specrsrch_natlstoneassoc.pdf (accessed on 1 October 2021).
  19. Kumrawat, N.; Ahirwar, S.K. Performance analysis of black cotton soil treated with calcium carbide residue and stone dust. Int. J. Eng. Res. Sci. Technol. 2014, 3, 202–209. Available online: http://www.ijerst.com/currentissue.php (accessed on 15 July 2021).
  20. Antonov, G.I.; Nedosvitii, V.P.; Semenenko, O.M.; Kulik, A.S.; Gerashchuk, Y.D.; I’chenko, N.V.; Poltavets, L.K. Use of dolomite dust for manufacturing stabilized dolomite refractories. Refract. Ind. Ceram. 1997, 38, 238–243. [Google Scholar] [CrossRef]
  21. Al-Homidy, A.A.; Dahim, M.H.; El Aal, A.K.A. Improvement of geotechnical properties of sabkha soil utilizing cement kiln dust. J. Rock Mech. Geotech. Eng. 2017, 9, 749–760. [Google Scholar] [CrossRef]
  22. Bellanova, J.; Calamita, G.; Giocoli, A.; Luongo, R.; Macchiato, M.; Perrone, A.; Uhlemann, S.; Piscitelli, S. Electrical resistivity imaging for the characterization of the Montaguto landslide (southern Italy). Eng. Geol. 2018, 243, 272–281. [Google Scholar] [CrossRef]
  23. Fajana, A.O. Geohazard characterization of subsurface materials using integrated geophysical methods for post foundation studies: A case study. Model. Earth Syst. Environ. 2020, 7, 403–415. [Google Scholar] [CrossRef]
  24. Shi, S.; Bu, L.; Li, S.; Xiong, Z.; Xie, X.; Li, L.; Zhou, Z.; Xu, Z.; Ma, D. Application of comprehensive prediction method of water inrush hazards induced by unfavourable geological body in high risk karst tunnel: A case study. Geomat. Nat. Hazards Risk 2017, 8, 1407–1423. [Google Scholar] [CrossRef]
  25. El Aal, A.K.A.; Rouaiguia, A. Determination of the Geotechnical Parameters of Soils Behavior for Safe Future Urban Development, Najran Area, Saudi Arabia: Implications for Settlements Mitigation. Geotech. Geol. Eng. 2019, 38, 695–712. [Google Scholar] [CrossRef]
  26. Malyukova, L.S.; Martyushev, N.V.; Tynchenko, V.V.; Kondratiev, V.V.; Bukhtoyarov, V.V.; Konyukhov, V.Y.; Bashmur, K.A.; Panfilova, T.A.; Brigida, V. Circular Mining Wastes Management for Sustainable Production of Camellia sinensis (L.) O. Kuntze. Sustainability 2023, 15, 11671. [Google Scholar] [CrossRef]
  27. Ratnasari, A.; Syafiuddin, A.; Mehmood, M.A.; Boopathy, R. A review of the vermicomposting process of organic and inorganic waste in soils: Additives effects, bioconversion process, and recommendations. Bioresour. Technol. Rep. 2023, 21, 101332. [Google Scholar] [CrossRef]
  28. El-Aal, A.K.A.; Salah, M.K.; Khalifa, M.A. Acoustic and strength characterization of Upper Cretaceous dolostones from the Bahariya Oasis, Western Desert, Egypt: The impact of porosity and diagenesis. J. Pet. Sci. Eng. 2019, 187, 106798. [Google Scholar] [CrossRef]
  29. Stander, H.-M.; Harrison, S.T.; Broadhurst, J.L. Using South African sulfide-enriched coal processing waste for amelioration of calcareous soil: A pre-feasibility study. Miner. Eng. 2022, 180, 107457. [Google Scholar] [CrossRef]
  30. ASTM D854-14; Standard Test Methods for Specific Gravity of Soil Solids by Water Pycnometer. ASTM International: West Conshohocken, PA, USA, 2014. Available online: www.astm.org (accessed on 27 September 2023). [CrossRef]
  31. ASTM D4318-17e1; Standard Test Methods for Liquid Limit, Plastic Limit, and Plasticity Index of Soils. ASTM International: West Conshohocken, PA, USA, 2017; ASTM D424-54(1971) Standard Method of Test for Plastic Limit (Withdrawn 1982). Available online: www.astm.org (accessed on 27 September 2023). [CrossRef]
  32. ASTM D422-63(2007)e2; Standard Test Method for Particle-Size Analysis of Soils (Withdrawn 2016). ASTM International: West Conshohocken, PA, USA, 2007. Available online: www.astm.org (accessed on 27 September 2023). [CrossRef]
  33. El-Aal, A.A.; Abdullah, G.M.; Metwaly, W.M.A.; AbdelMaksoud, K.M. Geological and archeological heritage resources assessment of the Najran Province; towards the 2030 vision of Saudi Arabia. Resour. Policy 2023, 85, 104061. [Google Scholar] [CrossRef]
  34. ASTM D1557-12e1; Standard Test Methods for Laboratory Compaction Characteristics of Soil Using Modified Effort (56,000 ft-lbf/ft3 (2,700 kN-m/m3)). ASTM International: West Conshohocken, PA, USA, 2012. Available online: www.astm.org (accessed on 27 September 2023). [CrossRef]
  35. ASTM C597-16; Standard Test Method for Pulse Velocity Through Concrete. ASTM International: West Conshohocken, PA, USA, 2016. Available online: www.astm.org (accessed on 27 September 2023). [CrossRef]
  36. ASTM D2166/D2166M-16; Standard Test Method for Unconfined Compressive Strength of Cohesive Soil. ASTM International: West Conshohocken, PA, USA, 2016. Available online: www.astm.org (accessed on 27 September 2023). [CrossRef]
  37. ASTM D1883-16; Standard Test Method for California Bearing Ratio (CBR) of Laboratory Compacted Soils. ASTM International: West Conshohocken, PA, USA, 2016. Available online: www.astm.org (accessed on 27 September 2023). [CrossRef]
  38. ASTM C 289 ASR; Aggregates Chemical Method. ASTM: West Conshohocken, PA, USA, 2017.
  39. Sanjay, M.; Sindhi, P.R.; Vinay, C.; Ravindra, N.; Vinay, A. Crushed rock sand—An economical and ecological alternative to natural sand to optimize concrete mix. Eng. Mater. Sci. 2016, 8, 345–347. [Google Scholar]
  40. Bonavetti, V.; Donza, H.; Menéndez, G.; Cabrera, O.; Irassar, E.F. Limestone filler cement in low w/c concrete: A rational use of energy. Cem. Concr. Res. 2003, 33, 865–871. [Google Scholar] [CrossRef]
  41. Al-Ayedi, E.S. Chemical Stabilization of Al-Qurayvah Eastern Saudi Sabkha Soil. Master’s Thesis, Department of Civil Engineering, King Fahd Univesity of Petroleum and Minerals, Dhahran, Saudi Arabia, 1996. [Google Scholar]
  42. ASTM D 559; Standard Test Methods for Wetting and Drying. ASTM: West Conshohocken, PA, USA, 1996.
  43. Goodman, R.E. Introduction to Rock Mechanics, 1st ed.; John Wiley and Sons: New York, NY, USA, 1980. [Google Scholar]
  44. Aiban, S.A.; Al-Abdul Wahhab, H.; Al-Amoudi, O.S.B. Identification, Evaluation, and Improvement of Eastern Saudi Soils for Constructional Purposes, Progess Report No.2; King AbdulAziz City for Science and Technology: Riyadh, Saudi Arabia, 1995. [Google Scholar]
  45. Aiban, S.A.; Al-Abdul Wahhab, H.; Al-Amoudi, O.S.B. Identification, Evaluation, and Improvement of Eastern Saudi Soils for Constructional Purposes, Progess Report No.3; King AbdulAziz City for Science and Technology: Riyadh, Saudi Arabia, 1995. [Google Scholar]
  46. Ahmad, H.R. Characterization and Stabilization of Eastern Saudi Marls. Ph.D. Thesis, King Fahd University of Petroleum & Minerals, Dhahran, Saudi Arabia, 1995. [Google Scholar]
  47. Helmuth, R.A. Fly Ash in Cement and Concrete; SP040; Portland Cement Association: Skokie, IL, USA, 1987. [Google Scholar]
  48. Wang, L. Cementitious Stabilization of Soils in the Presence of Sulfate. Ph.D. Thesis, Louisiana State University, Baton Rouge, LA, USA, 2002. [Google Scholar]
Figure 1. Diagram illustrating the experimental work.
Applsci 13 10930 g001
Figure 2. Geologic map for the study area modified after [33].
Applsci 13 10930 g002
Figure 3. Chart of grain size distribution of soil and CACW.
Applsci 13 10930 g003
Figure 4. The relationship between dry density and moisture content of soil−CAWA−2% cement mixes.
Applsci 13 10930 g004
Figure 5. Impact of adding CAWA on the optimum moisture content and maximum dry density.
Applsci 13 10930 g005
Figure 6. Effects of the addition of CACW on Ultrasonic pulse velocity at different mixes of CACW.
Applsci 13 10930 g006
Figure 7. Effect of addition CACW on the soaked CBR value.
Applsci 13 10930 g007
Figure 8. Effect of CACW addition on UCS.
Applsci 13 10930 g008
Figure 9. Durability using Modified Slake test: (a,b) slake test machine, (c) specimen with standard brush (d) speciemns after testing [44,45].
Applsci 13 10930 g009
Figure 10. Effect of CACW addition on voids and density.
Applsci 13 10930 g010
Figure 11. (ad): SEM images illustrating the effect of CACW addition at 5, 10, 15 and 20%, respectively, (e) is EDX to illustrate the composition of soil and CACW, yellow arrows refered to minor cracks at 15% of CACW.
Applsci 13 10930 g011
Table 1. Chemical composition of CACW.
ElementComposition Range (%)
SiO245–77
Al2O315–20
CaO3–15
Fe2O36–16
K2O3–5
MgO1–4
Na2O0–3
P2O30–0.04
TiO20–2.33
Table 2. t-test: Paired two samples for means for UCS results.
% CACW2% C + CACW
Mean736.81063
Variance32,829.264,595
Observations55
Pearson Correlation0.959028
Hypothesized Mean Difference0
df4
t Stat−7.64721
P (T <= t) one-tail0.000786
t Critical one-tail2.131847
P (T <= t) two-tail0.001571
t Critical two-tail2.776445
Table 3. t-test: Paired two sample for means for durability test results.
Standard Durability of Soil + 10% CACW + 2% CSlake Durability of Soil + 10% CACW + 2% C
Mean8.33333310
Variance1.1666670.9
Observations66
Pearson Correlation0.634335
Hypothesized Mean Difference0
df5
t Stat−4.66252
P (T <= t) one-tail0.00276
t Critical one-tail2.015048
P (T <= t) two-tail0.00552
t Critical two-tail2.570582
Disclaimer/Publisher’s Note: The statements, opinions and data contained in all publications are solely those of the individual author(s) and contributor(s) and not of MDPI and/or the editor(s). MDPI and/or the editor(s) disclaim responsibility for any injury to people or property resulting from any ideas, methods, instructions or products referred to in the content.

