1. Introduction
Approximately 71% of the Earth’s surface is covered by oceans, which have an average depth of about 3800 m. Despite this, the underwater ecosystem remains largely unexplored, primarily due to the challenging logistics, high budgetary demands, and lack of appropriate technology. The use of underwater video recording has been increasingly implemented across different marine ecology studies as a substitute for more invasive techniques, with successful results [
1]. However, the implementation of underwater recording poses several challenges. Firstly, image recordings can be time-consuming and costly to manually process and analyze, which has led to an emerging interest in developing automatic analysis software. Secondly, unconstrained or real underwater scenes are highly noisy, with limited visibility, non-uniform illumination, low contrast, attenuated color, and blur. Therefore, preprocessing of acquired images is necessary to reduce these disturbances, improve the quality of the images, and ensure better accuracy in the algorithms applied to them [
2,
3,
4].
One of the questions addressed with the use of underwater videos is the study of biomass abundance [
1]. Measurements of abundance are very sensitive to the minimum size of the organisms detected. For the detection of items in a video, there are several techniques and tools whose effectiveness depends on the context in which they are applied. Such is the case of event detection [
5,
6], an approach based on the use of self-organizing neural networks and a fixed camera. An event detection program is useful, for example, in a taxonomy study, but it does not solve the problem in situations where the goal is to automatically extract data such as items, sizes, etc. This is the case for obtaining biomass abundance estimations for the Deep Scattering Layer (DSL).
The DSL is a high-density biomass community located in the mesopelagic layer of the water column (between 400 and 600 m deep). This community is composed of a diversity of fish, crustaceans, cephalopods, and plankton [
7,
8,
9]. This layer is involved in the nutrient cycle [
10,
11], and it is thought to play a major role in the diet of different species of marine megafauna. Part of the organisms that form this layer perform a vertical synchronized movement to the epipelagic layer (between 0 and 200 m deep), thus constituting what has been defined as Diel Vertical Migration (DVM), which takes place at dusk and dawn every day [
12,
13].
Macroscopic amorphous aggregates, or “marine snow”, make up a significant part of the biomass in the water column [
14]. Marine snow is composed of detritus, living organisms, and inorganic matter [
15,
16]. These aggregates provide a feeding source for animals in the water column [
16] and in the deeper parts of the ocean [
10]. The primary mechanism through which surface-derived material reaches deep water and the ocean floor is the sinking of marine snow [
17]. Gaining a deeper understanding of marine snow abundance could provide valuable insights into the dynamics of deep-water communities.
Several studies have used various extractive techniques to study the abundance and composition of the DSL biomass [
16,
18,
19]. These sampling methods have biases due to factors such as mesh size or the evasiveness of the animals. On the other hand, the scientific community is moving towards the implementation of less invasive methods. Other methods for studying the diversity and abundance of deep-dwelling organisms in situ include video imaging [
20,
21] and acoustic sampling [
22,
23]. Imagery studies have also addressed estimations of the size, abundance, and distribution of marine snow [
24,
25,
26,
27]. Extractive methodologies targeting the study of marine snow also face bias involving its fragility; therefore, technology allowing the study in situ could offer a solution [
15].
Various approaches have arisen to tackle the challenge of estimating the abundance of phytoplankton and/or marine snow [
1]. These approaches include: using object features (especially size) without any classification; involving experts for manual identification of images; employing machine classification with subsequent visual inspection and validation/correction of some taxa or all images; and utilizing machine classification alone. However, in the majority of cases, marine snow is considered a singular, diverse entity due to the complexity of defining objective categories, despite its significant numerical predominance. All these strategies share, in the methodological flow to obtain abundance, the initial stages, i.e., from the way of acquiring the images through the preprocessing of the images stage to obtaining the features of each frame (especially item size) stage. From the features obtained, different classifiers can be applied automatically, supervised by experts, or through manual classification by experts.
Quantitative imaging system technologies, aided by automation, offer promising tools for globally observing marine snow or plankton. These systems capture numerous images in a controlled manner, enabling the extraction of consistent features of individual objects (e.g., size, opacity) and calculating in situ concentrations from a small image volume. The instruments use various technologies, such as monochromatic lateral laser illumination, color imaging, light field, and dark field. Some systems operate in the laboratory, in situ moorings, or open waters, with low flow field perturbations ideal for imaging fragile objects. Recent developments focus on miniaturized cameras mounted on autonomous vehicles, enhancing spatiotemporal coverage compared to manned submersibles or ships. Now that image acquisition is mature, effort should be directed towards the development of software tools based on standard terms and taxonomy to facilitate data exchange and should allow the development of quality control procedures to ensure data consistency. Moreover, to take advantage of this infrastructure and the data it contains, oceanographers must be trained in data science, not only to take advantage of machine learning methods but also simply to deal with the huge data sets involved [
28].
In the Canary Islands, different studies of the DSL biomass abundance and composition, as well as migration patterns, have been developed with extractive methods [
9,
29] and acoustics [
30,
31]. Under the project DeepCom (DEEPCOMCTM2017-88686-P), video recordings of the DSL were obtained with low-cost technology. The Delphis system consists of a 1000-m waterproof housing made from a modified scuba tank with a front window, into which a SONY HDR-AS20 high-definition camera is inserted. The system has a lighting system with automatic on/off, consisting of two side spotlights equipped with three white LED lights with 1200 lumens of power. The system was equipped with stabilizers to maintain a fixed direction with respect to the prevailing current in the water column. The videos obtained with the Delphis system were analyzed taxonomically for big organisms [
31]. No small items were considered in this analysis.
The aim of this investigation was to design a software application with a client-server-based architecture with the capability to automatically quantify objects in underwater recordings, including small-sized items. Previously, the analysis of such data required continuous expert supervision. By automating the analysis, detection, and data extraction processes, the ability of researchers to handle a substantial volume of images with ease and efficiency will be enhanced, leading to significantly more precise scientific results and improving the experimental setup. The design criteria encompass the utilization of open-source software, adaptation to the distinctive attributes of underwater videos, and versatility in operation across a diverse range of databases, even when handling medium- to low-quality images. The use of standard image processing tools has been shown to be sufficient to fulfill these objectives. The application achieves this by automatically processing videos, identifying items, and extracting data features (size in pixels), the number of items, and statistical data. Additionally, the application incorporates a user interface that simplifies the utilization of the application. For the purpose of this study, underwater recording material from the DeepCom project was used to test the software.
Our main objective does not involve a taxonomical analysis of the videos but a relative estimation of biomass abundance. Furthermore, we have refrained from contemplating the utilization of more potent but time-costly methods, such as artificial intelligence (AI). The deployment of AI necessitates high-quality images and an extensive training process, which may not always be feasible.
2. Software Application Description
The software application implemented is based on a client-server architecture model (
Figure 1). This structure is split into three main components: the user interface (frontend); the application server and database (backend); and the application core (deepviewcore). The client-server model provides greater flexibility when compared to PC applications. Research users (clients) can share resources on a single database (including underwater videos, processing parameters, and processing results) and access the application through a web browser client. This scalable and redundant system, with centralized security, enables updates to individual components without requiring a complete system overhaul.
2.1. Application Core: Deepwiew
The application core, named DeepViewCore, was developed using the Python programming language and is responsible for processing videos from the database. It is based on the OpenCV library [
32]. This software application is available on the official Python repository [
33].
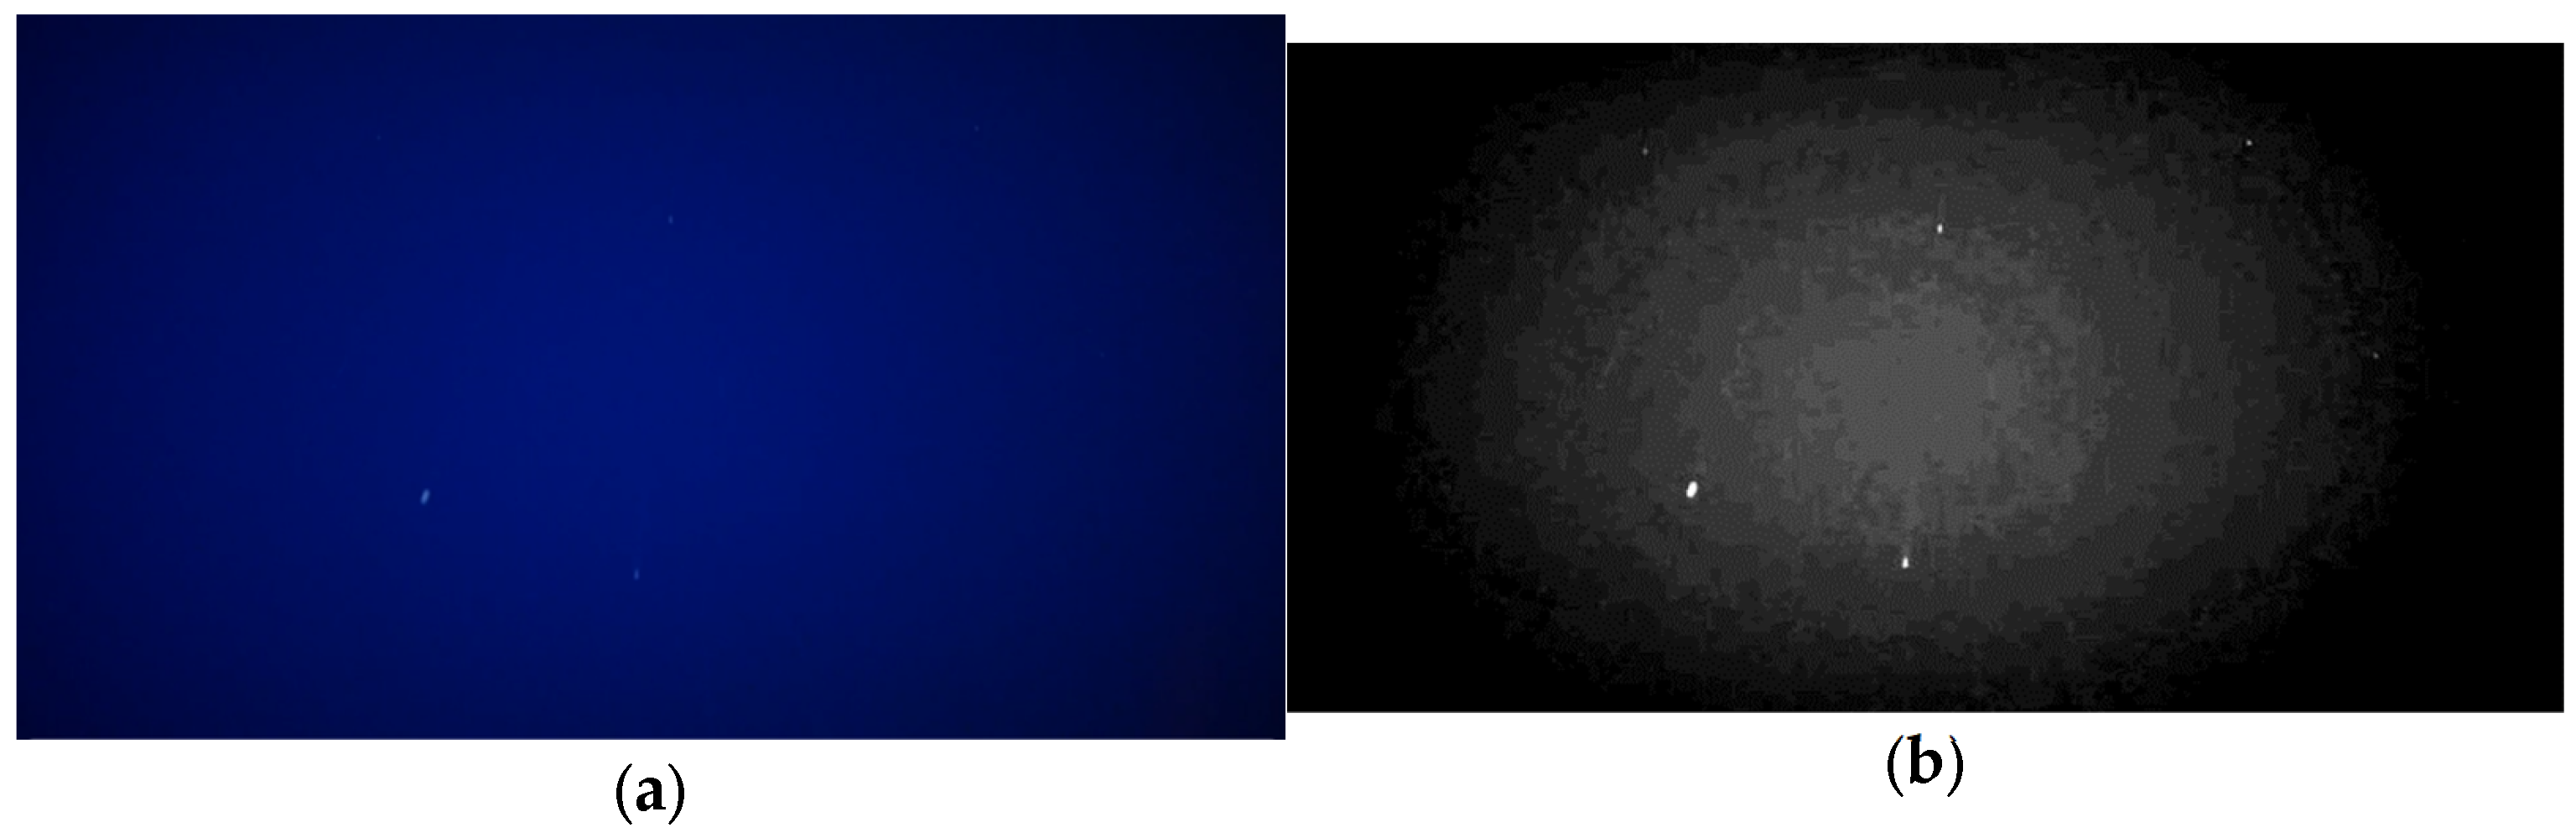
Prior to the design and implementation of a functional software application version, an initial analysis of the underwater images was conducted. The presence of non-uniform illumination and noise arising from the dark current introduces errors in item detection within underwater images. It is crucial to note that the gray value of the image background varies depending on factors such as the power of the spotlights and water conditions (
Figure 2a,b). This variability poses a challenge to calculating a fixed threshold through a histogram study in the detection process.
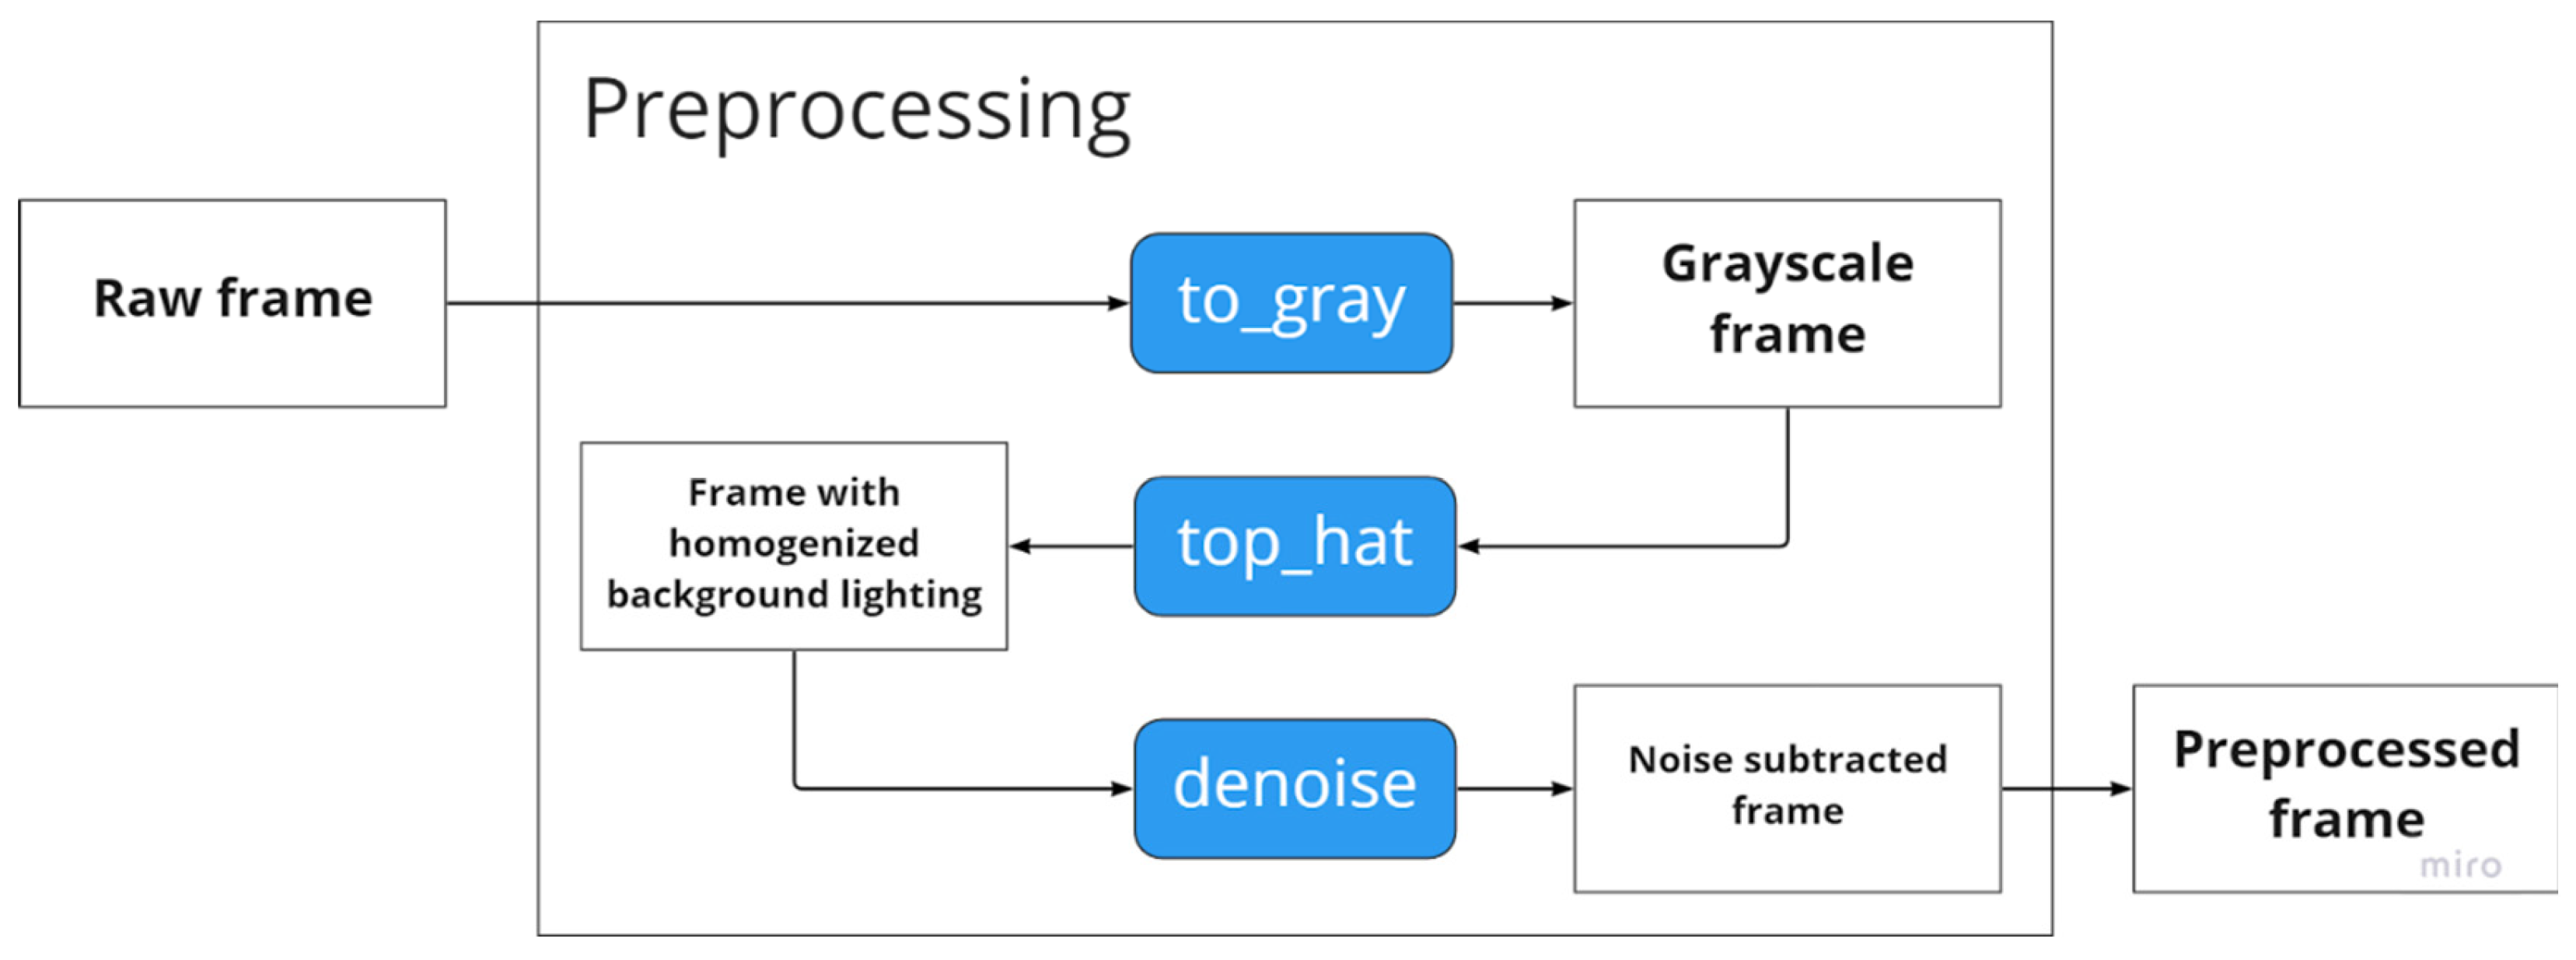
DeepViewCore is a modular pipeline architecture that consists of two main stages: preprocessing and processing. This design enables seamless maintenance operations, such as replacing or adding modules, thanks to its pipeline structure.
The preprocessing stage, illustrated in
Figure 3, is composed of three steps: to_gray, top_hat, and de-noise. These steps allow for a more accurate estimation of the threshold level on the grayscale image, leading to improved item detection.
In order to enhance the detection of ITEMS, it is essential to address two factors: correcting the non-uniform illumination and subtracting the noise due to the dark current from underwater images.
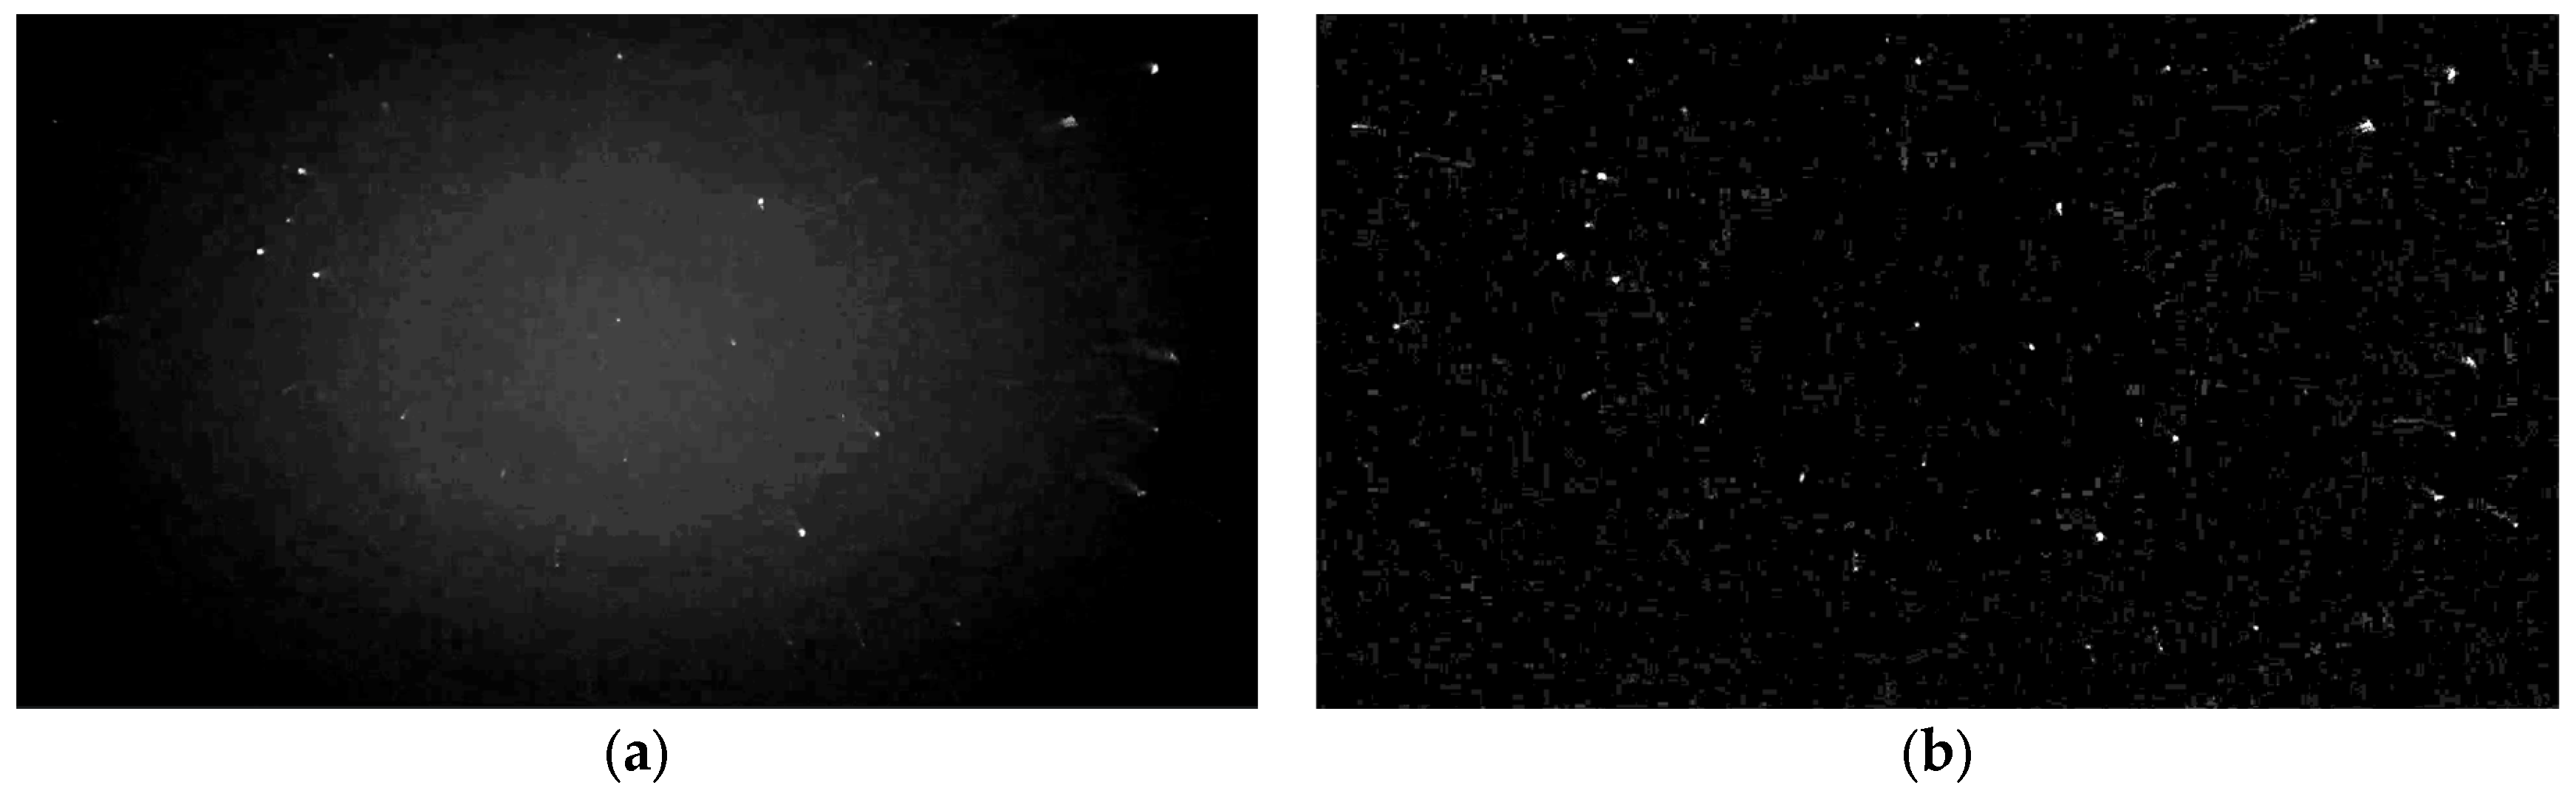
For the purpose of homogenizing the background illumination, a top-hat filter was employed [
34,
35]. The outcomes of this process, using a rectangular structuring element with dimensions 9 by 9, are presented in
Figure 4. It can be observed that by homogenizing the image’s background, the contrast between the background and the targeted items to be detected is significantly improved.
Another crucial source of noise that requires consideration is the “dark current”, which refers to the electrical current flowing through a camera sensor even in the absence of incident photons. This phenomenon is thermally induced, resulting from the spontaneous generation of electrons within the silicon material of the sensor [
31]. One of the primary challenges arises from the presence of pixels in the detector exhibiting notably high dark currents, commonly referred to as “hot pixels”. These hot pixels can emit brightness levels comparable to the signals of interest that we aim to detect. Applying a thresholding technique can effectively eliminate the hot pixels but may lead to substantial loss of image information since it sets a minimum detectable brightness level. Median filtering proves useful in eliminating hot pixels, as they are often isolated, but it can also introduce image smoothing and limit the minimum detectable size of items.
To mitigate the influence of the thermally generated signal in the image, we employed a method involving the subtraction of “dark images”. These dark images are captured under the same temperature conditions as the images being processed and are obtained from video sections recorded with the light source turned off.
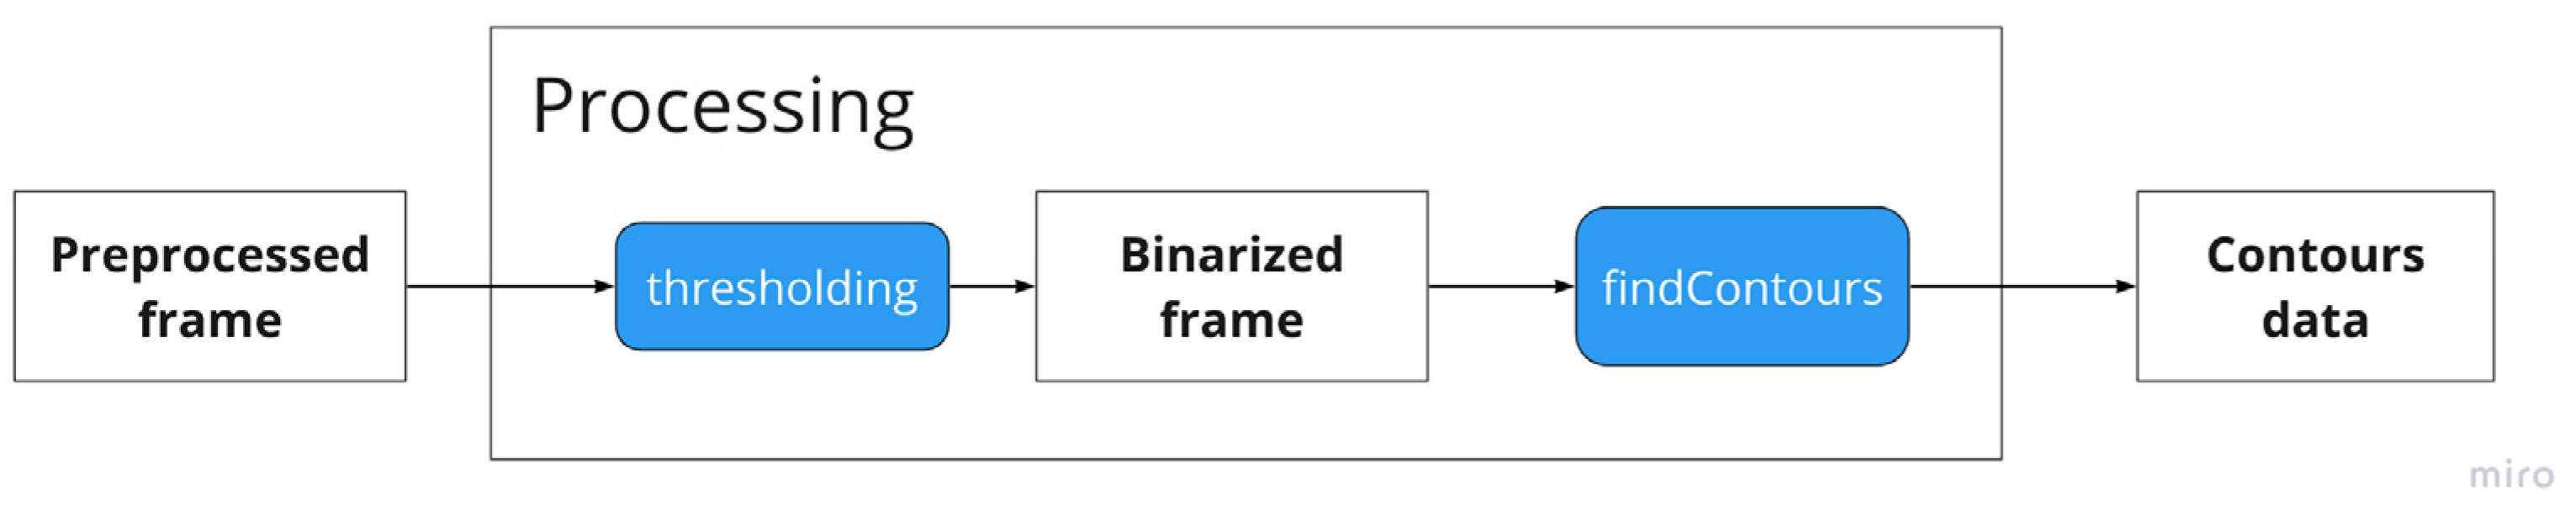
The processing stage takes the preprocessed frame as input, as shown in
Figure 5. It includes a thresholding and binarization step, followed by a detection phase using the findContours module. The final detection algorithm identifies the items in the image by providing their coordinates (x, y), assigning a label and size, and estimating the total number of items.
The implemented thresholding algorithm automatically computes the optimal threshold value using the Otsu method. However, this method encounters challenges when the signal density is low. To address this issue, it has been combined with an adaptive image equalization (AIE) process to enhance image contrast.
It should be noted that we have not observed a substantial improvement in results with the use of local adaptive algorithms, which, on the other hand, would require more computational time. This is likely due to the initial processing step, where non-uniform illumination in the image is removed.
The output of each analyzed frame, which includes the number of detected items and their corresponding coordinates in the image, is aggregated over time to observe the temporal evolution of the item count in the processed video. Additionally, there is an option to enclose the detected items with circular contours for visualizing their movement (
Figure 6).
Finally, an automated event detector has been incorporated into the software, which informs the user of the temporal position within the video where anomalous detections occur. These anomalies encompass both objects exceeding the established threshold in size and sudden variations in the number of detections within a very brief time period.
2.2. Application Server and Database: Backend
The application server’s functionalities include storing and managing multimedia files (videos), managing databases, and managing the application programming interface (API) for communication between the client and server. It was developed in Python for easy integration with DeepViewCore and functions under the open-source framework Django [
36].
As for the database management system, we chose to use MongoDB in its Community Edition 5.0 version. MongoDB stores data as documents in JSON format. The JSON format and Django library allow a direct mapping between the stored data and the native Python objects of the application. Additionally, it performs integrity checks and validations to ensure that only “clean” data is stored in the database. We have defined a video model class that contains the data (document ID, created time) concerning the media file. In other words, once the processing of the video is started, a document with the parameters, including document ID, time stamp, path, status, results of processing, and computation time, is generated. On the other hand, each video model class has an associated document where the processing parameters are stored, that is, the threshold, video link, and top-hat filter dimension.
For the communication between the server and the client of the application, an API (application programming interface) was designed using the REST (representational state transfer) architecture [
37]. This is based on the HTTP application layer protocol, which allows for data exchange through JSON objects. In order to allow clients to access and manage the current state of resources on the server, this API is implemented through endpoints named ‘video’ and ‘parameters’, which accept requests by both GET and POST methods.
The API, to respond quickly to the client request for the underwater video stream, creates a concurrent thread for each video request. These threads share the memory of the main thread, which permits the API, in an easy way, to manage them from the server code. Additionally, the API displays the available videos through an element of the Django fork client. However, this client does not support requests for video ranges dynamically. This is useful because it allows the user to conduct a partial analysis of the whole video. To solve this, we have implemented a new Django element (hosted on the Django GitHub repository) [
38], which allows the client, in addition to requesting the whole video from the server, to make partial requests for the video.
2.3. User Interface: Frontend
Frontend is based on the ReactJS Java script library to build user interfaces. It permits rendering video images for clients. The Redux Toolkit was also used to manage the state of the application. This is a library that facilitates the monitoring of the global state of the application through the Flux architecture, an alternative to the traditional Model View Controller pattern. In addition, TypeScript, a superset of the JavaScript language that adds type support such as transpilation-time checking and development-time type inference, was used as the programming language.
It is worth mentioning that in the initial design stages, the well-known design software Figma 3.1.0 was also used to layout the visual appearance of the application’s pages. Bootstrap, a popular CSS library for building responsive applications, was used to style the elements that make up the graphical interface.
The interface consists of three single-page applications (SPAs): the home or main page, the videos page, and the evaluation/analysis page.
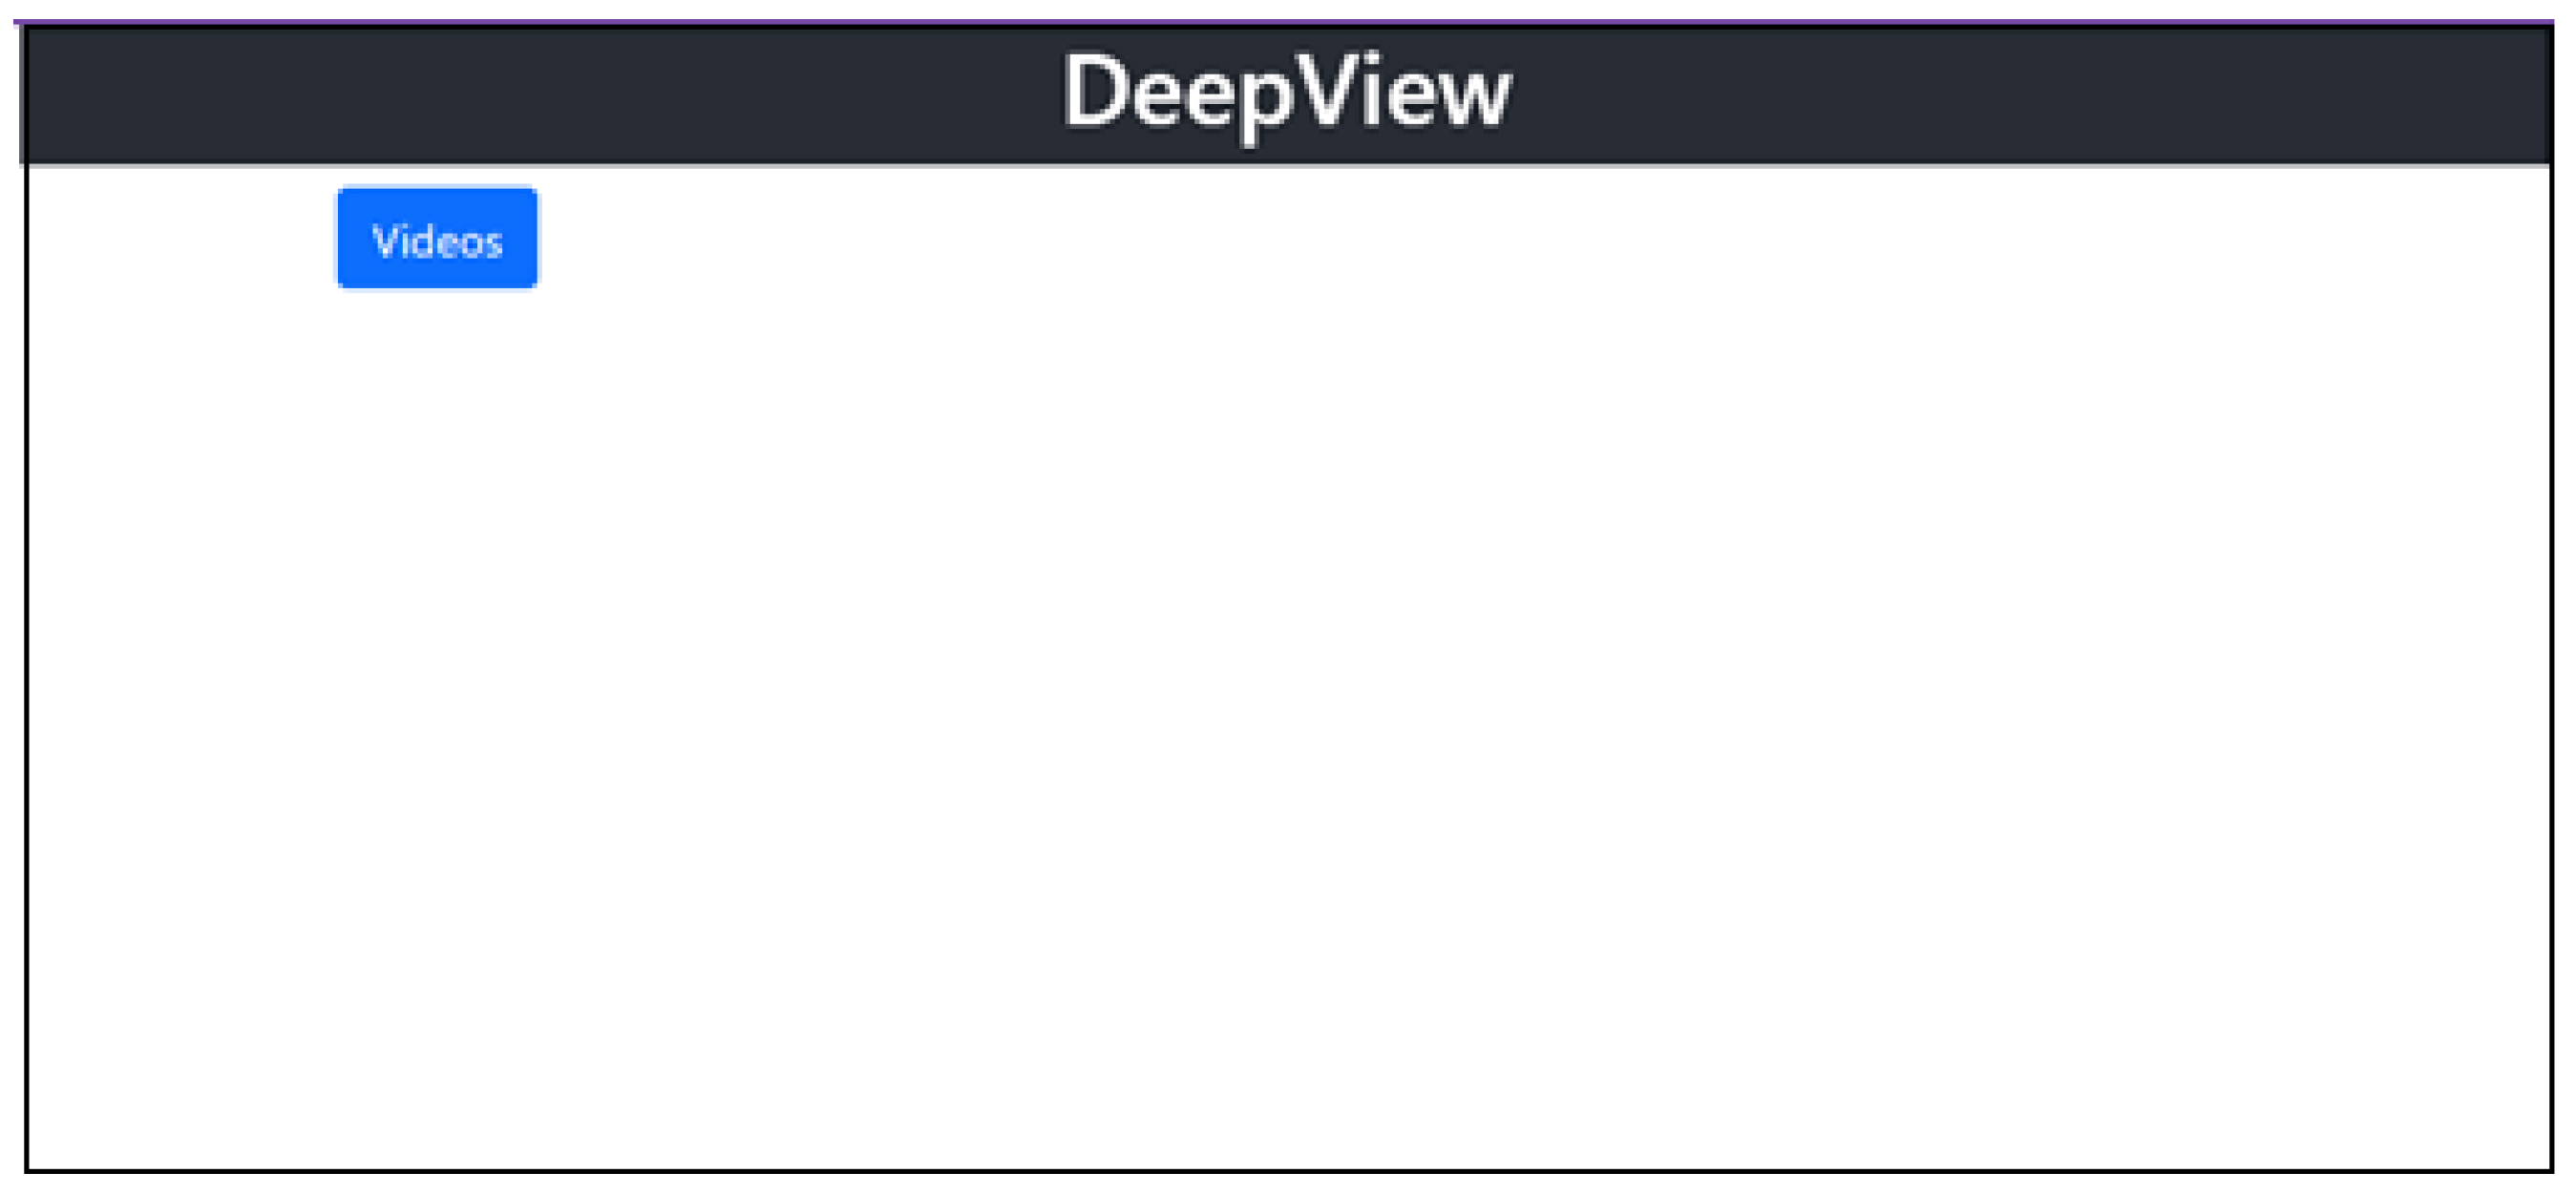
The home page (
Figure 7) represents the main page of the application and consists only of a Videos button that redirects the user to the videos page. The motivation for including this page is in response to possible future extensions of the application involving the processing not only of video files but also of audio or any other type of file.
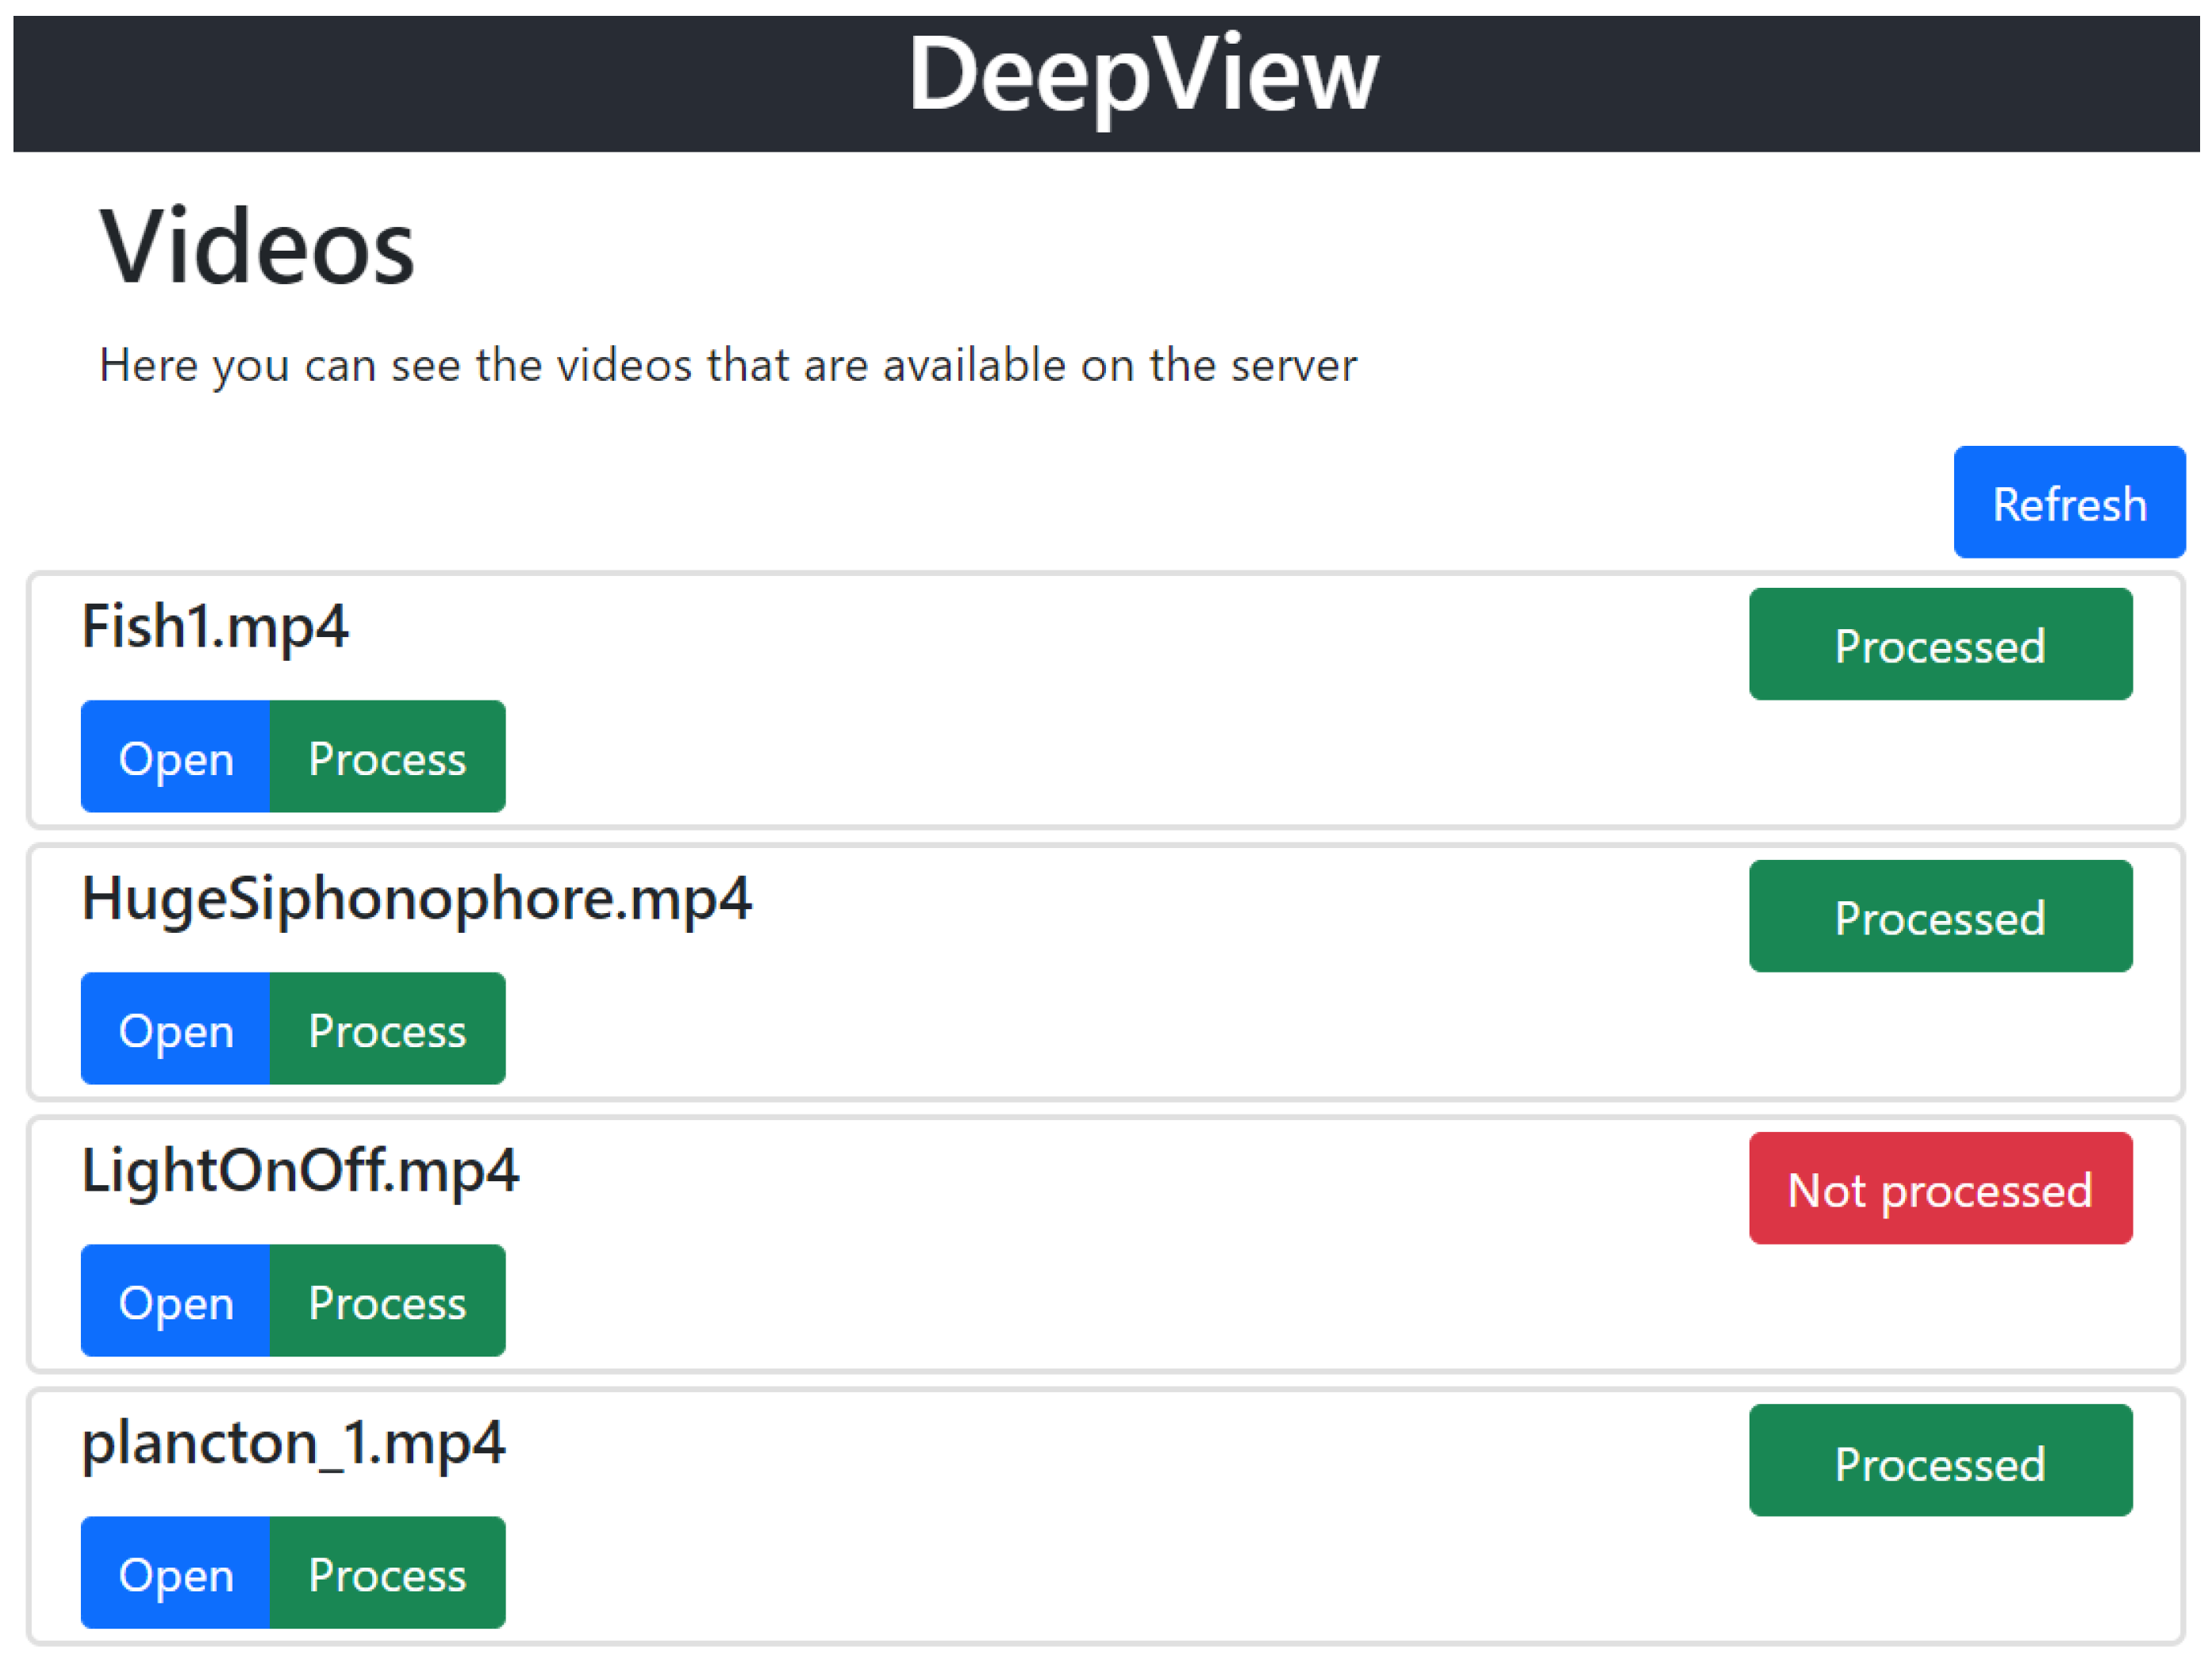
On the videos page, the user can view (explore) the media files available for processing by the server, as well as access their details, start/stop processing, and check their status. In
Figure 8, we can see the status (Not processed, Processing, Processed, or Stopped) of the sources in the database, differentiated with different colors.
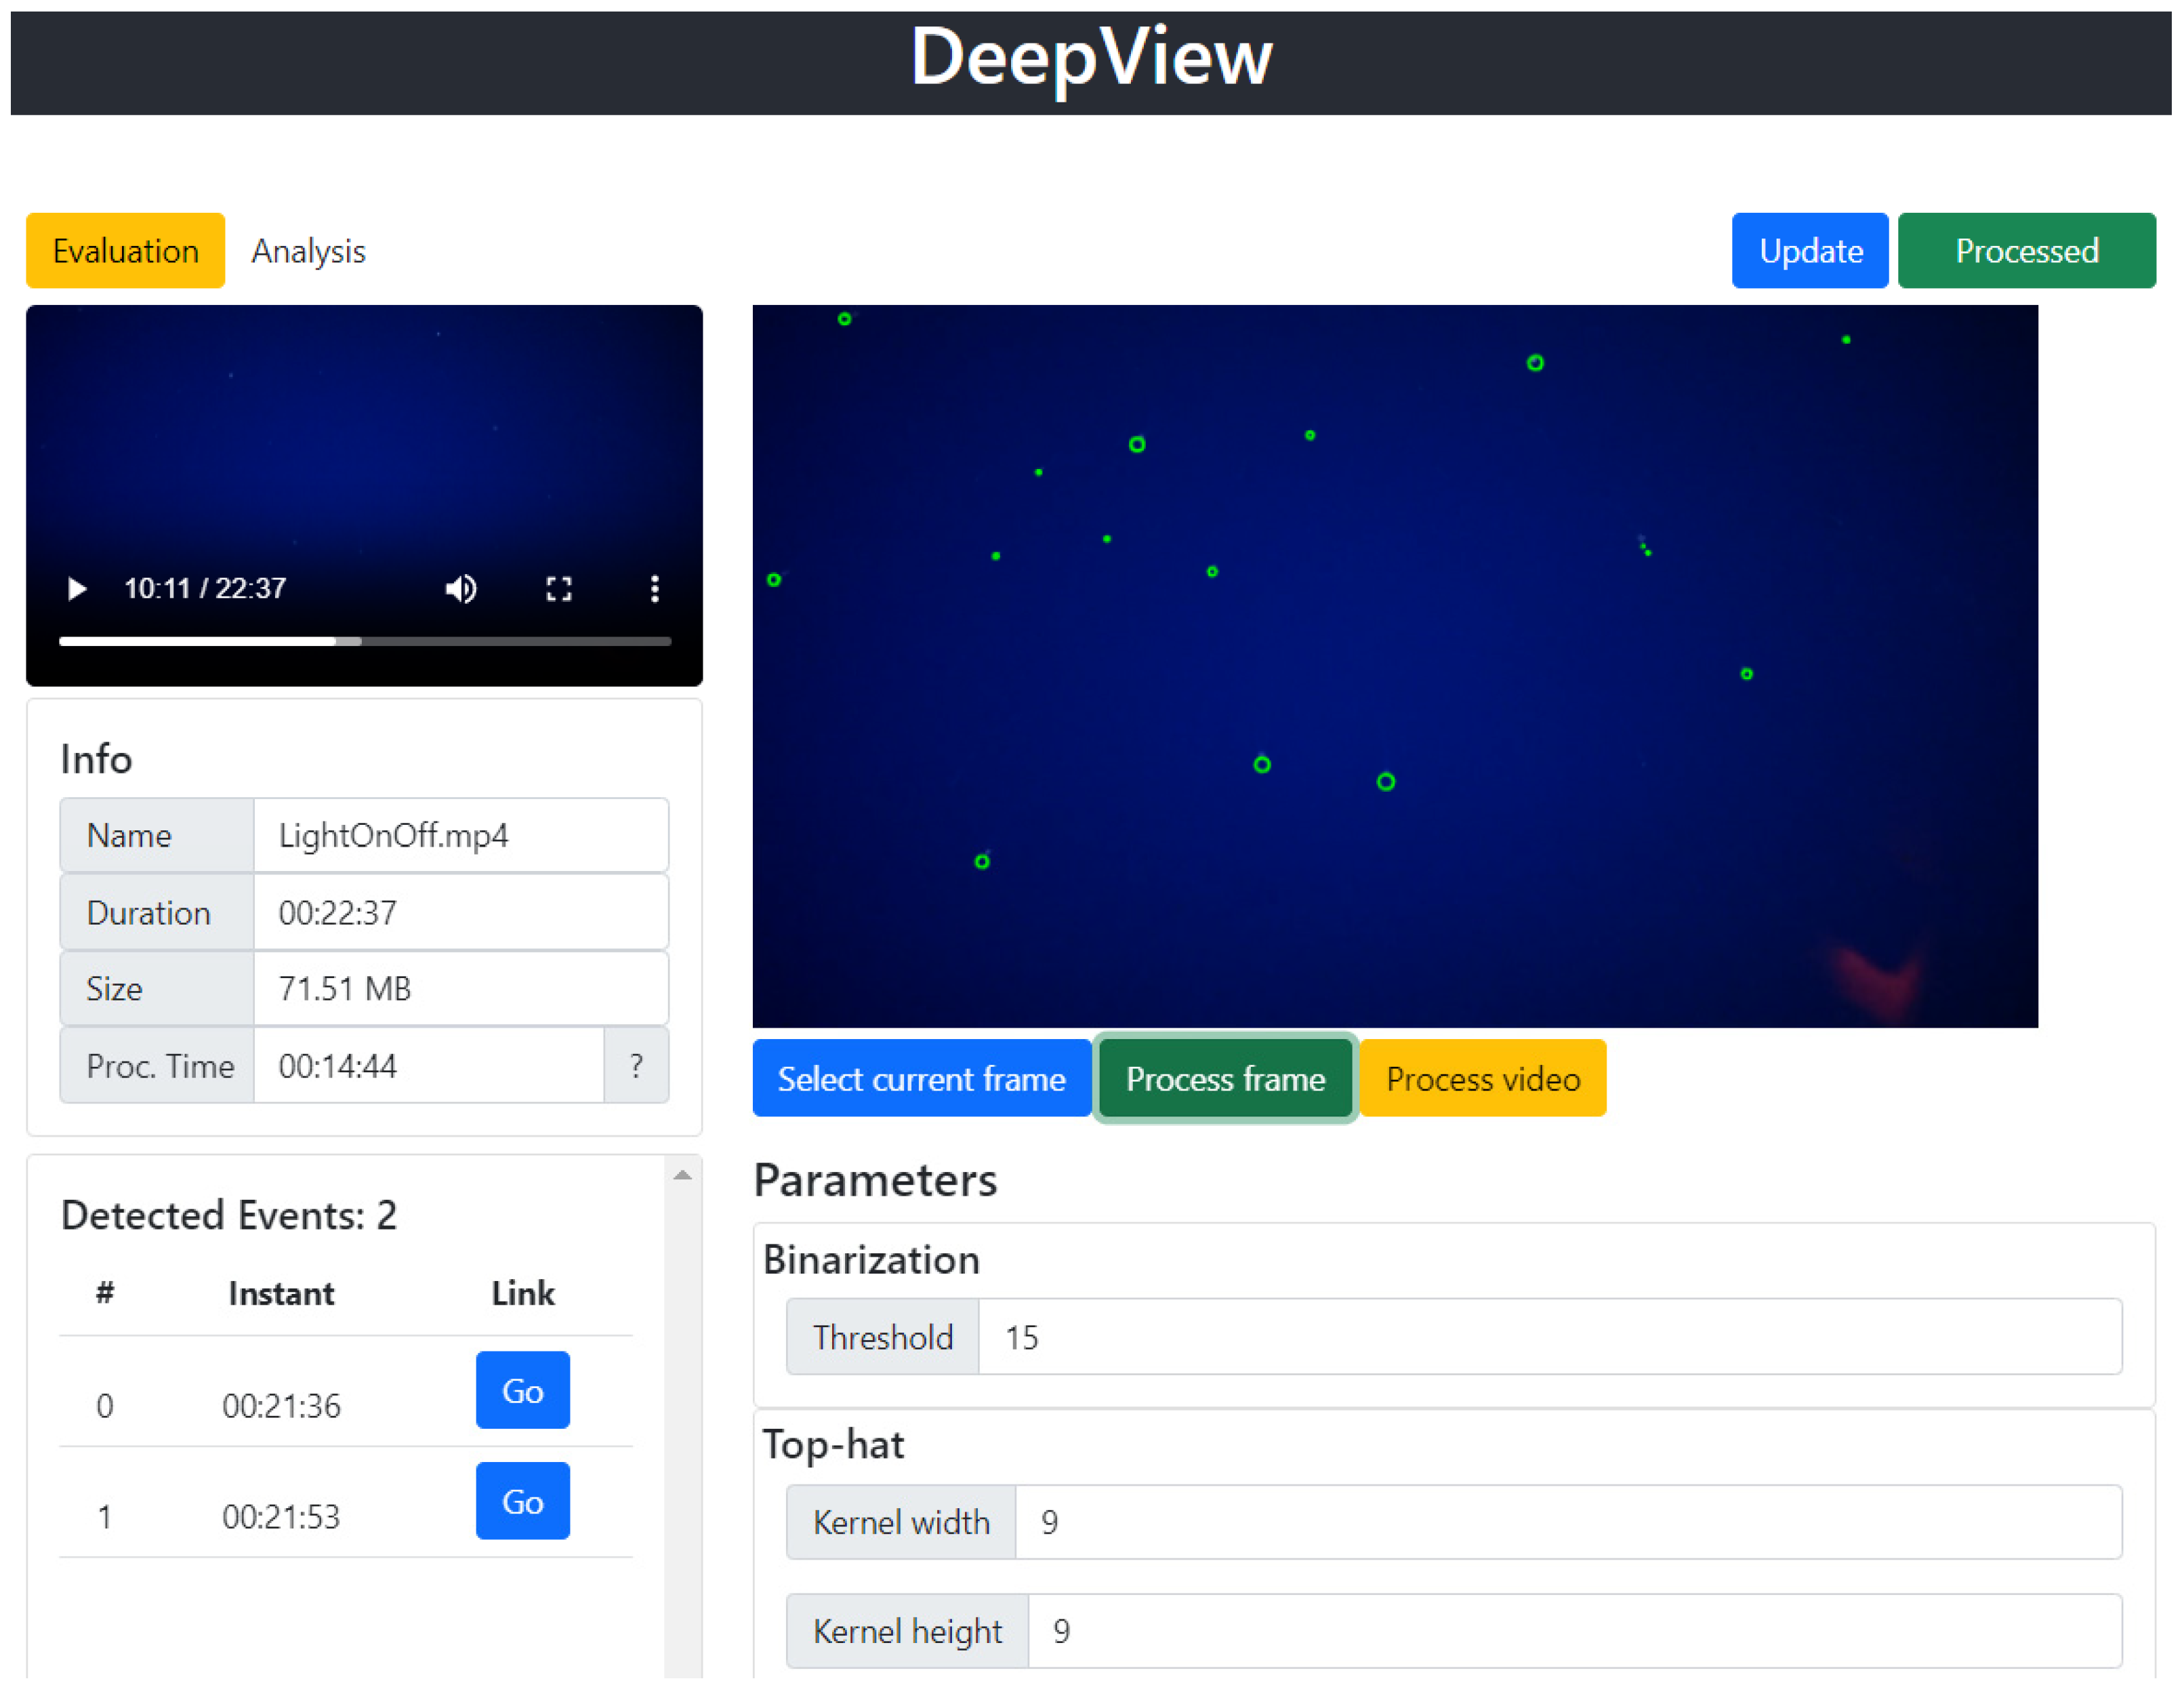
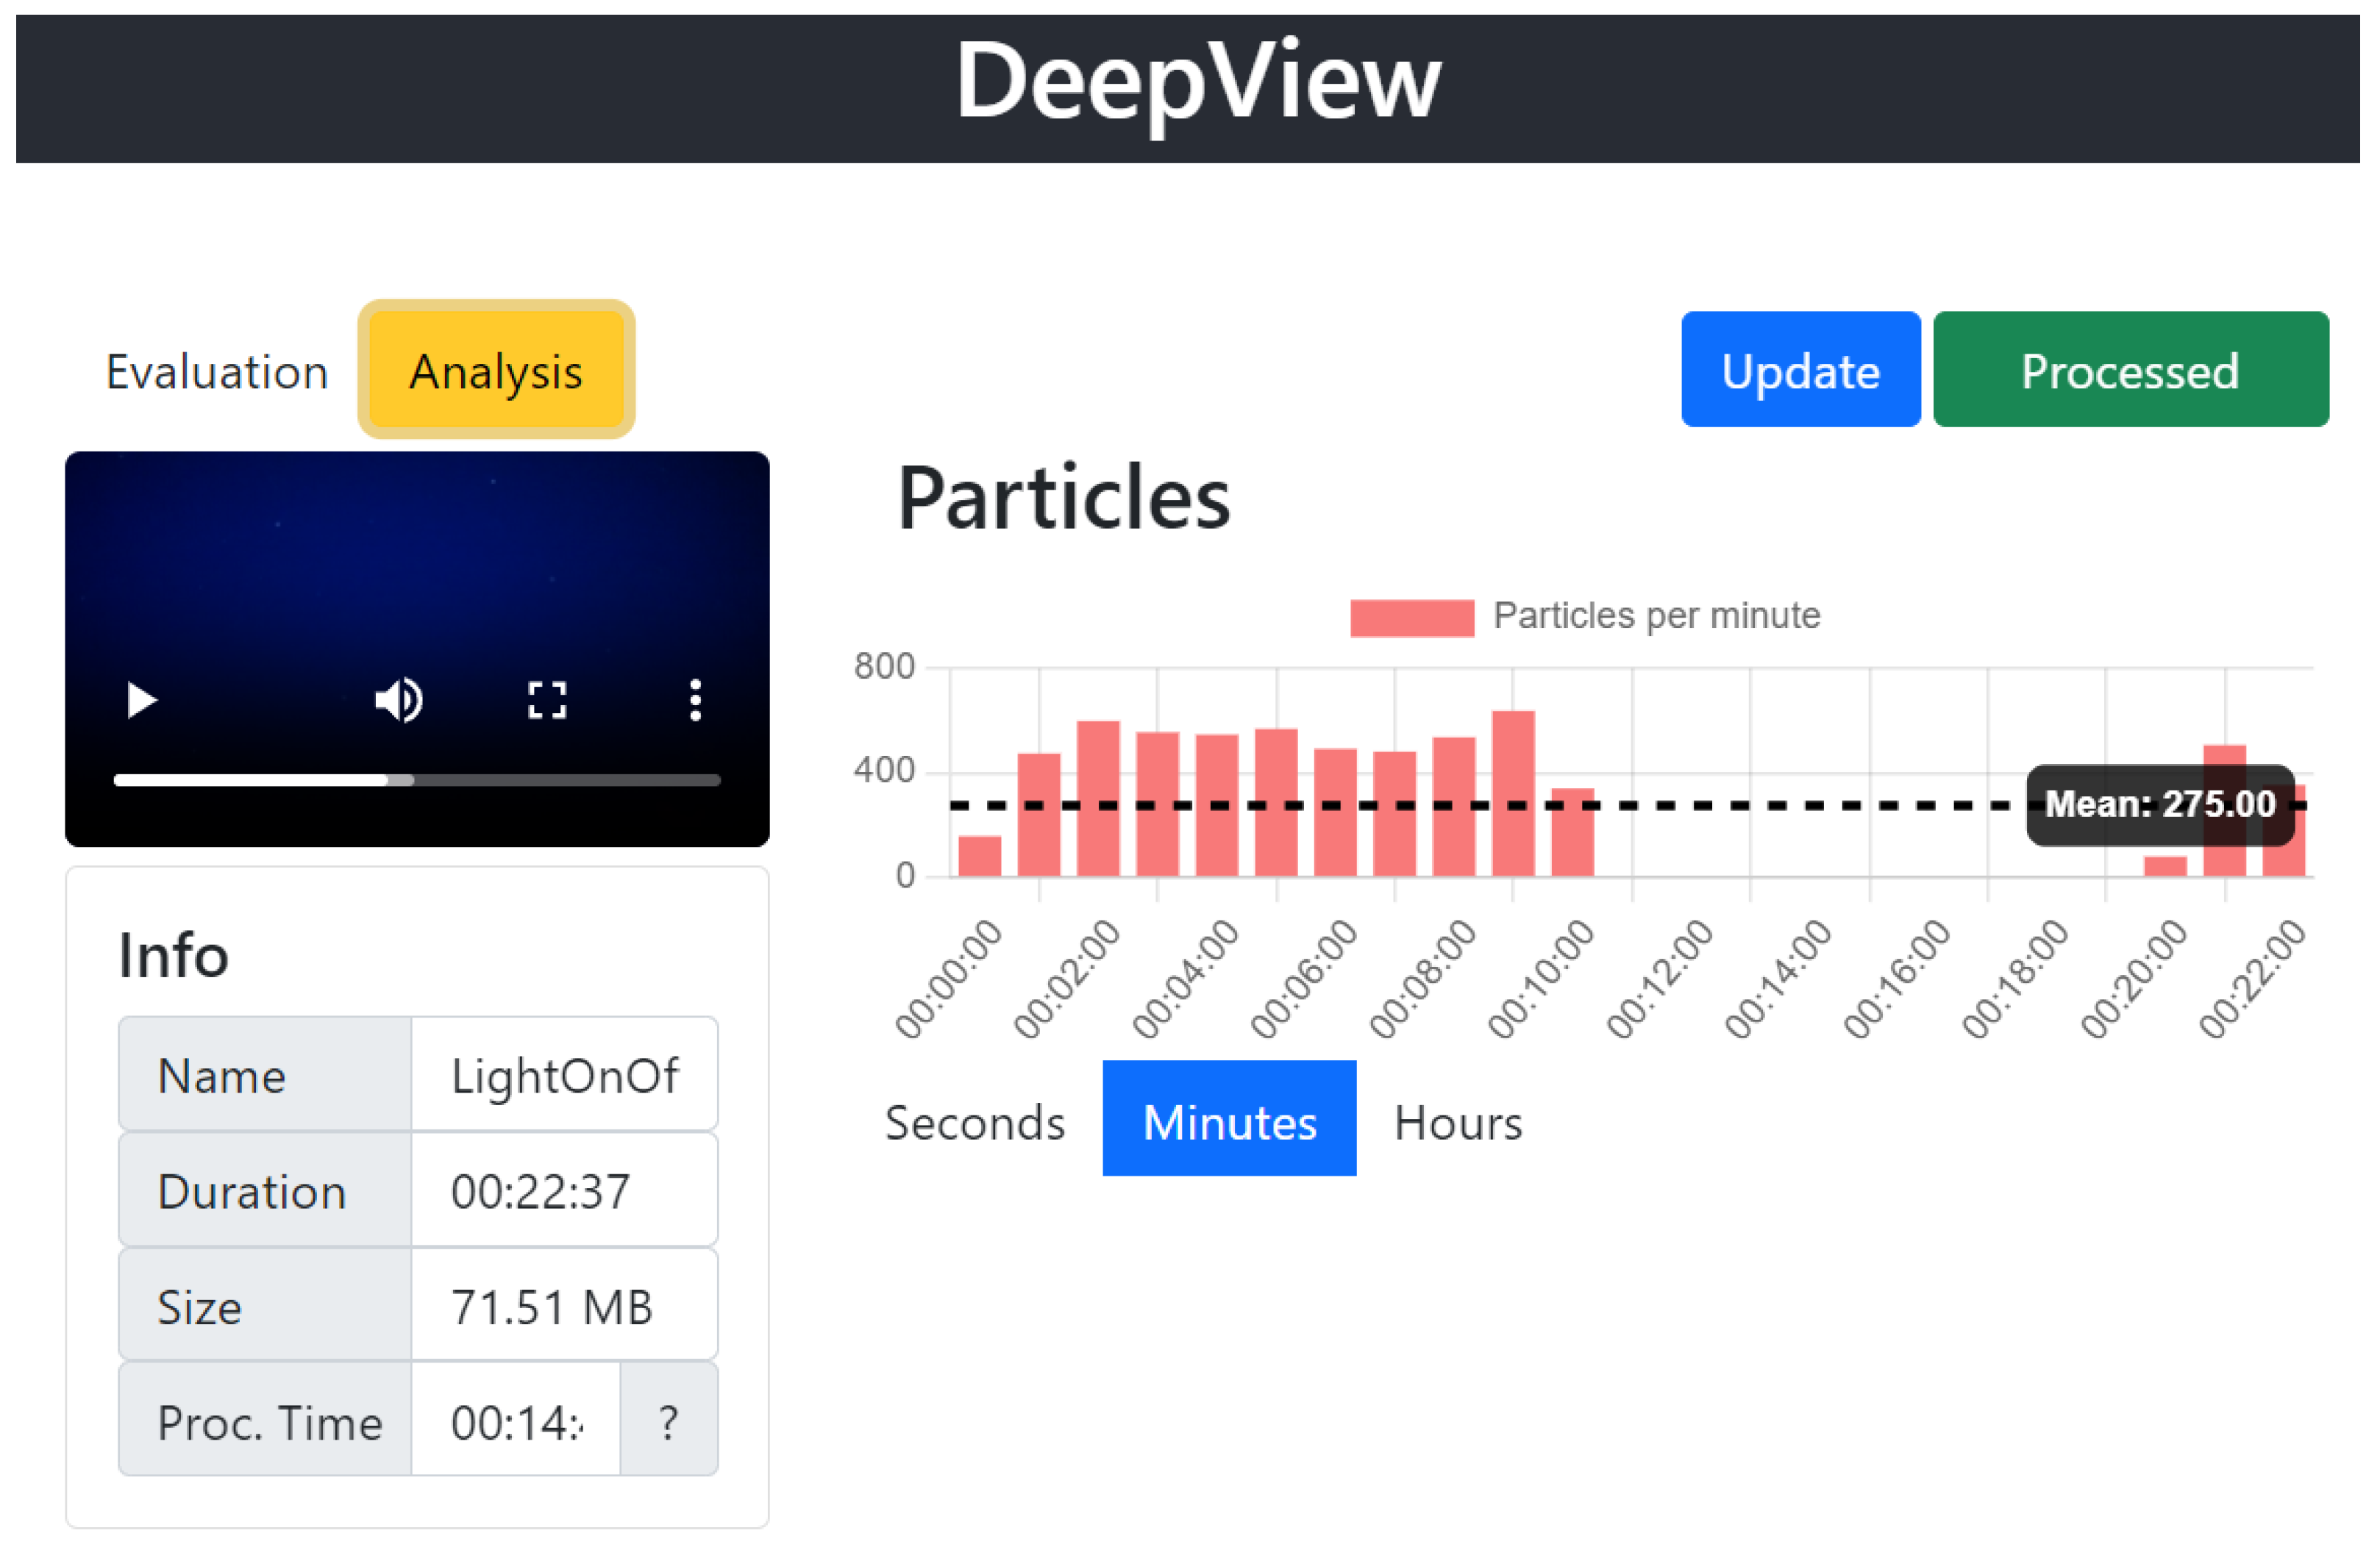
The evaluation/analysis page is specific to each video and allows the user to perform the main operations offered by the application: data analysis, parameter adjustment, video display, etc. This page consists of two working modes: evaluation mode, which allows the user to check the processing as well as adjust and save the processing parameters (
Figure 9), and analysis mode, which allows the user to graphically analyze the results obtained after processing the video in question. It consists of a graph representing the temporal density of items at different scales (
Figure 10).
3. Results
To verify the application’s functionality, underwater videos captured by the Delphis system within the DeepCom project were used. The dataset used is formed by 12 videos (approximately 4 h) acquired at 30 frames per second. The video resolution is 1080 pixels high by 1920 pixels wide.
Using the program in evaluation mode, a study was conducted on the effect of different parameters on detection capability. Random fragments of the database were used for this purpose, and automatic detections were compared with user visual detections. Finally, the use of the program in analysis mode on a large number of videos allowed us to detect the limitations of the program and environments/organisms that may lead to detection failures.
Although the results obtained are influenced by the type of camera, lighting, and other peculiarities of observations, they provide a good approximation of the potential of this application as well as its limitations.
In the reference case, dark noise correction does not seem to be necessary as it does not significantly affect item detection. This is probably because the Atlantic Ocean water acts as a coolant for the capsule containing the camera and cannot be extrapolated to other cameras or recording temperatures.
However, homogenizing the background image has proven to be very helpful in improving the program’s detection capability. The videos were captured using two lateral spotlights with 3 white LED lights equipped with a power of 1200 lumens each. We have observed that, under these lighting conditions, the threshold for subtracting the background from the image is reduced to a value, in grayscale, of around 15.
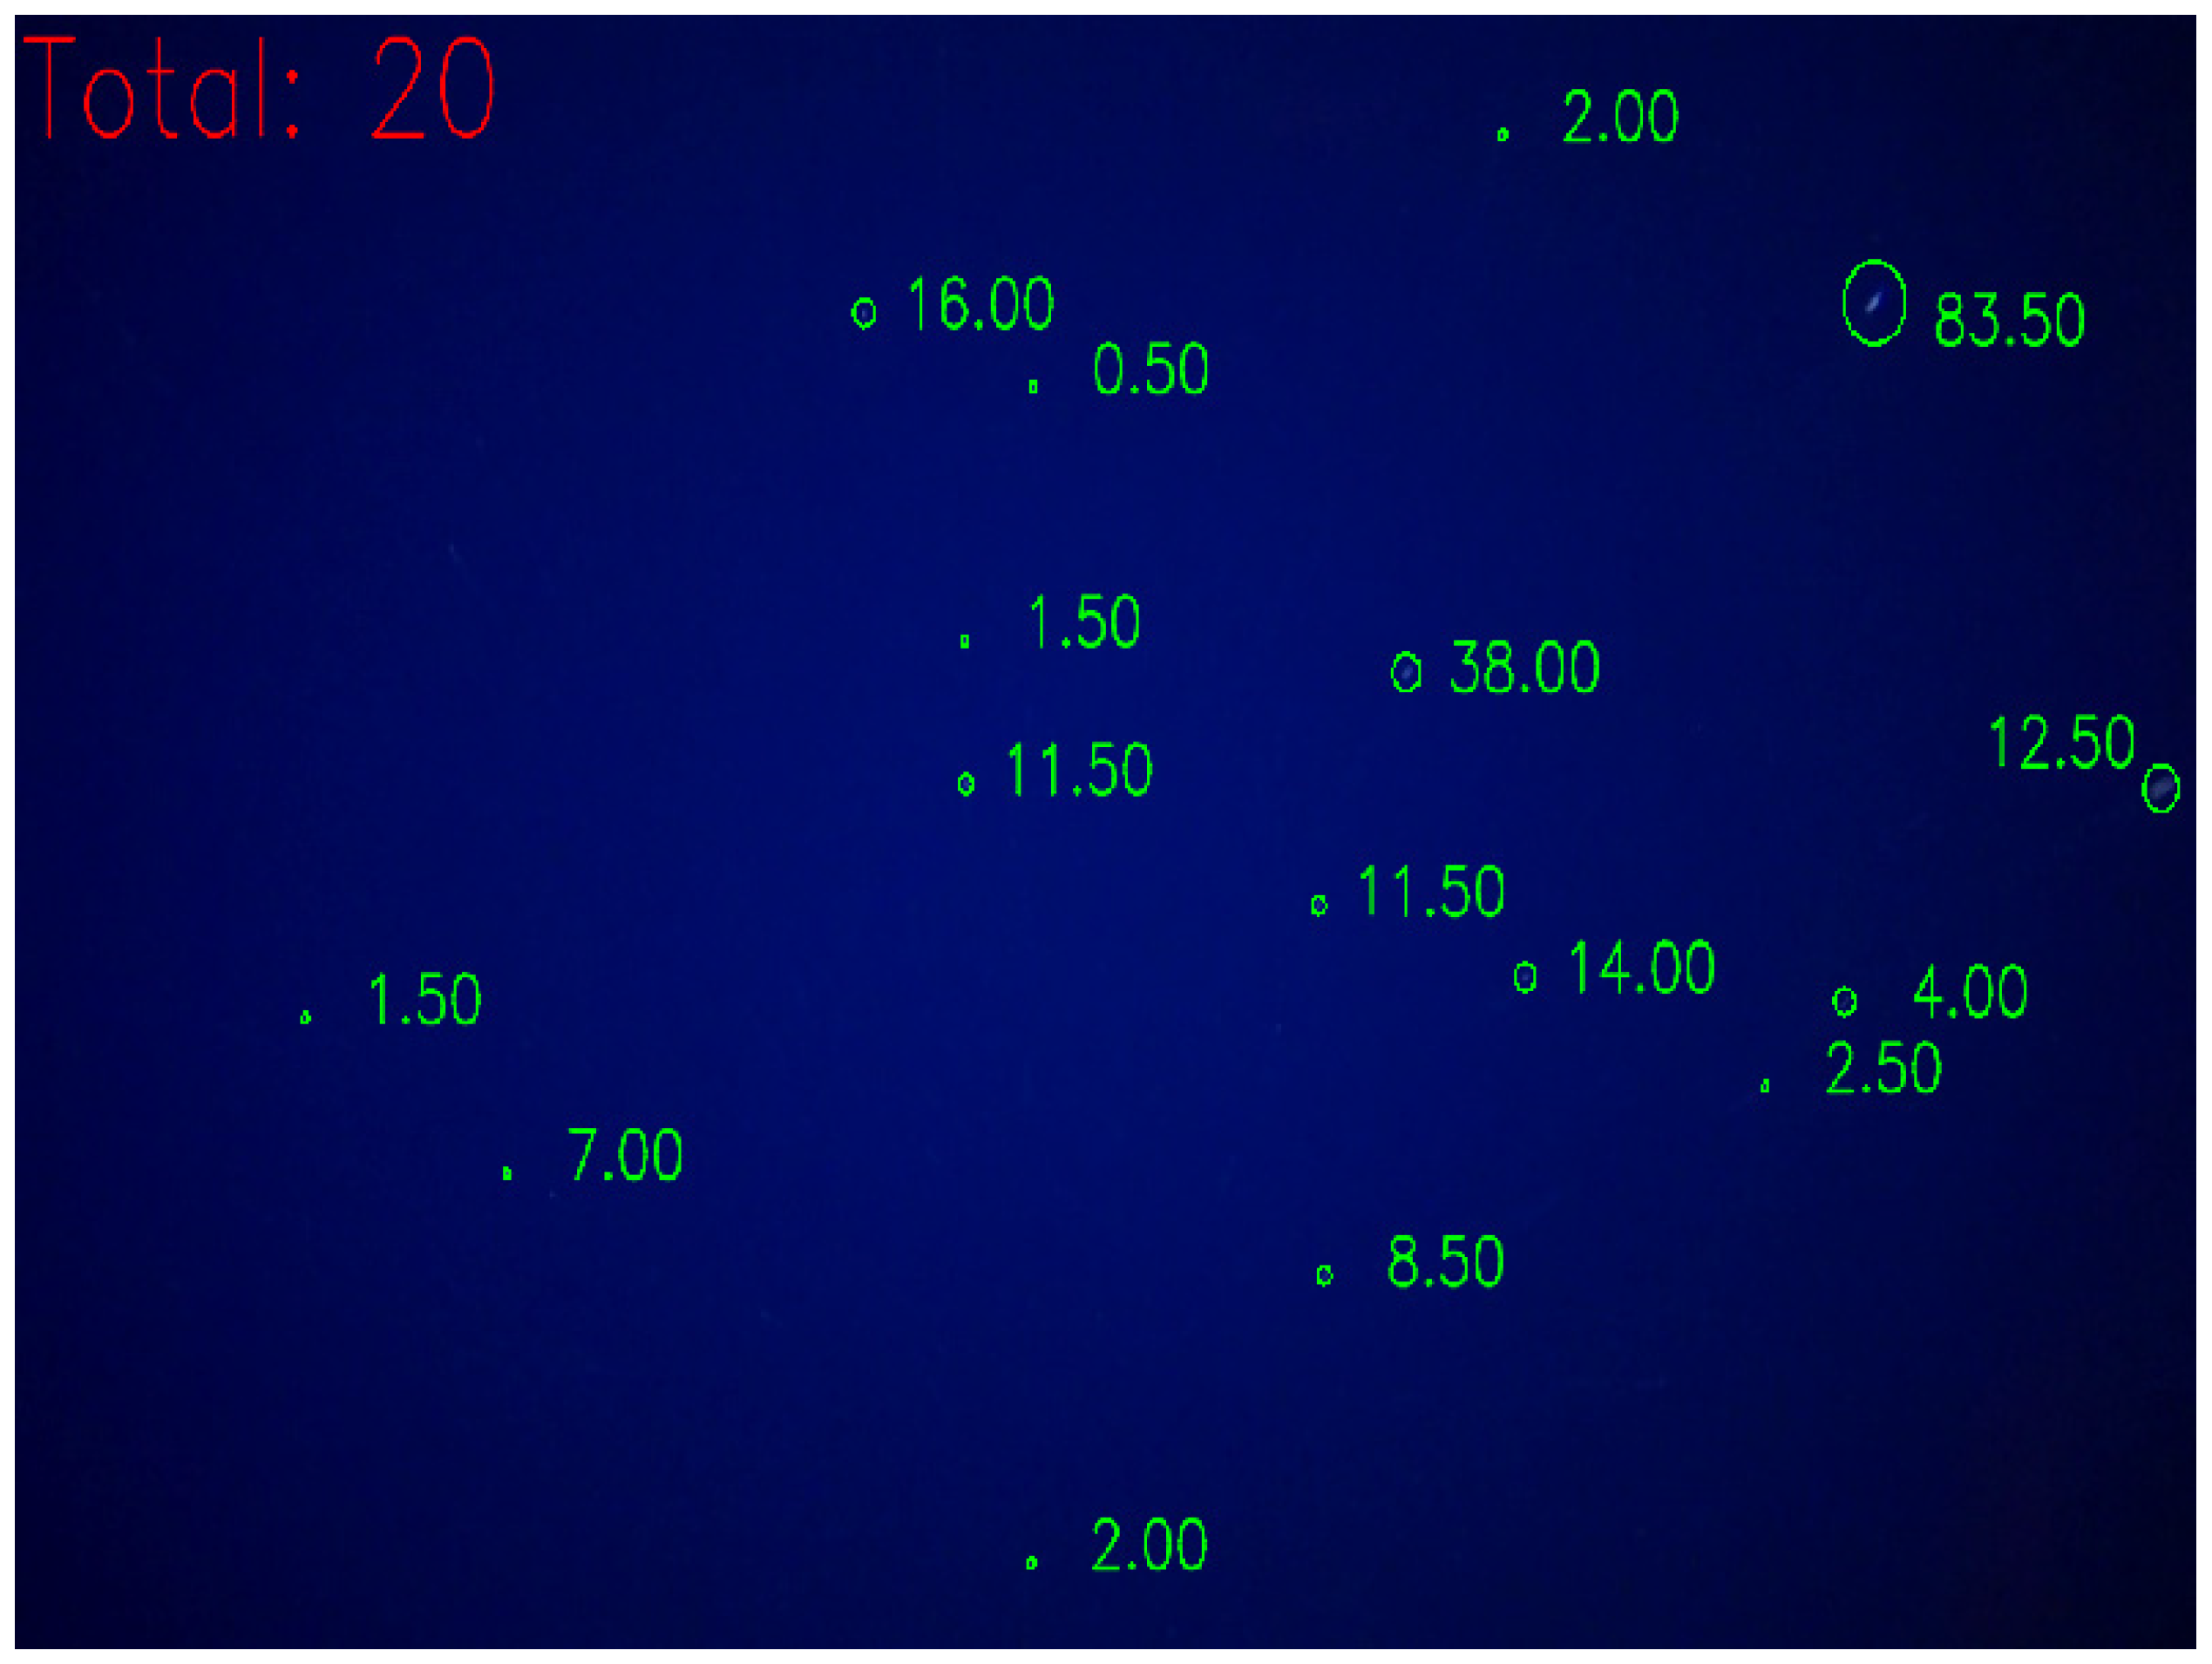
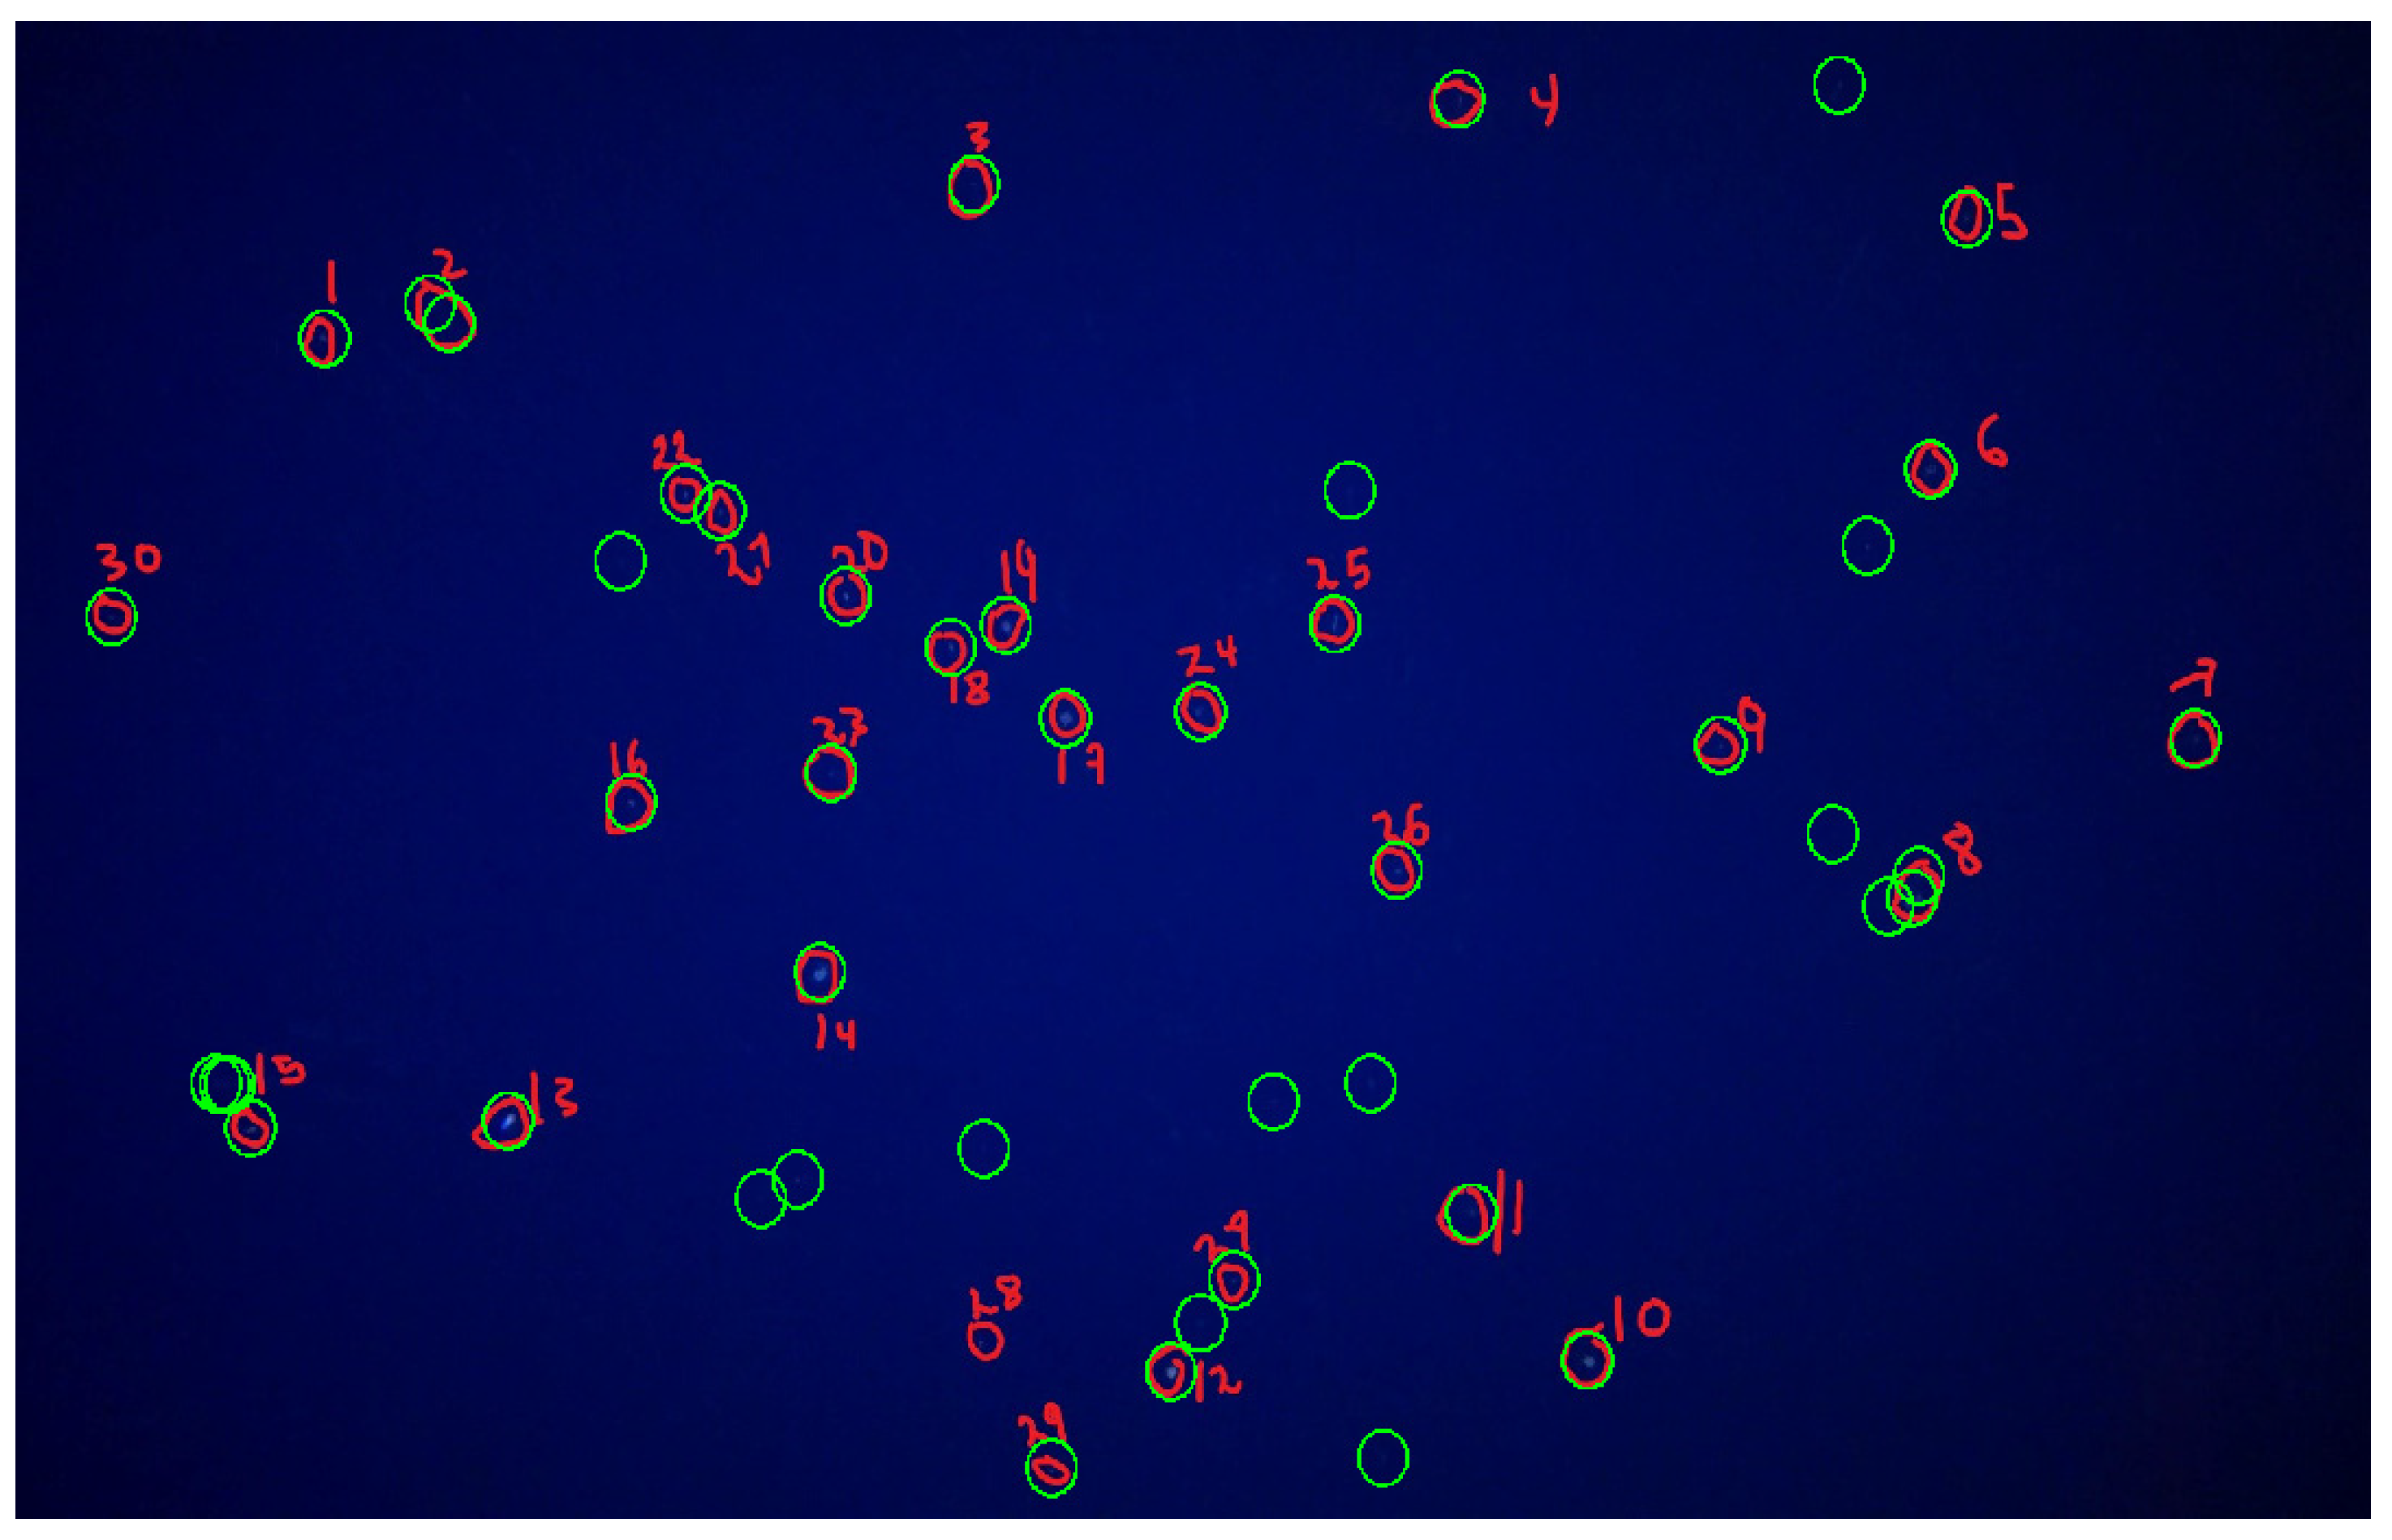
The program has proven to be highly reliable in the detection of small items, with a detection threshold even better than simple visual inspection. In fact, the software exhibits a higher detection capacity compared to the human eye. To quantify the minimum detectable contrast, visual detection was applied to random images, selecting 20 images in which the program detected more items than the observer (
Figure 11). To ensure that the program-detected items are not false positives, only those whose presence in the scene persists for at least 0.2 s (6 consecutive images) are chosen. Using the contour of these items, contrast is calculated on grayscale images as the ratio between the mean illumination value inside and around the item. The program was able to detect items with contrasts ranging from 0.8 to 1.2 that were not visible to the observers.
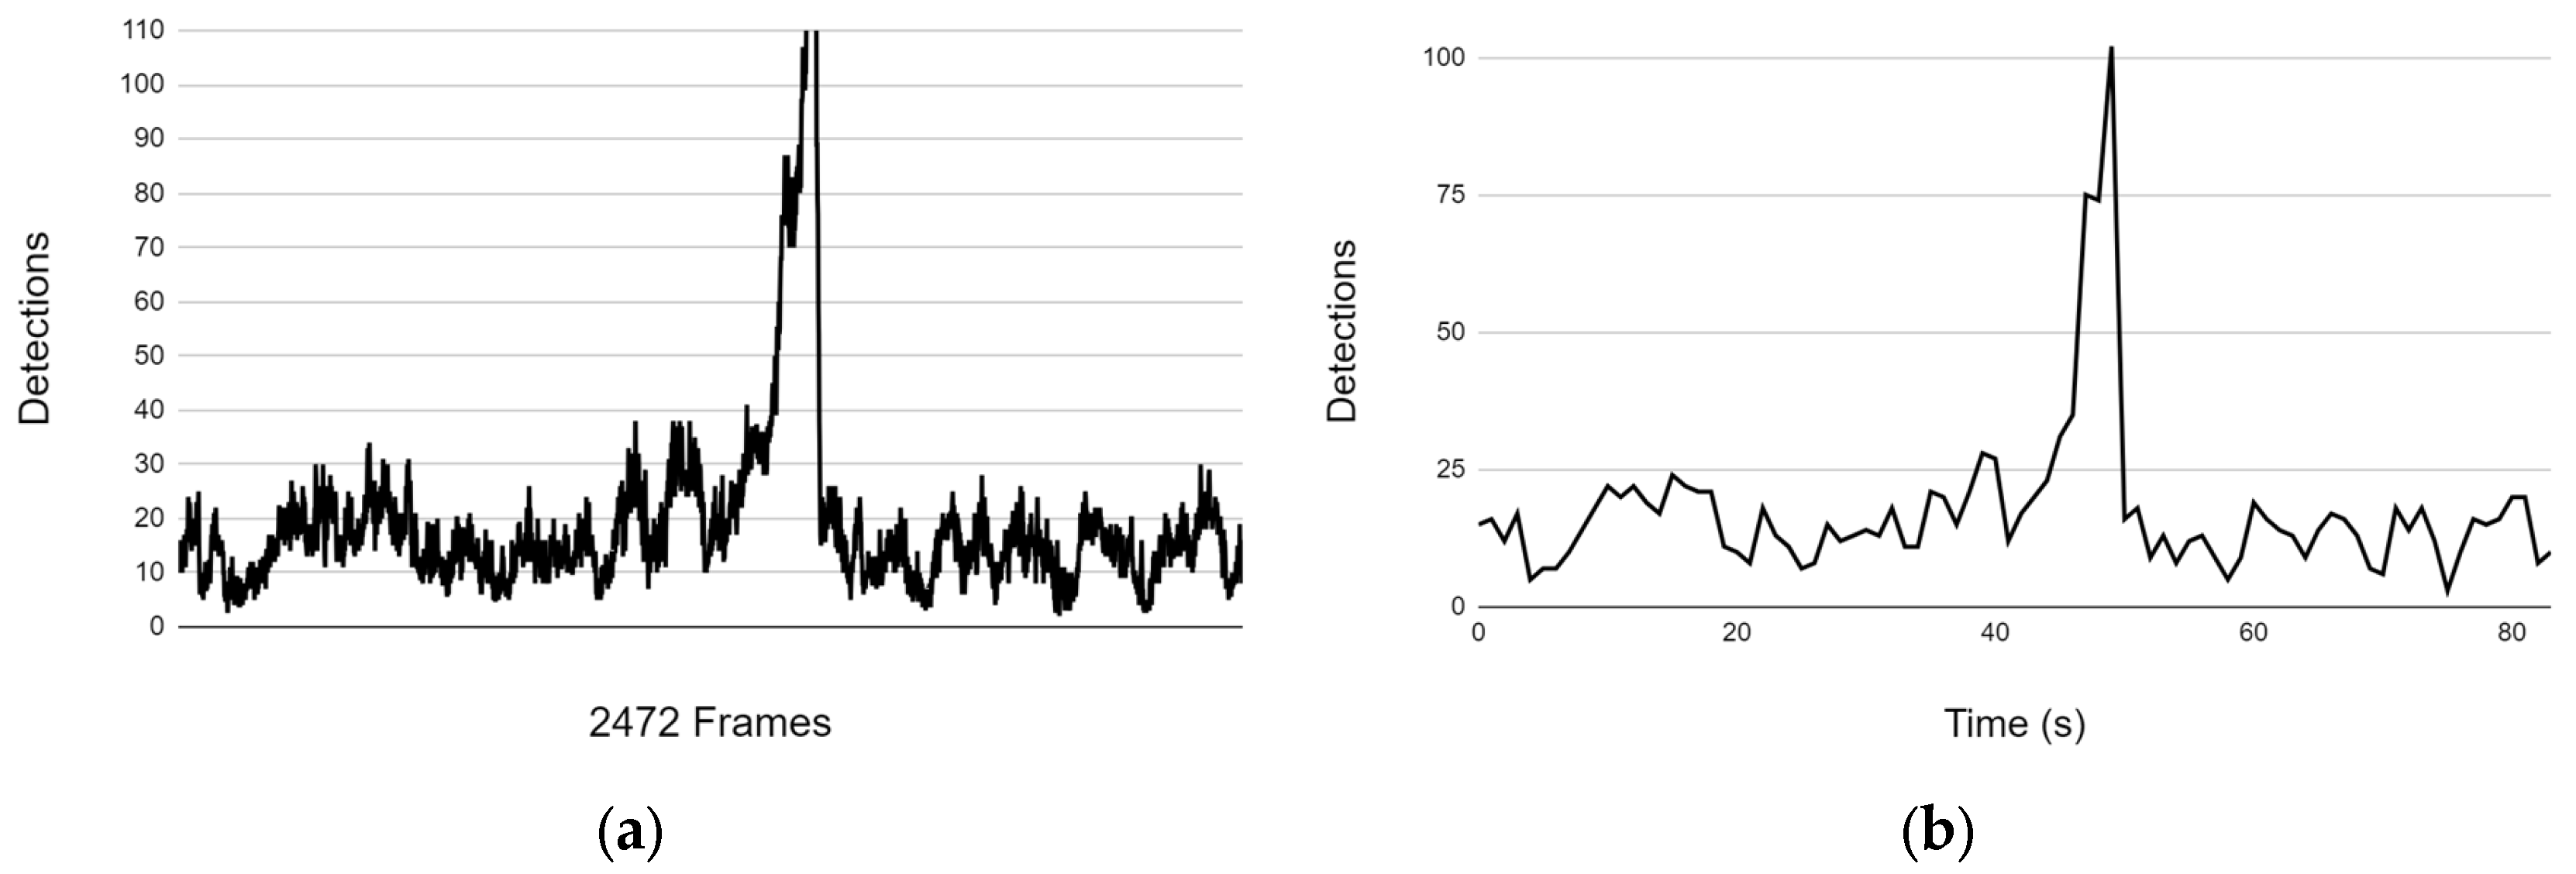
In order to evaluate the program’s reliability (false positive detections), the code was run in automatic mode on a dataset of videos. For this purpose, we have used 10 clips of 1–4 min duration extracted from videos recorded during the DeepCom project. The results exhibit high-frequency errors (
Figure 12a) characterized by fluctuations in the number of detections between consecutive images that stem from the numerical noise introduced by the detection process. However, these fluctuation detections do not impact the final program output, where the temporal resolution is reduced (minimum 0.5 s), resulting in the elimination of higher-frequency errors (
Figure 12b).
Sudden fluctuations in density detection can be easily discerned in temporal analysis (
Figure 12b) and can serve as indicators of false positives in the detection process. Through the examination of these instances, we can infer the origin of erroneous detections, in this case the appearance of a tunicate (
Figure 13a). In scenarios involving the presence of partially translucent or bioluminescent organisms, the program may erroneously identify a single large organism as a multitude of small items, for example, a siphonophore (
Figure 13b). In the reference case, their occurrence in the analyzed videos is sporadic, making manual removal straightforward thanks to the program’s automatic detection events tool included.
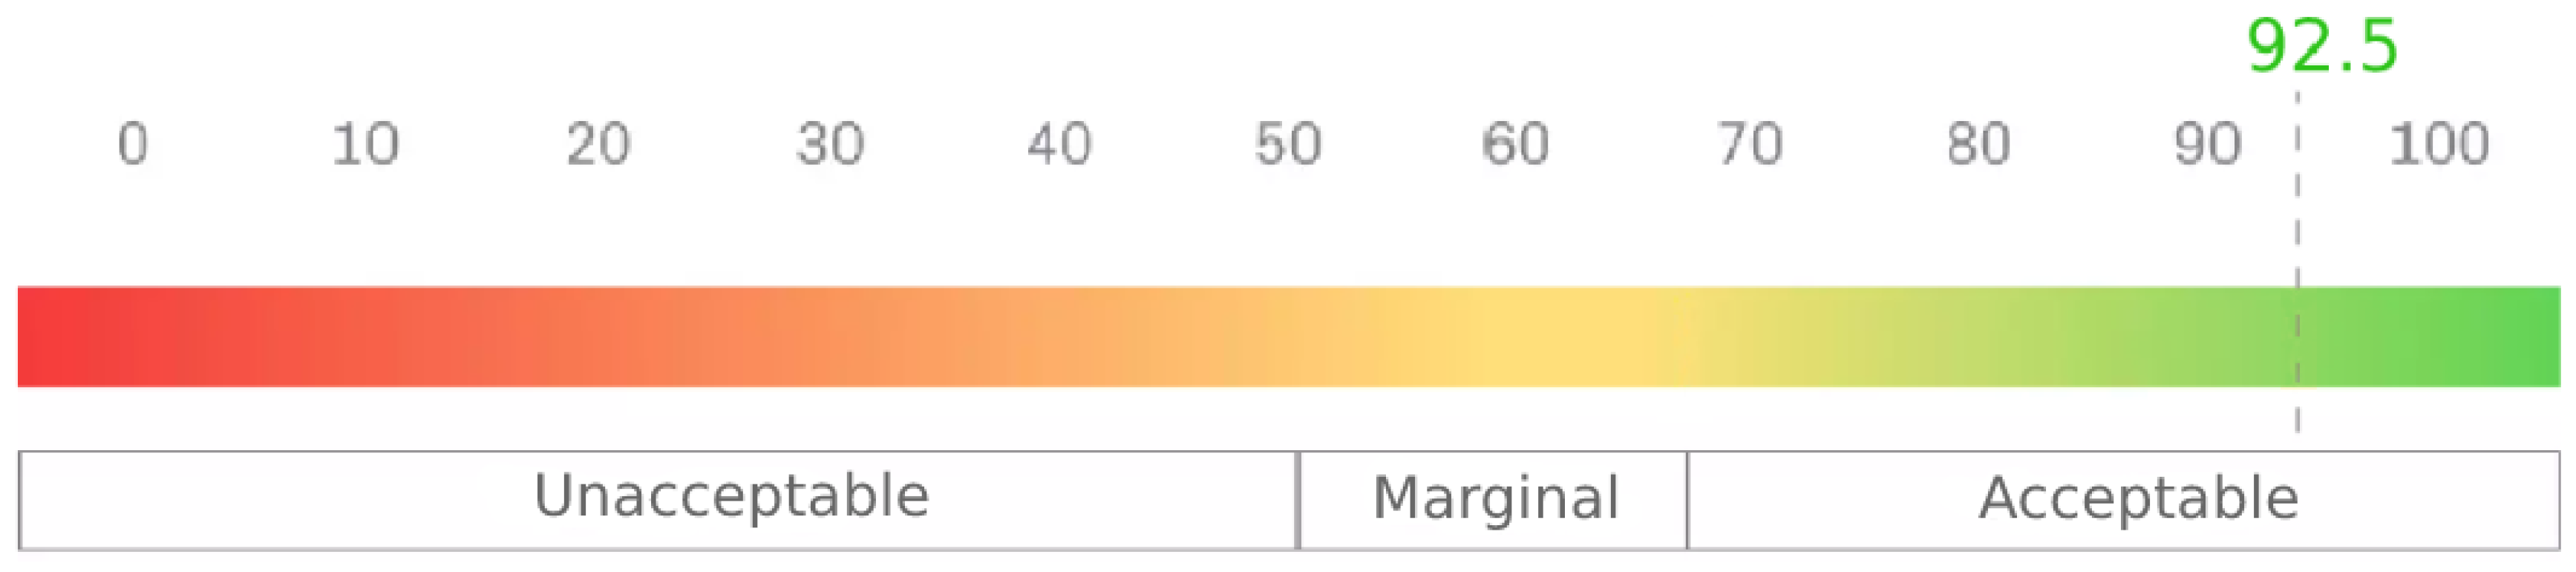
Finally, we evaluated the functionality of the developed application by testing it with end-users. A test was conducted to measure the functionality of the application and the ease with which individuals can use it to accomplish a specific task.
We have designed a testing procedure to measure the functionality of the application and the ease of utilizing the tool to accomplish their objectives. This test enables us to gauge the effectiveness, efficiency, and satisfaction levels of the application. Two sets of questions were prepared: the first one consists of specific questions about the application and its context, while the second one is the Usability Scale System [
39].
The results of this test are shown in
Table 1 and
Figure 14. It was concluded that the application was very well accepted by the end-user group.
During this process, user interaction led to the emergence of suggestions that were subsequently integrated to improve the application. These enhancements included features such as enabling users to specify the sections of a video for processing, providing the ability to download processing results in an Excel-compatible format or csv, and incorporating a comparison tool to facilitate the comparison of the effects of different parameters on the same video.
4. Conclusions
A complete server-based application has been developed to estimate biomass abundance through underwater image processing, accounting for small items and improving the previous processing methodology. The processing carried out by the system automatically detects small-sized organisms in each of the frames of the multimedia file, subjecting the image to a series of filters whose steps are specifically designed for this particular case. The program offers a user-friendly interface that empowers users to execute a wide array of tasks, such as data analysis, parameter fine-tuning, and video playback. Among its capabilities, it delivers a temporal analysis of object detection in videos for statistical insights. Furthermore, it maintains a chronological log of events, promptly notifying users of the presence of large organisms or sudden surges in detection counts. This feature serves as a valuable resource for conducting taxonomic post-analysis or manual verification as needed.
This software was developed for the estimation of relative biomass abundance in the DSL. However, its applicability can be broadened to other purposes. The new software, tailored to the unique characteristics of underwater images, represents a significant advancement over manual analysis of existing tools [
28].
Considering the disciplines of the users for whom the application is intended, mainly marine studies, a user manual was prepared with a detailed explanation and series of steps for the installation of the tool, as well as a detailed description of the elements of the graphic interface and its operation. This user manual is published in the git repository where the application is hosted.
In order to assess the accuracy and reliability of the automatic detection algorithm, videos from the DeepCom project have been used. Our software demonstrates good reliability in detecting small items, surpassing human visual inspection in certain cases. We evaluated its performance on a dataset of underwater videos, revealing occasional high-frequency errors that do not affect the final output due to the program’s temporal resolution reduction capability. The identification of sudden density fluctuations in temporal analysis aids in pinpointing potential false positives. These findings highlight the software’s effectiveness, particularly in scenarios involving partially translucent or bioluminescent organisms.
Finally, a concise usability study was conducted to assess the application’s effectiveness, efficiency, and user satisfaction. The findings revealed a high level of acceptance and satisfaction among users, highlighting their positive experience with the application. Furthermore, this study served as a valuable platform for gathering user feedback, suggestions, and insights for future enhancements and refinements of the application.


