Article

Comparative Study of the Anticancer Effects of Selenium Nanoparticles and Selenium Nanorods: Regulation of Ca2+ Signaling, ER Stress and Apoptosis

by
Elena G. Varlamova
1,*,
Ilya V. Baimler
2,
Sergey V. Gudkov
2 and
Egor A. Turovsky
1,*
1
Institute of Cell Biophysics of the Russian Academy of Sciences, Federal Research Center “Pushchino Scientific Center for Biological Research of the Russian Academy of Sciences”, 142290 Pushchino, Russia
2
Prokhorov General Physics Institute of the Russian Academy of Sciences, 119991 Moscow, Russia
*
Authors to whom correspondence should be addressed.
Appl. Sci. 2023, 13(19), 10763; https://doi.org/10.3390/app131910763
Submission received: 26 August 2023 / Revised: 19 September 2023 / Accepted: 26 September 2023 / Published: 27 September 2023
(This article belongs to the Special Issue Targeting Cellular Key Points in Drug Discovery)

Abstract

:
The anti-cancer effects of selenium sources are well known. Among other things, selenium has been shown to have a pleiotropic effect, causing cancer cell death without affecting the healthy cell’s viability, or, in the case of brain cells, has a cytoprotective effect. This feature of selenium determined its use in medicine and its use as part of dietary supplements. In recent years, selenium in the form of nanoparticles has received increased attention. Selenium nanoparticles also have anti-cancer effects, and their use appears to be more effective at significantly lower doses compared to other sources of selenium. The shape and size of nanoparticles largely affect the efficiency of nanoselenium application. We obtained two different types of selenium nanoparticles via the laser ablation technique—spherical selenium nanoparticles (SeNPs) about 100 nm in diameter and grown selenium nanorods (SeNrs) about 1 μm long and about 100 nm thick. We compared the anti-cancer efficacy of these two types of selenium nanoparticles using inhibitory analysis, PCR analysis and fluorescence microscopy. It turned out that both types of nanoparticles with high efficiency dose-dependently activate apoptosis in the human glioblastoma cell line A-172, as the most aggressive type of brain tumor. Apoptosis induction was determined not only by the concentration of nanoparticles, but also by the time. It was shown that SeNrs induce the process of apoptosis in glioblastoma cells more efficiently during 24 h of exposure and their effect is enhanced after 48 h without activation of necrosis, whereas the use of spherical SeNPs after 48 h of exposure can cause necrosis in some glioblastoma cells. It has been shown that Ca2+ signals of glioblastoma cells are significantly different for SeNPs and SeNrs. SeNPs cause a dose-dependent transient increase in the number of Ca2+ ions in the cell cytosol ([Ca2+]i), while SeNrs cause a slow rise in [Ca2+]i reaching a new stationary level, which may determine the cytotoxic effects of nanoparticles. It turned out that SeNPs and SeNrs cause depletion of the Ca2+ depot of the endoplasmic reticulum and ER-stress, which correlates with increased expression of genes encoding proapoptotic proteins. In our study, it was found that SeNPs do not activate the Ca2+ signaling system of healthy L-929 mouse fibroblast cells, while SeNrs activate a moderate slow growth in [Ca2+]i. That fact could indicate a lower selectivity of the SeNrs action.

1. Introduction

As the most common disease in the world, cancer leads to very high mortality and disability in the population. On average, about 18 million new cases of cancer and 9 million deaths caused by cancer are registered annually in the world. An estimated USD 150 billion was spent on cancer in 2020 [1,2]. Modern methods of treating oncological diseases and their consequences involve surgery, chemotherapy, radiotherapy etc. However, these methods have a number of side effects—toxic effects on healthy organs and tissues.
A wide range of metabolic reactions in the body are regulated by selenium (Se), which is a vital trace element [3,4]. Selenium is present in selenostatins and at least 25 human selenoproteins. Selenium, as well as its sources, are participating in the suppression of a large number of diseases. Such diseases are cardiovascular, neurodegenerative and viral and, especially, involve carcinogenesis [5,6]. A large number of dietary supplements are produced and available for purchase, including sources of selenium, and are capable of maintaining an optimal level of selenium in the body. Selenium nanoparticles can be used as a dietary supplement, since their effects are realized in a lower concentration range compared to other sources of selenium. The biological properties of selenium nanoparticles include the ability to stimulate the immune response to cancer cells, induce mitochondria-mediated cell death, inhibit the growth of microorganisms and exhibit anti-tumor activity in vitro and in vivo [7,8,9].
For the synthesis of selenium nanostructures, a wide variety of methods could be utilized, such as hydrothermal methods, electrodeposition techniques, physical adsorption by gas-phase diffusion, sonochemical synthesis, laser ablation in liquid, etc. [10,11,12]. Nanostructures of various shapes—trigonal, nanorods, nanoribbons, hexagonal prism, nanoplates, nanotubes, and spheres—are obtained from selenium [13,14,15,16]. The production of 1D selenium nanorods using various chemical polymers as shaping agents has been commonly reported [17]; nevertheless, the selenium nanorods obtained in this way become unsuitable for use in biological systems. The shape of nanoparticles can influence biological effects. It has been shown that cerium nanorods are able to circulate in the blood for a longer time. It should be noted that the degradation of nanorods occurs much faster than that of spherical nanoparticles due to their larger specific surface area. Moreover, nanorods are less prone to aggregation [18].
Due to the fact that nanoparticles in the form of nanorods are able to remain in the organism for longer periods of time and release large concentrations of selenium into cells, there is no doubt that the mechanism of action of selenium in the form of nanorods needs to be created and studied. We have created a technology for the production of selenium nanorods that are not toxic to healthy cells, which is characterized by low cost and the possibility of its adaptation to the industrial production of nanoparticles. The comparison of anti-tumor effectiveness of spherical selenium nanoparticles (SeNPs) and selenium nanorods (SeNrs) was the main goal of this study. At the same time, in this research we also focus on the differences in the activation of the Ca2+ signaling system in human glioblastoma A-172 cells and mouse fibroblasts L-929 and the correlation of an elevated level of calcium ions in the cytosol ([Ca2+]i) with endoplasmic reticulum stress and the induction of apoptosis.

2. Materials and Methods

2.1. Synthesis and Morphology of Selenium Nanorods

To obtain SeNrs, the technique of laser ablation of a bulk selenium followed by laser fragmentation of a colloid of SeNPs in propanol-2 was used. Then the colloidal liquid with selenium nanorods was replaced with highly purified water with a resistivity of 18.6 MΩcm.
The laser ablation procedure for obtaining spherical selenium particles took place in several stages. Initially, a polished selenium target was attached to the bottom of the glass cuvette, then chemically pure isopropanol was poured into the cuvette. The volume of the liquid was chosen so that the thickness of the fluid between the liquid surface and the target was approximately 2–3 mm. Then the laser source with the following parameters λ = 1064 nm, f = 1 kHz, τ = 4 ns, Ep = 2 mJ irradiated the selenium target. During irradiation, the beam moved along the surface of the Se target using a galvanomechanical scanner LScanH (Ateko-TM, Moscow, Russia) and an F-Theta lens. The trajectory of the beam consisted of several parallel lines written in a square. The typical ablation time was 30 min.
The second stage of colloidal irradiation was carried out without the use of a selenium target. Selenium nanoparticles obtained as a result of ablation in propanol-2 were repeatedly irradiated with laser radiation with the same parameters for an hour.
The liquid in the colloid of selenium nanoparticles was replaced by deionized water after several stages of particle settling in a centrifuge and solvent replacement. The transfer of selenium nanoparticles from propanol-2 to deionized water took place in several stages.
Selenium nanorods were initially precipitated by centrifuge LMC-4200 (Biosan, Riga, Latvia). The sedimentation of nanoparticles in the centrifuge was carried out for 15 min at a speed of 4200 rpm, rotor radius 0.12 m, Relative Centrifugal Force ~2400 g. After centrifugation of the solution, propanol-2 was replaced with a carbon tetrachloride (CCl4). Then the colloid was exposed to ultrasound inside an ultrasonic bath (P = 20 W) for 10 min. Next, the colloid liquid was replaced sequentially with dimethyl sulfoxide (C2H6OS), chloroform (CHCl3) and acetone (C3H6O) using the described centrifugation and ultrasonic treatment procedures at each step. After another colloid centrifugation procedure, acetone was replaced by deionized water.
A possible mechanism for the formation of selenium nanorods during fragmentation is shown in Figure 1A. As a result of the ablation of a solid target of selenium nanoparticles, large nanoparticles (100–200 nm) are present in the colloid. As a result of laser fragmentation, the size of nanoparticles decreases; along with this, the concentration of nanoparticles increases. In turn, an increasing concentration of nanoparticles in a colloid can lead to an increase in the rate of aggregation processes, leading to the formation of elongated nanorods of nanoparticles. As a result of laser heating and redistribution of the surface energy, the nanoparticles melt with each other, forming nanorods.
A Libra 200 FE HR transmission electron microscope (Carl Zeiss, Jena, Germany) was used to obtain TEM images of the particles and study its morphology. Microscopic grids made of Au were used during SeNPs preparation for TEM microscopy. It follows from the transmission microscope images that selenium nanoparticles have the shape of nanorods (Figure 1B,C). To study the size distribution of nanoparticles and determine the concentration of nanoparticles, an analytical centrifuge DC24000 (CPS Instruments, Oosterhout, Netherlands) and a Zetasizer Ultra (Malvern Panalytical, Malvern, UK) were used. The size distribution of SeNrs is bimodal (Figure 1D). The largest maximum of the distribution is located at approximately 160 nm, the peak half-width is 100 nm and another peak of the nanoparticle size distribution is at 1375 nm; the half-width of this peak is approximately 1000 nm. The distribution of the obtained selenium nanoparticles depending on their volume shows that most of the volume of NPs is located at the nanoparticle size of about 1800 nm (Figure 1E). The zeta potential of the resulting nanorods is approximately −28 mV.

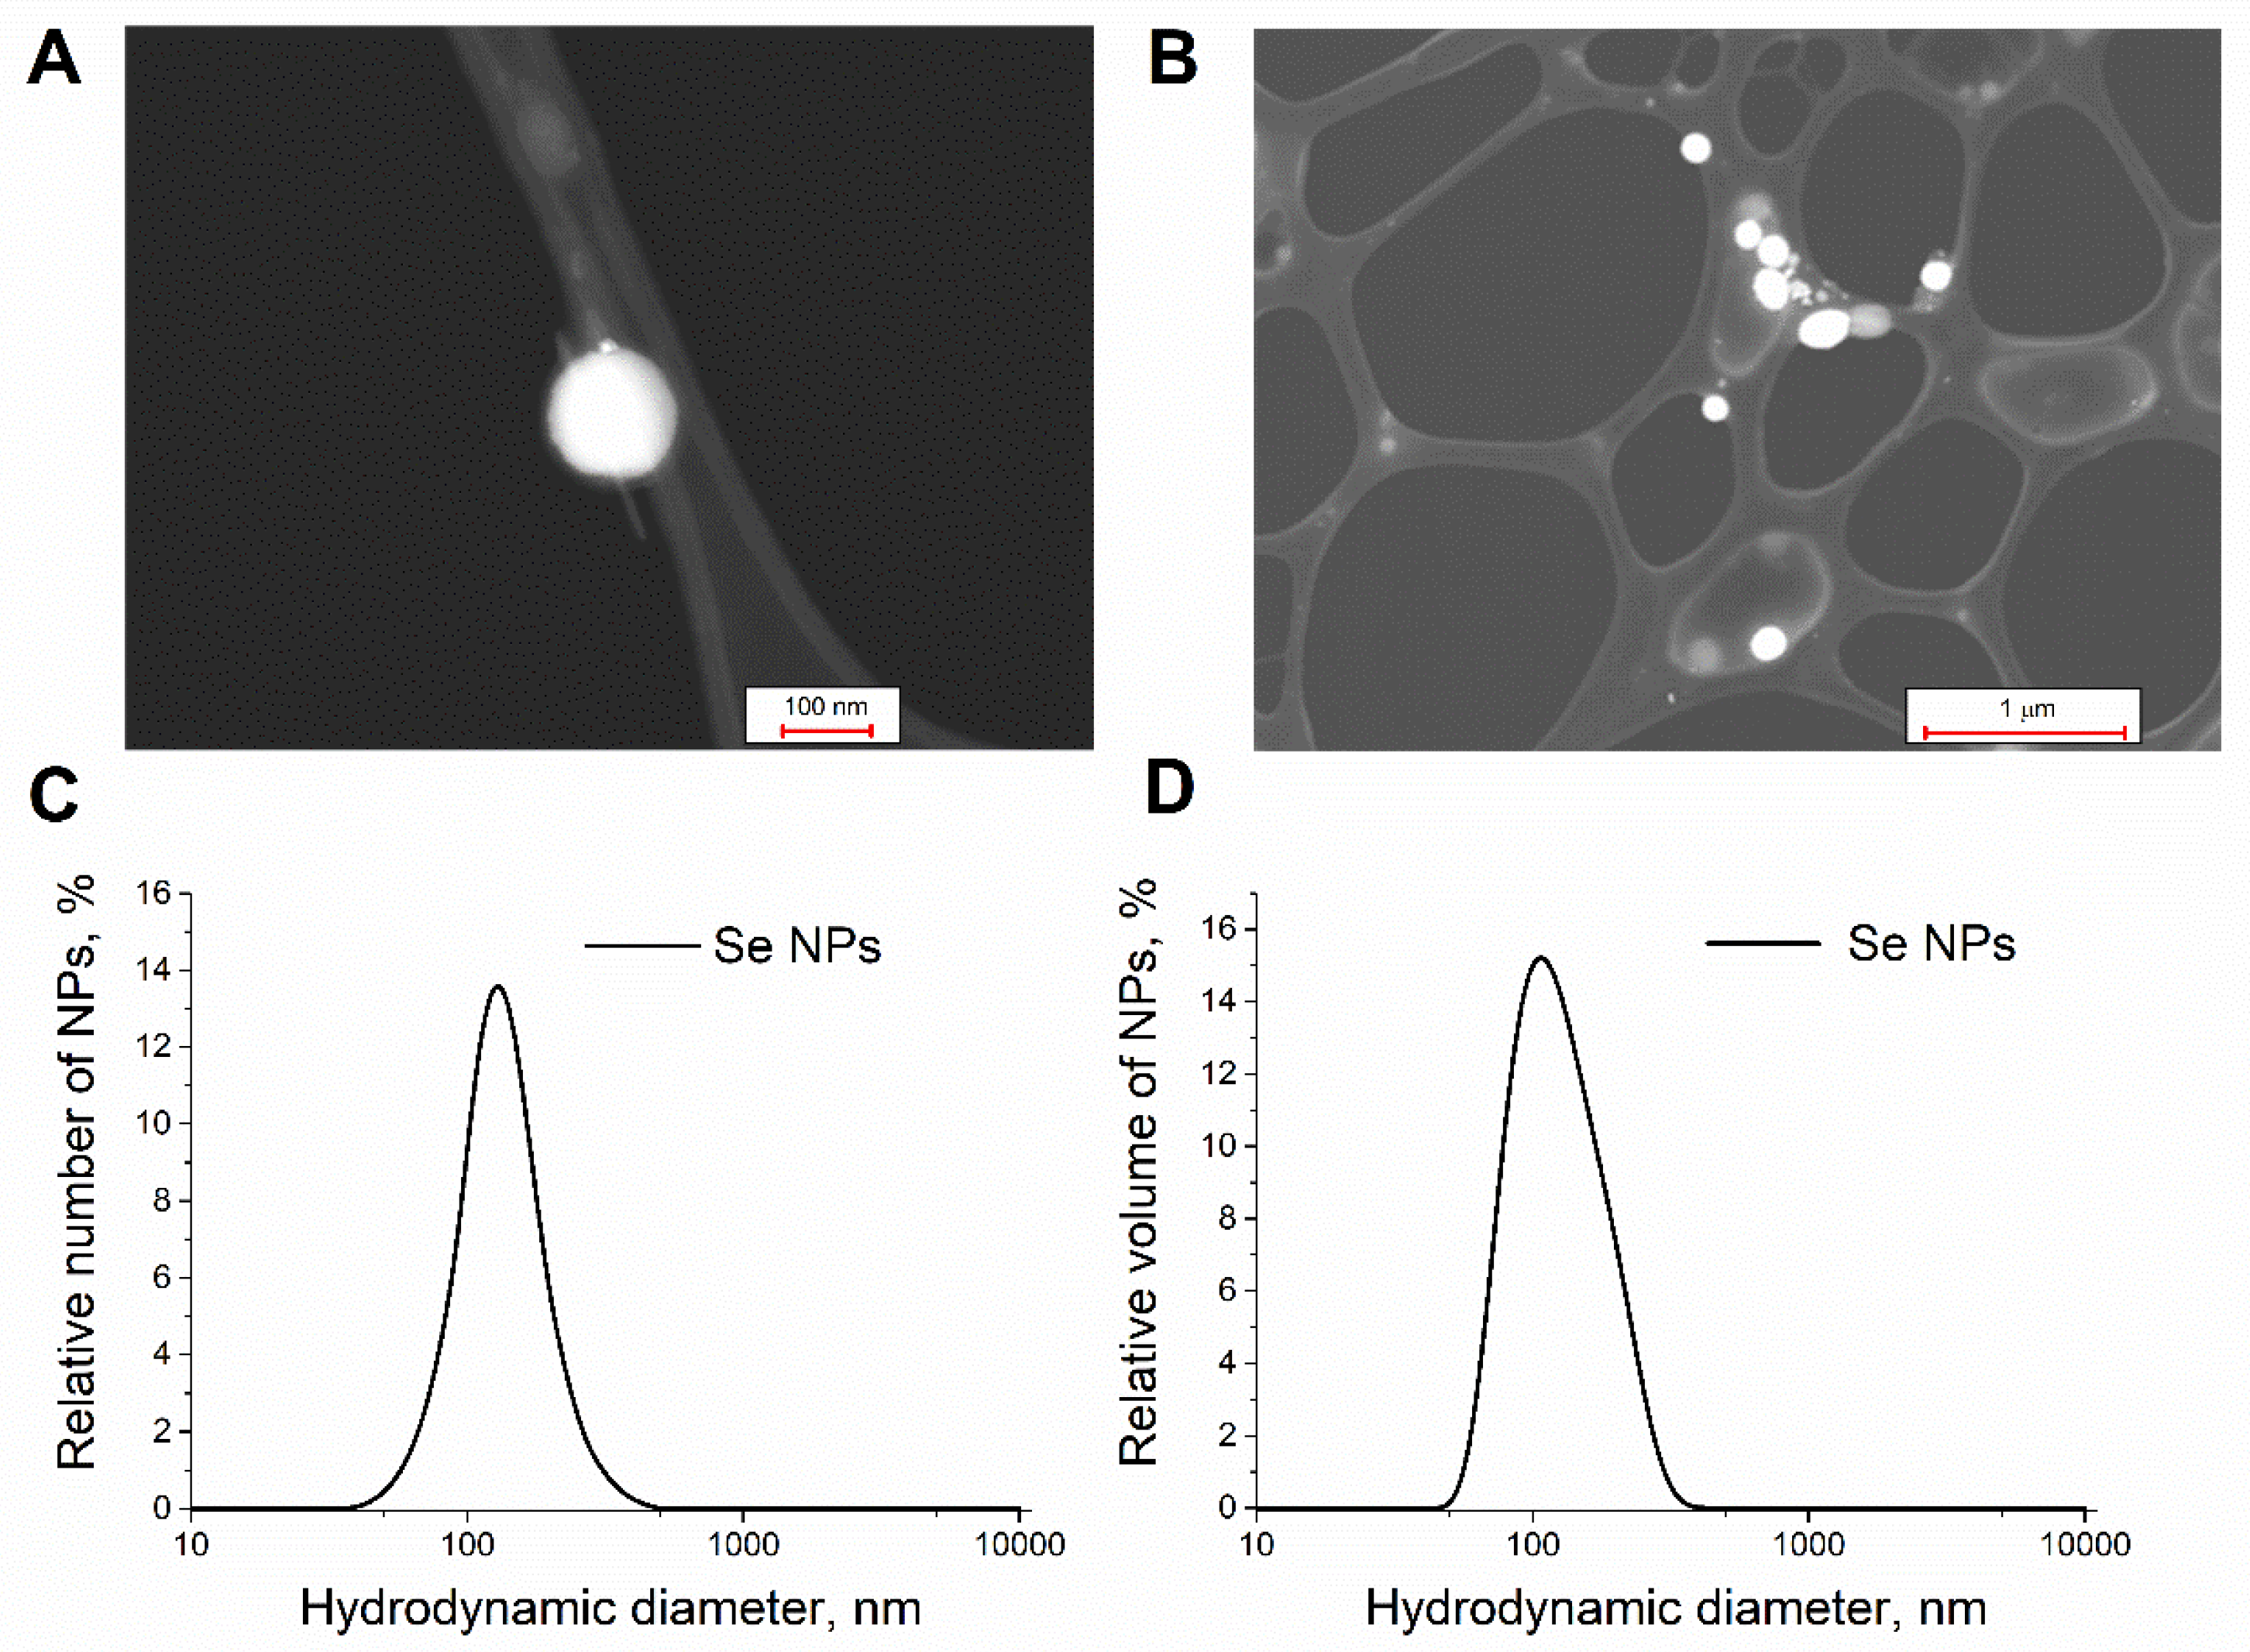
2.2. Synthesis and Morphology of Selenium Nanoparticles

To obtain spherical SeNPs, the laser ablation in liquid was used. The process of irradiation of a polished selenium plate was carried out in a flow cell. The cell with a selenium plate was filled with deionized water. The volume of deionized water used was about 40 mL. A fiber ytterbium laser with a wavelength of 1064 nm, pulse duration of 100 ns, frequency of 20 kHz, average power of 20 W and pulse energy of 1 mJ was used as a laser radiation source. In the same way as it was described above in the case of selenium nanorods, laser radiation traveled over the target surface. The described approach is necessary to maximize the production rate of selenium nanoparticles during ablation. The typical time of laser ablation was about 20–25 min.
Using TEM images, it was found that the obtained nanoparticles have a spherical shape; the size of the SeNPs is approximately 90–150 nm (Figure 2A,B). The nanoparticle size data obtained from TEM are consistent with the size distributions obtained on the CPS analytical centrifuge and DLS particle analyzer. The largest number of SeNP in the distribution has a size of about 130 nm (Figure 2C). The largest share in the volume distribution falls on particles with a diameter of 110 mm (Figure 2D). The aggregation of the nanoparticles did not occur within a few days of their receipt. The zeta potential of the Se nanoparticles obtained by laser ablation was approximately −30 mV.

2.3. Cell Culture

Human brain glioblastoma cell line A-172 and mouse fibroblast cell line L-929 were acquired from ATCC (Manassas, VA, USA). For experiments, cell cultures were grown on round coverslips during 48 h after seeding until 80–95% confluence was reached. Cell lines were cultured in DMEM medium supplemented with an antibiotic (gentamicin) and 10% fetal bovine serum. Cell lines were tested for mycoplasma contamination every 3 months using the Drexler and Uphoff method [19]. Mycoplasma contamination was not registered.

2.4. Assessment of Cell Viability

The necrosis and apoptosis induction were studied by staining cell cultures with 1 μM of propidium iodide (PI) and 1 μM of Hoechst 33342 (HO342). Hoechst 33342 stains the chromatin of viable cells, but its fluorescence is 3–4 times higher in cells with apoptosis, which is explained by chromatin condensation. Propidium iodide stains the nuclei of necrotic cells, but does not penetrate into viable cells [20,21]. PI and Hoechst 33342 fluorescence was recorded using an Axio Observer Z1 inverted fluorescent microscope supplied with Hamamatsu ORCA-Flash 2.8 high-speed monochrome CCD-camera. The illuminator Lambda DG-4 Plus (Sutter Instruments, Novato, CA, USA) was used as an excitation source. Probe fluorescence was excited and registered using Filter Set 01 with the excitation filter BP 365/12, beam splitter FT395, emission filter LP 397; Filter Set 20 with the excitation filter BP 546/12, beam splitter FT560, emission filter BP 575–640. Objective HCX PL APO 20.0 × 0.70 IMM UV, refraction index 1.52 was used.

2.5. Fluorescent Ca2+ Imaging

Cytosolic calcium ions concentration ([Ca2+]i) were measured by fluorescence microscopy (Axiovert 200 M with a high-speed monochrome CCD-camera AxioCam HSm with a high-speed light filter replacing system, Ludl MAC5000) using Fura-2/AM. A detailed description can be found in ref. [22].

2.6. Extraction of RNA and Real-Time Polymerase Chain Reaction (RT-qPCR)

Isolation of total RNA from cortical cultures was performed using the MagMAX mirVana kit (Thermo Fisher Scientific, Waltham, MA, USA). The quality of the obtained RNA was determined using electrophoresis. NanoDrop 1000c spectrophotometer was used to determine the RNA concentration. Reverse transcription was performed using the RevertAid H Minus First Strand kit (Thermo Fisher Scientific). Amplification was performed using the DTlite Real-Time PCR System (DNA-Technology, Moscow, Russia) in a 25 µL mixture containing 5 µL of qPCRmix-HS SYBR (Evrogen, Moscow, Russia, Cat. #PK147L), 1 µL (0.2 µM) of the primer solution, 18 µL water (RNase-free) and 1 µL cDNA. The amplification process details are described in ref. [23]. The sequences of all primers used in real-time PCR are shown in Table 1 and Table 2.

3. Results

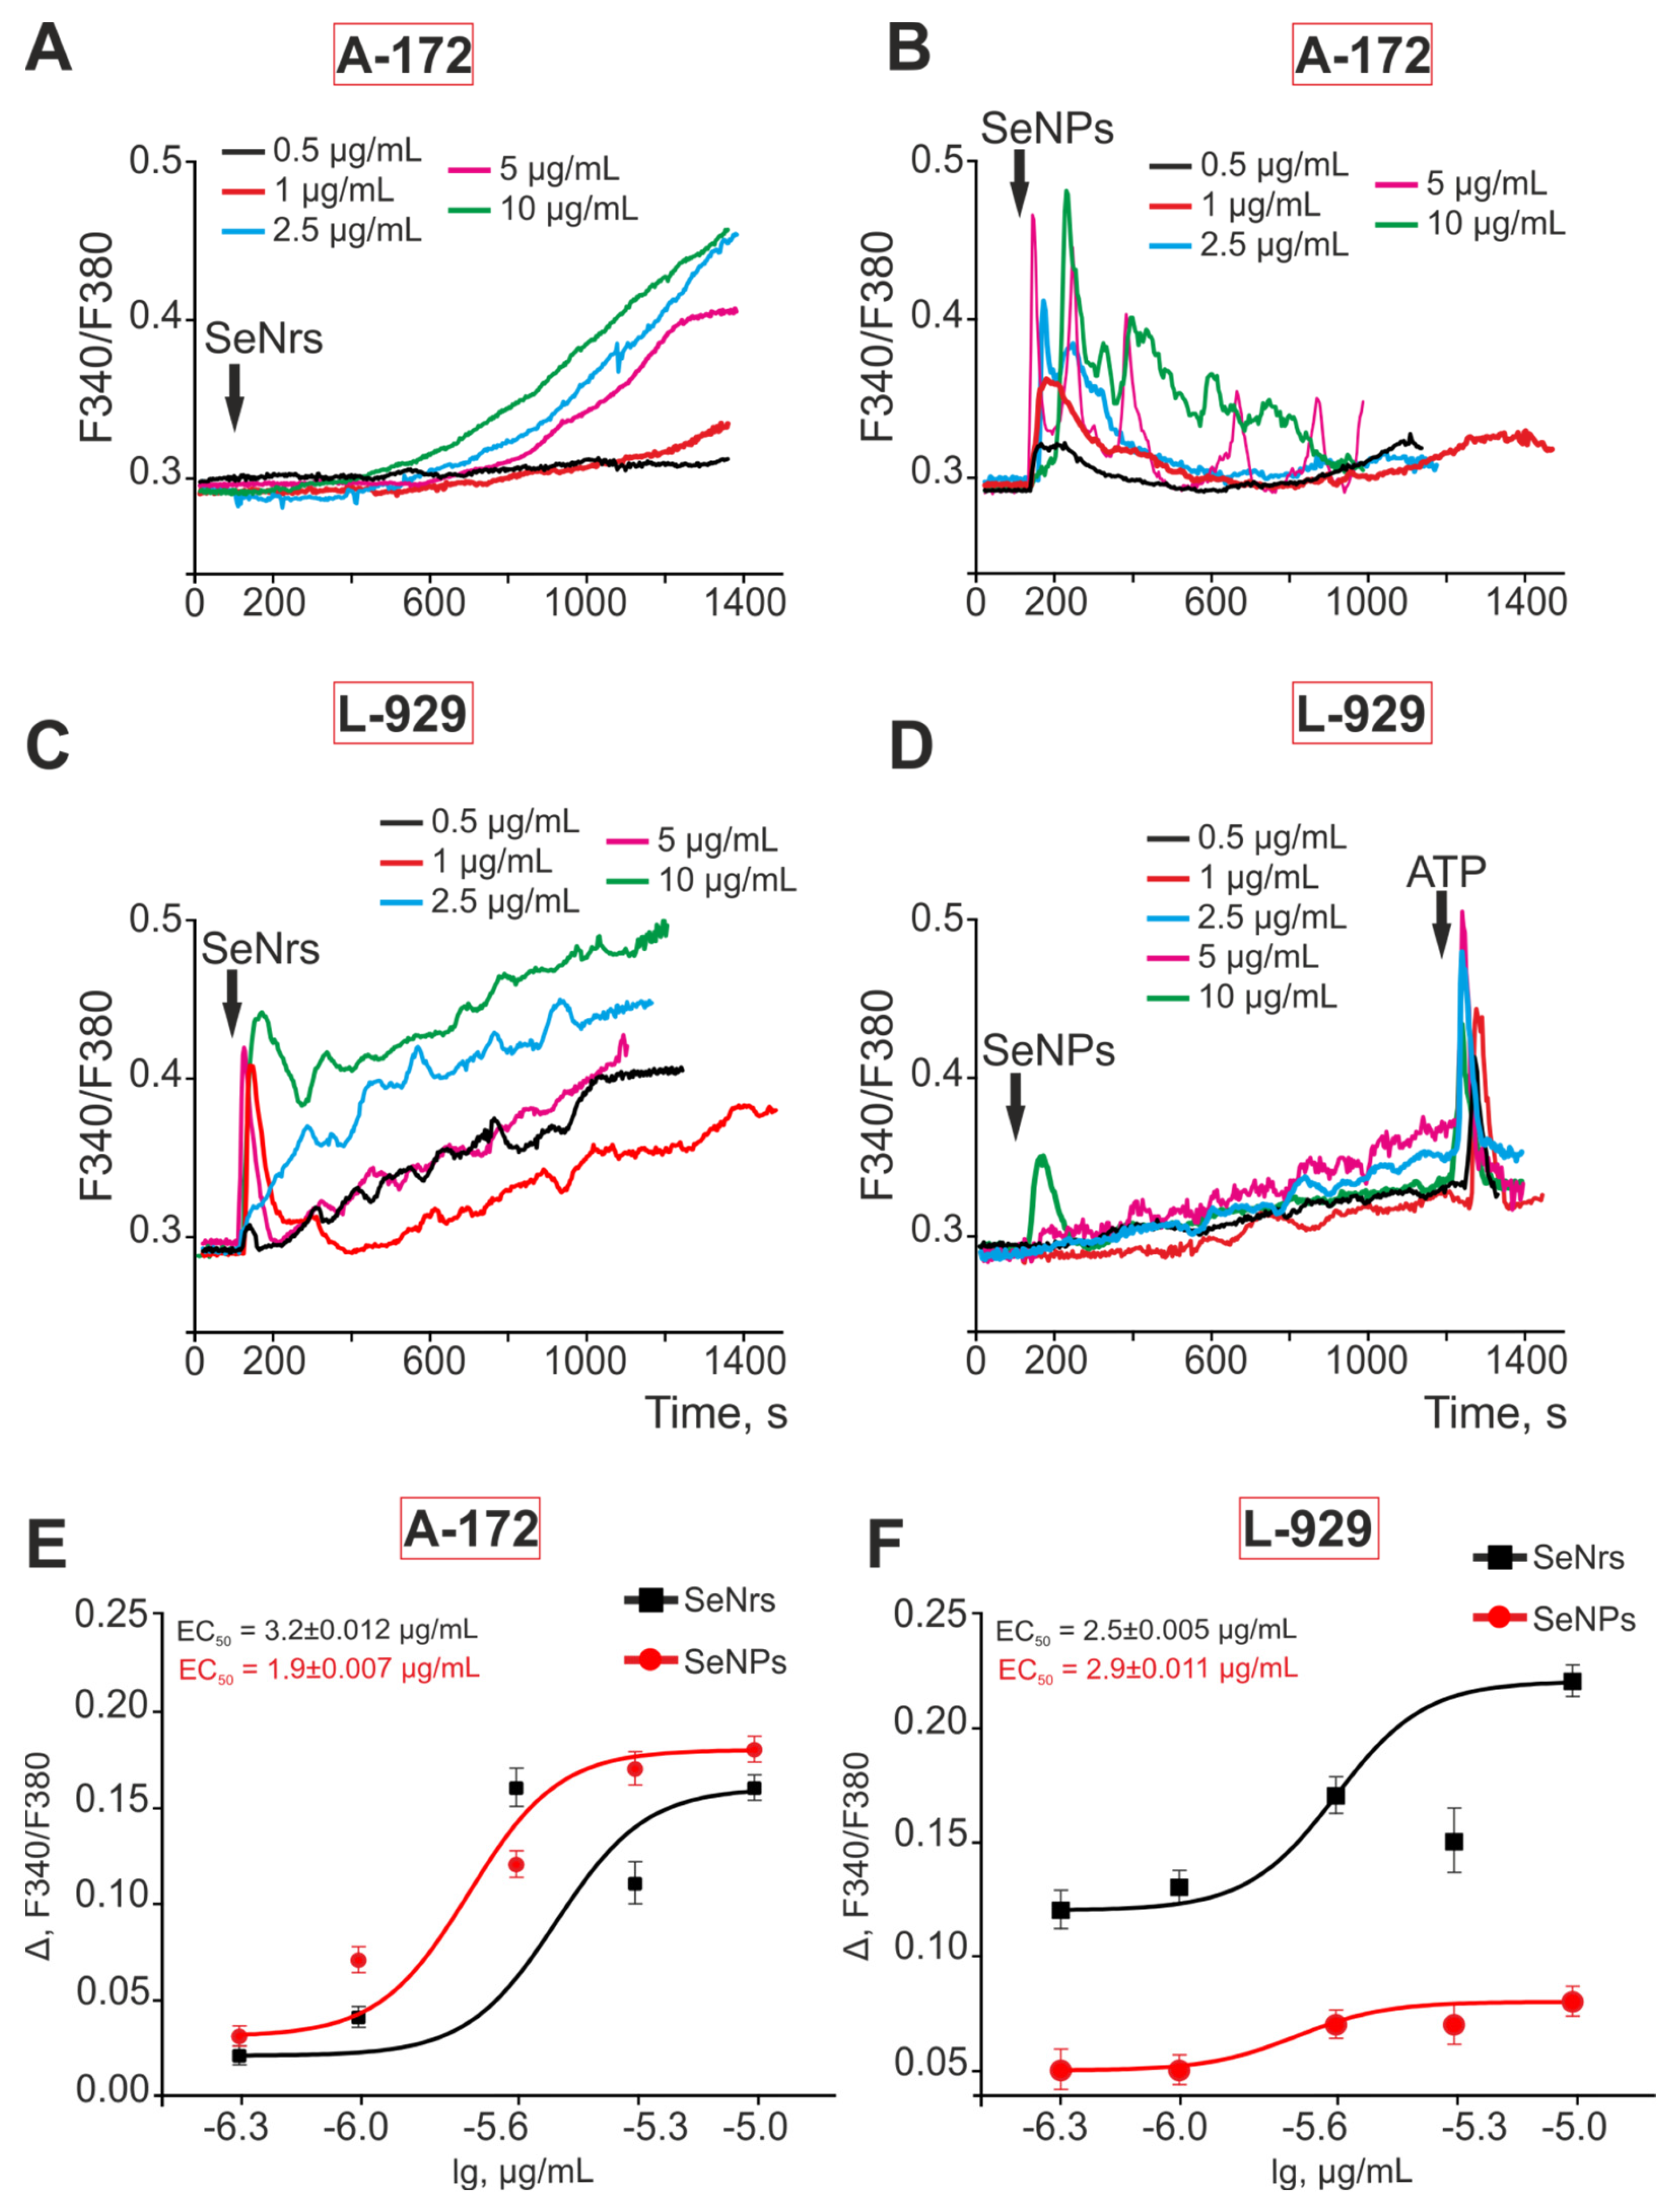
3.1. Comparative Analysis of the Selenium Nanorods (SeNrs) and Selenium Nanoparticles (SeNPs) Effects on the Induction of Ca2+ Signals in the A-172 Human Glioblastoma Cells and L-929 Mouse Fibroblasts

We have previously shown that spherical SeNPs induce Ca2+ signaling in various cell types [24,25]. Moreover, the amplitude of Ca2+ signals and the physiological effects of SeNPs depended on the diameter of the nanoparticles [26]. The use of selenium nanorods (SeNrs) at various concentrations starting from 1 μg/mL caused the generation of Ca2+ signals in A-172 cells, and the increase in [Ca2+]i depended on the dose (Figure 3A). Interestingly, the rise in [Ca2+]i to the application of SeNrs occurred after a lag period of 7 ± 1.5 min on average, and Ca2+ signals were a slow growth in [Ca2+]i and its level reaching a new elevated the steady state. On the other hand, the application of spherical SeNPs to human glioblastoma A-172 cells caused a rapid growth in [Ca2+]i and also had a dose-dependent character, but the cells responded even to the appliance of 0.5 µg/mL of nanoparticles (Figure 3B). Analysis of the dependence of the Ca2+ signal amplitudes of A-172 cells on the NP concentration showed that EC50 for SeNrs was 3.2 ± 0.012 µg/mL, and for SeNPs it was 1.9 ± 0.007 µg/mL (Figure 3E).
Application of SeNrs to L-929 mouse fibroblasts caused the generation of Ca2+ signals even at a concentration of 0.5 μg/mL, and Ca2+ signals had a combined form of kinetics, a quick rise in [Ca2+]i followed by a slow increase in the baseline level of [Ca2+]i (Figure 3C). However, the application of SeNPs to L-929 cells did not cause Ca2+ signals comparable with the application of SeNrs. In L-929 cells, a slow increase in [Ca2+]i was recorded upon 2.5 and 5 µg/mL SeNPs, while 10 µg/mL resulted in a transient increase in [Ca2+]i (Figure 3D). The cellular Ca2+ signals were a low amplitude. For L-929 cells, the EC50 value upon application of SeNrs was 2.5 ± 0.005 µg/mL, and for SeNPs, it was 2.9 ± 0.011 µg/mL (Figure 3F).
Thus, two different sources of nanoselenium have different effects on the Ca2+ signaling system of cells. In A-172 cells, SeNrs induce a slow increase in [Ca2+]i to the new stationary level of [Ca2+]i, while SeNPs induce a temporary growth in [Ca2+]i. In L-929 mouse fibroblast cells, the Ca2+ signaling system was activated only when SeNrs was used, and the application of SeNPs caused Ca2+ signals only in a high concentration range.

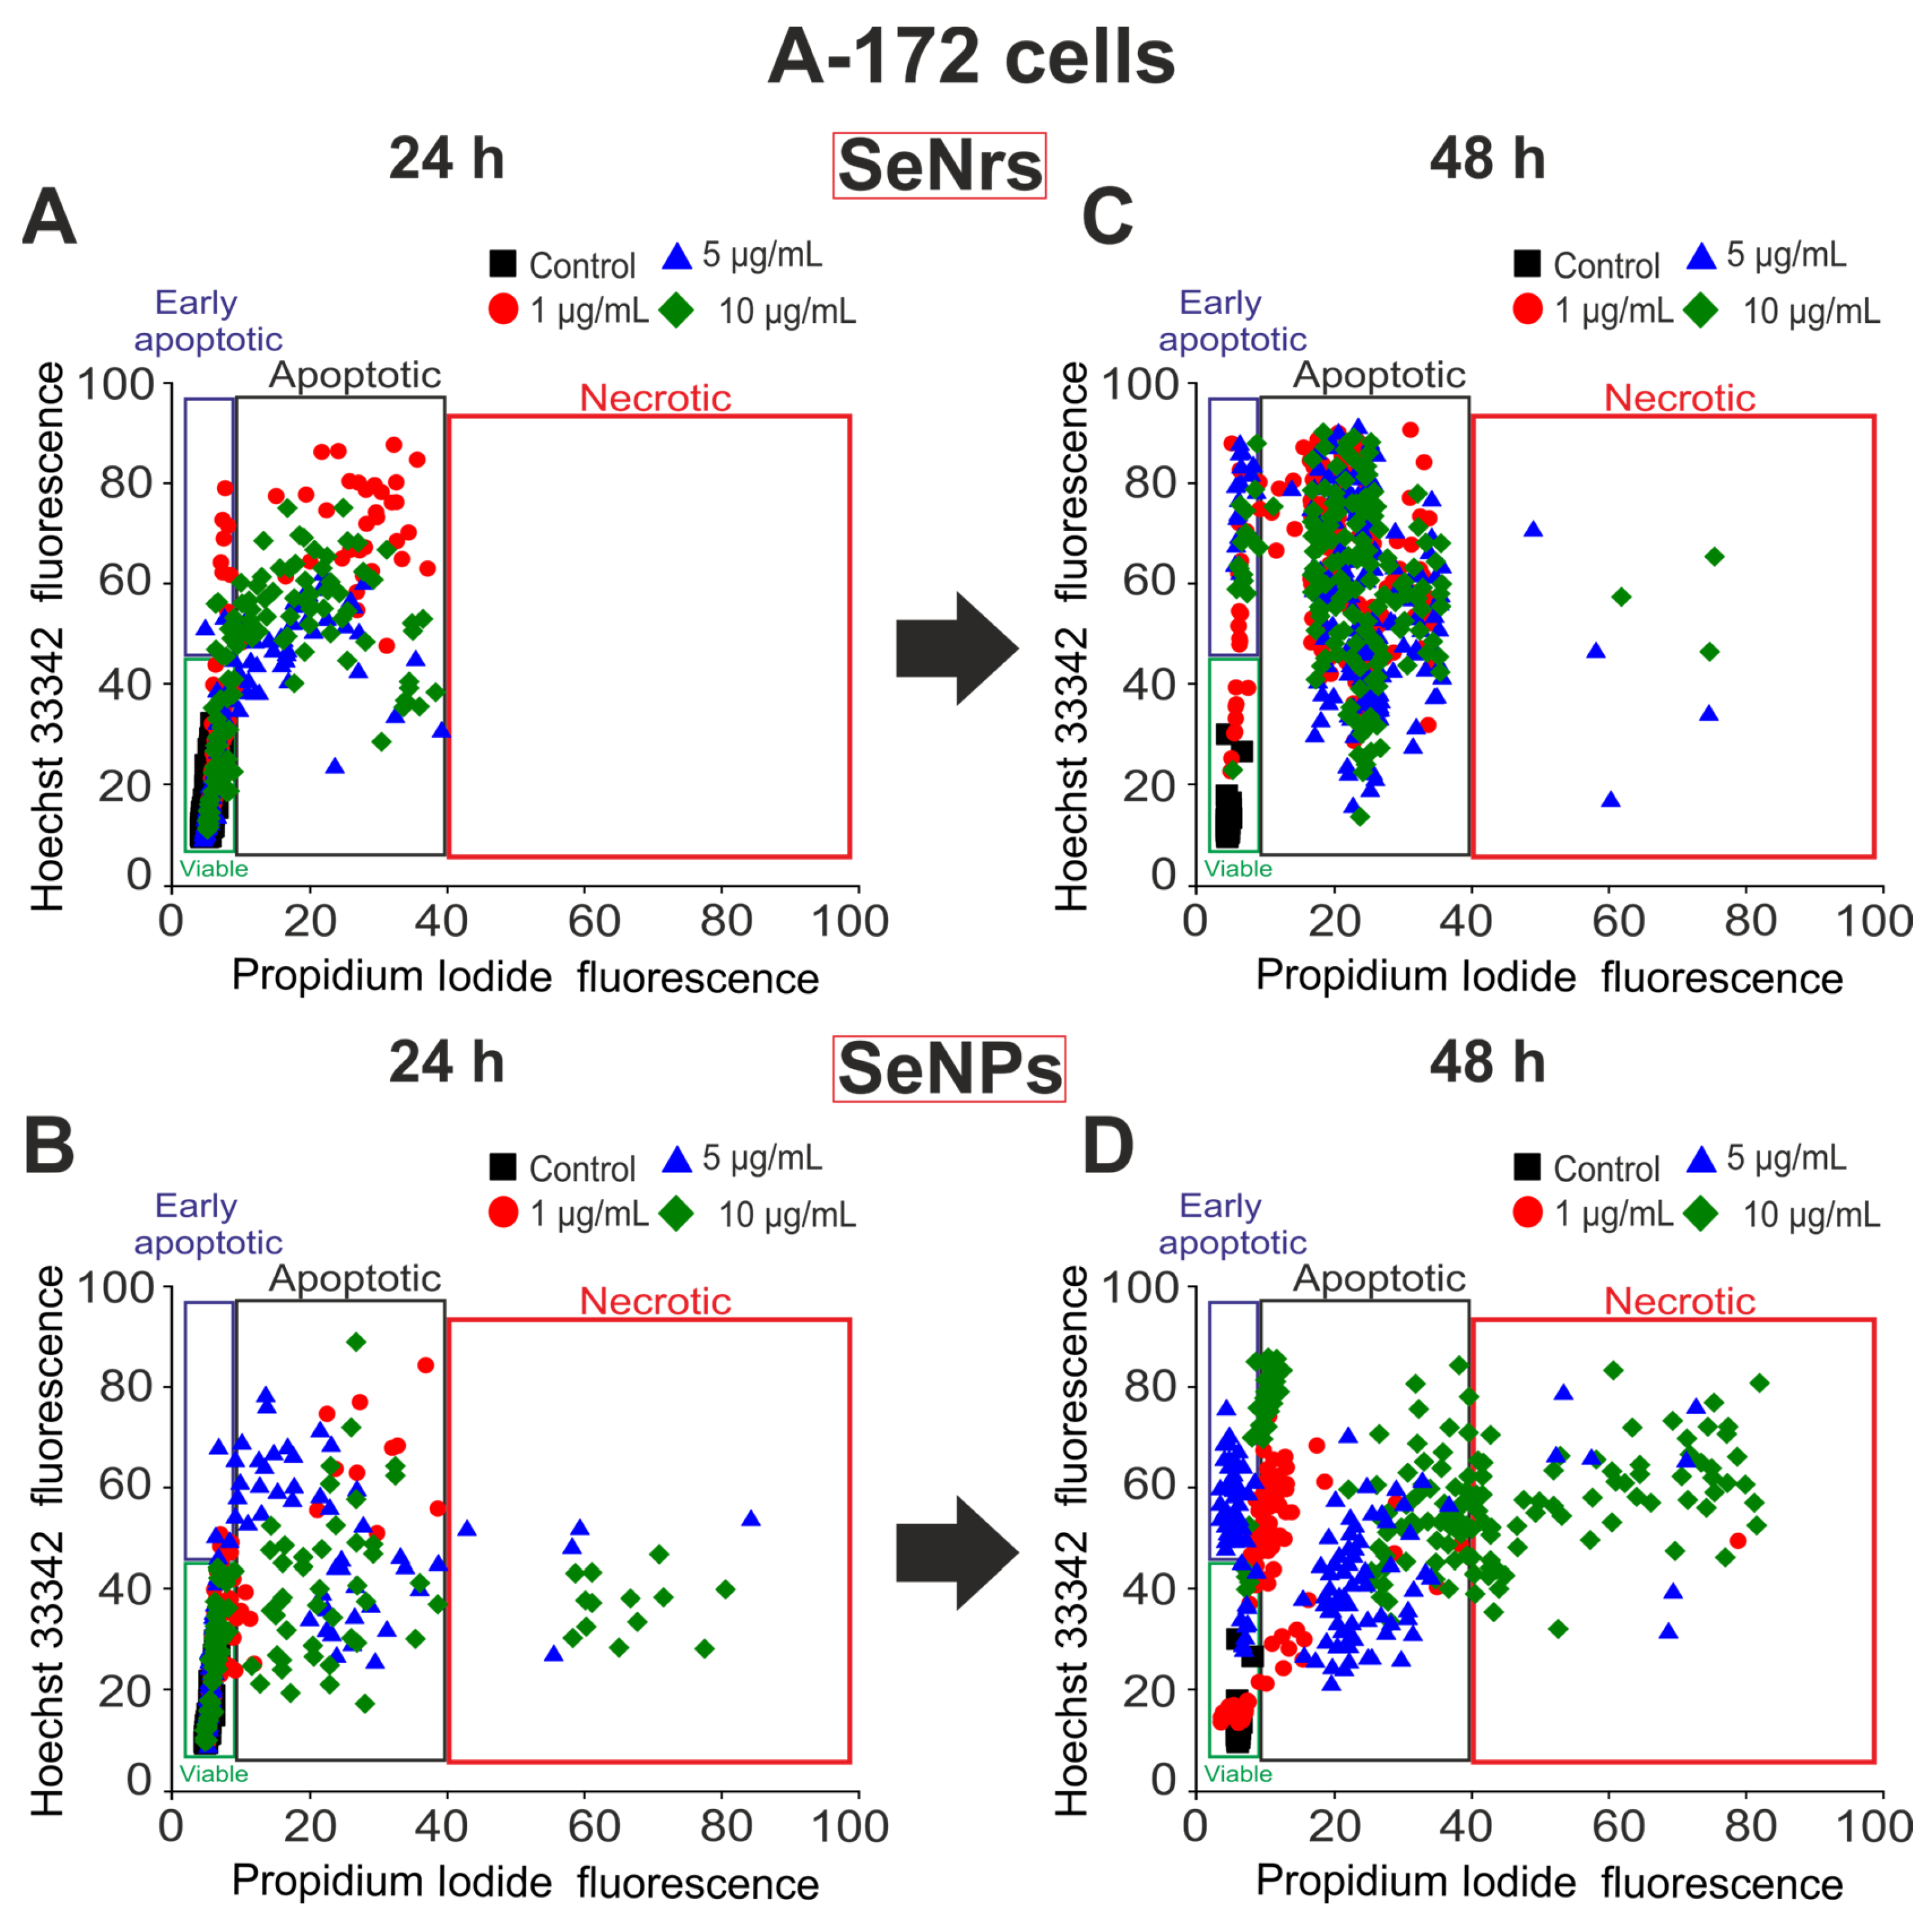
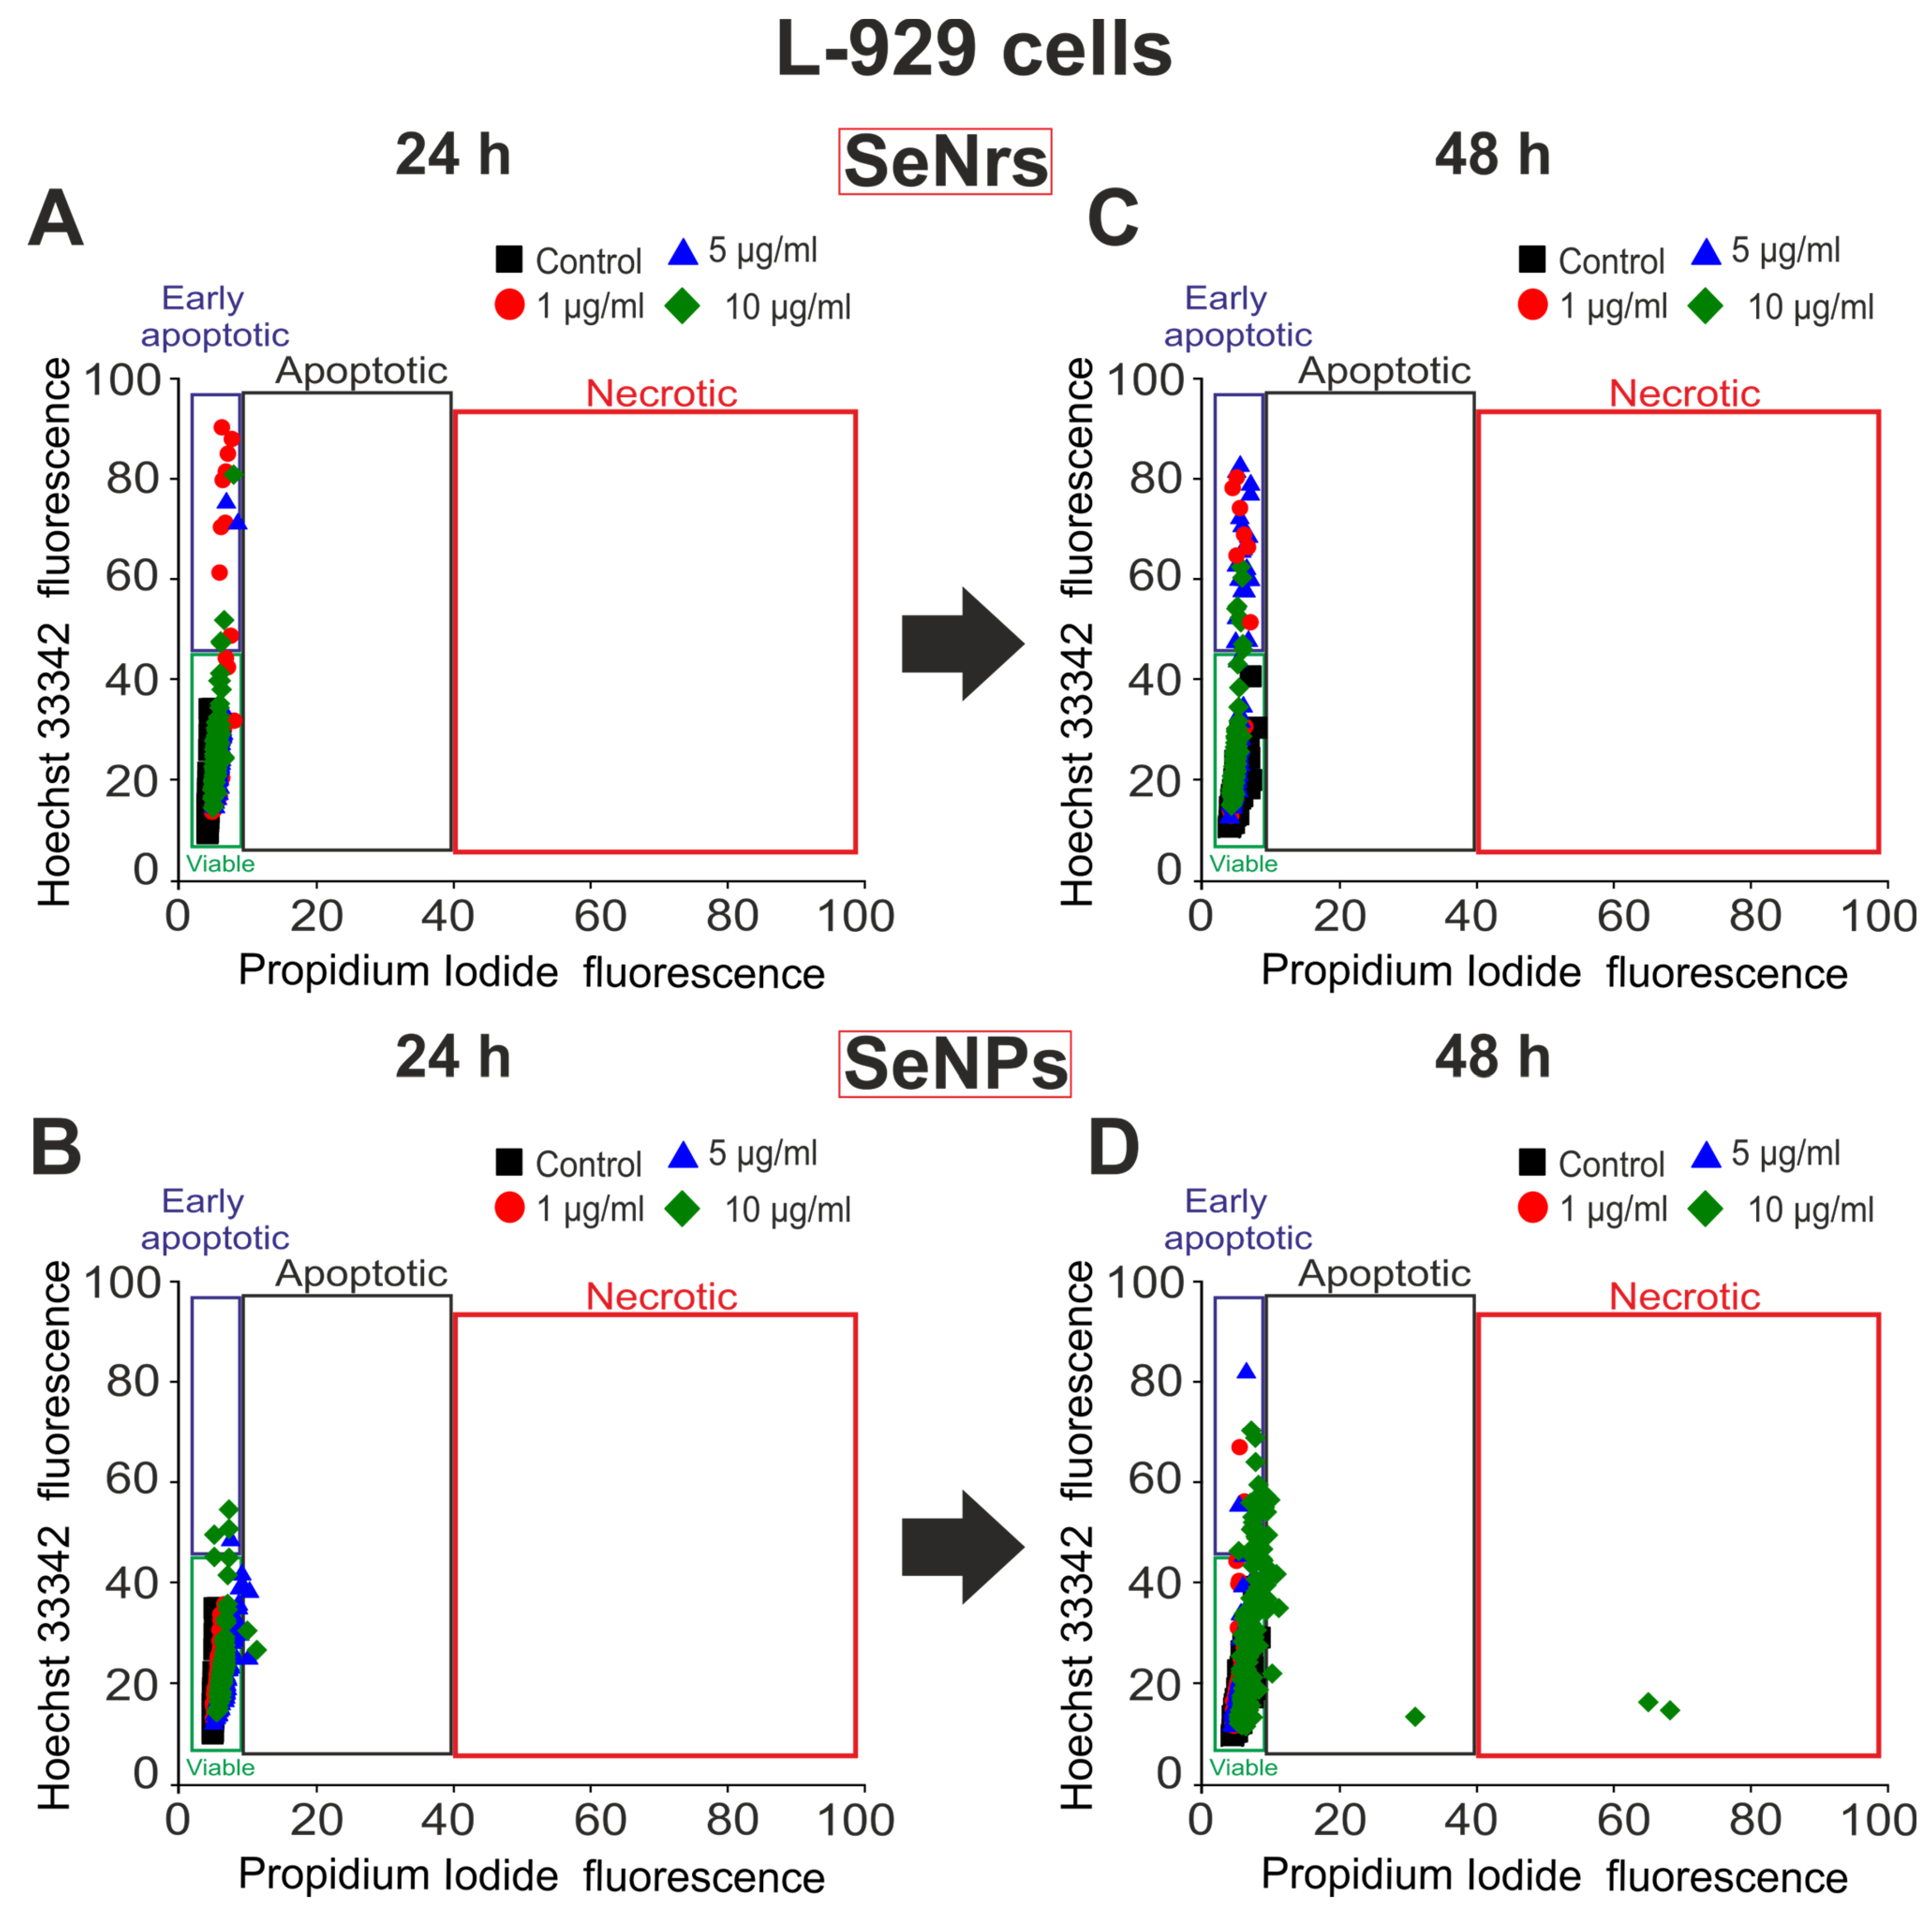
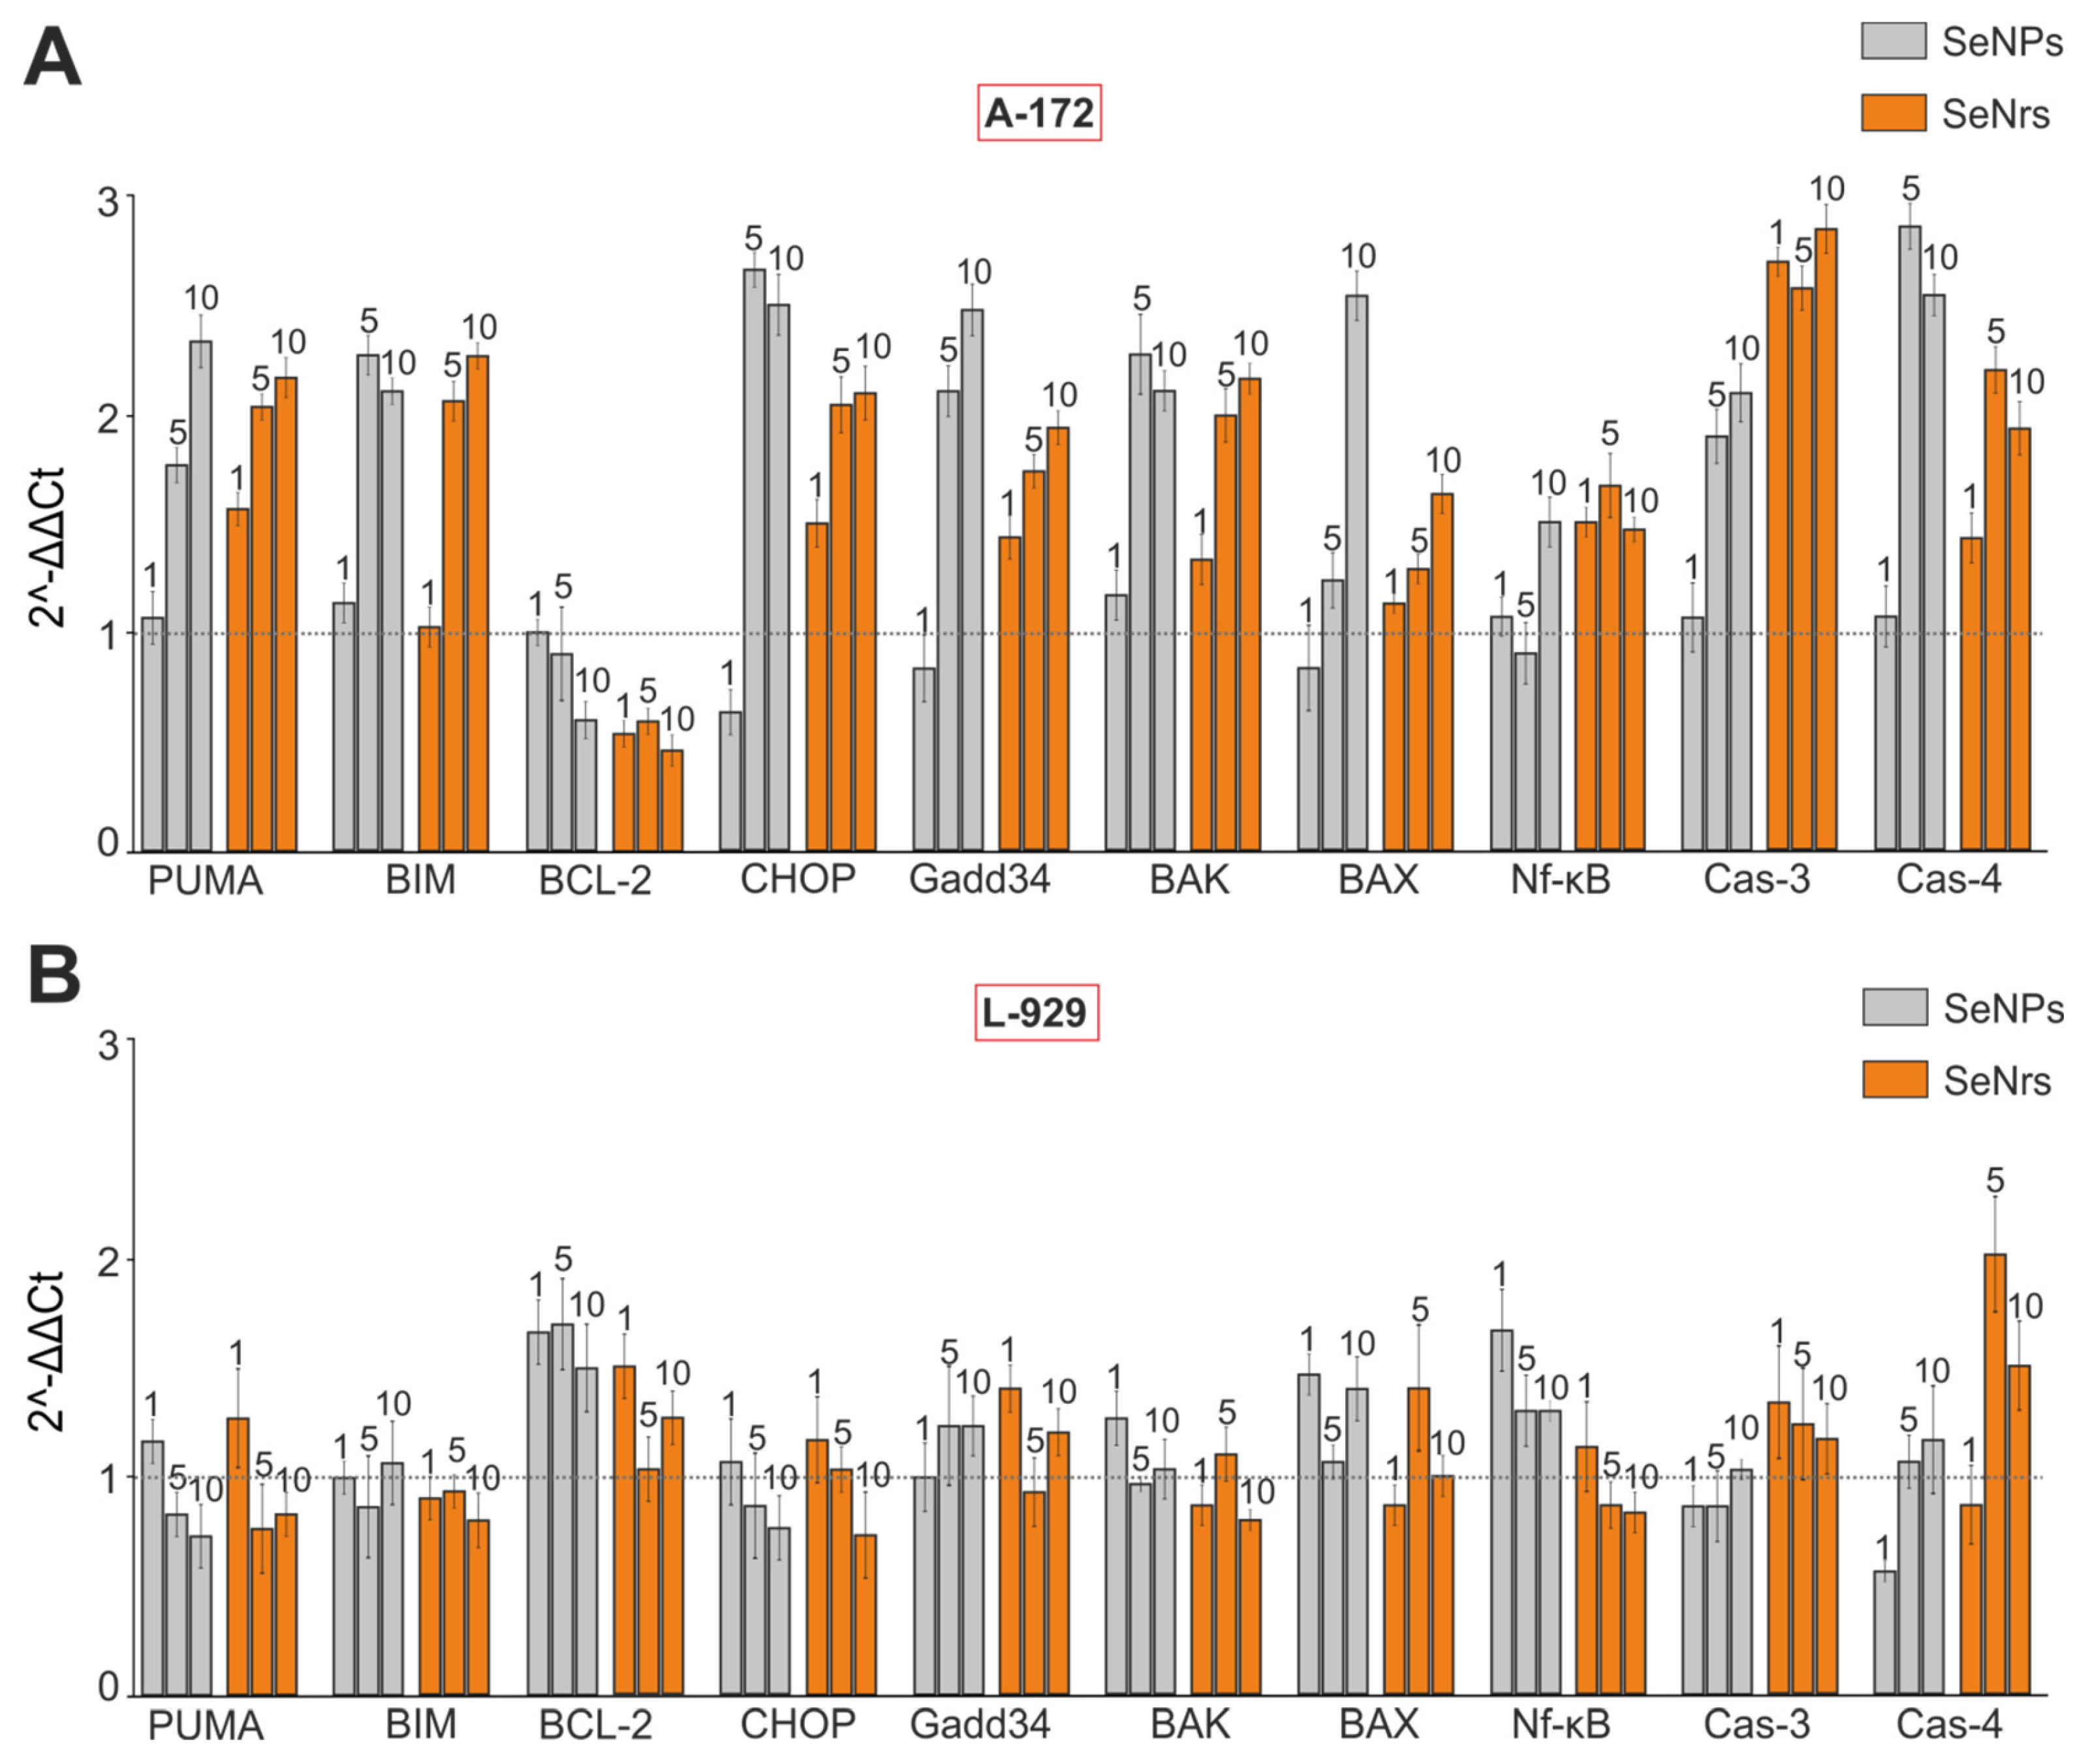
3.2. Comparative Analysis of the Proapoptotic Effect of Selenium Nanofibers and Selenium Nanoparticles on Human Glioblastoma Cells A-172 and Mouse Fibroblast Cells L-929

An increase in cellular [Ca2+]i can regulate both cell survival pathways and activate pro-apoptotic signaling cascades [27,28]. Preincubation of A-172 cells with different SeNrs concentrations during 24 h resulted in 5–15% of cells on the early stage of apoptosis. Late stages of apoptosis were observed in 52–67% of cells (Figure 4A and Table 3). The pro-apoptotic effect of SeNrs was dose-dependent and increased with an increase in the SeNrs concentration.
An increase in the pro-apoptotic effect occurred with an increase in the time of incubation of A-172 cells with SeNrs up to 48 h. Approximately 19–26% of the cells were registered in the early stages of apoptosis and 69–73% of the cells were detected in the late stages of apoptosis. At the same time, necrosis was detected only in single cells and when using high (5–10 μg/mL) concentrations of SeNrs (Figure 4C, Table 3).
Table 3. Influence of different SeNrs concentrations on the survival of human glioblastoma A-172 cells after 24 and 48 h of exposure.
24 h Pre-Incubation48 h Pre-Incubation
Control1 µg/mL5 µg/mL10 µg/mLControl1 µg/mL5 µg/mL10 µg/mL
Viable100%30%43%23%100%12%0%0%
Early apoptotic0%15%5%10%0%19%24%26%
Apoptotic0%55%52%67%0%69%73%69%
Necrosis0%0%0%0%0%0%3%5%
Early stages of apoptosis were activated in 2–8% of cells and late stages of apoptosis in 18–59% of cells after 24 h pre-incubation of glioblastoma A-172 cells with various concentrations of SeNPs (Figure 4B, Table 4). After 24 h exposure of A-172 cells with SeNPs, we did not register necrotic cells. Early stages of apoptosis were recorded in 4–17% of cells and late stages in 44–57% of cells after 48 h of pre-incubation (Figure 4D, Table 4). At the same time, necrotic death was recorded in 14–52% of cells after pre-incubation with 5 µg/mL and 10 µg/mL SeNPs, respectively (Figure 4D, Table 4).
Early stages of apoptosis were observed in 4–11% of cells after 24-h pre-incubation of mouse fibroblasts (L-929) with SeNrs, with the highest percentage of such cells observed when using 1 μg/mL (Figure 5A and Table 5). Under the action of SeNrs for 24 h, there was no mass death of fibroblasts. Increasing the preincubation time with SeNrs up to 48 h resulted in a increase in the percentage of cells at the early stage of apoptosis (9–14% of cells). The late stages of apoptosis and necrosis were not induced (Figure 5C and Table 5).
Early stages of apoptosis of L-929 mouse fibroblasts after 24-h exposure to SeNPs were recorded in 2–6% of cells using nanoparticles at a concentration of 5 µg/mL and 10 µg/mL without induction of late stages of apoptosis and necrosis (Figure 5B, Table 6). Early stages of apoptosis after 48-h incubation of mouse fibroblasts with SeNPs were recorded in 7–28% of cells, and late apoptosis in 8–16% of cells, using 5 and 10 μg/mL SeNPs, respectively, as well as single cells with necrosis (Figure 5D, Table 6).
Thus, after 24 h preincubation of A-172 cells with SeNrs induced human glioblastoma cells apoptosis in a smaller range of concentrations compared to SeNPs. The pro-apoptotic effect of SeNrs increased after 48 h of exposure, as did the effect of SeNPs, but SeNrs did not induce cell necrosis. However, in mouse fibroblasts, SeNrs resulted in early apoptosis stages both after 24 and 48 h of incubation, but without the late stages of apoptosis. While SeNPs did not cause the activation of the early apoptosis stages in mouse fibroblasts after 24 h of exposure, the process of apoptosis was observed in both early and late stages after 48 h of exposure. Therefore, one can speak of a greater efficiency of SeNrs in the induction of apoptosis in cancer cells compared to SeNPs. However, the effect of early apoptosis stages induction of in “healthy” fibroblasts under the action of SeNrs may indicate the lower selectivity of nanorods.

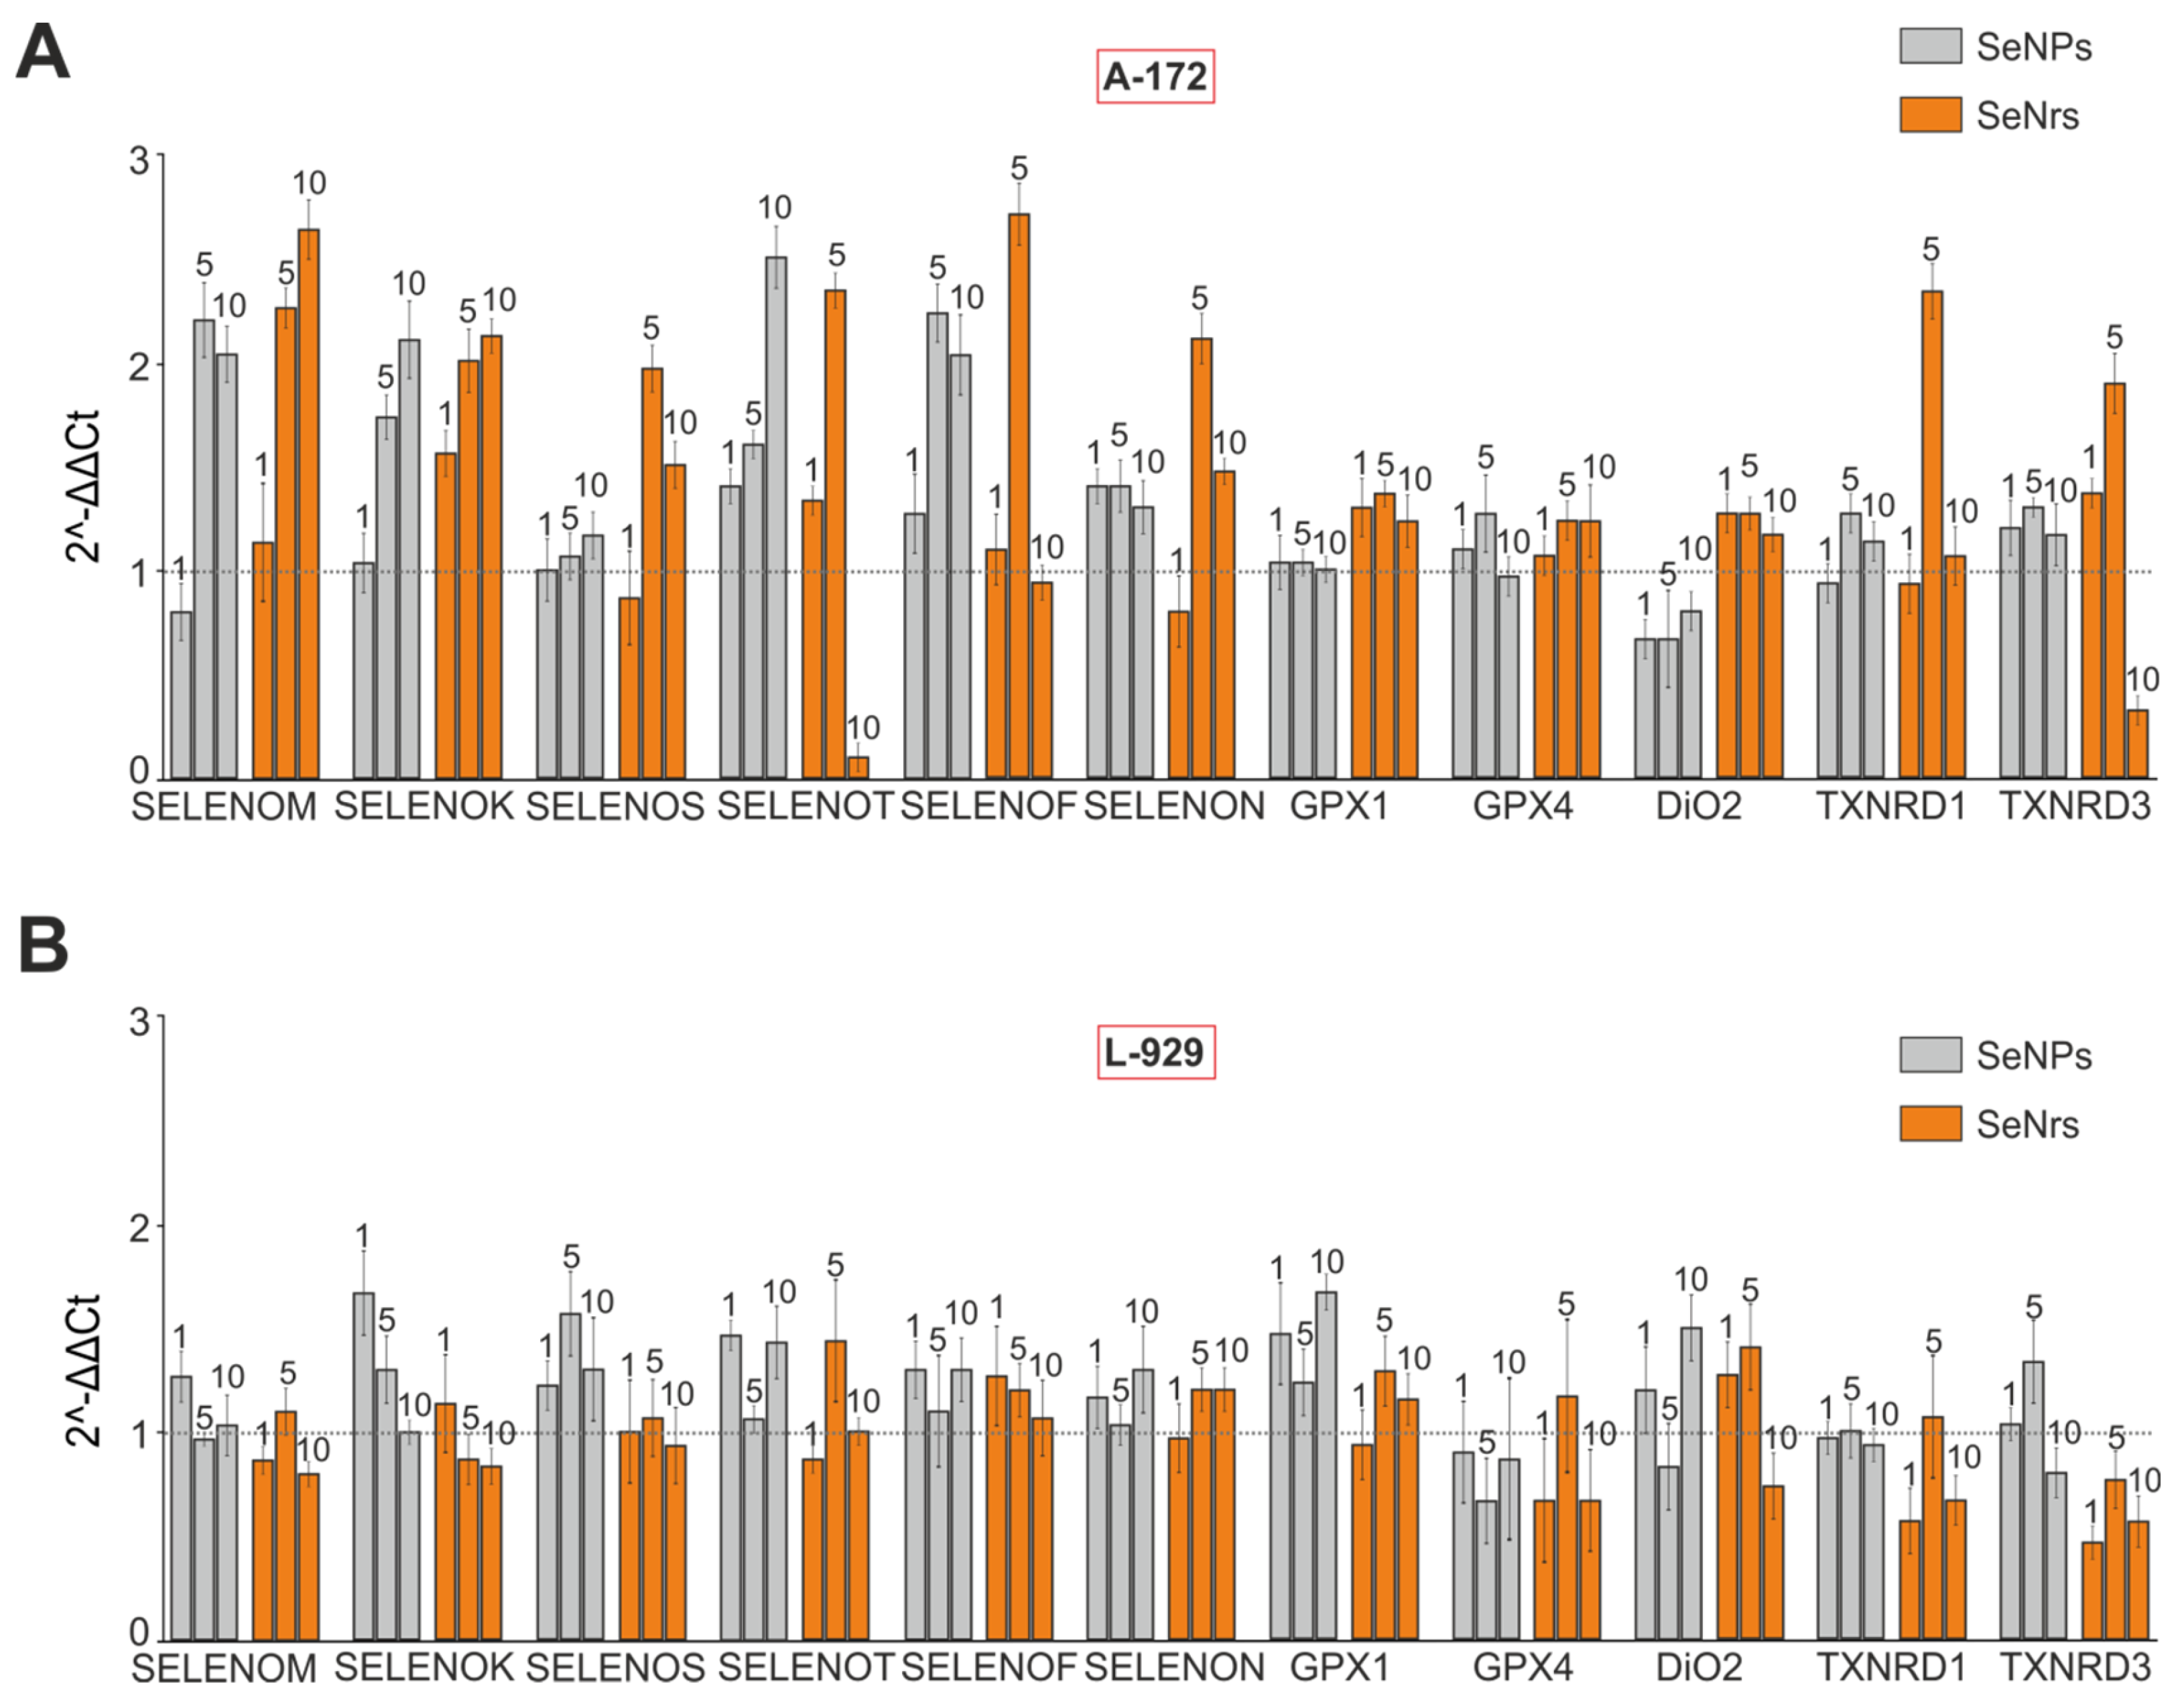
3.3. Effects of SeNrs and SeNPs on Expression Patterns of Genes Encoding Selenoproteins and Selenium-Containing Proteins, Genes Regulating Apoptosis and Endoplasmic Reticulum Stress

Based on the results of real-time PCR, it is safe to say that the expression of the mRNA of pro-apoptotic genes in the A-172 cell line increased after treatment of these cells with 5 and especially 10 μg/mL of SeNPs or SeNrs. However, there is no significant difference in the expression patterns of all the studied pro-apoptotic genes after 24-h treatment of glioblastoma cells with two types of selenium nanocomposites. The presented results demonstrate that the MRNA expression of the following pro-apoptotic genes: PUMA, BIM, SHOP, GADD34, BAK, Cas-3 and Cas-4 increases by more than two times (Figure 6A). At the same time, for a number of genes a more pronounced effect on the enhancement of their expression was observed when using SeNrs (Figure 6A, gray columns).
With the exception of Cas-4, the expression of pro-apoptotic genes generally was not influenced by the incubation of mouse fibroblasts (L-929) with SeNrs or SeNPs. The expression level of the Cas-4 gene increased after pre-incubation with 5 and 10 μg/mL SeNPs (Figure 6B).
The PCR analysis results correlate well with the activation of apoptosis under the selenium nanostructures’ influence on human glioblastoma A-172 cells. The contribution to the activation of the cell death can be made by the endoplasmic reticulum stress (ER-stress). Analysis of the gene’s expression encoding ER-stress proteins in A-172 cells showed an expression increase (Figure 7). Thus, the treatment of glioblastoma cells with 10 μg/mL selenium nanoparticles caused the expression of the transcription factor ATF-4 to rise significantly. That may indicate PERK signaling pathway UPR activation. Moreover, when these cells are exposed to SeNPs at 5 and 10 μg/mL concentrations, the expression of the spliced form of the transcription factor XBP1 is also increased by approximately two times (Figure 7A), which can serve as evidence of the activation of the IRE1α signaling pathway UPR. An increase in the mRNA expression of these ER-stress markers is also observed after 24 h of A-172 cell treatment with 5 μg/mL SeNrs. These data, as well as the similarity of mRNA patterns of expression of most pro-apoptotic genes, most likely indicate the same molecular mechanisms activated by both nanoselenium composites. However, it should be noted that their cytotoxic effect extends directly to the A-172 cancer cell line, but not to the L-929 fibroblast cells (Figure 7B).
Treatment of glioblastoma cells with two types of nanoselenium composites contributed to changes in mRNA expression of a number ER resident selenoproteins, as well as selenium-containing glutathione peroxidases (GPX1 and GPX4) and thioredoxin reductases (TXNRD1 and TXNRD3). So, as shown in Figure 8A, it can be noted that at SeNPs concentrations of 5 and 10 μg/mL the expression of mRNA of the selenoproteins SELENOM, SELENOK, SELENOT and SELENOF was significantly increased, while SeNrs at the same concentrations cause the increase in selenoproteins SELENOM and SELENOK (Figure 8A, orange columns). Interestingly, the main effect of enhancing selenoprotein mRNA expression was observed after the exposure of A-172 cells to SeNrs at concentration of 5 μg/mL rather than 10 μg/mL. This is typical for such selenoproteins as SELENOS, SELENOT, SELENOF and SELENON, and two thioredoxin reductases (TXNRD1 and TXNRD3), whose mRNA expression increased two or more times. At the same time, a more than two-time decrease in the expression of SELENOT and TXNRD3 mRNA was recorded after these cells were influenced by SeNrs at a concentration of 10 µg/mL.
Significant changes in mRNA expression of most of the studied selenoprotein genes do not occur when SeNrs are applied to L-929 mouse fibroblasts (Figure 8B, orange columns). Incubation of cells of this line with different concentrations of SeNPs resulted in an mRNA expression increase in the SELENOK, SELENOS, SELENOT and GPX1 genes (Figure 8B, gray columns).
Thus, both selenium nanocomposites are characterized by a pronounced increase in the mRNA expression of ER stress genes, selenoproteins and proapoptotic genes in glioblastoma cancer cells, excluding fibroblast cells. At the same time, there is a trend of a more pronounced pro-apoptotic effect of SeNrs, since they had an effect at lower concentrations compared to SeNPs.

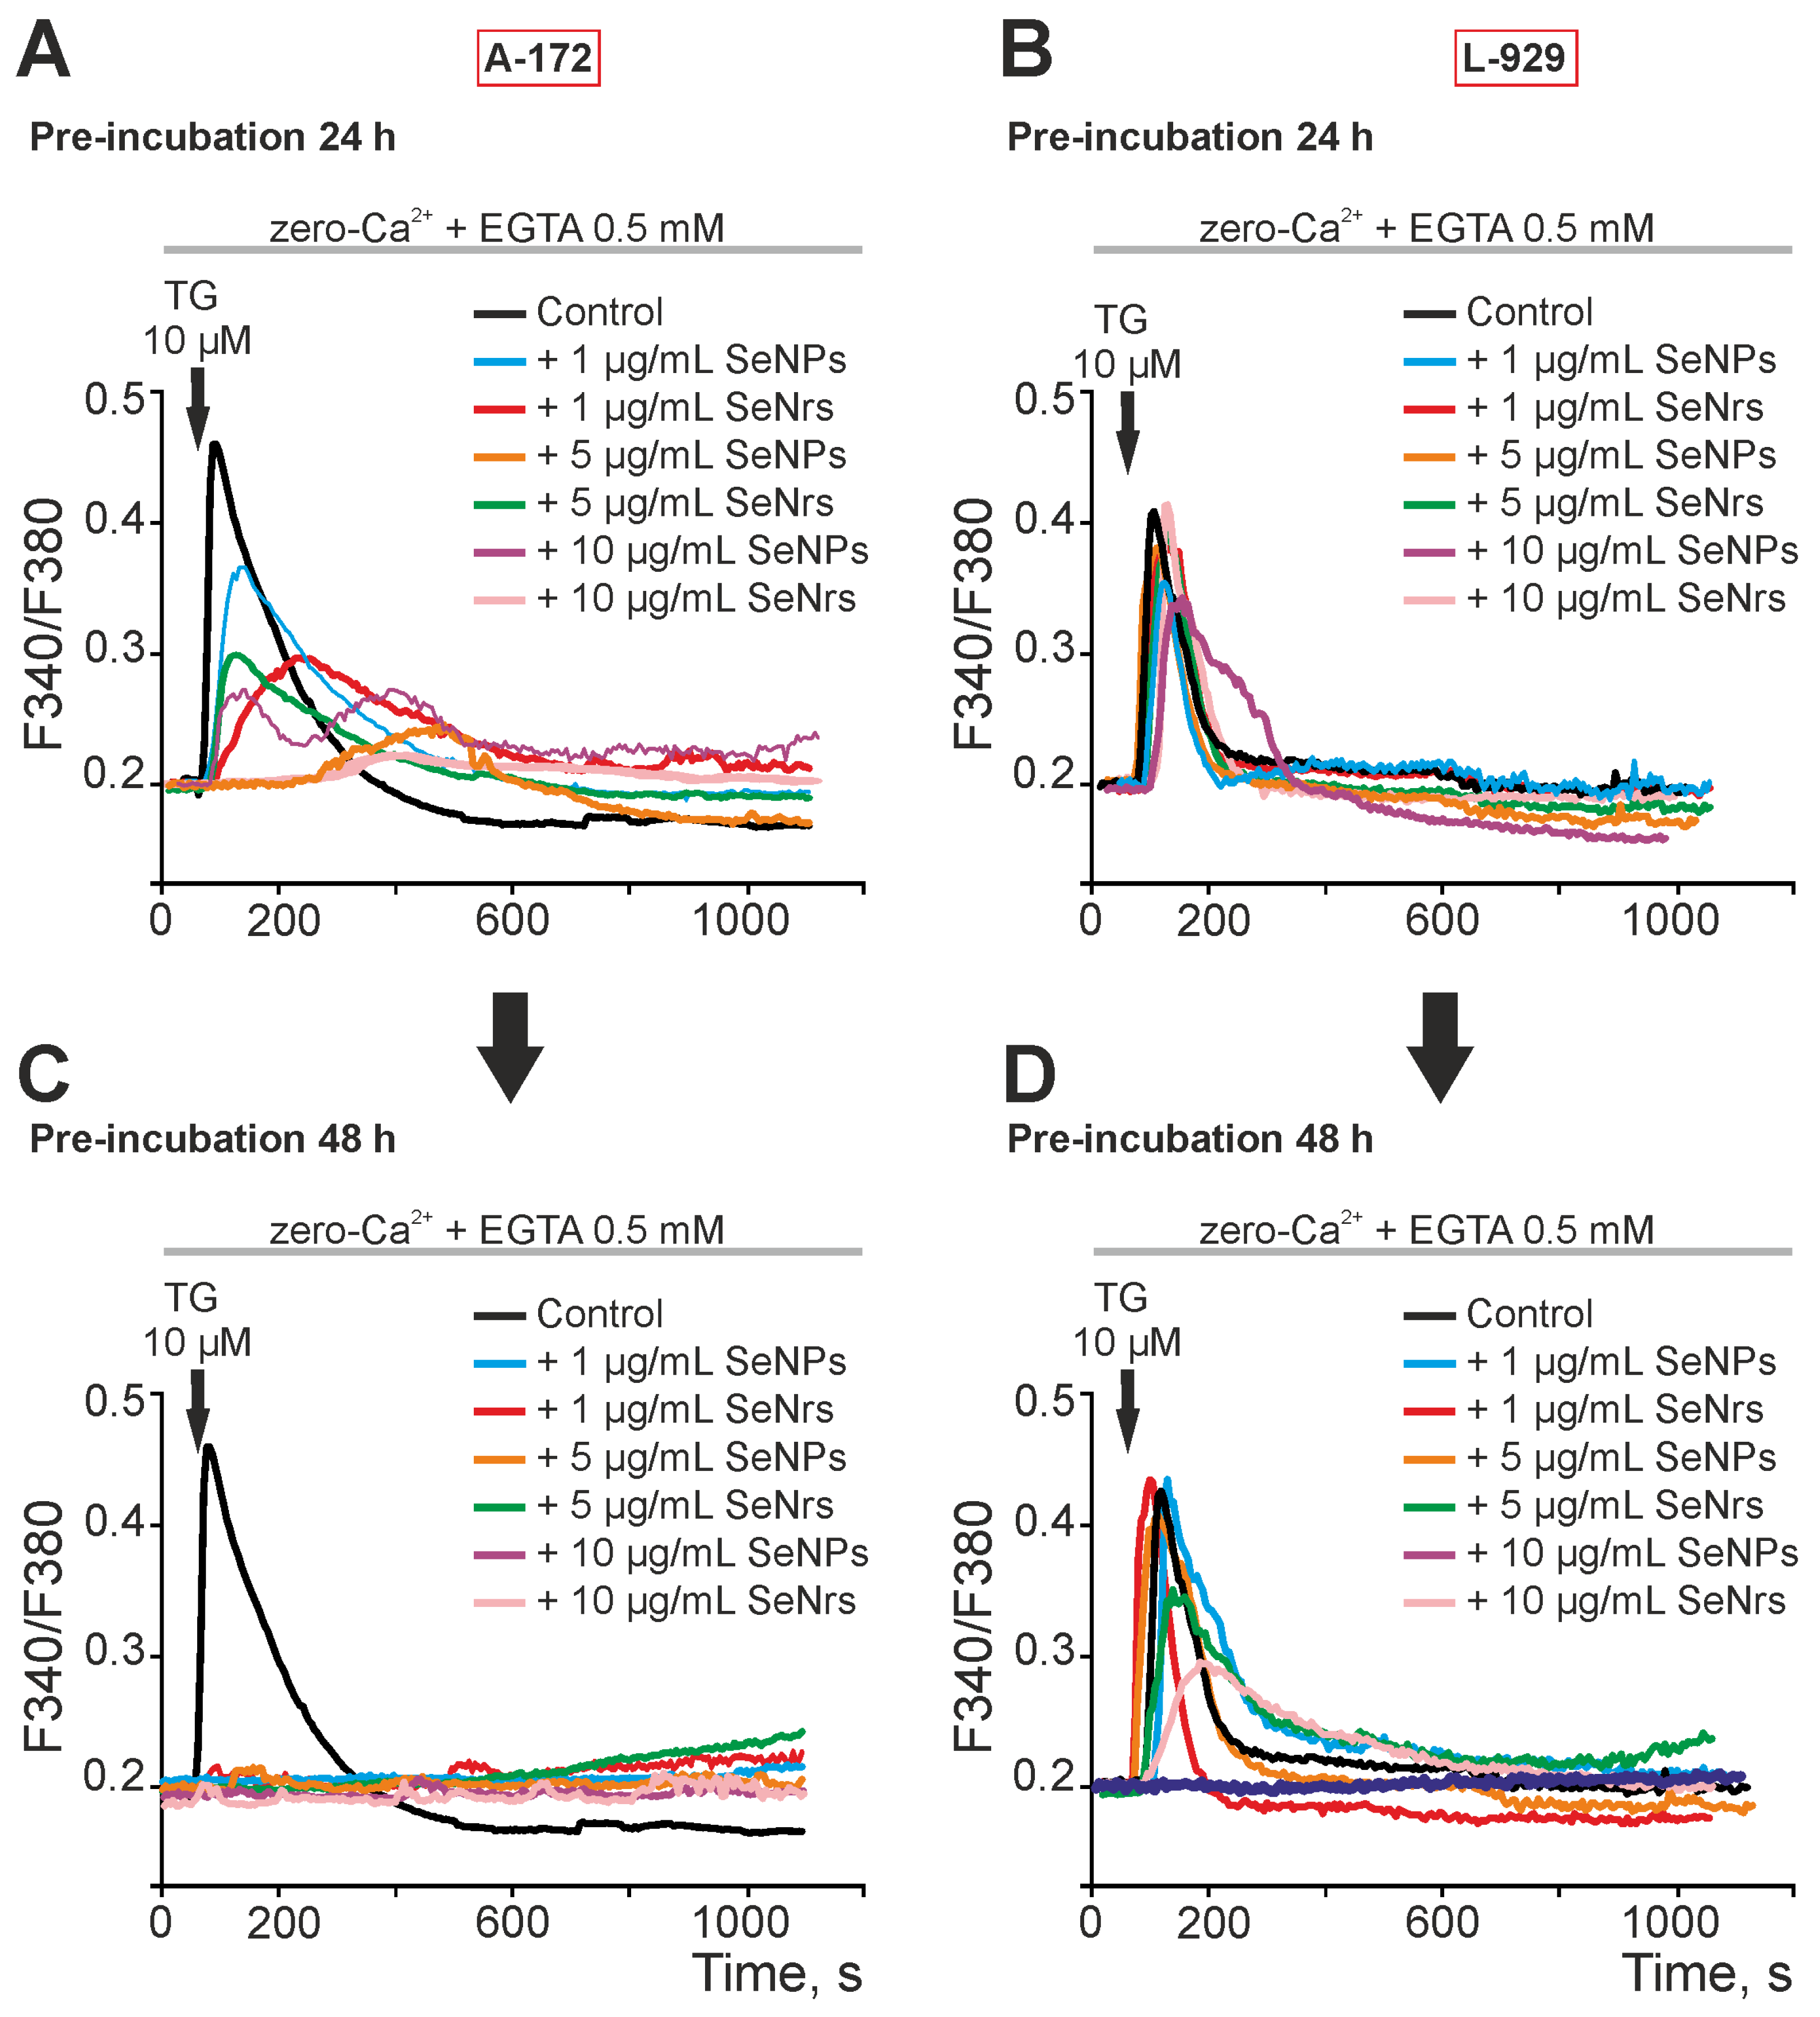
3.4. The Effect of Various SeNrs and SeNPs Concentrations on the Ca2+ Capacity of the Endoplasmic Reticulum of Human Glioblastoma Cells and Mouse Fibroblasts

We have previously shown that SeNPs selectively act on cancer cells and deplete the Ca2+ stores of the endoplasmic reticulum without affecting the Ca2+ depot of astrocytes [29]. A-172 cell pre-incubation with SeNPs with concentrations ranging from 1 to 10 μg/mL during 24 h caused a dose-dependent depletion of ER Ca2+ stores. Application of thapsigargin (TG) to A-172 cells in medium nominally free of calcium led to high [Ca2+]i growth (Figure 9A, black curve). However, there was a significant decrease in the amplitude of Ca2+ cell signals in response to the use of TG after 24-h incubation of cells with SeNPs (Figure 9A, blue, pink and purple curves). Pre-incubation of glioblastoma cells with the same SeNrs concentrations for 24 h led to a similar or more pronounced suppression of the signal amplitudes of calcium ions to the application of TG (Figure 9A, red, green and light pink curves). Pre-incubation of A-172 cells with SeNPs or SeNrs during a 48-h period resulted in the complete absence of cellular Ca2+ signals to the application of TG (Figure 9C), which indicates a complete depletion of the ER Ca2+ pool.
Pre-incubation of L-929 mouse fibroblasts with SeNPs or SeNrs did not lead to the depletion of Ca2+ stores of the ER (Figure 9B,D) comparable to the effects of these nanocomposites on A-172 cells (Figure 9C). In the case of SeNPs exposure to L-929 cells within 24 h, only a certain trend was observed to suppress the amplitude of cellular Ca2+ signals upon the application of TG after exposure to SeNPs, but not to SeNrs. The incubation time of L-929 cells with the studied nanocomposites was increased up to 48 h (Figure 9D) and also did not result in a noticeable suppression of Ca2+ signals to the application of TG. This shows the lack of a pronounced impact of these nanoparticles on the sex of healthy ER Ca2+ cells.
Thus, the exhaustion of the ER Ca2+ pool caused by the effect of SeNrs or SeNPs occurred only in human glioblastoma A-172 cells, but was absent in healthy fibroblasts. At the same time, SeNrs are likely to be more effective at an incubation interval of 24 h. Together with the data from the PCR analysis, the results of Ca2+ imaging indicate ER stress under the action of the studied nanocomposites in cancer cells.

4. Discussion

Glioblastomas represent more than 52% of all tumors that occur in the brain. Astrocytes are the source of glioblastomas. Glioblastoma is one of the lethal grade IV astrocytomas and has a mean survival rate of 15 months [30,31]. Treatment of glioblastomas in the brain is complicated by the presence of physiological barriers in the brain, for example, the blood–brain barrier (BBB), the blood–cerebrospinal fluid barrier (BCSFB) and other barriers [32,33].
The possibilities of using metal nanoparticles as carriers of anti-cancer drugs are being widely studied. Nanoparticles as carriers makes it possible to reduce the dose of therapeutic molecules and enhance their effect [10]. Selenium nanoparticles have shown their effectiveness in inducing apoptosis in cancer cells of various origins—breast cancer, prostate cancer, glioblastoma, hepatocellular carcinoma, etc. [25]. As for selenium nanorods, it is reported that biosynthesized SeNrs from Streptomyces bikiniensis on the Hep-G2 and MCF-7 cell lines have an LD50 of 75.96 and 61.86 micrograms/mL−1, respectively, which confirms the effectiveness in the treatment of cancer [34]. At the same time, the mechanism of action of selenium nanorods obtained by laser ablation is practically not studied. Despite the fact that these nanostructures are characterized by cheaper production and greater stability, this method of obtaining nanoparticles is characterized by the high purity of preparations. SeNrs showed a different dose anti-cancer efficacy, depending on the origin of the cancer cells. MCF-7 breast cancer cells have been found to be more sensitive to SeNrs compared to human hepatocellular carcinoma HepG2 cells [35]. Similarly, spherical selenium nanoparticles have shown more pronounced anti-cancer effects on HepG2, MCF-7 cells compared to CaCo-2 colorectal cancer cells or human glioblastoma [25,29,36]. In the present work, it was found that SeNrs more effectively induce apoptosis in glioblastoma A-172 cells compared to spherical SeNPs. Induction of apoptosis in A-172 cells occurred as early as 24 h after incubation with SeNrs, while under the action of SeNPs such effects could be achieved after 48 h of exposure. At the same time, after a 48-h exposure to SeNPs, inflammatory processes were also recorded in A-172 cells, which was not observed after SeNrs. A number of studies show the absence or mild cytotoxic effects of selenium nanostructures on “healthy” cells and tissues [29,37,38]. It has been shown that inorganic forms of selenium increase the activity of glutathione peroxidase in healthy cells, but selectively destroy their mitochondria through the release of free radicals in cancer cells. Thus, selenium is able to exert a selective anti-cancer effect [39,40].
In addition, our experiments showed that both types of nanoparticles were effective regulators of selenium-containing protein expression. A particularly important fact is the increase in the expression of SELENOT and SELENOT genes in glioblastoma cells after exposure to SeNPs and SeNrs, but the effects of SeNrs were more pronounced. These selenoproteins are of great importance in the regulation of the functions of the endoplasmic reticulum and are associated with carcinogenesis [41]. Similarly, spherical SeNPs did not generate Ca2+ signals in healthy L-929 mouse fibroblasts. However, in this case, SeNrs resulted in a slow increase in [Ca2+]i in fibroblasts, which indicates a lower selectivity of nanoparticles of this form to cells. As for selenoproteins, the studied nanoparticles also had almost no effect on, or regulated to a significantly lesser extent, the expression of most selenoprotein genes in fibroblasts of the L-929 line.
Selenium nanoparticles are used to enhance the effectiveness of radiotherapy, when the application of SeNPs together with irradiation enhances ROS production [42], ER-stress and leads to apoptosis induction in cancer cells and mitochondrial dysfunction [43]. Underlying many human diseases, endoplasmic reticulum stress is a typical molecular pathophysiological process, for the development of which a disturbance of protein folding is of great importance, which could be the reason for the accumulation of chemically aggressive proteins or inactive proteins in the lumen of ER [44]. To avoid these effects, eukaryotes have an unfolded protein response (UPR) mechanism. This mechanism is a signaling cascade with a common trigger mechanism mediated by transmembrane proteins—PERK (PKR-like ER kinase, also known as PEK, EIF2AK3), IRE1α (α-isoform of inositol-dependent enzyme type 1) and ATF-6 (activating factor transcription 6). The regulatory domain of these proteins is embedded in the lumen of the endoplasmic reticulum. Normally, the domain is associated with the BiP chaperone (immunoglobulin-binding protein, also known as GRP78-glucose-regulating protein and HspA5) [45]. It has been shown that selenium nanoparticles are able to inhibit a variety of signaling proteins participating in endoplasmic reticulum stress under the action of H2O2. These proteins include protein kinase R-like endoplasmic reticulum kinase (PERK), eukaryotic initiation factor 2 (eIF2α), CHOP and p-PERK activating transcription factor 4 (ATF4). In addition, SeNPs are able to regulate the process of mitophagy under endoplasmic reticulum stress through inhibition of the AMPK/mTOR/PINK1 signaling cascade [46]. In cortical astrocytes, spherical SeNPs also cause adaptive ER stress, which is not accompanied by the apoptosis activation, but, on the contrary, leads to the activation of genes encoding protective proteins [29]. Similarly, a slight depletion of the Ca2+ depots of the endoplasmic reticulum observed under the action of SeNrs on L-929 fibroblast cells with an increase in gene expressions of ER-stress proteins, does not cause pronounced cell death. The ER-stress registered in fibroblasts may have an adaptive value and protect cells in the event of pathological effects. Whereas in A-172 glioblastoma cells, we observe more pronounced ER-stress at the level of Ca2+ signaling and gene expression, which causes their apoptosis under the action of SeNrs and even necrotic processes under the action of high doses of SeNPs for 48 h. Depletion of Ca2+ depots of the endoplasmic reticulum can lead to the Ca2+ overload of mitochondria and activation of BCL-2-dependent apoptosis [47,48]. Another pathway of activation of apoptosis upon depletion of the ER is an [Ca2+]i increase, its accumulation in mitochondria, depolarization of mitochondria and release of cytochrome c [49]. In addition, overload of mitochondria with Ca2+ ions during ER-stress leads to the hyperproduction of ROS through NADPH oxidase 4 and disturbance of mitochondria [50]. In our experiments on a human glioblastoma cell line, after exposure to spherical SeNPs or selenium nanorods, the increase in expression of both ER-stress genes engaged in the apoptosis and genes encoding proteins adjusting the mitochondrial pathway of cell death increased.

5. Conclusions

The application of SeNPs and SeNrs in an acute experiment causes Ca2+ signaling system activation in human glioblastoma cells, and Ca2+ signals to SeNPs have the form of a temporal rise in [Ca2+]i, while the application of SeNrs induces a slow increase in [Ca2+]i and new steady-state of [Ca2+]i. However, both types of nanoparticles lead to the depletion of Ca2+ depots of the endoplasmic reticulum, induction of apoptosis and ER stress in glioblastoma cell cultures. SeNrs showed a trend towards greater efficiency in inducing apoptosis and increasing the expression of pro-apoptotic genes even at high concentrations, while SeNPs at high concentrations cause cell necrosis. In healthy L-929 mouse fibroblast cells, SeNrs also activate the Ca2+ signaling system, moderate depletion of Ca2+ stores of the endoplasmic reticulum and the induction of early stages of apoptosis when high concentrations of nanoparticles are used. Spherical SeNPs are more selective because they do not affect the physiology of normal cells.

Author Contributions

Conceptualization, E.G.V. and E.A.T.; methodology, E.G.V., I.V.B. and E.A.T.; investigation, E.G.V., I.V.B. and E.A.T.; resources, I.V.B. and S.V.G.; writing—original draft preparation, E.G.V., I.V.B. and E.A.T.; writing—review and editing, S.V.G.; visualization, E.G.V., I.V.B. and E.A.T.; funding acquisition, S.V.G. All authors have read and agreed to the published version of the manuscript.

Funding

This work was supported by a grant of the Ministry of Science and Higher Education of the Russian Federation (075-15-2022-315) for the organization and development of a world-class research center “Photonics”.

Institutional Review Board Statement

Not applicable.

Informed Consent Statement

Not applicable.

Data Availability Statement

The data presented in this study are available on request to the corresponding author.

Acknowledgments

The authors would like to thank the Center for Collective Use of the Prokhorov General Physics Institute of the Russian Academy of Sciences.

Conflicts of Interest

The authors declare no conflict of interest.

References

  1. Siegel, R.L.; Miller, K.D.; Jemal, A. Cancer statistics, 2020. CA Cancer J. Clin. 2020, 70, 7–30. [Google Scholar] [CrossRef] [PubMed]
  2. Bray, F.; Ferlay, J.; Soerjomataram, I.; Siegel, R.L.; Torre, L.A.; Jemal, A. Global cancer statistics 2018: GLOBOCAN estimates of incidence and mortality worldwide for 36 cancers in 185 countries. CA Cancer J. Clin. 2018, 68, 394–424. [Google Scholar] [CrossRef] [PubMed]
  3. Minich, W.B. Selenium Metabolism and Biosynthesis of Selenoproteins in the Human Body. Biochemistry 2022, 87, S168–S177. [Google Scholar] [CrossRef] [PubMed]
  4. Zhang, F.; Li, X.; Wei, Y. Selenium and Selenoproteins in Health. Biomolecules 2023, 13, 799. [Google Scholar] [CrossRef] [PubMed]
  5. Serov, D.A.; Khabatova, V.V.; Tikhonova, I.V.; Reut, V.E.; Pobedonostsev, R.V.; Astashev, M.E. Study of the Effects of Selenium Nanoparticles and Their Combination with Immunoglobulins on the Survival and Functional State of Polymorphonuclear Cells. Opera Med. Physiol. 2022, 4, 137–159. [Google Scholar]
  6. Mal’tseva, V.N.; Gudkov, S.V.; Turovsky, E.A. Modulation of the Functional State of Mouse Neutrophils by Selenium Nanoparticles In Vivo. Int. J. Mol. Sci. 2022, 23, 13651. [Google Scholar] [CrossRef] [PubMed]
  7. Yazdi, M.H.; Mahdavi, M.; Varastehmoradi, B.; Faramarzi, M.A.; Shahverdi, A.R. The immunostimulatory effect of biogenic selenium nanoparticles on the 4T1 breast cancer model: An in vivo study. Biol. Trace Elem. Res. 2012, 149, 22–28. [Google Scholar] [CrossRef] [PubMed]
  8. Martínez-Esquivias, F.; Gutiérrez-Angulo, M.; Pérez-Larios, A.; Sánchez-Burgos, J.A.; Becerra-Ruiz, J.S.; Guzmán-Flores, J.M. Anticancer Activity of Selenium Nanoparticles In Vitro Studies. Anticancer Agents Med. Chem. 2022, 22, 1658–1673. [Google Scholar] [CrossRef]
  9. Ferro, C.; Florindo, H.F.; Santos, H.A. Selenium Nanoparticles for Biomedical Applications: From Development and Characterization to Therapeutics. Adv. Healthc. Mater. 2021, 10, 2100598. [Google Scholar] [CrossRef]
  10. Deepasree, K.; Subhashree, V. Therapeutic potential of selenium nanoparticles. Front. Nanotechnol. 2022, 4, 1042338. [Google Scholar]
  11. Jiang, X.; Kemal, L.; Yu, A. Silver-induced growth of selenium nanowires in aqueous solution. Mater. Lett. 2007, 61, 2584–2588. [Google Scholar] [CrossRef]
  12. Sarkar, J.; Saha, S.; Dey, P.; Acharya, K. Production of selenium nanorods by phytopathogen, Alternaria alternata. Adv. Sci. Lett. 2012, 10, 111–114. [Google Scholar] [CrossRef]
  13. Kumar, A.; Sevonkaev, I.; Goia, D.V. Synthesis of selenium particles with various morphologies. J. Colloid Interface Sci. 2014, 416, 119–123. [Google Scholar] [CrossRef] [PubMed]
  14. Cao, X.; Xie, Y.; Zhang, S.; Li, F. Ultra-thin trigonal selenium nanoribbons developed from series-wound beads. Adv. Mater. 2004, 16, 649–653. [Google Scholar] [CrossRef]
  15. Yin, H.; Xu, Z.; Bao, H.; Bai, J.; Zheng, Y. Single crystal trigonal selenium nanoplates converted from selenium nanoparticles. Chem. Lett. 2005, 34, 122–123. [Google Scholar] [CrossRef]
  16. Zhang, H.; Yang, D.; Ji, Y.; Ma, X.; Xu, J.; Que, D. Selenium nanotubes synthesized by a novel solution phase approach. J. Phys. Chem. B 2004, 108, 1179–1182. [Google Scholar] [CrossRef]
  17. Zhang, B.; Dai, W.; Ye, X.; Zuo, F.; Xie, Y. Photothermally assisted solution-phase synthesis of microscale tubes, rods, shuttles, and an urchin-like assembly of single-crystalline trigonal selenium. Angew. Chem. Int. Ed. Engl. 2006, 45, 2571–2574. [Google Scholar] [CrossRef] [PubMed]
  18. Zhao, Y.; Wang, Y.; Ran, F.; Cui, Y.; Liu, C.; Zhao, Q.; Gao, Y.; Wang, D.; Wang, S. A comparison between sphere and rod nanoparticles regarding their in vivo biological behavior and pharmacokinetics. Sci. Rep. 2017, 7, 4131. [Google Scholar] [CrossRef]
  19. Drexler, H.G.; Uphoff, C.C. Mycoplasma contamination of cell cultures: Incidence, sources, effects, detection, elimination, prevention. Cytotechnology 2002, 39, 75–90. [Google Scholar] [CrossRef]
  20. Gaidin, S.G.; Turovskaya, M.V.; Gavrish, M.S.; Babaev, A.A.; Mal’tseva, V.N.; Blinova, E.V.; Turovsky, E.A. The selective BDNF overexpression in neurons protects neuroglial networks against OGD and glutamate-induced excitotoxicity. Int. J. Neurosci. 2020, 130, 363–383. [Google Scholar] [CrossRef]
  21. Schmid, I.; Uittenbogaart, C.; Jamieson, B.D. Live-cell assay for detection of apoptosis by dual-laser flow cytometry using Hoechst 33342 and 7-amino-actino-mycin D. Nat. Protoc. 2007, 2, 187–190. [Google Scholar] [CrossRef] [PubMed]
  22. Turovsky, E.A.; Varlamova, E.G. Mechanism of Ca2+-Dependent Pro-Apoptotic Action of Selenium Nanoparticles, Mediated by Activation of Cx43 Hemichannels. Biology 2021, 10, 743. [Google Scholar] [CrossRef] [PubMed]
  23. Lunin, S.M.; Novoselova, E.G.; Glushkova, O.V.; Parfenyuk, S.B.; Kuzekova, A.A.; Novoselova, T.V.; Sharapov, M.G.; Mubarakshina, E.K.; Goncharov, R.G.; Khrenov, M.O. Protective effect of exogenous peroxiredoxin 6 and thymic peptide thymulin on BBB conditions in an experimental model of multiple sclerosis. Arch. Biochem. Biophys. 2023, 746, 109729. [Google Scholar] [CrossRef] [PubMed]
  24. Varlamova, E.G.; Turovsky, E.A.; Babenko, V.A.; Plotnikov, E.Y. The Mechanisms Underlying the Protective Action of Selenium Nanoparticles against Ischemia/Reoxygenation Are Mediated by the Activation of the Ca2+ Signaling System of Astrocytes and Reactive Astrogliosis. Int. J. Mol. Sci. 2021, 22, 12825. [Google Scholar] [CrossRef] [PubMed]
  25. Khabatova, V.V.; Serov, D.A.; Tikhonova, I.V.; Astashev, M.E.; Nagaev, E.I.; Sarimov, R.M.; Matveyeva, T.A.; Simakin, A.V. Selenium Nanoparticles Can Influence the Immune Response Due to Interactions with Antibodies and Modulation of the Physiological State of Granulocytes. Pharmaceutics 2022, 14, 2772. [Google Scholar] [CrossRef]
  26. Varlamova, E.G.; Gudkov, S.V.; Plotnikov, E.Y.; Turovsky, E.A. Size-Dependent Cytoprotective Effects of Selenium Nanoparticles during Oxygen-Glucose Deprivation in Brain Cortical Cells. Int. J. Mol. Sci. 2022, 23, 7464. [Google Scholar] [CrossRef] [PubMed]
  27. Danese, A.; Leo, S.; Rimessi, A.; Wieckowski, M.R.; Fiorica, F.; Giorgi, C.; Pinton, P. Cell death as a result of calcium signaling modulation: A cancer-centric prospective. Biochim. Biophys. Acta Mol. Cell Res. 2021, 1868, 119061. [Google Scholar] [CrossRef]
  28. Pinton, P.; Giorgi, C.; Siviero, R.; Zecchini, E.; Rizzuto, R. Calcium and apoptosis: ER-mitochondria Ca2+ transfer in the control of apoptosis. Oncogene 2008, 27, 6407–6418. [Google Scholar] [CrossRef]
  29. Varlamova, E.G.; Khabatova, V.V.; Gudkov, S.V.; Turovsky, E.A. Ca2+-Dependent Effects of the Selenium-Sorafenib Nanocomplex on Glioblastoma Cells and Astrocytes of the Cerebral Cortex: Anticancer Agent and Cytoprotector. Int. J. Mol. Sci. 2023, 24, 2411. [Google Scholar] [CrossRef]
  30. Alifieris, C.; Trafalis, D.T. Glioblastoma multiforme: Pathogenesis and treatment. Pharmacol. Ther. 2015, 152, 63–82. [Google Scholar] [CrossRef]
  31. Davis, M.E. Glioblastoma: Overview of Disease and Treatment. Clin. J. Oncol. Nurs. 2016, 20, 2–8. [Google Scholar] [CrossRef] [PubMed]
  32. Silva, G.A. Nanotechnology approaches for the regeneration and neuroprotection of the central nervous system. Surg. Neurol. 2005, 63, 301–306. [Google Scholar] [CrossRef] [PubMed]
  33. Pardridge, W.M. Drug transport across the blood-brain barrier. J. Cereb. Blood Flow Metab. 2012, 32, 1959–1972. [Google Scholar] [CrossRef] [PubMed]
  34. Mehdi, Y.; Hornick, J.L.; Istasse, L.; Dufrasne, I. Selenium in the environment, metabolism and involvement in body functions. Molecules 2013, 18, 3292–3311. [Google Scholar] [CrossRef] [PubMed]
  35. Ahmad, M.S.; Yasser, M.M.; Sholkamy, E.N.; Ali, A.M.; Mehanni, M.M. Anticancer activity of biostabilized selenium nanorods synthesized by Streptomyces bikiniensis strain Ess_amA-1. Int. J. Nanomed. 2015, 10, 3389–3401. [Google Scholar]
  36. Varlamova, E.G.; Goltyaev, M.V.; Simakin, A.V.; Gudkov, S.V.; Turovsky, E.A. Comparative Analysis of the Cytotoxic Effect of a Complex of Selenium Nanoparticles Doped with Sorafenib, “Naked” Selenium Nanoparticles, and Sorafenib on Human Hepatocyte Carcinoma HepG2 Cells. Int. J. Mol. Sci. 2022, 23, 6641. [Google Scholar] [CrossRef] [PubMed]
  37. Feng, Y.; Su, J.; Zhao, Z.; Zheng, W.; Wu, H.; Zhang, Y.; Chen, T. Differential effects of amino acid surface decoration on the anticancer efficacy of selenium nanoparticles. Dalton Trans. 2014, 43, 1854–1861. [Google Scholar] [CrossRef]
  38. Aboul-Fadl, T. Selenium derivatives as cancer preventive agents. Curr. Med. Chem.-Anti-Cancer Agents 2005, 5, 637–652. [Google Scholar] [CrossRef]
  39. Baskar, G.; Lalitha, K.; Aiswarya, R.; Naveenkumar, R. Synthesis, characterization and synergistic activity of cerium-selenium nanobiocomposite of fungal l-asparaginase against lung cancer. Mater. Sci. Eng. C Mater. Biol. Appl. 2018, 93, 809–815. [Google Scholar] [CrossRef]
  40. Shigemi, Z.; Manabe, K.; Hara, N.; Baba, Y.; Hosokawa, K.; Kagawa, H.; Watanabe, T.; Fujimuro, M. Methylseleninic acid and sodium selenite induce severe ER stress and subsequent apoptosis through UPR activation in PEL cells. Chem.-Biol. Interact. 2017, 266, 28–37. [Google Scholar] [CrossRef]
  41. Varlamova, E.G.; Goltyaev, M.V.; Turovsky, E.A. The Role of Selenoproteins SELENOM and SELENOT in the Regulation of Apoptosis, ER Stress, and Calcium Homeostasis in the A-172 Human Glioblastoma Cell Line. Biology 2022, 11, 811. [Google Scholar] [CrossRef] [PubMed]
  42. Bruskov, V.I.; Karmanova, E.E.; Chernikov, A.V.; Usacheva, A.M.; Ivanov, V.E.; Emel’yanenko, V.I. Formation of Hydrated Electrons in Water under Thermal Electromagnetic Exposure. Phys. Wave Phenom. 2021, 29, 94–97. [Google Scholar] [CrossRef]
  43. Yu, B.; Liu, T.; Du, Y.; Luo, Z.; Zheng, W.; Chen, T. X-ray-responsive selenium nanoparticles for enhanced cancer chemo-radiotherapy. Colloids Surf. B Biointerfaces 2016, 139, 180–189. [Google Scholar] [CrossRef] [PubMed]
  44. Tsai, Y.; Weissman, A. The Unfolded Protein Response, Degradation from the Endoplasmic Reticulum, and Cancer. Genes Cancer 2010, 1, 764–778. [Google Scholar] [CrossRef] [PubMed]
  45. Marciniak, S.; Ron, D. Endoplasmic Reticulum Stress Signaling in Disease. Physiol. Rev. 2006, 86, 1133–1149. [Google Scholar] [CrossRef] [PubMed]
  46. Qiao, L.; Yan, S.; Dou, X.; Song, X.; Chang, J.; Pi, S.; Zhang, X.; Xu, C. Biogenic Selenium Nanoparticles Alleviate Intestinal Epithelial Barrier Damage through Regulating Endoplasmic Reticulum Stress-Mediated Mitophagy. Oxidative Med. Cell. Longev. 2022, 2022, 3982613. [Google Scholar] [CrossRef] [PubMed]
  47. Grosskreutz, J.; Van Den Bosch, L.; Keller, B.U. Calcium dysregulation in amyotrophic lateral sclerosis. Cell Calcium 2010, 47, 165–174. [Google Scholar] [CrossRef]
  48. Andjelíc, S.; Khanna, A.; Suthanthiran, M.; Nikolić-Zugić, J. Intracellular Ca2+ elevation and cyclosporin A synergistically induce TGF-beta 1-mediated apoptosis in lymphocytes. J. Immunol. 1997, 158, 2527–2534. [Google Scholar] [CrossRef]
  49. Crompton, M. The mitochondrial permeability transition pore and its role in cell death. Biochem. J. 1999, 341, 233–249. [Google Scholar] [CrossRef]
  50. Zhang, Y.; Ren, J. Thapsigargin triggers cardiac contractile dysfunction via NADPH oxidase-mediated mitochondrial dysfunction: Role of Akt dephosphorylation. Free Radic. Biol. Med. 2011, 51, 2172–2184. [Google Scholar] [CrossRef]
Figure 1. SeNrs formation scheme, shape and distribution by size. (A) Schematic diagram of a possible synthesis mechanism for SeNrs during laser fragmentation. (B) TEM image of a single selenium rod (scale mark size: 200 nm). (C) TEM image of obtained Se nanorods (scale mark size: 1 µm). (D) SeNrs number distribution by size. (E) SeNrs volume distribution by size. Disc centrifuge and a DLS particle size analyzer were used to collect data. PDI = 0.25 ± 0.5; (n = 3).
Applsci 13 10763 g001
Figure 2. Shape and size distribution of Se nanoparticles. (A) TEM image of a 130 nm spherical selenium nanoparticle (scale mark size: 100 nm). (B) TEM image of a single SeNP (scale mark size: 1 µm). (C) SeNPs number distribution by sizes. (D) SeNPs volume distribution by sizes. Disc centrifuge and a DLS particle size analyzer were used to obtain data. PDI = 0.27 ± 0.5; (n = 3).
Applsci 13 10763 g002
Figure 3. Activation of the Ca2+ responses of A-172 cells (A,B) and L-929 cells (C,D) by different concentrations of selenium nanorods (SeNrs) or selenium nanoparticles (SeNPs). (E,F) Dependence of the Ca2+ responses amplitude of A-172 (E) and L-929 (F) cells on the different concentrations (black squares) and SeNPs (red circles). Data were approximated by a sigmoid function. The averaged Ca2+ signals of cells are presented (panels (AD)). Ca2+ signals averaged over 3 independent experiments were used to plot the dose dependences of Ca2+ signal amplitudes from the concentrations of nanostructures (panels (E,F)).
Applsci 13 10763 g003
Figure 4. Effect of 24-h and 48-h incubation of A-172 cells with different SeNrs or SeNPs concentrations. (A,B) The cell viability after 24-h pre-incubation with different concentrations of SeNrs (A) and SeNPs (B). (C,D) Cytograms demonstrating the cell viability after 48-h pre-incubation with various concentrations of SeNrs (C) and SeNPs (D). X-axis: the intensity of propidium iodide (PI) fluorescence; Y-axis: the intensity of Hoechst 33342 fluorescence. Cells were stained with the probes after 24-h or 48-h pre-incubation with different concentrations of nanostructures. The presented data were obtained on three cell cultures.
Applsci 13 10763 g004
Figure 5. Effect of 24-h and 48-h pre-incubation of L-929 cells with various SeNrs or SeNPs concentration. (A,B) The viability of A-172 cells after 24-h pre-incubation with different concentrations of SeNrs (A) and SeNPs (B). (C,D) Cytograms demonstrating the viability of A-172 cells after 48-h pre-incubation with different concentrations of SeNrs (C) and SeNPs (D). X-axis: the intensity of propidium iodide fluorescence; Y-axis: the intensity of Hoechst 33342 fluorescence. Cells were stained with the probes after 24-h or 48-h pre-incubation with different concentrations of nanostructures. The experiments were carried out on three cell cultures of different passages.
Applsci 13 10763 g005
Figure 6. The patterns of expression of genes, which encode pro-apoptotic proteins in A-172 (A) and L-929 (B) cells after 24-h pre-incubation with various (1, 5, 10 µg/mL) selenium nanorods (SeNrs) or selenium nanoparticles (SeNPs) concentrations. The gene expression level in control cells was taken as 1. n = 3.
Applsci 13 10763 g006
Figure 7. The patterns of expression of genes encoding ER-stress proteins, which are involved in activation of apoptosis in A-172 (A) and L-929 (B) cells after 24-h incubation with different concentrations (1, 5, 10 µg/mL) of selenium nanorods (SeNrs) or selenium nanoparticles (SeNPs). The gene expression level was taken as 1 in control cells. n = 3.
Applsci 13 10763 g007
Figure 8. The expression patterns of genes encoding selenoproteins and selenium-containing proteins in A-172 (A) and L-929 (B) cells after 24-h incubation with different concentrations (1, 5, 10 µg/mL) of selenium nanofibers (SeNrs) or selenium nanoparticles (SeNPs). The gene expression level was taken as 1 in control cells. n = 3.
Applsci 13 10763 g008
Figure 9. Effect of A-172 human glioblastoma cells incubation (A,C) and L-929 mouse fibroblast cells (B,D) with different (1, 5, 10 µg/mL) selenium nanorod (SeNrs) or selenium nanoparticle (SeNPs) concentrations on Ca2+ capacity of endoplasmic reticulum. (A,C) Ca2+-responses of A-172 cells to the application of thapsigargin (TG, 10 µM) in a calcium-free medium contained 0.5 mM EGTA after 24-h (A) and 48-h (C) incubation with different concentrations (1, 5, 10 µg/mL) of selenium nanorods (SeNrs) or selenium nanoparticles (SeNPs). (B,D) Ca2+-responses of L-929 cells to the application of thapsigargin (TG, 10 µM) in a calcium-free medium supplemented with 0.5 mM EGTA after 24-h (B) and 48-h (D) pre-incubation with different concentrations (1, 5, 10 µg/mL) of selenium nanorods (SeNrs) or selenium nanoparticles (SeNPs). Ca2+ responses for panels (AD) are averaged over several dozens of cells.
Applsci 13 10763 g009
Table 1. Primers for the synthesis of human mRNA fragments.
Gene NameForward Primer 5′–>3′Reverse Primer 5′–>3′
GAPDHACATCGCTCAGACACCATGGCCAGTGAGCTTCCCGTT
SELENOTTCTCCTAGTGGCGGCGTCGTCTATATATTGGTTGAGGGAGG
SELENOMAGCCTCCTGTTGCCTCCGCAGGTCAGCGTGGTCCGAAG
SELENOFGGAGGAAGCACAATTTGAAACCTATGCGTTCCAACTTTTCACTC
SELENOKTTTACATCTCGAACGGACAAGCAGCCTTCCACTTCTTGATG
SELENOSTGGGACAGCATGCAAGAAGGCGTCCAGGTCTCCAGG
SELENONTGATCTGCCTGCCCAATGTCAGGAACTGCATGTAGGTGG
DIO2AGCTTCCTCCTCGATGCCAAAGGAGGTCAAGTGGCTG
CHOPGCTCTGATTGACCGAATGGTCTGGGAAAGGTGGGTAGTG
GADD34CTCCGAGAAGGTCACTGTCCGACGAGCGGGAAGGTGTGG
PUMACAGATATGCGCCCAGAGATCCATTCGTGGGTGGTCTTC
BIMGGACGACCTCAACGCACAGTACGAGGTAAGGGCAGGAGTCCCA
CAS–3GCATTGAGACAGACAGTGGTGAATAGAGTTCTTTTGTGAGCATG
CAS–4CACGCCTGGCTCTCATCATATAGCAAATGCCCTCAGCG
BAXGGGCTGGACATTGGACTTCAACACAGTCCAAGGCAGCTG
BAKGAGAGTGGCATCAATTGGGGCAGCCACCCCTCTGTGCAATCCA
BCL-2GGTGAACTGGGGGAGGATTGAGCCAGGAGAAATCAAACAGAG
ATF–4GTGTTCTCTGTGGGTCTGCCGACCCTTTTCTTCCCCCTTG
ATF–6AACCCTAGTGTGAGCCCTGCGTTCAGAGCACCCTGAAGA
XBPuACTCAGACTACGTGCACCTCGTCAATACCGCCAGAATCC
XBPsCTGAGTCCGCAGCGGTGCAGGGGTCCAAGTTGTCCAGAATG
GPX1AAGATCCAACCCAAGGGCAAGCATGAGTGCCGGTGGAAGG
GPX4AAGATCCAACCCAAGGGCAAGCATGAGTGCCGGTGGAAGG
TXNRD1CAACAAATGTTATGCAAAAATAATCACACTGGGGCTTAACCTCAG
TXNRD3CTCTTTAGAAAAGTGTGATTATATTGCCCACATTTCATTGCAGCTG
Nf-kBTACTTTCTCACTTTTTGCCCACGGTCTACAGGAAGGCGTGG
Table 2. Primers for the synthesis of mouse mRNA fragments.
Gene NameForward Primer 5′–>3′Reverse Primer 5′–>3′
GAPDHAAGGTGGTGAAGCAGGCATCCTCTTGCTCAGTGTCCTTGC
SELENOTTGATTGAGAACCAGTGTATGTCGGTACAACGAGCCTGCCAAG
SELENOMCGCCTAAAGGAGGTGAAGGCCTTGCGGTAGAAGCCGAGCTC
SELENOFAGGGTGCTGTCAGGAAGAAGCGTTCCAACTTCTCGCTCAG
SELENOKGAAGAGGGCCACCAGGAAACGGAATTCCCAGCATGACCTC
SELENOSGGACCAAGCCGAGACTGTTCCTTCTTGCATGCTGTCCCAC
SELENONAAGATGGCTTCCTAGGGGTCCTGAGGGGCAAAGCGGGTC
DIO2GCTTATCTCTGCCCCCATTGCACACATAAACGACCTCCTTC
CHOPCAGCTGGGAGCTGGAAGCCTGGACCACTCTGTTTCCGTTTCC
GADD34GAGTCCCATGAAGAGATTGTACACCAGCCCAGCAGCACTTAG
PUMATGAAGATCTGCGCCGGGAGGAGAGGGACATGACGCGTG
BIMAATGGCCGGCTATGGATGATGGCCAATTGGGTTCACTGTCTG
CAS–3GACCCGTCCTTTGAATTTCTCCTCTTCATCATTCAGGCCTGC
CAS–4TTTTCTTTTCTTCTCAGCTACAGTGTTGGTGTTATCATTTGGAGG
BAXTAAAGTGCCCGAGCTGATCAGAACCTTCCCAGCCACCCTGGTCTT
BAKCAGATGGATCGCACAGAGAGGCGTCTTTGCCCTGGGGAG
BCL-2GGTGAACTGGGGGAGGATTGAGCCAGGAGAAATCAAACAGAG
ATF–4TCGGGTTTGGGGGCTGAAGAAACAGAGCATCGAAGTCAAAC
ATF–6AGGAGGGGAGATACGTTTTACCGAGGAGCTTTTGATGTGGAG
XBPuGAGTCCGCAGCAGAGTCCGCAGCGGAGGCTGGTAAGGAACTAG
XBPsAGTCCGCAGCACAGCAGGTAGAGAAAGGGAGGCTGGTAAG
GPX1GGGGAGCCTGTGAGCCTGGGGACGTACTTGAGGGAATTC
GPX4GATGAAAGTCCAGCCCAAGGGAAGGCTCCAGGGGTCACAG
TXNRD1CAACAAATGTTATGCAAAAATAATCACACTGGGGCTTAACCTCAG
TXNRD3CTCTTTAGAAAAGTGTGATTATATTGCCCACATTTCATTGCAGCTG
Nf-kBAAGTGCAAAGGAAACGCCAGAAACTACCGAACATGCCTCCACCA
Table 4. Influence of different concentrations of SeNPs on the survival of human glioblastoma A-172 cells after 24 and 48 h of exposure.
24 h Pre-Incubation48 h Pre-Incubation
Control1 µg/mL5 µg/mL10 µg/mLControl1 µg/mL5 µg/mL10 µg/mL
Viable100%76%37%18%100%39%12%0%
Early apoptotic0%6%8%2%0%11%17%4%
Apoptotic0%18%47%59%0%47%57%44%
Necrosis0%0%8%21%0%3%14%52%
Table 5. Effect of different SeNrs concentrations on the survival of L-929 mouse fibroblast cells after 24 and 48 h of exposure.
24 h Pre-Incubation48 h Pre-Incubation
Control1 µg/mL5 µg/mL10 µg/mLControl1 µg/mL5 µg/mL10 µg/mL
Viable100%89%94%96%100%91%89%86%
Early apoptotic0%11%6%4%0%9%11%14%
Apoptotic0%0%0%0%0%0%0%0%
Necrosis0%0%0%0%0%0%0%0%
Table 6. Effect of different SeNPs concentrations on the survival of L-929 mouse fibroblast cells after 24 and 48 h of exposure.
24 h Pre-Incubation48 h Pre-Incubation
Control1 µg/mL5 µg/mL10 µg/mLControl1 µg/mL5 µg/mL10 µg/mL
Viable100%100%98%94%100%93%81%51%
Early apoptotic0%0%2%6%0%7%11%28%
Apoptotic0%0%0%0%0%0%8%16%
Necrosis0%0%0%0%0%0%0%5%
Disclaimer/Publisher’s Note: The statements, opinions and data contained in all publications are solely those of the individual author(s) and contributor(s) and not of MDPI and/or the editor(s). MDPI and/or the editor(s) disclaim responsibility for any injury to people or property resulting from any ideas, methods, instructions or products referred to in the content.

