

Hollow-Core Optical Fibers for Telecommunications and Data Transmission


Abstract
1. Introduction
- Minimum attenuation: 0.14–0.16 dB/km @ 1550 nm;
- Low-loss bandwidth: ≈1250–1750 nm, or ≈68 THz @ ≤ 0.40 dB/km;
- Latency and effective refractive index: neff = 1.45–1.47;
- Optical nonlinearities, in particular Kerr, Raman and Brillouin effects;
- Maximum optical power carried by fiber without damage.
- The length and cost of fiber needed is low in comparison to the economic or other benefits obtained (acceptable cost/benefit ratio);
- Technical requirements cannot be met using traditional fibers. Examples include mid-infrared transmission (λ ≥ 1.75 µm), phase-sensitive systems operating in variable temperatures, high-power applications, and systems affected by backscattering.
2. Main Types of Hollow-Core Fibers
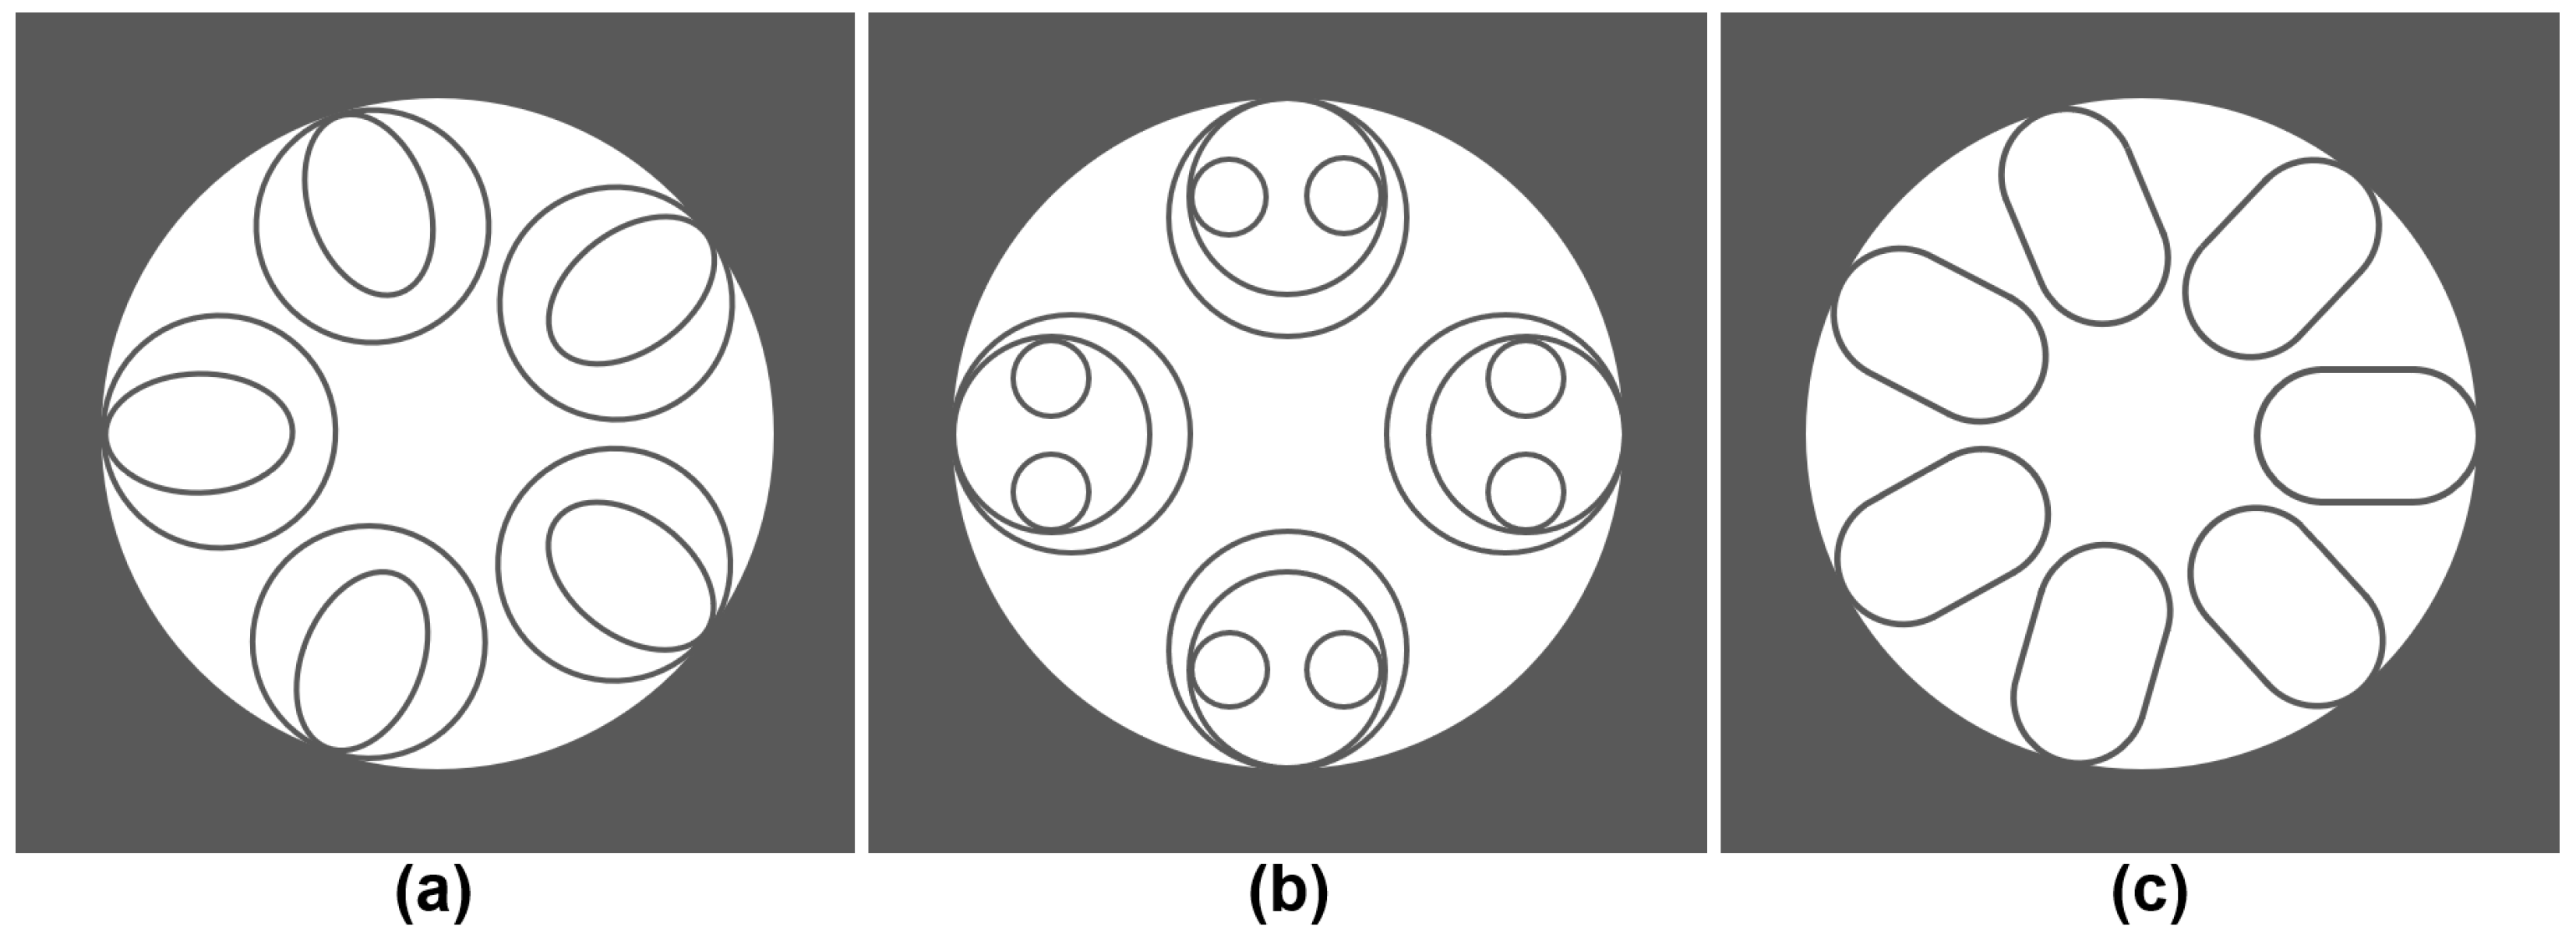
2.1. Basic Designs
- (a)
- Bragg Fibers, where the core is enclosed with multiple alternating layers of transparent materials with high and low refractive index constituting a Bragg mirror (Figure 1a);
- (b)
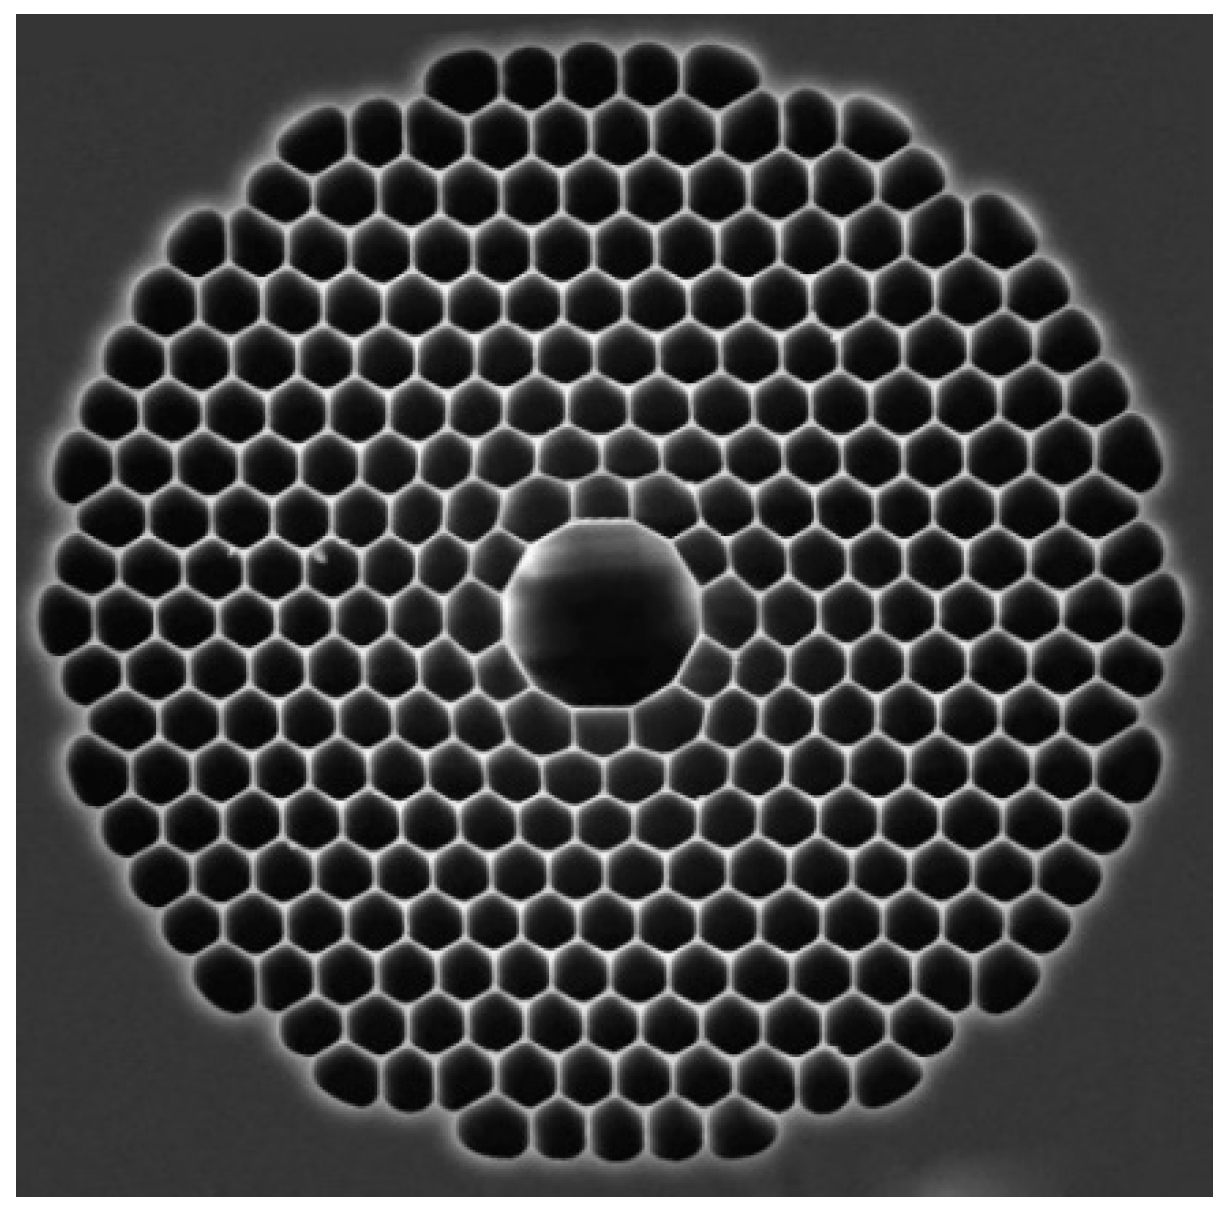
- Hollow-core Photonic Bandgap Fibers (HC-PBGFs), where multiple layers of periodic glass/air structure around the core block the radial propagation of light (Figure 1b). PBGFs with solid core are not covered here;
- (c)
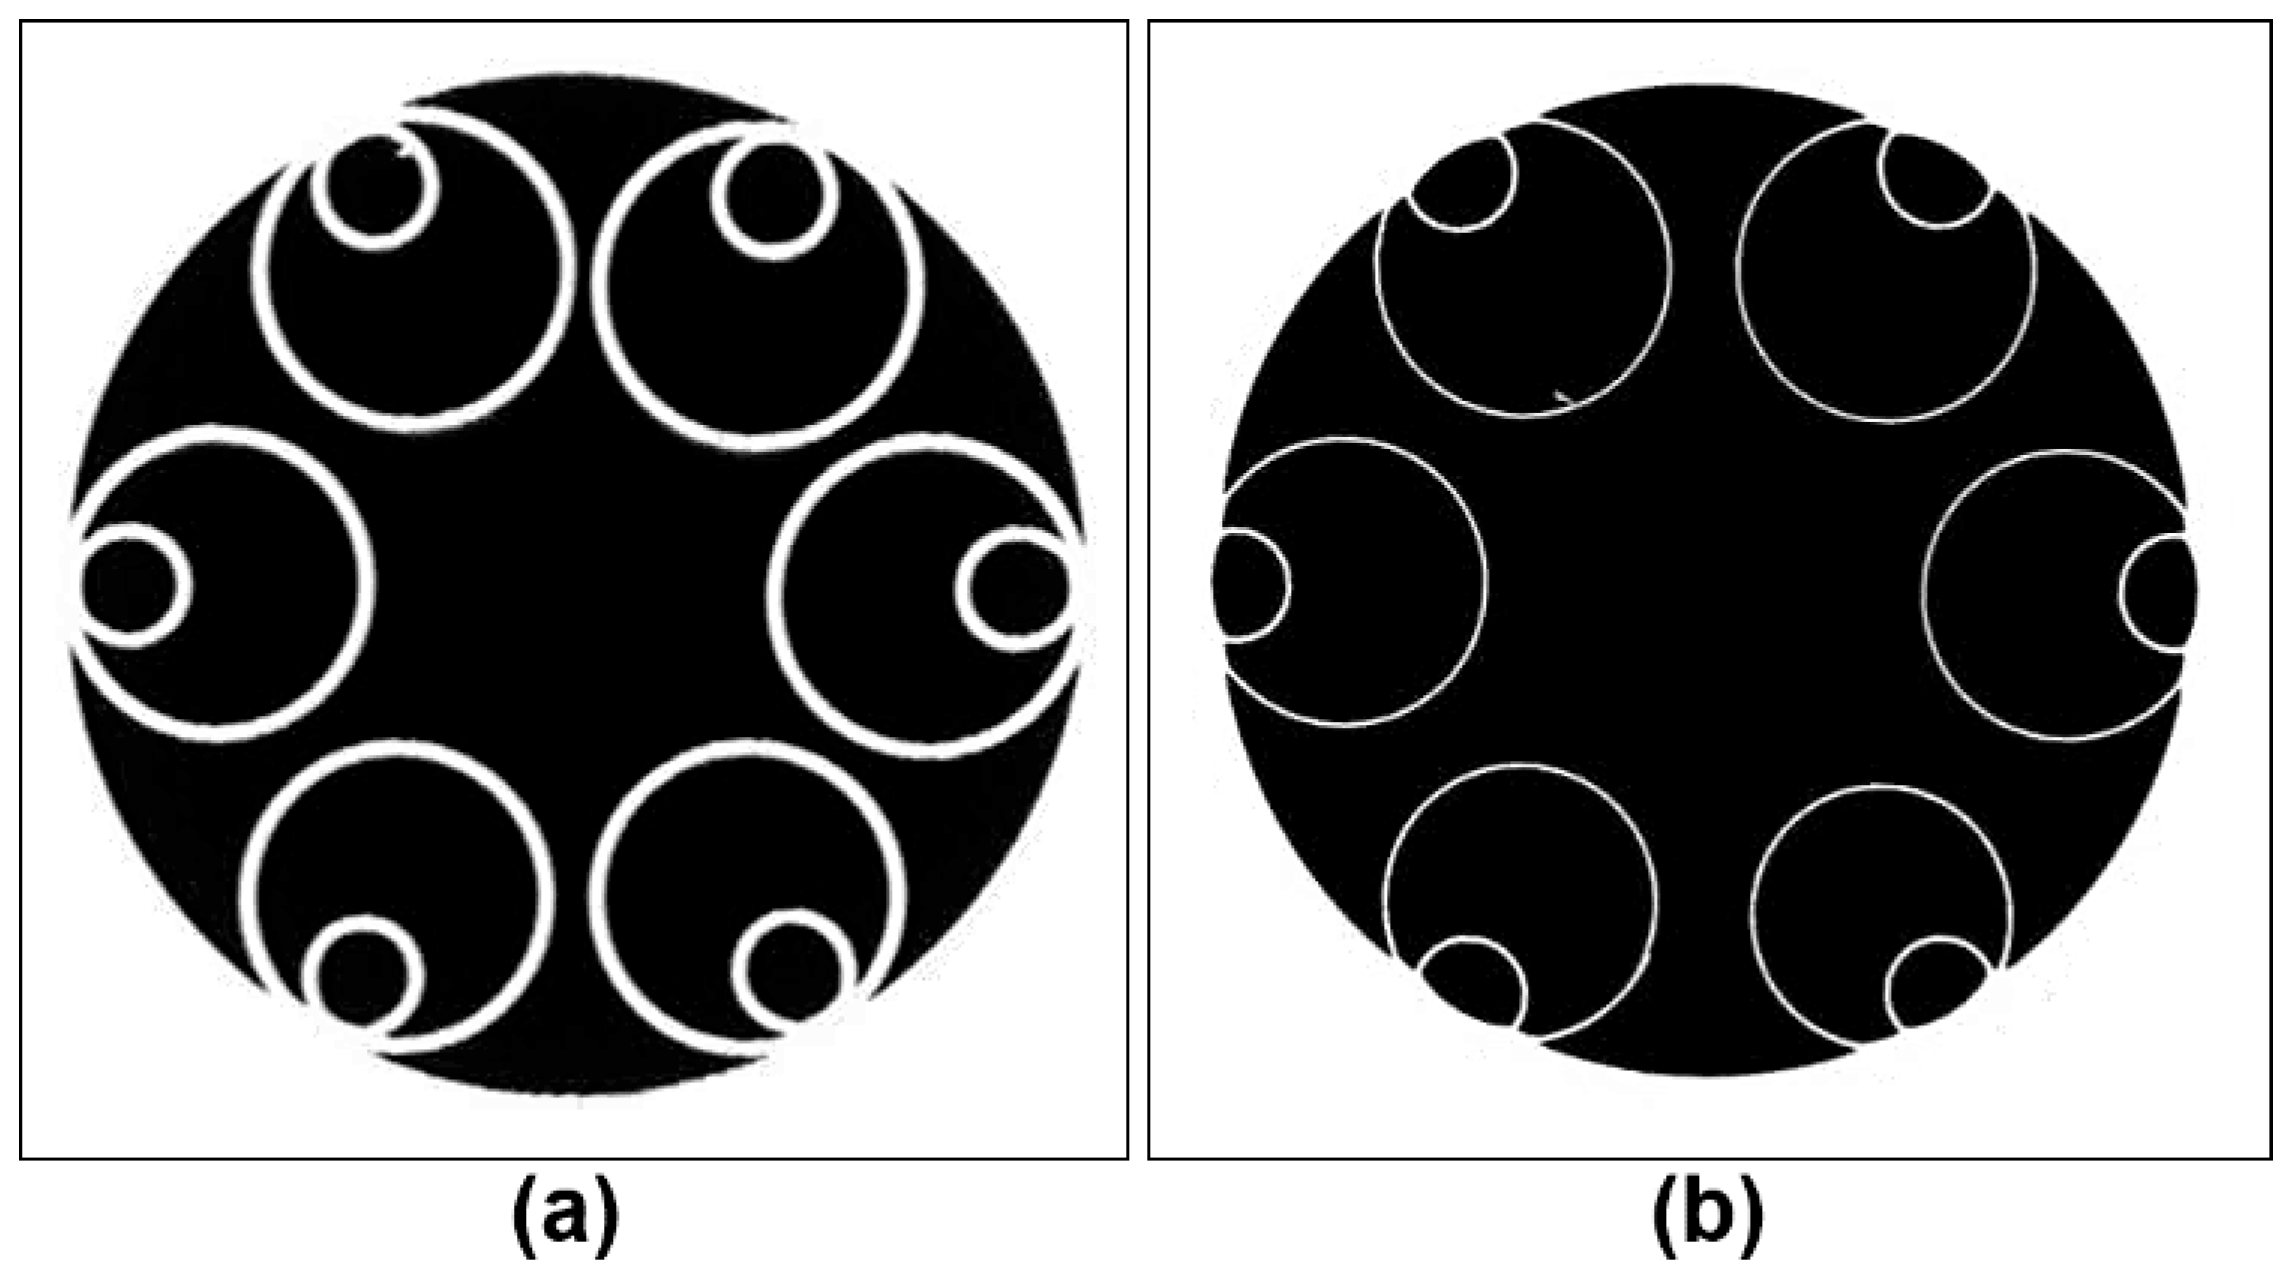
- Anti-Resonant Fibers (ARFs), where the optical anti-resonance in multiple flat membranes or walls of tubes blocks the radial propagation of light. (Figure 1c).
2.2. Main Differences
- Assembling large number of tubes (263 for fiber in Figure 1b) is labor-intensive and requires clean room;
- The dimensions of parts change during the consolidation of preform and the drawing of fiber due to the surface tension of softened glass and variations in the gas pressure in tubes.
3. Bragg Fibers
- (a)
- The material of the fiber’s outer tube (jacket) does not interact with guided radiation; it must only provide mechanical strength and hermeticity,
- (b)
- Bandwidth and attenuation depend solely on the design of the Bragg reflector and the properties of the materials used: refractive index, absorbance, and scattering.
- For almost 100% reflection with a low number of layers, usually 8–20 (Figure 3), the difference (“contrast”) of the refractive indices must be high, and materials of very different chemical compositions are required. Examples include poly(etherimide) (PEI) or poly(ether sulfone) (PES) as low index materials and arsenic triselenide (As2Se3) as a high index material, with n = 1.62 (PEI) and n = 2.73 (As2Se3) at 2000 nm, respectively [15,16]. The latter material is also poisonous.
- The materials of the Bragg reflector and cladding (jacket) shall have similar melting temperatures and melt viscosities to allow fiber drawing.
4. Photonic Bandgap (Photonic Crystal) Fibers
4.1. Fibers with Regular Photonic Structure
- (a)
- Propagation of higher-order modes in the photonic cladding, and modal dispersion, even when the core diameter is typical for single-mode fibers (10–20 µm) [21];
- (b)
- (c)
- High surface scattering loss (SSL) [26]—see Section 6.2;
- (d)
- Many HC-PBGFs have low loss only in a few narrow (10–30 nm) sections of the spectrum (Figure 4) [20,27,28] because of interference between the lossy surface modes and the fundamental mode [11]. However, fibers of this type with a broad (≈150 nm) transmission bandwidth centered around 1550 nm have been developed.


4.2. Single-Mode PBGFs with Shunts
- In solid-core fibers, mode field diameter and effective area are larger than the dimensions of the core, as diffraction causes light to “spill” into the cladding;
- In hollow-core fibers, the mode field is “pushed” towards the center of the core, away from the photonic cladding, and MFD is smaller than the core diameter (Table 2);
- The mode field diameter of HC-PBGFs decreases with the wavelength, while that of solid-core fibers increases with the wavelength at similar rate (Figure 7).
4.3. Commercial Fibers and Their Parameters

| Parameter | HC-1300 | HC-1550 | SMF-28e+ |
|---|---|---|---|
| Core diameter (nom.) [µm] | 10.0 | 11.5 | 8.2 |
| Mode field diameter (nom.) [µm] | 7.5 @ 1300 nm | 9.0 @ 1550 nm | 9.2 @ 1310 nm 10.4 @ 1550 nm |
| Cladding diameter (nom.) [µm] | 125 | 120 | 125 |
| Range of operating wavelengths [nm] | 1290–1330 | 1490–1680 | 1260–1675 |
| Attenuation (max.) [dB/km] | 60 @ 1300 nm | 30 @ 1550 nm | 0.35 @ 1310 nm 0.20 @ 1550 nm |
| Attenuation (typ.) [dB/km] | 30 @ 1300 nm | 18.5 @ 1550 nm | 0.18 @ 1550 nm |
| Chromatic dispersion (typ.) [ps/nm·km] | 66 @ 1300 nm | 42 @ 1550 nm | 17 @ 1550 nm |
| Parameter | AccuCore | SMF-28e+ |
|---|---|---|
| Core diameter (nom.) [µm] | 25.0 | 8.2 |
| Core area (nom.) [µm2] | 491 | 52.8 |
| Effective area, Aeff (nom.) [µm2] | 200 | 82 |
| Ratio of Aeff to core area | 0.41 | 1.55 |
| Mode field diameter, MFD (nom.) [µm] | 17.9 @ 1550 nm | 10.4 @ 1550 nm |
| Cladding diameter (nom.) [µm] | 82 1 | 125 |
| Jacket diameter (see Section 7.1) [µm] | 220 1 | (125) |
| Effective refractive index, neff @ 1550 nm | 1.005 | 1.468 |
| Low-loss band [nm] | See Figure 4 | 1260–1675 |
| Attenuation (max.) [dB/km] | 7.0 @ 1550 nm | 0.20 @ 1550 nm |
| Attenuation (typ.) [dB/km] | 4.0 @ 1550 nm | 0.18 @ 1550 nm |
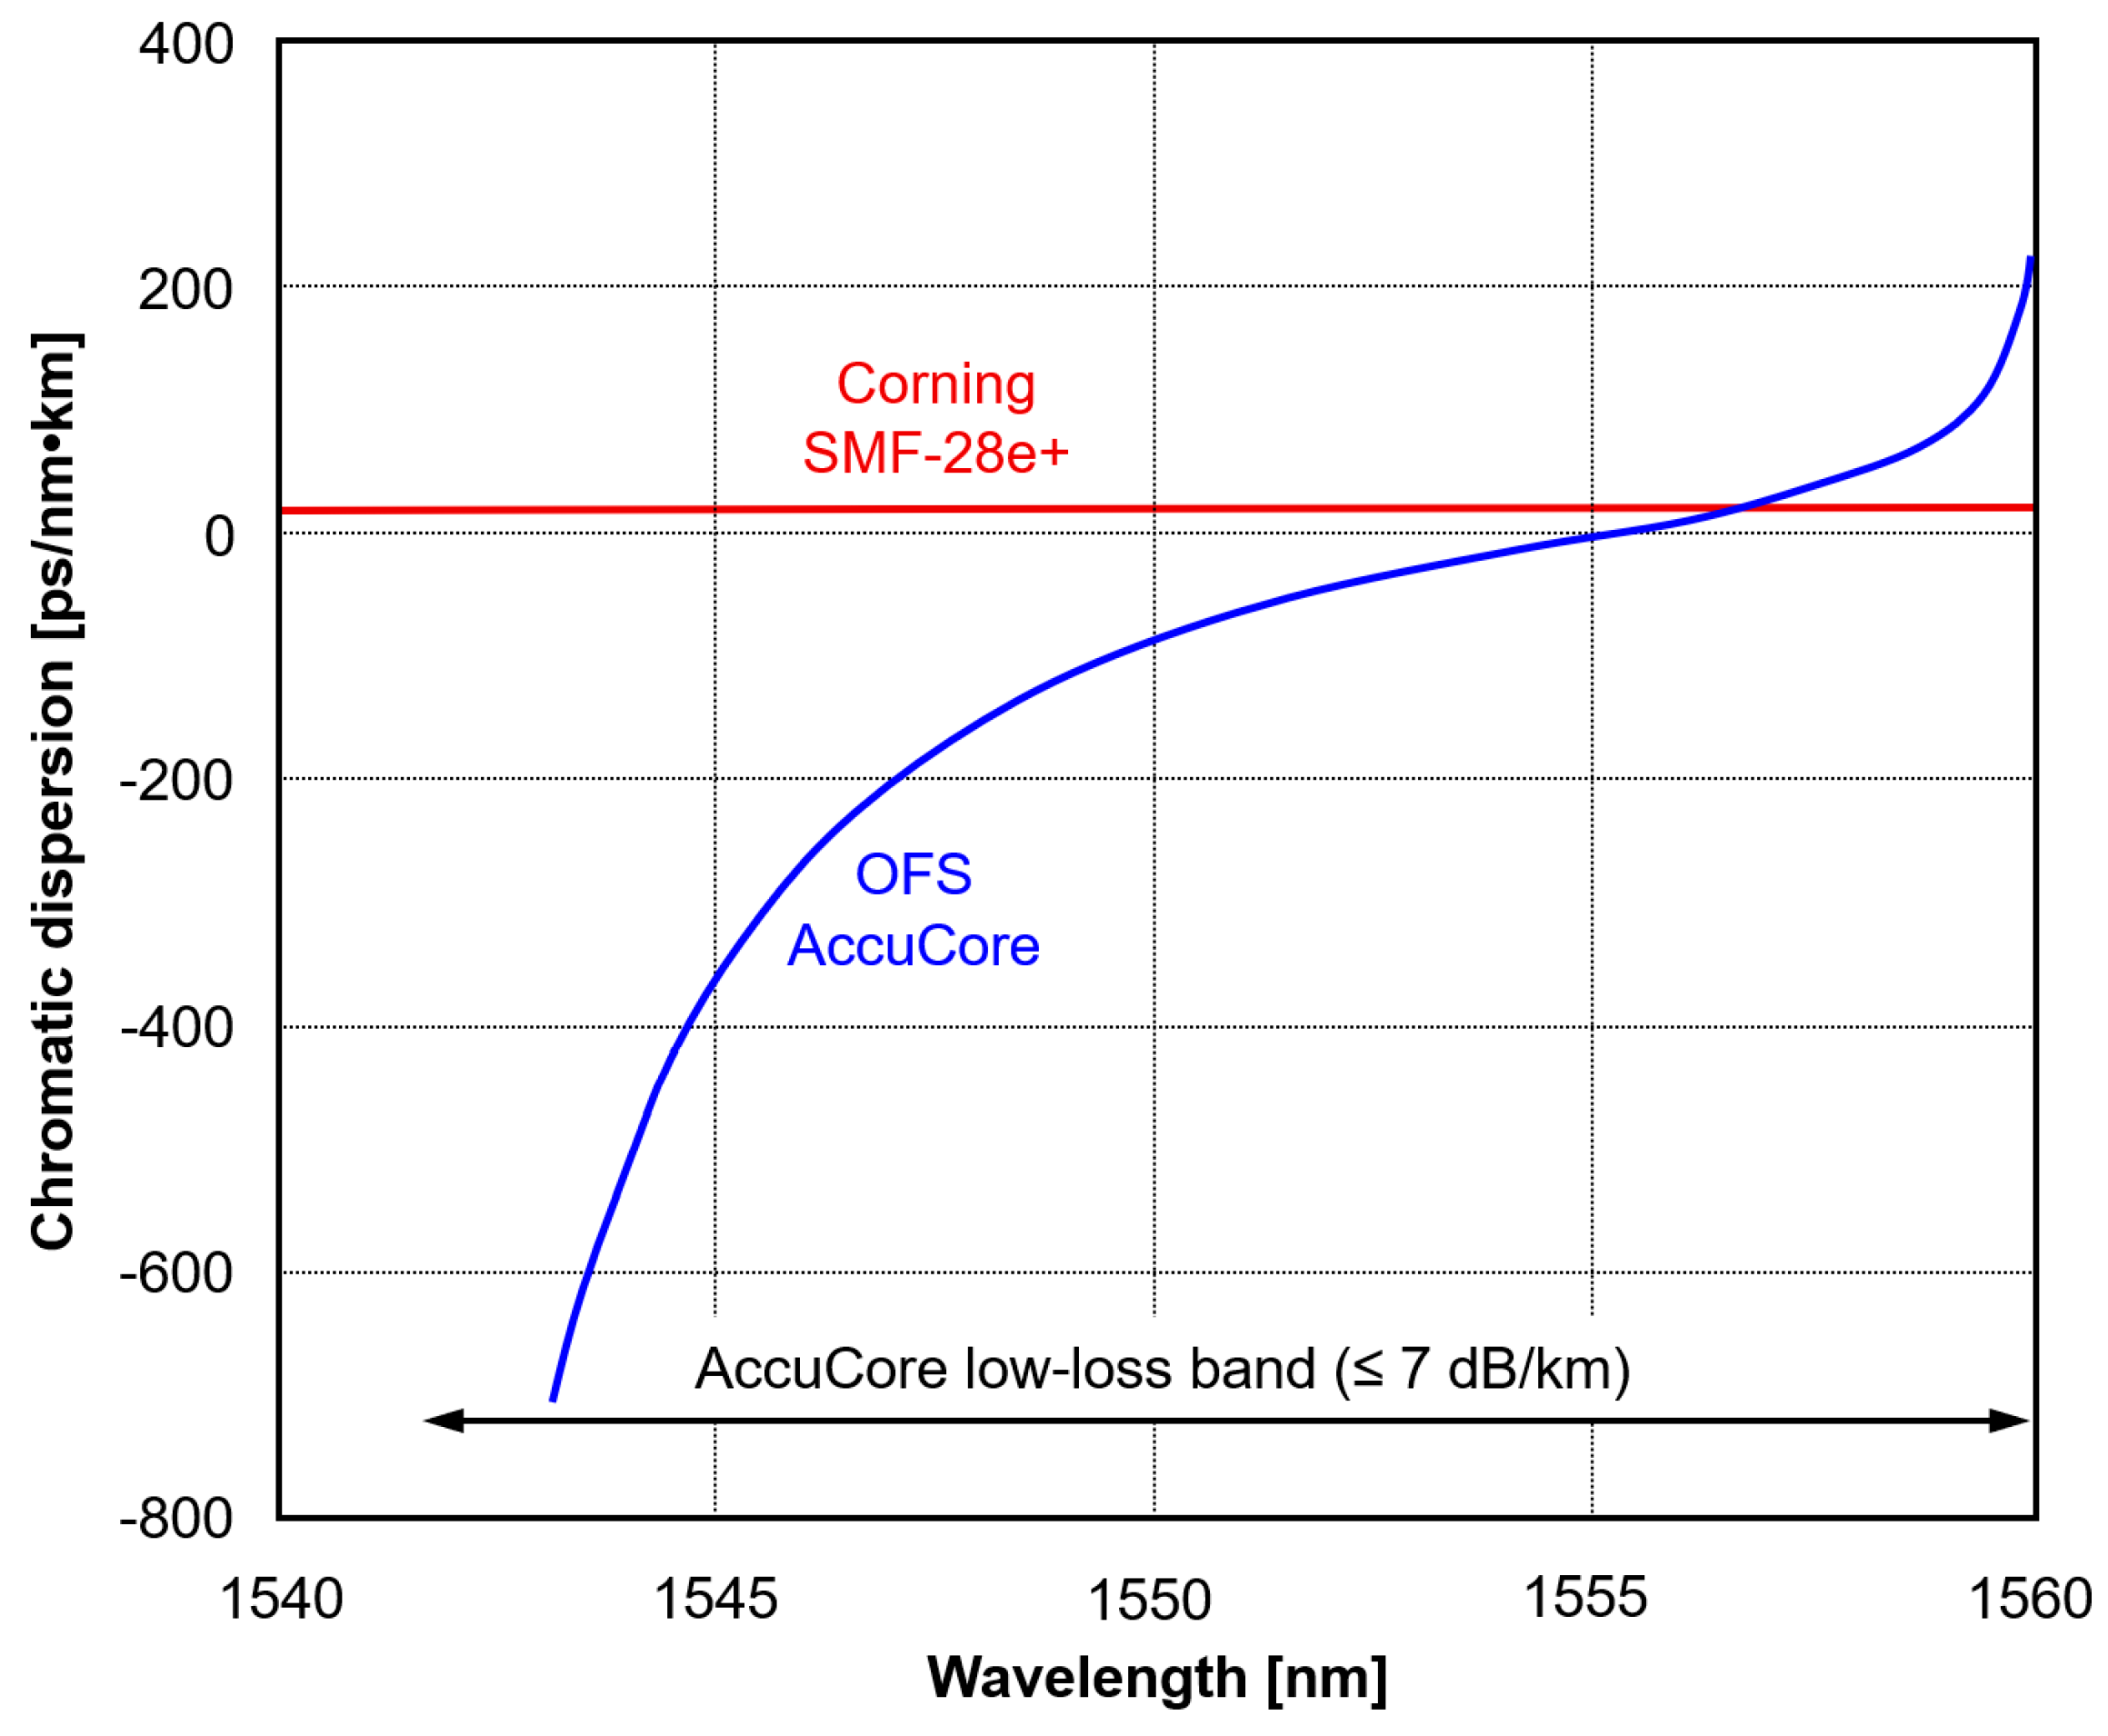
| Chromatic dispersion (typ.) [ps/nm⋅km] | −70 @ 1550 nm 2 | 17 @ 1550 nm |
| PMD [ps/√km] | 9.15 3 | ≤0.10 |
- Low optical nonlinearity and ability to handle high optical power;
- Resistance to ionizing radiation.
- Lack of 90° rotational symmetry: eight shunts would be better (Section 7.2);
5. Fibers with Anti-Resonant Guidance
5.1. Optical Resonance and Anti-Resonance
5.2. Kagome Fibers
5.3. NANF and DNANF Fibers

- Low latency (−31,7% vs. SMF-28e+);
- Low and weakly wavelength-dependent chromatic dispersion;
- Low optical nonlinearity and ability to handle high optical power;
- Resistance to ionizing radiation.
- Difficult splicing (Section 10);
- Sensitivity to contamination in adverse environments (Section 6.3 and Section 6.4);
- Large, non-standardized diameter of most fibers (Section 7.1).
6. New Transmission Medium: Gas
6.1. New Properties of Fiber
- η = 10−3–10−2 (0.1–1.0%, or 1000–10,000 ppm) for HC-PBGF fibers;
- η = 10−5–3 × 10⁻⁴ (0.001–0.03%, or 10–300 ppm) for ARF fibers like NANF.
- Effective refractive index (neff) of fiber is low: ≈1.005 for HC-PBGF, ≈1.001 for NANF.
- Optical nonlinearities resulting from interaction with glass are reduced in proportion to optical overlap coefficient η multiplied by the ratio of effective core area (Aeff) of SMF and HCF, approx. 1:4. In a typical HC-PBGF, Kerr nonlinearity is ca. 500× lower than in SMF; for NANF, the difference is in the order of 1:10,000. In a fiber with very low η like NANF, the contribution of gas to nonlinear effects can dominate [5].
- Backscattering is mostly produced by surface scattering, which is quite strong in HC-PBGFs, almost absent in ARFs, and filler gas, and dominant in NANF/DNANF, but weak; the contribution of Rayleigh scattering in fused silica is marginal [57]. Backscattering in ARFs is very weak and the fiber can hardly be tested with OTDR—see Section 7.4.
- Chromatic dispersion (CD) and polarization mode dispersion (PMD) in HCFs are substantially different from such parameters of solid-core fibers, and very different for each kind of HCF—see Section 7.2 and Table 2 and Table 3.
- Splicing and termination techniques must ensure hermetic sealing to prevent fiber contamination, e.g., with water vapor—see Section 6.3 and Section 6.4.
- Contaminated fiber can be purged with pure gas, but this can take several days for a 1 km long fiber with 100 µm core at 100 kPa overpressure [58]—See Section 6.4.
- HCFs exhibit much better stability of latency than solid-core fibers when subjected to variable temperatures, but not strain—see Section 7.3.
- HCFs are resistant to ionizing radiation, as color centers and associated bulk absorption in fused silica have little effect on fiber attenuation [59]. However, radiation can deteriorate fiber coatings and the polymer parts of the cable.
6.2. Origins of Fiber Loss
- (a)
- Escape of light through cladding, causing confinement loss (CL);
- (b)
- Surface scattering loss (SSL) [11];
- (c)
- Absorption by contaminants of filler gas, e.g., water vapor (Section 6.3);
- (d)
- Absorption of bulk silica glass, important at long wavelengths [26];
- (e)
- Micro- and macrobending loss;
- (f)
- Loss resulting from structural imperfections of photonic cladding [60].
- CL, which usually reaches high values in several bands, usually leaving narrow low-loss transmission band(s) (Figure 4).
- SSL, which imposes a low limit of fiber loss at short and medium wavelengths, up to 1800–1900 nm, where the associated loss can fall down to 0.1–0.2 dB/km [26] in optimized fibers, but is much higher, ≈2 dB/km in current commercial HC-PBGFs.
- Bulk absorption in fused silica, multiplied by the optical overlap coefficient η. Due to low η, bulk absorption is important only at wavelengths above 1800 nm [26].
- SSL, ≈0.03–0.05 dB/km at wavelengths in the 1500–1800 nm range [61], less than in HC-PBGFs due to lower power density at surfaces of cladding tubes.
- Absorption by contaminants of filler gas (Section 6.3).
- Microbending loss.
- Loss resulting from structural imperfections of cladding like variations in capillary diameters (Section 9) or their excessive fusion with fiber jacket.
- Rises with an increase in core diameter and MFD—as in SMF.
6.3. Absorption and Scattering by Filler Gas and Contaminants
- Present in the working area of the fiber manufacturing plant: water vapor, carbon dioxide, or fuel for gas burners;
- Out-gassing from hot glass, mostly chlorine and fluorine present in commercial fused silica tubes in concentrations up to 2000 ppm, and 3200 ppm for Heraeus F300 and F320-08, respectively [68];
6.4. Exchange of Gases with Atmosphere and Entry of Water
- The inner pressure in a freshly drawn fiber is 20–29 kPa, only 1/4th of the atmospheric pressure, despite the application of 6 kPa overpressure during drawing. This happened because the gas inside the preform was initially hot, ≈1400 °C during necking, and the pressure fell during cooling to room temperature, roughly by a factor of 5.7;
- The time required for the equalization of pressure inside a 55 m length of freshly drawn HC-PBGF with a 31.6 µm core diameter open at both ends with a surrounding atmosphere was 2 h. For a 34 m long 7-tube NANF with a smaller core diameter (18.5 µm), this time was longer—3 h;
- When a freshly drawn HC-PBGF (kept sealed after drawing, and cleaved 3 min before experiment) was vertically suspended, with one end sealed and the other immersed in pure water, the water column inside the fiber reached a height of 8.8 m after 40 h. For a pressure-equalized fiber, the result was still 2.1 m, as the water was driven into fiber by surface tension. The fiber tested was 26.5 m long.
6.5. Chromatic Dispersion of Gas
7. Selected Properties of HCFs
7.1. Fiber Dimensions
7.2. Polarization Mode Dispersion
- Minimal interaction of optical power with tubes—only 0.001–0.03% of it is propagating in the glass, or other solid material the fiber is made of;
- Small angle between the directions of adjacent extreme field distributions [84]: 36°, 30°, 25.7° and 22.5° in an NANF with five, six, seven and eight tubes, respectively.
7.3. Latency vs. Temperature and Strain
7.4. Backscattering
8. Theoretical Analysis and Simulations of Hollow-Core Fibers
8.1. Models
8.2. Simulation Tools
9. Manufacturing of Hollow-Core Fibers
9.1. Materials
- High gas permeability, allowing for the migration of contaminants into the fiber;
- Outgassing of unreacted monomer, water, etc.;
- Absorption of water from air;
- Lack of stiffness: Young moduli of fused silica and PMMA are 72 GPa and 2.9 GPa, respectively. A 125 µm or 200 µm plastic fiber is too soft to manually handle.
9.2. Stack-and-Draw
9.3. Extrusion of Preform
9.4. Sealing of Fiber
- Sealed at both ends by fusion for storage before next steps;
- Pumped with dry inert gas, like nitrogen or argon to elevated pressure;
- Tested, e.g., with OTDR, within minutes;
- Sealed at both ends by fusion for storage and shipping.
9.5. Reduction in NANF Attenuation
- Leakage of light due to imperfections in cladding;
- Surface Scattering Loss (SSL), typically 0.02–0.05 dB/km;
- Microbending loss—specific to each fiber design;
- Absorption by water vapor and other gas contaminants.
10. Splicing and Termination of Hollow-Core Fibers
10.1. HCF in the SMF World
- HCF–HCF splices between cable sections, and for repairs;
- HCF–SMF splices at both ends of optical path, mostly to pigtails with SMFs.
10.2. Common Issues
- Low insertion loss, preferably ≤0.25 dB;
- Low reflectivity, preferably ≤−40 dB;
- Hermeticity to prevent the contamination of HCF (Section 6.3 and Section 6.4);
- Mechanical strength and long-term reliability (≥20 years).
- Shortening the fusion time to ≈0.2 s so that heat does not fully penetrate the fiber’s cladding;
- Reducing the arc power and current to 50–70% of value for solid-core SMF;
- Sweeping the arc along certain length of fibers to reduce inner temperature;
- Applying overpressure in all voids in the cladding.
10.3. Splicing HCF to HCF
10.4. Splicing HCF to SMF
10.5. Glass Sleeve Fusion Splicing
11. Transmission Performance of HCFs
11.1. HC-PBGF
11.2. NANF
- The transmission distance was, in some cases, limited by Inter-Modal Interference (IMI) resulting from the coupling of optical power between the fundamental mode and higher-order modes. While a five-tube NANF with high attenuation of higher-order modes [54,114] improved the situation, the problem is not yet fully solved.
11.3. Fiber Ratings
12. Applications of HCFs in Networks and Systems
- Low latency (Section 12.1);
- Stable latency (Section 12.2);
- Wide bandwidth, low nonlinearity, and high-power capability (Section 12.3).
12.1. Low Latency Applications
12.1.1. Reduction in Latency by Using HCF
- Adding amplifiers or repeaters to bridge excessive loss;
- Activating dispersion compensation to avoid errors;
- Activating FEC, if errors are still experienced.
12.1.2. Latency in Transponders
12.1.3. High-Speed Trading
12.1.4. Data Centers and Computers
12.2. Stable Latency Applications
12.2.1. Electronic Monitoring and Stabilization of Link Latency
12.2.2. Radio Networks
12.2.3. Wide Area Multi-Antenna Systems
12.2.4. Time Distribution
12.3. DWDM Networks
- (a)
- Very low optical nonlinearity, ≥1000× weaker than in SMF;
- (b)
- Ability to carry high optical power;
- (c)
- Lower attenuation and/or new low-loss bands;
- (d)
- Low chromatic dispersion (Figure 16).
- Elimination of nonlinear optical effects (SPM, XPM, FWM, SRS, SBS);
- Wider bandwidth with suitable optical amplifiers;
- Increase in transmit power per channel and repeater spacing;
- Lower demand for dispersion compensation and FEC;
- Impossibility of Raman amplification in the transmission fiber;
- Fire and eye safety issues due to high power carried by the fiber.
13. Associated Technologies
- Splicing of HCFS, in particular to SMFs—presented in Section 10;
- New transmission bands and optical amplifiers;
- Purging of contaminated fibers.
13.1. Optical Amplifiers
13.2. Test Instruments
- (a)
- Testing of loss at new wavelengths including 1800–2050 nm and 1364 nm;
- (b)
- OTDRs able to detect low levels of Rayleigh scattering (Section 7.4);
- (c)
- Mandatory PMD testing at the factory to detect distorted fibers.
14. Conclusions
- Development of more efficient and consistent manufacturing process;
- Standardization of fibers;
- Development of inexpensive and simple to use dedicated fusion splicing machines;
- Development of compatible optical amplifiers.
Author Contributions
Funding
Institutional Review Board Statement
Informed Consent Statement
Data Availability Statement
Acknowledgments
Conflicts of Interest
Abbreviations
| ARF | Anti-Resonant Fiber |
| ARROW | Anti-Resonant Reflecting Optical Waveguide |
| BER | Bit Error Ratio |
| CAPEX | Capital Expenses |
| CD | Chromatic Dispersion |
| CL | Confinement Loss |
| DGD | Differential Group Delay |
| DNANF | Double Nested Anti-Resonant Nodeless Fiber |
| DWDM | Dense Wavelength Division Multiplexing |
| EDFA | Erbium-Doped Fiber Amplifier |
| FEC | Forward Error Correction |
| FEP | Fluorinated Ethylene-Propylene |
| FEM | Finite Element Method |
| FWM | Four Wave Mixing |
| GRIN | Graded Index (optical fiber or lens) |
| HST | High Speed Trading |
| HCF | Hollow-Core Fiber |
| HC-PBGF | Hollow-Core Photonic Bandgap Fiber |
| IL | Insertion Loss |
| ITU-T | International Telecommunication Union–Technical Standardization Sector |
| MCF | Multi-Core Fiber |
| MFD | Mode Field Diameter |
| MIMO | Multiple Input Multiple Output (radio network with several steerable beams) |
| MMF NA | Multimode Fiber (with solid core) Numerical Aperture |
| NANF | Nested Anti-Resonant Nodeless Fiber |
| OPEX | Operating Expenses |
| OTDR | Optical Time Domain Reflectometer |
| OTN | Optical Transport Network |
| PBGF | Photonic Bandgap Fiber |
| PEI | Polyetherimide |
| PES | Poly(ether sulfone) |
| PMD | Polarization Mode Dispersion |
| PMMA | Poly(methyl metacrylate) |
| POF | Polymer Optical Fiber |
| ppm | Part Per Million (concentration, proportion) |
| PSCF | Pure Silica Core Fiber |
| RL | Return Loss |
| SCW | Surface Capillary Wave |
| SEM | Scanning Electron Microscope |
| SMF | Single-Mode Fiber (with solid core and cladding) |
| SPM | Self-Phase Mixing |
| SSL | Surface Scattering Loss |
| TDFA | Thulium-Doped Fiber Amplifier |
| XPM | Cross-Phase Mixing |
References
- Kao, K.C.; Hockham, G.A. Dielectric-fibre surface waveguides for optical frequencies. Proc. IEE 1966, 113, 1151–1158. [Google Scholar] [CrossRef]
- World’s Largest Transmission Capacity with Standard Diameter Multi-Core Optical Fiber: Accelerate Multi-Core Fiber Application Using Current Standard Technology. 8 August 2017. Available online: https://group.ntt/en/newsrelease/2017/08/08/170808b.html (accessed on 21 March 2023).
- Soma, D.; Beppu, S.; Wakayama, Y.; Sumita, S.; Takahashi, H.; Yoshikake, N.; Morita, I.; Tsuritani, T.; Suzuki, M. Trans-Pacific class transmission over a standard cladding ultralow-loss 4-core fiber. Opt. Express 2022, 30, 9482–9493. [Google Scholar] [CrossRef]
- Debord, B.; Amrani, F.; Vincetti, L.; Gérôme, F.; Benabid, F. Hollow-Core Fiber Technology: The Rising of “Gas Photonics”. Fibers 2019, 7, 16. [Google Scholar] [CrossRef]
- Mulvad, H.C.H.; Mousavi, S.A.; Zuba, V.; Xu, L.; Sakr, H.; Bradley, T.D.; Hayes, J.R.; Jasion, G.T.; Numkam Foukua, E.; Taranta, A.; et al. Kilowatt-average-power single-mode laser light transmission over kilometre-scale hollow-core fibre. Nat. Photonics 2022, 16, 448–453. [Google Scholar] [CrossRef]
- Yeh, P.; Yariv, A. Bragg reflection waveguides. Opt. Commun. 1976, 19, 427–430. [Google Scholar] [CrossRef]
- Yeh, P.; Yariv, A.; Marom, E. Theory of Bragg fiber. J. Opt. Soc. Am. 1978, 68, 1196–1201. [Google Scholar] [CrossRef]
- Birks, T.A.; Roberts, P.J.; Russell, P.S.J.; Atkin, D.M.; Shepherd, T.J. Full 2-D photonic bandgaps in silica/air structures. Electron. Lett. 1995, 31, 1941–1943. [Google Scholar] [CrossRef]
- Yu, F.; Knight, J. Negative curvature hollow core optical fiber. IEEE J. Sel. Top. Quantum Electron. 2016, 22, 146–155. [Google Scholar] [CrossRef]
- Komanec, M.; Dousek, D.; Suslov, D.; Zvanovec, S. Hollow-Core Optical Fibers. Radioengineering 2020, 29, 417–430. [Google Scholar] [CrossRef]
- Richardson, D.J.; Wheeler, N.V.; Chen, Y.; Hayes, J.R.; Sandoghchi, S.R.; Jasion, G.T.; Bradley, T.D.; Numkam Fokoua, E.; Liu, Z.; Slavik, R.; et al. Hollow Core Fibres and their Applications. In Proceedings of the 2017 Optical Fiber Communications Conference and Exhibition (OFC), Los Angeles, CA, USA, 19–23 March 2017. Tu3H.1. [Google Scholar]
- Poletti, F. Hollowcore Optical Fibres: A British Invention with Revolutionary Potential (Presentation). In Proceedings of the Telecommunications, Optics and Photonics (TOP) Conference, London, UK, 14–15 February 2022. [Google Scholar]
- Jasion, G.T.; Sakr, H.; Hayes, J.R.; Sandoghchi, S.R.; Hooper, L.; Numkam Fokoua, E.; Saljoghei, A.; Mulvad, H.C.; Alonso, M.; Taranta, A.; et al. 0.174 dB/km Hollow Core Double Nested Antiresonant Nodeless Fiber (DNANF). In Proceedings of the 2022 Optical Fiber Communications Conference and Exhibition (OFC), San Diego, CA, USA, 6–10 March 2022. Th4C.7. [Google Scholar]
- Fink, Y.; Ripin, D.J.; Fan, S.; Chen, C.; Joannopoulos, J.D.; Thomas, E.L. Guiding Optical Light in Air Using an All-Dielectric Structure. J. Light. Technol. 1999, 17, 2039–2041. [Google Scholar] [CrossRef]
- Kuriki, K.; Shapira, O.; Hart, S.D.; Benoit, G.; Kuriki, Y.; Viens, J.F.; Bayindir, M.; Joannopoulos, J.D.; Fink, Y. Hollow multilayer photonic bandgap fibers for NIR applications. Opt. Express 2004, 12, 1510–1517. [Google Scholar] [CrossRef]
- Temelkuran, B.; Hart, S.D.; Benoit, G.; Joannopoulos, J.D.; Fink, Y. Wavelength-scalable hollow optical fibres with large photonic bandgaps for CO2 laser transmission. Nature 2002, 420, 650–653. [Google Scholar] [CrossRef] [PubMed]
- Johnson, S.G.; Ibanescu, M.; Skorobogatiy, M.; Weisberg, O.; Engeness, T.D.; Soljacic, M.; Jacobs, S.A.; Joannopoulos, J.D.; Fink, Y. Breaking the glass ceiling: Hollow OmniGuide fibers. In Photonic Bandgap Materials and Devices; Adibi, A., Scherer, A., Lin, S.Y., Eds.; SPIE: Bellingham, WA, USA, 2002; Proceedings of SPIE: 2002; Volume 4655. [Google Scholar] [CrossRef]
- Benabid, F.; Roberts, P.J. Guidance mechanisms in hollow-core photonic crystal fiber. In Photonic Crystal Materials and Devices VII, San Jose, CA, USA, 21–23 January 2008; Adibi, A., Lin, S.-Y., Scherer, A., Eds.; SPIE: Bellingham, WA, USA, 2008; Volume 6901, p. 69010U. [Google Scholar] [CrossRef]
- Wei, C.; Weiblen, R.J.; Menyuk, C.R.; Hu, J. Negative curvature fibers. Adv. Opt. Photonics 2017, 9, 504–561. [Google Scholar] [CrossRef]
- Mangan, B.J.; Farr, L.; Langford, A.; Roberts, P.J.; Williams, D.P.; Couny, F.; Lawman, M.; Mason, M.; Coupland, S.; Flea, R.; et al. Low loss (1.7dB/km) hollow core photonic bandgap fiber. In Proceedings of the Optical Fiber Communication Conference 2004, Los Angeles, CA, USA, 22–27 February 2004. PD24. [Google Scholar]
- Mukasa, K. Hollow Core Fiber Cable. Furukawa Electr. Rev. 2021, 52, 36–43. Available online: https://www.furukawa.co.jp/en/rd/review/fr052/fr52_09.pdf (accessed on 21 February 2023).
- Mangan, B.J.; Zhu, B.; Puc, G.S.; Kremp, T.; Irid, M. Low latency transmission in a hollow core fiber cable. In Proceedings of the CLEO 2021, Virtual Event, 9–14 May 2021. STu1Q.1. [Google Scholar] [CrossRef]
- Wegmuller, M.; Legré, M.; Gisin, N.; Hansen, T.P.; Jakobsen, C.; Broeng, J. Experimental investigation of the polarization properties of a hollow core photonic bandgap fiber for 1550 nm. Opt. Express 2005, 13, 1457–1467. [Google Scholar] [CrossRef] [PubMed]
- Numkam Fokoua, E.; Zhu, W.; Ding, M.; Feng, Z.; Chen, Y.; Bradley, T.D.; Jasion, G.T.; Richardson, D.J.; Poletti, F.; Slavík, R. Polarization Effects on Thermally Stable Latency in Hollow-Core Photonic Bandgap Fibers. J. Light. Technol. 2021, 39, 2142–2150. [Google Scholar] [CrossRef]
- Yu, X.; Zheng, X.; Zhang, H. PMD Measurement of Hollow-Core Photonic Bandgap Fiber by Investigating Power Penalty of Optically Generated Microwave Signals. IEEE Photon. Technol. Lett. 2007, 19, 279–281. [Google Scholar] [CrossRef]
- Roberts, P.J.; Couny, F.; Sabert, H.; Mangan, B.J.; Williams, D.P.; Farr, L.; Mason, M.W.; Tomlinson, A.; Birks, T.A.; Knight, J.C.; et al. Ultimate low loss of hollow-core photonic crystal fibres. Opt. Express 2005, 13, 236–244. [Google Scholar] [CrossRef]
- DiGiovanni, D.; Inniss, D.; Kremp, T.; Mangan, B.; Mikhailov, V.; Zhu, B. AccuCore HCF Optical Cable: Low-Latency Hollow-Core Fiber Transmission Primer; OFS Fitel White Paper; OFS Fitel LLC.: Norcross, GA, USA, 2020. [Google Scholar]
- AccuCore HCF Fiber Optic Cable and Assemblies; OFS Fitel LLC.: Norcross, GA, USA, 2020.
- ITU-T Recommendation, G. 652: Characteristics of a single-Mode Optical Fibre and Cable; International Telecommunication Union: Geneva, Switzerland, 2016. [Google Scholar]
- Corning SMF-28e+ Optical Fiber Product Information PI1463; Corning Inc.: Corning, NY, USA, 2021.
- Corning SMF-28 Ultra Optical Fiber Product Information PI1464; Corning Inc.: Corning, NY, USA, 2021.
- Mangan, B.J.; Nicholson, J.W.; Fini, J.M.; Windeler, R.S.; Meng, L.; Puc, G.; Mukasa, K. Single Mode, Polarization Maintaining Hollow Core Fibre with Significantly Improved Higher Order Mode Reduction. In Proceedings of the 2015 European Conference on Optical Communication (ECOC) 2015, Valencia, Spain, 27 September–1 October 2015; p. 0721. [Google Scholar] [CrossRef]
- ITU-T Recommendation, G. 650.1: Definitions and Test Methods for Linear, Deterministic Attributes of Single-Mode Fibre and Cable; International Telecommunication Union: Geneva, Switzerland, 2020. [Google Scholar]
- Optical Connector Assemblies for Low Latency Patchcords. International Patent Application WO 2021/127032A1, 24 June 2021.
- Hollow-Core Fibers: Hollow-Core Photonic Bandgap Fibers (HC-800, 920, 1060, 1300, 1550); NKT Photonics: Boston, MA, USA, 2022.
- Inniss, D. Low-Latency Optical Transmission: AccuCore HCF Fiber Optic Cable. In Proceedings of the Global STAC Live: High Technology in Finance, Spring 2020, Online, 2–4 June 2020. [Google Scholar]
- Bradley, T.D.; Hayes, J.R.; Chen, Y.; Jasion, G.T.; Sandoghchi, S.R.; Slavik, R.; Numkam Fokoua, E.; Bawn, S.; Sakr, H.; Davidson, I.A.; et al. Record Low-Loss 1.3dB/km Data Transmitting Antiresonant Hollow Core Fibre. In Proceedings of the 2018 European Conference on Optical Communication (ECOC), Rome, Italy, 23–27 September 2018. [Google Scholar] [CrossRef]
- Sakr, H.; Bradley, T.D.; Hong, Y.; Jasion, G.T.; Hayes, J.R.; Kim, H.; Davidson, I.A.; Numkam Fokoua, E.; Chen, Y.; Bottrill, K.R.H.; et al. Ultrawide Bandwidth Hollow Core Fiber for Interband Short Reach Data Transmission. In Proceedings of the 2019 Optical Fiber Communications Conference and Exhibition (OFC), San Diego, CA, USA, 3–7 March 2019. Th4A.1. [Google Scholar]
- Jasion, T.; Bradley, G.T.; Sakr, T.; Hayes, H.; Chen, J.R.; Chen, Y.; Taranta, A.; Mulvad, H.C.; Davidson, I.A.; Wheeler, N.V.; et al. Recent breakthroughs in hollow core fiber technology. In Next-Generation Optical Communication: Components, Sub-Systems, and Systems IX; SPIE: Bellingham, WA, USA, 2020; Volume 11309. [Google Scholar] [CrossRef]
- Zeisberger, M.; Hartung, A.; Schmidt, M.A. Understanding Dispersion of Revolver-Type Anti-Resonant Hollow Core Fibers. Fibers 2018, 6, 68. [Google Scholar] [CrossRef]
- Benabid, F.; Knight, J.C.; Antonopoulos, G.; Russell, P. Stimulated Raman Scattering in Hydrogen-Filled Hollow-Core Photonic Crystal Fiber. Science 2002, 298, 399–402. [Google Scholar] [CrossRef]
- Wang, Y.Y.; Wheeler, N.V.; Couny, F.; Roberts, P.J.; Benabid, F. Low loss broadband transmission in hypocycloid-core Kagome hollow-core photonic crystal fiber. Opt. Lett. 2011, 36, 669–671. [Google Scholar] [CrossRef]
- Maurel, M.; Chafer, M.; Amsanpally, A.; Adnan, M.; Amrani, F.; Debord, B.; Vincetti, L.; Gérôme, F.; Benabid, F. Optimized inhibited-coupling Kagome fibers at Yb-Nd:Yag (8.5 dB/km) and Ti:Sa (30 dB/km) ranges. Opt. Lett. 2018, 43, 1598–1601. [Google Scholar] [CrossRef]
- Wheeler, N.V.; Bradley, T.D.; Hayes, J.R.; Gouveia, M.A.; Liang, S.; Chen, Y.; Sandoghchi, S.R.; Abokhamis Mousavi, S.M.; Poletti, F.; Petrovich, M.N.; et al. Low-loss Kagome hollow-core fibers operating from the near- to the mid-IR. Opt. Lett. 2017, 42, 2571–2574. [Google Scholar] [CrossRef]
- Amrani, F.; Osório, J.H.; Delahaye, F.; Giovanardi, F.; Vincetti, L.; Debord, B.; Gérôme, F.; Benabid, F. Low-loss single-mode hybrid-lattice hollow-core photonic-crystal fibre. Light Sci. Appl. 2021, 10, 7. [Google Scholar] [CrossRef]
- Pryamikov, A.D.; Biriukov, A.S.; Kosolapov, A.F.; Plotnichenko, V.G.; Semjonov, S.L.; Dianov, E.M. Demonstration of a waveguide regime for a silica hollow-core microstructured optical fiber with a negative curvature of the core boundary in the spectral region > 3.5 μm. Opt. Express 2011, 19, 1441–1448. [Google Scholar] [CrossRef]
- Kolyadin, A.N.; Kosolapov, A.F.; Pryamikov, A.D.; Biriukov, A.S.; Plotnichenko, V.G.; Dianov, E.M. Light transmission in negative curvature hollow core fiber in extremely high material loss region. Opt. Express 2013, 21, 9514–9519. [Google Scholar] [CrossRef]
- Poletti, F. Nested antiresonant nodeless hollow core fiber. Opt. Express 2014, 22, 23807–23828. [Google Scholar] [CrossRef] [PubMed]
- Sakr, H.; Bradley, T.D.; Jasion, G.T.; Numkam Fokoua, E.; Sandoghchi, S.R.; Davidson, I.A.; Taranta, A.; Guerra, G.; Shere, W.; Chen, Y.; et al. Hollow Core NANFs with Five Nested Tubes and Record Low Loss at 850, 1060, 1300 and 1625nm. In Proceedings of the 2021 Optical Fiber Communications Conference and Exhibition (OFC), San Francisco, CA, USA, 6–10 June 2021. F3A.4. [Google Scholar]
- Belardi, W.; Knight, J.C. Negative curvature fibers with reduced leakage loss. In Proceedings of the OFC 2014, San Francisco, CA, USA, 9–13 March 2014; Th2A.45. ISBN 978-1-55752-993-0. [Google Scholar]
- Sumi Rani Shaha, K.; Khaleque, A.; Hosen, S. Wideband Low Loss Hollow Core Fiber with Nested Hybrid Cladding Elements. J. Light. Technol. 2021, 39, 6585–6591. [Google Scholar] [CrossRef]
- Wang, Y.; Chang, W. Multi-nested antiresonant hollow-core fiber with ultralow loss and single-mode guidance. Opt. Express 2023, 31, 18250–18264. [Google Scholar] [CrossRef] [PubMed]
- Murphy, L.R.; Bird, D. Azimuthal confinement: The missing ingredient in understanding confinement loss in antiresonant, hollow-core fibers. Optica 2023, 10, 854–870. [Google Scholar] [CrossRef]
- Saljoghei, A.; Qiu, M.; Sandoghchi, S.R.; Laperle, C.; Alonso, M.; Hubbard, M.; Lang, I.; Pasandi, M.; Chen, Y.; Petrovich, M.; et al. First Demonstration of Field-Deployable Low Latency Hollow-core Cable Capable of Supporting >1000km, 400Gb/s WDM Transmission. arXiv 2021, arXiv:2106.05343. Available online: https://arxiv.org/ftp/arxiv/papers/2106/2106.05343.pdf (accessed on 11 February 2023). [CrossRef]
- Jasion, G.T.; Bradley, T.D.; Harrington, K.; Sakr, H.; Chen, Y.; Numkam Fokoua, E.; Davidson, I.A.; Taranta, A.; Hayes, J.R.; Richardson, D.J.; et al. Hollow Core NANF with 0.28 dB/km Attenuation in the C and L Bands. In Proceedings of the 2020 Optical Fiber Communications Conference and Exhibition (OFC), San Diego, CA, USA, 8–12 March 2020. Th4B.4. [Google Scholar]
- Zhang, X.; Song, W.; Dong, Z.; Yao, J.; Wan, S.; Hou, Y.; Wang, P. Low loss nested hollow-core anti-resonant fiber at 2 μm spectral range. Opt. Lett. 2022, 47, 589–592. [Google Scholar] [CrossRef] [PubMed]
- Slavik, R.; Numkam Fokoua, E.; Bradley, T.D.; Tarranta, A.A.; Komanec, M.; Zvanovec, S.; Michaud-Belleau, V.; Poletti, F.; Richardson, D.J. Optical time domain backscattering of antiresonant hollow core fibers. Opt. Express 2022, 30, 31310–31321. [Google Scholar] [CrossRef] [PubMed]
- Krzempek, K.; Abramski, K.; Nikodem, M. Kagome Hollow Core Fiber-Based Mid-Infrared Dispersion Spectroscopy of Methane at Sub-ppm Levels. Sensors 2019, 19, 3352. [Google Scholar] [CrossRef]
- Olanterä, L.; Troska, J.; Sigaud, C.; Vasey, F.; Petrovich, M.; Poletti, F.; Wheeler, N.; Wooler, J.; Richardson, D. Gamma Irradiation of Minimal Latency Hollow-Core Photonic Bandgap Fibers. J. Instrum. 2013, 8, C12010. [Google Scholar] [CrossRef]
- Numkam Fokoua, E.; Richardson, D.J.; Poletti, F. Impact of structural distortions on the performance of hollow-core photonic bandgap fibers. Opt. Express 2014, 22, 2735–2744. [Google Scholar] [CrossRef]
- Numkam Fokoua, E.; Abokhamis Mousavi, S.; Jasion, G.T.; Richardson, D.J.; Poletti, F. Loss in hollow-core optical fibers: Mechanisms, scaling rules, and limits (Tutorial). Adv. Opt. Photonics 2023, 15, 1–85. [Google Scholar] [CrossRef]
- Osório, J.H.; Amrani, F.; Delahaye, F.; Dhaybi, A.; Vasko, K.; Melli, F.; Giovanardi, F.; Vandembroucq, D.; Tessier, G.; Vincetti, L.; et al. Hollow-core fibers with reduced surface roughness and ultralow loss in the short-wavelength range. Nat. Commun. 2023, 14, 1146. [Google Scholar] [CrossRef]
- Sakr, H.; Chen, Y.; Jasion, G.T.; Bradley, T.D.; Hayes, J.R.; Mulvad, H.-C.H.; Davidson, I.A.; Numkam Fokoua, E.; Poletti, F. Hollow core optical fibres with comparable attenuation to silica fibres between 600 and 1100 nm. Nat. Commun. 2020, 11, 6030. [Google Scholar] [CrossRef]
- Abrate, S.; Gaudino, R.; Perrone, G. Step-Index PMMA Fibers and Their Applications. In Current Developments in Optical Fiber Technology; Harun, S.W., Arof, H., Eds.; IntechOpen: London, UK, 2013; pp. 177–202. [Google Scholar] [CrossRef]
- Stawska, H.I.; Popenda, M.A.; Beres-Pawlik, E. Anti-Resonant Hollow Core Fibers with Modified Shape of the Core for the Better Optical Performance in the Visible Spectral Region—A Numerical Study. Polymers 2018, 10, 899. [Google Scholar] [CrossRef]
- 50 μm Graded-Index OM2—Bend-Insensitive Multimode Optical Fiber (Data Sheet); OFS Fitel, ID: Fiber-151; OFS Fitel LLC.: Norcross, GA, USA, 2018.
- Ciddor, P.E. Refractive Index of Air: New Equations for the Visible and Near Infrared. Appl. Opt. 1996, 35, 1566–1573. [Google Scholar] [CrossRef]
- Heraeus High Purity Fused Silica Tubes for Specialty Fiber Production; Heraeus: Henau, Germany, 2020; Available online: https://www.heraeus.com/media/media/hca/doc_hca/products_and_solutions_8/optical_fiber/Fiber_Tubes_EN.pdf (accessed on 13 February 2023).
- Rikimi, S.; Chen, Y.; Kelly, T.W.; Davidson, I.A.; Jasion, G.T.; Partridge, M.; Harrington, K.; Bradley, T.D.; Taranta, A.; Poletti, F.; et al. Internal Gas Composition and Pressure in As-drawn Hollow Core Optical Fibers. J. Light. Technol. 2022, 40, 4776–4785. [Google Scholar] [CrossRef]
- Rikimi, S.; Chen, Y.; Bradley, T.D.; Davidson, I.A.; Sakr, H.; Taranta, A.; Harrington, K.; Poletti, F.; Petrovich, M.N.; Richardson, D.J.; et al. Comparison between the Optical Performance of Photonic Bandgap and Antiresonant Hollow Core Fibers after Long-Term Exposure to the Atmosphere. In Proceedings of the 2022 Optical Fiber Communications Conference and Exhibition (OFC), San Diego, CA, USA, 6–10 March 2022. W4E.3. [Google Scholar]
- Bucholtz, A. Rayleigh-scattering calculations for the terrestrial atmosphere. Appl. Opt. 1995, 34, 2765–2773. [Google Scholar] [CrossRef]
- Shardanand, A.D.; Rao, P. NASA Technical Note TN D-8442: Absolute Rayleigh Scattering Cross Sections of Gases and Freons of Stratospheric Interest in the Visible and Ultraviolet Regions; NASA: Washington, DC, USA, 1977. [Google Scholar]
- NIST Basic Atomic Spectroscopic Data. Available online: https://physics.nist.gov/PhysRefData/Handbook/element_name.htm (accessed on 23 January 2023).
- HITRAN on the Web. Available online: https://hitran.iao.ru/home and https://hitran.iao.ru/molecule/simlaunch (accessed on 23 January 2023).
- Van Agthoven, M.A.; Fujisawa, G.; Rabbito, P.; Mullins, O.C. Near-Infrared Spectral Analysis of Gas Mixtures. Appl. Spectrosc. 2002, 56, 593–598. [Google Scholar] [CrossRef]
- Shemshad, J.; Aminossadati, S.; Bowen, W.; Kizil, M. Effects of pressure and temperature fluctuations on near-infrared measurements of methane in underground coal mines. Appl. Phys. B Lasers Opt. 2011, 106, 979–986. [Google Scholar] [CrossRef]
- IEC 60793-2-50; Optical Fibres—Part 2-50: Product Specifications—Sectional Specification for Class B Single-Mode Fibres. International Electrotechnical Commission: London, UK, 2018.
- ITU-T Recommendation G.654: Characteristics of a Cut-Off Shifted Single-Mode Optical Fibre and Cable; International Telecommunication Union: Geneva, Switzerland, 2020.
- ITU-T Recommendation G.657: Characteristics of a Bending-Loss Insensitive Single-Mode Optical Fibre and Cable; International Telecommunication Union: Geneva, Switzerland, 2016.
- Hayashi, T.; Nakanishi, T.; Hirashima, K.; Shimakawa, O.; Sato, F.; Koyama, K.; Furuya, A.; Murakami, Y.; Sasaki, T. 125 μm Cladding Eight-Core Multi-Core Fiber Realizing Ultra-High-Density Cable Suitable for O-Band Short-Reach Optical Interconnects. J. Light. Technol. 2016, 34, 85–92. [Google Scholar] [CrossRef]
- Barlow, A.J.; Payne, D.N.; Hadley, M.R.; Mansfield, R.J. Production of single-mode fibres with negligible intrinsic birefringence and polarisation mode dispersion. Electron. Lett. 1981, 17, 725–726. [Google Scholar] [CrossRef]
- Hart, A.; Huff, R.; Walker, R.J. Optical Fiber Having Low Polarization Mode Dispersion, Due to Permanent Spin. U.S. Patent 5418881, 23 May 1995. [Google Scholar]
- Li, M.-J.; Chen, X.; Nolan, D.A. Fiber Spinning for Reducing Polarization Mode Dispersion in Single-Mode Fibers: Theory and Applications. Optical Transmission Systems and Equipment for WDM Networking II. Proc. SPIE 2003, 5247, 97–110. [Google Scholar] [CrossRef]
- Suslov, D.; Komanec, M.; Numkam Fokoua, E.R.; Dousek, D.; Zhong, A.; Zvánovec, S.; Bradley, T.D.; Poletti, F.; Richardson, D.J.; Slavík, R. Low loss and high performance interconnection between standard single-mode fiber and antiresonant hollow-core fiber. Sci. Rep. 2021, 11, 8799. [Google Scholar] [CrossRef]
- Slavík, R.; Marra, G.; Numkam Fokoua, E.; Baddela, N.; Wheeler, N.V.; Petrovich, M.; Poletti, F.; Richardson, D.J. Ultralow thermal sensitivity of phase and propagation delay in hollow core optical fibres. Sci. Rep. 2015, 5, 15447. [Google Scholar] [CrossRef] [PubMed]
- Dangui, V.; Kim, H.K.; Digonnet, M.J.F.; Kino, G.S. Phase sensitivity to temperature of the fundamental mode in air-guiding photonic-bandgap fibers. Opt. Express 2005, 13, 6669–6684. [Google Scholar] [CrossRef] [PubMed]
- Michaud-Belleau, V.; Numkam Fokoua, E.; Bradley, T.D.; Hayes, J.R.; Chen, Y.; Poletti, F.; Richardson, D.J.; Genest, J.; Slavik, R. Backscattering in antiresonant hollow-core fibers: Over 40 dB lower than in standard optical fibers. Optica 2021, 8, 216–219. [Google Scholar] [CrossRef]
- Numkam Fokoua, E.; Michaud-Belleau, V.; Genest, J.; Slavík, R.; Poletti, F. Theoretical analysis of backscattering in hollow-core antiresonant fibers. APL Photonics 2021, 6, 096106. [Google Scholar] [CrossRef]
- Chen, Y.; Liu, Z.; Sandoghchi, S.R.; Jasion, G.T.; Bradley, T.D.; Numkam Fokoua, E.; Hayes, J.R.; Wheeler, N.V.; Gray, D.R.; Mangan, B.J.; et al. Multi-kilometer Long, Longitudinally Uniform Hollow Core Photonic Bandgap Fibers for Broadband Low Latency Data Transmission. J. Light. Technol. 2016, 34, 104–113. [Google Scholar] [CrossRef]
- Marcatili, E.A.J.; Schmeltzer, R.A. Hollow Metallic and Dielectric Waveguides for Long Distance Optical Transmission and Lasers. Bell Syst. Tech. J. 1964, 43, 1783–1809. [Google Scholar] [CrossRef]
- Duguary, M.; Kokubun, Y.; Koch, T.; Pferiffer, L. Antiresonant reflecting optical waveguides in SiO2-Si multilayer structures. Appl. Phys. Lett. 1986, 49, 13–15. [Google Scholar] [CrossRef]
- Litchinitser, N.M.; Abeeluck, A.K.; Headley, C.; Eggleton, B.J. Antiresonant reflecting photonic crystal optical waveguides. Opt. Lett. 2002, 27, 1592–1594. [Google Scholar] [CrossRef]
- Vincetti, L.; Setti, V. Waveguiding mechanism in tube lattice fibers. Opt. Express 2010, 18, 23133–23146. [Google Scholar] [CrossRef]
- Benabid, F. Hollow-core photonic bandgap fibre: New light guidance for new science and technology. Phil. Trans. R. Soc. A 2006, 364, 3439–3462. [Google Scholar] [CrossRef]
- Jasion, G.T.; Hayes, J.R.; Wheeler, N.V.; Chen, Y.; Bradley, T.D.; Richardson, D.J.; Poletti, F. Fabrication of tubular anti-resonant hollow core fibers: Modelling, draw dynamics and process optimization. Opt. Express 2019, 27, 20567–20582. [Google Scholar] [CrossRef] [PubMed]
- Ventura, A.; Hayashi, J.; Cimek, J.; Jasion, G.; Janicek, P.; Slimen, F.; White, N.; Fu, Q.; Xu, L.; Sakr, H.; et al. Extruded tellurite antiresonant hollow core fiber for Mid-IR operation. Opt. Express 2020, 28, 16542–16553. [Google Scholar] [CrossRef] [PubMed]
- Ross, A. Basalt Fibers: Alternative to Glass? Composites World. 8 January 2006. Available online: https://www.compositesworld.com/articles/basalt-fibers-alternative-to-glass (accessed on 7 February 2023).
- Bagley, R.D. Corning Glass Works: Extrusion Method for Forming Thin-Walled Honeycomb Structures. U.S. Patent US3790654A, 5 February 1974. [Google Scholar]
- A Lumenisity White Paper: CoreSmart Hollowcore Cable Solutions. Version 1.1. Lumenisity: Romsey, UK, 2021.
- Zhu, T.; Xiao, F.; Xu, L.; Liu, M.; Deng, M.; Seng Chiang, K. Pressure-assisted low-loss fusion splicing between photonic crystal fiber and single-mode fiber. Opt. Express 2012, 20, 24465–24471. [Google Scholar] [CrossRef] [PubMed]
- Song, N.; Wua, C.; Luo, W.; Zhang, Z.; Li, W. High strength fusion splicing of hollow core photonic crystal fiber and single-mode fiber by large offset reheating. Opt. Fiber Technol. 2016, 32, 106–110. [Google Scholar] [CrossRef]
- Xiao, L.; Demokan, M.S.; Jin, W.; Wang, Y.; Zhao, C.-L. Fusion Splicing Photonic Crystal Fibers and Conventional Single-Mode Fibers: Microhole Collapse Effect. J. Light. Technol. 2007, 25, 3563–3574. [Google Scholar] [CrossRef]
- User’s Manual for the FSU 975 Single Fiber Fusion Splicer by Ericsson; Ericsson Cables AB: Hudiksvall, Sweden, undated; Document 89ST018 R1E.
- FITEL S183PMII ver.2 Fusion Splicer/S184PM-SLDF ver.2 Fusion Splicer—A New Standard in the Field for High-End/Super High-End Fusion Splicing Applications; AC2T-110021-3; Furukawa Electric: Tokyo, Japan, 2017.
- Wooler, J.P.; Sandoghchi, S.R.; Gray, D.; Poletti, F.; Petrovich, M.N.; Wheeler, N.V.; Baddela, N.; Richardson, D.J. Overcoming the Challenges of Splicing Dissimilar Diameter Solid-Core and Hollow-Core Photonic Band Gap Fibers. In Proceedings of the Workshop on Specialty Optical Fibers and their Applications, Sigtuna, Sweden, 28–30 August 2013. W3.26. [Google Scholar] [CrossRef]
- Wooler, J.P.; Gray, D.; Poletti, F.; Petrovich, M.N.; Wheeler, N.V.; Parmigiani, F.; Richardson, D.J. Robust Low Loss Splicing of Hollow Core Photonic Bandgap Fiber to Itself. In Proceedings of the OFC/NFOEC 2013, Anaheim, CA, USA, 17–21 March 2013. OM3I.5. [Google Scholar] [CrossRef]
- Borzycki, K.; Schuster, K. Arc fusion splicing of photonic crystal fibres. In Photonic Crystals—Introduction, Applications and Theory; Massaro, A., Ed.; IntechOpen: London, UK, 2012; pp. 175–200. [Google Scholar] [CrossRef]
- Komanec, M.; Suslov, D.; Zvánovec, S.; Chen, Y.; Bradley, T.; Sandoghchi, S.R.; Numkam Fokoua, E.R.; Jasion, G.T.; Petrovich, M.N.; Poletti, F.; et al. Low-Loss and Low-Back-Reflection Hollow-Core to Standard Fiber Interconnection. IEEE Photonics Technol. Lett. 2019, 31, 723–726. [Google Scholar] [CrossRef]
- PYREX and Corning Glass and Reusable Plastic Product Selection Guide; Life Sciences, document LS-GL-001 REV14. Corning Inc.: Corning, NY, USA, March 2023; p. 115. Available online: https://www.corning.com/catalog/cls/documents/selection-guides/CLS-GL-001.pdf (accessed on 21 September 2023).
- VitroCom Miniature Hollow Glass Capillaries (VitroTubes). CM Scientific. July 2018. Available online: https://www.cmscientific.de/wp-content/uploads/VitroCom-DataSheet.pdf (accessed on 21 September 2023).
- Kuschnerov, M.; Sleiffer, V.A.J.M.; Chen, Y.; de Man, E.; Chen, Y.; Liu, Z.; Sandoghchi, S.R.; Jasion, G.T.; Bradley, T.; Numkam Fokoua, E.; et al. Data Transmission through up to 74.8 km of Hollow-Core Fiber with Coherent and Direct-Detect Transceivers. In Proceedings of the ECOC 2015, Valencia, Spain, 27 September–1 October 2015. Th1.2.4. [Google Scholar] [CrossRef]
- Nespola, A.; Straullu, S.; Bradley, T.D.; Mulvad, H.C.; Hayes, J.R.; Jasion, G.T.; Gouveia, M.A.; Sandoghchi, S.R.; Bawn, S.; Forghieri, F.; et al. Record PM-16QAM and PM-QPSK transmission distance (125 and 340 km) over hollow-core-fiber. In Proceedings of the ECOC 2019, Dublin, Ireland, 22–26 September 2019. [Google Scholar] [CrossRef]
- Nespola, A.; Straullu, S.; Bradley, T.D.; Harrington, K.; Sakr, H.; Jasion, G.T.; Fokoua, E.N.; Jung, Y.M.; Chen, Y.; Hayes, J.R.; et al. Transmission of 61 C-band Channels with L-band Interferers over Record 618km of Hollow-Core-Fiber. In Proceedings of the OFC 2020, San Diego, CA, USA, 8–12 March 2020. Th4B.5. [Google Scholar] [CrossRef]
- Nespola, A.; Sandoghchi, S.R.; Hooper, L.; Alonso, M.; Bradley, T.D.; Sakr, H.; Jasion, G.T.; Numkam Fokoua, E.; Straullu, S.; Garrisi, F.; et al. Ultra-Long-Haul WDM Transmission in a Reduced Inter-Modal Interference NANF Hollow-Core Fiber. In Proceedings of the OFC-2021, San Francisco, CA, USA, 6–10 June 2021. F3B.5. [Google Scholar] [CrossRef]
- Iqbal, A.; Wright, P.; Parkin, N.; Fake, M.; Alonso, M.; Sandoghchi, S.R.; Lord, A. First Demonstration of 400ZR DWDM Transmission through Field Deployable Hollow-Core-Fibre Cable. In Proceedings of the OFC-2021, San Francisco, CA, USA, 6–10 June 2021. F4C.2. [Google Scholar] [CrossRef]
- Liu, C.Y. 100+ Gb/s Ethernet Forward Error Correction (FEC) Analysis. Signal Integr. J. 2019, 9. Available online: https://www.signalintegrityjournal.com/articles/1286-gbs-ethernet-forward-error-correction-fec-analysis (accessed on 21 September 2023).
- Teipen, B.; Filer, M.; Grießer, H.; Eiselt, E.; Elbers, J. Forward Error Correction Trade-offs in Reduced-Latency Optical Fiber Transmission Systems. In Proceedings of the ECOC-2012, Amsterdam, The Netherlands, 16–20 September 2012. P4.07. [Google Scholar]
- Low Latency—How Low Can You Go? White Paper 0188-WP-RevB-0920; Infinera: San Jose, CA, USA, 2020.
- Lewis, M. The Wolf Hunters of Wall Street. New York Times. 31 March 2014. Available online: https://www.nytimes.com/2014/04/06/magazine/flash-boys-michael-lewis.html (accessed on 20 February 2023).
- Duhigg, C. Stock Traders Find Speed Pays, in Milliseconds. New York Times. 23 July 2009. Available online: https://www.nytimes.com/2009/07/24/business/24trading.html (accessed on 20 February 2023).
- Troianovski, A. Networks Built on Milliseconds. The Wall Street Journal. 30 May 2012. Available online: https://www.wsj.com/articles/SB10001424052702304065704577426500918047624 (accessed on 20 February 2023).
- Bhattacherjee, D.; Aqeel, W.; Laughlin, G.; Maggs, B.M.; Singla, A. A Bird’s Eye View of the World’s Fastest Networks. In Proceedings of the ACM Internet Measurement Conference (IMC’20), Virtual Event, USA, 27–29 October 2020; pp. 521–527. [Google Scholar] [CrossRef]
- Osipovich, A. High-Frequency Traders Push Closer to Light Speed with Cutting-Edge Cables. The Wall Street Journal. 15 December 2020. Available online: https://www.wsj.com/articles/high-frequency-traders-push-closer-to-light-speed-with-cutting-edge-cables-11608028200 (accessed on 20 February 2023).
- Zhou, X. Low Latency for Modern Datacenter Applications. Session “Low Latency Communications—Where Do We Need It? How To Achieve It?”. In Proceedings of the OFC-2021, San Francisco, CA, USA, 6 June 2021. [Google Scholar]
- Lopez, O.; Kefelian, F.; Jiang, H.; Haboucha, A.; Bercy, A.; Stefani, F.; Chanteau, B.; Kanj, A.; Rovera, D.; Achkar, J.; et al. Frequency and time transfer for metrology and beyond using telecommunication network fibres. Comptes Rendus Phys. 2015, 16, 531–539. [Google Scholar] [CrossRef]
- Liu, B.; Guo, X.; Kong, W.; Liu, T.; Dong, R.; Zhang, S. Stabilized Time Transfer via a 1000-km Optical Fiber Link Using High-Precision Delay Compensation System. Photonics 2022, 9, 522. [Google Scholar] [CrossRef]
- Krehlik, P.; Sliwczynski, L.; Buczek, L.; Kolodziej, L.; Lipinski, M. ELSTAB—Fiber-Optic Time and Frequency Distribution Technology: A General Characterization and Fundamental Limits. IEEE Trans. Ultrason. Ferroelectr. Freq. Control. 2016, 63, 993–1013. [Google Scholar] [CrossRef]
- Lu, Z.; Gui, Y.; Wang, J.; Ying, K.; Sun, Y.; Liu, L.; Cheng, N.; Cai, H. Fiber-optic time-frequency transfer in gigabit ethernet networks over urban fiber links. Opt. Express 2021, 29, 11693–11701. [Google Scholar] [CrossRef] [PubMed]
- Bigler, T.; Treytl, A.; Loeschenbrand, D.; Zemen, T. High Accuracy Synchronization for Distributed Massive MIMO using White Rabbit. In Proceedings of the 2018 IEEE International Symposium on Precision Clock Synchronization for Measurement, Control, and Communication (ISPCS 2018), Geneva, Switzerland, 30 September–5 October 2018; pp. 118–123. [Google Scholar] [CrossRef]
- Iqbal, M.A.; Wright, P.; Parkin, N.; Lord, A. Performance Assessment of Hollow Core Fibre in High-Capacity National Backbone Networks. In Proceedings of the Conference on Lasers and Electro-Optics (CLEO), San Diego, CA, USA, 15–20 May 2022. SM2J.1. [Google Scholar] [CrossRef]
- Iqbal, M.A.; Wright, P.; Lord, A. Technical Study on the Viability of Hollow-Core and Ultra-Low-Loss Silica Fibres in Metro-Core Optical Networks. In Proceedings of the Optical Fiber Communications Conference and Exhibition (OFC), San Diego, CA, USA, 5–9 March 2023. Th2A.14. [Google Scholar] [CrossRef]
- Poggiolini, P.; Poletti, F. Opportunities and Challenges for Long-Distance Transmission in Hollow-Core Fibres. J. Light. Technol. 2022, 40, 1605–1616. [Google Scholar] [CrossRef]
- Li, Z.; Heidt, A.M.; Daniel, J.M.O.; Jung, Y.; Alam, S.U.; Richardson, D.J. Thulium-doped fiber amplifier for optical communications at 2 μm. Opt. Express 2013, 21, 9289–9297. [Google Scholar] [CrossRef] [PubMed]
- Chen, S.; Jung, S.; Alam, S.-U.; Richardson, D.J.; Sidharthan, R.; Ho, D.; Yoo, S.; Daniel, J.M.O. Ultra-short wavelength operation of thulium-doped fiber amplifiers and lasers. Opt. Express 2019, 27, 36699–36707. [Google Scholar] [CrossRef] [PubMed]
- Wei, X.; Shi, B.; Richardson, D.J.; Poletti, F.; Slavik, R. Distributed Characterization of Low-loss Hollow Core Fibers using EDFA-assisted Low-cost OTDR instrument. In Proceedings of the OFC-2023, San Diego, CA, USA, 24–28 March 2023. W1C.4. [Google Scholar] [CrossRef]
- Wheeler, N.V.; Petrovich, M.N.; Baddela, N.K.; Hayes, J.R.; Numkam Fokoua, E.; Poletti, F.; Richardson, D.J. Gas absorption between 1.8 and 2.1 μm in low loss (5.2 dB/km) HC-PBGF. In Proceedings of the 2012 Conference on Lasers and Electro-Optics (CLEO), San Jose, CA, USA, 6–11 May 2012; pp. 1–2. [Google Scholar] [CrossRef]


| Parameter | NANF | SMF-28e+ |
|---|---|---|
| Core diameter [µm] | 29–36 | 8.2 |
| Mode field diameter, MFD (nom.) [µm] | 18–25 @ 1550 nm | 10.4 @ 1550 nm |
| Cladding diameter (nom.) [µm] | 82 | 125 |
| Jacket diameter (see Section 7.1) [µm] | 200 | (125) |
| Effective refractive index, neff @ 1550 nm | 1.003 | 1.468 |
| Low-loss spectrum [nm] | 1250–1650 1 | 1260–1675 |
| Attenuation @ 1310 nm [dB/km] | 0.22–0.40 | ≤0.35 |
| Attenuation @ 1550 nm [dB/km] | 0.20–0.35 | ≤0.20 |
| Chromatic dispersion (typ.) [ps/nm⋅km] | 1.5–4 @ 1550 nm | 17 @ 1550 nm |
| PMD [ps/√km] | 0.29 | ≤0.10 |
| Gas | σ [10−32 m2] | Absorption Lines or Bands 1 [nm] |
|---|---|---|
| Helium (4He) | 0.39 | 668, 707, 1083, 2058 |
| Argon (Ar) | 23.8 | 697, 707, 750, 764, 795, 801, 810, 812, 912, 966 |
| Nitrogen (N2) | 26.5 | 744, 747, 868, 1247, 1358, 2099–2206 |
| Oxygen (O2) | 22.0 | 777, 845, 927, 1253–1283 |
| Chlorine (Cl2) | no data | 822, 838, 859 |
| Fluorine (F2) | no data | 686, 704, 713 |
| Hydrogen (H2) | 5.30 | 656, 1282, 1875 |
| Methane (CH4) | 59.2 | 1631–1679 |
| Propane (C3H8) | 346 | 1685–1765 |
| Ammonia (NH3) | 38.9 | 1471–1547, 1926–2025, 2200–2348 |
| Water vapor (H2O) | 19.2 | 1117–1153, 1352–1414, 1816–1934 |
| Carbon dioxide (CO2) | 62.2 | 1432, 1438, 1998–2026 |
| Channel Data Rate [Gb/s] | Number of Channels | Aggregate Data Rate [Tb/s] | Line Code | Channel Spacing [GHz] | Minimum Reach [km] | Year | Ref. |
|---|---|---|---|---|---|---|---|
| 25 | 61 | 1.525 | PM-QPSK | 50 | 341 | 2019 | [112] |
| 25 | 61 | 1.525 | PM-16QAM | 50 | 125 | 2019 | [112] |
| 25 | 61 | 1.525 | PM-QPSK | 50 | 618 | 2020 | [113] |
| 25 | 41 | 1.025 | PM-QPSK | 50 | 2760 | 2021 | [114] |
| 400 | 38 | 15.2 | DP-16QAM 1 | 100 | 10.25 2 | 2021 | [115] |
| 400 | 63 | 25.6 | DP-16QAM 3 | 75 | 1128 | 2021 | [54] |
| 800 | 47 | 38.4 | No data 4 | 100 | 126 | 2021 | [54] |
Disclaimer/Publisher’s Note: The statements, opinions and data contained in all publications are solely those of the individual author(s) and contributor(s) and not of MDPI and/or the editor(s). MDPI and/or the editor(s) disclaim responsibility for any injury to people or property resulting from any ideas, methods, instructions or products referred to in the content. |
© 2023 by the authors. Licensee MDPI, Basel, Switzerland. This article is an open access article distributed under the terms and conditions of the Creative Commons Attribution (CC BY) license (https://creativecommons.org/licenses/by/4.0/).
Share and Cite
Borzycki, K.; Osuch, T. Hollow-Core Optical Fibers for Telecommunications and Data Transmission. Appl. Sci. 2023, 13, 10699. https://doi.org/10.3390/app131910699
Borzycki K, Osuch T. Hollow-Core Optical Fibers for Telecommunications and Data Transmission. Applied Sciences. 2023; 13(19):10699. https://doi.org/10.3390/app131910699
Chicago/Turabian StyleBorzycki, Krzysztof, and Tomasz Osuch. 2023. "Hollow-Core Optical Fibers for Telecommunications and Data Transmission" Applied Sciences 13, no. 19: 10699. https://doi.org/10.3390/app131910699
APA StyleBorzycki, K., & Osuch, T. (2023). Hollow-Core Optical Fibers for Telecommunications and Data Transmission. Applied Sciences, 13(19), 10699. https://doi.org/10.3390/app131910699