1. Introduction
In applied optics, the introduction of photonic crystals [
1] marked an important milestone in the technological ability to control and manipulate light. The photonic crystal functionality is based on its micrometer or nanometer periodic structure scale, so that electromagnetic waves in the visible range will be affected by effects analogous to those suffered by an electron at a periodic potential. This creates a pattern through which photons cannot propagate in certain directions, with different polarization or for certain wavelengths. This is due to the formation of what are known as photonic band gaps. Their application is quite widespread; it has even recently been shown that they can be used for polarization control in metamaterials [
2].
The idea of bringing these microstructures to the fiber optic waveguides field led to the introduction of the photonic crystal fibers (PCFs) [
3,
4], which paved the way to a fresh bunch of new research fields for the photonics community. We can study their use as sensors [
5], in high-power generation [
6], or as fiber lasers [
7], to cite some. Among these new applications, supercontinuum generation by means of a PCF emerged as an easy way to cause a significant broadening in the spectral bandwidth of an input pulse propagating through the fiber [
8,
9,
10].
Since the fabrication process of a PCF is expensive, it is mandatory to previously simulate the characteristics and performance of the design to be sure it will offer the expected results [
11].
The simulation process consists of two clearly differentiated parts: the characterization of the fiber parameters solving the Helmholtz equation and the study with the generalized nonlinear Schrödinger equation (GNLSE) of the propagation of the pulse under the effects of the previously determined parameters [
12,
13]. In our work, the Helmholtz equation can be treated as an eigenvalue problem [
14], and the GNLSE will be solved using spectral techniques.
From a PCF characterization model, a set of curves that relates dispersion parameters with the light wavelength inside the fiber has been obtained [
15]. Once these parameters are known, the GNLSE shows the pulse evolution in the fiber both in the time and spectral domains.
There is nothing new in what has been exposed so far; both are well-known problems that have been solved a long time ago. But, while the characterization of the PCF determines the relation between all its parameter and the corresponding wavelength, it is common practice to assume in the propagation a constant working wavelength, usually associated with the center of the pulse [
16]. This is an approximation that could be taken in systems where the spectral broadening of the pulse during the simulation is negligible, but the supercontinuum generation is the totally opposite case to that assumption, because our goal is to broaden the spectrum as much as possible [
17].
The aim of this work is to study the influence of the wavelength dependence of nonlinear and dispersion parameters on the pulse propagation and its effect on the spectrum. Thus, we analyzed if the impact justifies the implementation of this dependency in the usual methods that solve the GNLSE when supercontinuum generation occurs. As it will be shown in the Conclusions, this is the case.
The structure of the paper is as follows.
Section 2 will introduce the equations mentioned before, starting with the PCF parameters’ characterization through the Helmholtz equation and their application to the proposed structure; secondly, the GNLSE is presented, taking into account the different effects that it includes and its associated terms, as well as the spectral method used to solve it. The supercontinuum generation will also be presented there.
Section 3 collects all the results from the simulations and the comparison data between the constant and wavelength-dependent cases. The conclusions will be presented at the end of the whole study.
2. Materials and Methods
We have divided this section into four parts; in the first two, we will explain the design of the fiber used and the equations necessary to calculate its most-representative parameters. Subsequently, the wavelength dependence of these parameters will be calculated, and we will end with the application of these results to the GNLSE to see a first generic example of supercontinuum generation.
2.1. The PCF Model
The PCFs are characterized by a variety of complex designs built upon a mix of materials that, working as a whole, try to induce interesting behaviors over the light along its propagation, so that, when talking about the PCF design, it would not be misguiding to speak about a tailoring process.
In this paper, a very specific design has been chosen to study the supercontinuum phenomena [
16]. The next figure shows the transversal section of this fiber. In our case, the core is made of Si and is surrounded by four concentric rings of air holes. The main body of the PCF is made of MgF
2. Concrete details appear in the comments for
Figure 1.
As can be seen, a radial pattern of concentric rings surrounds a central core of silicon. Each of the rings contains
air holes, where
n is the order of the ring starting from the inside to the outside. The cladding and core materials are MgF
2 and Si, respectively. Using the Sellmeier equation, with the coefficients presented in
Table 1, the dependency of the materials’ refractive index can be expressed as a function of wavelength (in µm) as [
3]:
The values used for the different coefficients in Equation (
1) that appear in
Table 1 coming from [
18,
19] are given below.
Table 1.
Sellmeier coefficients for MgF2 and Si.
Table 1.
Sellmeier coefficients for MgF2 and Si.
| Material | | | | (µm2) | (µm2) | (µm2) |
|---|
| MgF2 | 0.413 | 0.505 | 2.49 | 0.0013 | 0.0081 | 565 |
| Si | 10.67 | 0.003 | 1.541 | 0.090 | 1.288 | 1,218,816 |
2.2. Helmholtz Equations and Photonic Crystal Fiber Characterization
As explained in the Introduction, the study of the propagation of light through an optical fiber begins with the simulation of its characteristic parameters, which are determined by the internal structure and materials of the fiber. The governing equations of the interaction between this structure and the electric and magnetic fields inside the fiber are the Helmholtz equations [
14]:
where
and
are the transversal components of the electric and magnetic fields for the guided mode,
the complex propagation constant,
the wavenumber associated with the input pulse, and
the dielectric distribution inside the fiber, which depends on its internal structure and constituent materials. By solving one of the equations, Maxwell’s equations allow expressing this solution in terms of the other field distribution.
As can be seen, each of the Helmholtz equations can be expressed as an eigenvalue problem, where the eigenvalues are related to the effective index of the PCF and the eigenvectors coincide with the field distributions for the guided modes.
Starting with the eigenvalue, the effective index can be expressed as:
where
is the real propagation parameter and
the loss parameter.
From
, the dispersion orders can be calculated through successive derivation [
20]:
On the other hand, the integration of the field distributions obtained from the eigenvectors of the system allow calculating the effective area of the modes [
20]:
where
refers to the optical field. This parameter represents the light-carrying section of the fiber and is related to the nonlinear parameter, where
is the second-order nonlinear refraction index:
The whole set of parameters presented at this point has a strong dependency on the wavelength, which is introduced in the system through the
value in Equations (
2) and (
3). In addition, another important factor is the
parameter, the dielectric constant, which models the electrical response of the constitutive materials in the PCF.
2.3. PCF Parameters’ Wavelength Dependency
As we have already pointed out, in our work, we will try to prove the relevance of the dependence on the wavelength of the dispersion parameters used for the propagation of the pulse within the PCF.
In principle, the process to simulate the supercontinuum generation starts by choosing a PCF structure; this part has been explained in a previous section. At this point, we will calculate its parameters with a numerical algorithm for the Helmholtz equations. These parameters will be then employed to numerically solve the generalized NLSE and model the propagation of an input pulse through the given PCF.
A specific numerical method based on centered finite differences [
21] was employed to solve the Helmholtz Equations (
2) and (
3). Once performed, the fiber is characterized over the whole range of the studied wavelengths, obtaining the effective index and effective area relations.
While it is a common practice to assume a working wavelength and refer all the parameters to this value [
16], the results that will be presented in the next section show that the parameters’ dependency must be calculated individually for each wavelength, for all the wavelengths in the simulation range.
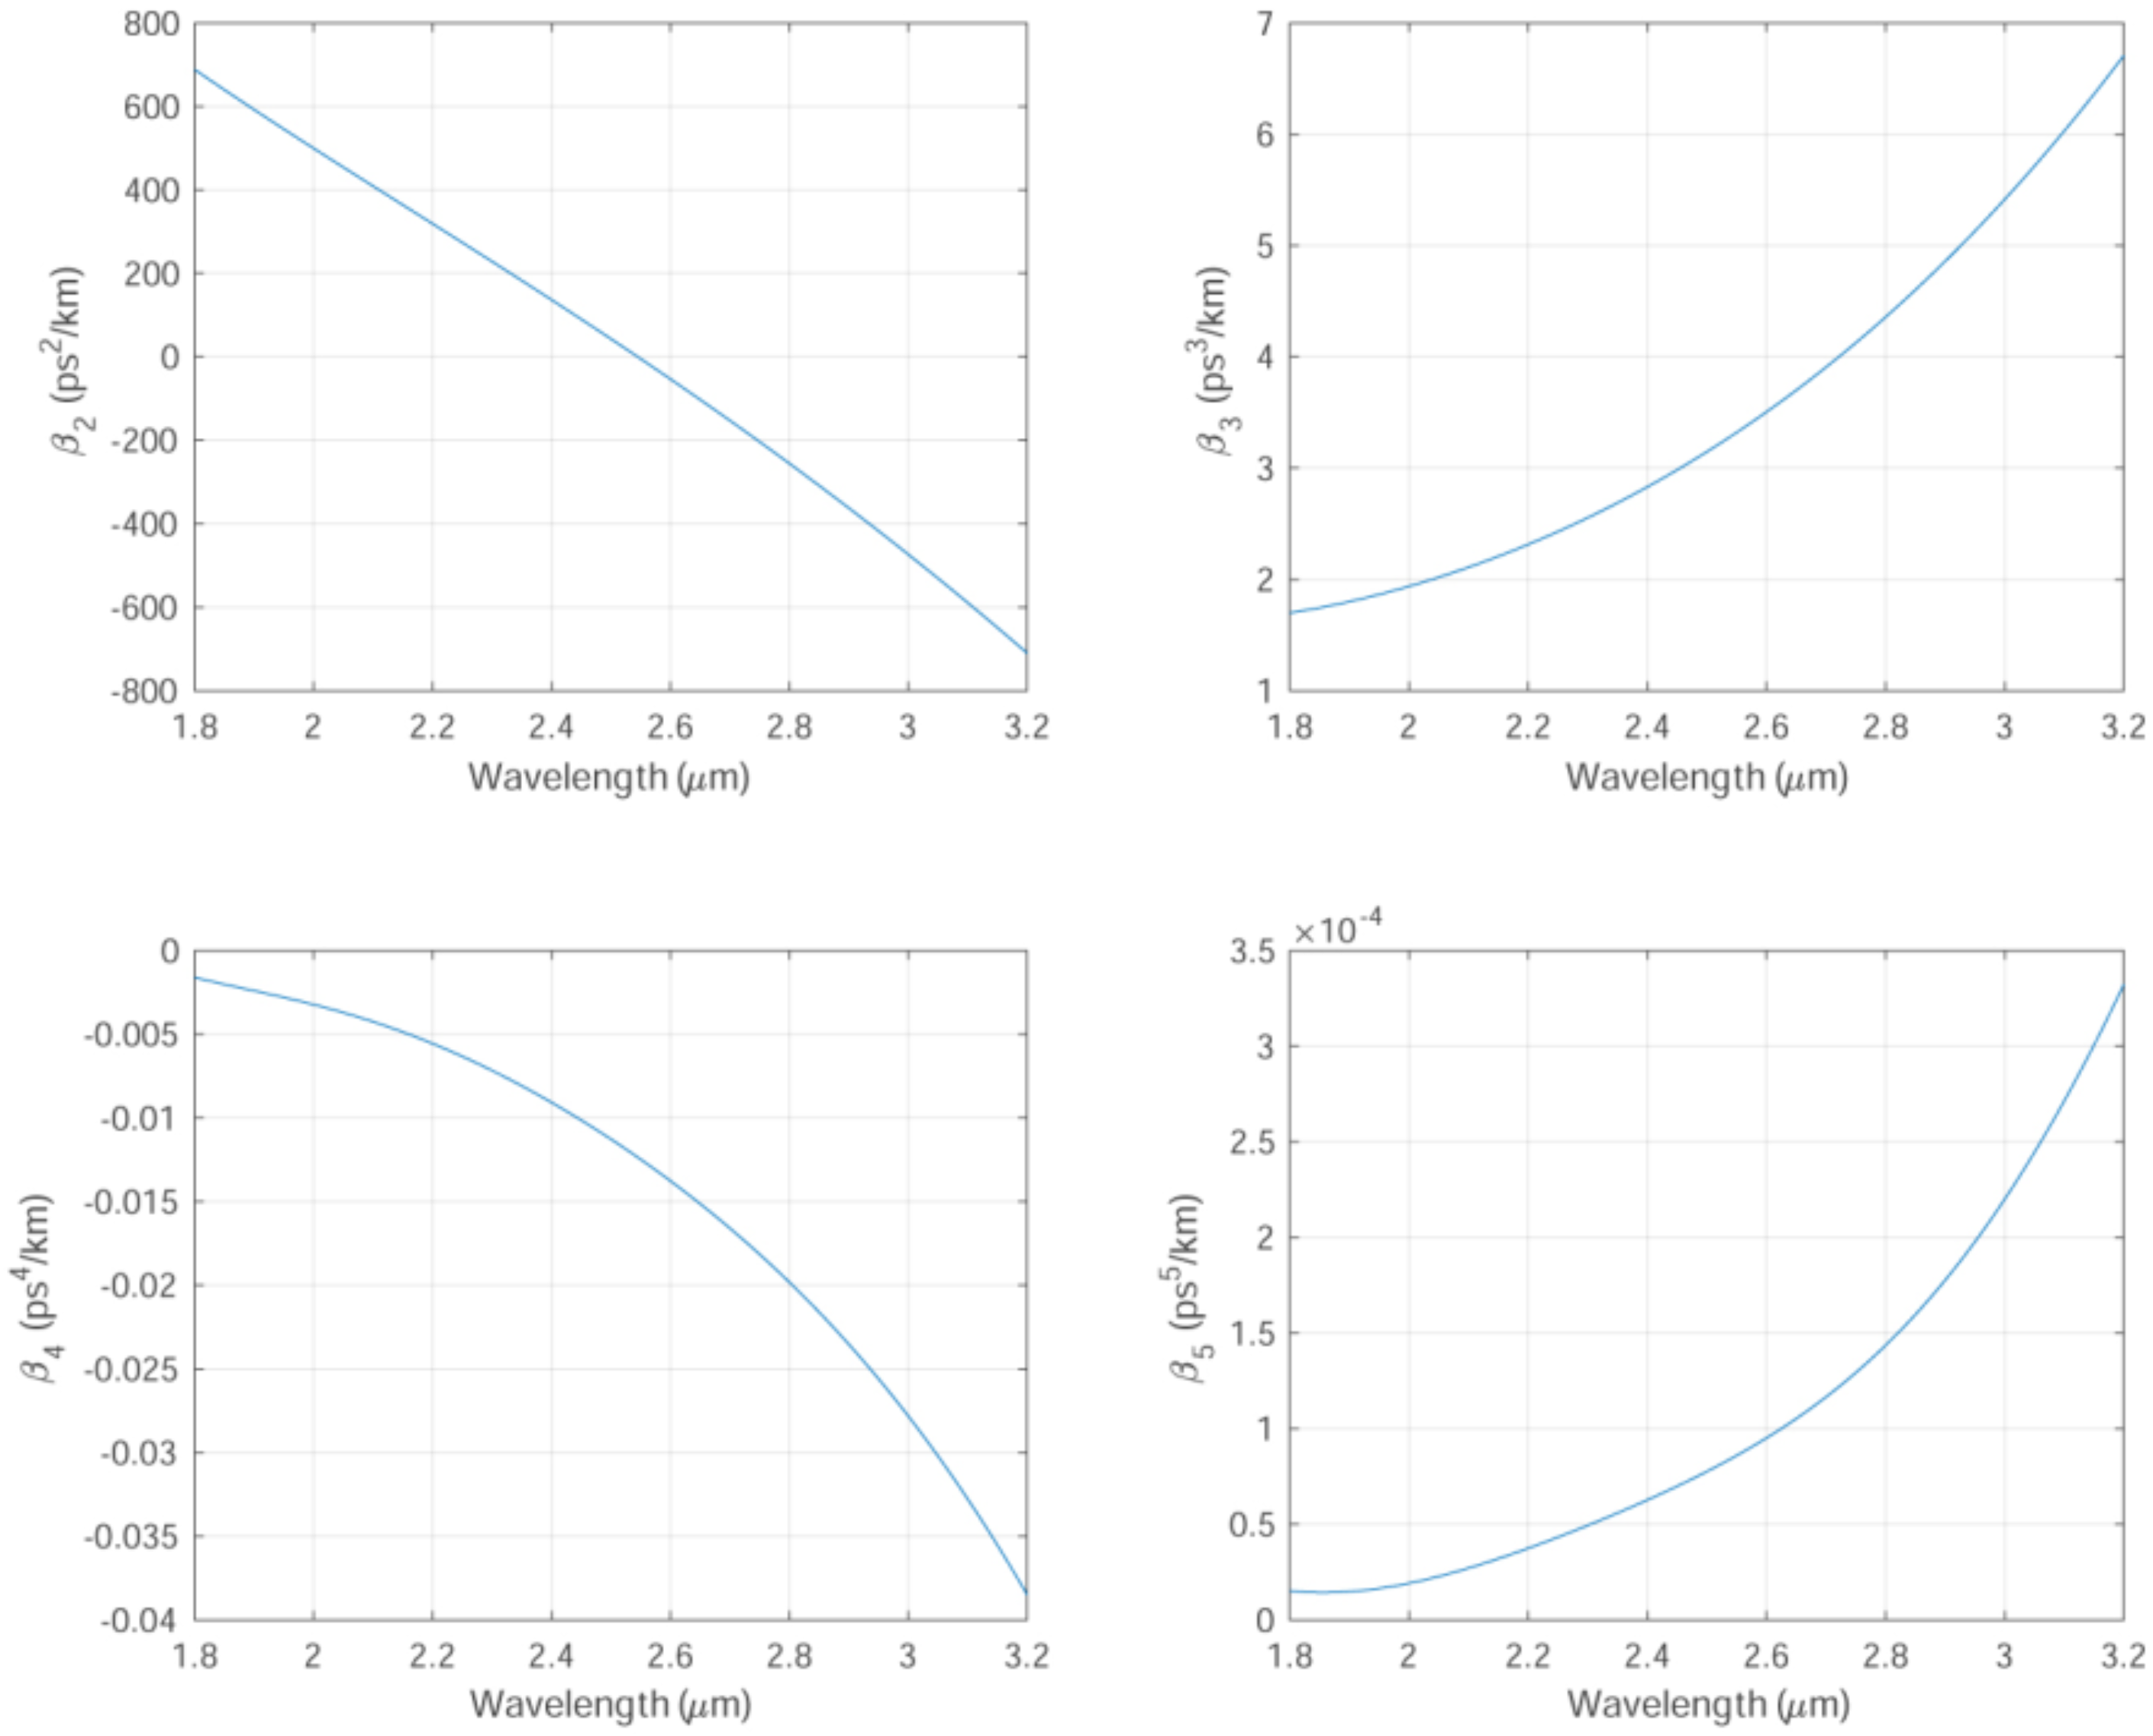
As can be seen in
Figure 2, the variability of the dispersion parameters with the wavelength is significant from one end to the another of the simulated range. The impact on the lowest and highest wavelengths is usually neglected with the assumption of constant averaged values. In the
Section 3, the influence of each individual value over its associated wavelength in the pulse propagation will be shown.
2.4. Generalized Nonlinear Schrödinger Equation and Supercontinuum Generation
The central idea behind supercontinuum generation is to obtain a broad continuous spectrum from a narrower input pulse after its propagation through a nonlinear media, the PCF in this case. Regarding the pulse, its initial delay should be in the femtoseconds regime, which allows the higher-order dispersion effects, among others, to act over it.
The governing equation in this case is the GNLSE, the expression of which is [
8]:
The three parts of Equation (
9) that appear to the left correspond to the following: In the first term,
accounts for the loss processes; the second part corresponds to the different partial derivatives that made the group velocity dispersion (GVD) effect; the
terms and its dependence on the wavelength is the main part of this work.
Finally, the nonlinear effects including the Raman effect constitute the third part; here,
is the nonlinear coefficient, which depends on the mode effective area
, Equation (
7), and the nonlinear refractive index. The Raman effects are included through the nonlinear response function
, which accounts for the instantaneous electronic and delayed Raman contributions, defined as:
where
and
is the Raman response function related to molecular vibrations [
22].
In order to resolve the generalized GNLSE, let us separate it into two parts, each one of these accounting for the two different physical effects this equation applies to: the GVD or linearpart and the self-phase modulation (SPM) or nonlinear part [
20].
After the proposed partitioning, the NLSE has the form:
Here,
E represents the slowly varying envelope of the solution,
z is the propagation distance, and
and
are the differential operators for the linear (GVD) and the nonlinear (SPM) parts of the equation, respectively.
The separation between both terms is the basis of the time-splitting spectral method used in this work to solve the GNLSE.
We start with the linear operator
:
In a dispersive medium, the GVD term is a result of the differences in the group velocity in a material with respect to the different frequencies that compound the pulse. For a time-splitting spectral approach, this linear part is resolved in the frequency Fourier space.
The nonlinear operator
:
In this case, we use the symmetric propagation scheme:
Among the multiple numerical algorithms developed to solve the previous equation, the split-step pseudospectral methods are the most-extended due to its accuracy and comparatively lower computational cost [
12]. In this paper, the symmetrical split-step Fourier method (S-SSFM) [
13] is applied in the simulations.
3. Results
In this section, once the object of the study (PCF) and the methods to be used have been stated, we will present the most-relevant results obtained for the generation of supercontinuum when our model is used.
The structure in this part is as follows. We will start by explaining the use of the wavelength dependence of the dispersion propagation parameters, i.e., , to solve the problem. Subsequently, the results in both propagation schemes: the constant parameters and the wavelength-dependent scheme, with different pulse widths and peak powers, will be compared, and we will finish by quantitatively defining a parameter to characterize the differences between them.
3.1. Wavelength-Dependent Supercontinuum-Generation Regime
The basis thesis of this paper is that the dependence on the wavelength of the fiber parameters induces a significant impact over the propagation of a solitonic pulse, which must be specially taken into account when simulating processes that cover a wide range of wavelengths like supercontinuum generation. These functional dependences, as appear in
Figure 2, have been included in the S-SSFM algorithm.
In
Figure 3, we show the results obtained for different propagation stages in the PCF of a input soliton pulse. Starting with the initial values, we can see how relevant the power values appear in the pulse profile throughout the simulations in all the wavelength range [
23] In the same figure, we can see how the parameter
deviates from a constant value. This constant approach, for the parameters of the generalized NLSE, have been used in previous works [
15,
16].
Due to these significant discrepancies, we considered it necessary to introduce the dependence on the wavelength for the different-order dispersion parameters and, thus, give a more-adjusted result to the simulated process.
3.2. Comparison of Results
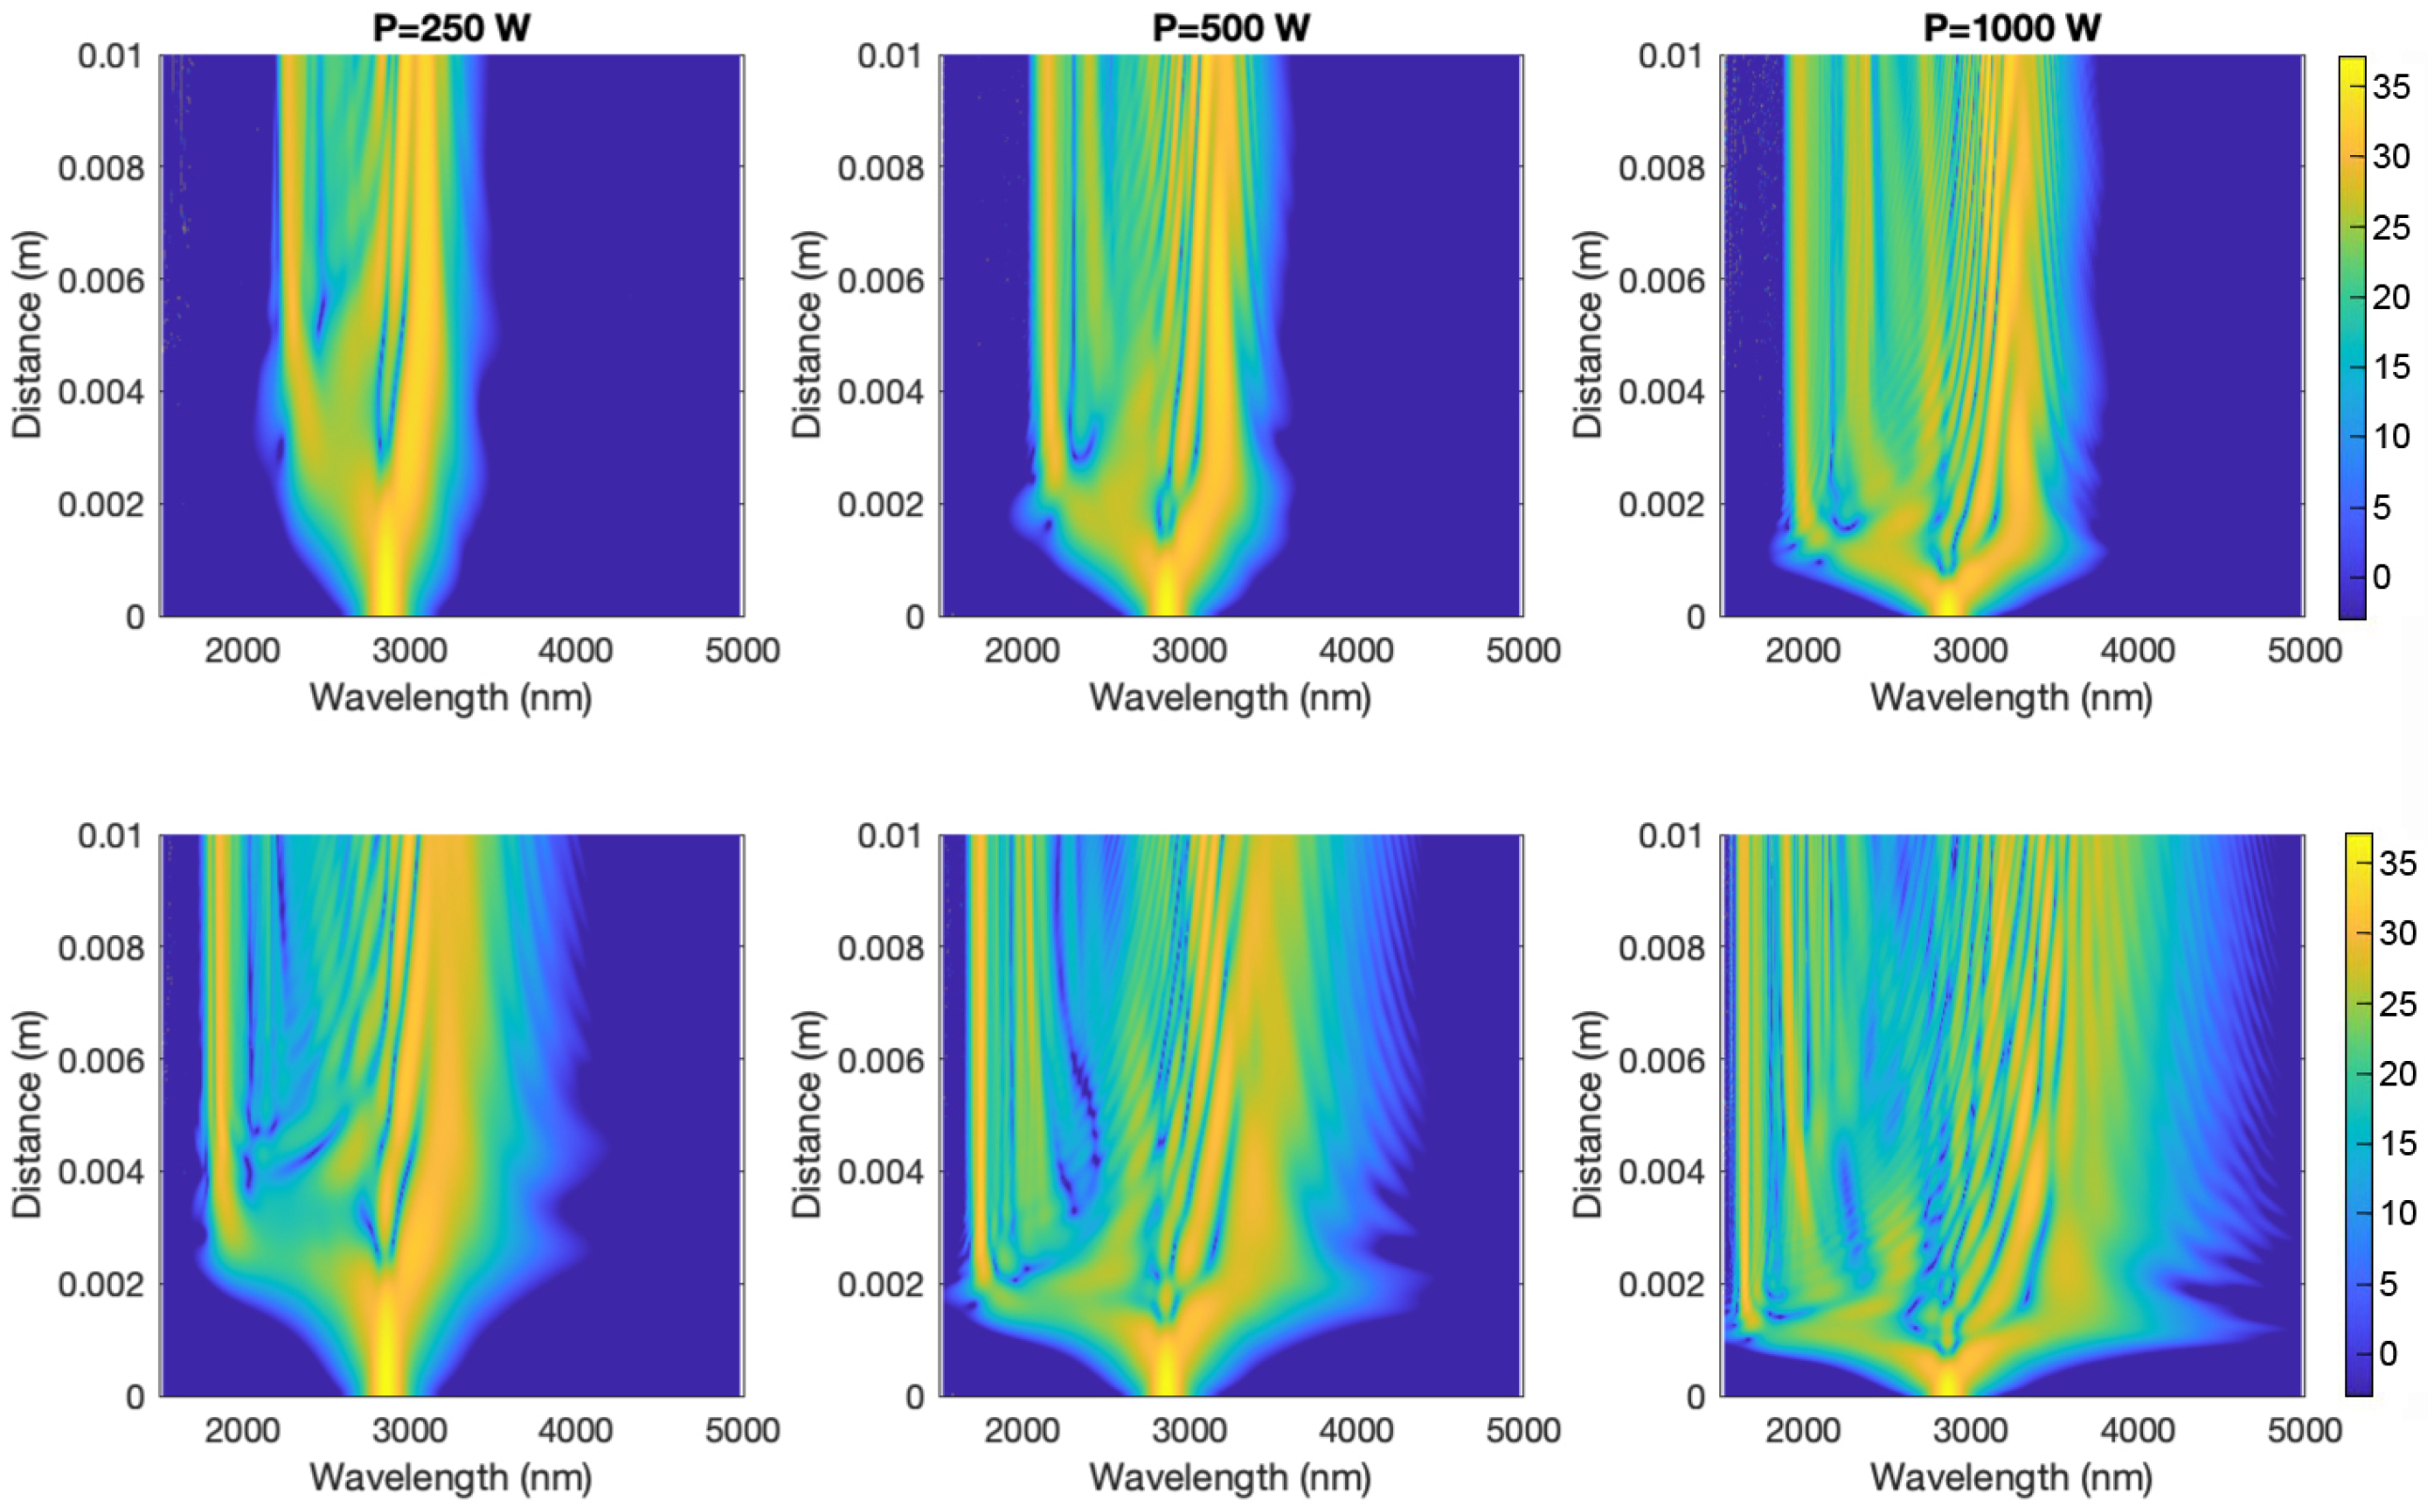
Two different input pulses have been simulated for different powers. These simulations have been performed for the constant and functional parameter models, and the results showed the impact of the wavelength dependence over the propagation.
In the first set of simulations, an input soliton pulse of a 50 fs width and a 2860 nm central wavelength were used. Also, the initial peak power values of 250, 500, and 1000 W complete the simulation set. In all cases, the distribution of the spectral intensity is represented on a logarithmic scale.
In addition,
Table 2 contains the fiber characteristic parameters, which have been used in the constant model, while the values with the wavelength dependence are those that appear in
Figure 2.
As we can expect, in both simulations, the appearance of notable power values can be observed for wavelengths that are not present in the original pulse. This, as we have already mentioned, is the essence of the supercontinuum-generation phenomenon.
In the approach we propose, i.e., with a dependence on the wavelength of the simulation parameters, we observed a compression of the spectrum obtained with respect to the results of previous studies [
16]. This effect is notable even for the lowest of the power values.
Figure 4 shows the results for the propagation in the PCF, expressed as the power obtained for each of the wavelengths used.
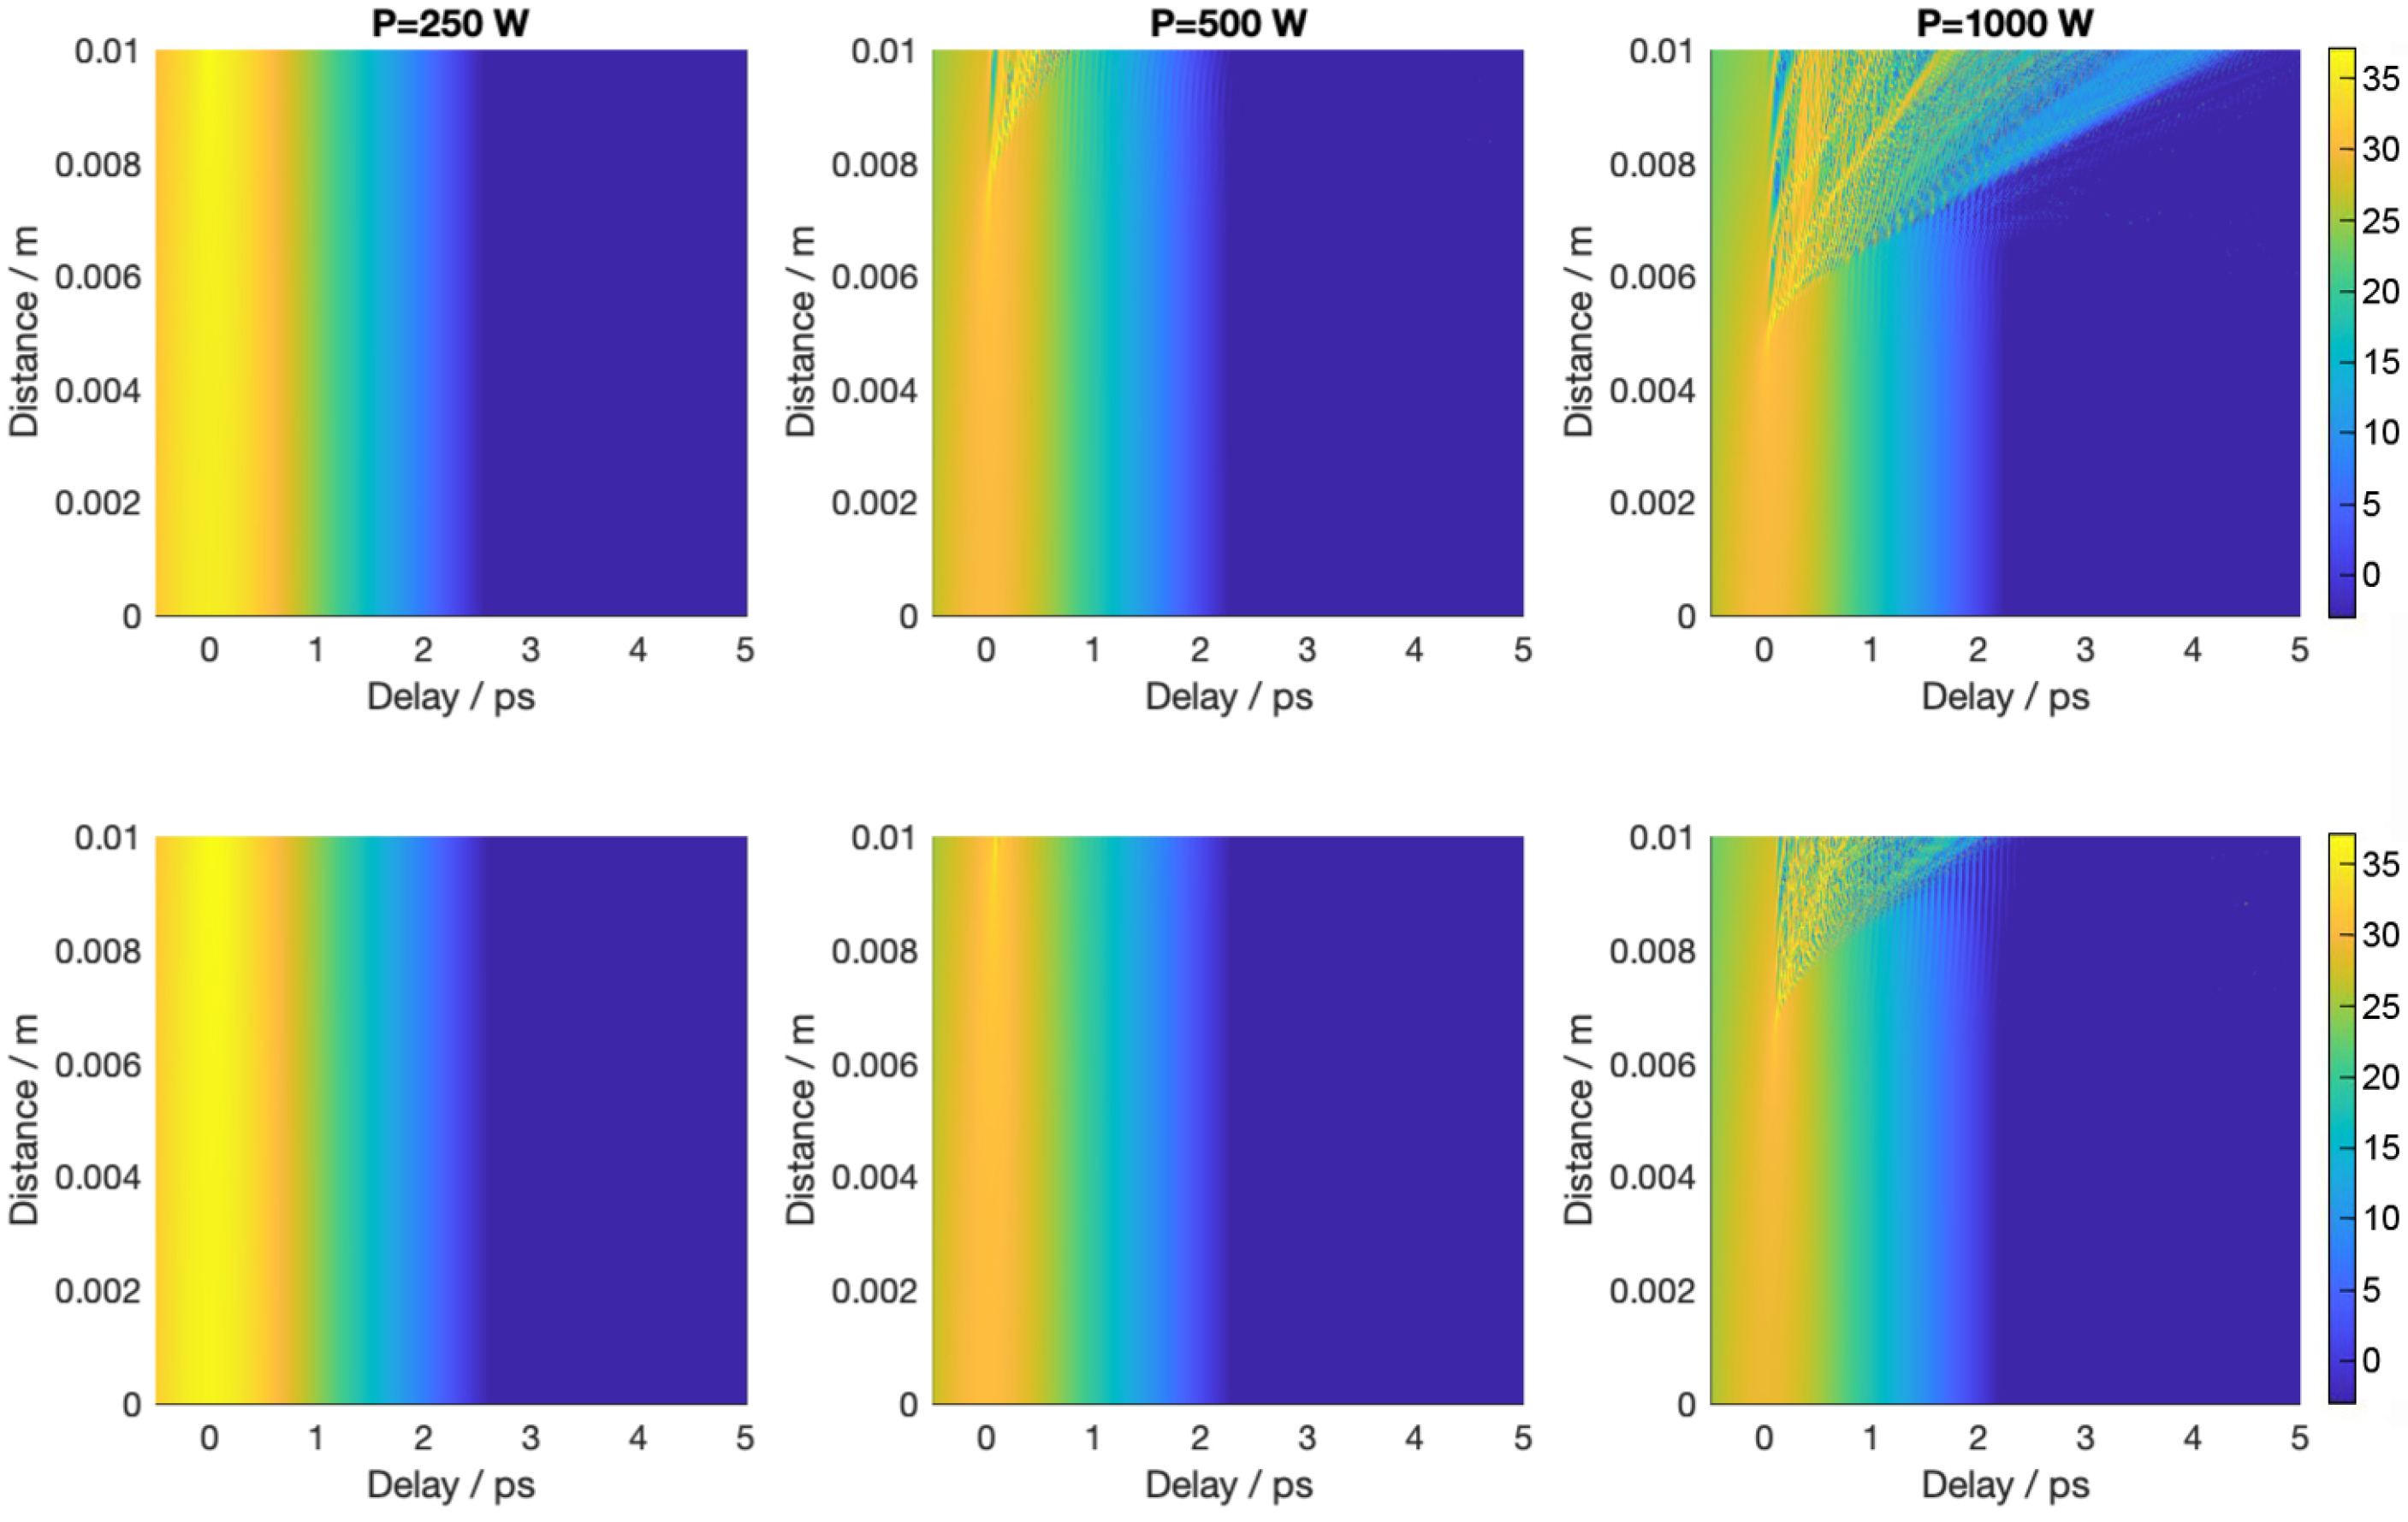
In
Figure 5, we can see the same results obtained in
Figure 4, but using the temporal representation. This representation gives us the opportunity to interpret the supercontinuum generation process as being similar to the soliton fission mechanism [
24,
25].
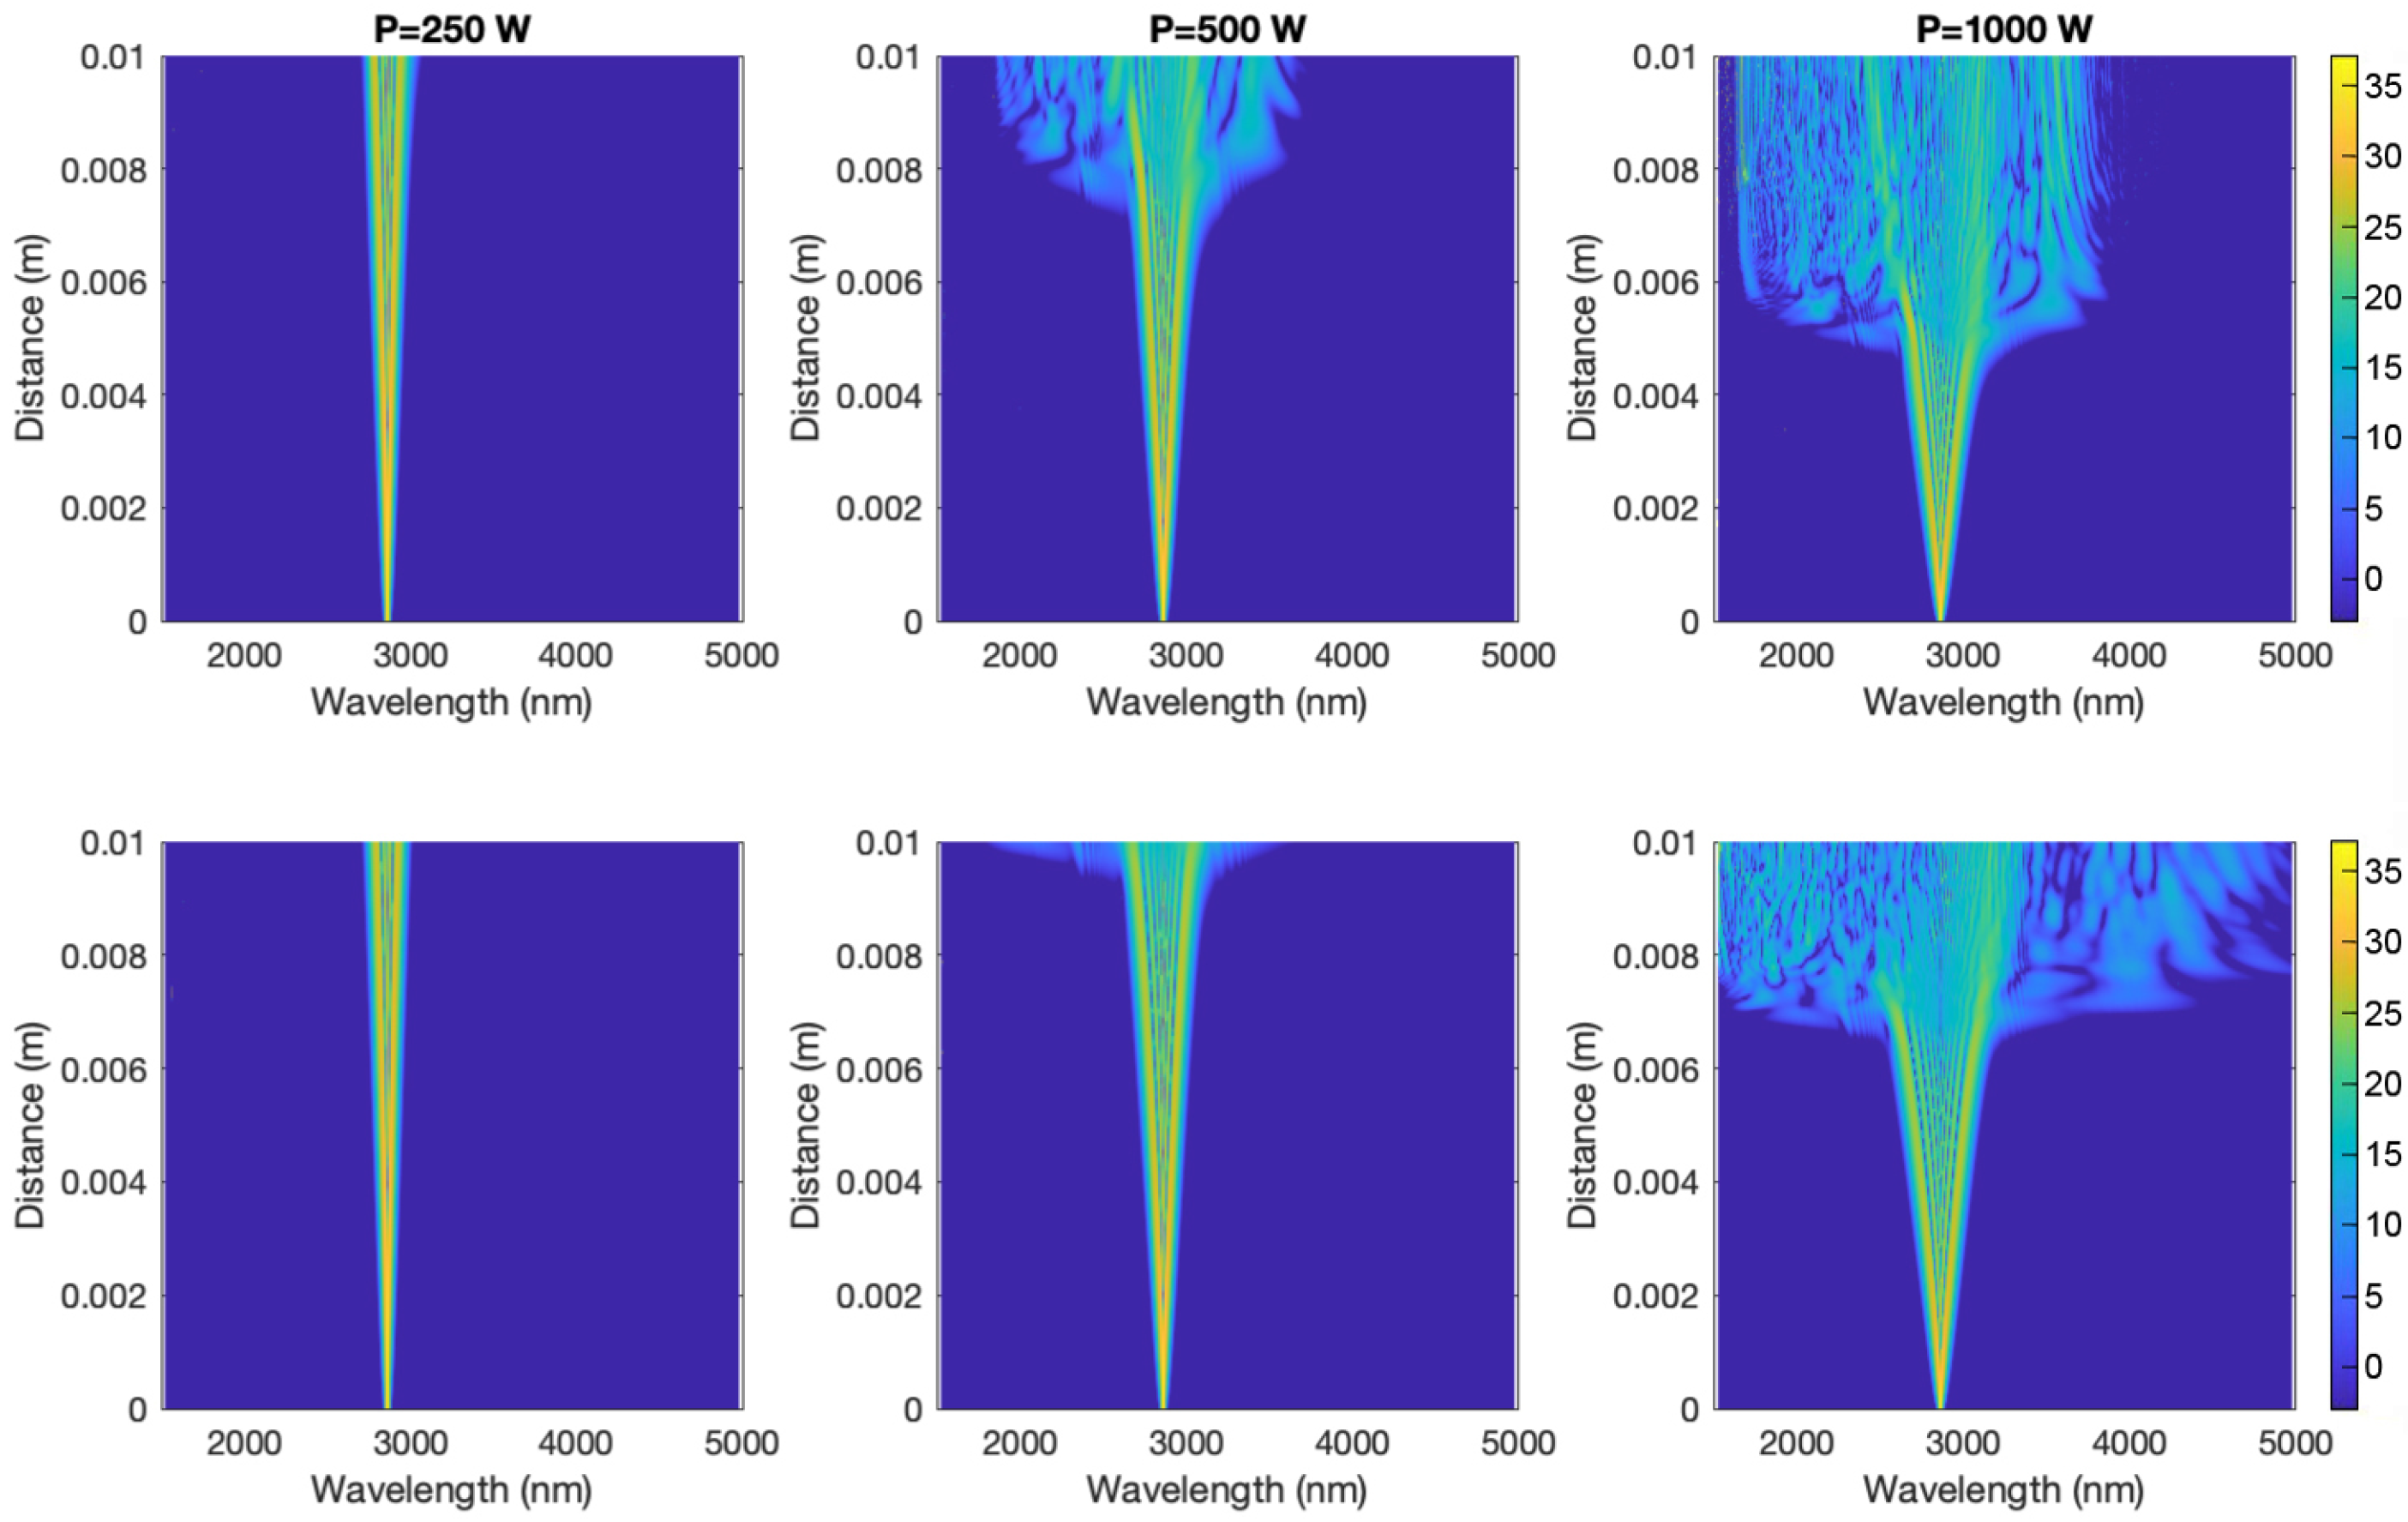
A second case was simulated for a solitonic pulse with the same central wavelength, but with a 500 fs width. The same constant parameters of
Table 2 were used, as well as the three same previous input powers.
Figure 6 and
Figure 7 show the results for the wavelength and time domain representations.
3.3. Spectral Measuring of the Results
From all the previous results, in our opinion,
Figure 4 and
Figure 6 are the most-relevant since they show the impact of the wavelength dependence over the spectral width, i.e., the comparison between the top and bottom rows in these figures shows the relevance of our approach to the problem, due to the difference between them.
In order to measure the aforementioned effect, we propose the following scheme:
Identify the peak power of the spectrum.
Calculate the desired fraction of power of this peak value (50% in both graphs in the paper).
Count the total number of wavelengths that exceed this power.
Determine its percentage over the total of the wavelengths simulated.
This process is repeated over the whole simulation for the constant and dependent models, calculating the difference between both results at each step to obtain
Figure 8 and
Figure 9.
The results showed a difference, which rises up to 30% in the case of the 50 fs pulse, between the number of wavelengths above 50% of the peak power for the constant over the dependent model, being considerably narrower along the whole propagation. This also implies a significative number of wavelengths that are associated with a lower power value than the simplified constant model predicts.
4. Discussion
In this work, we tried to establish, to the best of our knowledge, a different approach to the study of supercontinuum production in the PCF using the wavelength dependence of the dispersion parameters . As the most-relevant result, we have seen a considerable change in the distribution of the power associated with the different wavelengths.
This effect, in our opinion, is not negligible, as can be seen in the case of the narrow pulses in
Figure 8 or in the case of the wider pulses for higher powers in
Figure 9. In such a wavelength-dependent effect, as the supercontinuum generation is, we considered that this result must be taken into account in order to design better and more-accurate experimental devices.
To finish this section, some future lines of research associated with the proposed results could be proposed, e.g., from a theoretical point of view, the study could be extended to different geometries of the device or include the wavelength dependency for the rest of the parameters that appear in the generalized NLSE or, in a more-applied way, the study of the sensitivity characteristics when the PCFs are used as detectors. In this last direction, our group has already begun with some simulations.
Author Contributions
P.R. and D.M.-M. designed the simulations; A.O.-M. and A.D.-S. developed the theoretical part. All authors contributed to the analysis and writing of the results of the work. All authors have read and agreed to the published version of the manuscript.
Funding
This research received no external funding. We would like to thank the SICOMFI-TIC176 group of the Physics Department of the University of Córdoba for their support during the research process.
Institutional Review Board Statement
Not applicable.
Informed Consent Statement
Not applicable.
Data Availability Statement
We are considering the possibility of creating a git-hub-type repository with the developed material. The raw data supporting the conclusions of this article will be made available by the authors on request.
Acknowledgments
The authors appreciate the support of C. Quesada Padilla with the grammatical corrections of the final document.
Conflicts of Interest
The authors declare no conflicts of interest.
Abbreviations
The following abbreviations are used in this manuscript:
| PCF | photonic crystal fiber |
| GNLSE | generalized nonlinear Schrodinger equation |
| SPM | self-phase modulation |
| GVD | group velocity dispersion |
| S-SSFM | symmetrical split-step Fourier method |
References
- Joannopoulos, J.D.; Villeneuve, P.R.; Fan, S. Photonic Crystals. Solid State Commun. 1997, 102, 165–173. [Google Scholar] [CrossRef]
- She, Y.; Liu, D.; Li, J.; Yao, M.; Zheng, Y.; Wu, F. Tunable wide-angle high-efficiency polarization selectivity based on a one-dimensional photonic crystal containing elliptical metamaterials. Phys. Lett. A 2024, 494, 129299. [Google Scholar] [CrossRef]
- Knight, J.C. Photonic Crystal Fibres. Nature 2003, 424, 847–851. [Google Scholar] [CrossRef] [PubMed]
- Russell, P.S.J. Photonic-crystal fibers. J. Light. Technol. 2006, 24, 4729–4749. [Google Scholar] [CrossRef]
- Pinto, A.M.R.; López-Amo, M. Photonic Crystal Fibers for Sensing Applications. J. Sens. 2012, 2012, 598178. [Google Scholar] [CrossRef]
- Luan, F.; Knight, J.; Russell, P.; Campbell, S.; Xiao, D.; Reid, D.; Mangan, B.; Williams, D.; Roberts, P. Femtosecond soliton pulse delivery at 800 nm wavelength in hollow-core photonic bandgap fibers. Opt. Express 2004, 12, 835–840. [Google Scholar] [CrossRef] [PubMed]
- Cheo, P.L.; Liu, A.; King, G.G. A high-brightness laser beam from a phase-locked multicore Yb-doped fiber laser array. IEEE Photon. Technol. Lett. 2001, 13, 439–441. [Google Scholar] [CrossRef] [PubMed]
- Dudley, J.M.; Taylor, J.R. (Eds.) Supercontinuum Generation in Optical Fibers; Cambridge University Press: Cambridge, UK, 2010. [Google Scholar]
- Wadsworth, W.J.; Ortigosa-Blanch, A.; Knight, J.C.; Birks, T.A.; Martin, T.P.; Russell, P.S.J. Supercontinuum generation in photonic crystal fibers and optical fiber tapers: A novel light source. J. Opt. Soc. Am. B 2002, 19, 2148–2155. [Google Scholar] [CrossRef]
- Baselt, T.; Nelsen, B.; Lasagni, A.F.; Hartmann, P. Supercontinuum Generation in the Cladding Modes of an Endlessly Single-Mode Fiber. Appl. Sci. 2019, 9, 4428. [Google Scholar] [CrossRef]
- Joannopoulos, J.D.; Johnson, S.G.; Winn, J.N.; Meade, R.D. Photonic Crystals: Molding the Flow of Light, 2nd ed.; Princeton University Press: Princeton, NJ, USA, 2008. [Google Scholar]
- Taha, T.R.; Ablowitz, M.I. Analytical and numerical aspects of certain nonlinear equations: II Nonlinear Schrodinger Equation. J. Comput. Phys. 1984, 55, 203–230. [Google Scholar] [CrossRef]
- Yoshida, H. Construction of higher order symplectic integrators. Phys. Lett. A 1990, 150, 262–268. [Google Scholar] [CrossRef]
- Saleh, B.E.A.; Teich, M.C. Fundamentals of Photonics; Wiley Series in Pure and Applied Optics; John Wiley & Sons: New York, NY, USA, 2019. [Google Scholar]
- Huttunen, A.; Törmä, P. Effect of wavelength dependence of nonlinearity, gain, and dispersion in photonic crystal fiber amplifiers. Opt. Express 2005, 13, 4286–4295. [Google Scholar] [CrossRef][Green Version]
- Dashtban, Z.; Salehi, M.R.; Abiri, E. Supercontinuum generation in near- and mid-infrared spectral region using highly nonlinear silicon-core photonic crystal fiber for sensing applications. Photonics Nanostruct. Fundam. Appl. 2021, 46, 100942. [Google Scholar] [CrossRef]
- Jones, W.J.; Stoicheff, B.P. Inverse Raman Spectra: Induced Absorption at Optical Frequencies. Phys. Rev. Lett. 1964, 13, 657–659. [Google Scholar] [CrossRef]
- Dodge, M.J. Refractive Properties of Magnesium Fluoride. Appl. Opt. 1984, 23, 1980–1985. [Google Scholar] [CrossRef] [PubMed]
- Salzberg, C.D.; Villa, J.J. Infrared Refractive Indexes of Silicon, Germanium and Modified Selenium Glass. J. Opt. Soc. Am. 1957, 47, 244–246. [Google Scholar] [CrossRef]
- Agrawal, G.P. Nonlinear Fiber Optics, 6th ed.; Academic Press: San Diego, CA, USA, 2019. [Google Scholar]
- Díaz-Soriano, A.; Ortiz-Mora, A.; Dengra, A. Comparative study of numerical methods used in modeling photonic crystal fibers. Microw. Opt. Technol. Lett. 2013, 55, 1049–1053. [Google Scholar] [CrossRef]
- Lin, Q.; Agrawal, G.P. Raman response function for silica fibers. Opt. Lett. 2006, 31, 3086–3088. [Google Scholar] [CrossRef]
- Arteaga-Sierra, F.R.; Antikainen, A.; Agrawal, G.P. Soliton dynamics in photonic-crystal fibers with frequency-dependent Kerr nonlinearity. Phys. Rev. 2018, 98, 013830. [Google Scholar] [CrossRef]
- Tai, K.; Hasegawa, A.; Bekki, N. Fission of optical solitons induced by stimulated Raman effect. Opt. Lett. 1988, 13, 392–394. [Google Scholar] [CrossRef] [PubMed]
- Sharafali, A.; Nithyanandan, K. A theoretical study on the supercontinuum generation in a novel suspended liquid core photonic crystal fiber. Appl. Phys. B 2020, 126, 55. [Google Scholar] [CrossRef]
| Disclaimer/Publisher’s Note: The statements, opinions and data contained in all publications are solely those of the individual author(s) and contributor(s) and not of MDPI and/or the editor(s). MDPI and/or the editor(s) disclaim responsibility for any injury to people or property resulting from any ideas, methods, instructions or products referred to in the content. |
© 2024 by the authors. Licensee MDPI, Basel, Switzerland. This article is an open access article distributed under the terms and conditions of the Creative Commons Attribution (CC BY) license (https://creativecommons.org/licenses/by/4.0/).


