


Optimization of Median Modified Wiener Filter for Improving Lung Segmentation Performance in Low-Dose Computed Tomography Images

 , and
, and 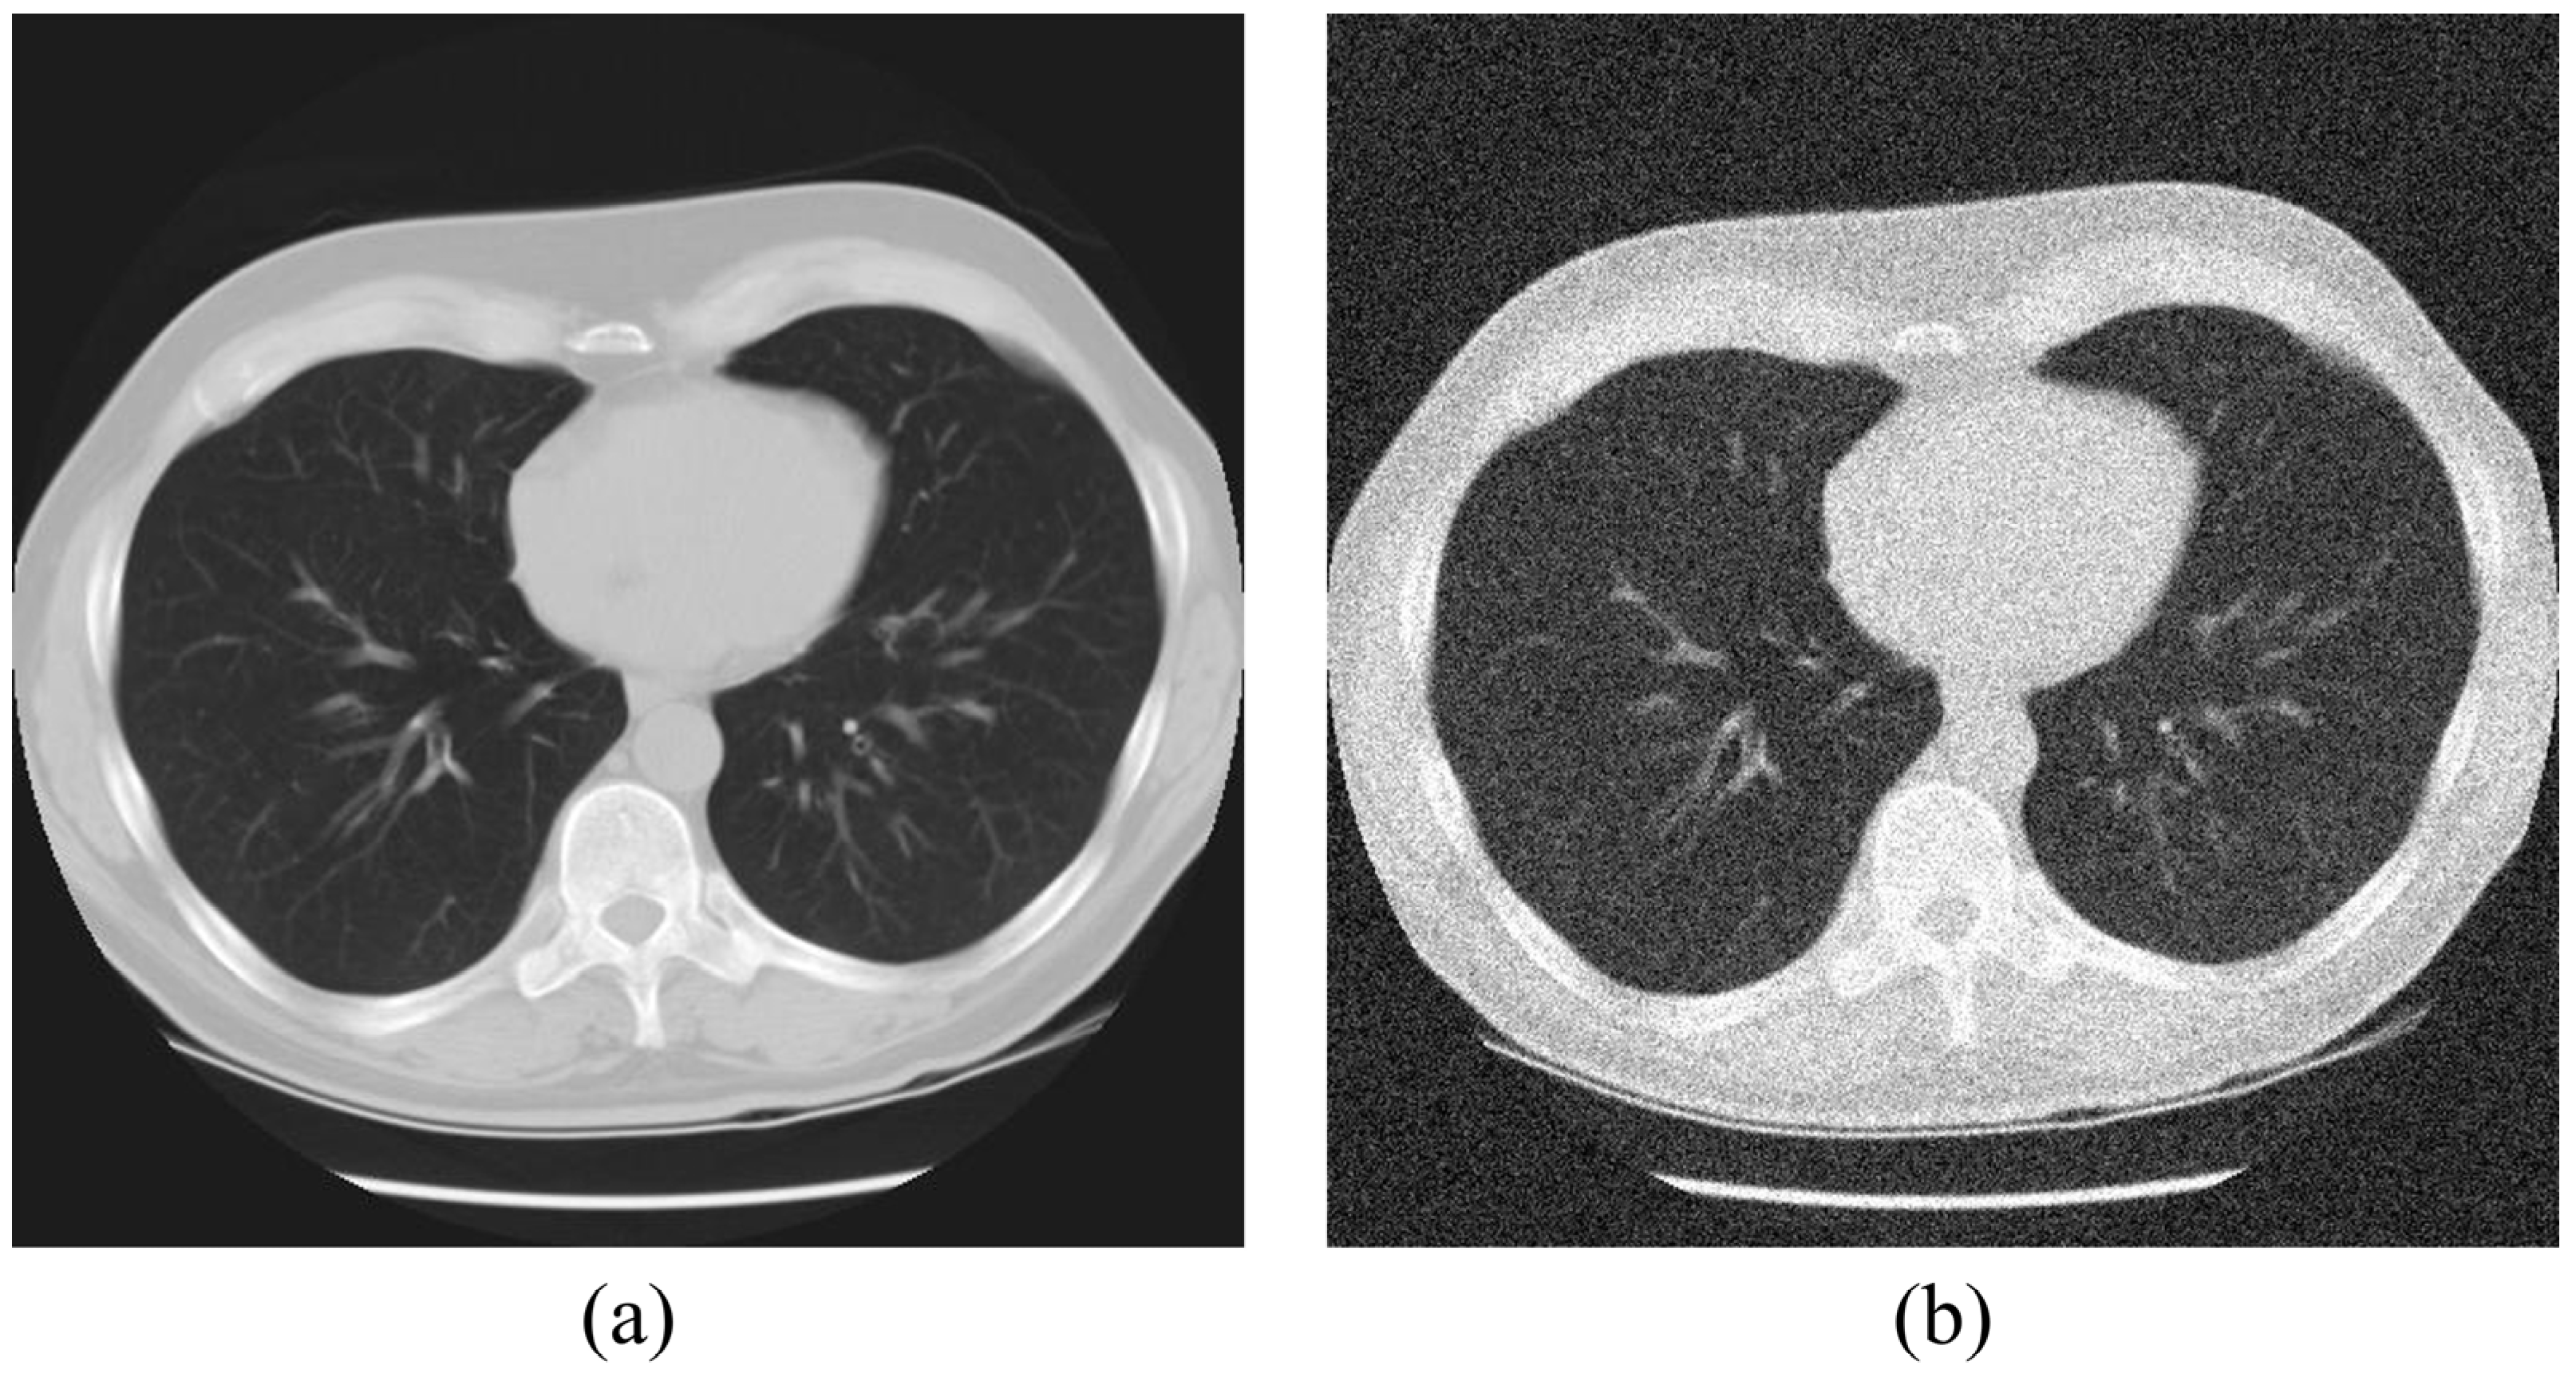
Abstract
:1. Introduction
2. Materials and Methods
2.1. The Acquisition of the Lung Computed Tomography Images
2.2. Median Modified Wiener Filter (MMWF) Modeling
2.3. Region-Growing-Based Segmentation Algorithm Modeling
2.4. Quantitative Evaluation of the Acquired Image
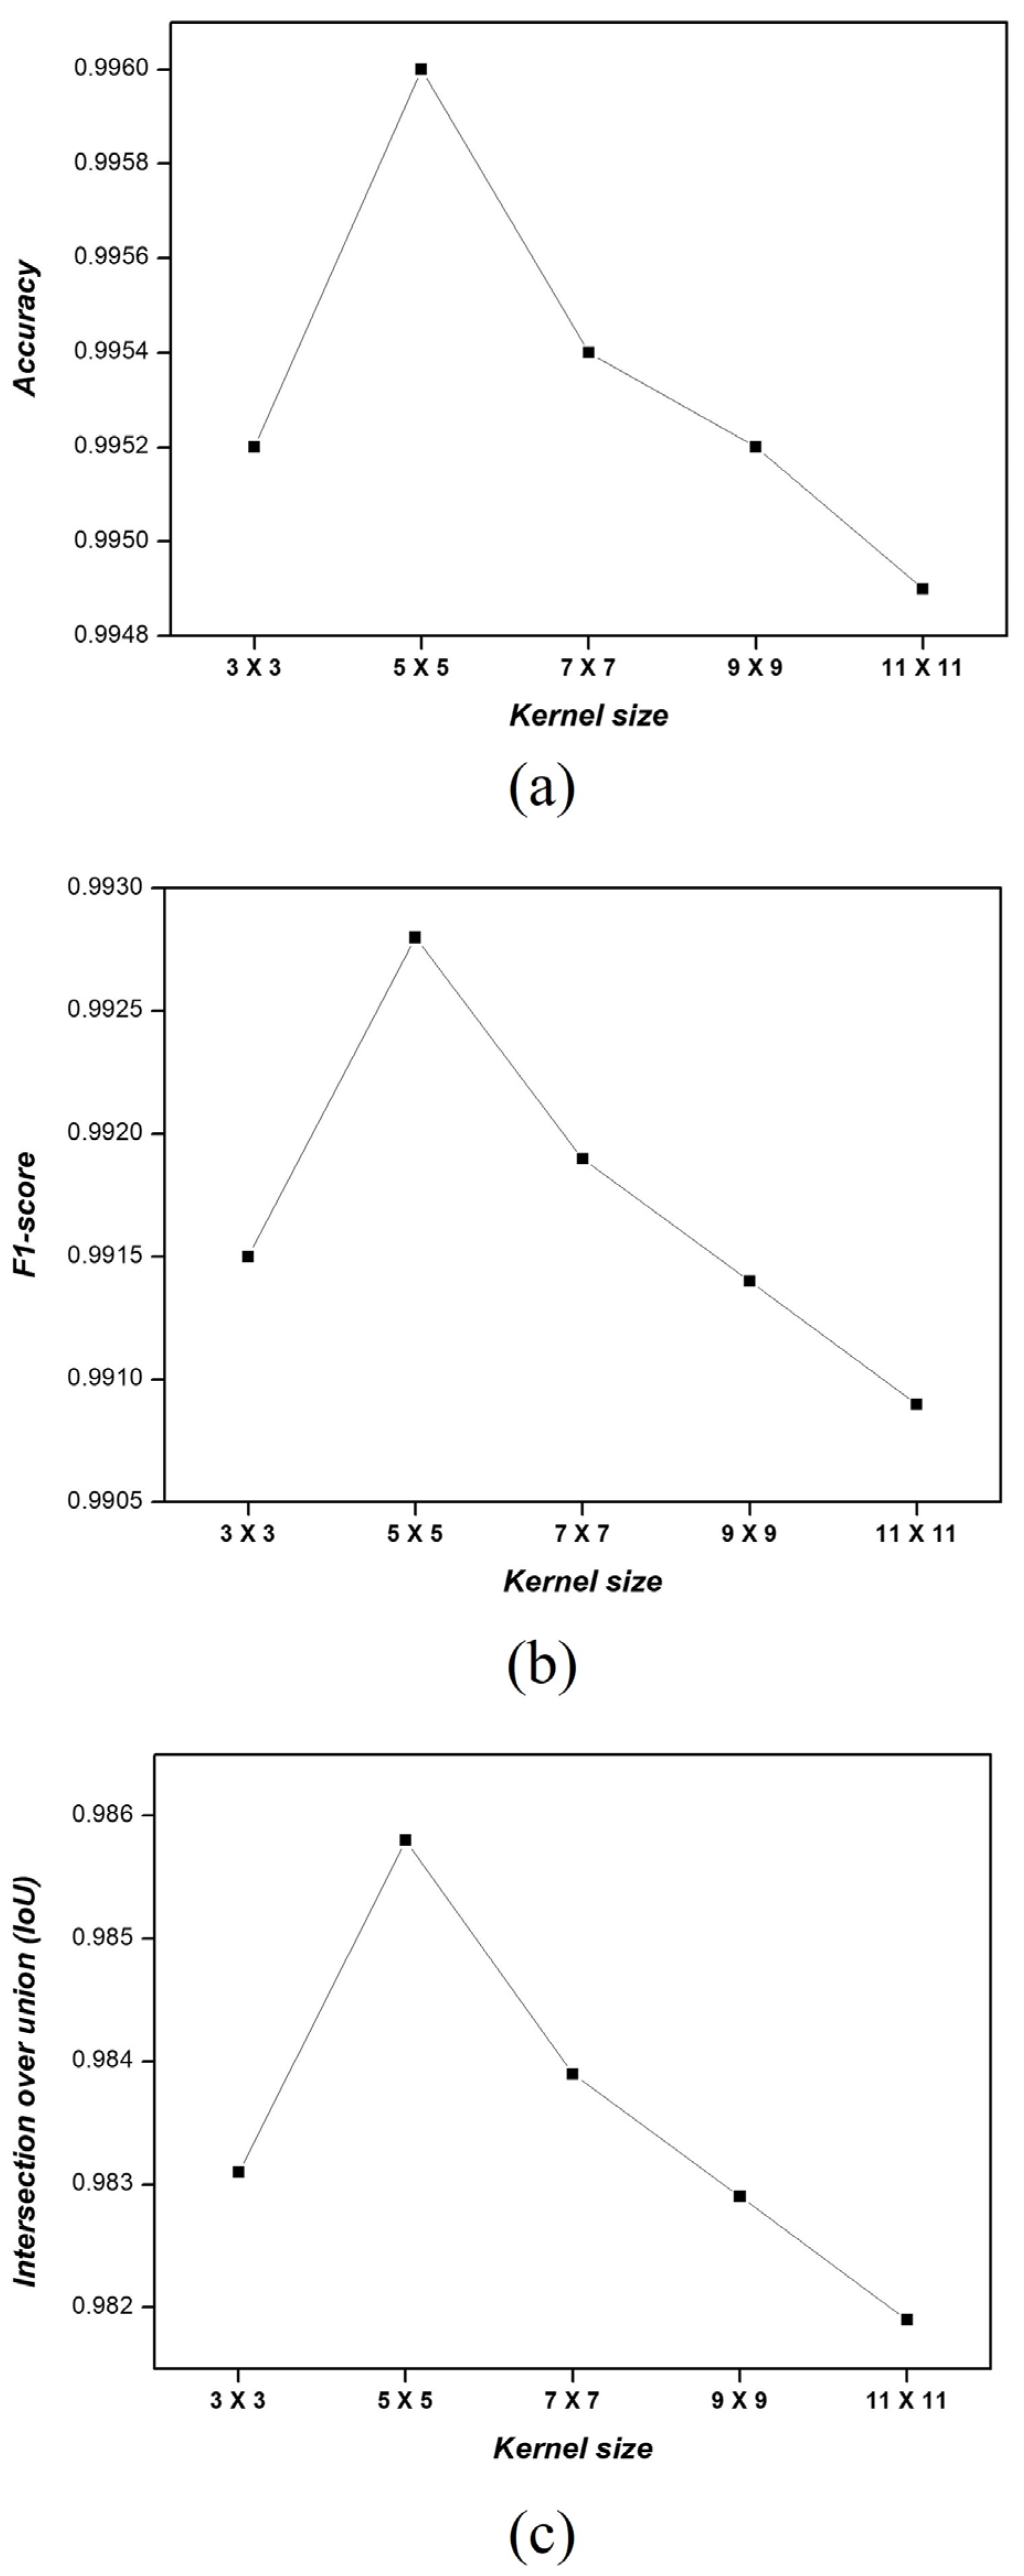
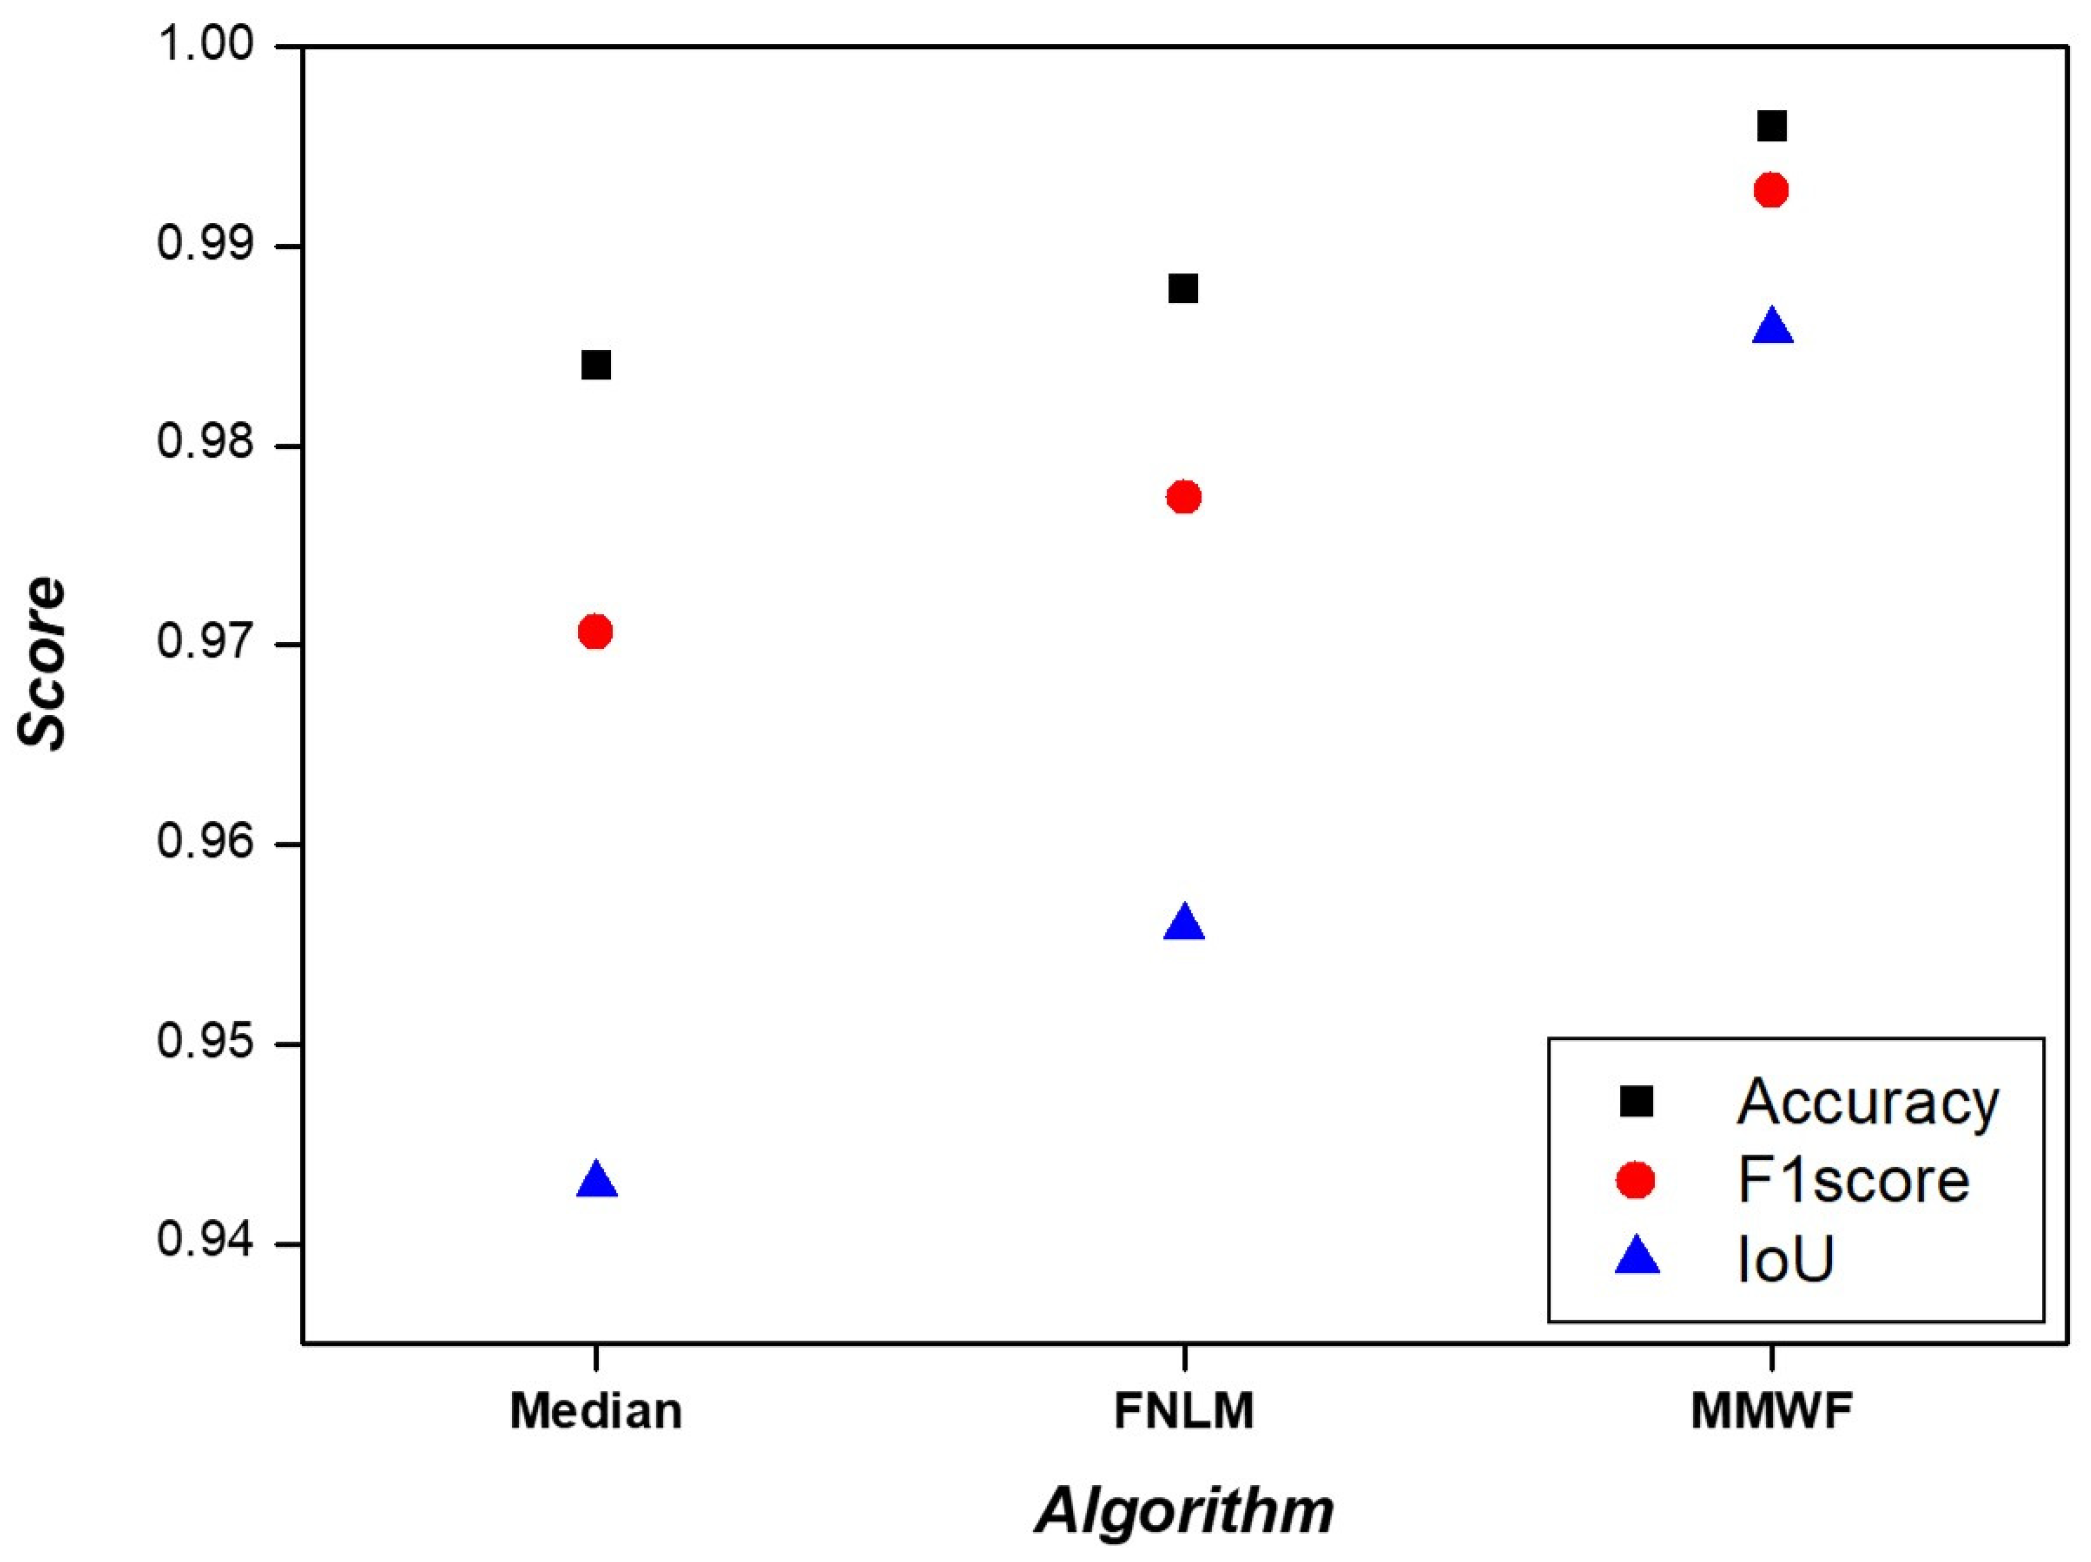
2.4.1. Segmentation Performance Evaluation
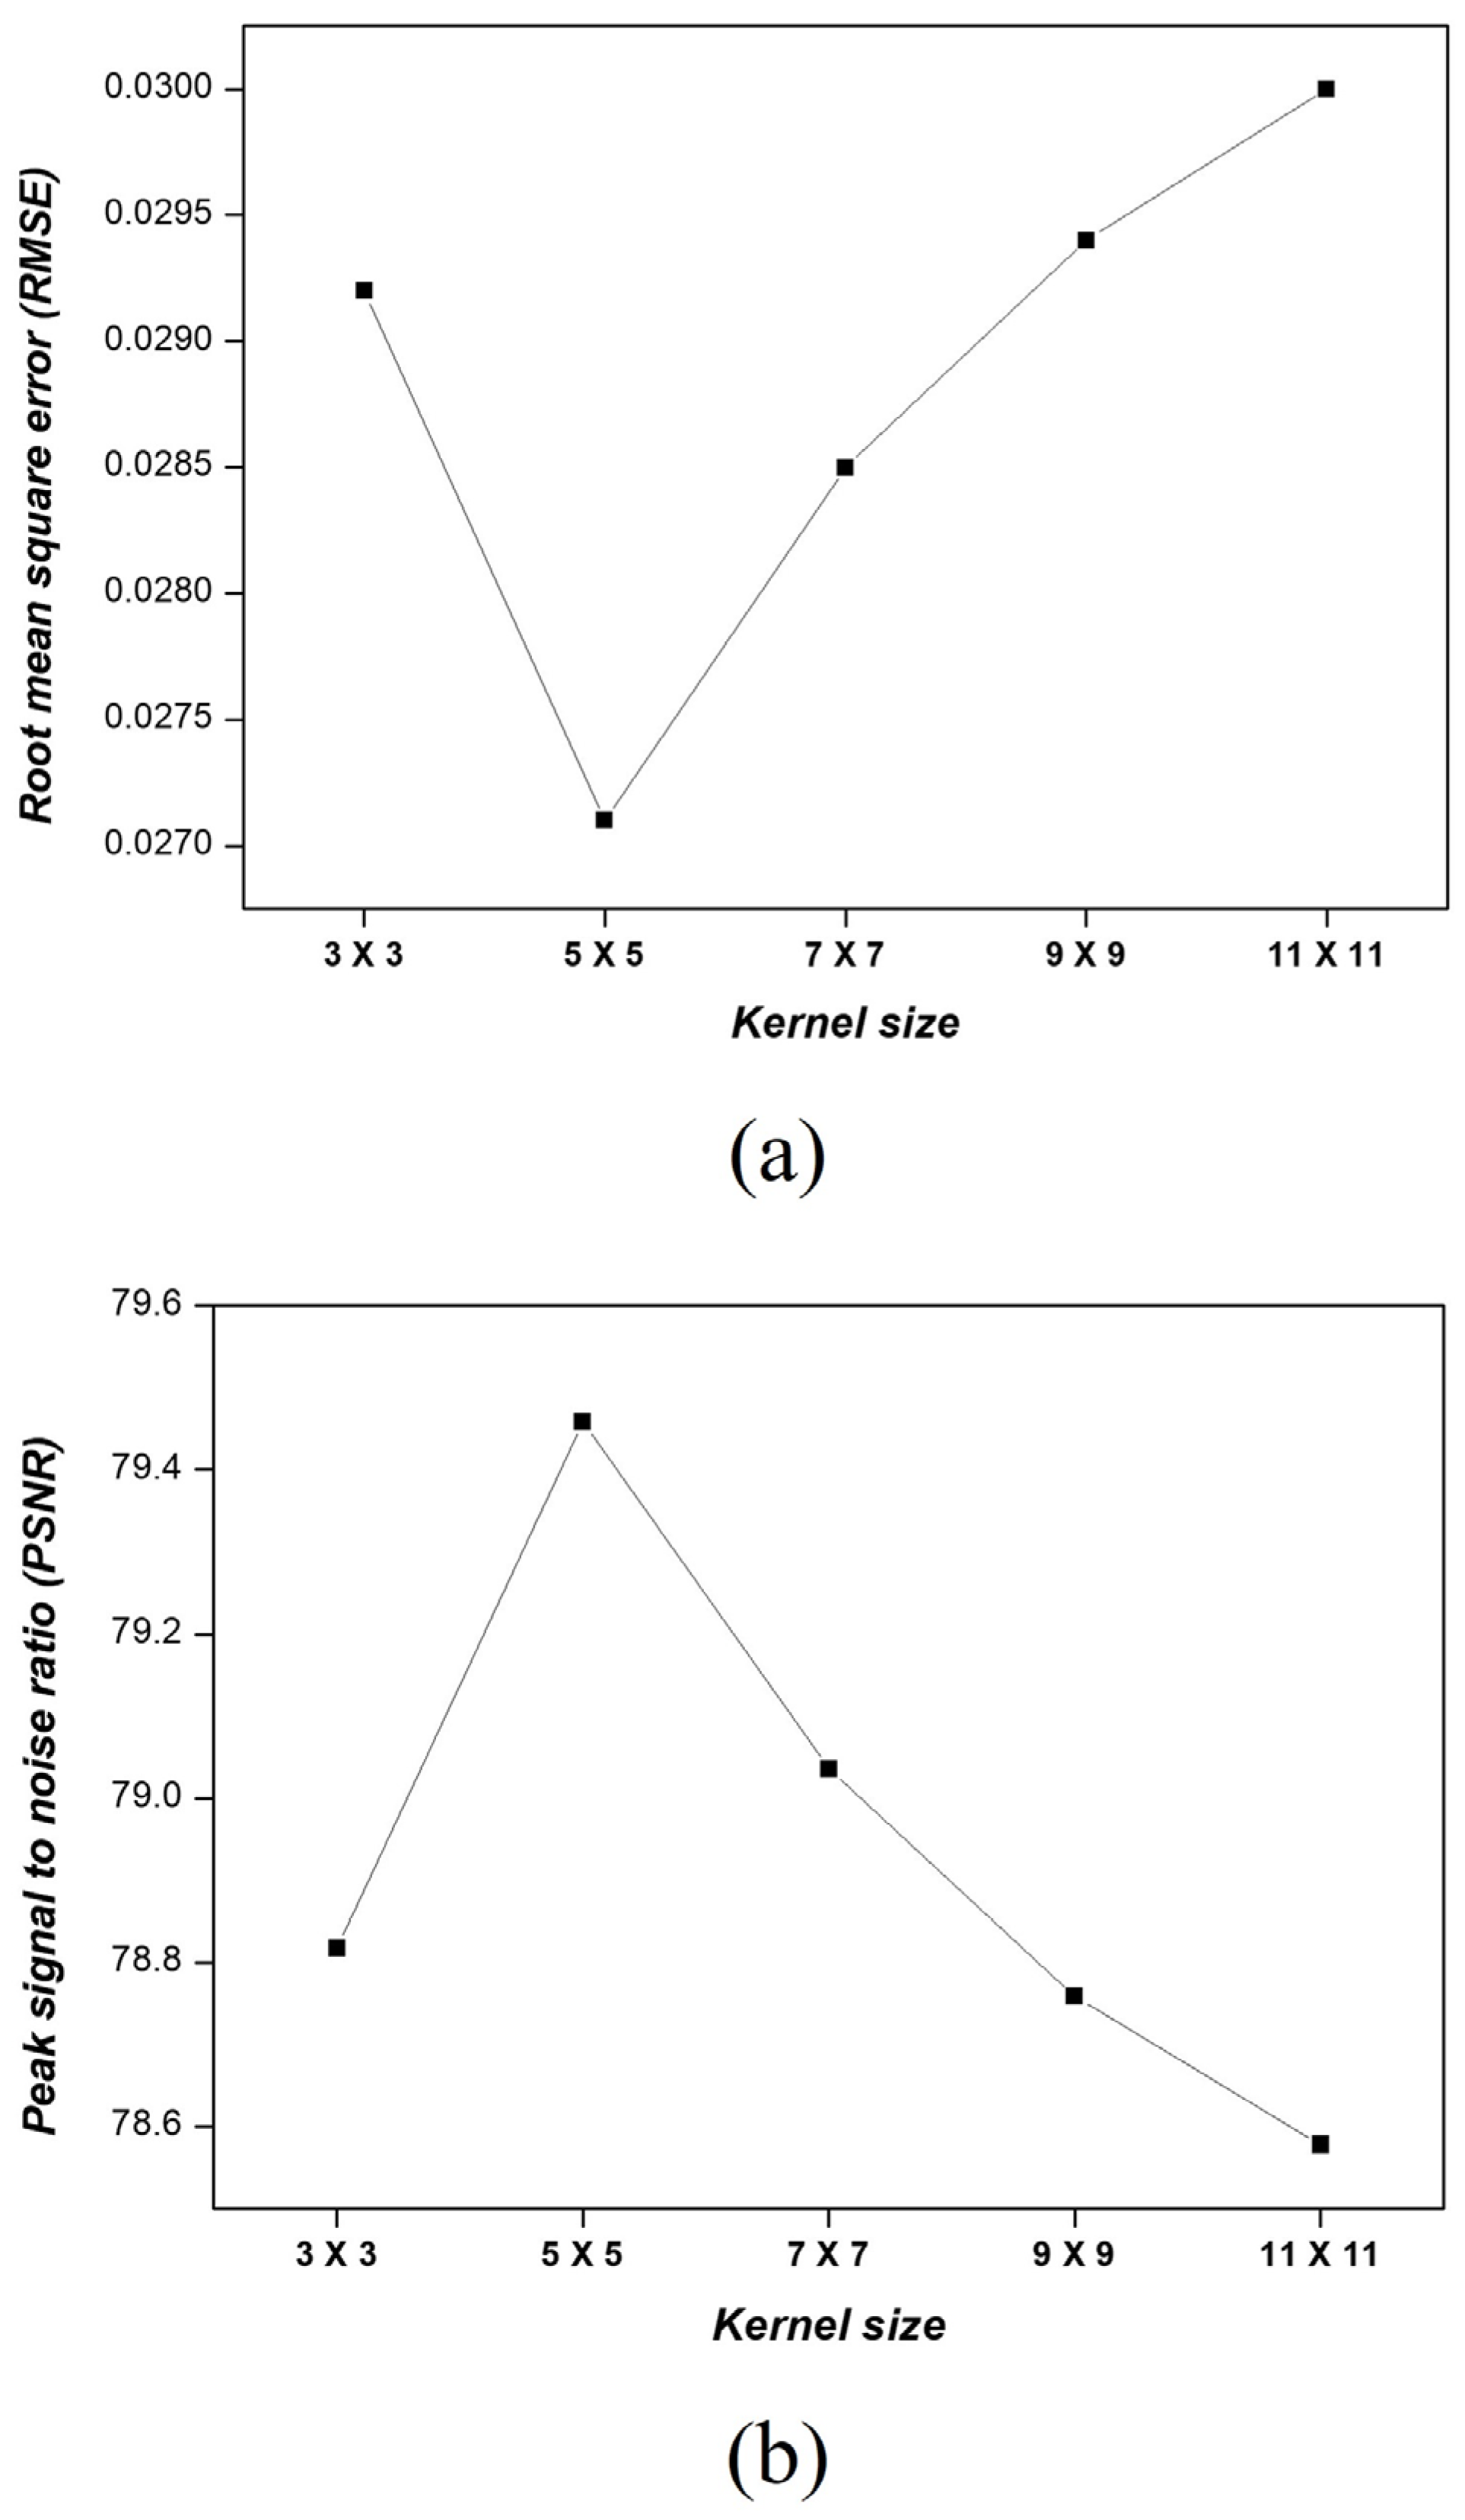
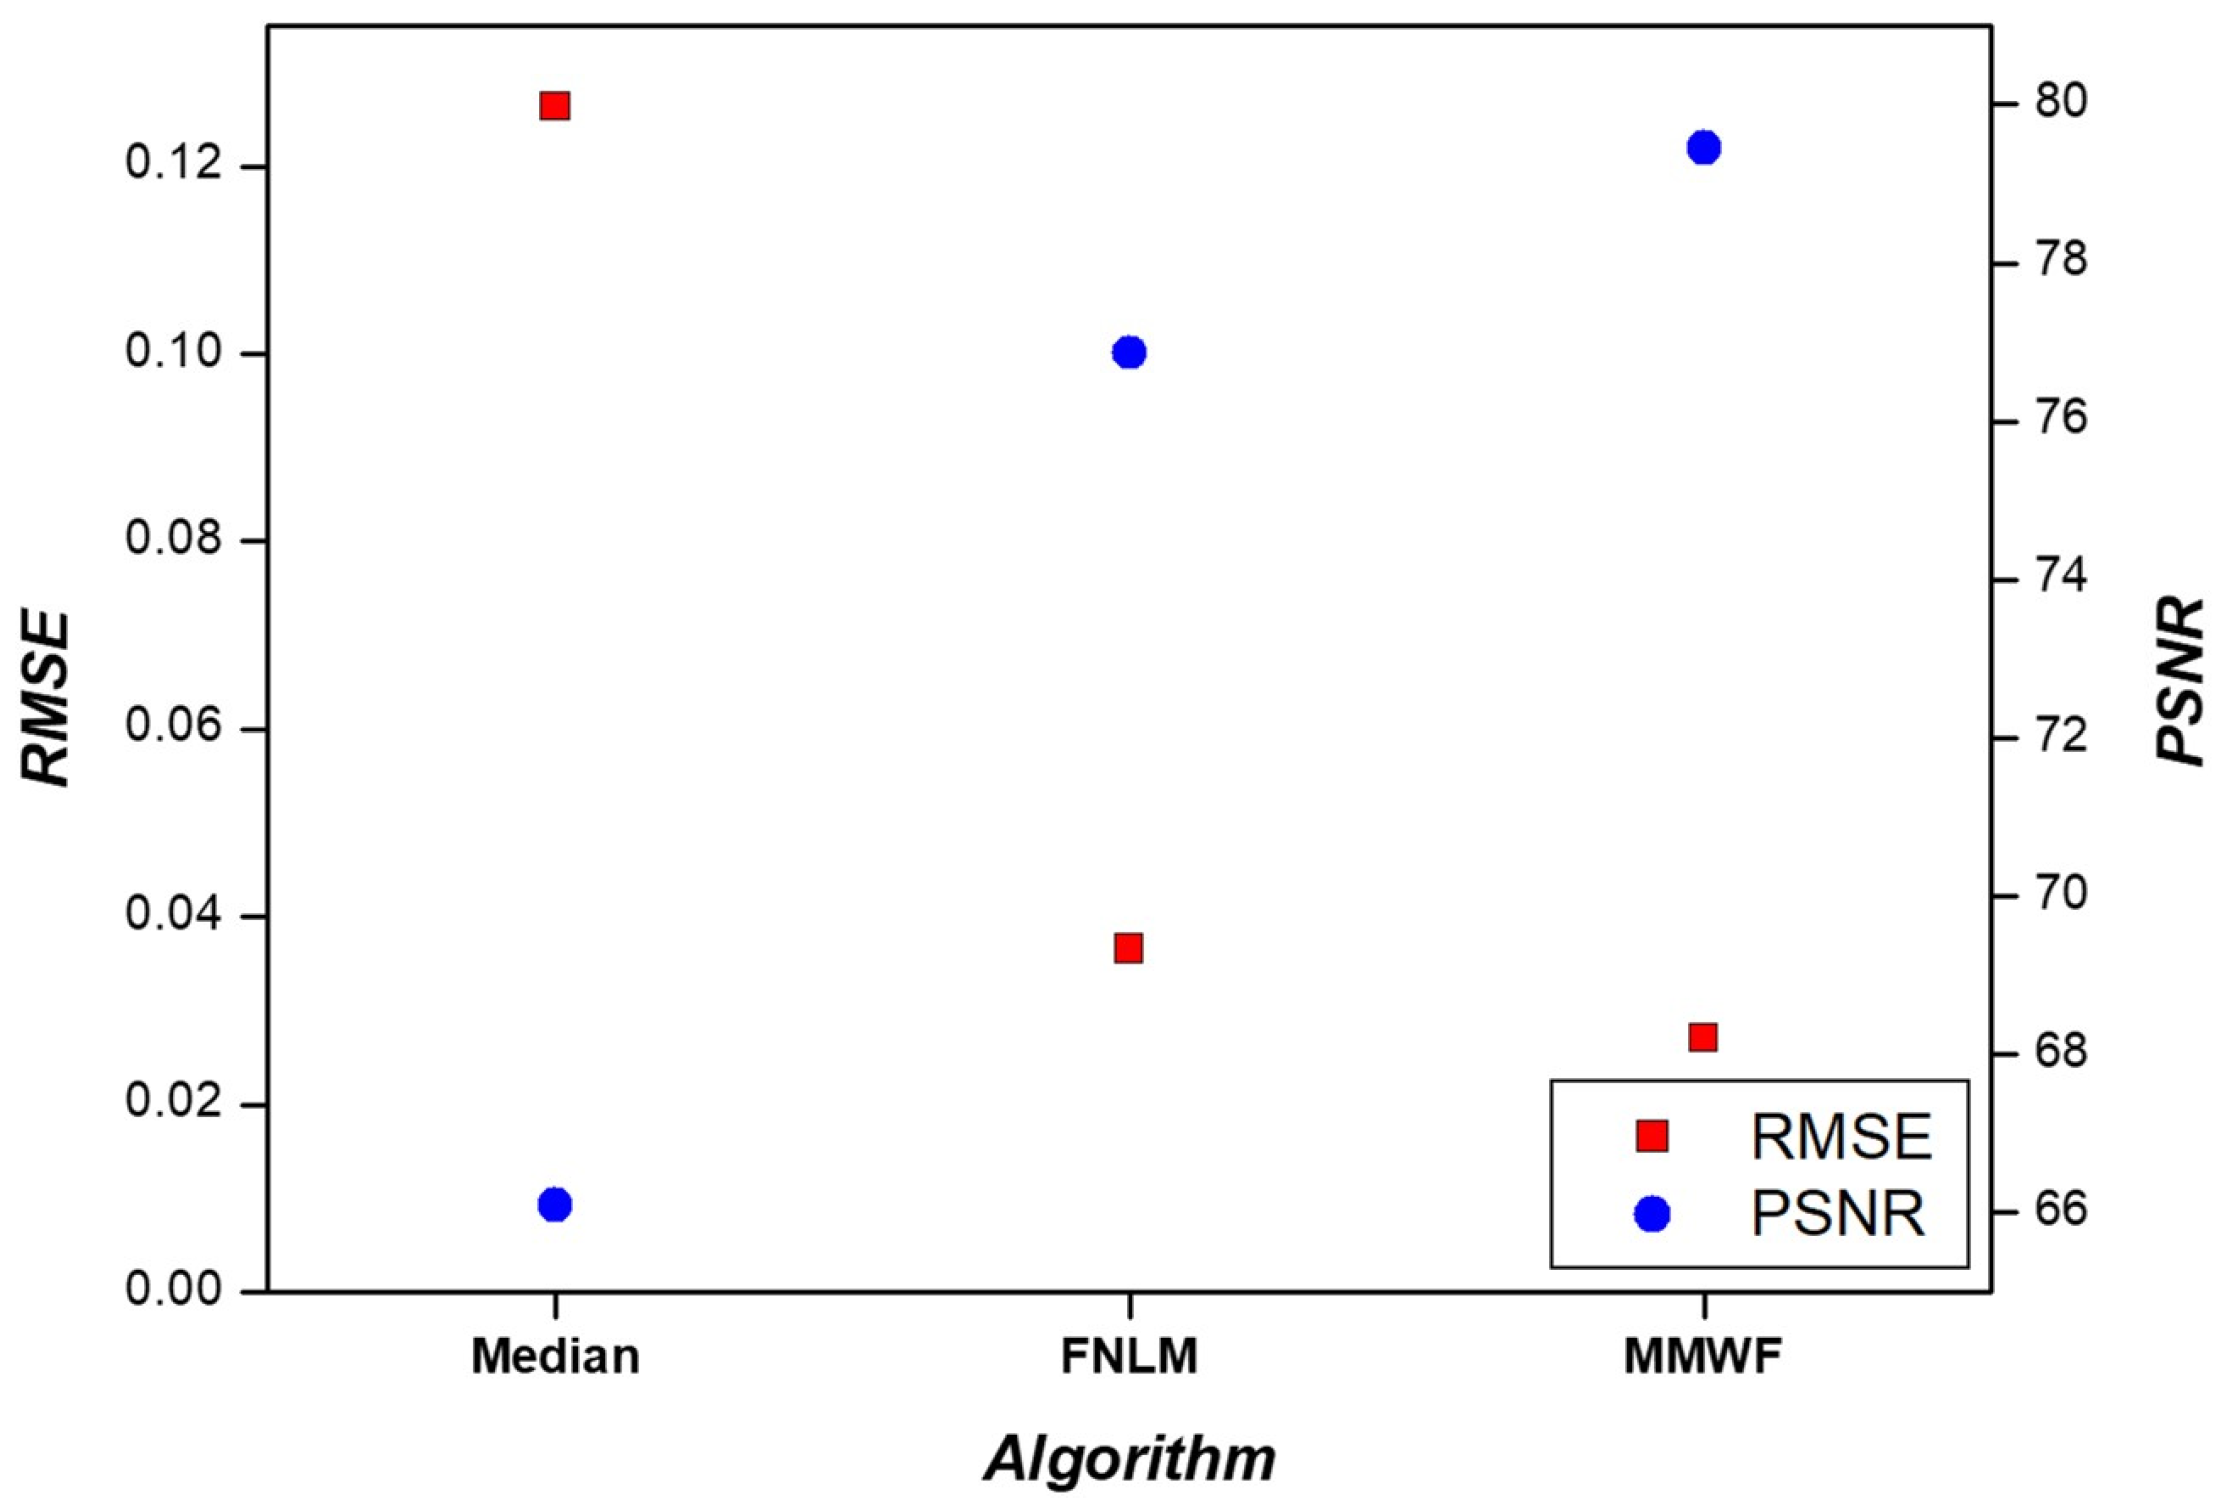
2.4.2. Similarity Evaluation
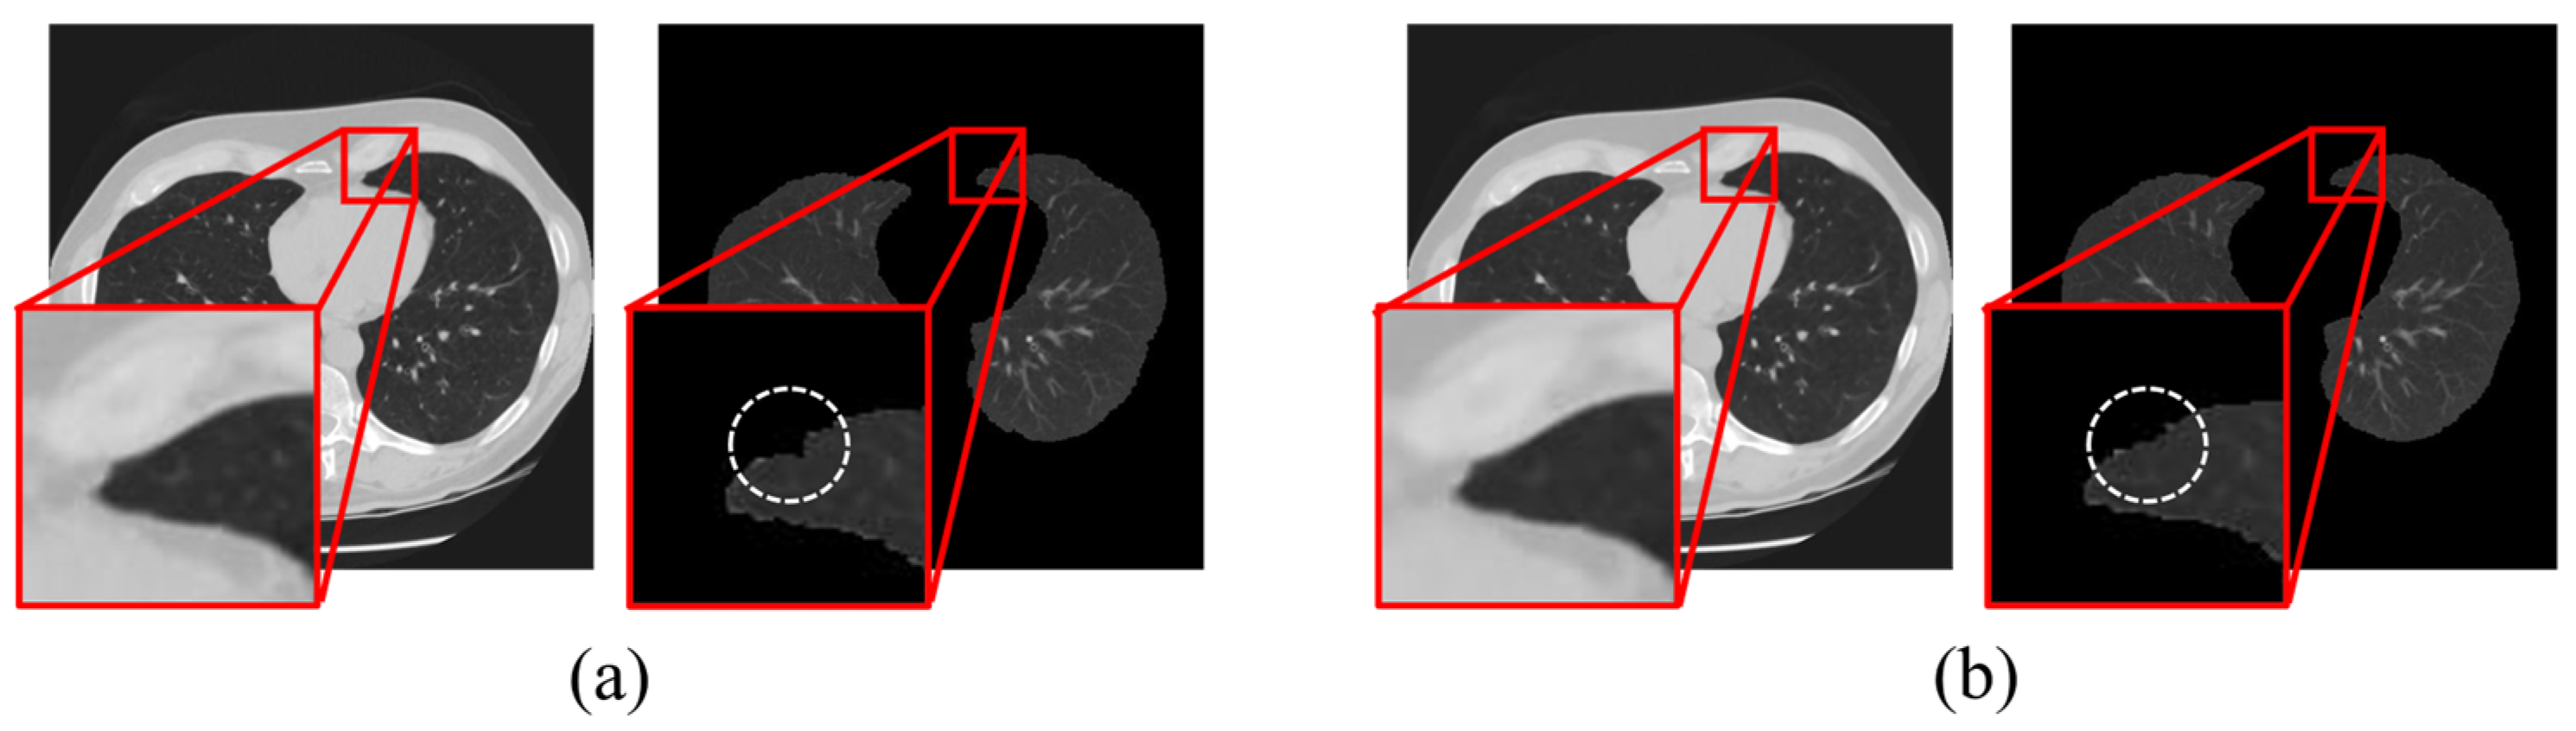
3. Results
4. Discussion
5. Conclusions
Author Contributions
Funding
Institutional Review Board Statement
Informed Consent Statement
Data Availability Statement
Conflicts of Interest
References
- Schillebeeckx, E.; Lamote, K. Lung cancer screening by volume computed tomography: Thriving to high performance. Breathe 2021, 17, 210063. [Google Scholar] [CrossRef] [PubMed]
- Bjerager, M.; Palshof, T.; Dahl, R.; Vedsted, P.; Olesen, F. Delay in diagnosis of lung cancer in general practice. Br. J. Gen. Pract. 2006, 56, 863–868. [Google Scholar] [PubMed]
- Vansteenkiste, J.; Dooms, C.; Mascaux, C.; Nackaerts, K. Screening and early detection of lung cancer. Ann. Oncol. 2012, 23, 320–327. [Google Scholar] [CrossRef] [PubMed]
- Malkawi, I.M.; Han, E.; Atalla, C.S.; Santucci, R.A.; O’Neil, B.; Wynberg, J.B. Low-Dose (10%) Computed Tomography May Be Inferior to Standard-Dose CT in the Evaluation of Acute Renal Colic in the Emergency Room Setting. J. Endourol. 2016, 30, 493–496. [Google Scholar] [CrossRef]
- Li, Z.; Yang, L.; Shu, L.; Yu, Z.; Huang, J.; Li, J.; Chen, L.; Hu, S.; Shu, T.; Yu, G. Research on CT Lung Segmentation Method Preschool Children based on Traditional Image Processing and ResUnet. Comput. Math. Methods Med. 2022, 2022, 7321330. [Google Scholar] [CrossRef]
- Hu, S.; Hoffman, E.A.; Reinhardt, J.M. Automatic lung segmentation for accurate quantitation of volumetric X-ray CT images. IEEE Trans. Med. Imaging 2001, 20, 490–498. [Google Scholar] [CrossRef]
- Qian, Y.; Guirong, W. Lung Nodule Segmentation Using EM Algorithm. Sixth Int. Conf. Intell. Hum. -Mach. Syst. Cybern. 2014, 1, 20–23. [Google Scholar] [CrossRef]
- Yang, X.; Xu, G.; Zhou, T. An effective approach for CT lung segmentation using region growing. J. Phys. 2021, 2082, 012001. [Google Scholar] [CrossRef]
- Yoo, S.J.; Yoon, S.H.; Lee, J.H.; Kim, K.H.; Choi, H.I.; Park, S.J.; Goo, J.M. Automated Lung Segmentation on Chest Computed Tomography Images with Extensive Lung Parenchymal Abnormalities Using a Deep Neural Network. Korean J. Radiol. 2021, 22, 476–488. [Google Scholar] [CrossRef]
- Diwakar, J.; Kumar, M. A review on CT image noise and its denoising. Biomed. Signal Process. Control. 2018, 42, 73–88. [Google Scholar] [CrossRef]
- Chalfoun, J.; Majurski, M.; Dima, A.; Stuelten, C.; Peskin, A.; Brady, M. FogBank: A single cell segmentation across multiple cell lines and image modalities. BMC Bioinform. 2014, 15, 431. [Google Scholar] [CrossRef]
- Selamin, A.M.A.; Fadhil, A.F. A study of the effects of Gaussian noise on image features. Kirkuk Univ. J.-Sci. Stud. 2016, 11, 152–169. [Google Scholar] [CrossRef]
- Jia, Y.; Rong, C.; Wu, C.; Yang, Y. Research on the decomposition and fusion method for the infrared and visible images based on the guided image filtering and Gaussian filter. In Proceedings of the 2017 3rd IEEE International Conference on Computer and Communications (ICCC), Chengdu, China, 13–16 December 2017; pp. 1797–1802. [Google Scholar]
- Cannistraci, C.V.; Montevecchi, F.M.; Alessio, M. Median-modified Wiener filter provides efficient denoising, preserving spot edge and morphology in 2-DE image processing. Proteomics 2009, 9, 4908–4919. [Google Scholar] [CrossRef] [PubMed]
- Cannistraci, C.V.; Abbas, A.; Gao, X. Median Modified Wiener Filter for nonlinear adaptive spatial denoising of protein NMR multidimensional spectra. Sci. Rep. 2015, 5, srep08017. [Google Scholar] [CrossRef] [PubMed]
- Ju, S.; Kang, S.; Lee, Y. Optimization of mask size for median-modified Wiener filter according to matrix size of computed tomography images. Nucl. Instrum. Methods Phys. Res. Sect. A Accel. Spectrometers Detect. Assoc. Equip. 2021, 1010, 165508. [Google Scholar] [CrossRef]
- Talebi, M.; Abbasi-Rad, S.; Malekzadeh, M.; Shahgholi, M.; Ardakani, A.A.; Foudeh, K.; Rad, H.S. Cortical Bone Mechanical Assessment via Free Water Relaxometry at 3 T. J. Magn. Reson. Imaging 2021, 54, 1744–1751. [Google Scholar] [CrossRef]
- Jain, A.; Bhateja, V. A versatile denoising method for images contaminated with Gaussian noise. In Proceedings of the CUBE International Information Technology Conference, Pune, India, 3–5 September 2012. [Google Scholar] [CrossRef]
- Dumakude, A.; Ezugwu, A.E. Automated COVID-19 detection with convolutional neural networks. Sci. Rep. 2023, 13, 10607. [Google Scholar] [CrossRef]
- Li, S.; Liu, J.; Zhou, Z.; Wu, X.; Li, Y.; Wang, S.; Liao, W.; Ying, S.; Zhao, Z. Artificial intelligence for caries and periapical periodontitis detection. J. Densitry 2022, 122, 104107. [Google Scholar] [CrossRef]
- Yu, Y.; Jiang, H.; Zhang, X.; Chen, Y. Identifying Irregular Potatoes Using Hausdorff Distance and Intersection over Union. Sensors 2022, 22, 5740. [Google Scholar] [CrossRef]
- Kang, S.H.; Kim, M.K.; Lee, Y.J. The study on reuction for near field clutter (NFC) artifact based on wavelet thresholding method in ultrasound image using Field Ⅱ program. Optik 2018, 162, 220–227. [Google Scholar] [CrossRef]
- Dehmeshki, J.; Amin, H.; Valdovieso, M.; Ye, X. Segmentation of pulmonary nodules in thoracic CT scans: A region growing approach. IEEE Trans. Med. Imaging 2008, 27, 467–480. [Google Scholar] [CrossRef]
- Osadebey, M.; Andersen, H.K.; Waaler, D.; Fossaa, K.; Martinsen, A.C.T.; Pedersen, M. Three-stage segmentation of lung region from CT images using deep neural networks. BMC Med. Imaging 2021, 21, 112. [Google Scholar] [CrossRef] [PubMed]
- Nesbitt, J.C.; Putnam, J.B.; Walsh, G.L.; Roth, J.A.; Mountrain, C.F. Survival in early-stage non-small cell lung cancer. Ann. Thorac. Surg. 1995, 60, 466–472. [Google Scholar] [CrossRef] [PubMed]
- Humphrey, L.L.; Teutsch, S.; Johnson, M. Lung Cancer Screening with Sputum Cytologic Examination, Chest Radiography, and Computed Tomography: An Update for the U.S. Preventive Services Task Force. Ann. Intern. Med. 2004, 140, 740–753. [Google Scholar] [CrossRef] [PubMed]
- Shariaty, F.; Hosseinlou, S.; Rud, V.Y. Automatic lung segmentation method in computed tomography scans. J. Phys. Conf. Ser. 2019, 1236, 012028. [Google Scholar] [CrossRef]
- Buades, A.; Coll, B.; Morel, J.M. A non-local algorithm for image denoising. In Proceedings of the IEEE Computer Society Conference on Computer Vision and Pattern Recognition, San Diego, CA, USA, 20–25 June 2005; Volume 2, pp. 60–65. [Google Scholar] [CrossRef]
- Gul, S.; Khan, M.S.; Bibi, A.; Khandakar, A.; Ayari, M.A.; Chowdhury, M.E.H. Deep learning techniques for liver and liver tumor segmentation: A review. Comput. Biol. Med. 2022, 147, 105620. [Google Scholar] [CrossRef]
- Malek, A.; Rahman, W.E.Z.W.A.; Yasiran, S.S.; Jumaat, A.K.; Jalil, U.M.A. Seed point selection for seed-based region growing in segmenting microcalcifications. In Proceedings of the 2012 International Conference on Statistics in Science, Business and Engineering (ICSSBE), Langkawi, Malaysia, 10–12 September 2012. [Google Scholar] [CrossRef]
- Li, J.; Lin, X.; Che, H.; Li, H.; Qian, X. Pancreas segmentation with probabilistic map guided bi-directional recurrent UNet. Phys. Med. Biol. 2021, 66, 115010. [Google Scholar] [CrossRef]
- Abbasi-Rad, S.; Akbari, A.; Malekzadeh, M.; Shahgholi, M.; Arabalibeik, H.; Rad, H.S. Quantifying cortical bone free water using short echo time (STE-MRI) at 1.5 T. Magn. Reson. Imaging 2020, 71, 17–24. [Google Scholar] [CrossRef]
- Mittal, A.; Soundararajan, R.; Bovik, A.C. Making a “Completely Blind” Image Quality Analyzer. IEEE Signal Process. Lett. 2013, 20, 209–212. [Google Scholar] [CrossRef]
- Mittal, A.; Moorthy, A.K.; Bovik, A.C. No-Reference Image Quality Assessment in the Spatial Domain. IEEE Trans. Image Process. 2012, 21, 4695–4708. [Google Scholar] [CrossRef]
- Lee, M.-H.; Yun, C.-S.; Kim, K.; Lee, Y. Image restoration algorithm incorporating methods to remove noise and blurring from positron emission tomography imaging for Alzheimer’s disease diagnosis. Phys. Medica 2022, 103, 181–189. [Google Scholar] [CrossRef] [PubMed]


Disclaimer/Publisher’s Note: The statements, opinions and data contained in all publications are solely those of the individual author(s) and contributor(s) and not of MDPI and/or the editor(s). MDPI and/or the editor(s) disclaim responsibility for any injury to people or property resulting from any ideas, methods, instructions or products referred to in the content. |
© 2023 by the authors. Licensee MDPI, Basel, Switzerland. This article is an open access article distributed under the terms and conditions of the Creative Commons Attribution (CC BY) license (https://creativecommons.org/licenses/by/4.0/).
Share and Cite
Lim, S.; Park, M.; Kim, H.; Kang, S.-H.; Kim, K.; Lee, Y. Optimization of Median Modified Wiener Filter for Improving Lung Segmentation Performance in Low-Dose Computed Tomography Images. Appl. Sci. 2023, 13, 10679. https://doi.org/10.3390/app131910679
Lim S, Park M, Kim H, Kang S-H, Kim K, Lee Y. Optimization of Median Modified Wiener Filter for Improving Lung Segmentation Performance in Low-Dose Computed Tomography Images. Applied Sciences. 2023; 13(19):10679. https://doi.org/10.3390/app131910679
Chicago/Turabian StyleLim, Sewon, Minji Park, Hajin Kim, Seong-Hyeon Kang, Kyuseok Kim, and Youngjin Lee. 2023. "Optimization of Median Modified Wiener Filter for Improving Lung Segmentation Performance in Low-Dose Computed Tomography Images" Applied Sciences 13, no. 19: 10679. https://doi.org/10.3390/app131910679
APA StyleLim, S., Park, M., Kim, H., Kang, S.-H., Kim, K., & Lee, Y. (2023). Optimization of Median Modified Wiener Filter for Improving Lung Segmentation Performance in Low-Dose Computed Tomography Images. Applied Sciences, 13(19), 10679. https://doi.org/10.3390/app131910679