
Optimal Insertion Torque for Orthodontic Anchoring Screw Placement: A Comprehensive Review


Abstract
:1. Introduction
2. Methods
2.1. Search Strategy
2.2. Eligibility Criteria
- Original articles except for review articles, and case reports, unpublished articles.
- Original articles in which OASs were placed in humans for orthodontic treatment.
- Original articles that reported success rates for OAS placement.
- Original articles that reported IT data for OAS placement.
3. Results
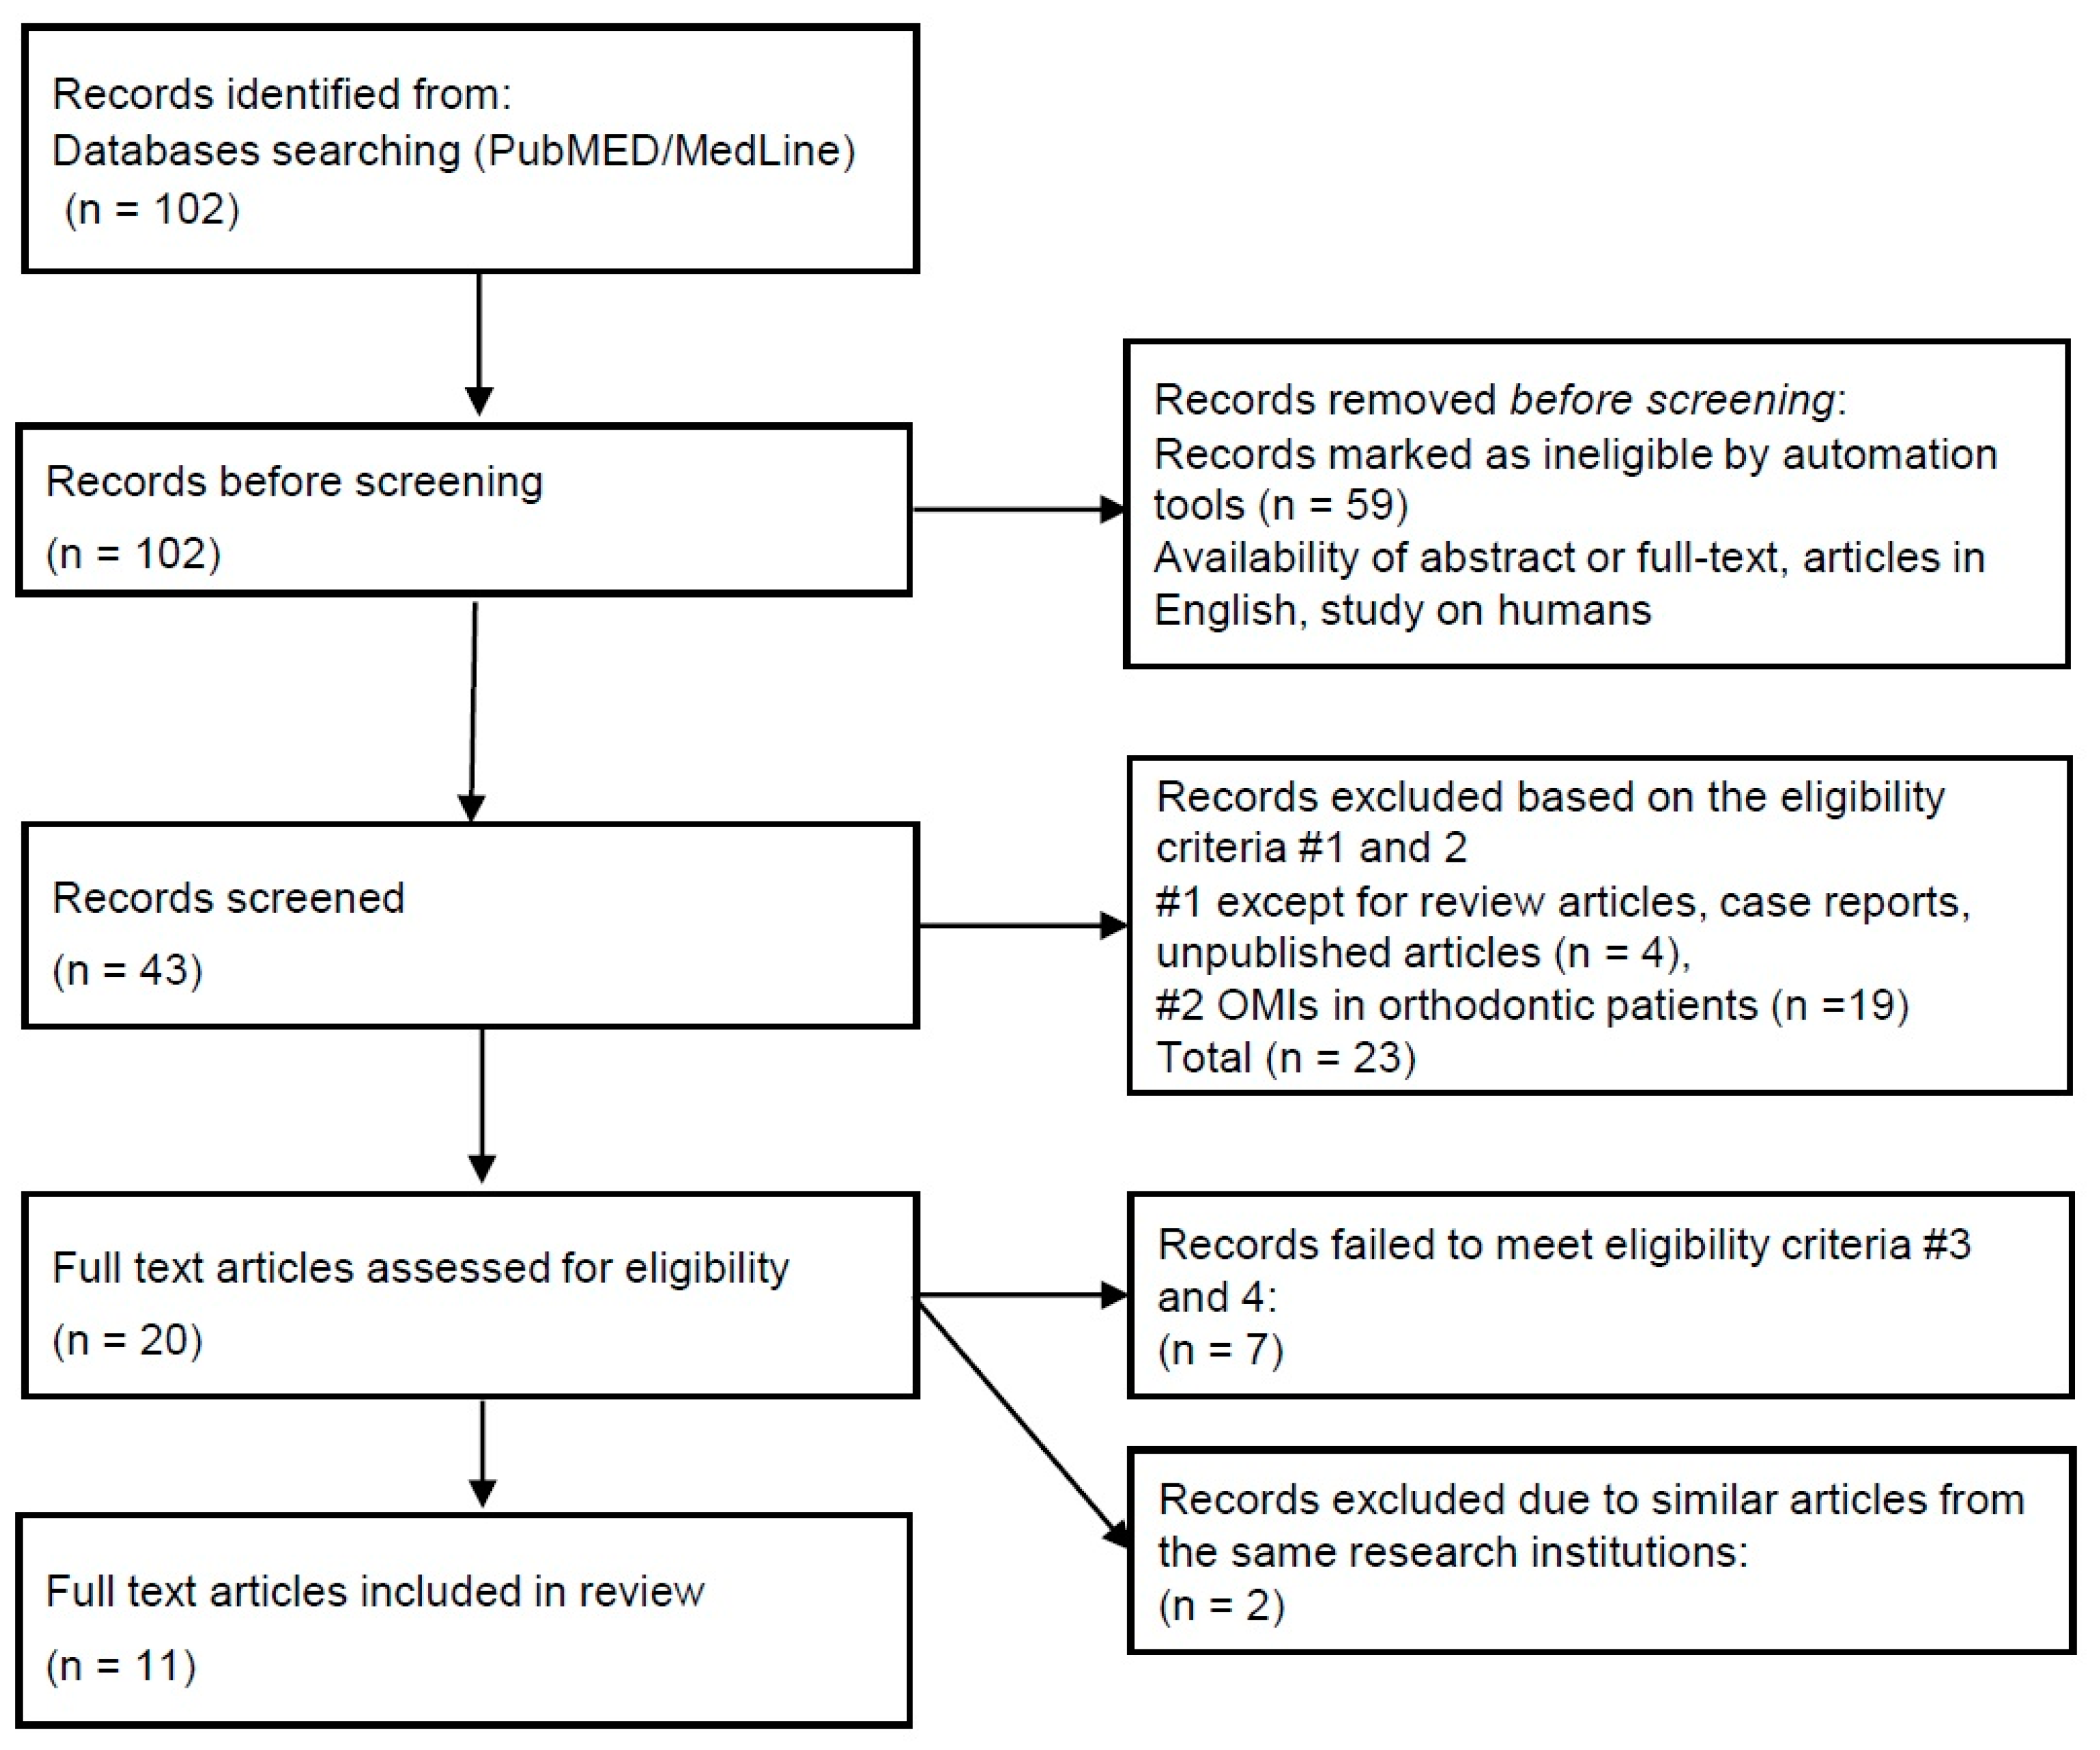
3.1. Selection
3.2. Overview of the Selected Studies (Table 1)

| Authors | Patients (n) | Mean Age (y) | Screws (n) | Placement Location | Methods | Loading | Definition of Success (or Failure) | Notes |
|---|---|---|---|---|---|---|---|---|
| Watanabe et al., 2017 [1] | 60 | 25.4 ± 10.5 | 120 | Maxillary buccal and lingual alveolar area | Self-Drilling | Loaded 3 months after placement | dislodgement of a screw during active treatment (failure) | female subjects only |
| Geshay et al., 2021 [6] | 26 | 27.4 | 82 | Maxillary buccal alveolar area | Self-Drilling | Immediate | if screws exhibited any degree of mobility (failure) | Comparison between anterior and posterior area using OASs of 3 mm in length |
| Motoyoshi et al., 2007 [7] | 30 | 15.9 ± 1.9 | 83 (adolescent) | Maxillary and Mandibular buccal alveolar area | Self-Tapping | Loaded from 2 to 4 weeks after placement (early-load) | if screw endured orthodontic force for 6 months or more without mobility | Comparison between adolescent and adult subjects |
| Loaded from 3 months or more after placement (late-load) | ||||||||
| 27 | 26.2 ± 5.6 | 86(adult) | Loaded from 2 to 4 weeks after placement (early-load) | |||||
| Uchida et al., 2021 [8] | 83 | 26.8 ± 9.8 | 161 | Mid-palatal suture area | Self-Tapping | Immediate | if screw endured the orthodontic force for 6 months or more | Comparison between φ1.2 mm and 1.5 mm in pre-drilling diameter |
| Lee et al., 2021 [9] | 142 | 20.7 ± 7.5 | 280 | Maxillary and Mandibular buccal alveolar area | Self-Drilling | 3 weeks after placement | if screw endured the orthodontic force for 6 months or more | Comparison among Cylindrical screws with and without dual thread |
| Sreenivasagan et.al., 2021 [10] | 31 | 27 ± 9 | 59 | Maxillary and Mandibular buccal alveolar area, Infrazygomatic crest and Buccal shelf | Self-Drilling | Immediate | unknown | - |
| Moghaddam et al., 2021 [11] | 31 | 18.5 | 62 | Maxillary buccal alveolar area | Self-Drilling | 6 weeks after insertion | useful up to the end of the treatment | Comparison according to surface characteristics |
| Di Leonardo et al., 2018 [12] | 40 | 17.3 (female) 15.7 male) | 80 | paramedian suture area | Self-Drilling | within one week after placement | unknown | Comparison according to force system |
| Yoo et al., 2014 [13] | 132 | 25.3 ± 8.0 | 227 | Maxillary and Mandibular buccal alveolar area | Self-Drilling | unknown | if screw endured the orthodontic force for 6 months or more | Comparison according to screw design |
| Son et al., 2014 [14] | 70 | 23.2 ± 7.7 | 70 | Maxillary buccal alveolar area | Self-Tapping | Immediate | when screw endured an orthodontic force applied for 6 months or more without clinical mobility | Comparison according to placement methods |
| 22.3 ± 7.4 | 70 | Self-Drilling | ||||||
| Suzuki and Suzuki 2011 [15] | 95 | 25.6 ± 6.7 | 120 | Maxillary and Mandibular buccal alveolar area, and Mid-palatal suture area | Self-Tapping | Healing period of at least two weeks | unknown | Comparison according to placement methods |
| 160 | Self-Drilling |
4. Discussion
4.1. Placement Methods (Self-Drilling or Self-Tapping)
4.2. Shapes and Dimensions of OASs
4.2.1. Tapered and Cylindrical OASs
4.2.2. OAS Dimensions
4.3. Placement Location
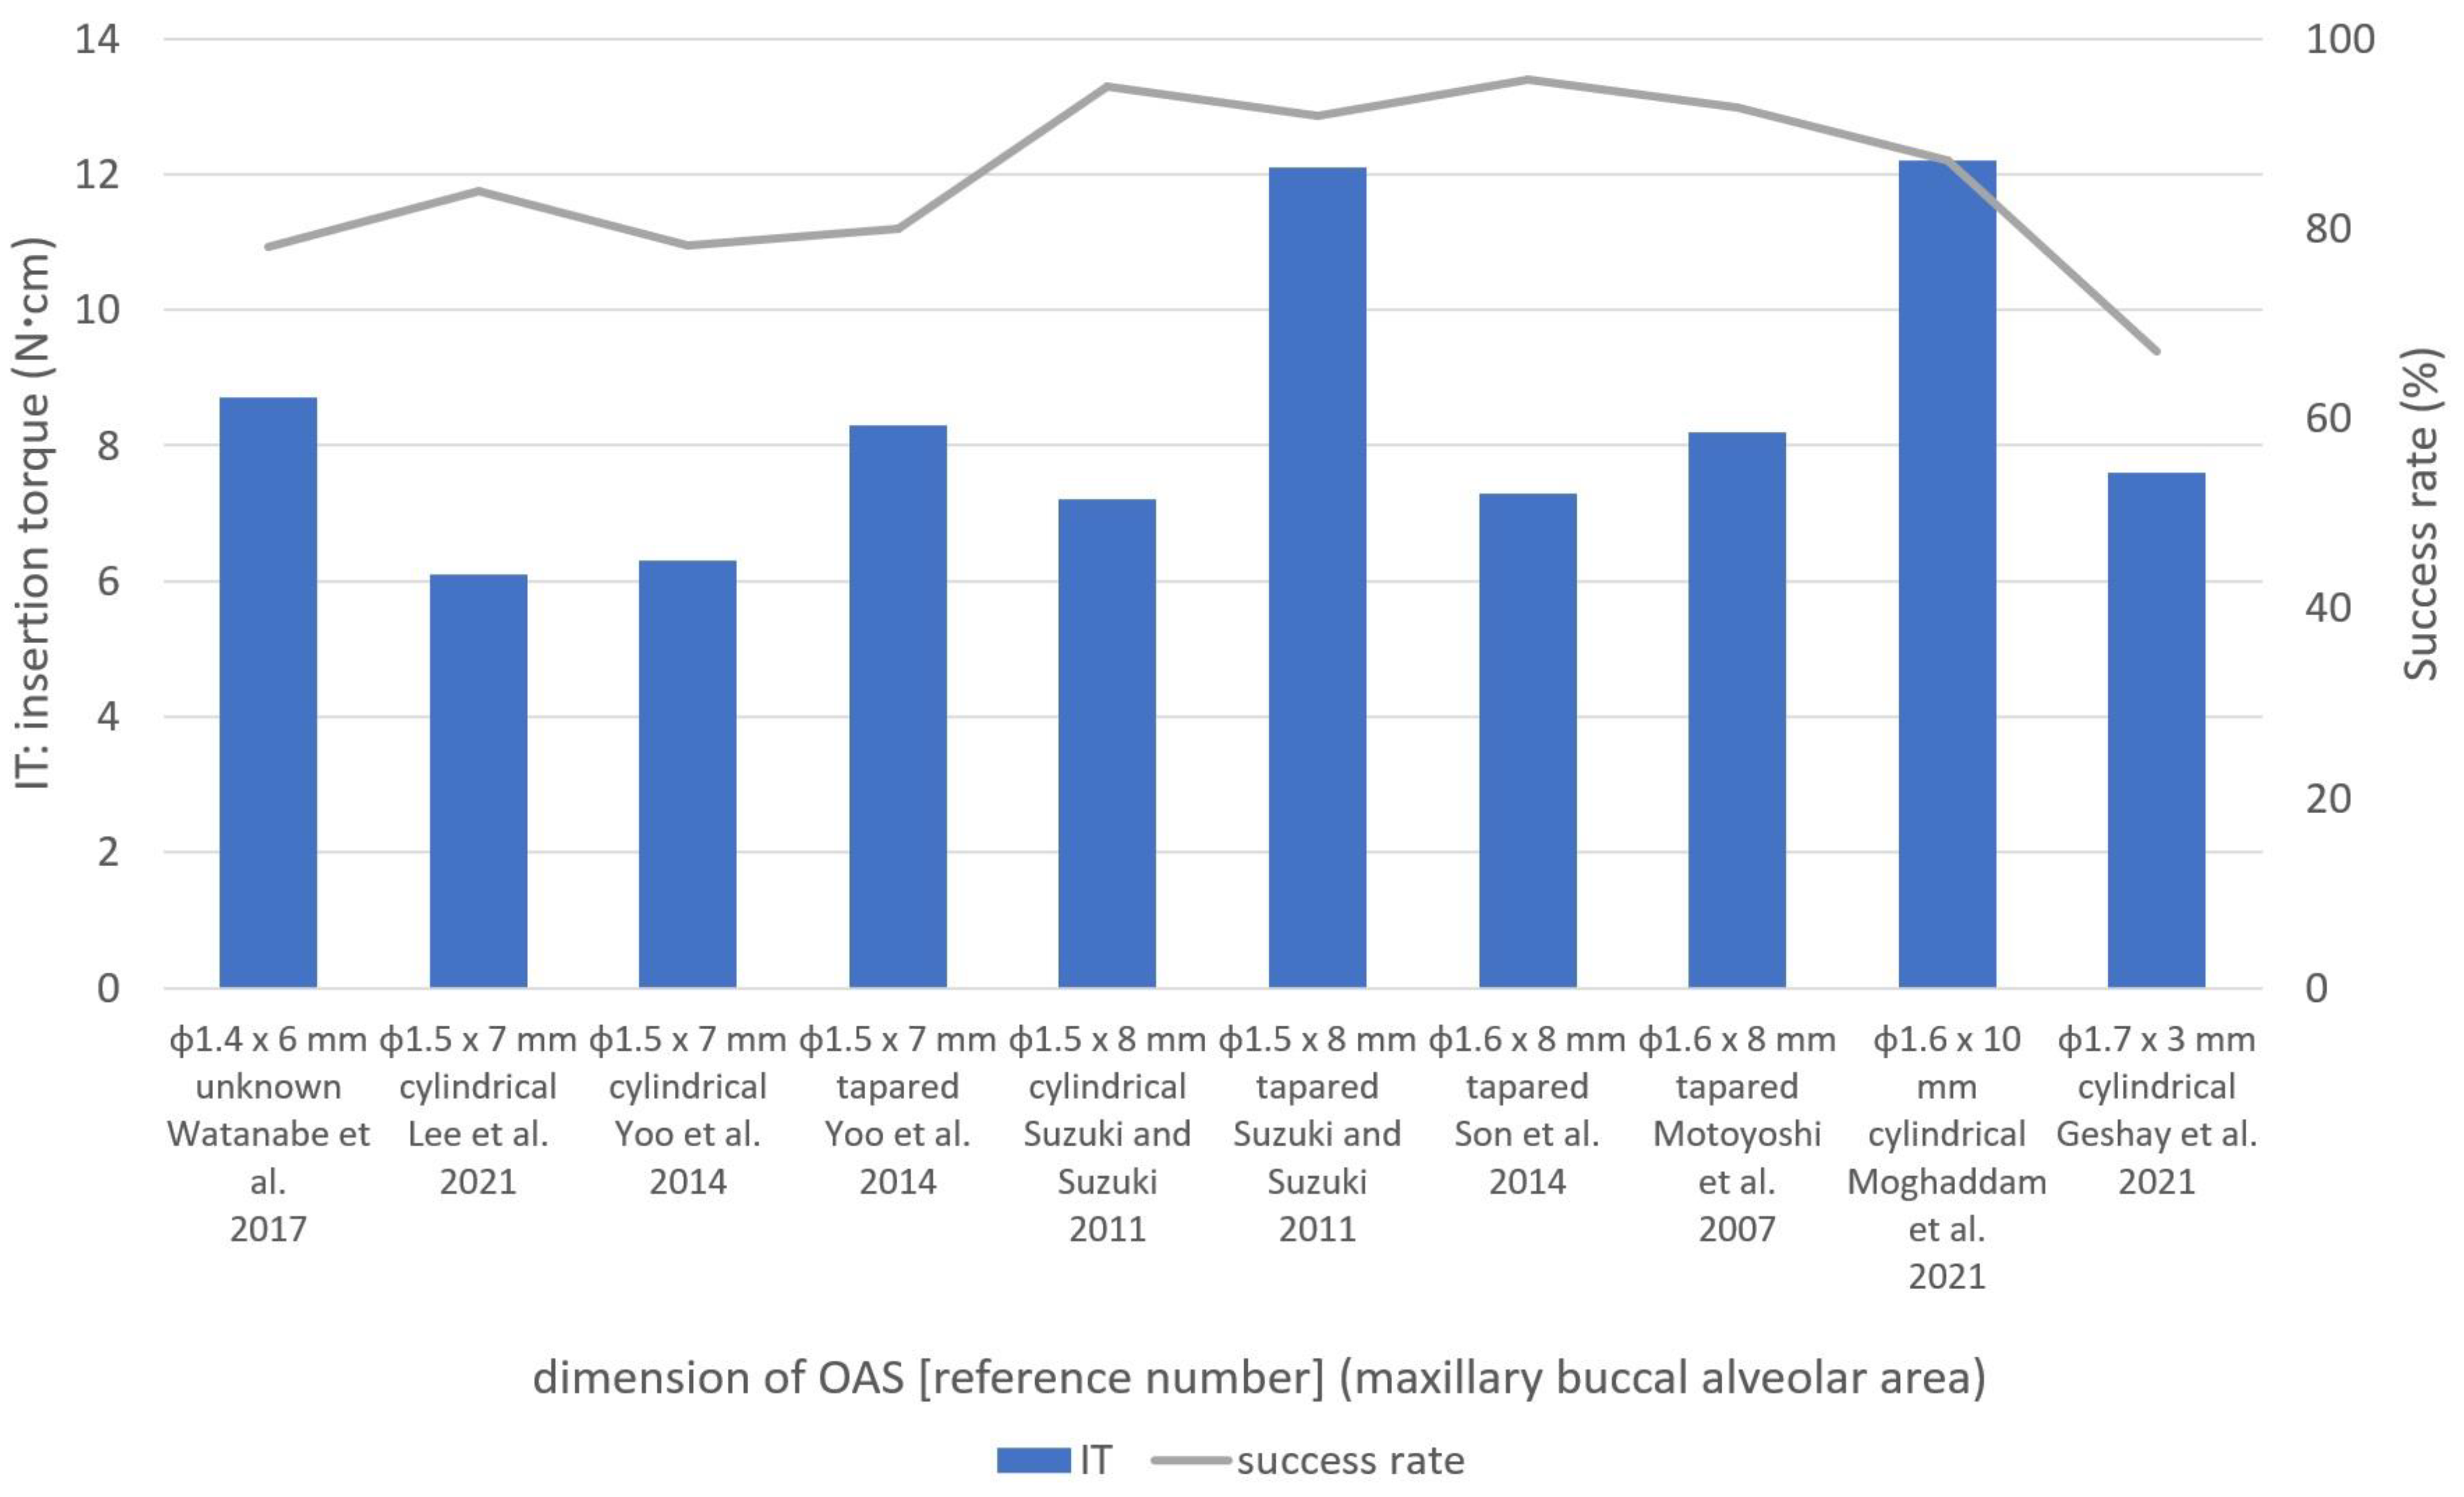
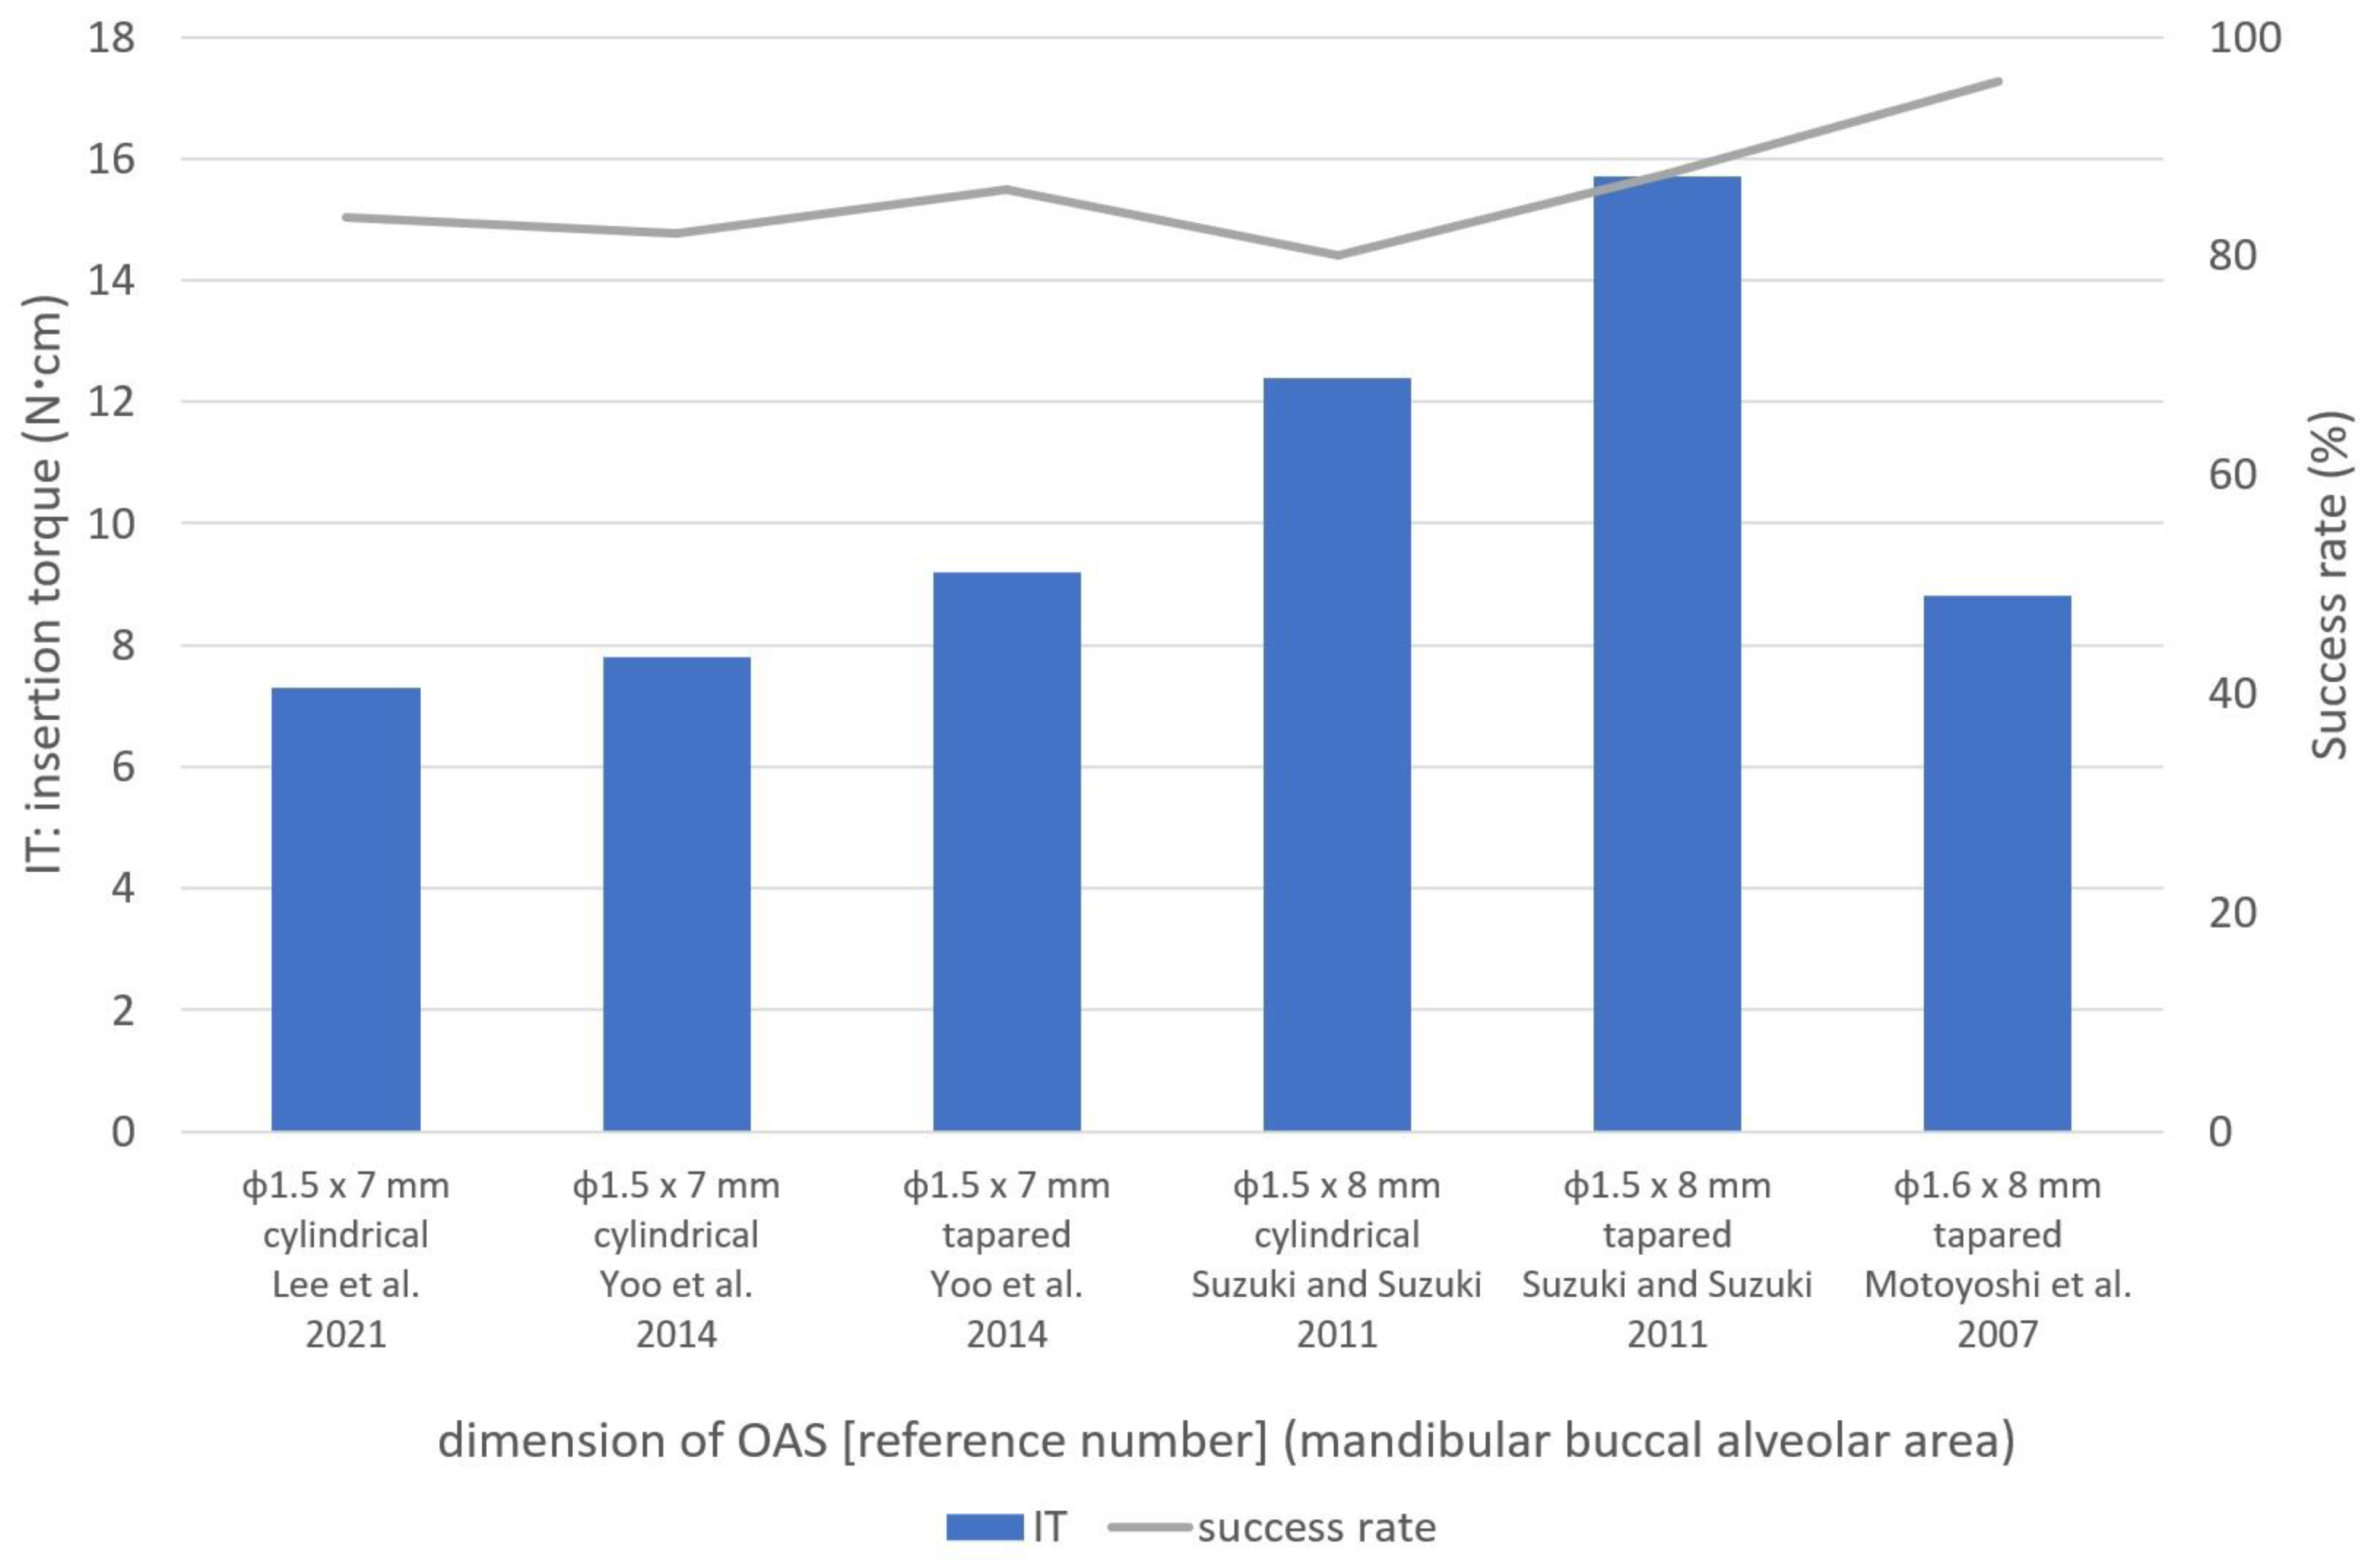
4.3.1. Buccal Alveolar Area
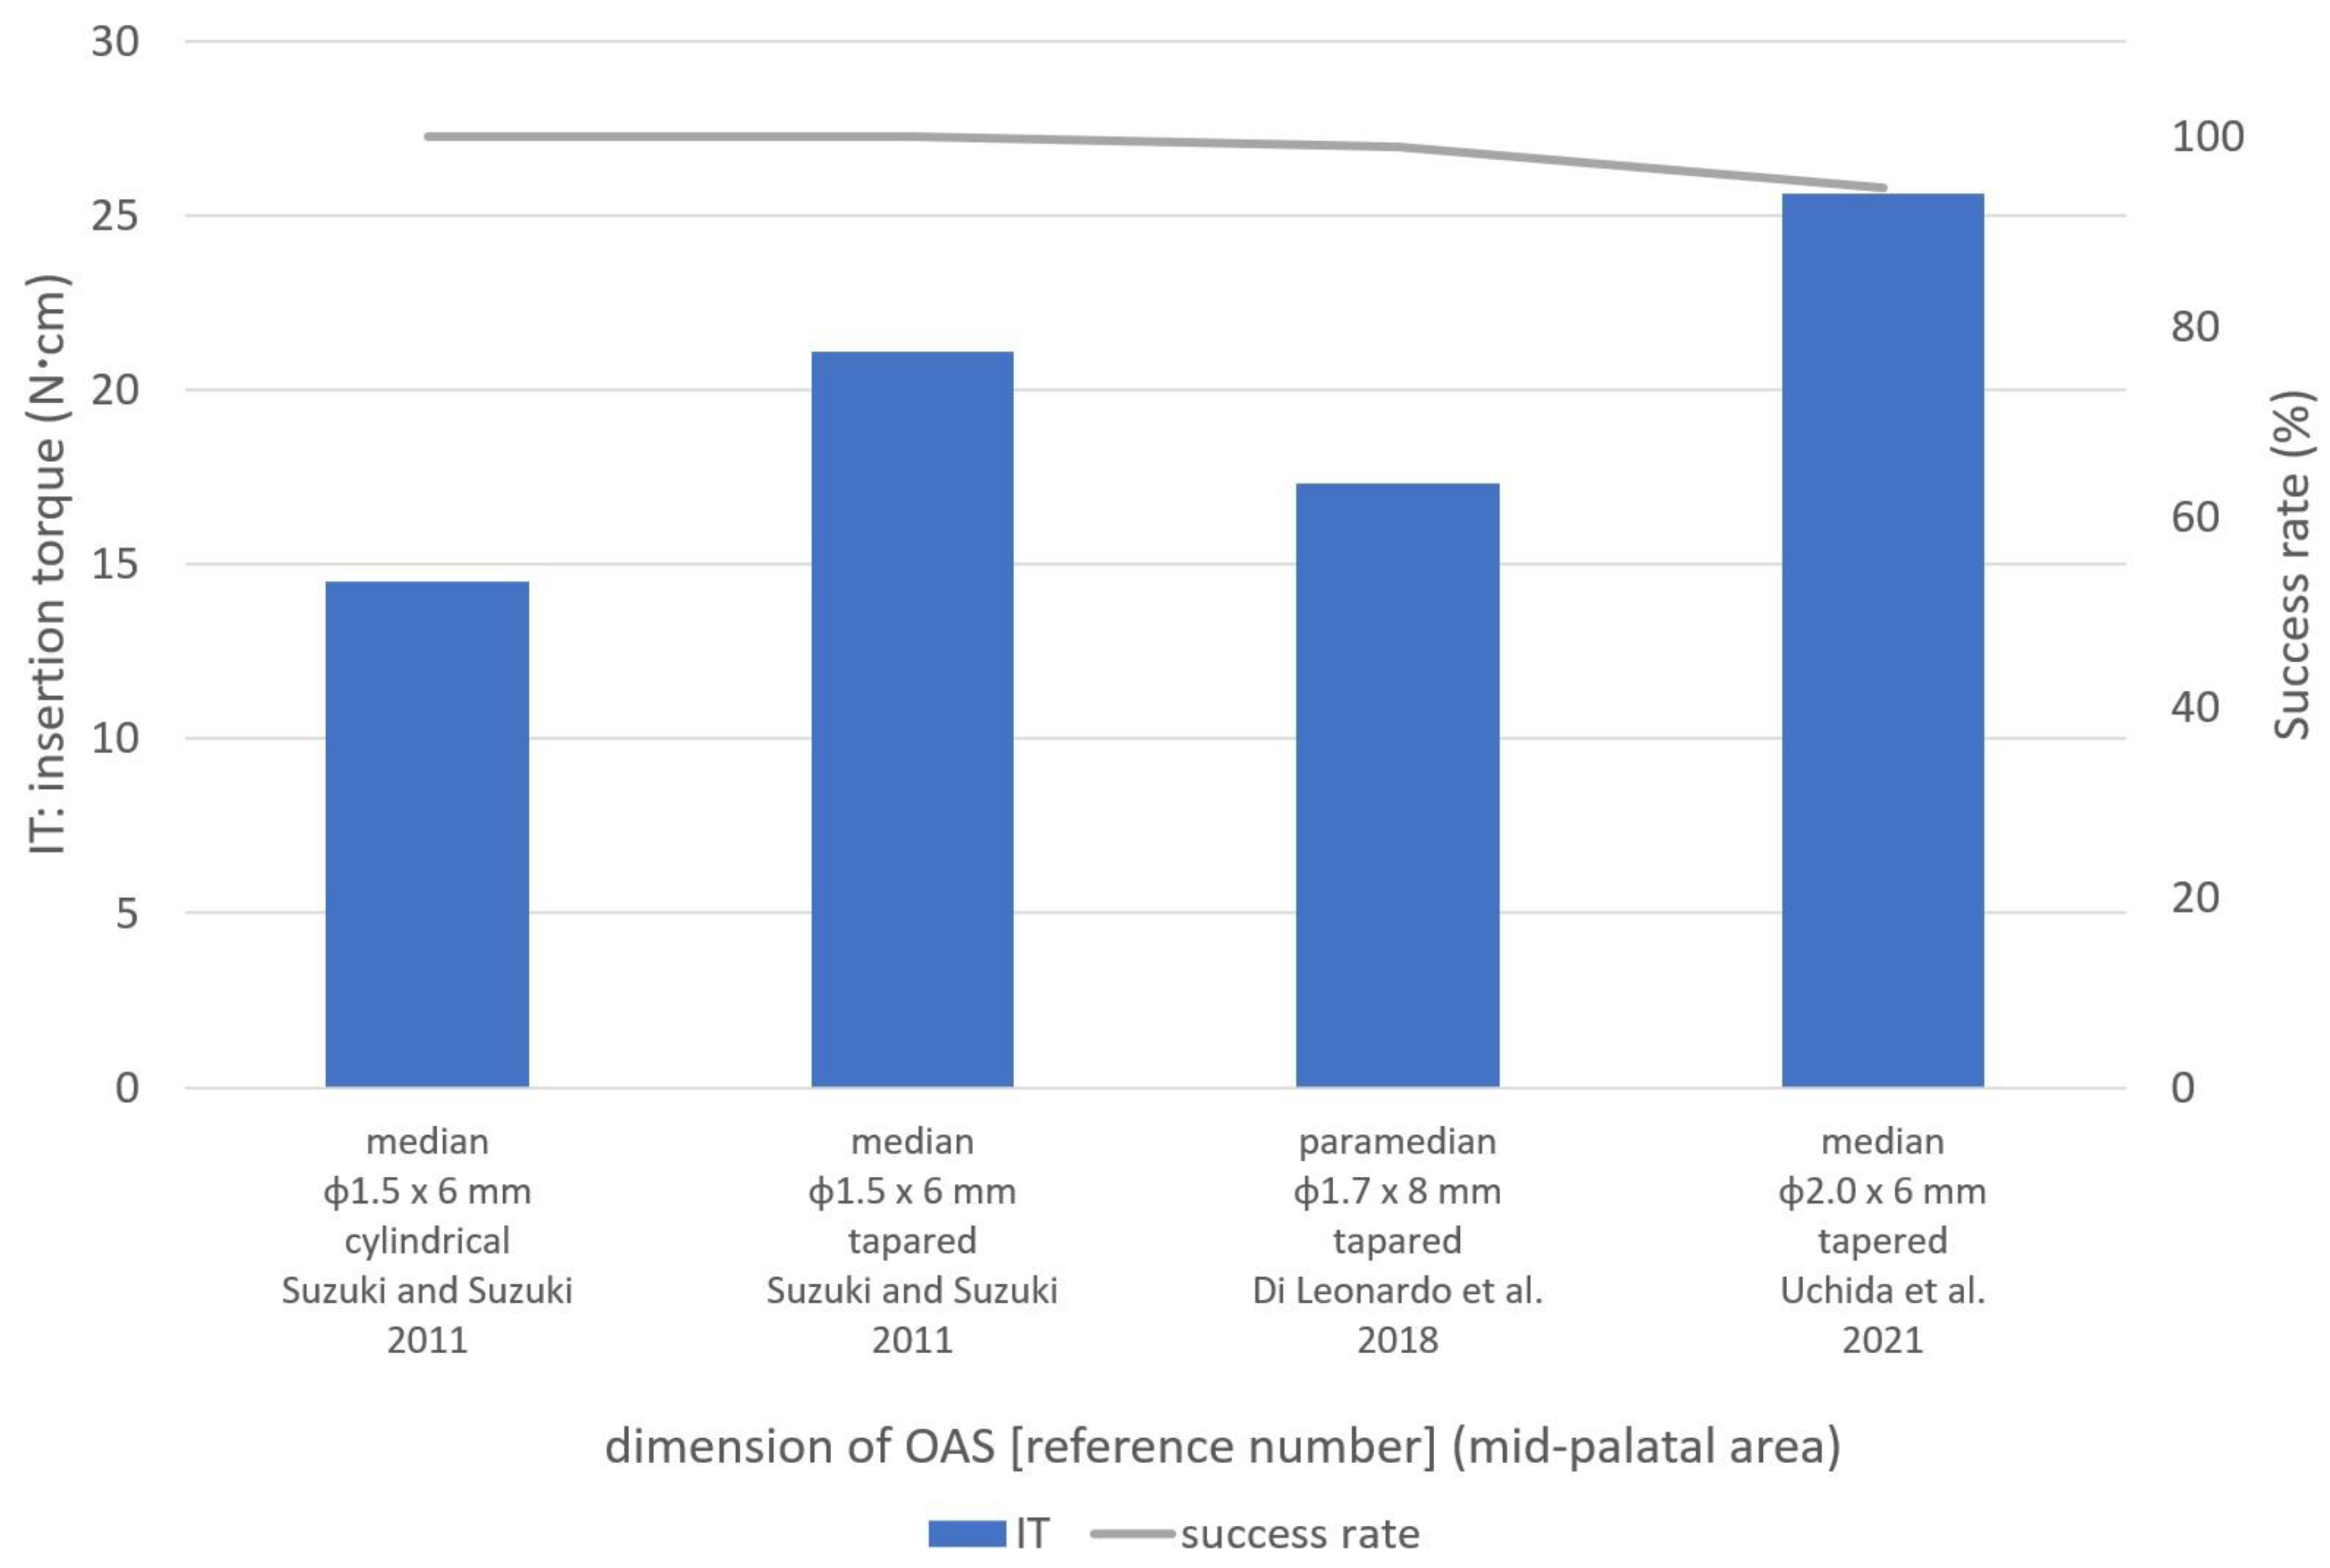
4.3.2. Mid-Palatal Area
4.3.3. Infrazygomatic Crest and the Buccal Shelf Areas
4.4. Limitation
5. Conclusions
Author Contributions
Funding
Institutional Review Board Statement
Informed Consent Statement
Data Availability Statement
Conflicts of Interest
References
- Watanabe, T.; Miyazawa, K.; Fujiwara, T.; Kawaguchi, M.; Tabuchi, M.; Goto, S. Insertion torque and Periotest values are important factors predicting outcome after orthodontic miniscrew placement. Am. J. Orthod. Dentofac. Orthop. 2017, 152, 483–488. [Google Scholar] [CrossRef]
- Tepedino, M.; Masedu, F.; Chimenti, C. Comparative evaluation of insertion torque and mechanical stability for self-tapping and self-drilling orthodontic miniscrews—An in vitro study. Head Face Med. 2017, 13, 10. [Google Scholar] [CrossRef]
- Nguyen, M.V.; Codrington, J.; Fletcher, L.; Dreyer, C.W.; Sampson, W.J. The influence of miniscrew insertion torque. Eur. J. Orthod. 2018, 40, 37–44. [Google Scholar] [CrossRef]
- Marquezan, M.; Mattos, C.T.; Sant’Anna, E.F.; de Souza, M.M.; Maia, L.C. Does cortical thickness influence the primary stability of miniscrews?: A systematic review and meta-analysis. Angle Orthod. 2014, 84, 1093–1103. [Google Scholar] [CrossRef]
- Casaña-Ruiz, M.D.; Bellot-Arcís, C.; Paredes-Gallardo, V.; García-Sanz, V.; Almerich-Silla, J.M.; Montiel-Company, J.M. Risk factors for orthodontic mini-implants in skeletal anchorage biological stability: A systematic literature review and meta-analysis. Sci. Rep. 2020, 10, 5848. [Google Scholar] [CrossRef]
- Geshay, D.; Campbell, P.; Tadlock, L.; Schneiderman, E.; Kyung, H.M.; Buschang, P. Stability of immediately loaded 3 mm long miniscrew implants: A feasibility study. Dent. Press J. Orthod. 2021, 26, e2119155. [Google Scholar] [CrossRef]
- Motoyoshi, M.; Matsuoka, M.; Shimizu, N. Application of orthodontic mini-implants in adolescents. Int. J. Oral Maxillofac. Surg. 2007, 36, 695–699. [Google Scholar] [CrossRef]
- Uchida, Y.; Namura, Y.; Inaba, M.; Osada, A.; Charleston-Coad, T.; Nakamura, Y.; Motoyoshi, M. Influence of pre-drilling diameter on the stability of orthodontic anchoring screws in the mid-palatal area. J. Oral Sci. 2021, 63, 270–274. [Google Scholar] [CrossRef]
- Lee, Y.; Choi, S.H.; Yu, H.S.; Erenebat, T.; Liu, J.; Cha, J.Y. Stability and success rate of dual-thread miniscrews. Angle Orthod. 2021, 91, 509–514. [Google Scholar] [CrossRef]
- Sreenivasagan, S.; Subramanian, A.K.; Nivethigaa, B. Assessment of insertion torque of mini-implant and its correlation with primary stability and pain levels in orthodontic patients. J. Contemp. Dent. Pract. 2021, 22, 84–88. [Google Scholar]
- Moghaddam, S.F.; Mohammadi, A.; Behroozian, A. The effect of sandblasting and acid etching on survival rate of orthodontic miniscrews: A split-mouth randomized controlled trial. Prog. Orthod. 2021, 22, 2. [Google Scholar] [CrossRef] [PubMed]
- Di Leonardo, B.; Ludwig, B.; Lisson, J.A.; Contardo, L.; Mura, R.; Hourfar, J. Insertion torque values and success rates for paramedian insertion of orthodontic mini-implants: A retrospective study. J. Orofac. Orthop. 2018, 79, 109–115. [Google Scholar] [CrossRef] [PubMed]
- Yoo, S.H.; Park, Y.C.; Hwang, C.J.; Kim, J.Y.; Choi, E.H.; Cha, J.Y. A comparison of tapered and cylindrical miniscrew stability. Eur. J. Orthod. 2014, 36, 557–562. [Google Scholar] [CrossRef] [PubMed]
- Son, S.; Motoyoshi, M.; Uchida, Y.; Shimizu, N. Comparative study of the primary stability of self-drilling and self-tapping orthodontic miniscrews. Am. J. Orthod. Dentofac. Orthop. 2014, 145, 480–485. [Google Scholar] [CrossRef] [PubMed]
- Suzuki, E.Y.; Suzuki, B. Placement and removal torque values of orthodontic miniscrew implants. Am. J. Orthod. Dentofac. Orthop. 2011, 139, 669–678. [Google Scholar] [CrossRef]
- Assad-Loss, T.F.; Kitahara-Céia, F.M.F.; Silveira, G.S.; Elias, C.N.; Mucha, J.N. Fracture strength of orthodontic mini-implants. Dent. Press J. Orthod. 2017, 22, 47–54. [Google Scholar] [CrossRef]
- Da Cunha, A.C.; Marquezan, M.; Lima, I.; Lopes, R.T.; Nojima, L.I.; Sant’Anna, E.F. Influence of bone architecture on the primary stability of different mini-implant designs. Am. J. Orthod. Dentofac. Orthop. 2015, 147, 45–51. [Google Scholar] [CrossRef]
- Ghorbanyjavadpour, F.; Kazemi, P.; Moradinezhad, M.; Rakhshan, V. Distribution and amount of stresses caused by insertion or removal of orthodontic miniscrews into the maxillary bone: A finite element analysis. Int. Orthod. 2019, 17, 758–768. [Google Scholar] [CrossRef]
- Ueda, M.; Matsuki, M.; Jacobsson, M.; Tjellström, A. The Relationship Between Insertion Torque and Removal Torque Analyzed in Fresh Temporal Bone. Int. J. Oral Maxillofac. Implant. 1991, 6, 442–447. [Google Scholar]
- Jasmine, M.I.; Yezdani, A.A.; Tajir, F.; Venu, R.M. Analysis of stress in bone and microimplants during en-masse retraction of maxillary and mandibular anterior teeth with different insertion angulations: A 3-dimensional finite element analysis study. Am. J. Orthod. Dentofac. Orthop. 2012, 141, 71–80. [Google Scholar] [CrossRef]
- Chen, Y.; Kyung, H.M.; Gao, L.; Yu, W.J.; Bae, E.J.; Kim, S.M. Mechanical properties of self-drilling orthodontic micro-implants with different diameters. Angle Orthod. 2010, 80, 821–827. [Google Scholar] [CrossRef] [PubMed]
- Suzuki, M.; Deguchi, T.; Watanabe, H.; Seiryu, M.; Iikubo, M.; Sasano, T.; Fujiyama, K.; Takano-Yamamoto, T. Evaluation of optimal length and insertion torque for miniscrews. Am. J. Orthod. Dentofac. Orthop. 2013, 144, 251–259. [Google Scholar] [CrossRef] [PubMed]
- Nienkemper, M.; Santel, N.; Hönscheid, R.; Drescher, D. Orthodontic mini-implant stability at different insertion depths: Sensitivity of three stability measurement methods. J. Orofac. Orthop. 2016, 77, 296–303. [Google Scholar] [CrossRef] [PubMed]
- Wang, C.H.; Wu, J.H.; Lee, K.T.; Hsu, K.R.; Wang, H.C.; Chen, C.M. Mechanical strength of orthodontic infrazygomatic mini-implants. Odontology 2011, 99, 98–100. [Google Scholar] [CrossRef] [PubMed]
- Shah, A.H.; Behrents, R.G.; Kim, K.B.; Kyung, H.M.; Buschang, P.H. Effects of screw and host factors on insertion torque and pullout strength. Angle Orthod. 2012, 82, 603–610. [Google Scholar] [CrossRef]
- Wilmes, B.; Panayotidis, A.; Drescher, D. Fracture resistance of orthodontic mini-implants: A biomechanical in vitro study. Eur. J. Orthod. 2011, 33, 396–401. [Google Scholar] [CrossRef]
- Dalla Rosa, F.; Burmann, P.F.; Ruschel, H.C.; Vargas, I.A.; Kramer, P.F. Evaluation of fracture torque resistance of orthodontic mini-implants. Acta Odontol. Latinoam. 2016, 29, 248–254. [Google Scholar]
- Kim, Y.H.; Yang, S.M.; Kim, S.; Lee, J.Y.; Kim, K.E.; Gianelly, A.A.; Kyung, S.H. Midpalatal miniscrews for orthodontic anchorage: Factors affecting clinical success. Am. J. Orthod. Dentofac. Orthop. 2010, 137, 66–72. [Google Scholar] [CrossRef]
- Stockmann, P.; Schlegel, K.A.; Srour, S.; Neukam, F.W.; Fenner, M.; Felszeghy, E. Which region of the median palate is a suitable location of temporary orthodontic anchorage devices? A histomorphometric study on human cadavers aged 15–20 years. Clin. Oral Implant. Res. 2009, 20, 306–312. [Google Scholar] [CrossRef]
- Naya-Imai, H.; Uchida, Y.; Inaba, M.; Namura, Y.; Osada, A.; Charleston-Coad, T.; Nakamura, Y.; Motoyoshi, M. Age dependence of the maturation of the midpalatal suture in the stability of orthodontic anchoring screws. Am. J. Orthod. Dentofac. Orthop. 2022, 161, 809–819. [Google Scholar] [CrossRef]
- Nienkemper, M.; Pauls, A.; Ludwig, B.; Drescher, D. Stability of paramedian inserted palatal mini-implants at the initial healing period: A controlled clinical study. Clin. Oral Implant. Res. 2015, 26, 870–875. [Google Scholar] [CrossRef] [PubMed]
- Chang, C.J.; Lin, W.C.; Chen, M.Y.; Chang, H.C. Evaluation of total bone and cortical bone thickness of the palate for temporary anchorage device insertion. J. Dent. Sci. 2021, 16, 636–642. [Google Scholar] [CrossRef]
- Chen, C.M.; Wu, J.H.; Lu, P.C.; Wang, H.C.; Lee, H.E.; Wang, C.H.; Du, J.K. Horizontal pull-out strength of orthodontic infrazygomatic mini-implant: An in vitro study. Implant Dent. 2011, 20, 139–145. [Google Scholar] [CrossRef] [PubMed]
- Nucera, R.; Lo Giudice, A.; Bellocchio, A.M.; Spinuzza, P.; Caprioglio, A.; Perillo, L.; Matarese, G.; Cordasco, G. Bone and cortical bone thickness of mandibular buccal shelf for mini-screw insertion in adults. Angle Orthod. 2017, 87, 745–751. [Google Scholar] [CrossRef] [PubMed]
| Authors | Screws (n) | Placement Location | Diameter (mm) | Length (mm) | Bland (Country) | Shape | Methods | Insertion Torque: IT (Ncm) | Success Rate (%) | Pre-Drilling Diameter (mm) | Notes | |
|---|---|---|---|---|---|---|---|---|---|---|---|---|
| Watanabe et al., 2017 [1] | 50 | Maxillary buccal alveolar area | between 2nd bicuspid and 1st molar | 1.4 | 6.0 | Jeil Medical (Korea) | unknown | Self-Drilling | 8.7 ± 2.2 | 78.0 | - | female subjects only |
| 70 | Maxillary lingual alveolar area | 8.8 ± 2.3 | 91.4 | - | ||||||||
| Geshay et al., 2021 [6] | 42 | Maxillary buccal alveolar area | between canine and 1st bicuspid | 1.7 | 3.0 | Dentos (Korea) | Cylindrical | Self-Drilling | 7.8 ± 1.2 | 64.3 | - | - |
| 40 | Maxillary buccal alveolar area | between 2nd bicuspid and 1st molar | 7.4 ± 1.9 | 70.0 | - | |||||||
| Motoyoshi et al., 2007 [7] | 31 | Maxillary buccal alveolar area | between 2nd premolar and 2nd molar | 1.6 | 8.0 | Biodent (Janan) | Tapered | Self-Tapping | 8.9 ± 2.6 | 64.5 | 1.0 | early loading in adolescent subjects |
| 20 | Maxillary buccal alveolar area | 7.6 ± 2.7 | 95.0 | 1.0 | late loading in adolescent subjects | |||||||
| 49 | Maxillary buccal alveolar area | 8.8 ± 2.8 | 91.8 | 1.0 | early loading in adult subjects | |||||||
| Uchida et al., 2021 [8] | 73 | Mid-palatal suture area | corresponding area to 2nd premolar and 1st molar | 2.0 | 6.0 | Biodent (Janan) | Tapered | Self-Tapping | 25.6 ± 5.5 | 94.5 | 1.2 | placement torque data of φ1.2 mm pre-drilling screws only |
| 88 | None | 83.0 | 1.5 | |||||||||
| Lee et al., 2021 [9] | 91 | Maxillary buccal alveolar area | No mention in antero-posterior placement location | 1.5 | 7.0 | Biomaterials Korea (Korea) | Cylindrical | Self-Drilling | 6.0 ± 3.2 | 79.1 | - | - |
| 85 | Maxillary buccal alveolar area | 1.5 | 7.0 | Biomaterials Korea (Korea) | Cylindrical (Dual Thread) | Self-Drilling | 6.2 ± 2.6 | 88.2 | - | |||
| Sreenivasagan et.al., 2021 [10] | 12 | Infrazygomatic crest | - | 2.0 | 12.0 | Favanchor TM (India) | unknown | Self-Drilling | 10.1 | 83.3 | - | - |
| 32 | Maxillary buccal alveolar area | No mention in antero-posterior placement location | 1.3 and 1.5 | unknown | SK Surgicals (India) | unknown | Self-Drilling | 6.6 | 87.5 | - | data of φ1.3 and 1.5 mm OASs were unified | |
| Moghaddam et al., 2021 [11] | 31 | Maxillary buccal alveolar area | between 2nd bicuspid and 1st molar | 1.6 | 10.0 | Jeil Medical (Korea) | Cylindrical | Self-Drilling | 12.1 ± 6.3 | 90.3 | - | sandblasted acid-etched |
| 31 | 12.4 ± 5.8 | 83.9 | - | control | ||||||||
| Di Leonardo et al., 2018 [12] | 44 | Paramedian suture area | immediately posterior to the palatal rugae | 1.7 | 8.0 | Forestadent, (Germany) | Tapered | Self-Drilling | 17.1 ± 3.3 | 98.8 | - | use for distalize |
| 20 | 16.0 ± 5.2 | - | use for mesialize | |||||||||
| 16 | 18.1 ± 5.6 | - | use for RPE | |||||||||
| Yoo et al., 2014 [13] | 55 | Maxillary buccal alveolar area | including incisor area | 1.5 | 7.0 | Biomaterials Korea (Korea) | Tapered | Self-Drilling | 8.3 ± 3.7 | 80.0 | - | - |
| 55 | Maxillary buccal alveolar area | 1.5 | 7.0 | Biomaterials Korea (Korea) | Cylindrical | Self-Drilling | 6.3 ± 2.8 | 78.2 | - | - | ||
| Son et al., 2014 [14] | 70 | Maxillary buccal alveolar area | between 2nd bicuspid and 1st molar | 1.6 | 8.0 | Biodent (Janan) | Tapered | Self-Tapping | 7.0 ± 2.1 | 95.7 | 1.0 | - |
| 70 | Self-Drilling | 7.5 ± 3.1 | 95.7 | - | - | |||||||
| Suzuki and Suzuki 2011 [15] | 78 | Maxillary buccal alveolar area | No mention in antero-posterior placement location | 1.5 | 8.0 | Sistema Nacional de Implantes (Brazil) | Cylindrical | Self-Tapping | 7.2 ± 1.4 | 94.9 | 1.1 | - |
| 27 | Mid-palatal suture area | 6.0 | 14.5 ± 1.6 | 100 | - | |||||||
| 98 | Maxillary buccal alveolar area | 8.0 | BioMaterials Korea (Korea) | Tapered | Self-Drilling | 12.1 ± 3.1 | 91.8 | - | - | |||
| 30 | Mid-palatal suture area | 6.0 | 21.1 ± 2.2 | 100 | - | - | ||||||
| Authors | Screws (n) | Placement Location | Diameter (mm) | Length (mm) | Bland (Country) | Shape | Methods | Insertion Torque: IT (Ncm) | Success Rate (%) | Pre-Drilling Diameter (mm) | Notes | |
|---|---|---|---|---|---|---|---|---|---|---|---|---|
| Motoyoshi et al., 2007 [7] | 16 | Mandibular buccal alveolar area | between 2nd premolar and 2nd molar | 1.6 | 8.0 | Biodent (Janan) | Tapered | Self-Tapping | 8.5 ± 3.0 | 62.5 | 1.3 or 1.4 | early loading in adolescent subjects |
| 16 | Mandibular buccal alveolar area | 8.8 ± 3.0 | 100.0 | 1.3 or 1.4 | late loading in adolescent subjects | |||||||
| 37 | Mandibular buccal alveolar area | 8.8 ± 2.6 | 91.9 | 1.3 or 1.4 | early loading in adult subjects | |||||||
| Lee et al., 2021 [9] | 54 | Mandibular buccal alveolar area | No mention in antero-posterior placement location | 1.5 | 7.0 | Biomaterials Korea (Korea) | Cylindrical | Self-Drilling | 6.5 ± 2.8 | 87.0 | - | - |
| 50 | Mandibular buccal alveolar area | 1.5 | 7.0 | Biomaterials Korea (Korea) | Cylindrical (Dual Thread) | Self-Drilling | 8.0 ± 3.9 | 78.0 | - | |||
| Sreenivasagan et.al., 2021 [10] | 4 | Buccal shelf | — | 2.0 | 12.0 | Favanchor TM (India) | unknown | Self-Drilling | 10.3 | 100.0 | - | - |
| 11 | Mandibular buccal alveolar area | No mention in antero-posterior placement location | 1.3 and 1.5 | unknown | SK Surgicals (India) | unknown | Self-Drilling | 6.6 | 72.7 | - | data of φ1.3 and 1.5 mm OASs were unified | |
| Yoo et al., 2014 [13] | 50 | Mandibular buccal alveolar area | including incisor area | 1.5 | 7.0 | Biomaterials Korea (Korea) | Tapered | Self-Drilling | 9.2 ± 4.0 | 86.0 | - | - |
| 67 | Mandibular buccal alveolar area | 1.5 | 7.0 | Biomaterials Korea (Korea) | Cylindrical | Self-Drilling | 7.8 ± 3.5 | 82.1 | - | - | ||
| Suzuki and Suzuki 2011 [15] | 15 | Mandibular buccal alveolar area | No mention in antero-posterior placement location | 1.5 | 8.0 | Sistema Nacional de Implantes (Brazil) | Cylindrical | Self-Tapping | 12.4 ± 1.2 | 80.0 | 1.1 | - |
| 32 | Mandibular buccal alveolar area | 8.0 | BioMaterials Korea (Korea) | Tapered | Self-Drilling | 15.7 ± 2.3 | 87.5 | - | - | |||
Disclaimer/Publisher’s Note: The statements, opinions and data contained in all publications are solely those of the individual author(s) and contributor(s) and not of MDPI and/or the editor(s). MDPI and/or the editor(s) disclaim responsibility for any injury to people or property resulting from any ideas, methods, instructions or products referred to in the content. |
© 2023 by the authors. Licensee MDPI, Basel, Switzerland. This article is an open access article distributed under the terms and conditions of the Creative Commons Attribution (CC BY) license (https://creativecommons.org/licenses/by/4.0/).
Share and Cite
Uchida, Y.; Namura, Y.; Motoyoshi, M. Optimal Insertion Torque for Orthodontic Anchoring Screw Placement: A Comprehensive Review. Appl. Sci. 2023, 13, 10681. https://doi.org/10.3390/app131910681
Uchida Y, Namura Y, Motoyoshi M. Optimal Insertion Torque for Orthodontic Anchoring Screw Placement: A Comprehensive Review. Applied Sciences. 2023; 13(19):10681. https://doi.org/10.3390/app131910681
Chicago/Turabian StyleUchida, Yasuki, Yasuhiro Namura, and Mitsuru Motoyoshi. 2023. "Optimal Insertion Torque for Orthodontic Anchoring Screw Placement: A Comprehensive Review" Applied Sciences 13, no. 19: 10681. https://doi.org/10.3390/app131910681
APA StyleUchida, Y., Namura, Y., & Motoyoshi, M. (2023). Optimal Insertion Torque for Orthodontic Anchoring Screw Placement: A Comprehensive Review. Applied Sciences, 13(19), 10681. https://doi.org/10.3390/app131910681