Article

A Multiscale Deep Encoder–Decoder with Phase Congruency Algorithm Based on Deep Learning for Improving Diagnostic Ultrasound Image Quality

1
Department of Radiology, Sunchonhyang University Bucheon Hospital, 170, Jomaru-ro, Bucheon-si 14584, Gyeonggi-do, Republic of Korea
2
Department of Health Science, General Graduate School of Gachon University, 191, Hambakmoero, Yeonsu-gu, Incheon 21936, Republic of Korea
3
Department of Biomedical Engineering, Eulji University, 553, Sanseong-daero, Sujeong-gu, Seongnam-si 13135, Gyeonggi-do, Republic of Korea
4
Department of Radiological Science, Gachon University, 191, Hambakmoero, Yeonsu-gu, Incheon 21936, Republic of Korea
*
Authors to whom correspondence should be addressed.
These authors contributed equally to this work.
Appl. Sci. 2023, 13(23), 12928; https://doi.org/10.3390/app132312928
Submission received: 25 October 2023 / Revised: 17 November 2023 / Accepted: 1 December 2023 / Published: 3 December 2023
(This article belongs to the Special Issue Advances in Image and Video Processing: Techniques and Applications)

Abstract

:
Ultrasound imaging is widely used as a noninvasive lesion detection method in diagnostic medicine. Improving the quality of these ultrasound images is very important for accurate diagnosis, and deep learning-based algorithms have gained significant attention. This study proposes a multiscale deep encoder–decoder with phase congruency (MSDEPC) algorithm based on deep learning to improve the quality of diagnostic ultrasound images. The MSDEPC algorithm included low-resolution (LR) images and edges as inputs and constructed a multiscale convolution and deconvolution network. Simulations were conducted using the Field 2 program, and data from real experimental research were obtained using five clinical datasets containing images of the carotid artery, liver hemangiomas, breast malignancy, thyroid carcinomas, and obstetric nuchal translucency. LR images, bicubic interpolation, and super-resolution convolutional neural networks (SRCNNs) were modeled as comparison groups. Through visual assessment, the image processed using the MSDEPC was the clearest, and the lesions were clearly distinguished. The structural similarity index metric (SSIM) value of the simulated ultrasound image using the MSDEPC algorithm improved by approximately 38.84% compared to LR. In addition, the peak signal-to-noise ratio (PSNR) and SSIM values of clinical ultrasound images using the MSDEPC algorithm improved by approximately 2.33 times and 88.58%, respectively, compared to LR. In conclusion, the MSDEPC algorithm is expected to significantly improve the spatial resolution of ultrasound images.

1. Introduction

Ultrasound refers to frequencies above 20,000 Hz, which is higher than the human hearing range and is widely used in diagnostic medicine. Ultrasound imaging used in the diagnostic medical field is referred to as ultrasonography, and organs of the human body are observed in the frequency range of 2–18 MHz [1]. Although the use of ultrasound imaging to observe the human body was established later than the use of radiography, it has recently been in the spotlight as an imaging technique that allows for the relatively easy observation of lesions through a nondestructive and noninvasive examination method. Since diagnostic ultrasound imaging technology was first used in obstetrics and gynecology, it has been used in all medical fields, including those pertaining to the abdomen, breast, thyroid, and blood vessels [2,3,4,5,6].
Various methods are available for acquiring diagnostic ultrasound images [1]. Among these, the brightness mode (B-mode) expresses the intensity of the reflected wave as a two-dimensional brightness image. B-mode ultrasound images are used to diagnose lesions, and efforts are needed to improve image quality and diagnostic accuracy. Spatial resolution is an important evaluation index for ultrasound image quality, and methods to improve it include thickening the damping layer of the pulse-wave probe or using systems that improve the basic frequency [7]. In addition, ultrasound images can be acquired using multiple focal points to improve lateral resolution, or additional acoustic lenses can be installed to improve the slice thickness resolution [8].
However, when the damping on the ultrasonic probe is increased, the bandwidth of the sound beam widens and the quality factor decreases, and increasing the frequency shortens the penetration depth. In addition, when the focal length of the sound beam is increased, the disadvantage of lowering the temporal resolution inevitably decreases. Recently, software and technologies have been widely used to overcome the shortcomings of hardware-based spatial-resolution improvement methods. Super resolution (SR) is one of the primary methods [9]. This technique overcomes the inherent resolution limitation of low-resolution (LR) imaging systems. The main advantage of this approach is that it is inexpensive and can be simply utilized with existing LR imaging systems. The SR image reconstruction problem expresses the degradation model between LR and high-resolution (HR) images as follows [9,10,11]:
y = W x + n ,   W = D B M ,
where y denotes the LR image generated from the HR image x , with resolution degradation factor W , and additional noise n . The matrices comprising W are D for the subsampling matrix, B for the blur matrix, and M for the warp matrices. SR is the process of predicting the optimal W and n , and the most basic method is multi-image-based SR [12]. Interpolating multiframe images to an HR image grid to improve resolution has the advantage of enabling SR based on real-world information. However, it is difficult to generate an HR image using this approach because it does not always match the even HR grid, and noise can interfere with matching [13]. However, example-based SR does not require this process. This is a learning-based approach to image enlargement in which the training set consists of pairs of LR and HR images. Generally, a detailed HR image is acquired and downsampled to account for the degradation of W and n , as shown in Equation (1). The size is matched to the HR image using an existing interpolation method (e.g., linear or bilinear) to design a training dataset [14]. High-frequency information, which is mainly related to resolution, is distorted between LR and HR images, and several methods have been introduced, including Bayesian, prior-based, dictionary learning, and self-similarity methods [15,16,17,18]. Research on predicting the detailed components of HR images from single LR images has been extended to the field of single-image super-resolution (SISR) based on deep learning [19,20]. Dong et al. introduced a super-resolution convolutional neural network (SRCNN) [21]. The convolutional neural network states that each nonlinear transformation using a data-driven filter corresponds to traditional patch extraction, nonlinear mapping (from LR to HR patches), and reconstruction. The SRCNN is a combination of upsampling methods, a model framework, a network design, and a learning strategy and serves as a cornerstone of early SISR research. Kim et al. proposed the so-called very deep super-resolution (VDSR) convolutional network, inspired by VGG-net [22]. Using 20 layers and many small cascading filters, they were able to utilize the contextual information throughout the image. Adjustable gradient clipping was used to compensate for slow convergence. Residual blocks have been actively used since VDSR was proposed. SISR based on a generative adversarial network (GAN) was also introduced [23]. Ledig et al. demonstrated SRResNet (SRGAN), which is used for the perceptual loss function and consists of adversarial loss and content loss to improve the human visual system perspective. In addition, deep learning models that implement SISR in various ways, such as recursive, densely connected, and attention-based networks, have been introduced [24]. Because most of the image resolution is in the high-frequency range, it is also of interest to extract the edge image separately to improve image sharpness. Liu et al. presented a multiscale deep encoder–decoder-based SISR method with phase congruency (MSDEPC) [25]. They proposed a phase congruency edge map to maintain the structural edge features of an image according to the subsampling of different scales. It has been demonstrated that this method can appropriately integrate edge details better than existing deep learning models.
Ultrasound imaging is highly dependent on image resolution when observing the shape and blood flow angles, which is one of the reasons why SISR is needed [26]. In this study, we investigated a deep learning-based SISR process to improve sonographic image quality using the MSDEPC model. The purpose of the paper is to identify how much the MSDEPC model, which performs SISR by extracting an accurate edge structure, improves image quality in ultrasound images according to important clinical imaging sites and to reveal its usefulness. The clinical validation of the deep learning model will provide useful information and further research directions for other researchers. We evaluated the full width at half maximum (FWHM), peak signal-to-noise ratio (PSNR), and structural similarity index measure (SSIM) [27,28]. In the following sections, we briefly describe the implementation of the simulation and experiment and discuss the results in detail. The remainder of this manuscript is divided into three sections: Section 2 discusses the MSDEPC model architecture for SISR in ultrasound imaging, the datasets used for model training and testing, and the quantitative evaluation factors used. Section 3 describes the results and discussion regarding the Field II simulation and experiment of clinical images pertaining to the carotid artery, a liver hemangioma, breast malignancy, a thyroid carcinoma, and obstetric nuchal translucency. Finally, Section 4 presents the conclusions that can be drawn from our study.

2. Materials and Methods

This section contains a description of the MSDEPC model, the datasets used in the study, and the quantitative evaluation factors used in the study, and it is organized into the following: Section 2.1. MSDEPC model based on deep learning for SISR in ultrasound imaging; Section 2.2. Datasets; Section 2.3. Quantitative evaluations of image quality.

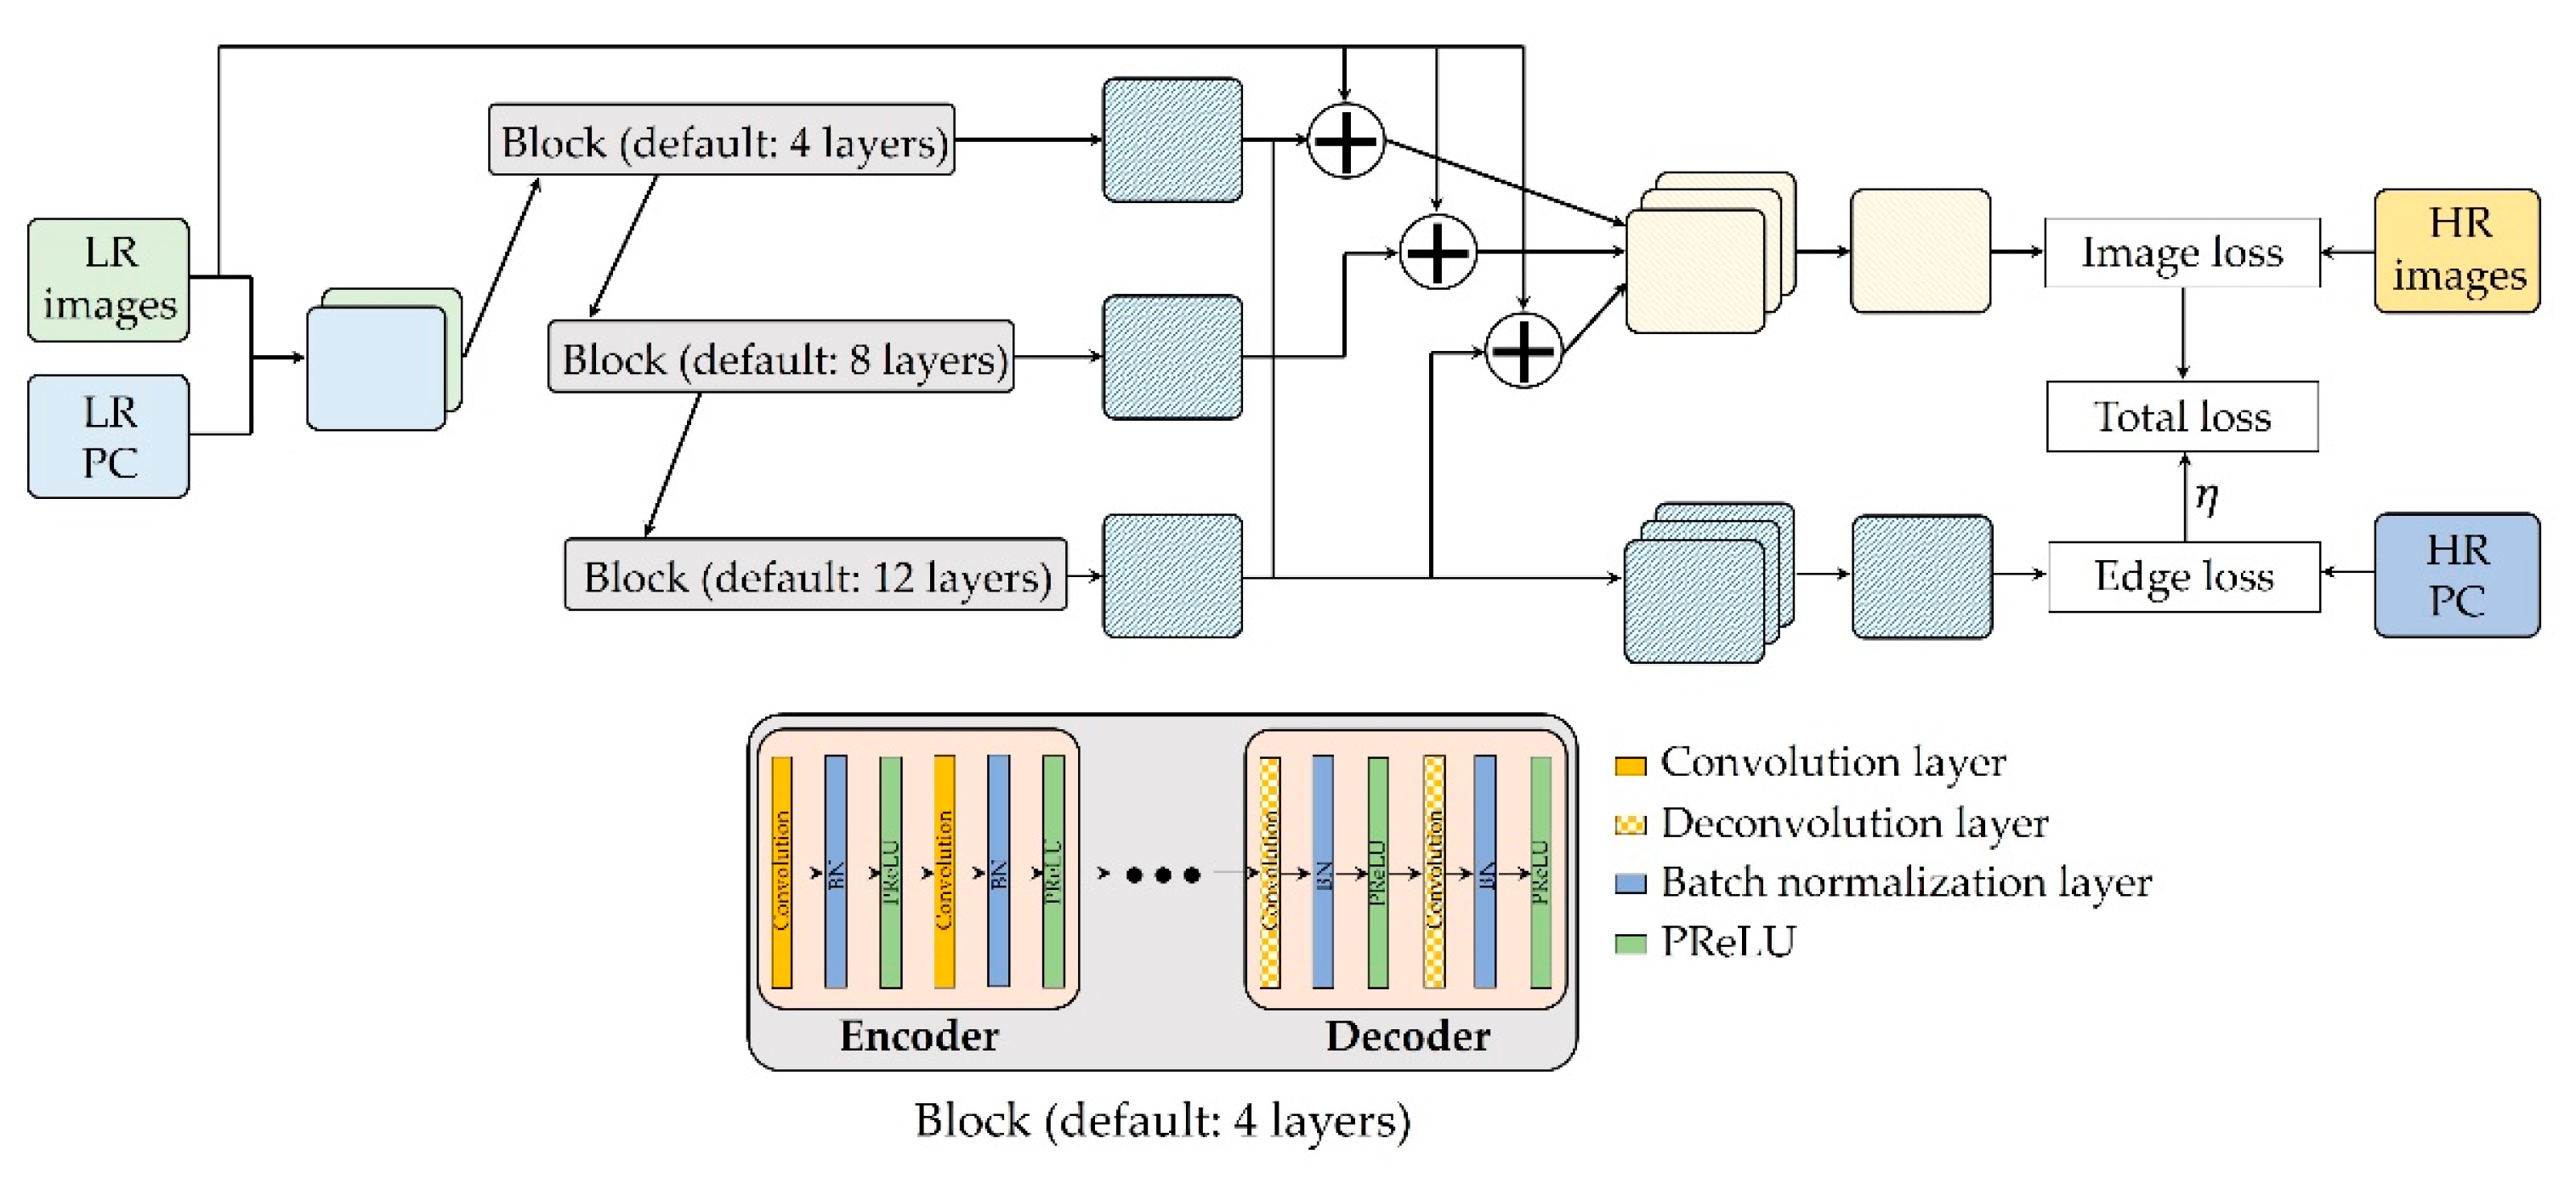
2.1. MSDEPC Model Based on Deep Learning for SISR in Ultrasound Imaging

Figure 1 shows a simplified illustration of the MSDEPC architecture for SISR and how it improves image sharpness. The LR image and its phase congruency (PC) image of the high-frequency component were used in a deep learning model.
High-frequency images contain information on areas representing edges, textures, corners, and other details, which provide information for improving the resolution when performing the SISR method. Existing edge extraction methods include Sobel, Canny, Prewitt, Scharr, Laplacian, and hybrid edge operators [29]. However, when the scale of the image changes, such as in multiresolution analysis (MRA), the position of the edge may not be consistent, or completely different problems may occur [25]. Kovesi introduced the PC principle to identify regions where considerable changes are in phase at the point of the step in a high-variation square wave [30,31]. Morrone and Owens mathematically defined PC by extending the Fourier series for position x as follows [31,32]:
P C x = W x inf E x T A x + ε ,
where W x expresses a weighting function for frequency spread, E x is local energy, T denotes the noise compensation, A x is the amplitude of the Fourier component, and ε is a small constant to avoid division by zero. The PC map has been used for edge detection because it prevents robust edge details in log-Gabor multiscale analysis subsampling images [25,30,33]. Instead of searching for points where there is a sudden change in intensity, this approach searches for order patterns in the phase components of Fourier transforms. PC defines a point as a feature in an image with a high phase order. This is similar to physiological evidence indicating that the human visual system responds strongly to points in highly aligned images with phase information. It has a series of advantages over other image feature detectors. Since the PC is proportional to the local energy of the signal, it can be calculated through the convolution of the original image with a spherical spatial filter bank such as Gabor filter [33]. The accurate extraction of local structures is possible, and edge detection without distortion is also possible in each sub-band in MRA. Considering the unique characteristics of edge detection in MRA, they improved the SISR by extracting PC edge maps and leveraging them to oversee the predictive accuracy during training. After combining the LR image with the PC edge map, prediction operations were performed in the multiscale network. This network consists of encoder and decoder blocks, with each basic block consisting of four layers. The entire network consists of three scale encoder–decoder symmetric networks using blocks of 1× (4 layers), 2× (8 layers), and 3× (12 layers). This block sequentially cascades the convolution and deconvolution layers of different lengths, and a multiscale deep encoder–decoder is constructed. Here, the convolution and deconvolution layers have the following properties: a kernel size of 3 × 3, stride = 1, and number of filters = 32 for 4 and 8 layers and 64 for 12 layers. Each block is connected by side outputs, as in existing studies [34,35]. The hidden layers were created based on the initial convolutional layer, batch normalization (BN) layer [36], and PReLU [37] followed into this architecture. The total loss function can be represented as follows:
L o s s Θ i = 1 N F L i , Θ H i 2 + η i = 1 N F L e , i , Θ H e , i 2 ,
where { L i , H i } represents the i-thextracted LR and HR image pairs, { L e , i , H e , i } are the i t h extracted PC edge images of LR and HR, F · denotes the model function, and Θ are learned parameters of the network model. η is the balancing parameter between the F L , Θ H 2 and F L e , Θ H e 2 , and the optimizer we used was the Adam optimizer [38]. Here, the learning rate is 0.001, and η is set to 0.3 empirically. Finally, SISR is performed using the trained resolution restoration model to obtain an HR ultrasound image.

2.2. Datasets

This study was conducted using simulated and actual clinical ultrasound images. The Field 2 program, which has been well validated for ultrasound image modeling, was used as a simulation tool. The program was modeled based on the spatial impulse responses proposed by Tupholme and designed to easily acquire various B-mode ultrasound images [39,40]. To analyze the applicability of the proposed algorithm in various areas, images of the carotid artery, a liver hemangioma, breast malignancy, a thyroid carcinoma, and obstetric nuchal translucency were selected.
We used two types of public data for training. Zukal et al. established an arterial ultrasound imaging database (http://splab.cz/en/download/databaze/ultrasound (accessed on 3 April 2023)). The database contains B-mode images of the common carotid artery of ten volunteers (mean age 27.5 ± 3.5 years) of varying weights (mean weight 76.5 ± 9.7 kg) taken by an expert with at least 5 years of experience in arterial scanning. Images provided by the Signal Processing Laboratory and Ultrasound Cases were used to acquire clinical ultrasound image data. Another database we used is an open database (https://www.ultrasoundcases.info/cases/abdomen-and-retroperitoneum (accessed on 3 April 2023)) offered by FujiFilm Healthcare Europe and SonoSkills (founder: Marc Schmitz, Date of establishment: 2010). This database provides access to 7673 cases and 59,357 ultrasound images and clips. In this study, the data ratio used for testing and training was set to 3:7, and the ratio of the validation and training sets during training was 3:7. We used a normal workstation (OS: Windows 10, CPU: 2.13 GHz, RAM: 64 GB), the PyTorch library (device condition: GPU (Titan Xp, 12 GB), and CPU (Intel Xeon, 3 GHz)) for deep learning, and MATLAB software (R2022a, MathWorks, Natick, MA, USA) for image display and quantitative evaluation.

2.3. Quantitative Evaluations of Image Quality

Parameters that confirmed the spatial resolution and similarity were used as quantitative evaluation methods to evaluate the usefulness of the proposed algorithm. In the simulation study, the spatial resolution was analyzed by deriving the FWHM value through intensity profile acquisition, and the similarity was evaluated using the PSNR and SSIM evaluation parameters. We attempted to prove the usefulness of the proposed algorithm by analyzing the PSNR and SSIM of real clinical ultrasound images. The formulas for calculating PSNR and SSIM are as follows:
P S N R = 10 × l o g ( M A X I 2 M S E )
S S I M x , y = ( 2 μ x μ y + C 1 ) ( 2 σ x y + C 2 ) ( μ x 2 + μ y 2 + C 1 ) ( σ x 2 + σ y 2 + C 2 )  
where M A X I is the maximum pixel value, M S E is the mean squared error, μ x , μ y are the average luminance values of each image, respectively; σ x , σ y are the standard deviations of each image, respectively; and σ x y is the covariance between the two images.

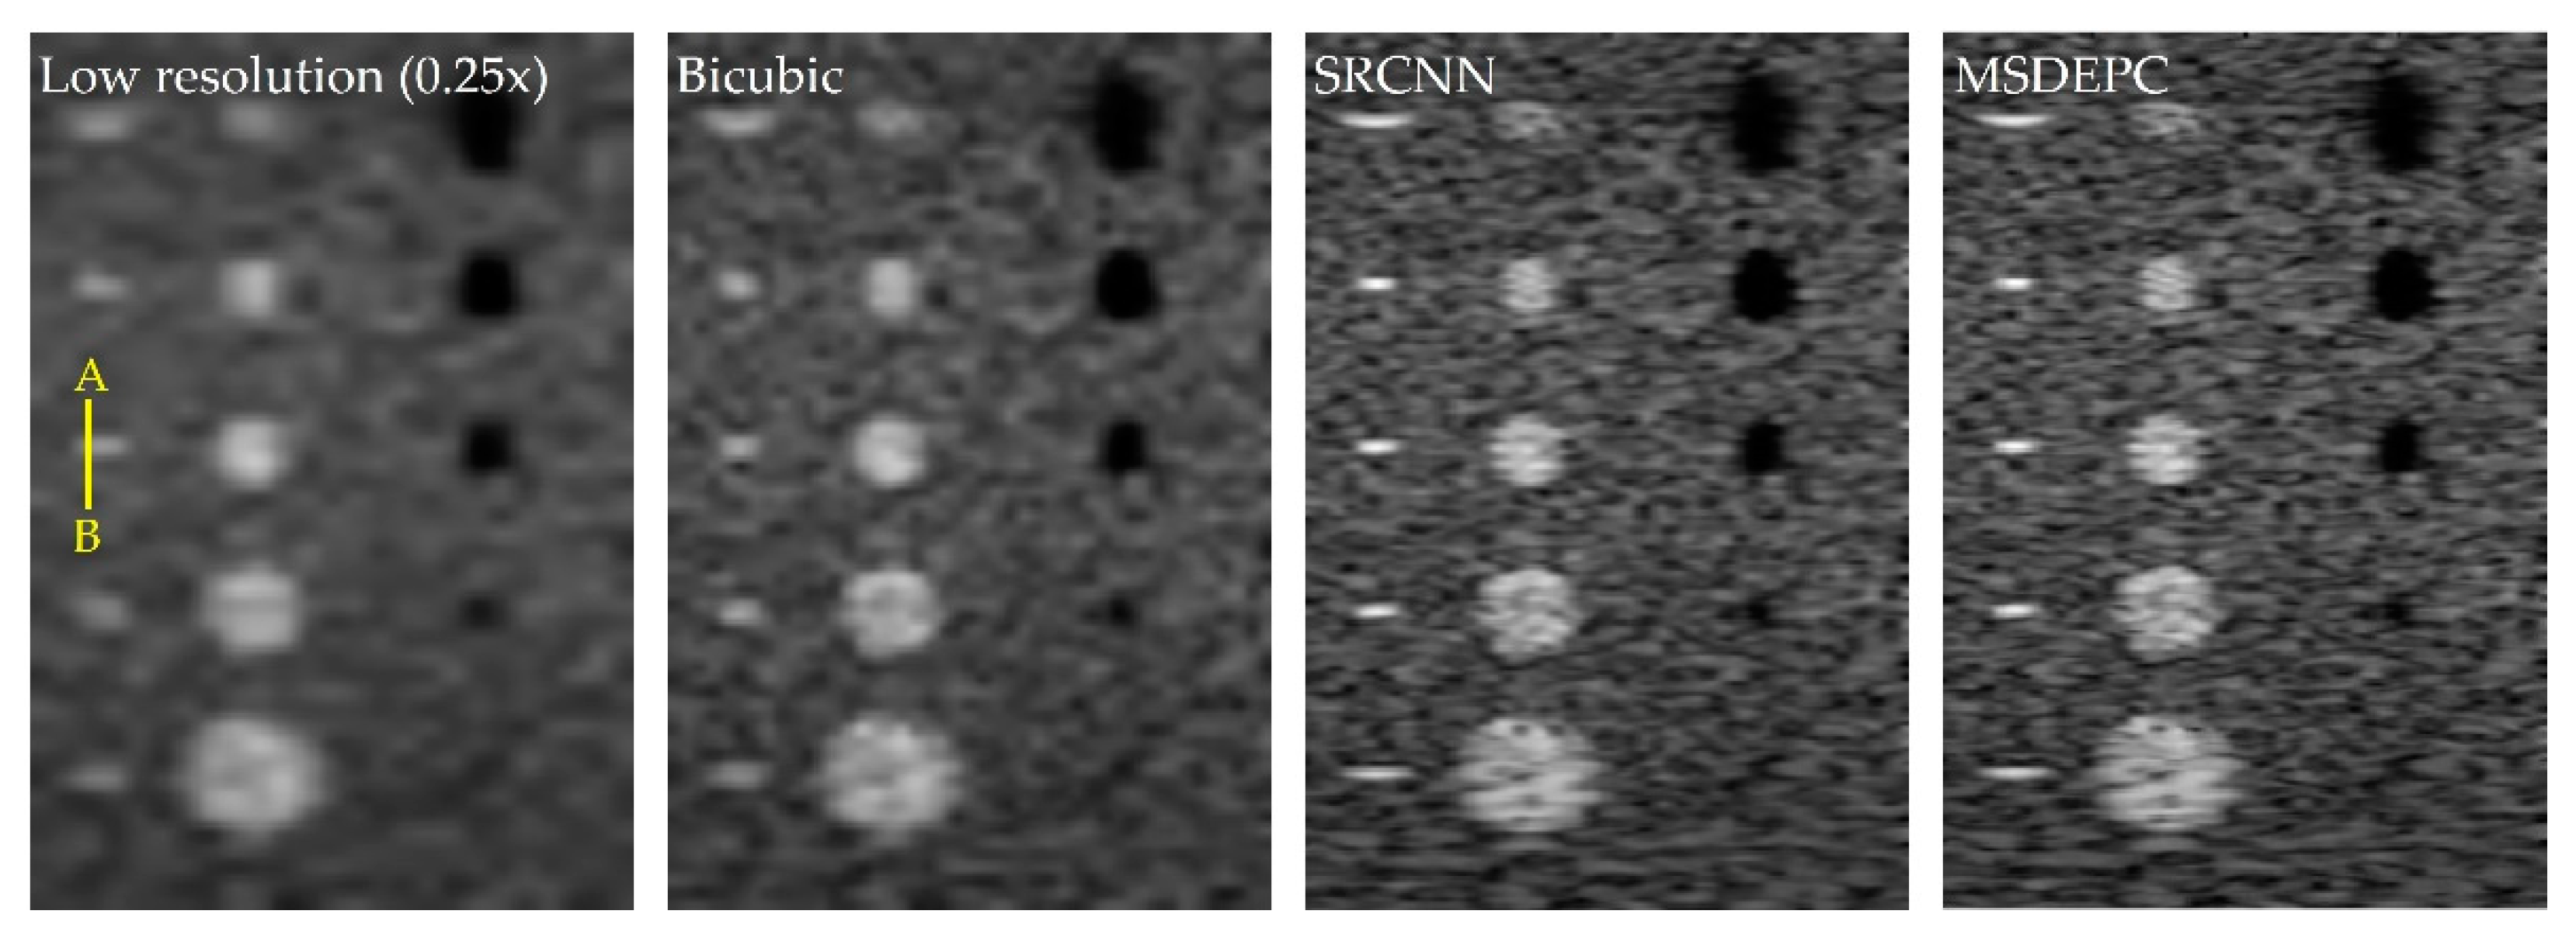
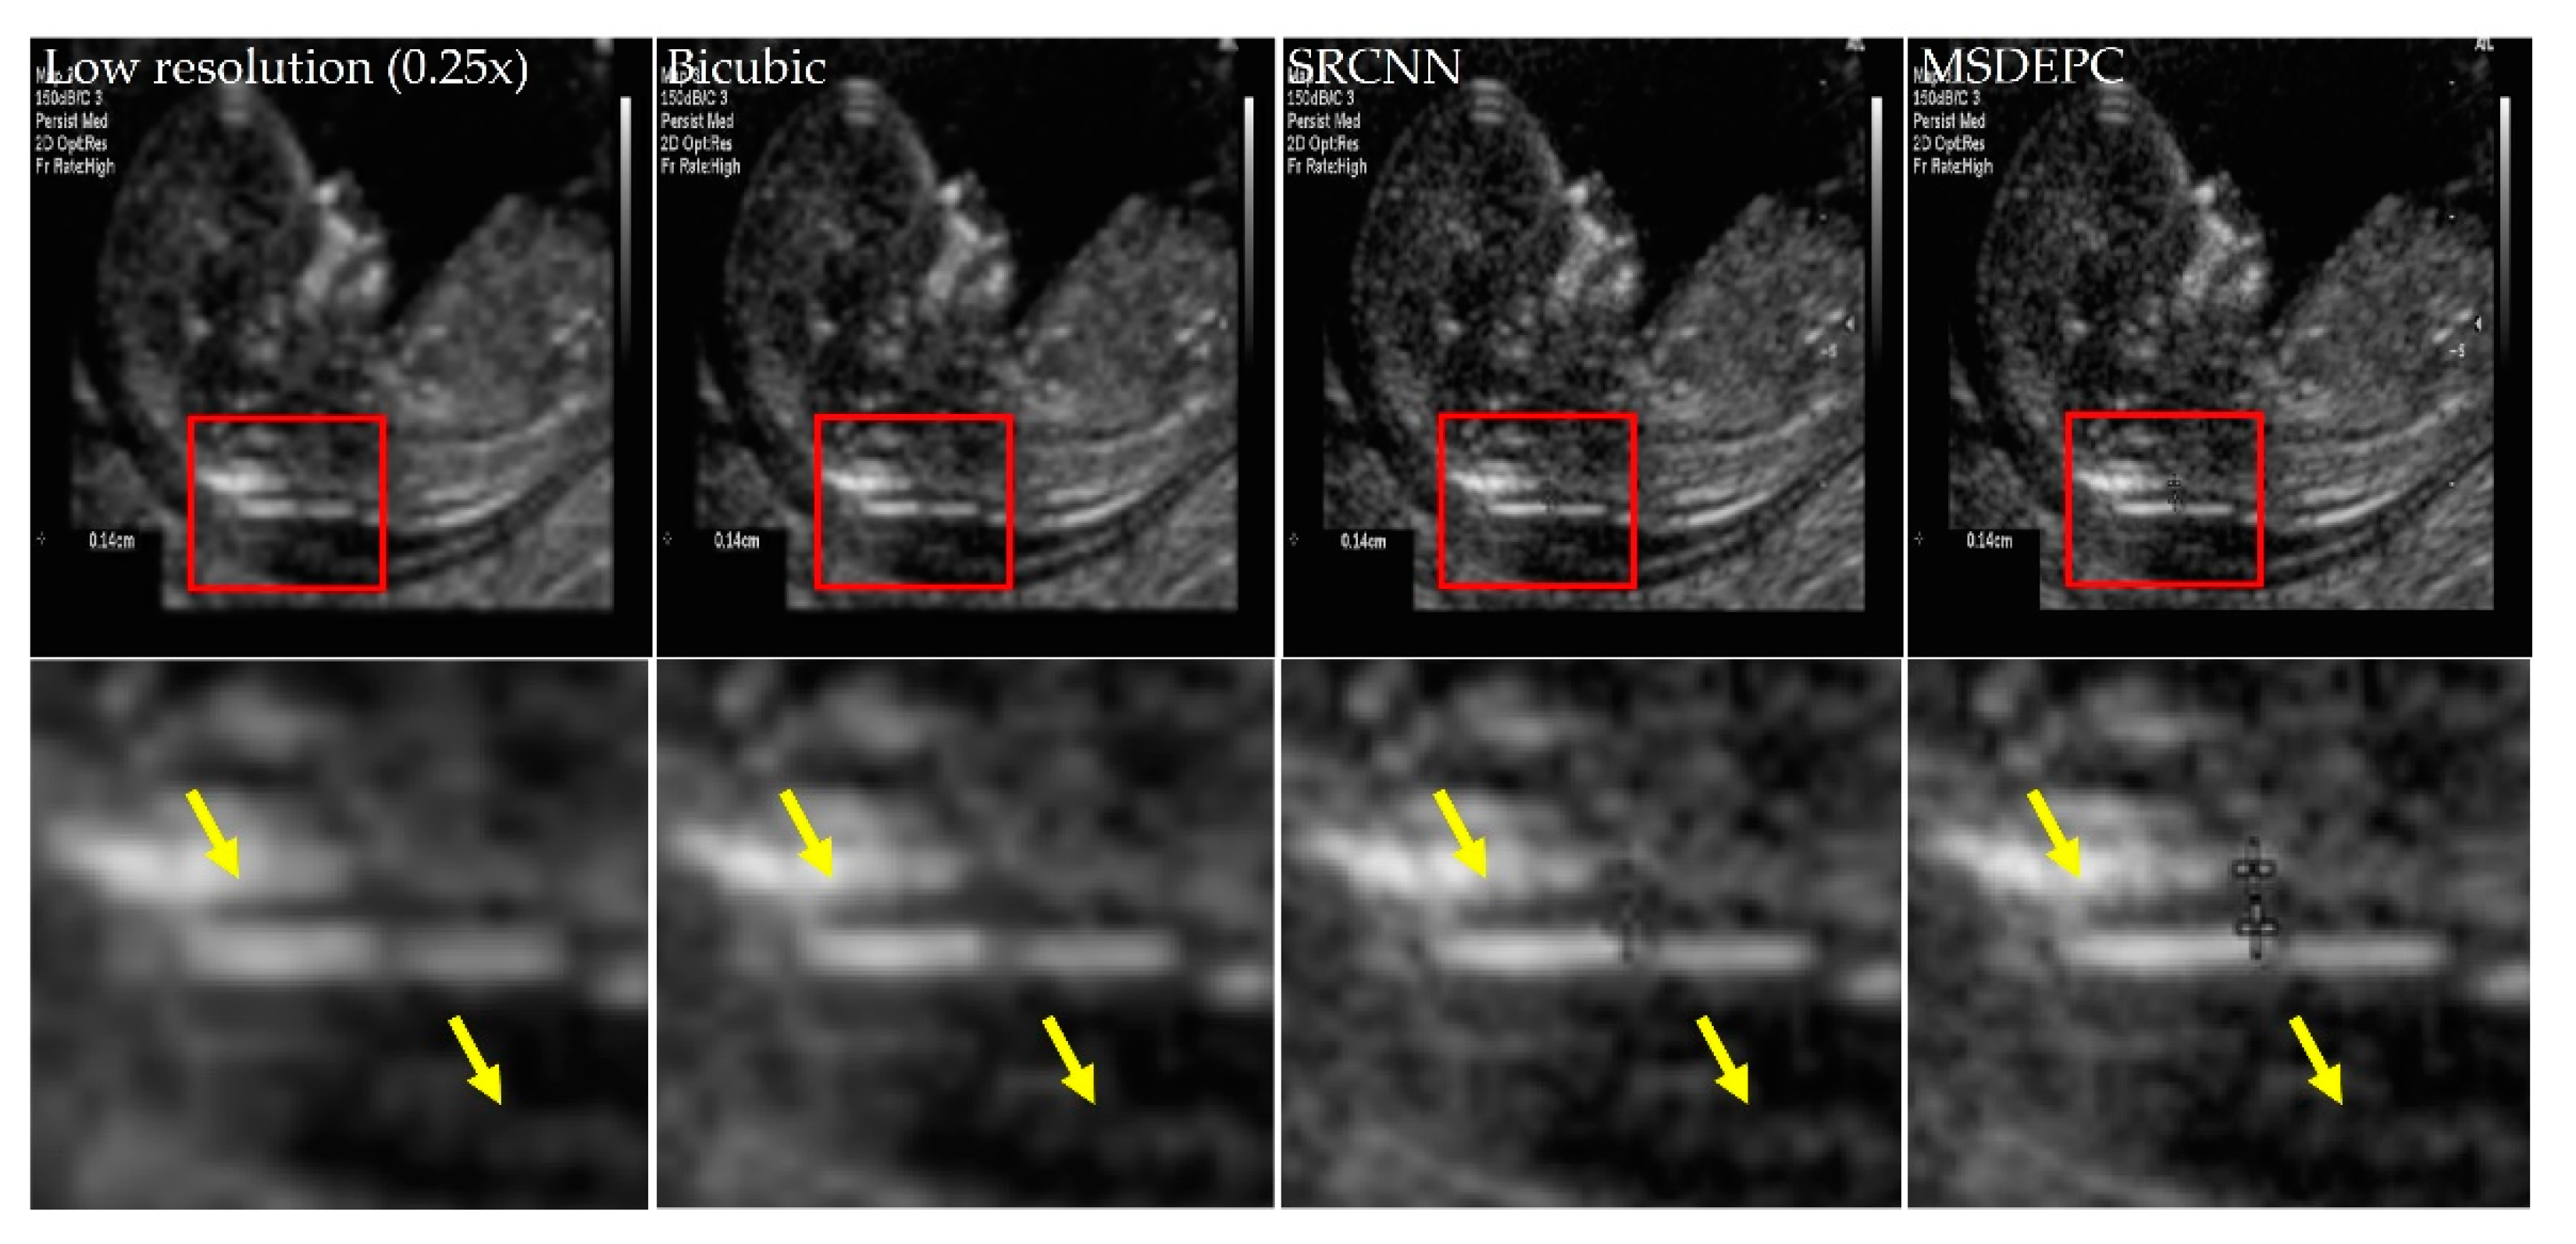
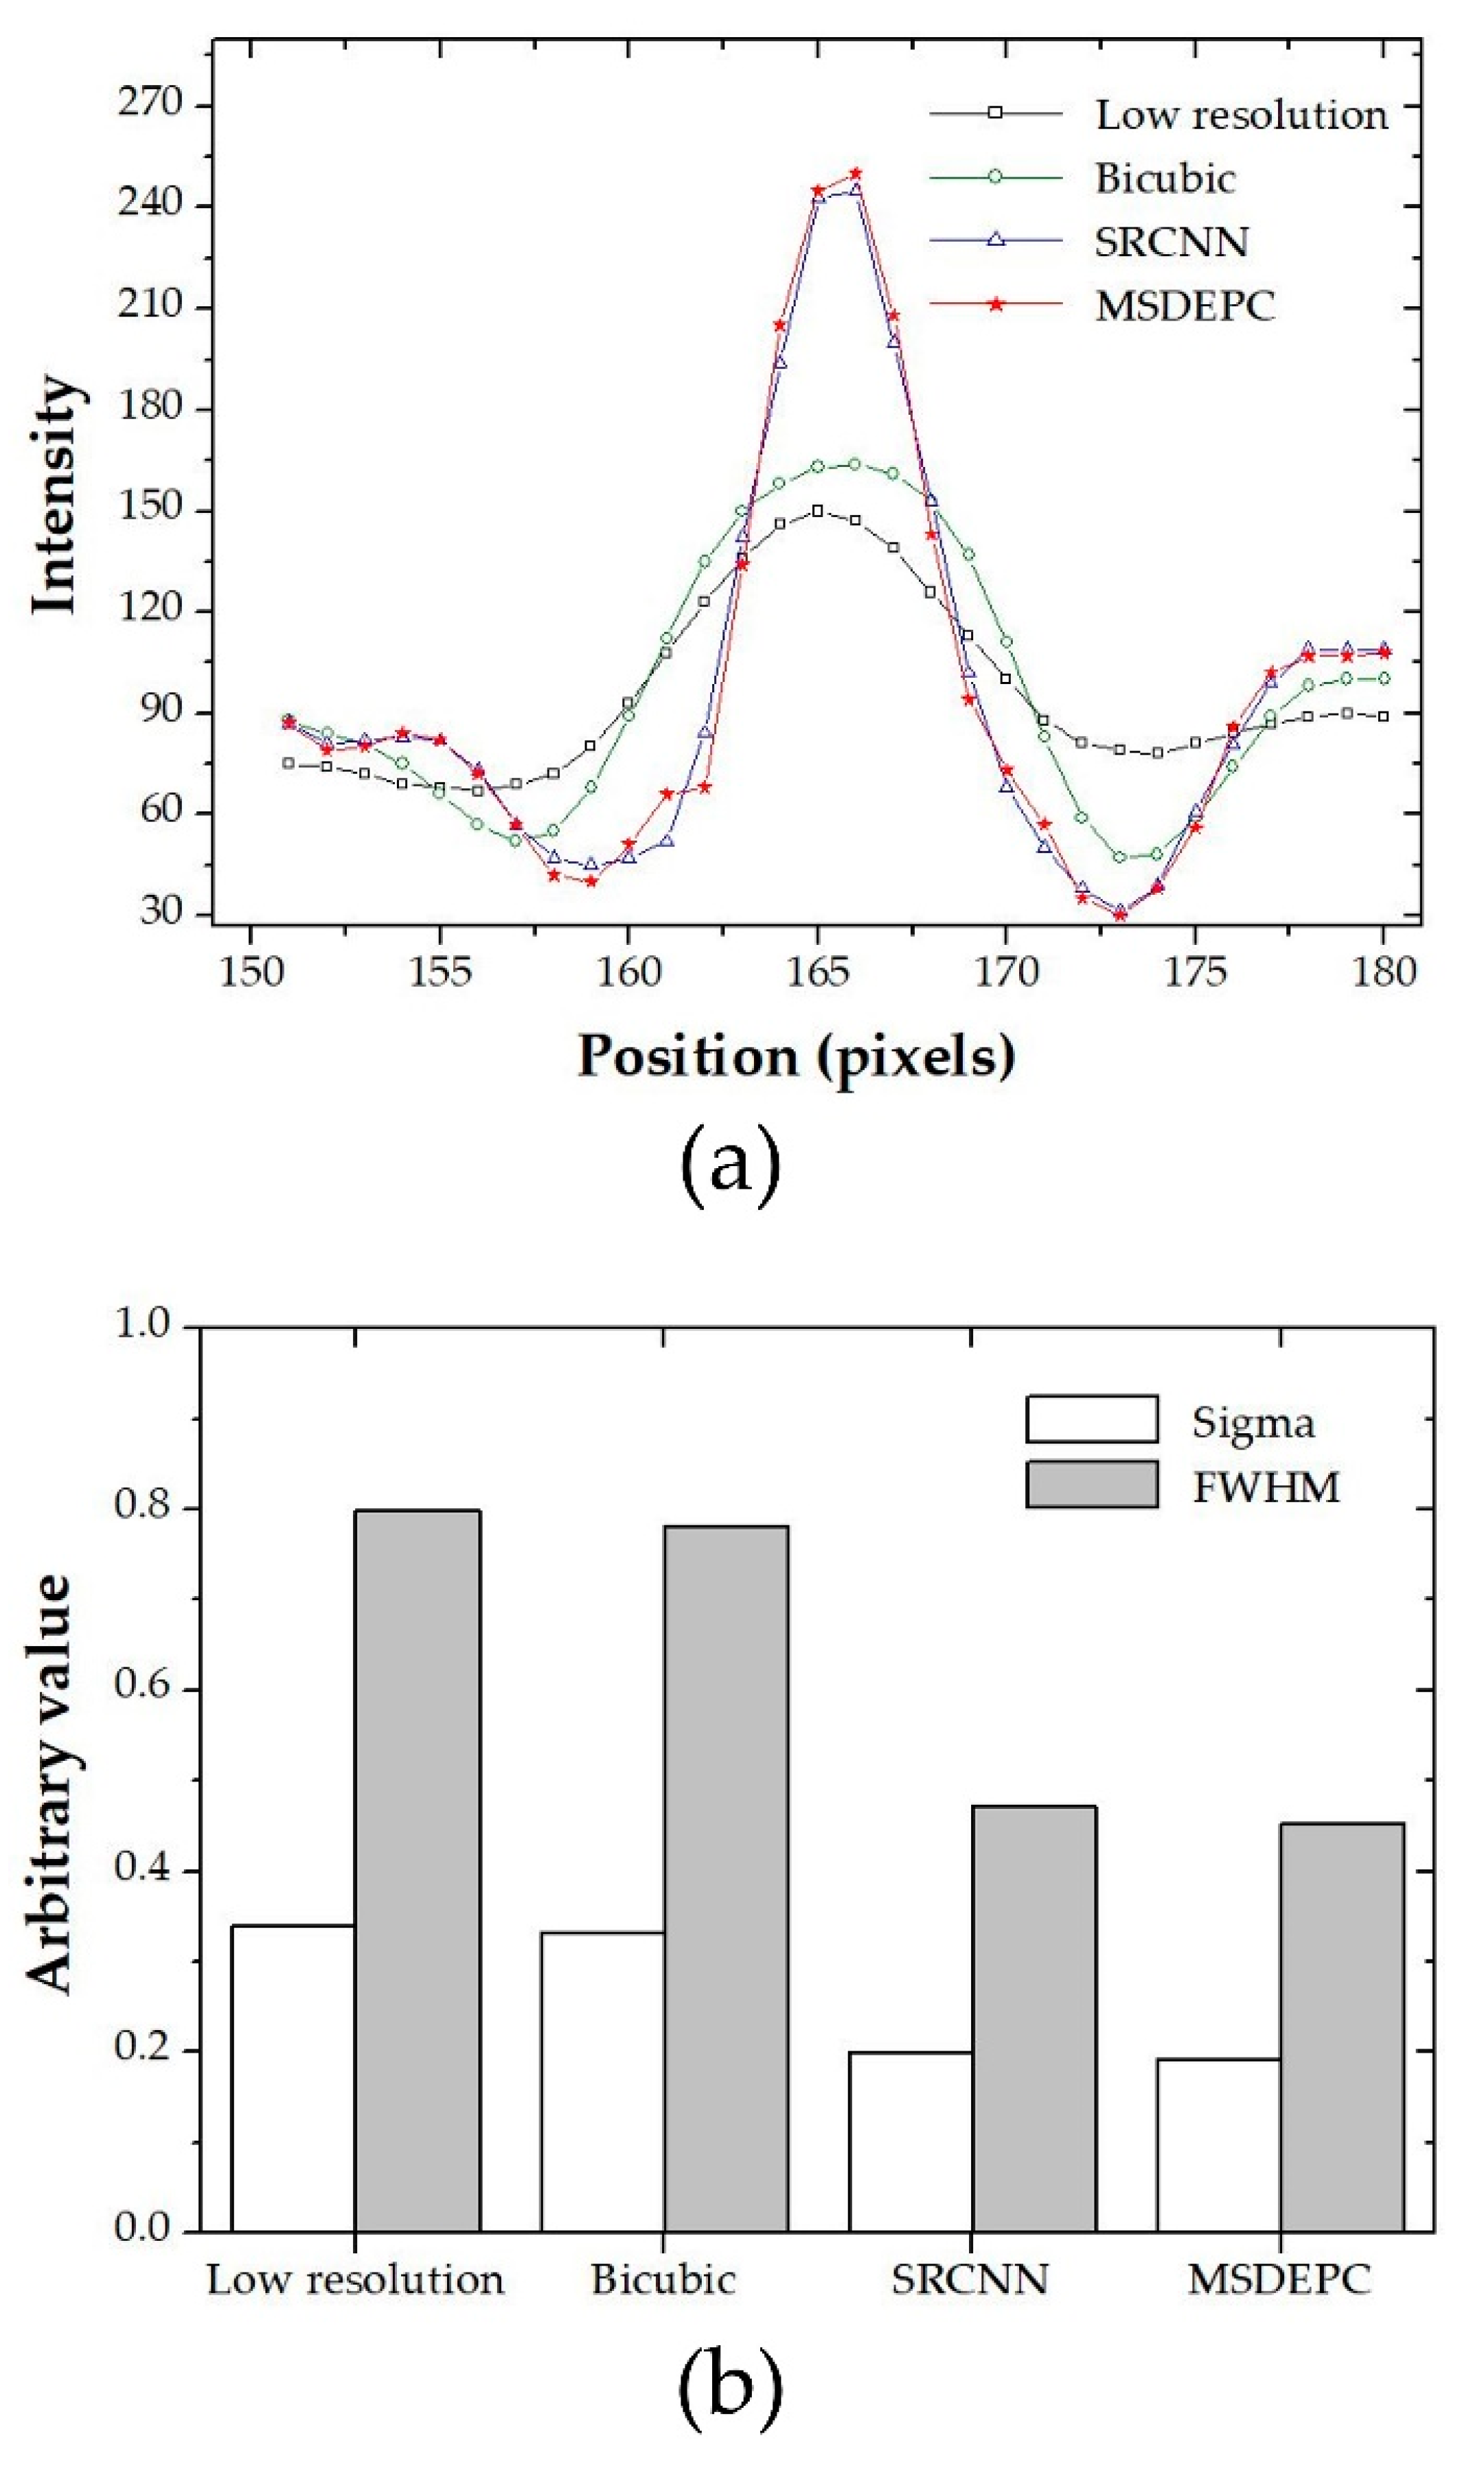
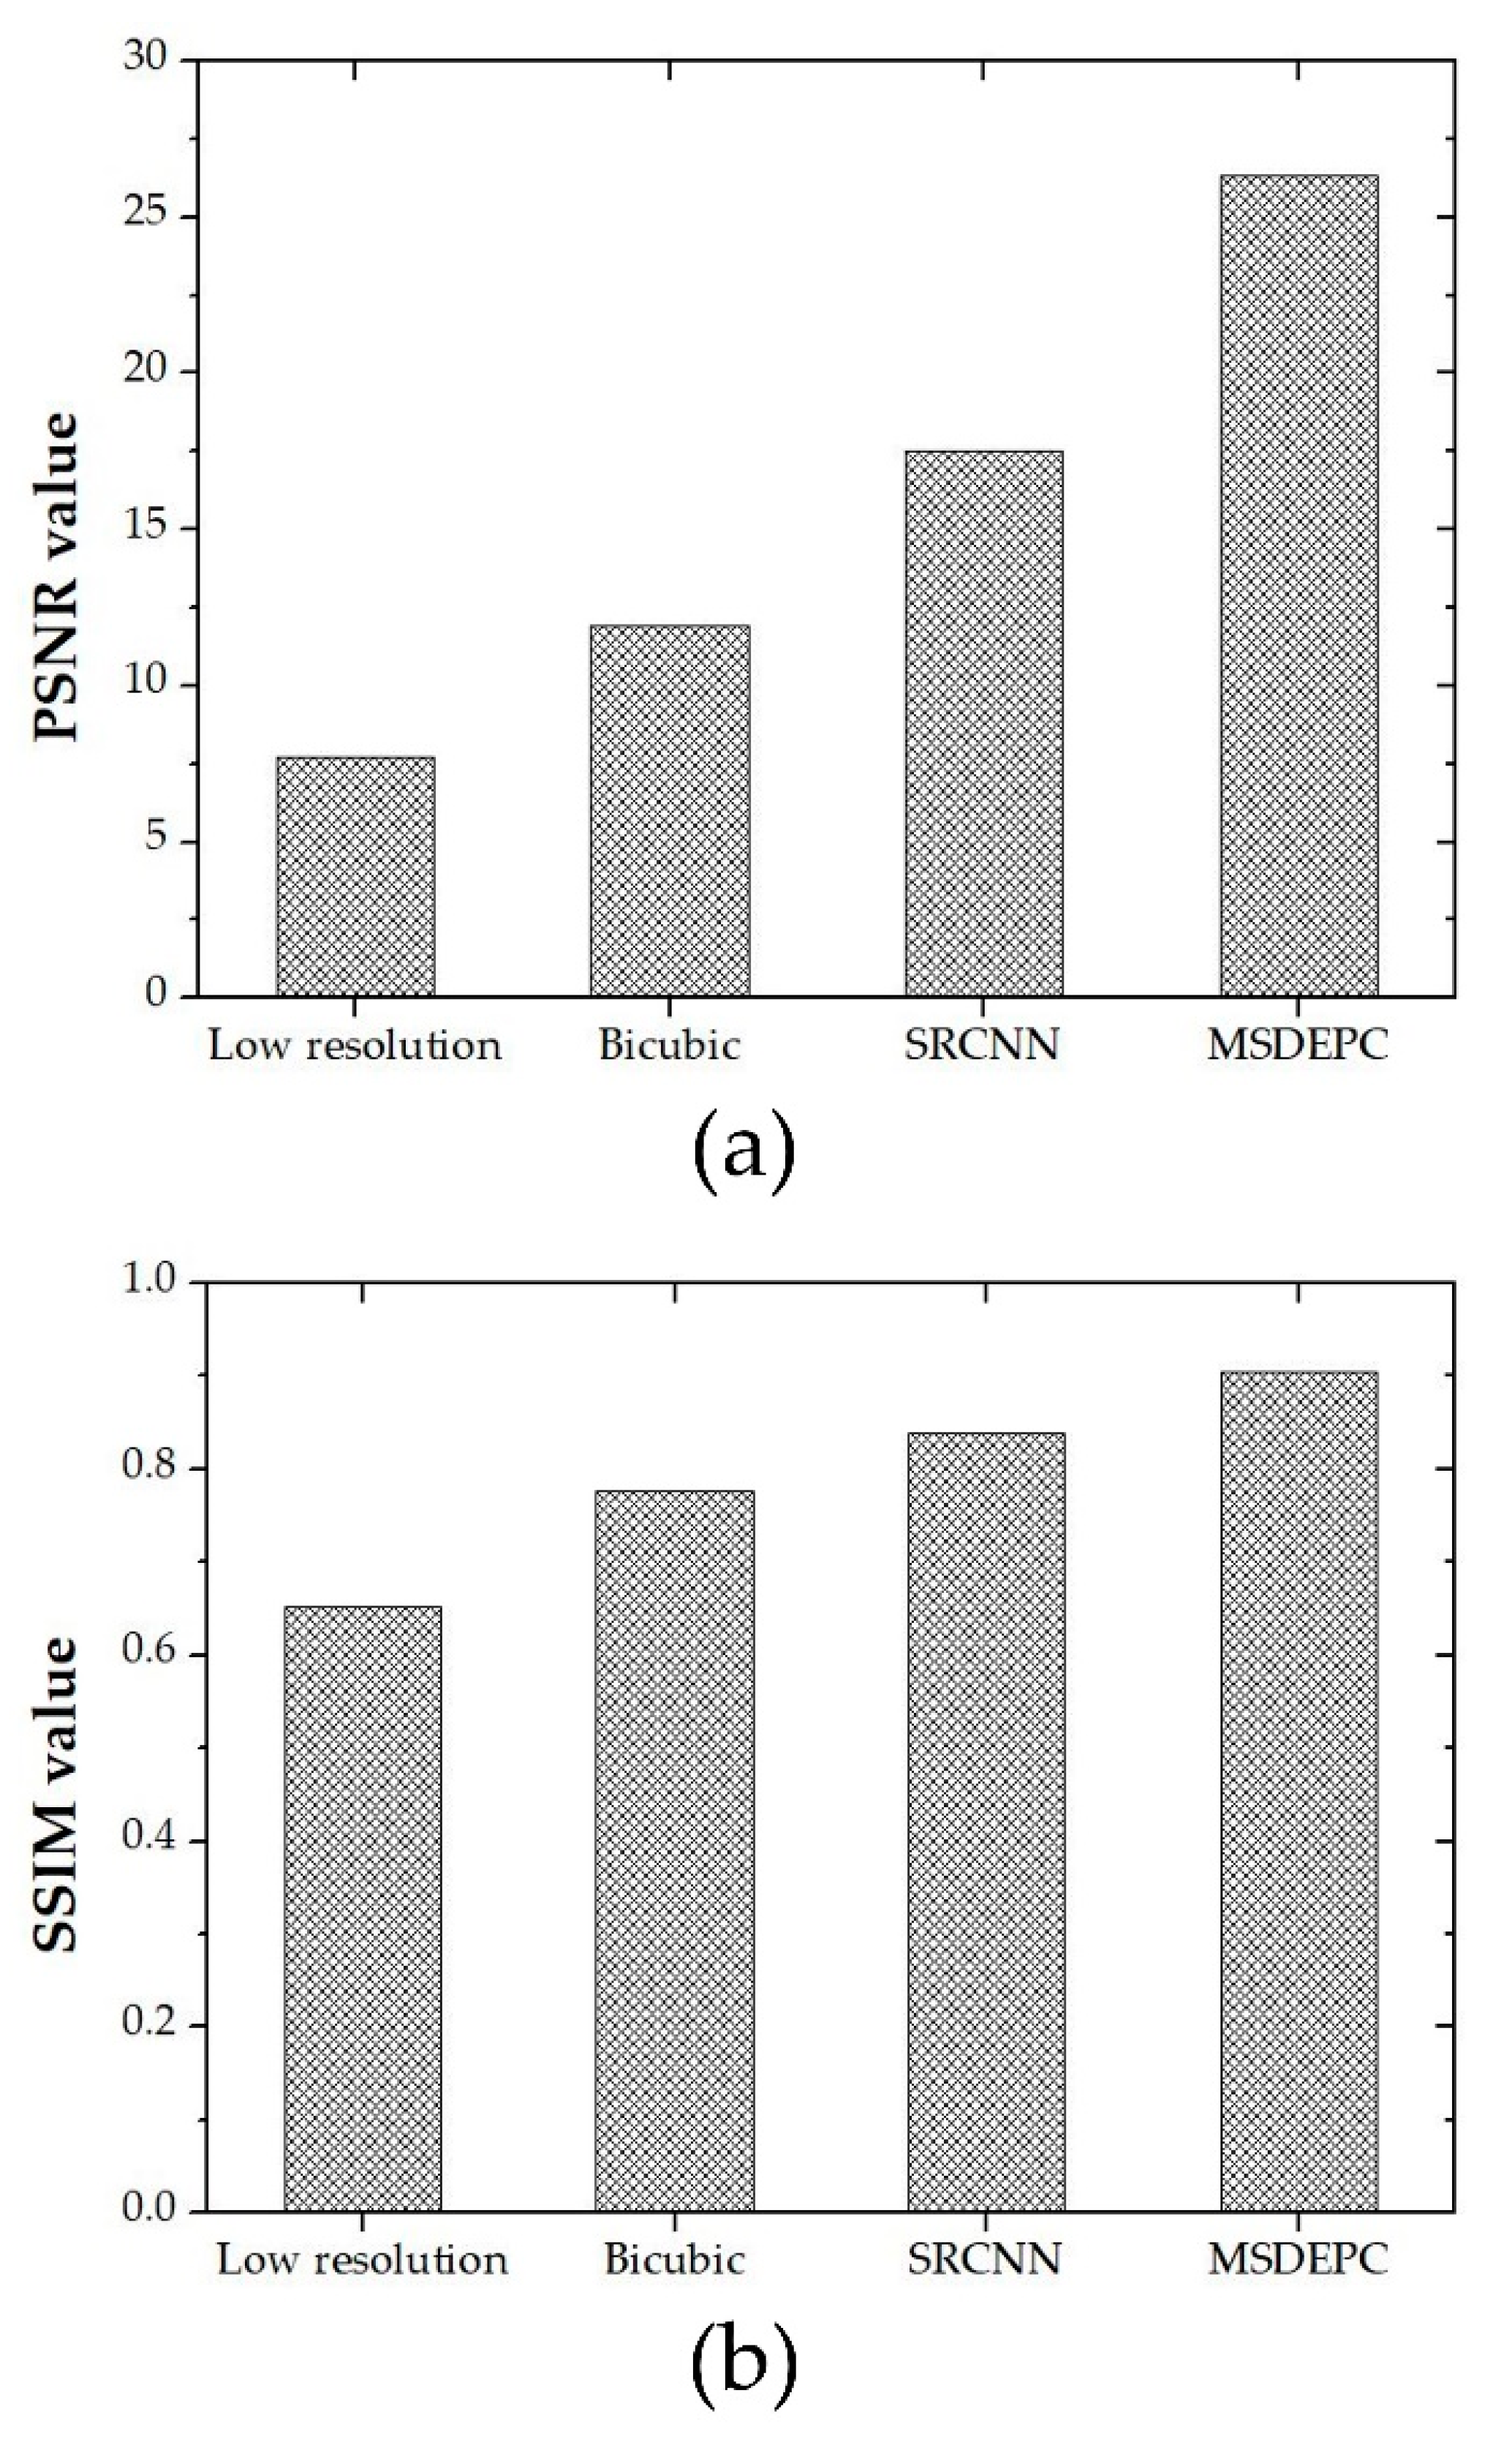
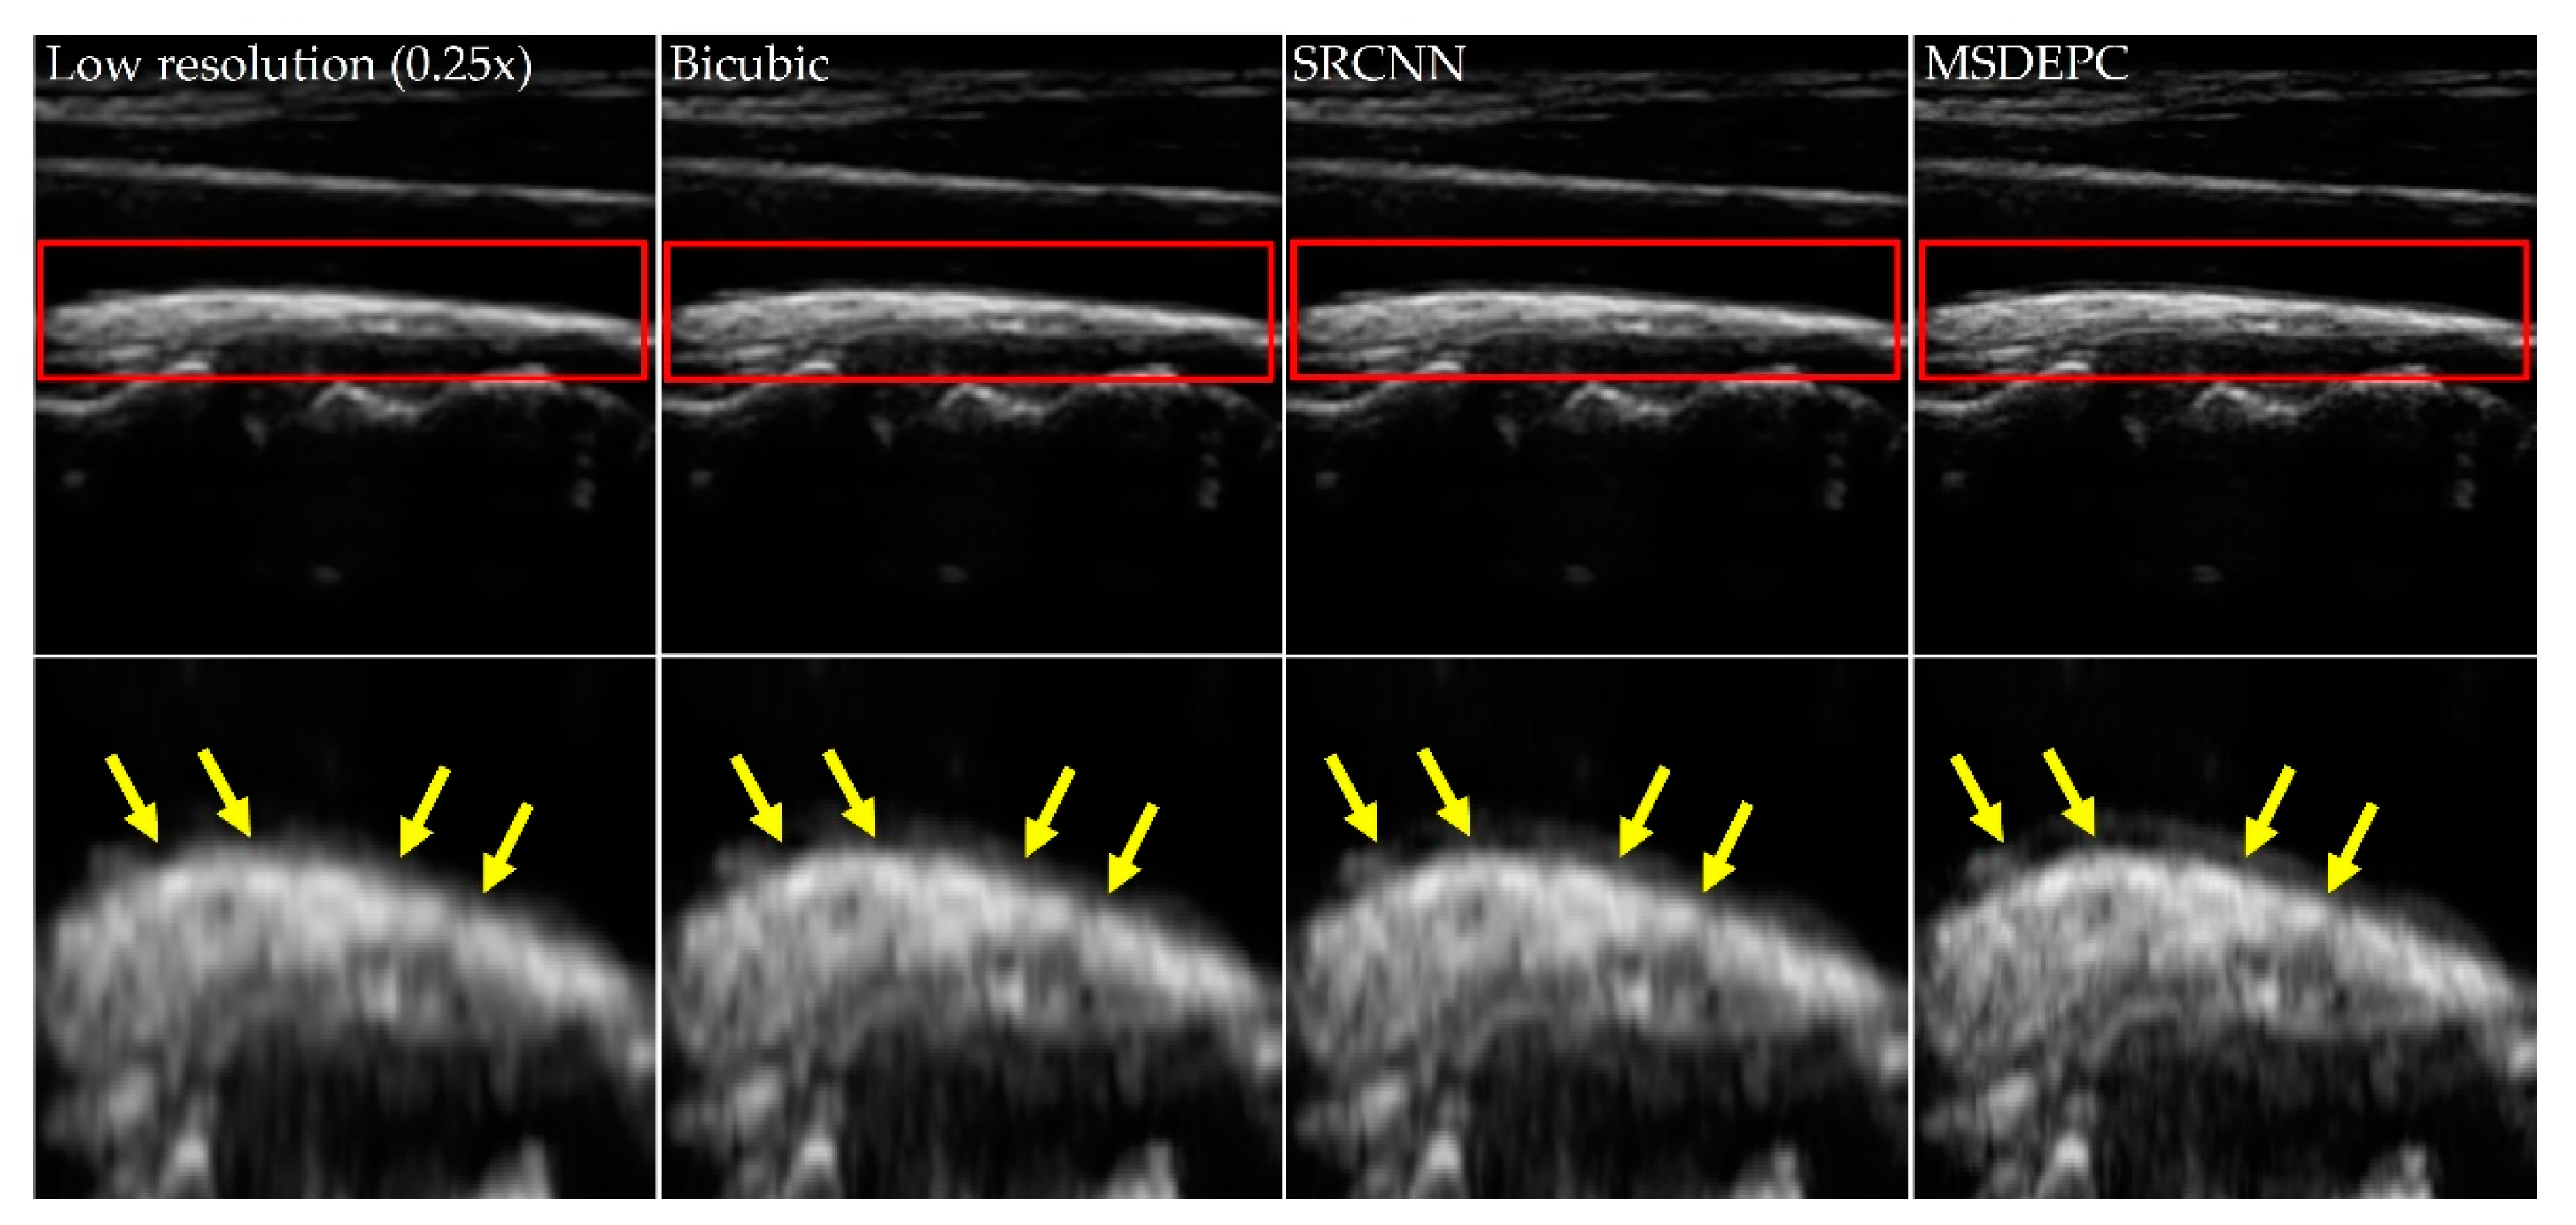
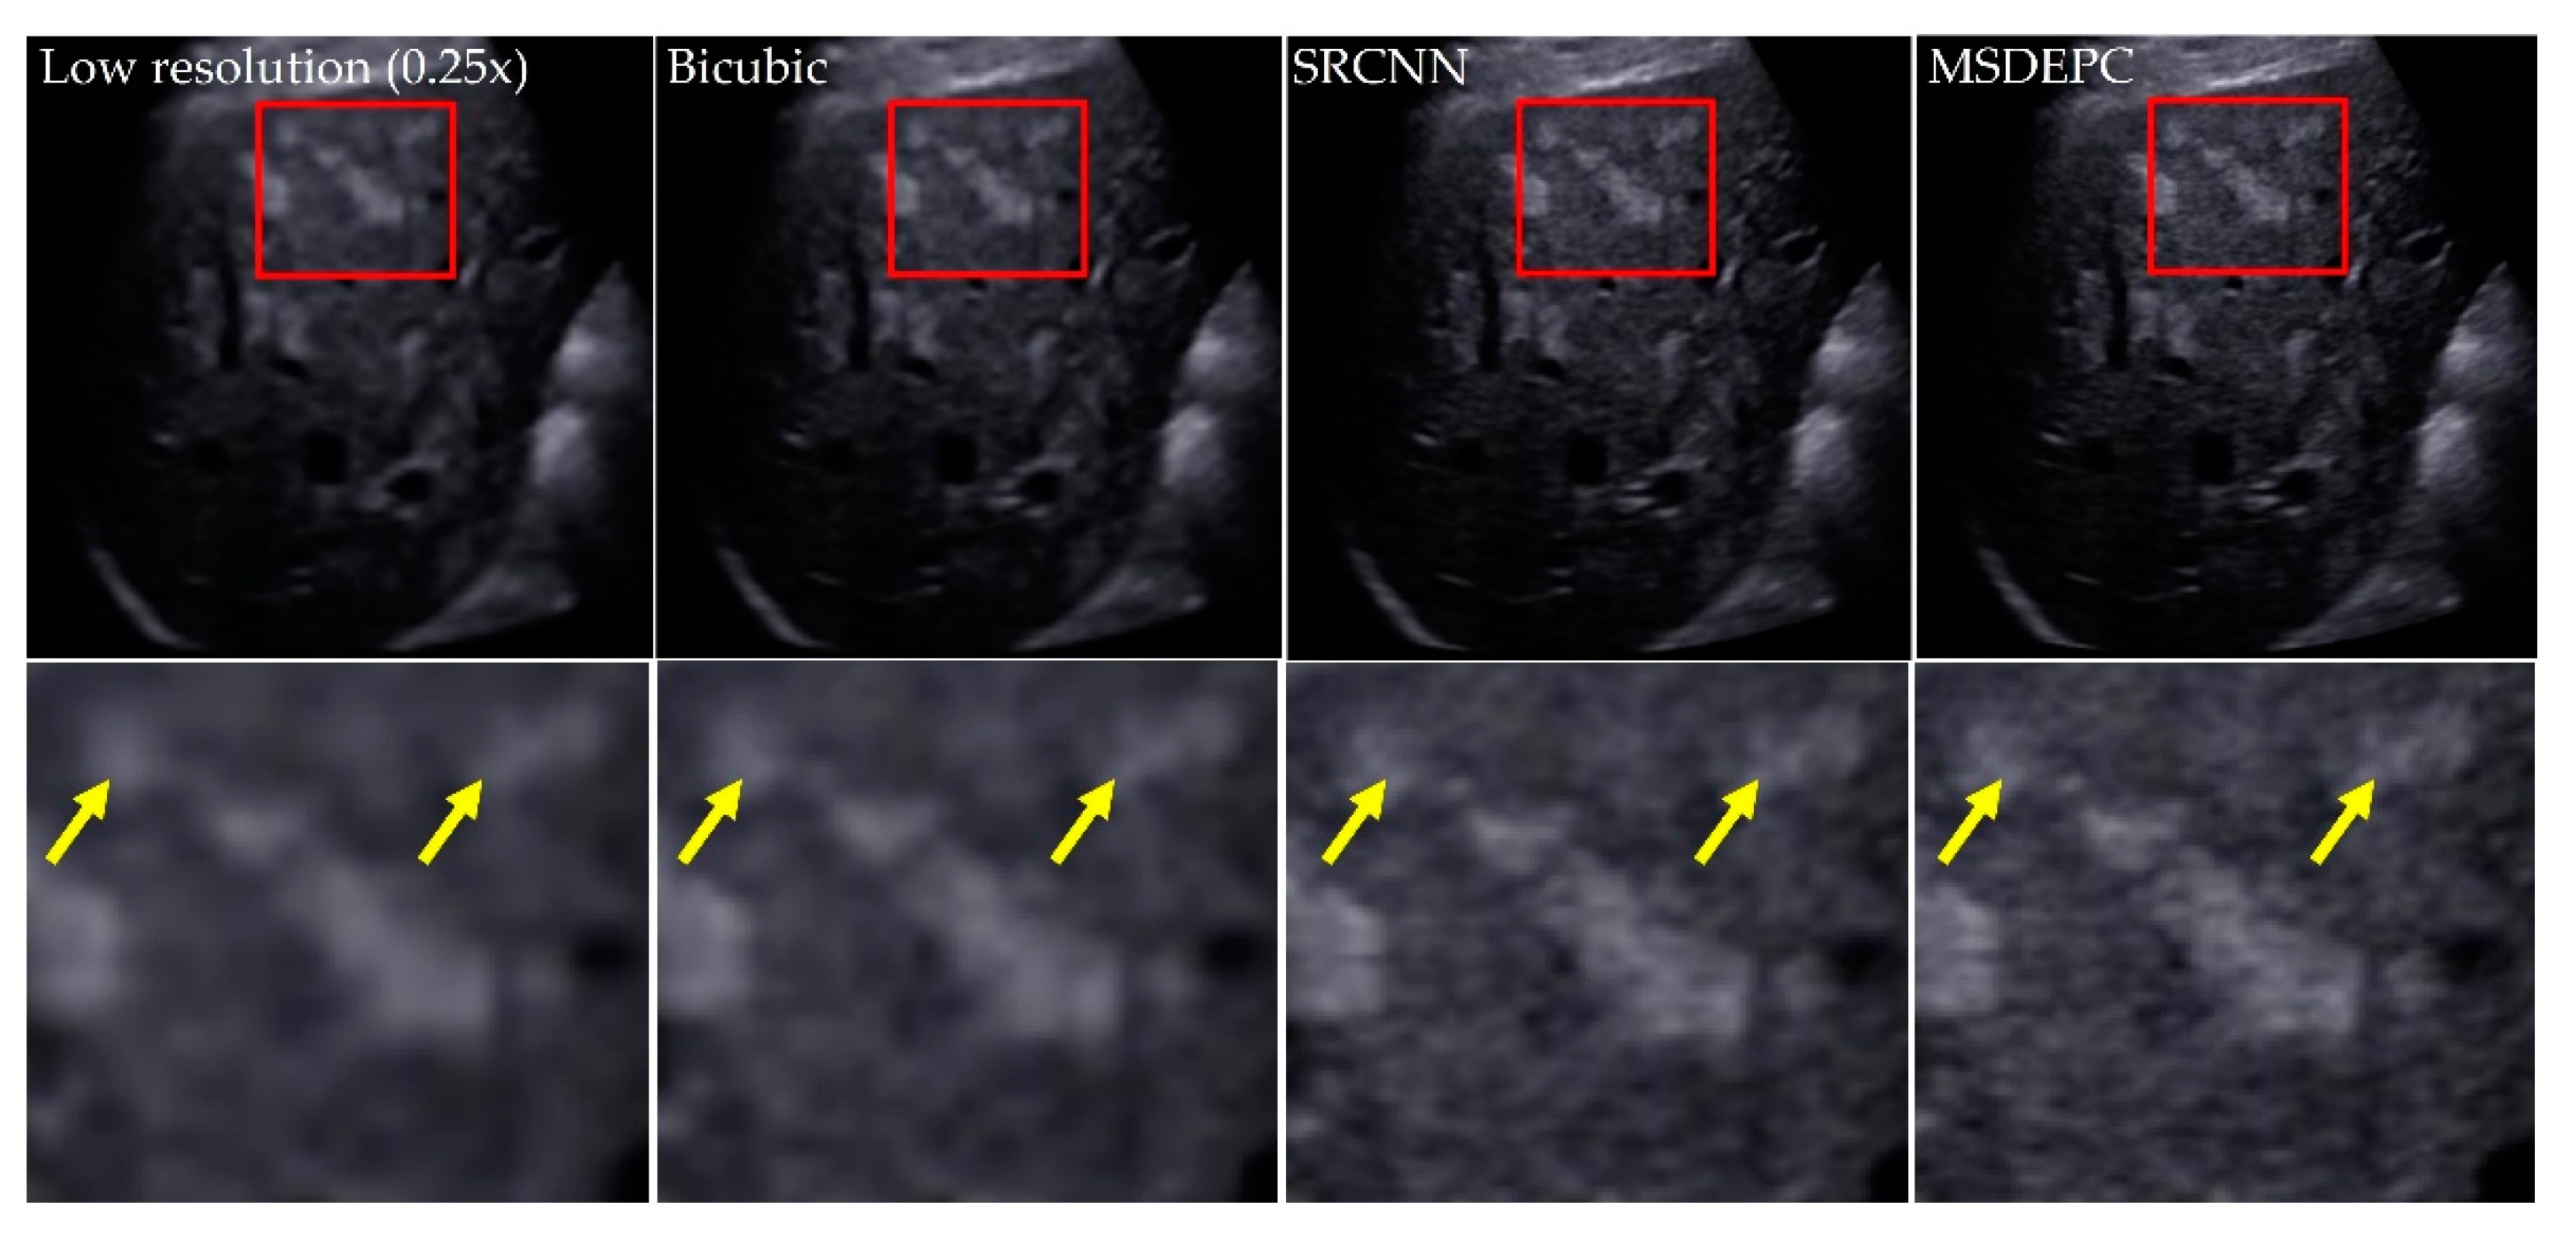
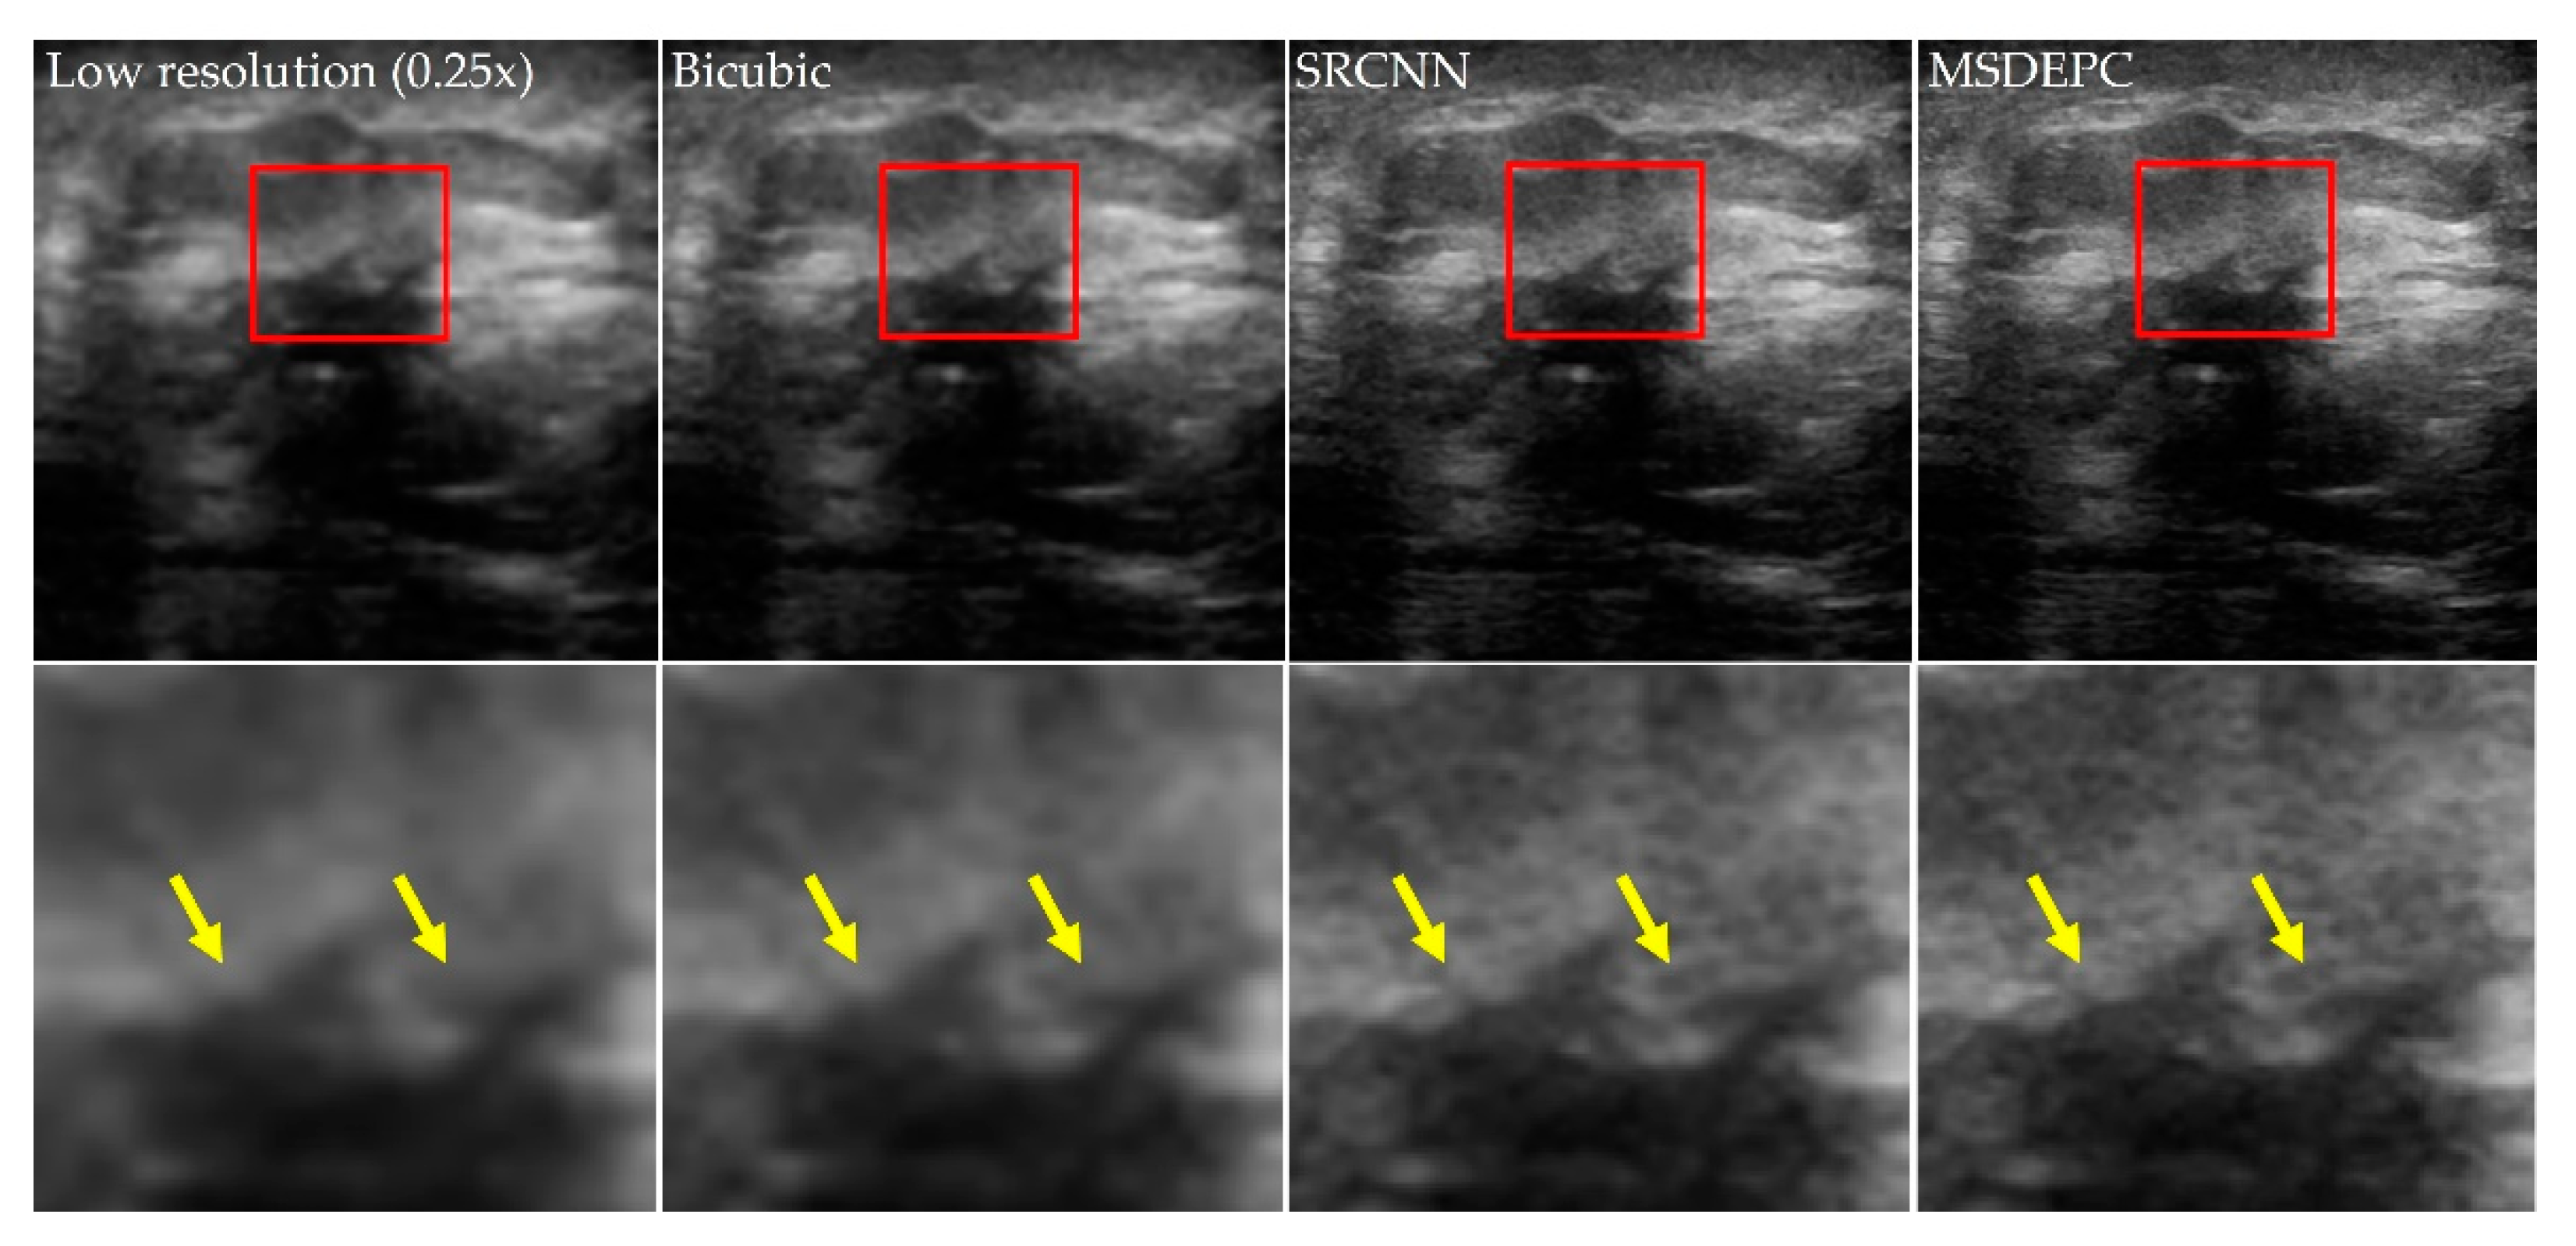
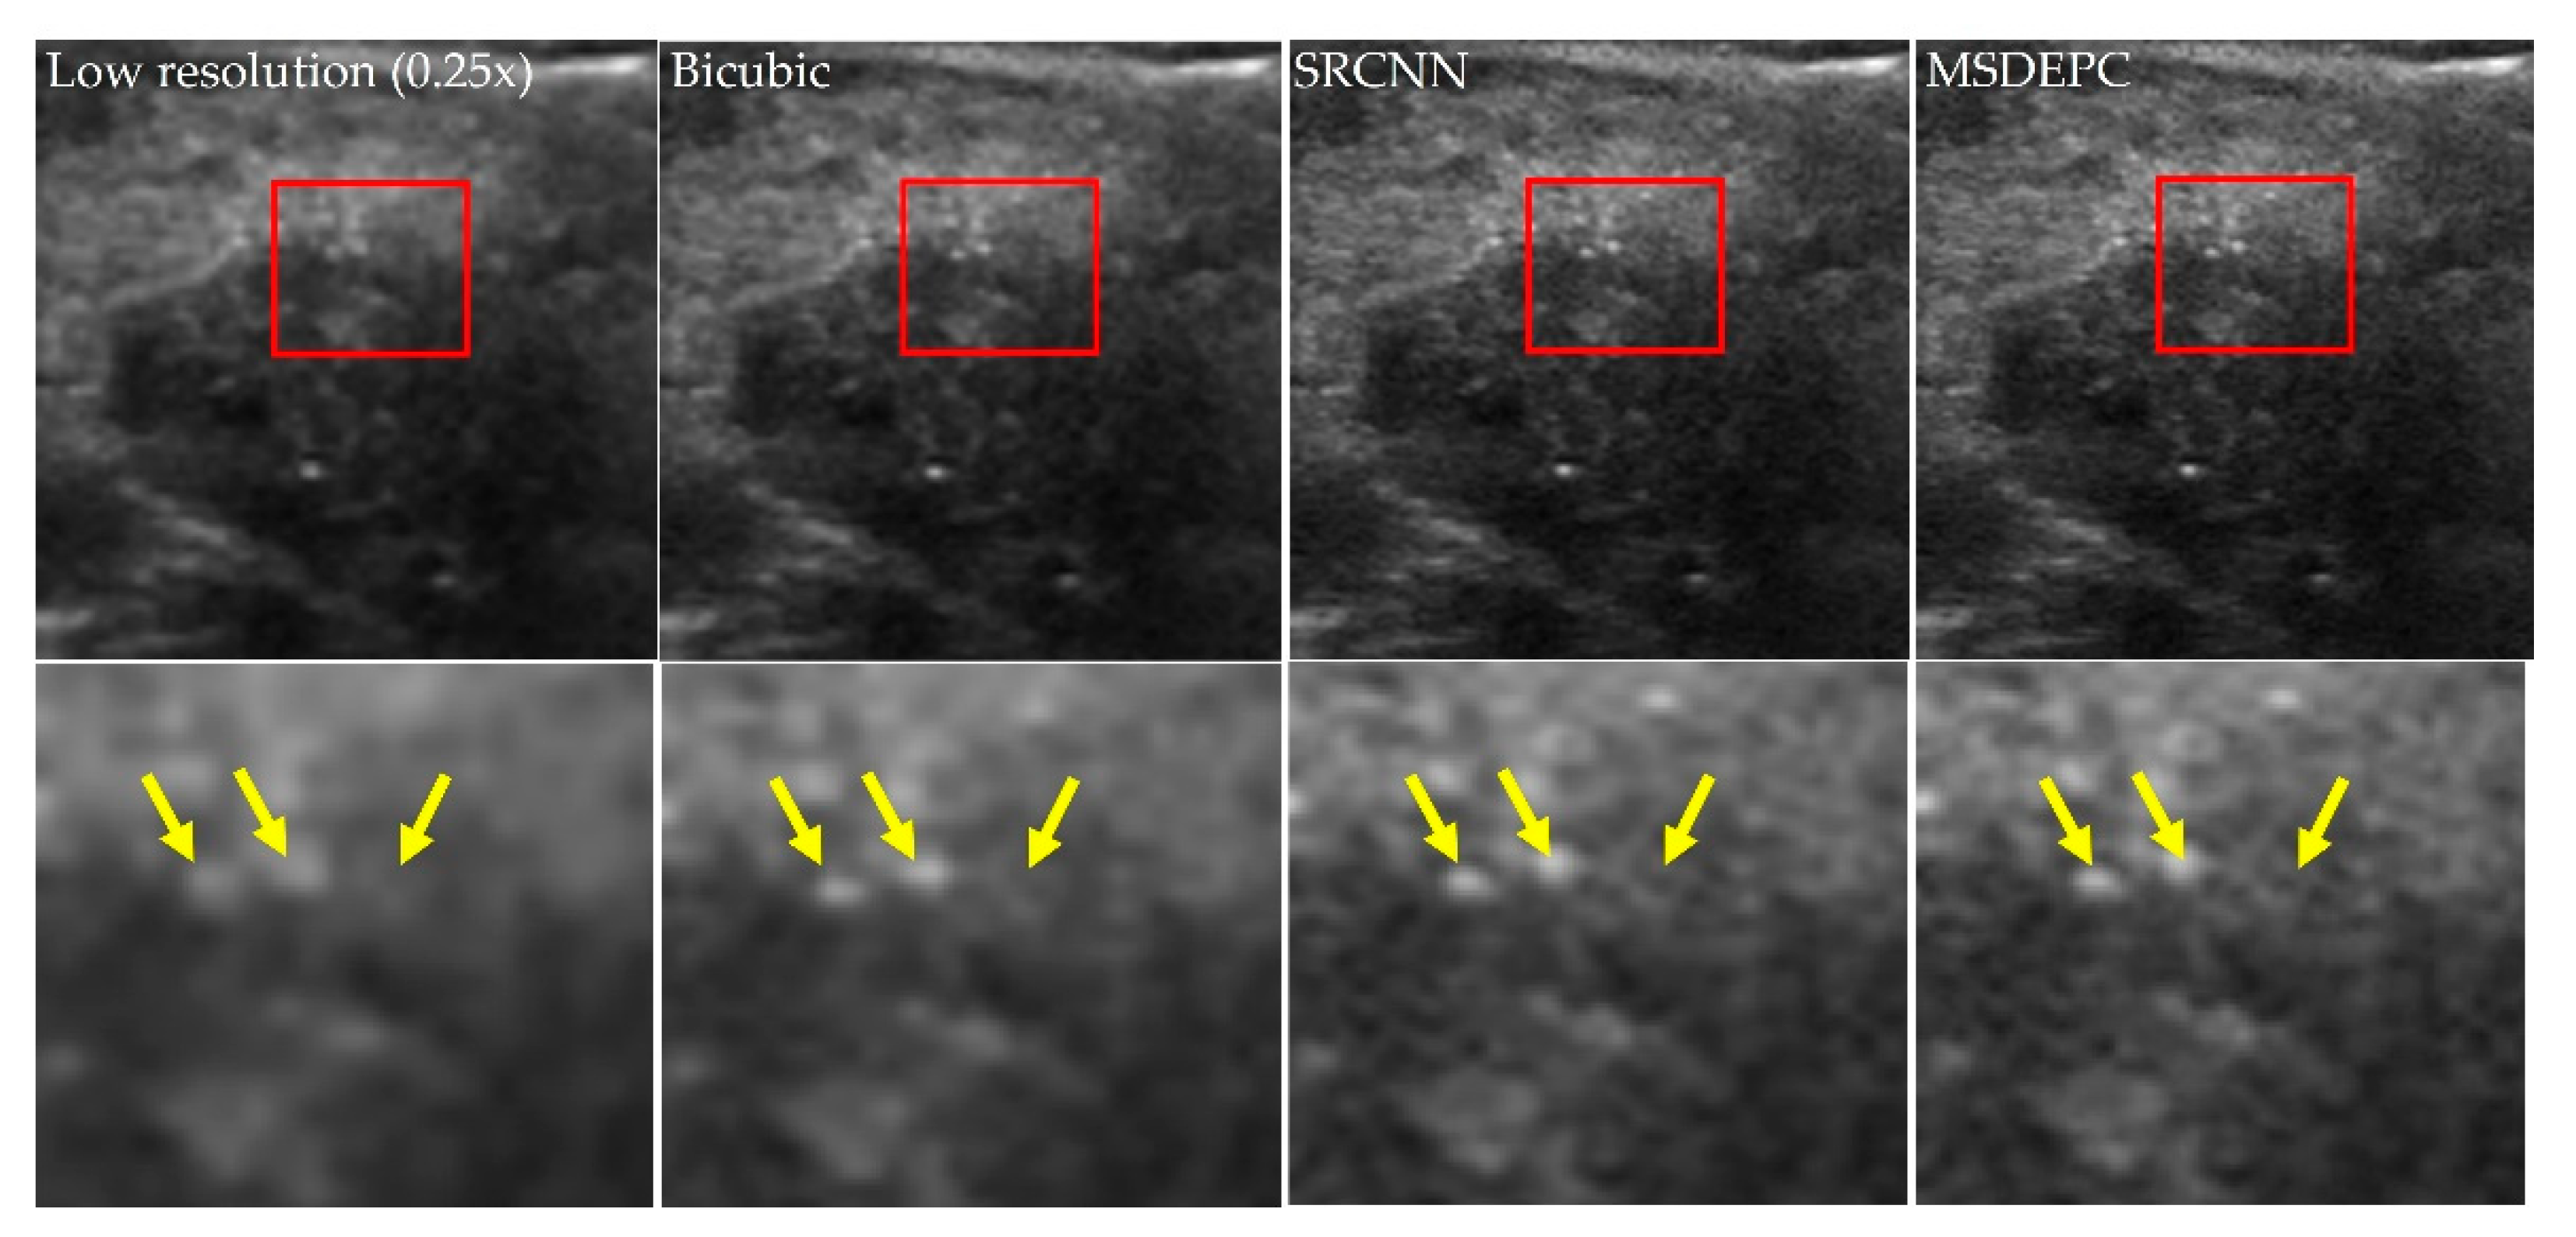
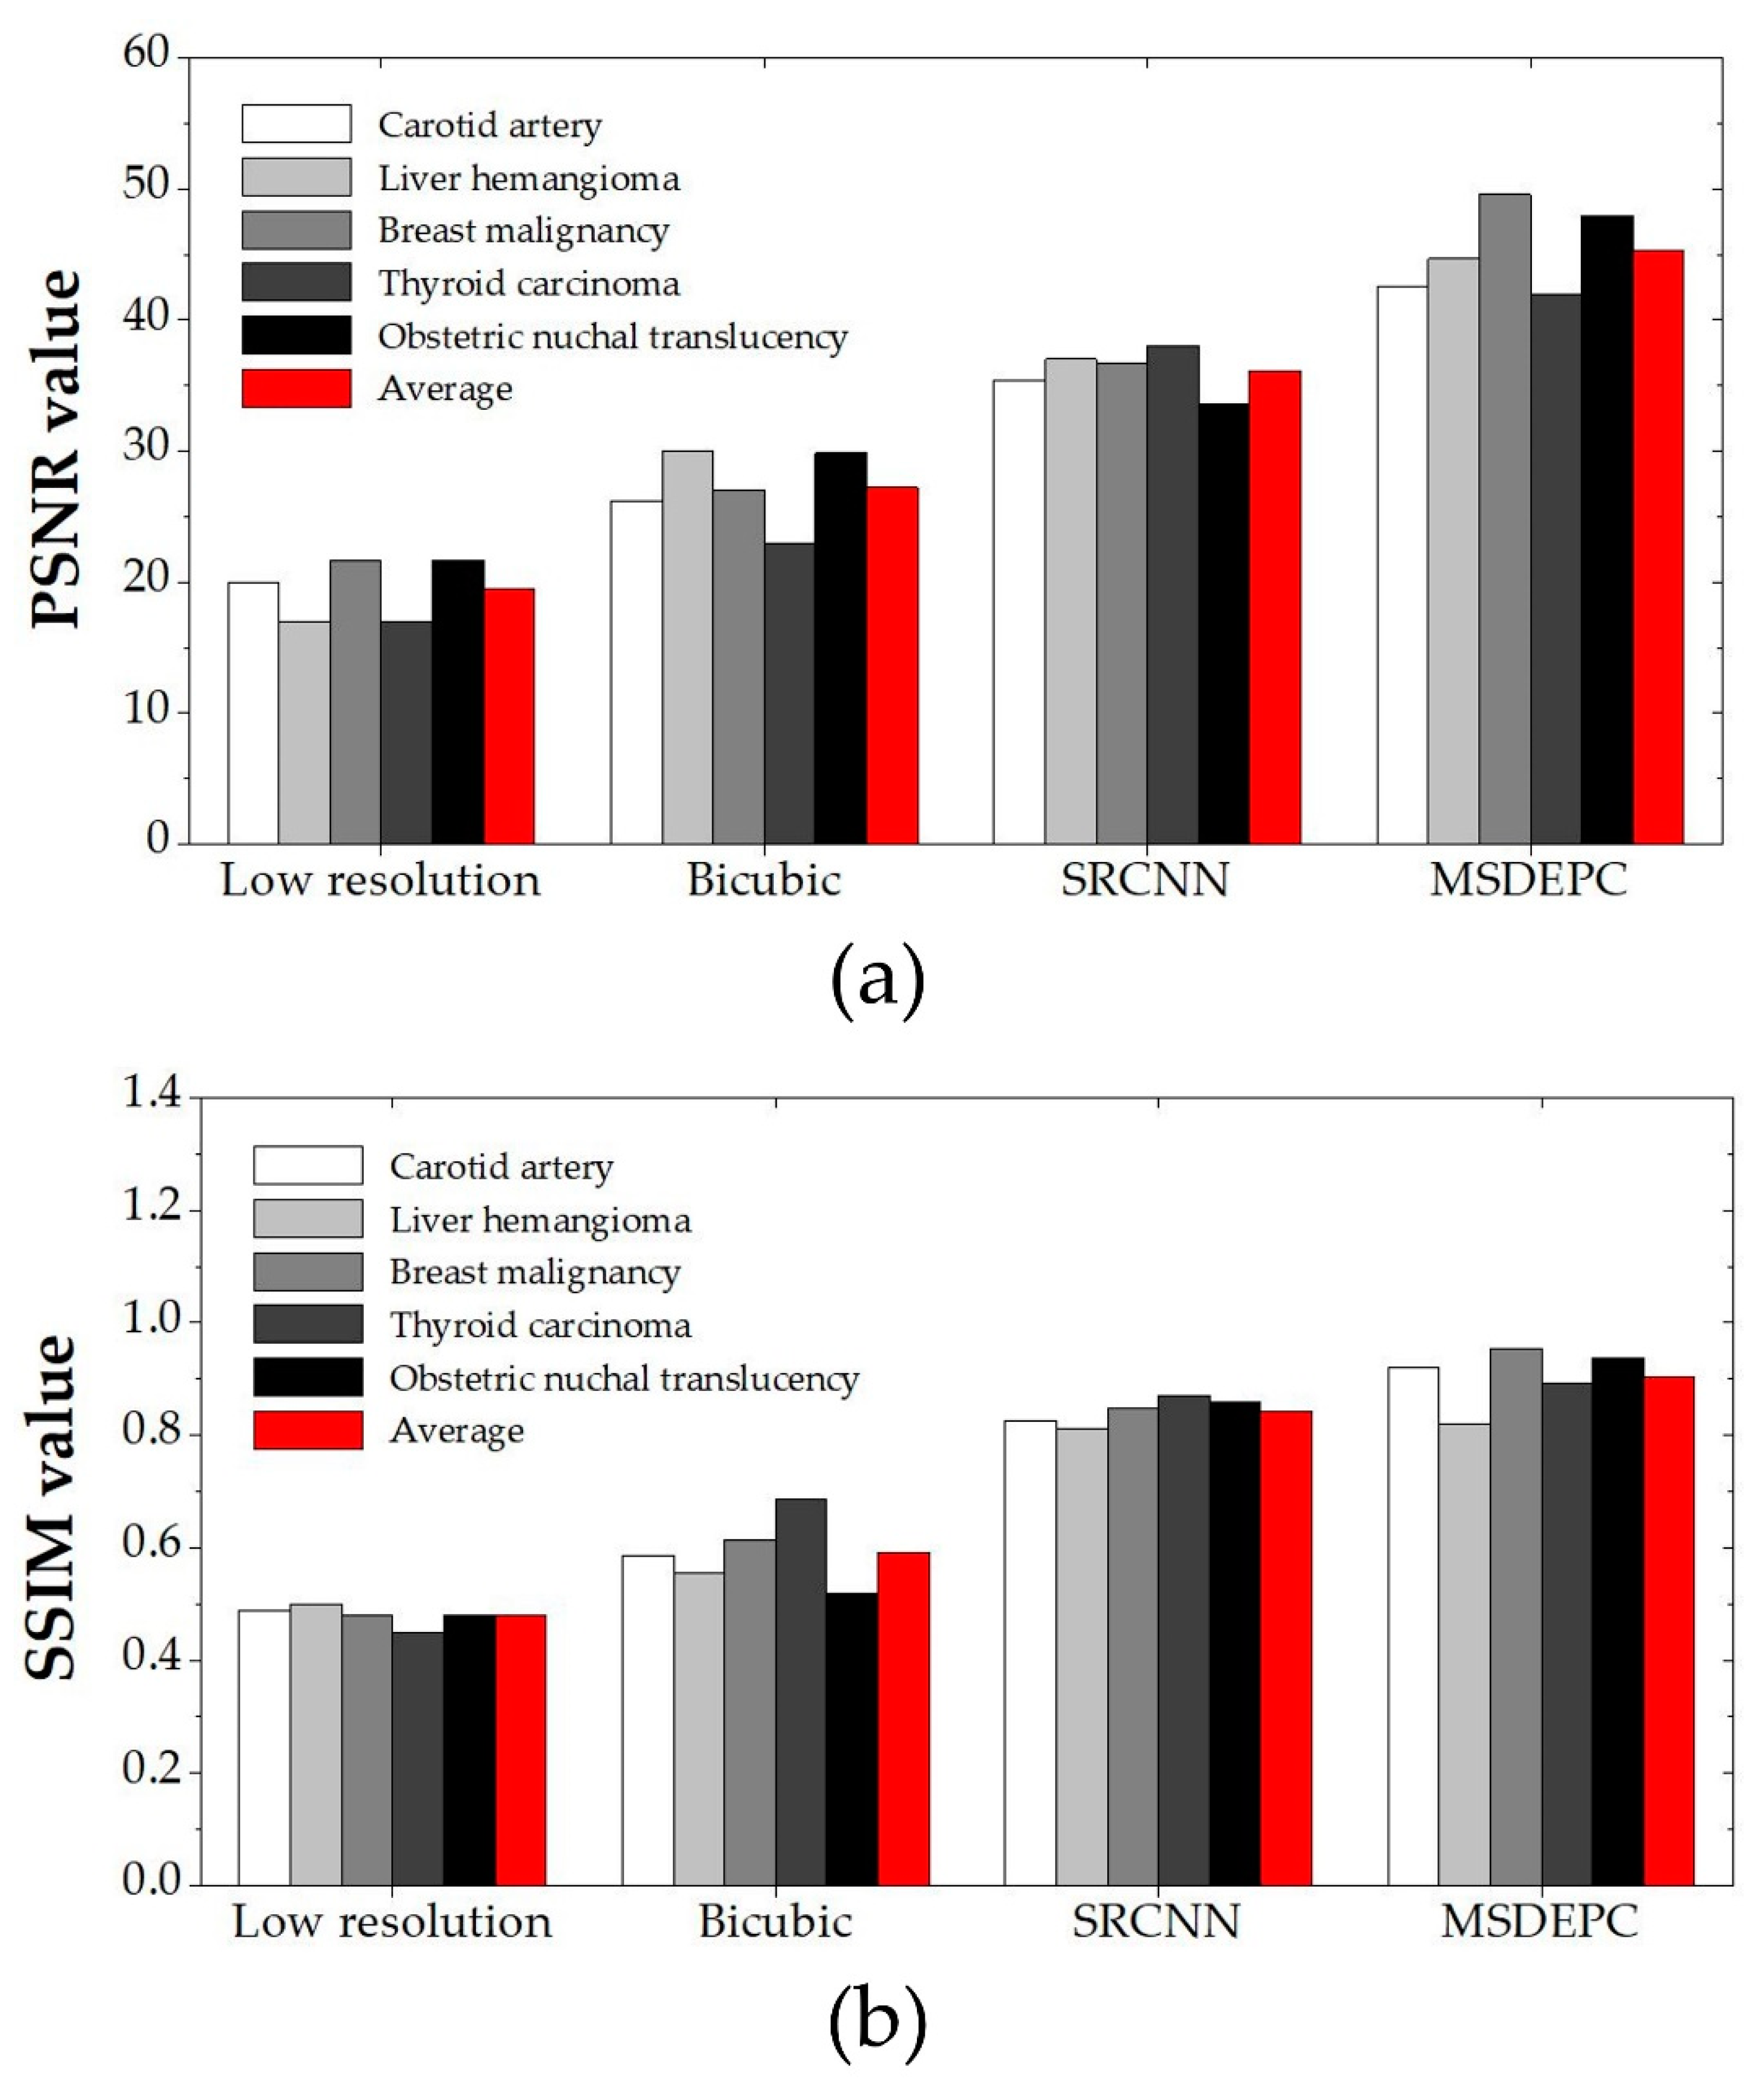
3. Results and Discussion

Figure 2 shows the ultrasound images obtained by applying the algorithms to improve the spatial resolution of the ultrasound phantom image acquired using the Field 2 program. The phantom image consisted of a point target, cyst region, and strongly reflecting region. To demonstrate the spatial resolution improvement efficiency of the proposed MSDEPC algorithm, the bicubic interpolation method [41] and SRCNN [21] were compared. Bicubic interpolation is a traditional interpolation method that applies the product of the intensity value of an adjacent pixel and its weight according to distance. Sixteen adjacent intensity values are required to determine the value of one pixel. The existing interpolation method can be used effectively by applying appropriate boundary conditions and constraints to the interpolation kernel. The SRCNN uses three convolution layers and a ReLU [42] activation function. The kernel size of each convolution layer was 9 × 9, 1 × 1, and 5 × 5, with a stride of 16 and an initial learning rate of 0.003; in addition, the Adam optimizer was implemented in this study. Table 1 shows the computation times of the bicubic interpolation method, SRCNN, and the MSDEPC algorithm. When GPUs were used, the MSDEPC algorithm was approximately 0.72 times slower than SRCNN, and the CPU was about approximately 0.8 times slower. This is due to an increase in the model parameters, which did not affect the result. In the case of the bicubic interpolation method, there was no significance in the comparative measurements at very high computational speeds.
By visually analyzing the acquired images, we confirmed that the spatial resolution improved when using the algorithms compared to the LR images. In particular, we confirmed that blurring was significantly reduced in most areas of the phantom image when the proposed MSDEPC algorithm was used.
To quantitatively analyze the degree of spatial resolution improvement of the MSEDPC algorithm, the intensity profile was obtained and the FWHM was calculated. Figure 3 shows the intensity profile and FWHM results measured from the simulated ultrasound phantom images obtained using the various spatial resolution improvement algorithms. The line profile is represented graphically using “line AB” in Figure 2. As shown in Figure 3a, the profiles of the SRCNN and MSDEPC algorithms are sharper than those of the images obtained using LR and bicubic interpolation. In addition, the proposed MSDEPC algorithm showed a slightly sharper profile in the edge areas than the SRCNN. The graph in which the sigma value was derived from the profile obtained is shown in Figure 3a, and the graph from which the FWHM values were calculated is shown in Figure 3b. The FWHM values that accurately represented the spatial resolution were calculated as 0.800, 0.781, 0.472, and 0.452 using the LR, bicubic, SRCNN, and proposed MSDEPC algorithms, respectively. Similar to the visual evaluation results, the best FWHM value was derived from the ultrasound simulation phantom image using the MSDEPC algorithm, which was approximately 1.77 times better than the one obtained from the LR image.
Figure 4 shows the PSNR and SSIM graphs calculated from the resulting ultrasound images based on Field 2 simulation. The PSNR values obtained using the simulated images were 7.73, 11.93, 17.50, and 26.32 for the LR, bicubic, SRCNN, and proposed MSDEPC algorithms, respectively. Following the same trend as the FWHM data, the best PSNR value was obtained using the MSDEPC algorithm, and an improvement of approximately 3.40 times compared to LR was confirmed. The SSIM values obtained using the simulated image were calculated to be 0.652, 0.776, 0.840, and 0.906 for the LR, bicubic, SRCNN, and proposed MSDEPC algorithms, respectively. Owing to the characteristics of the SSIM method, which indicate superior similarity as the value approaches 1, the MSDEPC algorithm was derived as a noteworthy solution. Our findings demonstrate that the SSIM value of the simulated ultrasound image using the MSDEPC algorithm improved by approximately 38.84% compared to LR.
Figure 5, Figure 6, Figure 7, Figure 8 and Figure 9 show the results of applying the spatial resolution improvement methods to clinical ultrasound images obtained from open sources. Figure 5, Figure 6, Figure 7, Figure 8 and Figure 9 show images of the carotid artery, a liver hemangioma, breast malignancy, a thyroid carcinoma, and obstetric nuchal translucency, respectively. By restoring all the clinical ultrasound images using the proposed MSDEPC algorithm, we confirmed that the spatial resolution of the images was visually improved.
Figure 10a,b show the PSNR and SSIM results, respectively, with respect to the application of various spatial resolution improvement algorithms to clinical ultrasound images. When the LR, bicubic, SRCNN, and proposed MSDEPC algorithms were used, the values were 19.45, 27.23, 36.14, and 45.00, respectively. In addition, the average SSIM values for the clinical ultrasound images obtained using the LR, bicubic, SRCNN, and proposed MSDEPC algorithms were 0.480, 0.592, 0.843, and 0.904, respectively. The same tendencies as those of the PSNR and SSIM values derived from the simulation study were observed, and we proved that the best quantitative spatial resolution values were obtained using the MSDEPC algorithm. In particular, we confirmed that the PSNR and SSIM values of the clinical ultrasound images improved by approximately 2.33 times and 88.58%, respectively, using the MSDEPC algorithm compared to LR.
In ultrasound images of carotid arteries, intima-media thickness is often measured, and a thickness of less than 0.8 mm is diagnosed as normal. Because 0.8 mm is a very small value to distinguish in ultrasound images, improving spatial resolution is important. In addition, atheromatous plaques in the carotid arteries were assessed by ultrasound using B-mode, including echogenicity, echo texture, surface characteristics, and volume. Generally, vulnerable atheromatous plaques show a hypoechoic pattern on ultrasound images and have an uneven echo intensity. In the case of atheromatous plaques of the carotid artery, the location of calcified nodules and lipid cores have additional significance in assessing vulnerability. Therefore, improving the spatial resolution of images is important because the texture of an ultrasound image determines the characteristics of the atheromatous plaques.
In ultrasound images of a focal lesion of the liver, a difference in whether the margin appears irregular or well defined should be observed [43]. Local lesions of the liver can be classified according to texture, and hemangioma lesions can appear with atypical ultrasound imaging characteristics [44]. Thus, the spatial resolution of liver ultrasound images can affect one’s ability to discriminate hemangiomas, and the proposed algorithm is expected to provide significant advantages in this regard. Improving the spatial resolution of breast ultrasound imaging is an effective method for detecting fine calcific formations, and it has been reported that a sensitivity of up to 95% is achievable [45]. In addition, breast ultrasound images with improved spatial resolution can be used better distinguish between solid and cystic lesions and characterize their complexity [46]. These images can be used to confirm the malignant nature of breast tumors and can be of great help when performing ultrasound-guided biopsies.
High spatial resolution is also very important in thyroid cancer ultrasound imaging. In ultrasound images of thyroid cancer, features such as fine calcifications, marked hypoechoicity, and irregular edges have been observed [47]. Thus, in thyroid ultrasound images with excellent spatial resolution, the microcalcification texture, a characteristic of malignancy, can be better observed, and the diagnostic value of Doppler detection can be improved. The inner–inner method was used to measure the obstetric nuchal translucency in the ultrasound images. A value of 3.5 mm for nuchal translucency should be considered important and warrant further testing [48]. Therefore, a detailed nuchal translucency measurement is necessary, and improving the spatial resolution of images using the proposed MSDEPC algorithm can contribute to these characteristics. In addition, an improvement in spatial resolution is important for identifying other brain structures that require detailed measurements in ultrasound image views from different directions. We expect that these imaging techniques will contribute to the early detection of the fetus.
The proposed method produced sufficient qualitative and quantitative results to improve the sharpness and resolution of the ultrasound images; however, there are still some issues to be discussed. First, it facilitates a more realistic discussion of real-world deterioration. Because it is difficult to obtain LR and HR paired images in the real world, we generated LR images through upsampling interpolation (e.g., bicubic interpolation) after downsampling the HR images. However, LR images obtained in the real world have additional blurring (e.g., motion artifacts) and noise components compared to virtually generated LR images. Therefore, when a network trained on virtual LR and HR paired images is applied to an actual LR image, its quality may be poor. Recently, results regarding the generation of deteriorated LR images using a GAN and using them as training data have also been reported [49]. These efforts must be discussed in terms of medical images, which have many restrictions. Second, an appropriate normalization method was discussed. BN, commonly used in deep learning, is a technique that helps students learn by normalizing the distribution of intermediate layers. However, it has also been claimed that there is a disadvantage in removing the flexibility of features in SISR; therefore, various discussions are underway [50]. In this study, the MSDEPC model used BN; however, it is expected that such claims will need to be verified using ultrasound images in the future. Third, the upsampling size was determined to be appropriate. We can determine the size of the downsampling mathematically in the HR images, and the existing methods argue that the images are similar to the HR images. However, when an HR image is restored, it may be unclear whether the detailed information of the actual image has been fully restored when the LR image has an extremely low resolution [51]. In particular, the loss of detailed information can lead to a decrease in diagnostic accuracy in the case of medical imaging. Finally, the PC detects an edge in the frequency domain. In general, gradient-based edge operators (e.g., Sobel, Canny, etc.) are vulnerable to brightness and contrast changes because they extract edges from the spatial domain, but PC has the advantage of being uncomfortable with brightness and contrast changes because they extract edges from the frequency domain. However, it is vulnerable to noise components [52]. Noise interferes with feature extraction and becomes an obstacle to extracting an accurate edge map. A method to remove speckle noise from ultrasound images while maintaining features as much as possible has been introduced, but a careful approach is required [53]. Therefore, this issue is a very important point of discussion.
Research on the application of three-dimensional (3D) printing technology in diagnostic medical ultrasound imaging is being actively conducted by many researchers. Three-dimensional printing technology will be helpful in the deep-learning-based SISR process when using the MSDEPC model proposed in this study. Habibi et al. conducted a study on 3D printing technology for structures based on acoustic cavitation directly generated by focused ultrasound, making the precise modeling of human organs possible [54]. Kim et al. modeled the left ventricle of the heart and analyzed the applicability of wavelet-thresholding image-processing technology after acquiring ultrasound images [55]. We expect that the applicability of phantoms using 3D printing, which has been proven in various studies, to ultrasound images will help build various datasets in situations where it is difficult to secure deep learning datasets.

4. Conclusions

We developed the MSDEPC model using deep-learning-based SISR and applied it to simulations and real clinical ultrasound images. We expect that the proposed MSDEPC algorithm will be able to compensate for problems that may occur because of the reduced spatial resolution of ultrasound images. Based on the results derived from the image evaluation parameters (FWHM, PSNR, and SSIM), the MSDEPC model is expected to be used more efficiently in clinical settings than the SRCNN approach, which is currently the most actively used deep-learning-based spatial-resolution improvement approach. Additionally, we expect that the algorithm proposed in this study will be able to sufficiently influence the development process of state-of-the-art (SOTA) SR technology. In the future, we also plan to conduct research on comparative evaluations with currently known SOTA SR technologies.

Author Contributions

Conceptualization, R.K., K.K. and Y.L.; Methodology, K.K. and Y.L.; Formal analysis, R.K., K.K. and Y.L.; funding acquisition, Y.L.; software, K.K. and Y.L.; validation, Y.L.; writing of the original draft, R.K. and K.K.; and writing, review, and editing, K.K. and Y.L. All authors have read and agreed to the published version of the manuscript.

Funding

This study was supported by a grant from the National Foundation of Korea (NRF) funded by the Korean government (Grant No. NRF-2021R1F1A1061440).

Institutional Review Board Statement

This does not apply to clinical data because the data used are open-source.

Informed Consent Statement

Not applicable.

Data Availability Statement

Data are contained within this article.

Conflicts of Interest

The authors declare no conflict of interest.

References

  1. Carovac, A.; Smajlovic, F.; Junuzovic, D. Application of Ultrasound in Medicine. Acta Inform. Med. 2011, 19, 168–171. [Google Scholar] [CrossRef] [PubMed]
  2. Choi, M.J.; Lim, C.M.; Jeong, D.; Jeon, H.-R.; Cho, K.J.; Kim, S.Y. Efficacy of intraoperative wireless ultrasonography for uterine incision among patients with adherence findings in placenta previa. J. Obstet. Gynaecol. Res. 2020, 46, 876–882. [Google Scholar] [CrossRef] [PubMed]
  3. Joo, Y.; Park, H.-C.; Lee, O.-J.; Yoon, C.; Choi, M.H.; Choi, C. Classification of Liver Fibrosis from Heterogeneous Ultrasound Image. IEEE Access 2023, 11, 9920–9930. [Google Scholar] [CrossRef]
  4. Kim, J.H.; Paik, N.-S.; Nam, S.Y.; Cho, Y.; Park, H.K. The Emerging Crisis of Stakeholders in Implant-based Augmentation Mammaplasty in Korea. J. Korean Med. Sci. 2020, 35, e103. [Google Scholar] [CrossRef]
  5. Lee, J.-H.; Kim, Y.-G.; Ahn, Y.; Park, S.; Kong, H.-J.; Choi, J.Y.; Kim, K.; Nam, I.-C.; Lee, M.-C.; Masuoka, H.; et al. Investigation of optimal convolutional neural network conditions for thyroid ultrasound image analysis. Sci. Rep. 2023, 13, 1360. [Google Scholar] [CrossRef] [PubMed]
  6. Yu, S.H.; Hwang, J.H.; Kim, J.H.; Park, S.; Lee, K.H.; Choi, S.T. Duplication of superficial femoral artery: Imaging findings and literature review. BMC Med. Imaging 2020, 20, 99. [Google Scholar] [CrossRef]
  7. Ng, A.; Swanevelder, J. Resolution in ultrasound imaging. Contin. Educ. Anaesth. Crit. Care Pain 2011, 11, 186–192. [Google Scholar] [CrossRef]
  8. Kim, H.; Labropoulos, N. Image Optimization in Venous Ultrasound Examination. Ann. Phlebol. 2022, 20, 64–67. [Google Scholar] [CrossRef]
  9. Park, S.C.; Park, M.K.; Kang, M.G. Super-resolution image reconstruction: A technical overview. IEEE Signal Process. Mag. 2003, 20, 21–36. [Google Scholar] [CrossRef]
  10. Elad, M.; Feuer, A. Restoration of a single superresolution image from several blurred, noisy, and undersampled measured images. IEEE Trans. Image Process. 1997, 6, 1646–1658. [Google Scholar] [CrossRef]
  11. Kim, K.; Lee, Y. Improvement of signal and noise performance using single image super-resolution based on deep learning in single photon-emission computed tomography imaging system. Nucl. Eng. Technol. 2021, 53, 2341–2347. [Google Scholar] [CrossRef]
  12. Farsiu, S.; Robinson, M.D.; Elad, M.; Milanfar, P. Fast and robust multiframe super resolution. IEEE Trans. Image Process. 2004, 13, 1327–1344. [Google Scholar] [CrossRef] [PubMed]
  13. Lin, Z.; Shum, H.-Y. Fundamental limits of reconstruction-based super-resolution algorithms under local translation. IEEE Trans. Pattern Anal. Mach. Intell. 2004, 26, 83–97. [Google Scholar] [CrossRef] [PubMed]
  14. Freeman, W.T.; Jones, T.R.; Pasztor, E.C. Example-based super-resolution. IEEE Comput. Graph. Appl. 2002, 22, 56–65. [Google Scholar] [CrossRef]
  15. Geman, S.; Geman, D. Stochastic relaxation, gibbs distributions, and the Bayesian restoration of images. IEEE Trans. Pattern Anal. Mach. Intell. 1984, PAMI-6, 721–741. [Google Scholar] [CrossRef] [PubMed]
  16. Sun, J.; Xu, Z.; Shum, H.-Y. Image super-resolution using gradient profile prior. In Proceedings of the 2008 IEEE Conference on Computer Vision and Pattern Recognition 2008, Anchorage, AK, USA, 24–26 June 2008. [Google Scholar] [CrossRef]
  17. Yang, J.; Wang, Z.; Lin, Z.; Cohen, S.; Huang, T. Coupled dictionary training for image super-resolution. IEEE Trans. Image Process. 2012, 21, 3467–3478. [Google Scholar] [CrossRef]
  18. Yang, J.; Lin, Z.; Cohen, S. Fast image super-resolution based on in-place example regression. In Proceedings of the 2013 IEEE Conference on Computer Vision and Pattern Recognition 2013, Portland, OR, USA, 23–28 June 2013. [Google Scholar] [CrossRef]
  19. Yang, W.; Zhang, X.; Tian, Y.; Wang, W.; Xue, J.-H.; Liao, Q. Deep learning for single image super-resolution: A brief review. IEEE Trans. Multimed. 2019, 21, 3106–3121. [Google Scholar] [CrossRef]
  20. Li, K.; Yang, S.; Dong, R.; Wang, X.; Huang, J. Survey of single image super-resolution reconstruction. IET Image Process. 2020, 14, 2273–2290. [Google Scholar] [CrossRef]
  21. Dong, C.; Loy, C.C.; He, K.; Tang, X. Image super-resolution using deep convolutional networks. IEEE Trans. Pattern Anal. Mach. Intell. 2016, 38, 295–307. [Google Scholar] [CrossRef]
  22. Kim, J.; Lee, J.K.; Lee, K.M. Accurate image super-resolution using very deep convolutional networks. In Proceedings of the 2016 IEEE Conference on Computer Vision and Pattern Recognition (CVPR), Las Vegas, NV, USA, 27–30 June 2016. [Google Scholar] [CrossRef]
  23. Ledig, C.; Theis, L.; Huszár, F.; Caballero, J.; Cunningham, A.; Acosta, A.; Aitken, A.; Tejani, A.; Totz, J.; Wang, Z.; et al. Photo-realistic single image super-resolution using a generative adversarial network. In Proceedings of the 2017 IEEE Conference on Computer Vision and Pattern Recognition (CVPR), Honolulu, HI, USA, 21–26 July 2017. [Google Scholar] [CrossRef]
  24. Anwar, S.; Khan, S.; Barnes, N. A deep journey into super-resolution: A survey. ACM Comput. Surv. 2020, 53, 1–34. [Google Scholar] [CrossRef]
  25. Liu, H.; Fu, Z.; Han, J.; Shao, L.; Hou, S.; Chu, Y. Single image super-resolution using multi-scale deep encoder-decoder with phase congruency edge map guidance. Inf. Sci. 2019, 473, 44–58. [Google Scholar] [CrossRef]
  26. Liu, H.; Liu, J.; Hou, S.; Tao, T.; Han, J. Perception consistency ultrasound image super-resolution via self-supervised CycleGAN. Neural. Comput. Appl. 2021, 35, 12331–12341. [Google Scholar] [CrossRef]
  27. Yu, L.; Zhang, X.; Chu, Y. Super-resolution reconstruction algorithm for infrared image with double regular items based on sub-pixel convolution. Appl. Sci. 2020, 10, 1109. [Google Scholar] [CrossRef]
  28. Wang, Z.; Bovik, A.C.; Sheikh, H.R.; Simoncelli, E.P. Image quality assessment: From error visibility to structural similarity. IEEE Trans. Image Process. 2004, 13, 600–612. [Google Scholar] [CrossRef]
  29. Kesarwani, A.; Purohit, K.; Dalui, M.; Kisku, D.R. Measuring the degree of suitability of edge detection operators prior to an application. In Proceedings of the 2020 IEEE Applied Signal Processing Conference (ASPCON), Kolkata, India, 7–9 October 2020. [Google Scholar] [CrossRef]
  30. Kovesi, P. Image features from phase congruency. Videre J. Comput. Vis. Res. 1999, 1, 1–26. [Google Scholar]
  31. Forero, M.G.; Jacanamejoy, C.A. Unified mathematical formulation of monogenic phase congruency. Mathematics 2021, 9, 3080. [Google Scholar] [CrossRef]
  32. Morrone, M.C.; Owens, R.A. Feature detection from local energy. Pattern Recognit. Lett. 1987, 6, 303–313. [Google Scholar] [CrossRef]
  33. Bounneche, M.D.; Boubchir, L.; Bouridane, A.; Nekhoul, B.; Ali-Chérif, A. Multi-spectral palmprint recognition based on oriented multiscale log-gabor filters. Neurocomputing 2016, 205, 274–286. [Google Scholar] [CrossRef]
  34. Xie, S.; Tu, Z. Holistically-nested edge detection. In Proceedings of the 2015 IEEE International Conference on Computer Vision (ICCV), Santiago, Chile, 7–13 December 2015. [Google Scholar] [CrossRef]
  35. Shen, W.; Zhao, K.; Jiang, Y.; Wang, Y.; Zhang, Z.; Bai, X. Object skeleton extraction in natural images by fusing scale-associated deep side outputs. In Proceedings of the 2015 IEEE International Conference on Computer Vision (ICCV), Las Vegas, NV, USA, 7–13 December 2015. [Google Scholar] [CrossRef]
  36. Ioffe, S.; Szegedy, C. Batch normalization: Accelerating deep network training by reducing internal covariate shift. In Proceedings of the 32nd International Conference on International Conference on Machine Learning (ICML’15), Lille, France, 6–11 July 2015; Volume 37, pp. 448–456. [Google Scholar] [CrossRef]
  37. He, K.; Zhang, X.; Ren, S.; Sun, J. Delving deep into rectifiers: Surpassing human-level performance on ImageNet classification. In Proceedings of the 2015 IEEE International Conference on Computer Vision (ICCV), Santiago, Chile, 7–13 December 2015. [Google Scholar] [CrossRef]
  38. Kingma, D.P.; Ba, J. Adam: A method for stochastic optimization. arXiv 2015, arXiv:1412.6980. [Google Scholar] [CrossRef]
  39. Tupholme, G.E. Generation of acoustic pulses by baffled plane pistons. Mathematika 1969, 16, 209–224. [Google Scholar] [CrossRef]
  40. Jensen, J.A.; Munk, P. Computer Phantoms for Simulating Ultrasound B-Mode and CFM Images. Acoust. Imaging 1997, 23, 75–80. [Google Scholar] [CrossRef]
  41. Keys, R. Cubic convolution interpolation for digital image processing. IEEE Trans. Acoust. Speech Signal Process. 1981, 29, 1153–1160. [Google Scholar] [CrossRef]
  42. Nair, V.; Hinton, G.E. Rectified linear units improve restricted Boltzmann machines. In Proceedings of the 27th International Conference on International Conference on Machine Learning (ICML’10), Haifa, Israel, 21–24 June 2010; pp. 807–814. [Google Scholar]
  43. Mastafiz, R.; Rahman, M.M.; Islam, A.K.M.K.; Belkasim, S. Focal Liver Lesion Detection in Ultrasound Image Using Deep Feature Fusions and Super Resolution. Mach. Learn. Knowl. Extr. 2020, 2, 172–191. [Google Scholar] [CrossRef]
  44. Kim, K.W.; Kim, M.J.; Lee, S.S.; Kim, H.J.; Shin, Y.M.; Kim, P.-N.; Lee, M.-G. Sparing of Fatty Infiltration Around Focal Hepatic Lesions in Patients with Hepatic Steatosis: Sonographic Appearance with CT and MRI Correlation. Am. J. Roentgenol. 2008, 190, 1018–1027. [Google Scholar] [CrossRef] [PubMed]
  45. Gupta, K.; Sandhu, P.; Arora, S.; Bedi, G. Role of high resolution ultrasound complementary to digital mammography. Ann. Afr. Med. 2018, 17, 117–124. [Google Scholar] [CrossRef] [PubMed]
  46. Zhang, G.; Lei, Y.-M.; Li, N.; Yu, J.; Jiang, X.-Y.; Yu, M.-H.; Hu, H.-M.; Zeng, S.-E.; Cui, X.-W.; Ye, H.-R. Ultrasound super-resolution imaging for differential diagnosis of breast masses. Front. Oncol. 2022, 12, 1049991. [Google Scholar] [CrossRef]
  47. Acharya, U.R.; Faust, O.; Sree, S.V.; Molinari, F.; Suri, J.S. ThyroScreen system: High resolution ultrasound thyroid image characterization into benign and malignant classes using novel combination of texture and discrete wavelet transform. Comput. Methods Programs Biomed. 2012, 107, 233–241. [Google Scholar] [CrossRef]
  48. Guraya, S.S. The Associations of Nuchal Translucency and Fetal Abnormalities; Significance and Implications. J. Clin. Diagn. Res. 2013, 7, 936–941. [Google Scholar] [CrossRef]
  49. Bulat, A.B.; Tzimiropoulos, G. To learn image super-resolution, use a GAN to learn how to do image degradation first. In Proceedings of the ECCV 2018: Computer Vision–ECCV, Munich, Germany, 8–14 September 2018; pp. 187–202. [Google Scholar] [CrossRef]
  50. Liu, J.; Tang, J.; Wu, G. AdaDM: Enabling normalization for image super-resolution. arXiv 2021, arXiv:2111.13905. [Google Scholar] [CrossRef]
  51. Lepcha, D.C.; Goyal, B.; Dogra, A.; Goyal, V. Image super-resolution: A comprehensive review, recent trends, challenges and applications. Inf. Fusion 2023, 91, 230–260. [Google Scholar] [CrossRef]
  52. Ma, W.; Wu, Y.; Liu, S.; Su, Q.; Zhong, Y. Remote sensing image registration based on phase congruency feature detection and spatial constraint matching. IEEE Access 2018, 6, 77554–77567. [Google Scholar] [CrossRef]
  53. Zhu, L.; Wang, W.; Qin, J.; Wong, K.-H.; Choi, K.-S.; Heng, P.-A. Fast feature-preserving speckle reduction for ultrasound images via phase congruency. Signal Process. 2017, 134, 275–284. [Google Scholar] [CrossRef]
  54. Habibi, M.; Foroughi, S.; Karamzadeh, V.; Packirisamy, M. Direct sound printing. Nat. Commun. 2022, 13, 1800. [Google Scholar] [CrossRef] [PubMed]
  55. Kim, M.; Han, D.-K.; Lee, Y. Near-field clutter artifact reduction algorithm based on wavelet thresholding method in echocardiography using 3D printed cardiac phantom. J. Korean Phys. Soc. 2022, 81, 441–449. [Google Scholar] [CrossRef]
Figure 1. Schematic illustration of the multiscale deep encoder–decoder-based SISR method with phase congruency (MSDEPC) architecture. The network consists of the encoder and decoder block and total loss, which is calculated by summing the image loss and edge loss using the appropriate ratio, η .
Applsci 13 12928 g001
Figure 2. Images derived from applying algorithms to ultrasound images acquired using the Field 2 program. When algorithms that can improve spatial resolution compared to low-resolution images were applied, visually clear areas were observed, and the proposed MSDEPC showed the best characteristics. The yellow line was used to obtain the intensity profile.
Applsci 13 12928 g002
Figure 3. Graph showing (a) intensity profile and (b) sigma and (FWHM) values calculated from low-resolution (LR) images and images acquired by applying each spatial resolution improvement algorithm. When using the proposed MSDEPC algorithm, the intensity profile was observed to be the sharpest, and the best FWHM result were also obtained.
Applsci 13 12928 g003
Figure 4. Graph showing (a) peak signal-to-noise ratio (PSNR) and (b) structural similarity index metric (SSIM) values calculated from simulated LR images and images acquired by applying each spatial resolution improvement algorithm. The best PSNR and SSIM values were obtained when using the proposed MSDEPC algorithm.
Applsci 13 12928 g004
Figure 5. Results of applying various spatial-resolution enhancement algorithms to clinical ultrasound images of the carotid artery (The red box area indicates the magnified area). A clear improvement in spatial resolution was observed when using the MSDEPC algorithm at the edge of the blood vessel wall (yellow arrow area).
Applsci 13 12928 g005
Figure 6. Results of applying various spatial resolution enhancement algorithms to clinical ultrasound images of a liver hemangioma (The red box area indicates the magnified area). When using the proposed MSDEPC algorithm, the margin of the liver hemangioma ultrasound image was clearly observable (yellow arrow area).
Applsci 13 12928 g006
Figure 7. Results of applying various spatial resolution enhancement algorithms to clinical breast malignancy ultrasound images (The red box area indicates the magnified area). When using the proposed MSDEPC algorithm, it was confirmed that irregular parts of the malignancy area could be clearly derived (yellow arrow area).
Applsci 13 12928 g007
Figure 8. Results of applying various spatial resolution enhancement algorithms to clinical ultrasound images of a thyroid carcinoma (The red box area indicates the magnified area). When using the proposed MSDEPC algorithm, the microcalcification area was clearly distinguishable (yellow arrow area).
Applsci 13 12928 g008
Figure 9. Results of applying various spatial resolution enhancement algorithms to clinical ultrasound images of obstetric nuchal translucency (The red box area indicates the magnified area). When using the proposed MSDEPC algorithm, the obstetric nuchal translucency area was clearly distinguishable (yellow arrow area).
Applsci 13 12928 g009
Figure 10. Graph showing (a) PSNR and (b) SSIM values calculated from clinical LR images and images acquired by applying each spatial resolution improvement algorithm. The best PSNR and SSIM values were obtained when using the proposed MSDEPC algorithm.
Applsci 13 12928 g010
Table 1. Comparison of the computation times of the three algorithms.
Computation Time (s)BicubicSRCNNMSDEPC
GPU (Titan Xp)<0.010.210.29
CPU (Intel Xeon)<0.0112.4215.49
Disclaimer/Publisher’s Note: The statements, opinions and data contained in all publications are solely those of the individual author(s) and contributor(s) and not of MDPI and/or the editor(s). MDPI and/or the editor(s) disclaim responsibility for any injury to people or property resulting from any ideas, methods, instructions or products referred to in the content.

