
Construction of Geosynthetic–Reinforced Pavements and Evaluation of Their Impacts


Abstract
:1. Introduction
2. Field Construction
2.1. Overview
2.2. Geosynthetics Installation
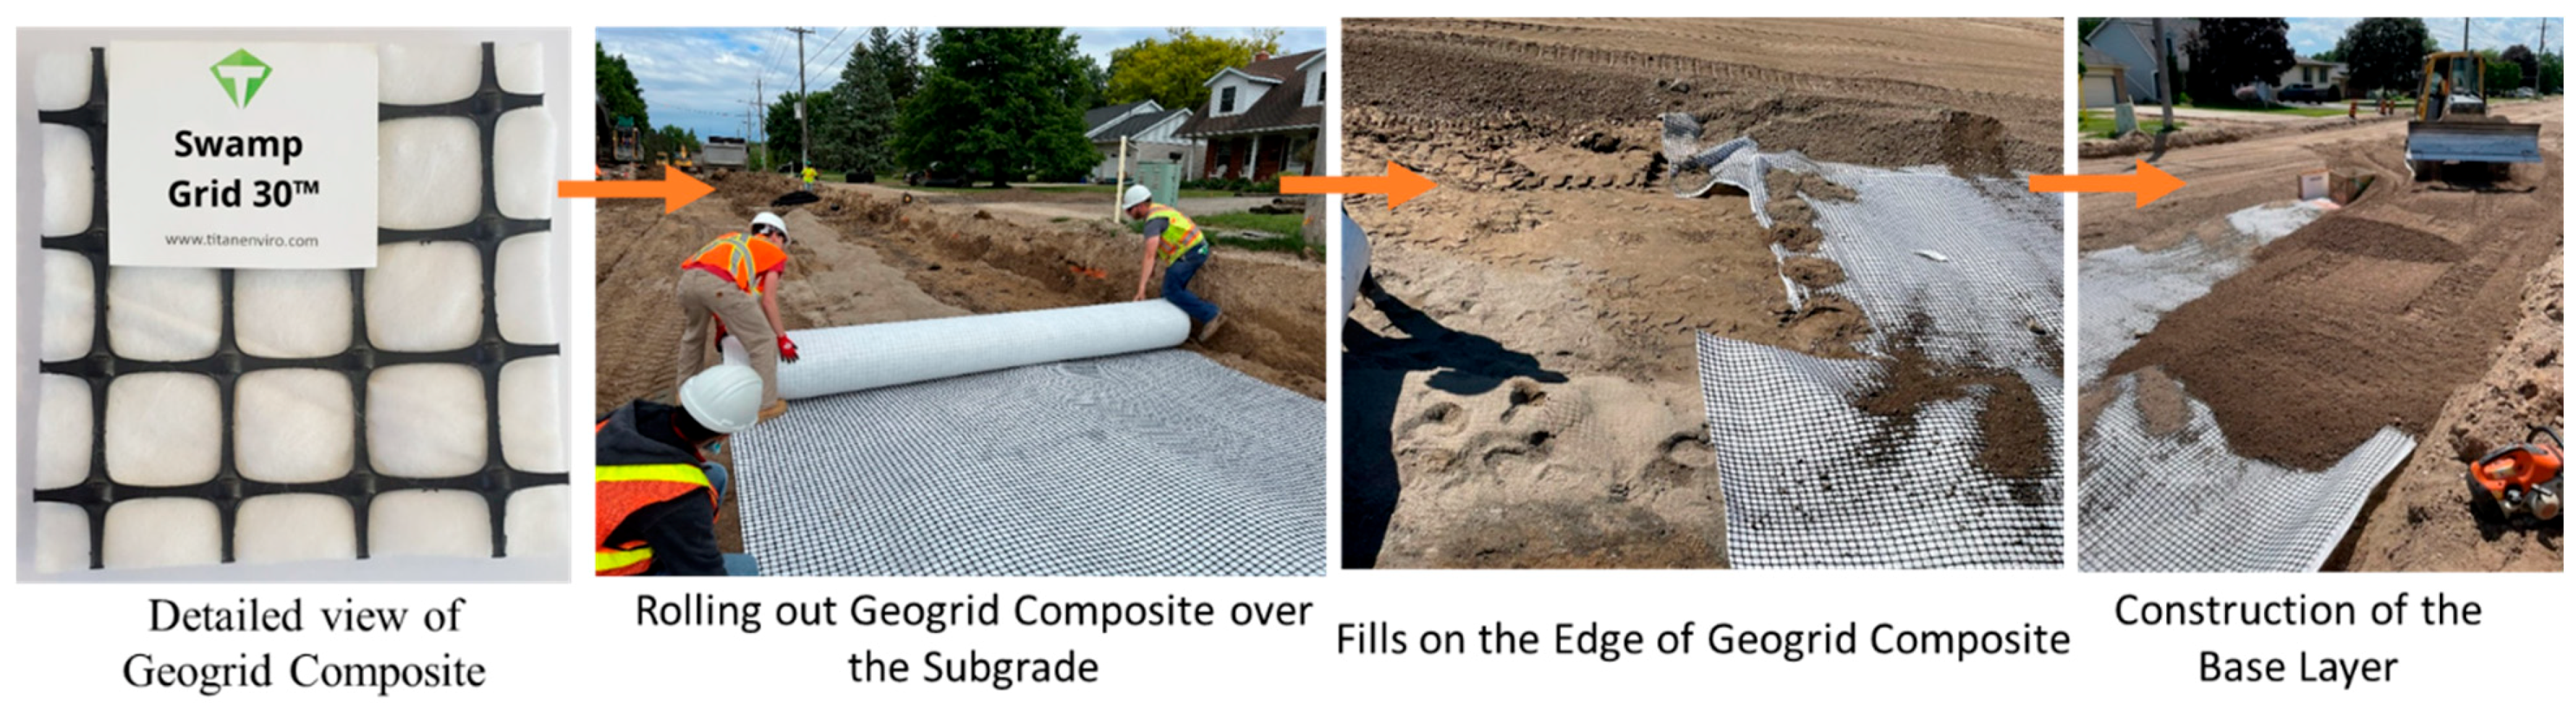
2.2.1. Geogrid Composite on Subgrade
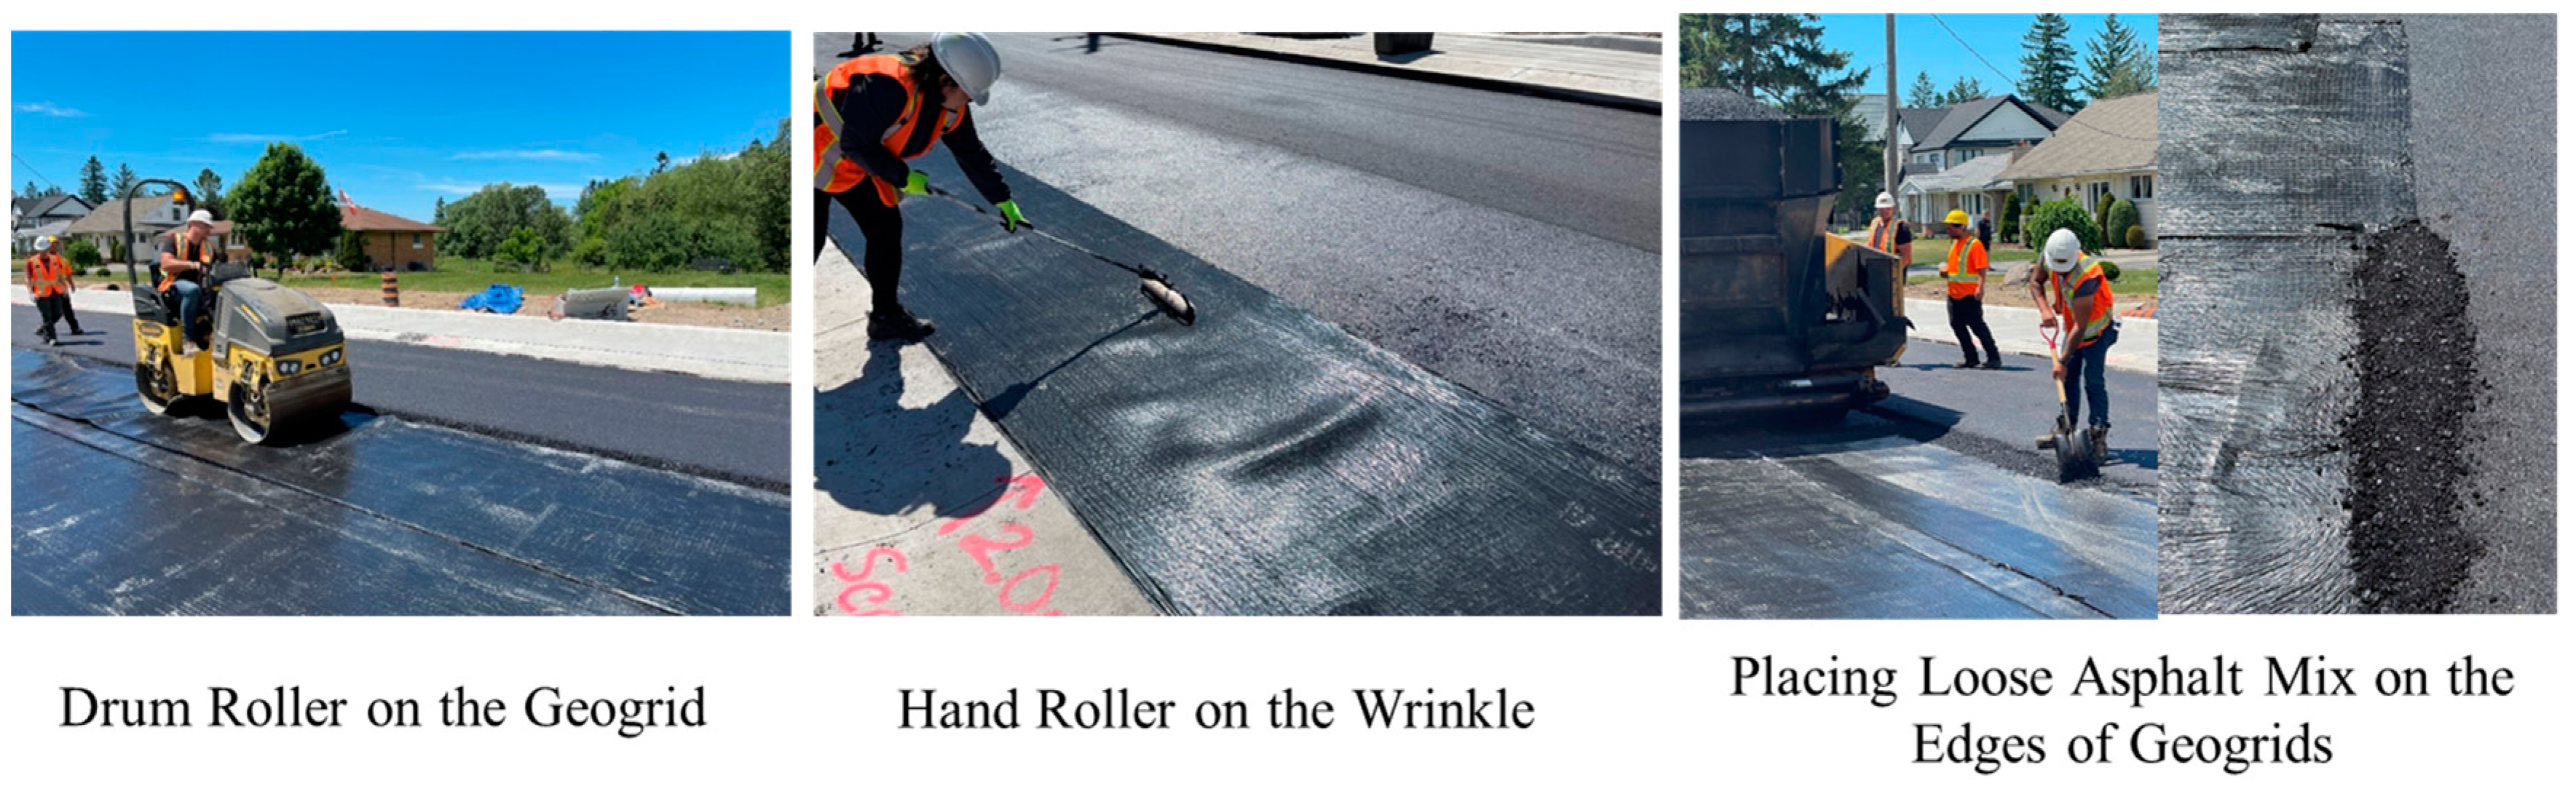
2.2.2. Fibreglass Geogrid in Asphalt Binder Course (SP 19)
2.3. Field Instrumentation
2.3.1. Temperature String
2.3.2. Moisture Probe
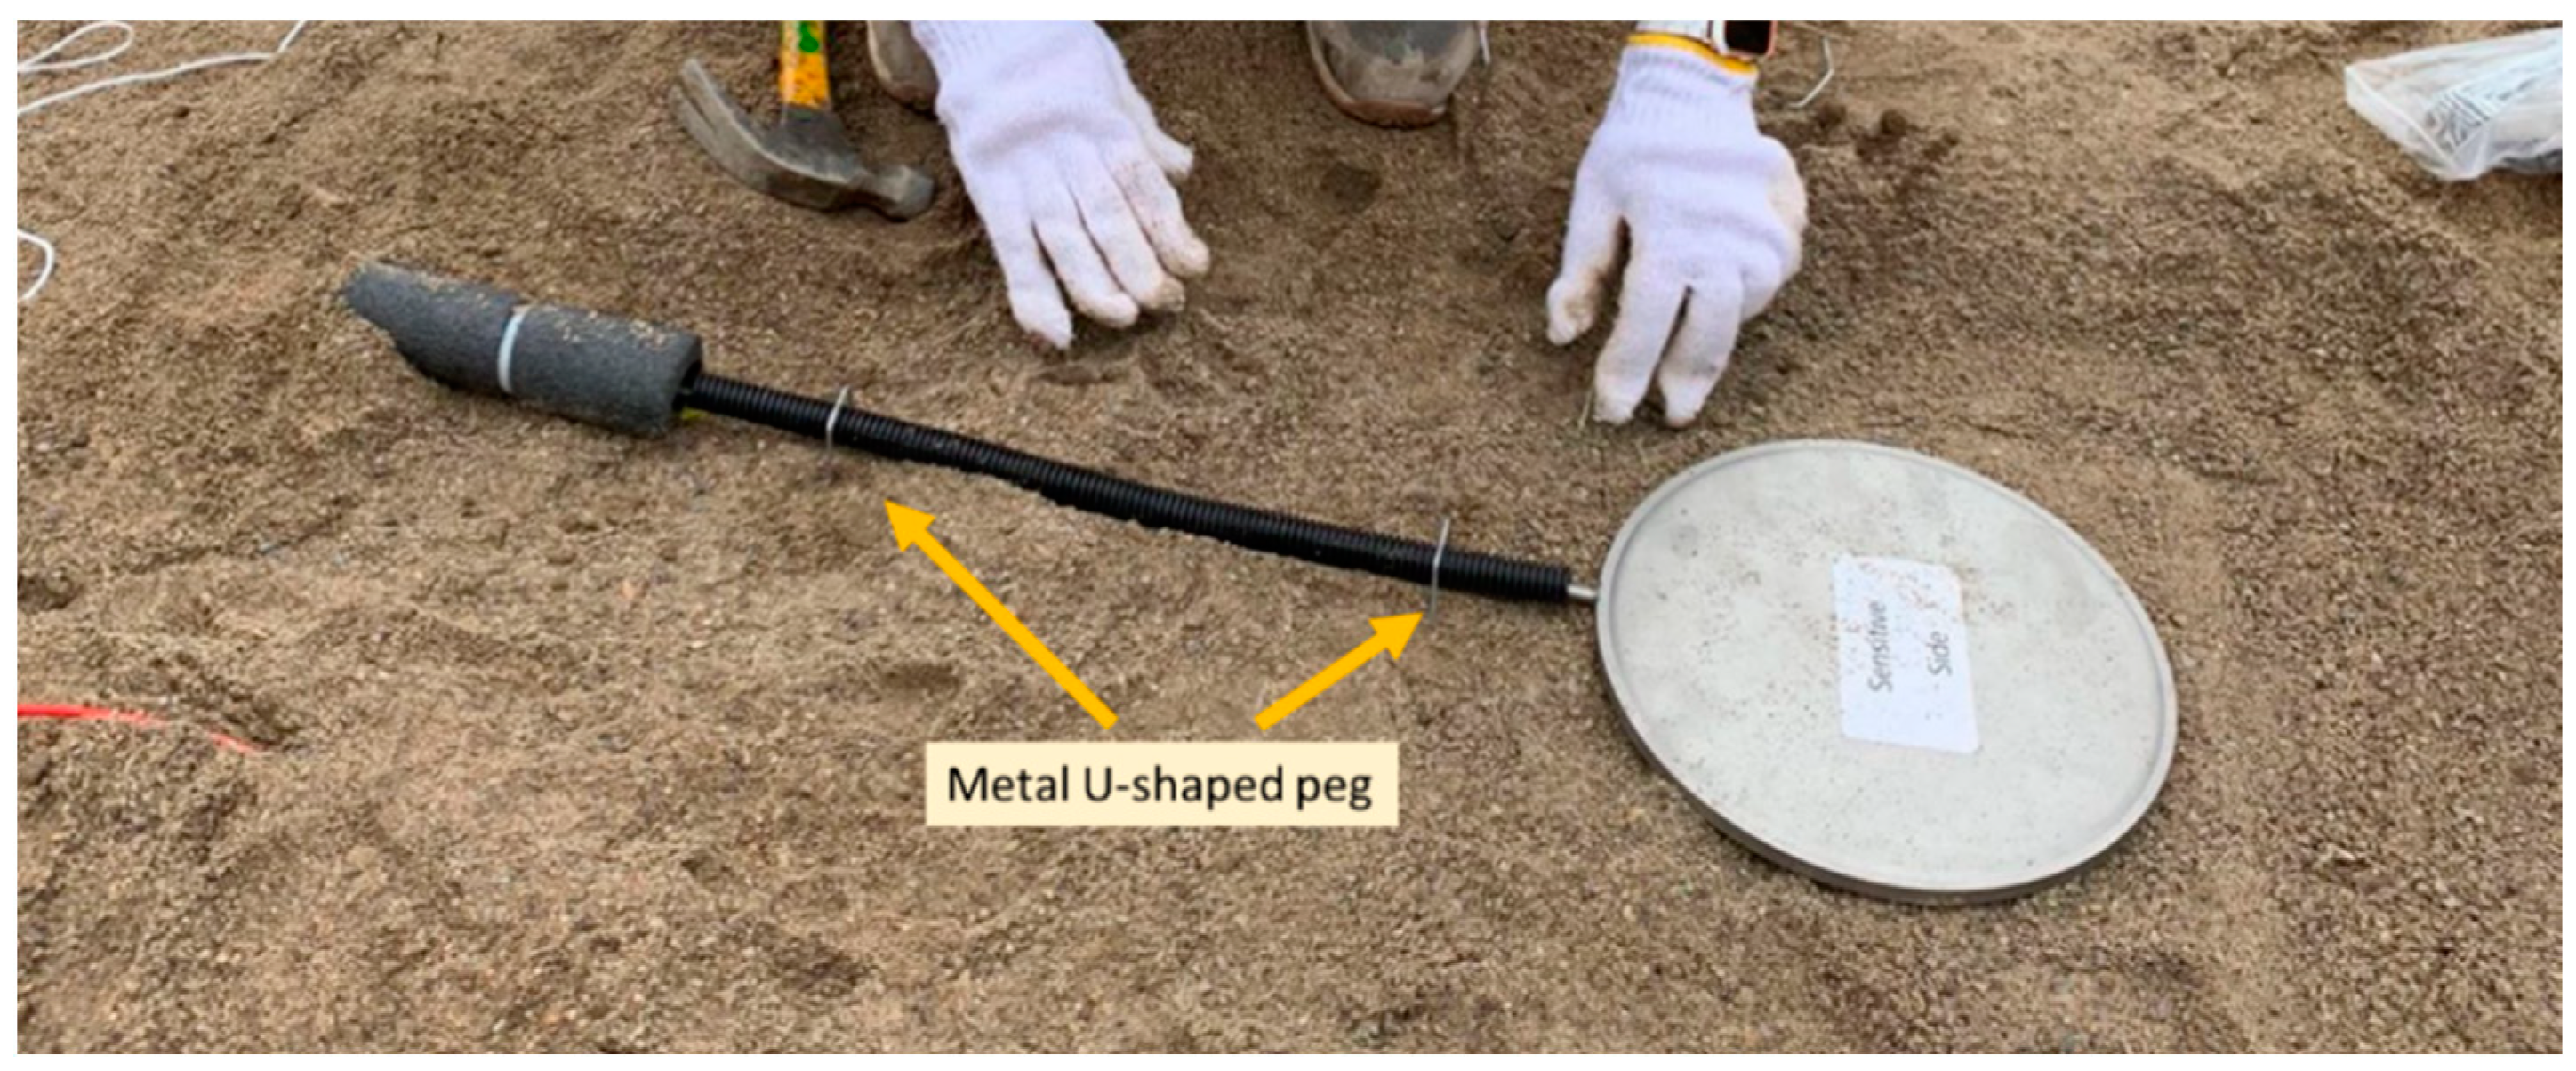
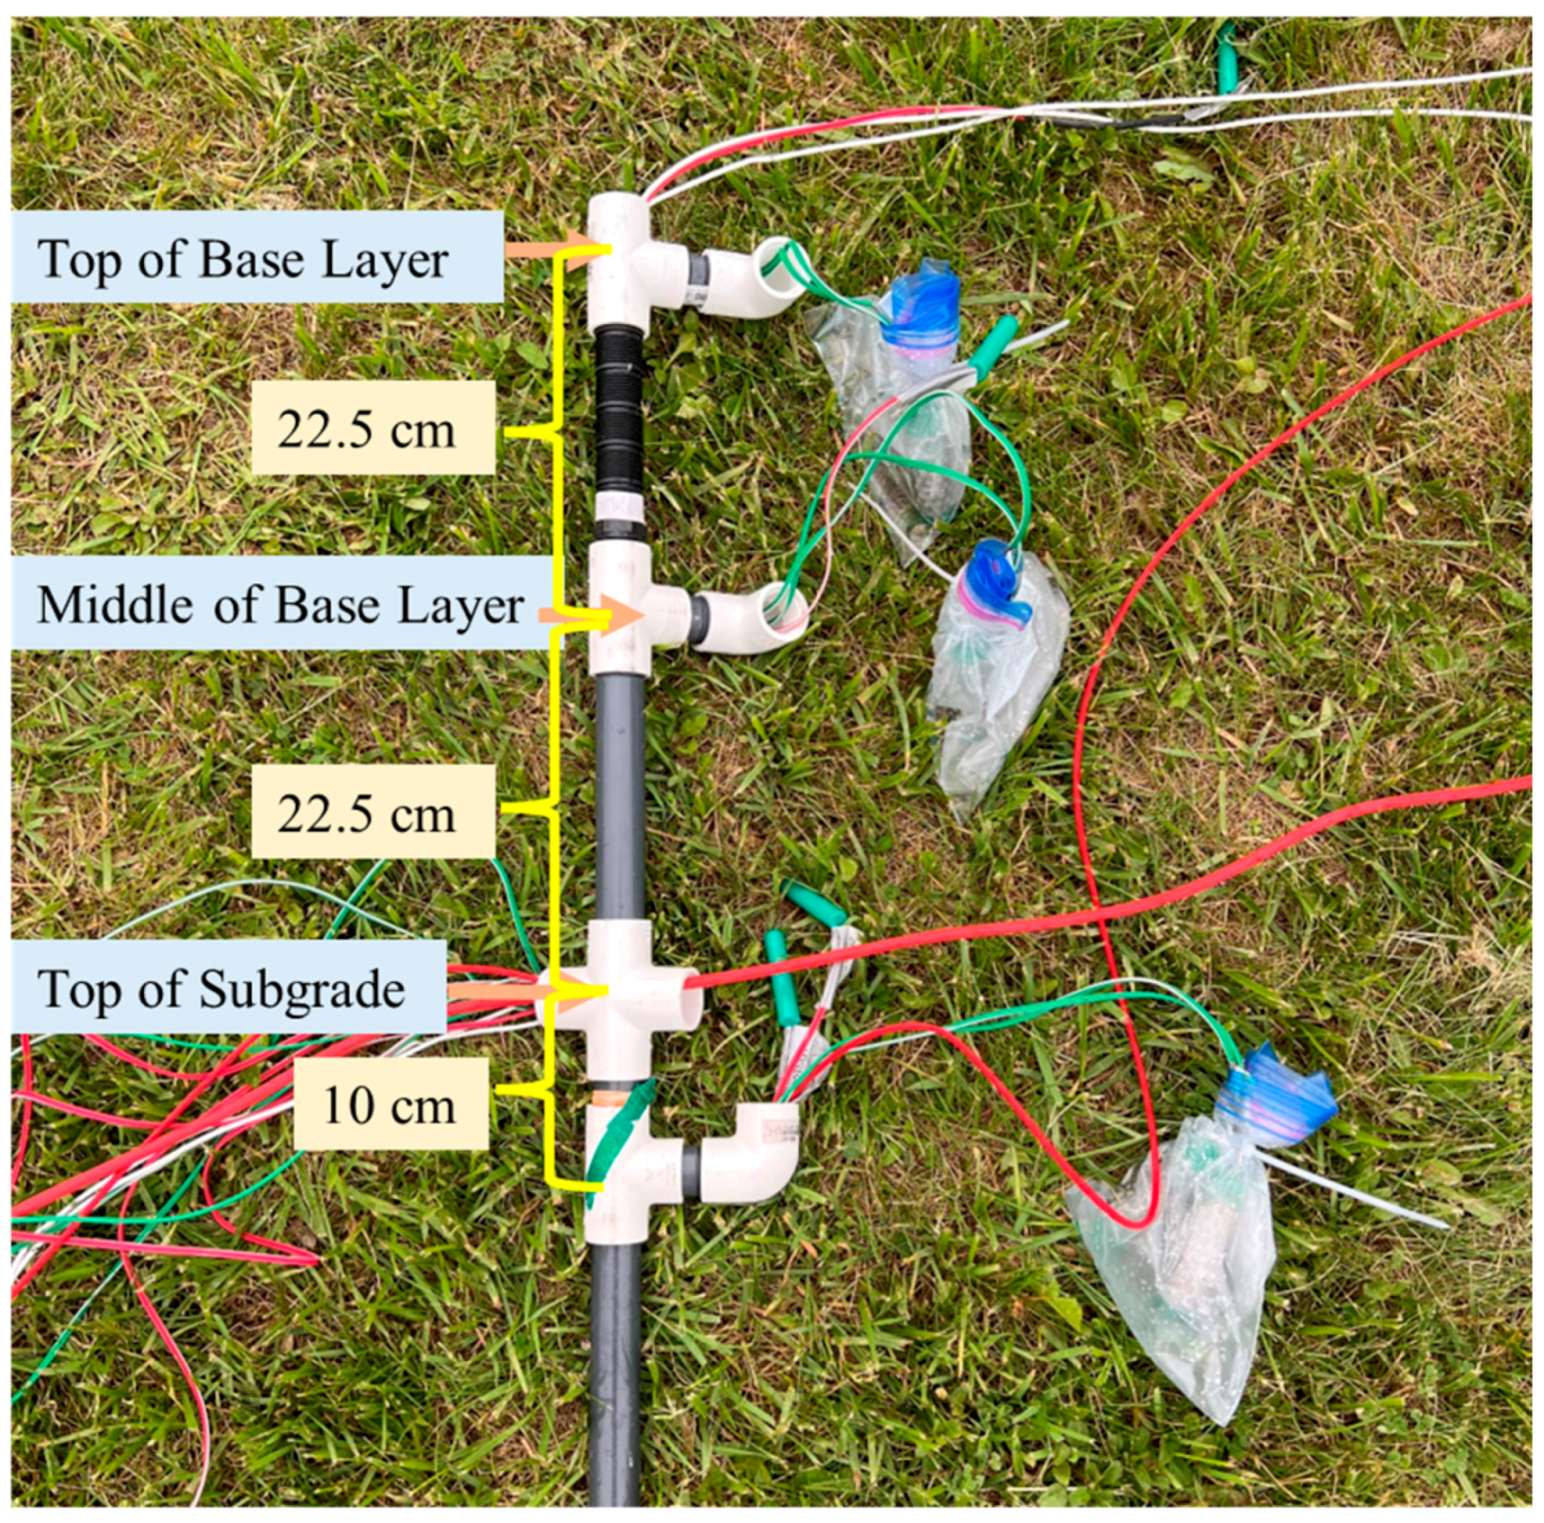
2.3.3. Total Earth Pressure Cell on Subgrade
2.3.4. Dynamic Strain Gauges in Asphalt
2.3.5. Installation of Sensor Tree and Protection
3. Construction Impacts on the Geosynthetic–Reinforced Pavements
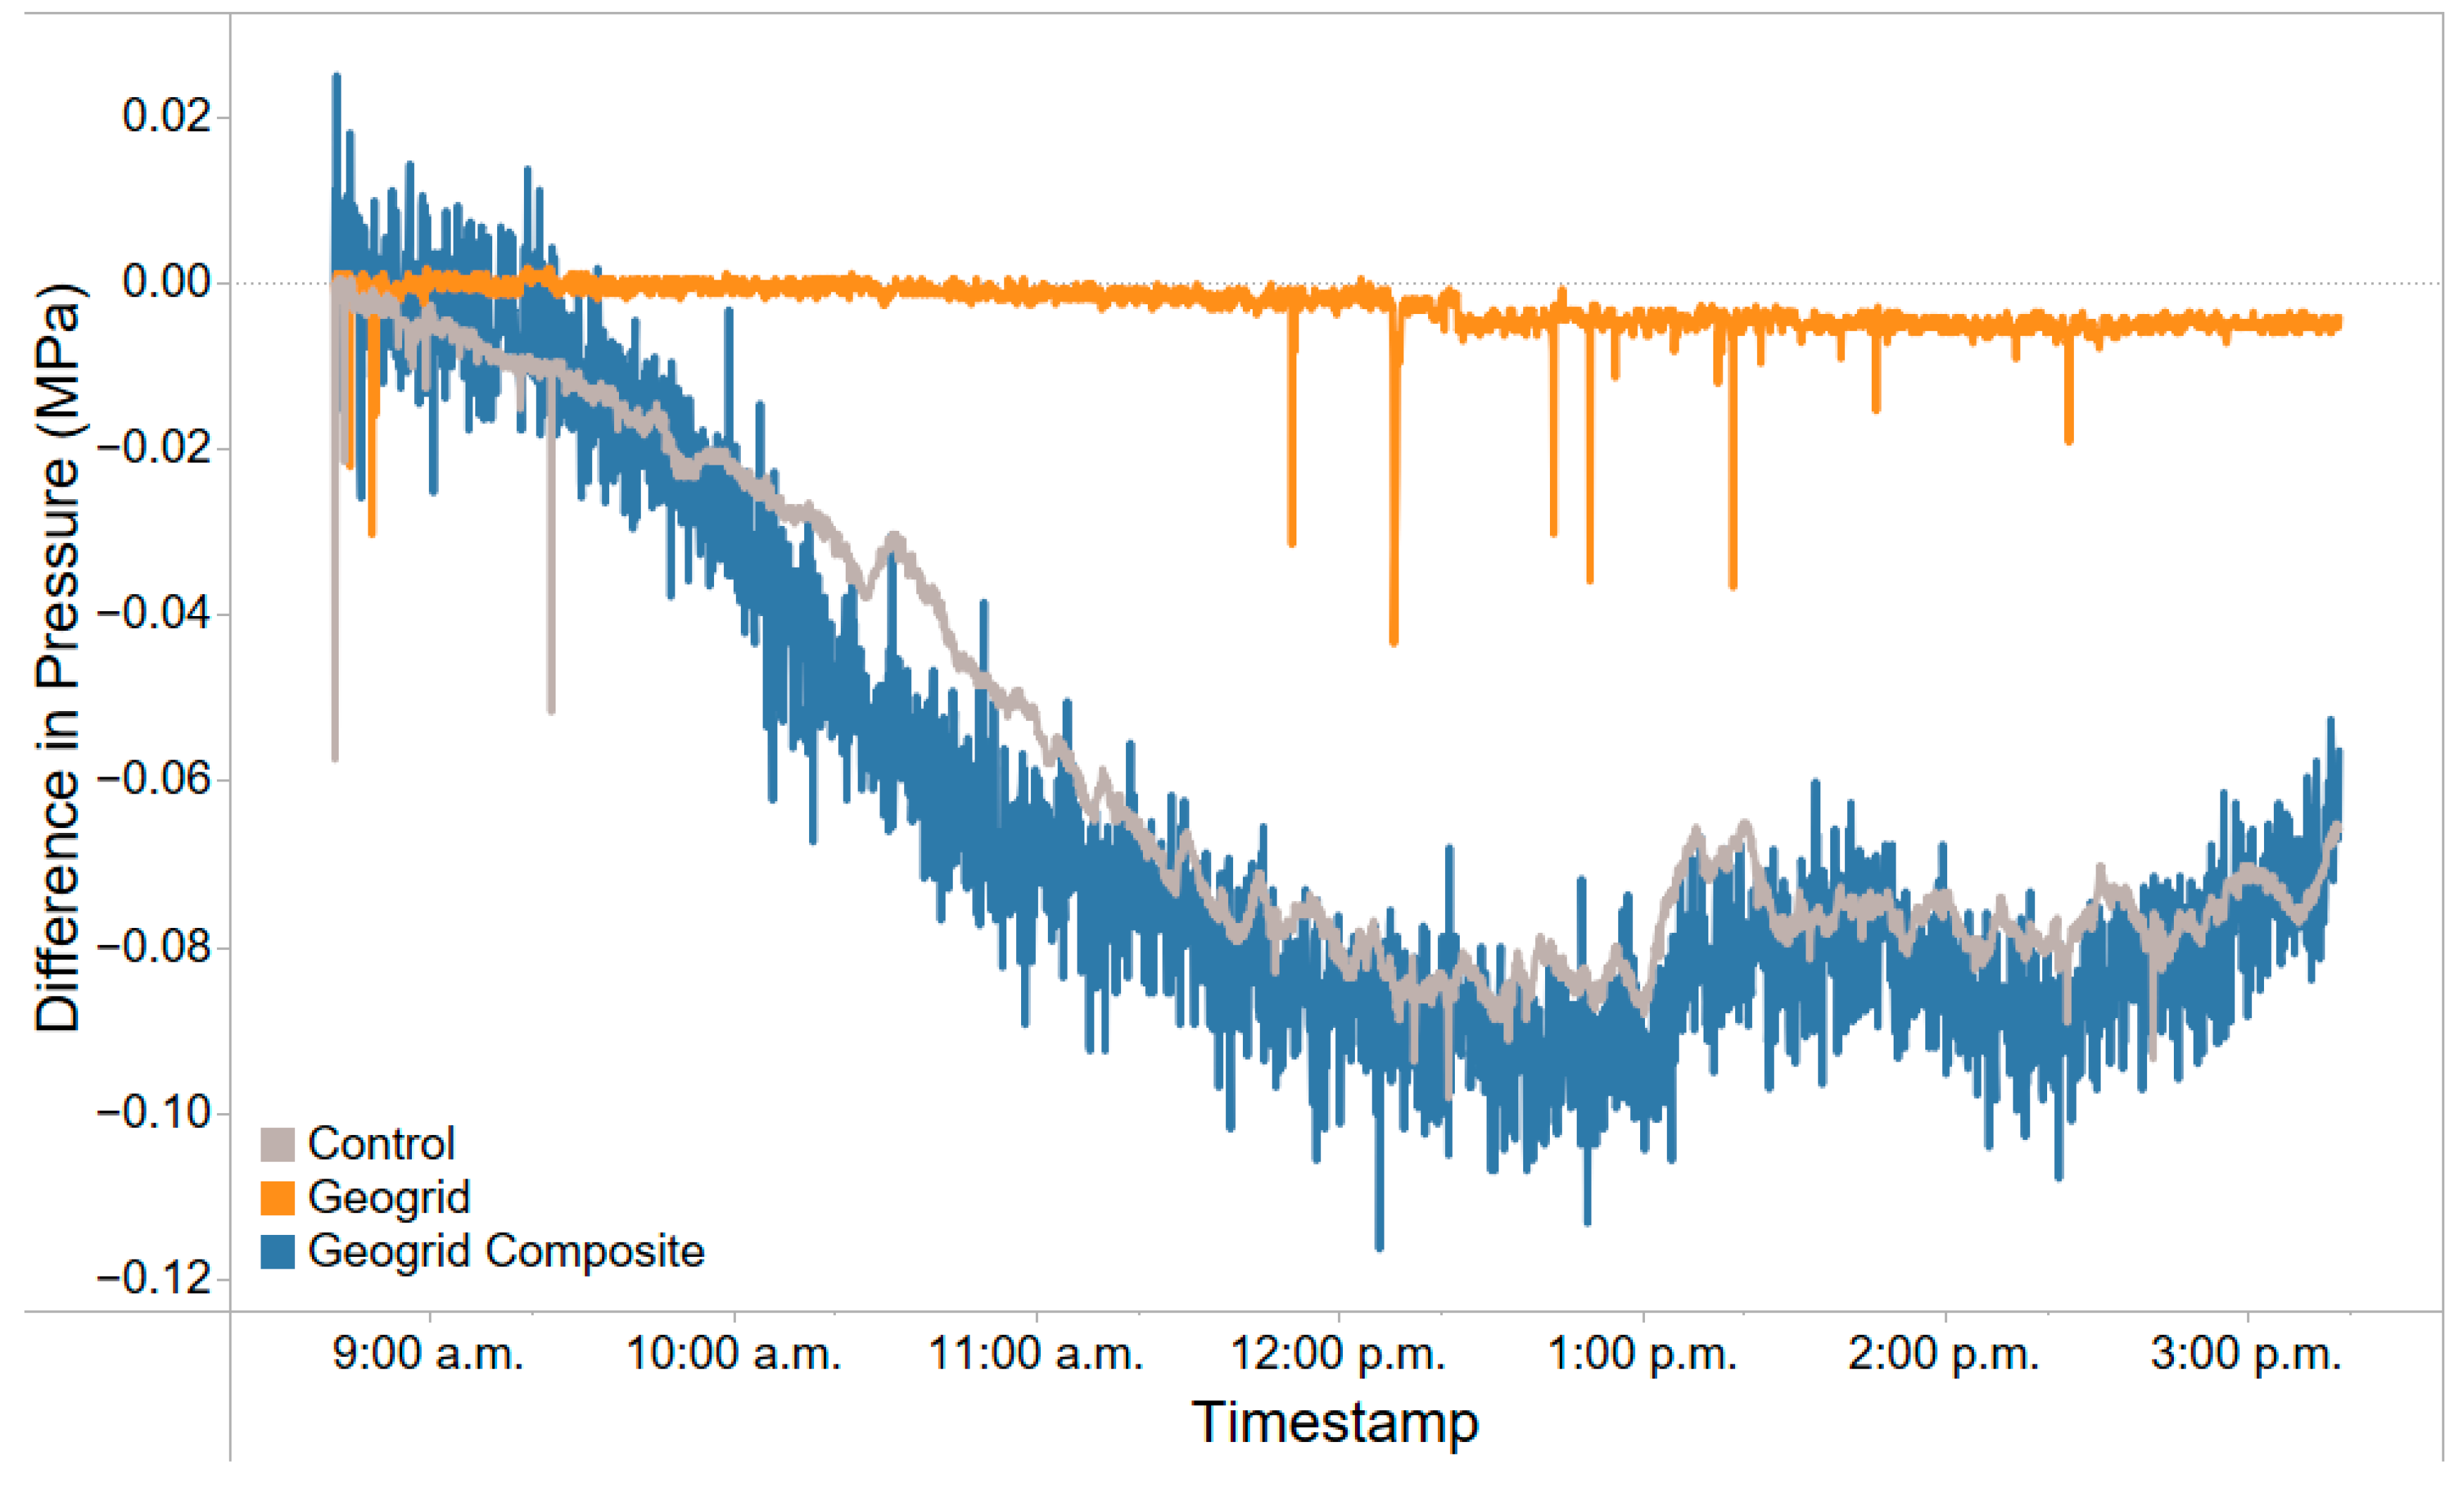
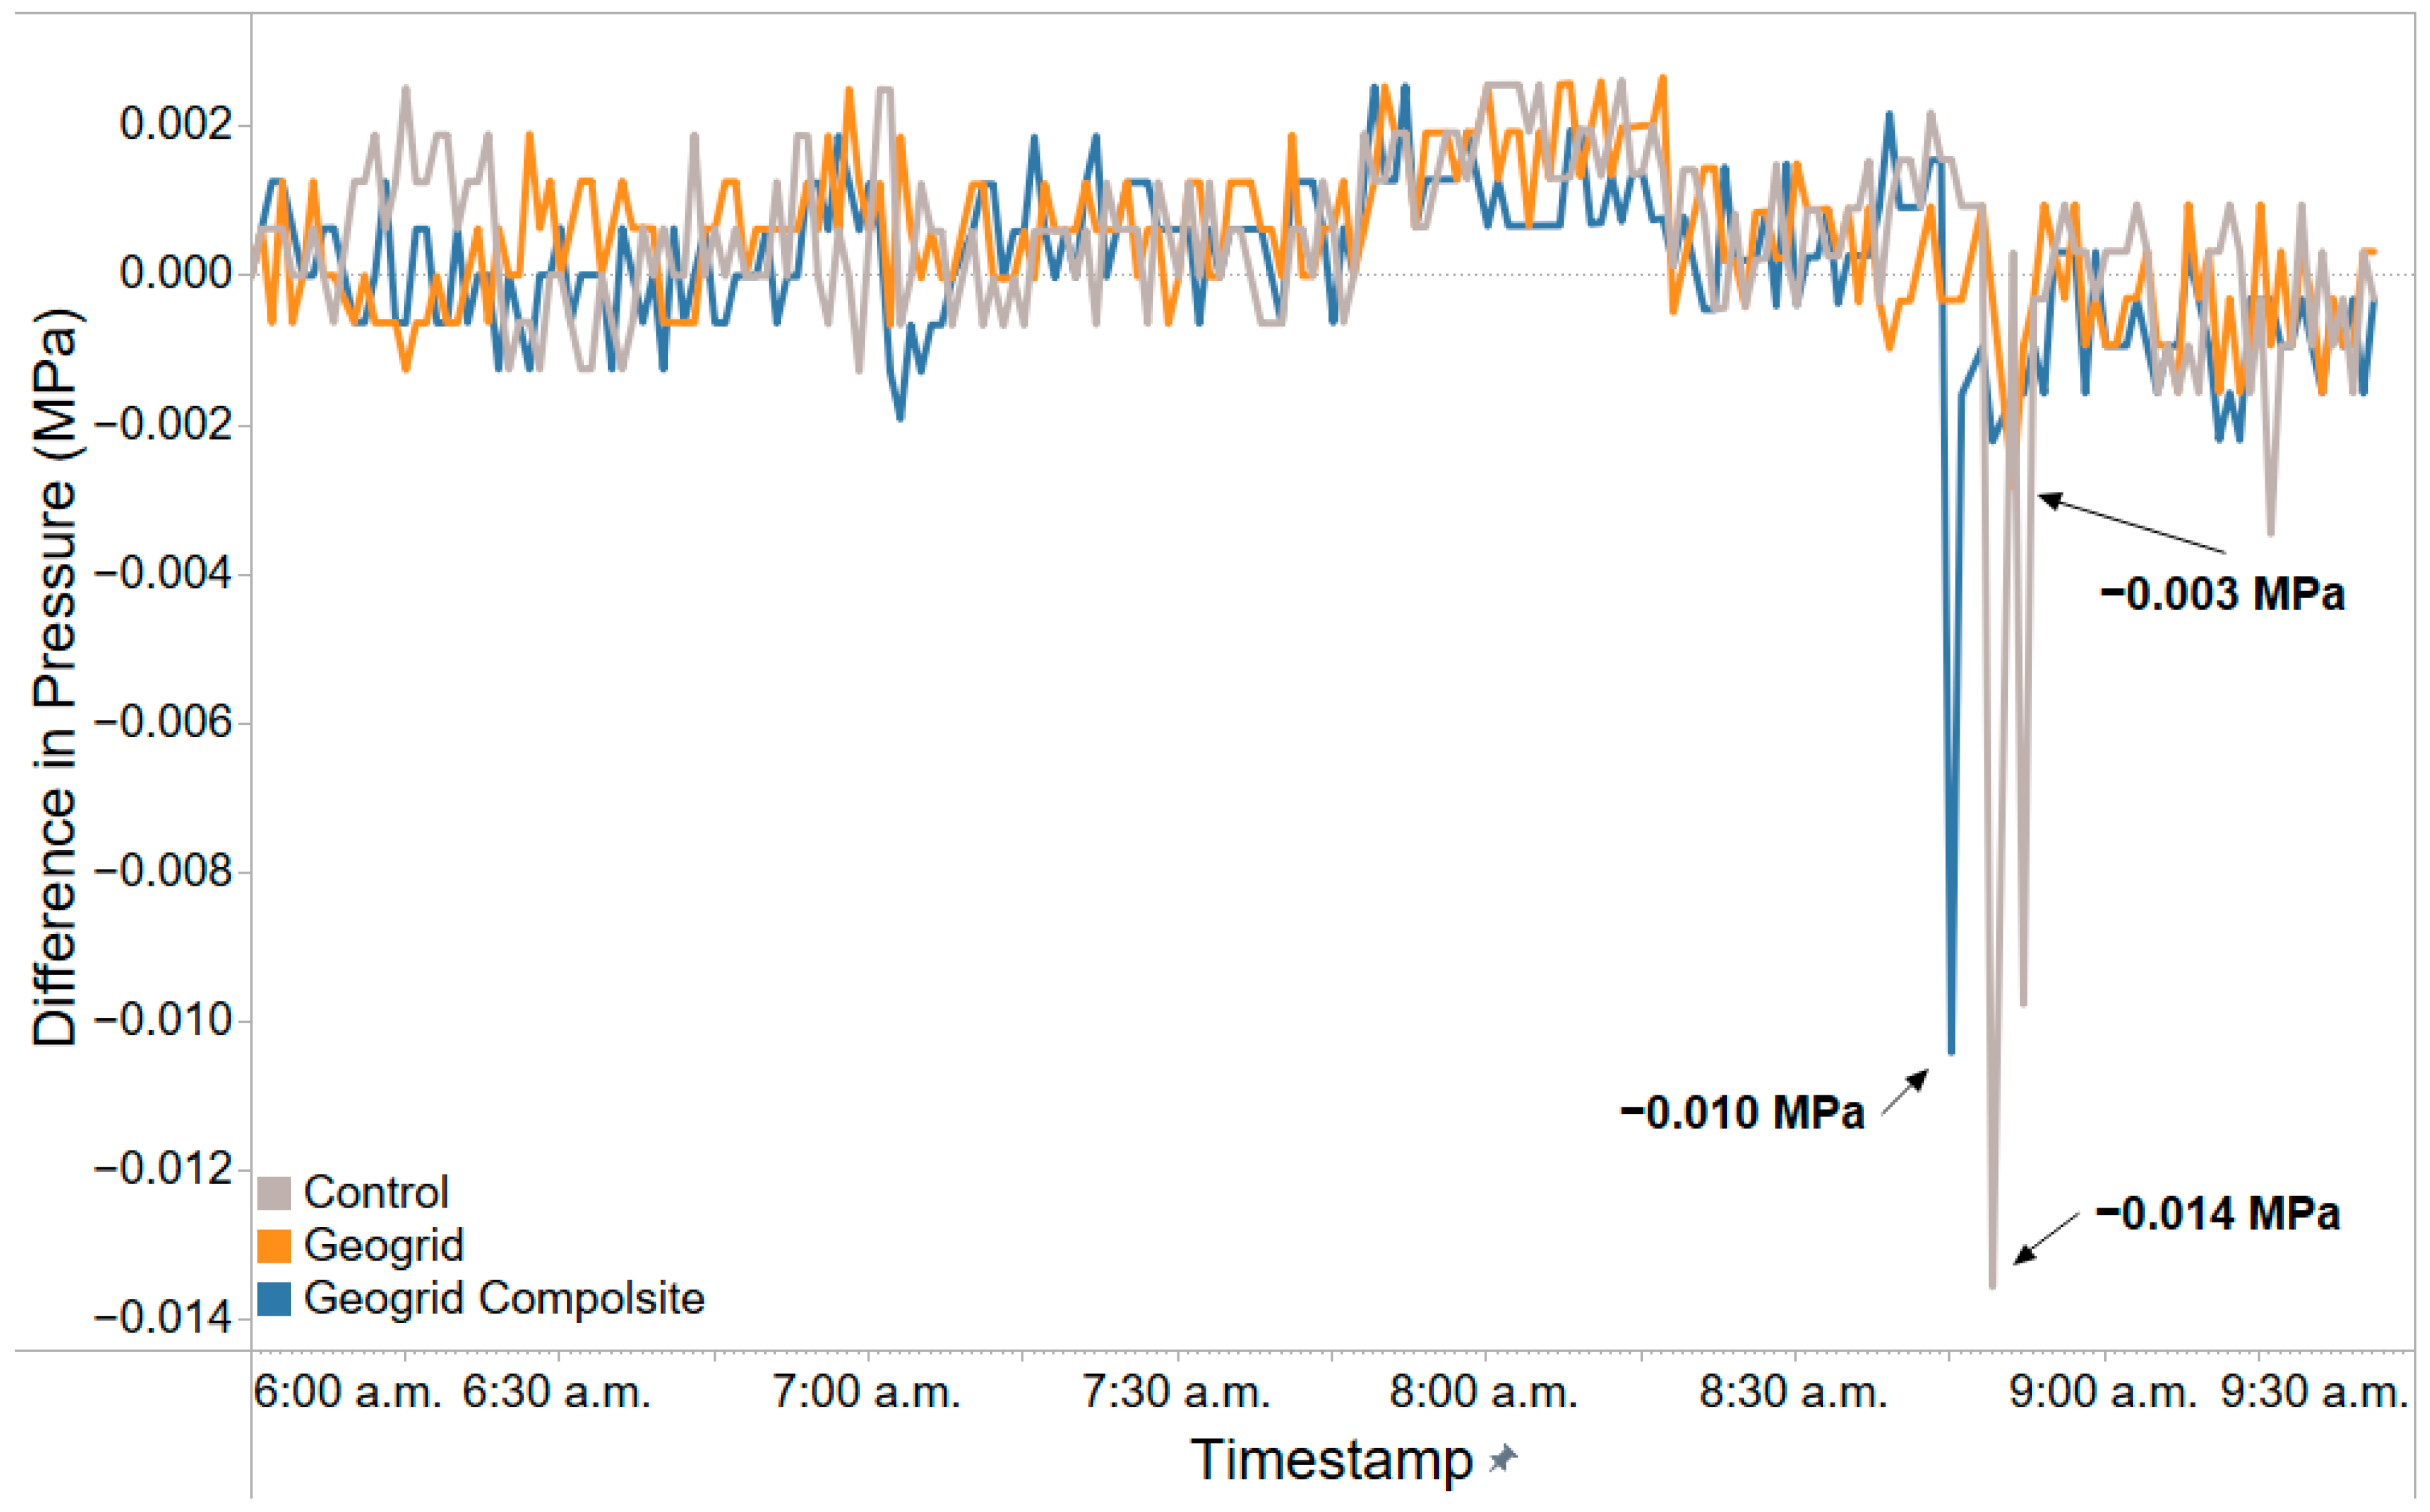
3.1. Pressure at the Interface of Subgrade and Base
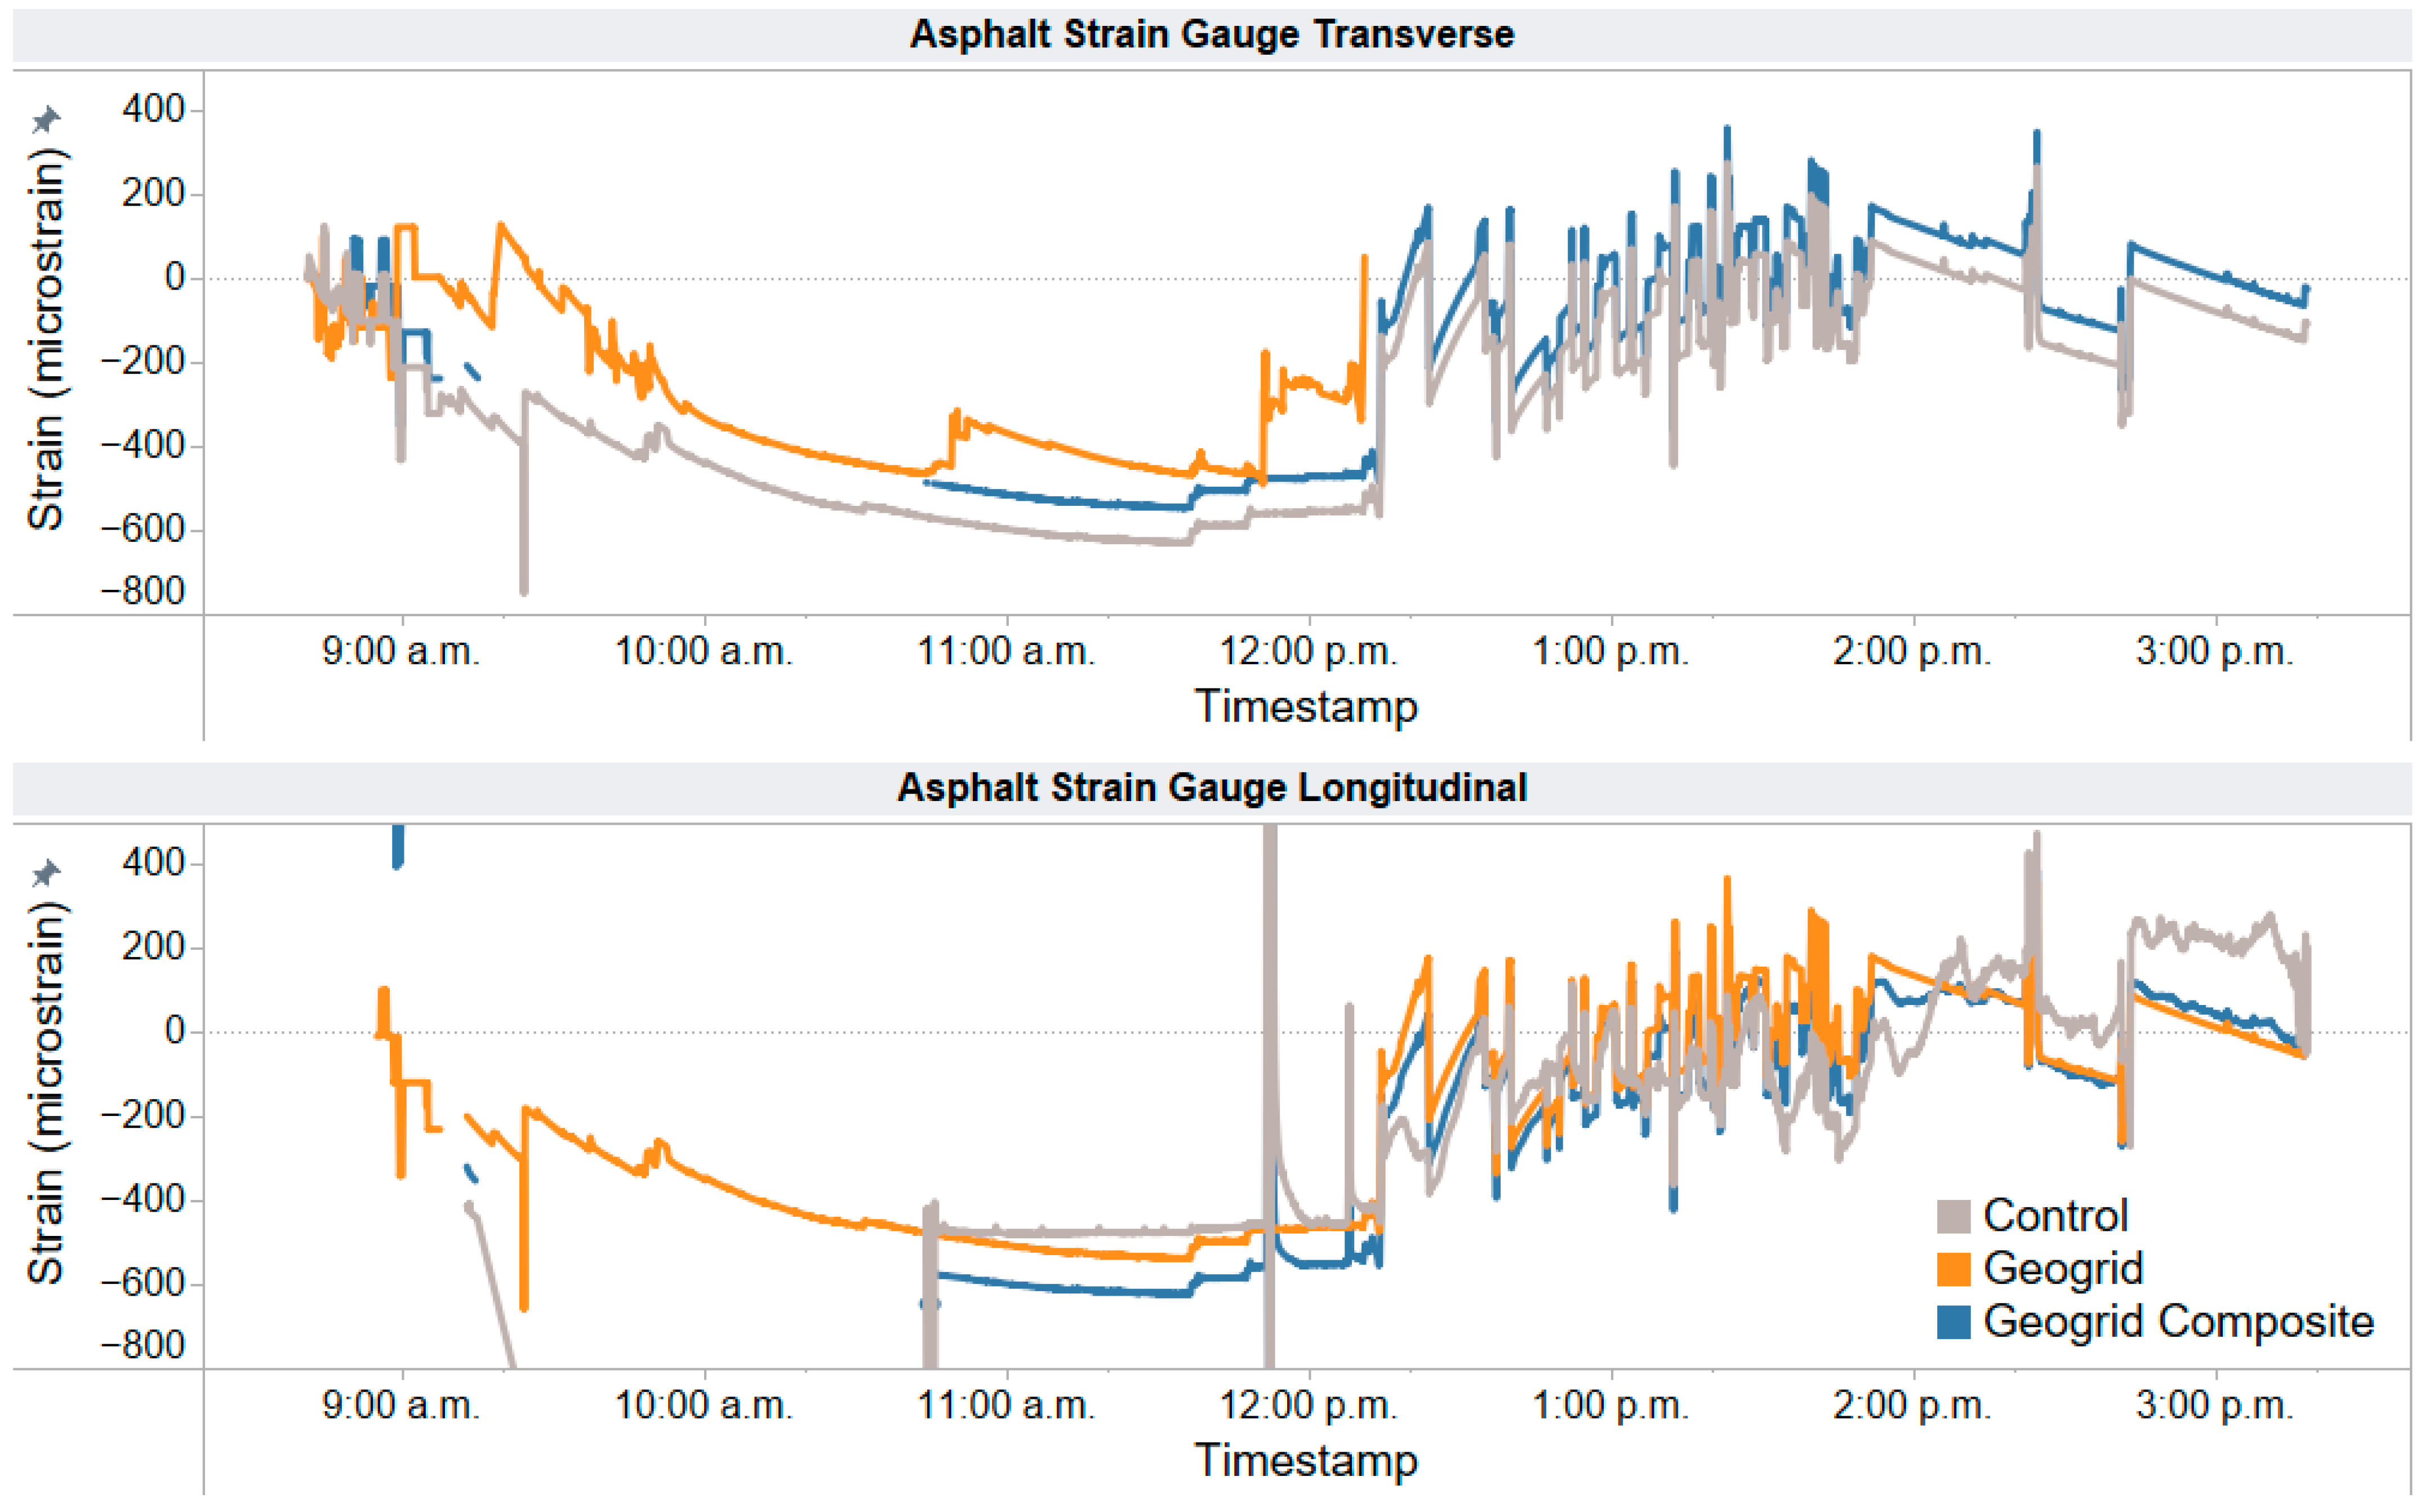
3.2. Strain within the Asphalt Binder Course
3.3. Moisture
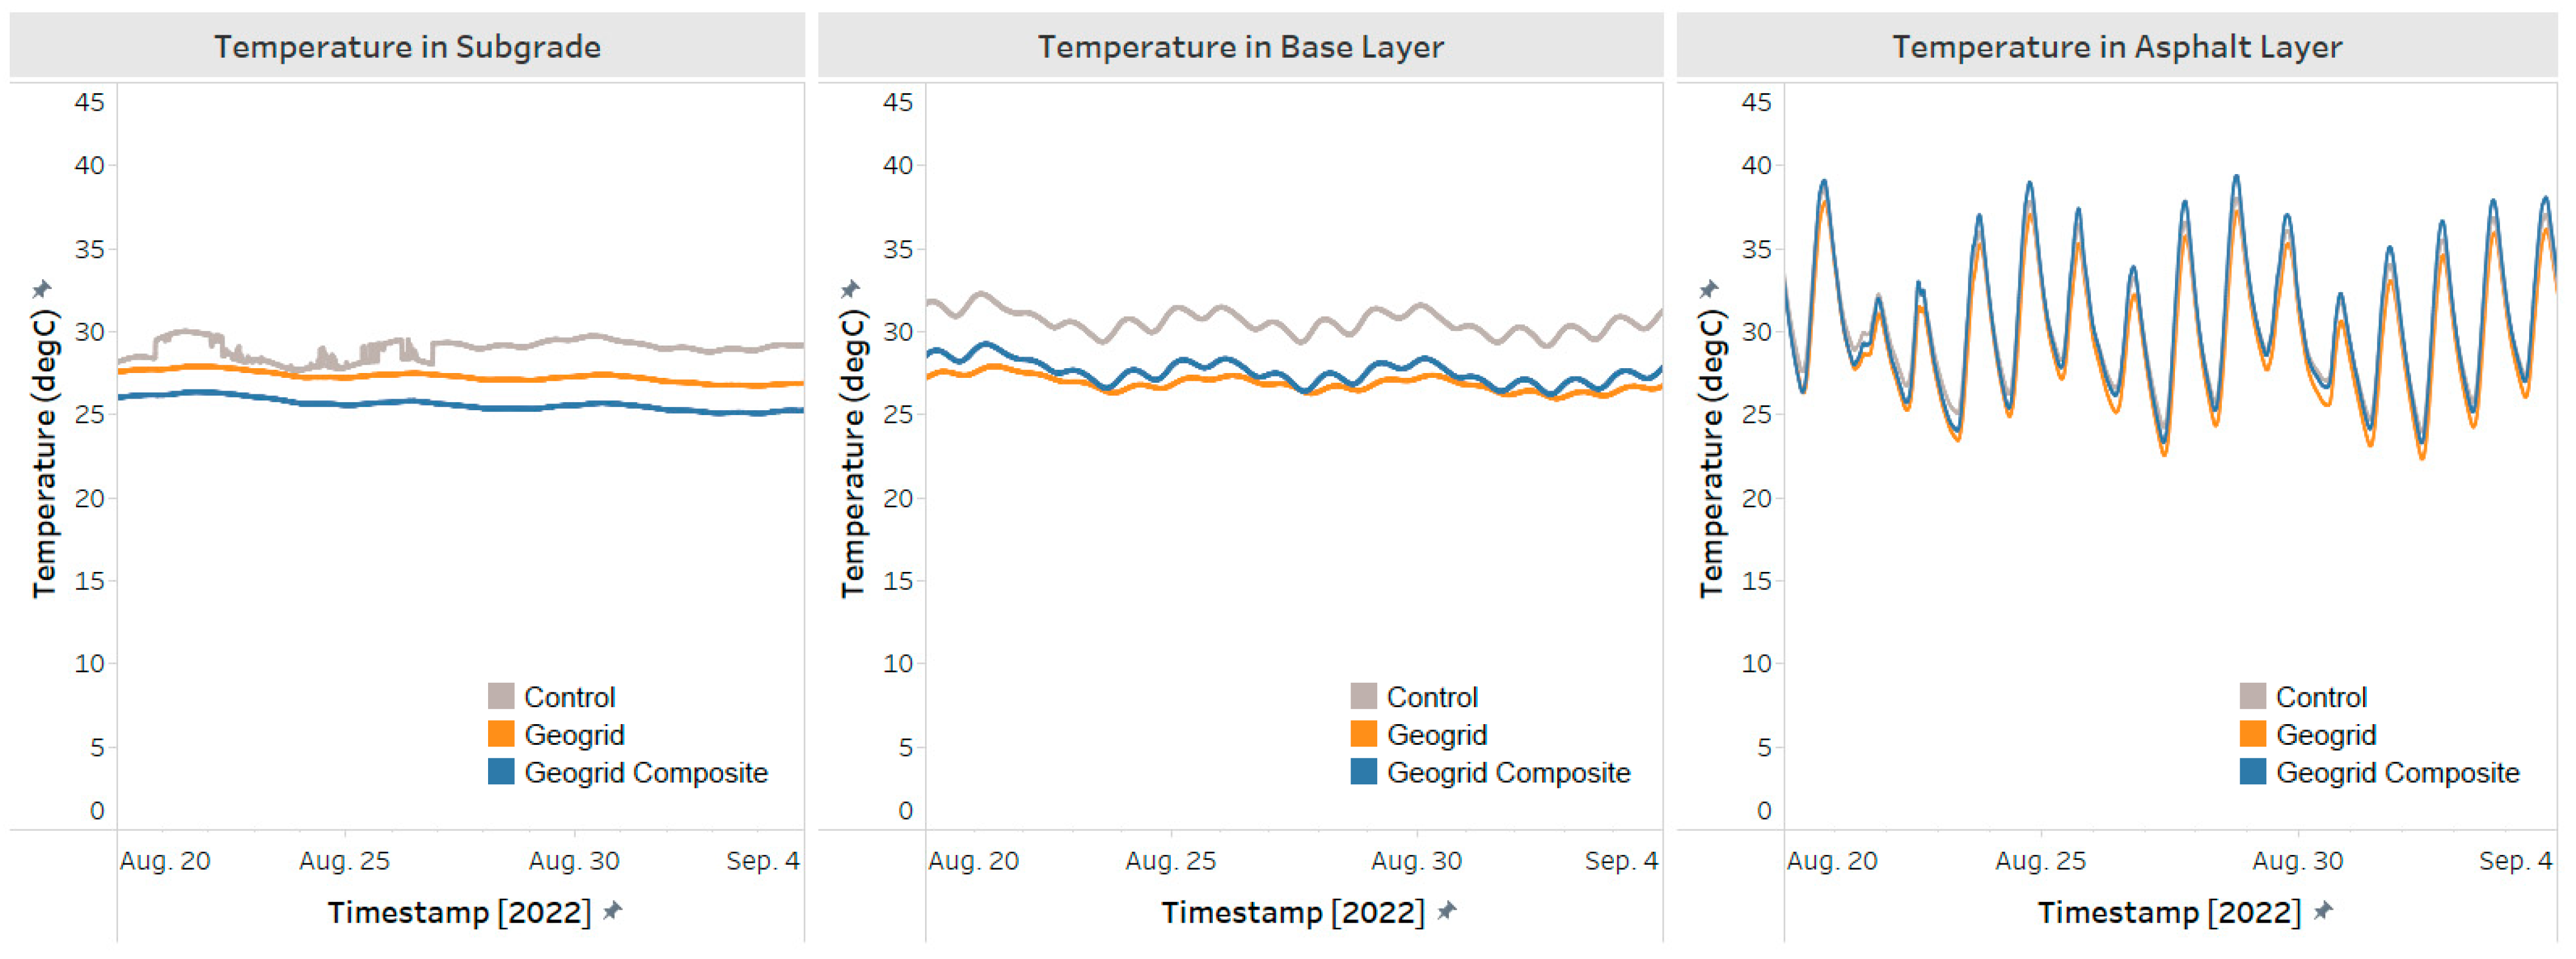
3.4. Temperature
4. Post-Construction Impact Assessment
4.1. Light Weight Deflectometer Testing
4.2. Instrumentation Monitoring
5. Conclusions
- The readings taken from pressure cells on the subgrade show that the fibreglass geogrid in the binder course can diminish the mechanical disturbances vertically from the construction of the binder course and surface course by distributing the load. The geogrid composite can offer little reinforcement of the entire structure during the construction with a similar pressure reading as observed in the control section.
- The horizontal strain in the first lift of the binder course caused by construction activities of asphalt placement can be significantly reduced by the fibreglass geogrid installed between the two lifts of the binder course in the transverse direction, with some reduction in the longitudinal direction. The geogrid composite section shows similar horizontal strain values in the binder course during construction with the control section.
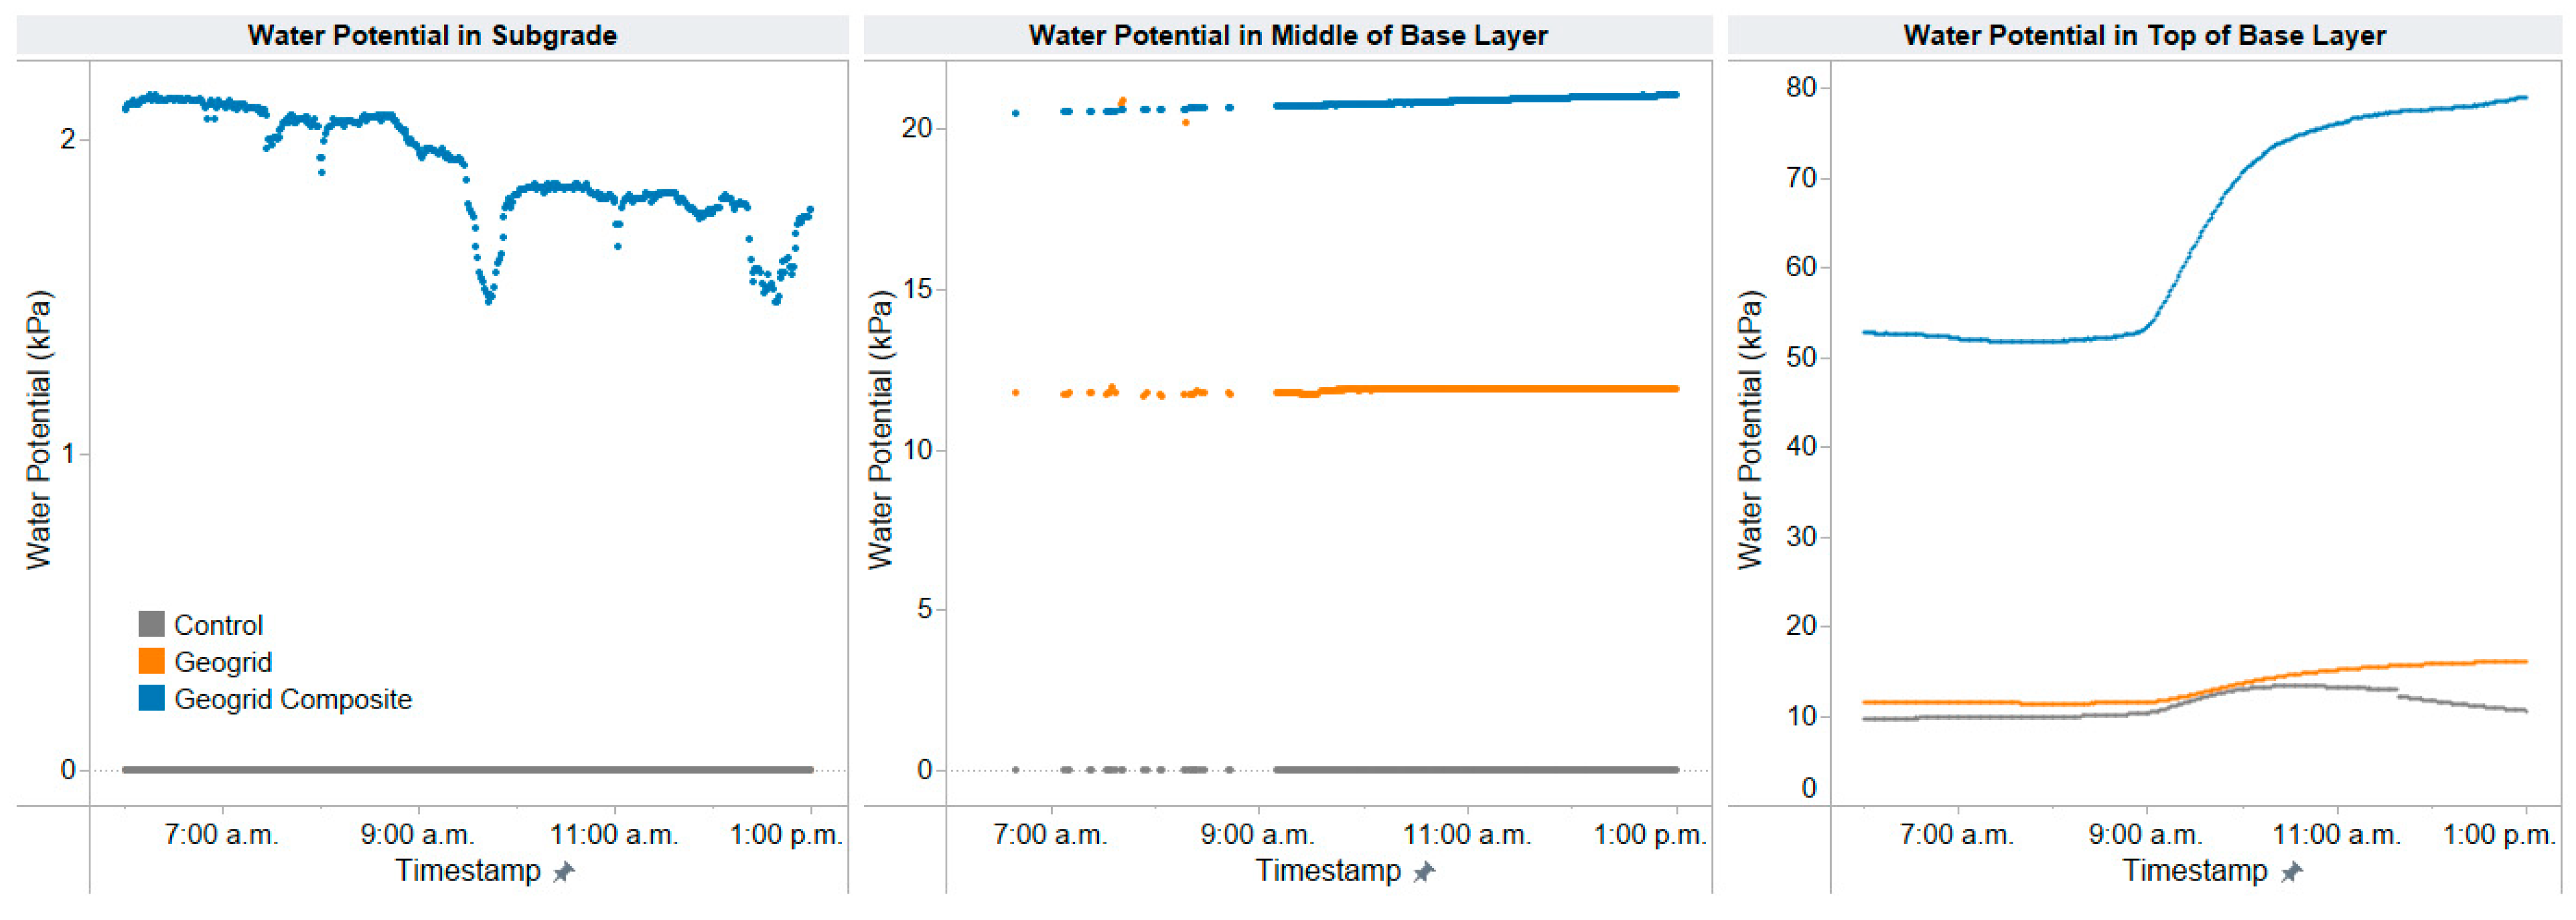
- Geogrid composite on the subgrade shows improved drainage capability and produces a distinct water potential profile within the pavement structure. The drainage, filtration, and inhibition of upward migration of moisture and fine particles were observed in the geogrid composite section with drier conditions in different depths of the pavements. This indicates an improved performance of the pavements undergoing freeze–thaw cycles and can be verified with future fieldwork at the site.
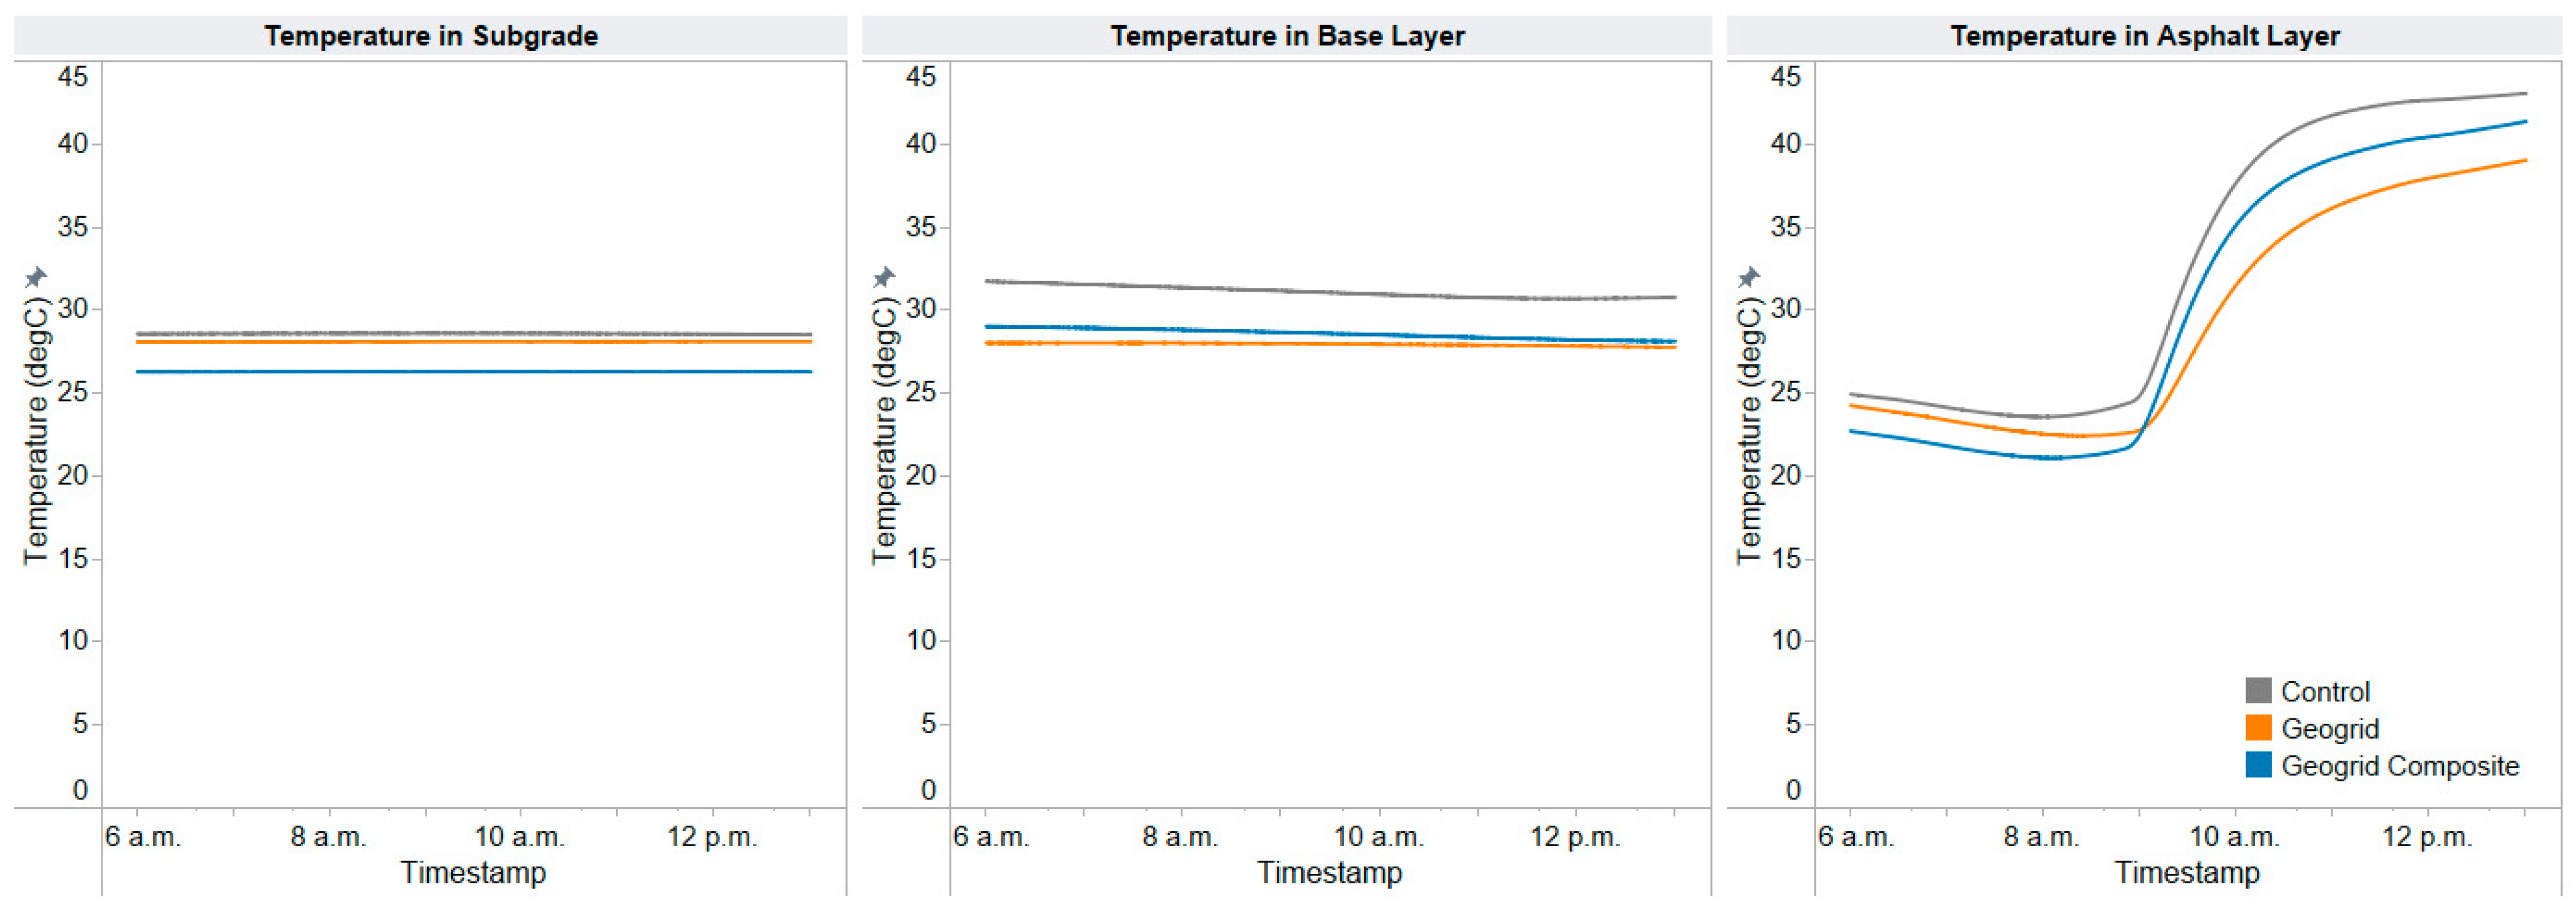
- From the temperature monitoring, the geogrid composite shows indirect insulation capability due to the drainage effect provided by the geotextile, which may decrease the potential for severe freeze–thaw damage. This observation will have to be verified using the long-term monitoring of the pavement sections.
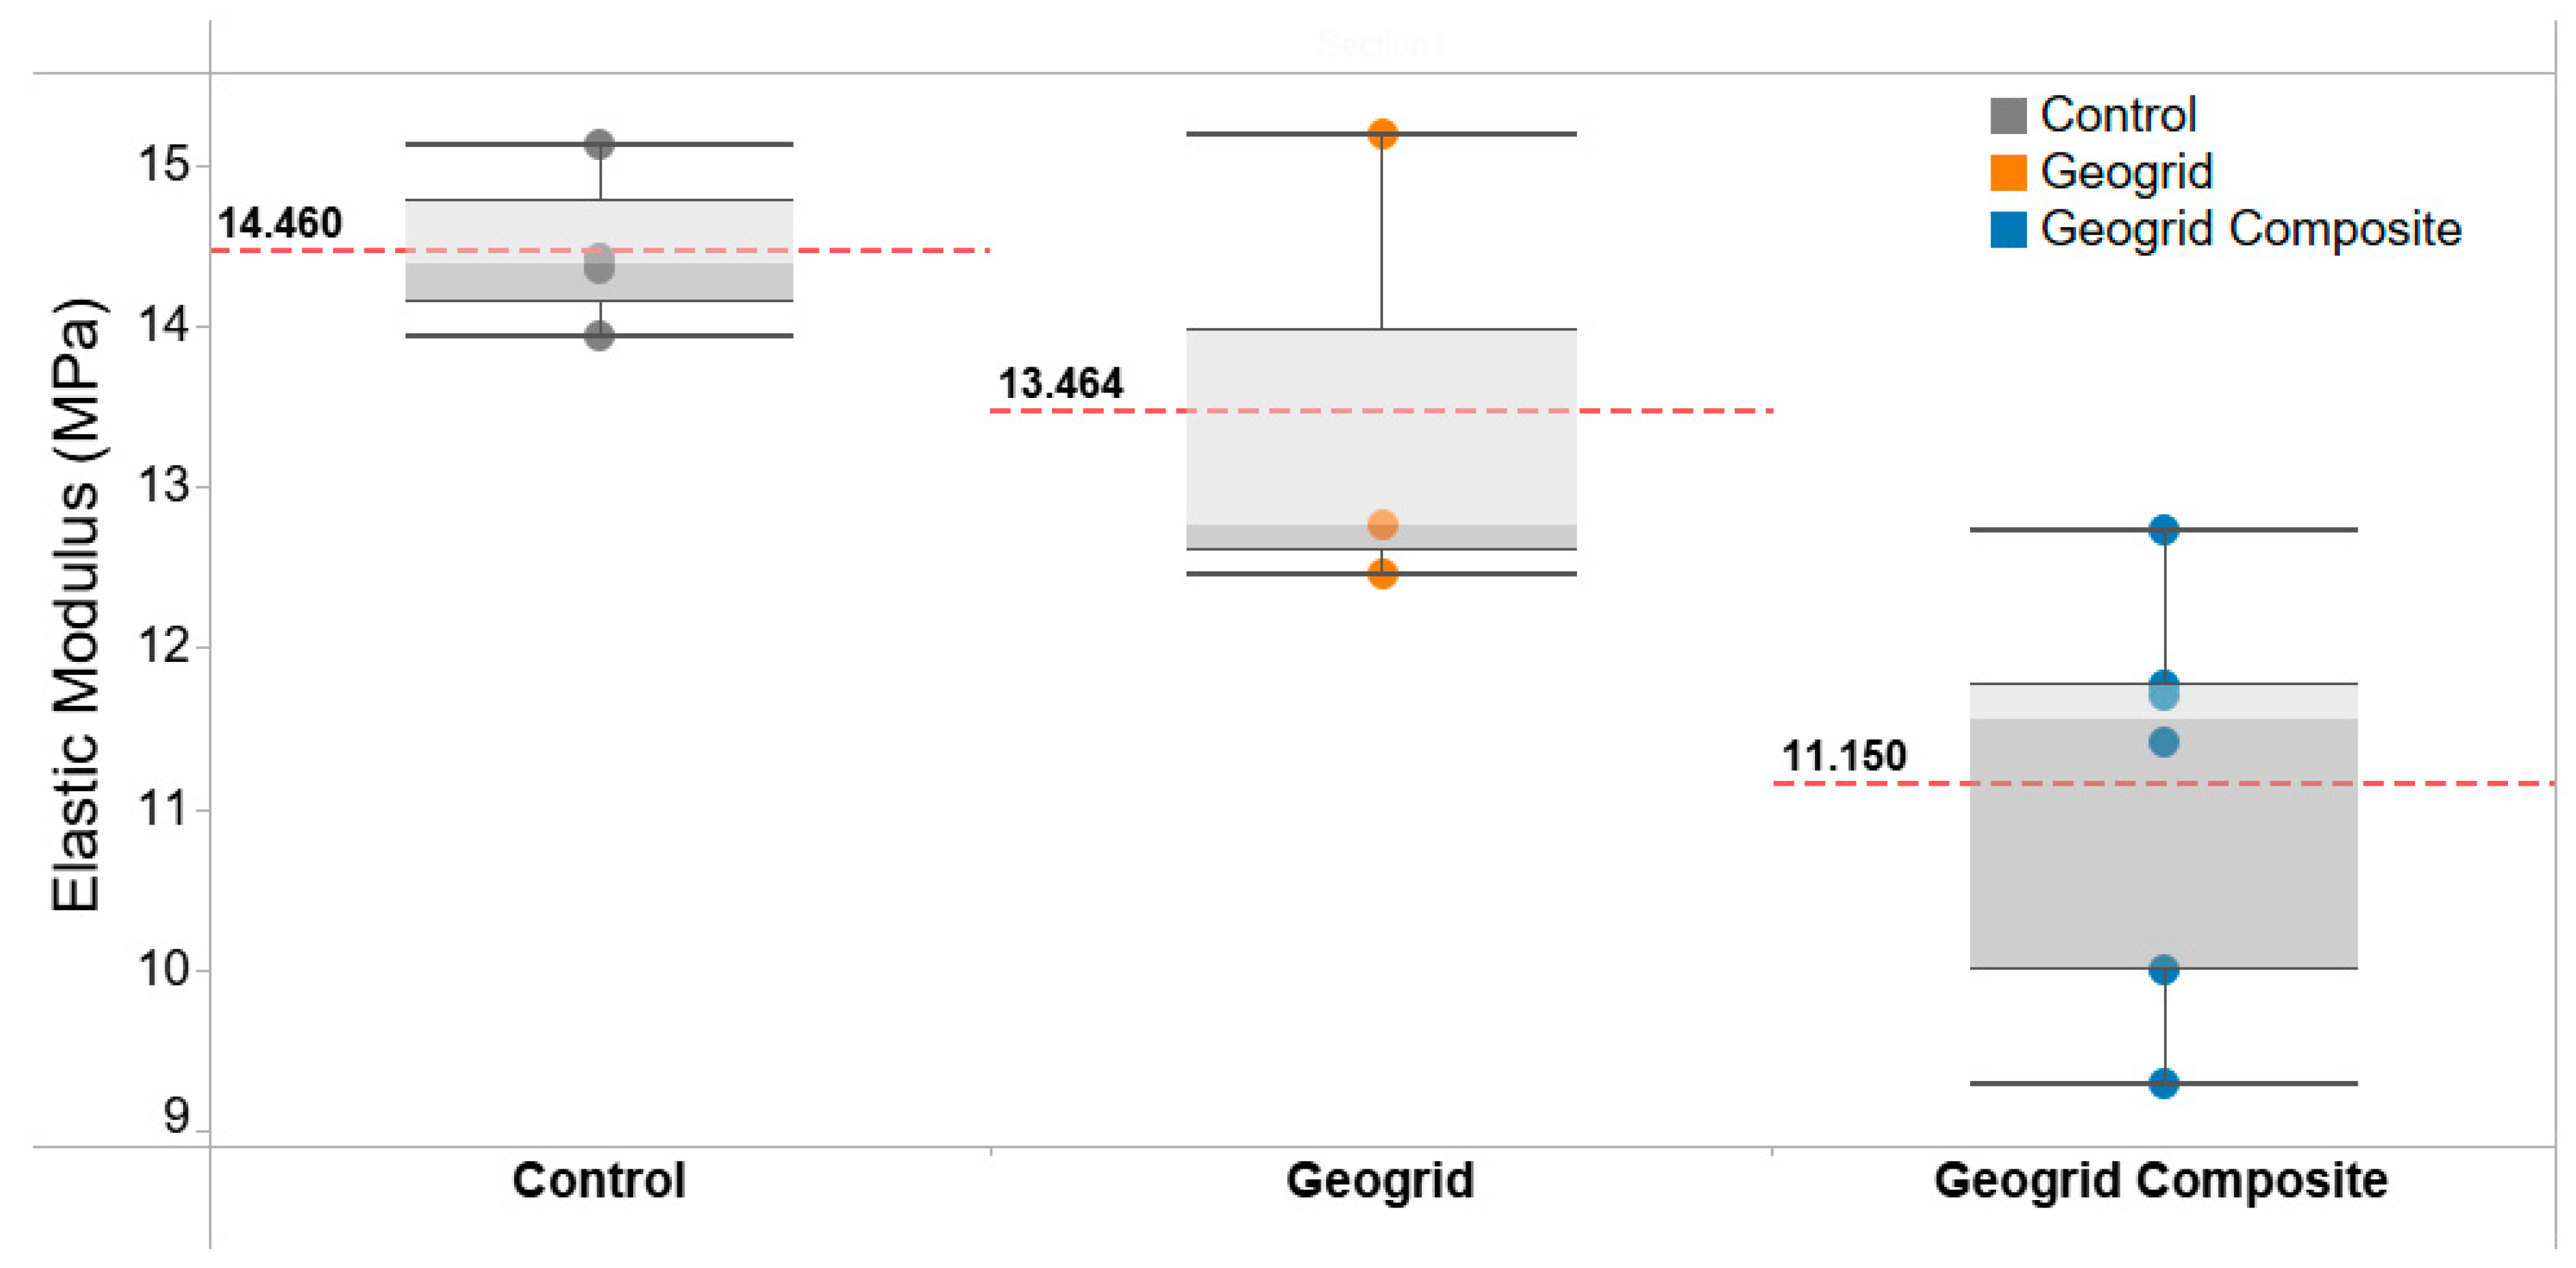
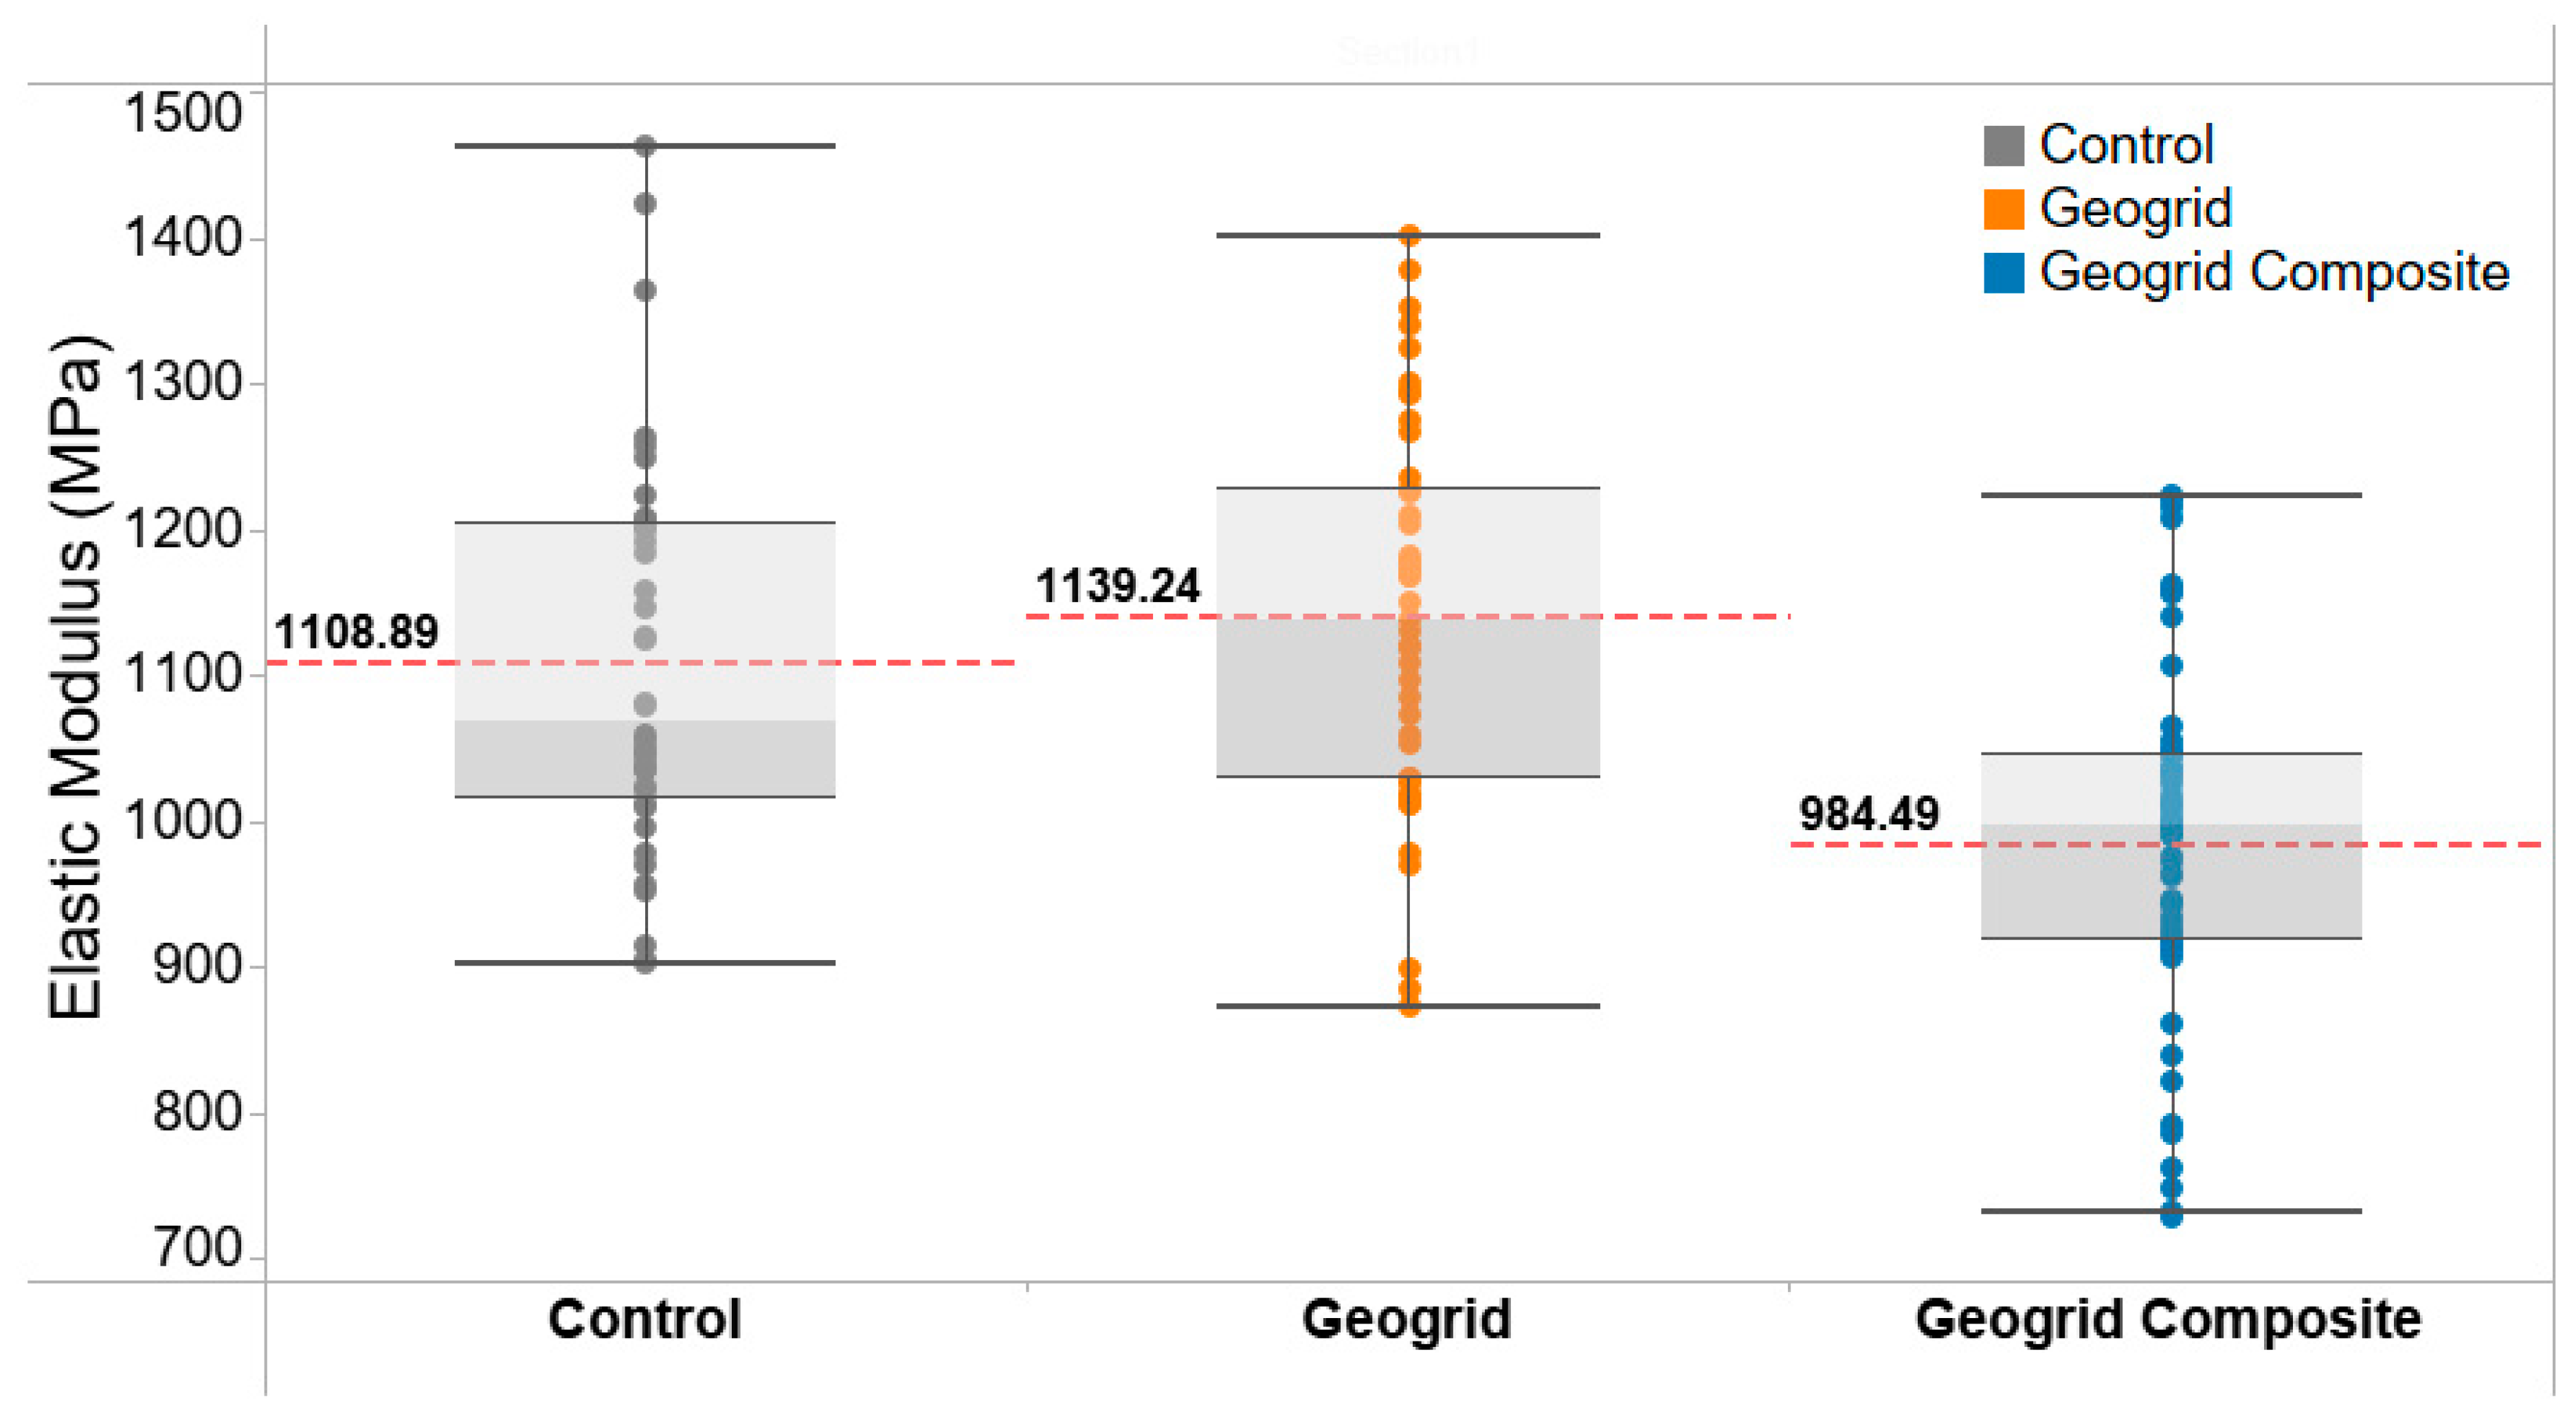
- The results of LWD testing indicate the reinforcement of the fibreglass geogrid with the highest stiffness measurements after the asphalt placement. Future fieldwork can be used to determine the long-term benefits of the geosynthetic.
- Data collected during two weeks after construction verified that all instrumentations were functioning as expected. A longer monitoring process would be beneficial to evaluate the pavement performance to reduce the prevalence of outliers and spikes in the sensor measurements. Furthermore, further field investigations are recommended to study the long-term behaviour of geosynthetic-reinforced pavements. Non-destructive pavement evaluation techniques can be used to evaluate the permanent deformation under the traffic loading, and the fatigue damage caused by the repetitive loading. Based on the moisture and temperature results, long-term monitoring will also be beneficial to evaluate the performance of the pavement sections after they experience freeze–thaw cycles to investigate the ability of geosynthetic composites to mitigate freeze-thaw.
- With certain financial and technical constraints, which limited the ability to employ a larger number of sensors to provide duplication, it is recommended to verify the mechanical responses obtained from the strain gauges and pressure cells by applying certain traffic loading on the pavements; it can also help monitor the performance of in-service pavements.
Author Contributions
Funding
Institutional Review Board Statement
Informed Consent Statement
Data Availability Statement
Conflicts of Interest
References
- Ghafoori, N.; Sharbaf, M. Use of Geogrid for Strengthening and Reducing the Roadway Structural Sections; Department of Transportation: Carson City, NV, USA, 2016.
- Behera, B.; Nanda, R.P. Geogrid Reinforced Brick Buildings for Earthquake Disaster Mitigations. Case Stud. Constr. Mater. 2022, 16, e01113. [Google Scholar] [CrossRef]
- Han, J.; Akins, K. Use of Geogrid-Reinforced and Pile-Supported Earth Structures. In Deep Foundations 2002: An International Perspective on Theory, Design, Construction, and Performance; ASCE: Reston, VA, USA, 2002; pp. 668–679. [Google Scholar] [CrossRef]
- Jain, S.K.; Nusari, M.S.; Shrestha, R.; Mandal, A.K. Use of RCC Pile, Anchor Bolt and Geogrid for Building Construction on the Unstable Slope. Geoenviron. Disasters 2023, 10, 13. [Google Scholar] [CrossRef]
- Das, B.M. Use of Geogrid in the Construction of Railroads. Innov. Infrastruct. Solut. 2016, 1, 1–12. [Google Scholar] [CrossRef]
- Caltabiano, M.A.; Brunton, J.M. Reflection Cracking in Asphalt Overlays; Association of Asphalt Paving Technologists Technical Sessions: Seattle, WA, USA, 1991; Volume 60. [Google Scholar]
- Brown, S.F.; Thom, N.H.; Sanders, P.J. A Study of Grid Reinforced Asphalt to Combat Reflection Cracking; Association of Asphalt Paving Technologists Technical Sessions: Seattle, WA, USA, 2001; Volume 70, pp. 543–571. [Google Scholar]
- Sobhan, K.; Tandon, V. Mitigating Reflection Cracking in Asphalt Overlays Using Geosynthetic Reinforcements. Road Mater. Pavement Des. 2008, 9, 367–387. [Google Scholar] [CrossRef]
- Lee, S.J. Mechanical Performance and Crack Retardation Study of a Fiberglass-Grid-Reinforced Asphalt Concrete System. Can. J. Civ. Eng. 2008, 35, 1042–1049. [Google Scholar] [CrossRef]
- Arsenie, I.M.; Chazallon, C.; Duchez, J.L.; Mouhoubi, S. Modelling of the Fatigue Damage of a Geogrid-Reinforced Asphalt Concrete. Road Mater. Pavement Des. 2016, 18, 250–262. [Google Scholar] [CrossRef]
- Darzins, T.; Qiu, H.; Xue, J. A Preliminary Laboratory Study of Fatigue Performance of Geogrid-Reinforced Asphalt Beam. In Proceedings of the 6th GeoChina International Conference on Civil & Transportation Infrastructures: From Engineering to Smart & Green Life Cycle Solutions, Nanchang, China, 19–21 July 2021; pp. 67–77. [Google Scholar] [CrossRef]
- Kumar, V.V.; Saride, S.; Zornberg, J.G. Fatigue Performance of Geosynthetic-Reinforced Asphalt Layers. Geosynth. Int. 2021, 28, 584–597. [Google Scholar] [CrossRef]
- Li, Q.; He, Y.; Yang, G.; Su, P.; Li, B. The Cracking Resistance Behavior of Geosynthetics-Reinforced Asphalt Concrete under Lower Temperatures Using Bending Test. Coatings 2022, 12, 812. [Google Scholar] [CrossRef]
- Jayalath, C.; Gallage, C.; Wimalasena, K.; Lee, J.; Ramanujam, J. Performance of Composite Geogrid Reinforced Unpaved Pavements under Cyclic Loading. Constr. Build. Mater. 2021, 304, 124570. [Google Scholar] [CrossRef]
- Jayalath, C.P.G.; Gallage, C.; Wimalasena, K. Development of Design Guidelines for Composite-Geogrid Reinforced Unpaved Pavements. In Road and Airfield Pavement Technology; Springer: Berlin/Heidelberg, Germany, 2022; Volume 193, pp. 375–387. [Google Scholar] [CrossRef]
- Perkins, S.W.; Perkins, S.W. Geosynthetic Reinforced Flexible Pavement Systems Using Two Pavement Test Facilities; Federal Highway Administration: Bozeman, MT, USA, 2002.
- Aran, S. Geosynthetics: Soil and Aggregate Reinforcement Testing—Base Reinforcement with Biaxial Geogrid. Transp. Res. Rec. J. Transp. Res. Board. 2006, 1975, 115–123. [Google Scholar] [CrossRef]
- Al-Qadi, I.L.; Dessouky, S.H.; Kwon, J.; Tutumluer, E. Geogrid in Flexible Pavements: Validated Mechanism. Transp. Res. Rec. 2008, 2045, 102–109. [Google Scholar] [CrossRef]
- Al-Qadi, I.L.; Dessouky, S.H.; Kwon, J.; Tutumluer, E. Geogrid-Reinforced Low-Volume Flexible Pavements: Pavement Response and Geogrid Optimal Location. J. Transp. Eng. 2012, 138, 1083–1090. [Google Scholar] [CrossRef]
- Alimohammadi, H.; Schaefer, V.R.; Zheng, J.; Li, H. Performance Evaluation of Geosynthetic Reinforced Flexible Pavement: A Review of Full-Scale Field Studies. Int. J. Pavement Res. Technol. 2021, 14, 30–42. [Google Scholar] [CrossRef]
- Correia, N.S.; Zornberg, J.G. Mechanical Response of Flexible Pavements Enhanced with Geogrid-Reinforced Asphalt Overlays. Geosynth. Int. 2016, 23, 183–193. [Google Scholar] [CrossRef]
- Lai, Y.; Zhang, S.; Yu, W. A New Structure to Control Frost Boiling and Frost Heave of Embankments in Cold Regions. Cold Reg. Sci. Technol. 2012, 79–80, 53–66. [Google Scholar] [CrossRef]
- Tingle, J.S.; Webster, S.L. Corps of Engineers Design of Geosynthetic-Reinforced Unpaved Roads. Transp. Res. Rec. 2003, 1849, 193–201. [Google Scholar] [CrossRef]
- Pasquini, E.; Pasetto, M.; Canestrari, F. Geocomposites against Reflective Cracking in Asphalt Pavements: Laboratory Simulation of a Field Application. Road Mater. Pavement Des. 2015, 16, 815–835. [Google Scholar] [CrossRef]
- Lakkavalli, V.; Bhat, S.; Thomas, J. The City of Calgary’s Early Experiences with Use of Fiberglass Grids for Asphalt Pavement Rehabilitation. In Proceedings of the Geosynthetics 2018—2nd International Conference on Technology and Application of Geosynthetics, Santiago, Chile, 3–5 October 2018. [Google Scholar]
- Gonzalez-Torre, I.; Calzada-Perez, M.A.; Vega-Zamanillo, A.; Castro-Fresno, D. Damage Evaluation during Installation of Geosynthetics Used in Asphalt Pavements. Geosynth. Int. 2015, 21, 377–386. [Google Scholar] [CrossRef]
- OPSS, OPSS 1151; Material Specification for Superpave and Stone Mastic Asphalt Mixtures. Ontario Provincial Standard Specifications (OPSS): Ottawa, ON, Canada, 2006.
- OPSS, OPSS 1010; Material Specification for Aggregates-Base, Subbase, Select Subgrade, and Backfill Material. Ontario Provincial Standard Specifications (OPSS): Ottawa, ON, Canada, 2013.
- Pinchin Ltd. Geotechnical Investigation-Proposed Snyder’s Road Reconstruction; Pinchin Ltd.: Edmonton, AB, USA, 2020. [Google Scholar]
- Bhat, S.; Thomas, J. Design and Construction of a Geosynthetic Reinforced Pavement on Weak Subgrade. In Proceedings of the Canadian Geotechnical Conference & Canadian Permafrost Conference, Quebec City, QC, Canada, 20–23 September 2015. [Google Scholar]
- Titan Environmental Containment. Swamp Grid 30. 2021. Available online: https://www.google.com.hk/url?sa=t&rct=j&q=&esrc=s&source=web&cd=&cad=rja&uact=8&ved=2ahUKEwiyl7CT0KmBAxU4qFYBHfYbDg8QFnoECBgQAQ&url=https%3A%2F%2Ftitanenviro.com%2Fwp-content%2Fuploads%2F2021%2F07%2FSwamp-Grid-30_February2021.pdf&usg=AOvVaw1zuExkHYMnQ6SregPuO-N9&opi=89978449 (accessed on 21 March 2023).
- Titan Environmental Containment. Installation Guide for Base Reinforcement. 2022. Available online: https://titanenviro.com/wp-content/uploads/2022/03/Titan-Earth-Grid-Swamp-Grid-and-Gladiator-Grid-Installation-Guide_Base-Reinforcement_22Feb2022.pdf (accessed on 21 March 2023).
- Titan Environmental Containment. Spartan Road GridTM 11EPM. 2017. Available online: https://www.google.com.hk/url?sa=t&rct=j&q=&esrc=s&source=web&cd=&cad=rja&uact=8&ved=2ahUKEwj8xMfA0KmBAxVSr1YBHWIABHAQFnoECB4QAQ&url=https%3A%2F%2Ftitanenviro.com%2Fwp-content%2Fuploads%2F2021%2F05%2FSpartan-Road-Grid-11EPM_March2021.pdf&usg=AOvVaw00i_jFhXVeYb0w6JBme79H&opi=89978449 (accessed on 21 March 2023).
- Francken, L. Prevention of Cracks in Pavements. Road Mater. Pavement Des. 2005, 6, 407–425. [Google Scholar] [CrossRef]
- Irrometer Irrometer. Available online: https://www.irrometer.com (accessed on 21 March 2023).
- Talebsafa, M.; Romanoschi, S.A.; Papagiannakis, A.T.; Popescu, C. Evaluation of Strains at the Bottom of the Asphalt Base Layer of a Semi-Rigid Pavement Under a Class 6 Vehicle. MATEC Web Conf. 2019, 271, 08008. [Google Scholar] [CrossRef]
- Grellet, D.; Doré, G.; Bilodeau, J.P. Comparative Study on the Impact of Wide Base Tires and Dual Tires on the Strains Occurring within Flexible Pavements Asphalt Concrete Surface Course. Can. J. Civ. Eng. 2012, 39, 526–535. [Google Scholar] [CrossRef]
- Pant, A.; Datta, M.; Ramana, G.V.; Bansal, D. Measurement of Role of Transverse and Longitudinal Members on Pullout Resistance of PET Geogrid. Measurement 2019, 148, 106944. [Google Scholar] [CrossRef]
- Bhowmik, R.; Shahu, J.T.; Datta, M. Influence of Transverse and Longitudinal Members of Coated Polyester-Yarn Geogrid on Pullout Response Under Low Normal Stress. Int. J. Civ. Eng. 2023, 21, 33–50. [Google Scholar] [CrossRef]


Disclaimer/Publisher’s Note: The statements, opinions and data contained in all publications are solely those of the individual author(s) and contributor(s) and not of MDPI and/or the editor(s). MDPI and/or the editor(s) disclaim responsibility for any injury to people or property resulting from any ideas, methods, instructions or products referred to in the content. |
© 2023 by the authors. Licensee MDPI, Basel, Switzerland. This article is an open access article distributed under the terms and conditions of the Creative Commons Attribution (CC BY) license (https://creativecommons.org/licenses/by/4.0/).
Share and Cite
Wang, D.; Wang, S.-L.; Tighe, S.; Bhat, S.; Yin, S. Construction of Geosynthetic–Reinforced Pavements and Evaluation of Their Impacts. Appl. Sci. 2023, 13, 10327. https://doi.org/10.3390/app131810327
Wang D, Wang S-L, Tighe S, Bhat S, Yin S. Construction of Geosynthetic–Reinforced Pavements and Evaluation of Their Impacts. Applied Sciences. 2023; 13(18):10327. https://doi.org/10.3390/app131810327
Chicago/Turabian StyleWang, Danrong, Sheng-Lin Wang, Susan Tighe, Sam Bhat, and Shunde Yin. 2023. "Construction of Geosynthetic–Reinforced Pavements and Evaluation of Their Impacts" Applied Sciences 13, no. 18: 10327. https://doi.org/10.3390/app131810327
APA StyleWang, D., Wang, S.-L., Tighe, S., Bhat, S., & Yin, S. (2023). Construction of Geosynthetic–Reinforced Pavements and Evaluation of Their Impacts. Applied Sciences, 13(18), 10327. https://doi.org/10.3390/app131810327