Article

Surface Quality Evaluation in the Milling Process Using a Ball Nose End Mill

1
Department of Technology, Materials and Computer-Aided Production, Faculty of Mechanical Engineering, Technical University of Košice, Letná 9, 040 02 Košice, Slovakia
2
Faculty of Mechanical Engineering, Prototyping and Innovation Centre, Technical University of Košice, Park Komenského 12/a, 042 00 Košice, Slovakia
3
Department of Machining and Manufacturing Technology, Faculty of Mechanical Engineering, University of Žilina, Univerzitná 1, 010-26 Žilina, Slovakia
*
Author to whom correspondence should be addressed.
Appl. Sci. 2023, 13(18), 10328; https://doi.org/10.3390/app131810328
Submission received: 21 July 2023 / Revised: 11 September 2023 / Accepted: 12 September 2023 / Published: 15 September 2023
(This article belongs to the Special Issue Modernly Designed Materials and Their Processing)

Abstract

:
Shaped surfaces are increasingly used in the field of mold-making for casting or injection molding, where future products include shapes with different curvatures. These are surfaces that form convex curves, concave curves, or a combination thereof. Given these machined surfaces, it is important to know the impact of the finishing strategies on these surfaces. This paper deals with the comparison of finishing milling strategies in the production of shaped surfaces and the analysis of different methods for the evaluation of surface topography. In addition, the experimental results evaluate the roughness of the machined surface and surface shape variations. The material used for the experiments was AlCu4Mg aluminum alloy, and Constant Z, spiral and spiral circle strategies were chosen for the finishing strategies. The evaluation of surface topography and surface roughness was carried out at three different specimen heights with respect to the tool’s contact with the machined surface.

1. Introduction

Nowadays, freeform shapes are some of the most difficult surfaces to produce. They are present in various areas of production, such as the automotive industry, the aerospace industry, or the production of dies, molds, and many others, where the shape corresponds to the shape of the future product [1,2,3].
In this group of future products, we can find different shapes comprising convex, concave, or flat surfaces. In some cases, these surfaces can be described mathematically. Each part must be manufactured to meet the recommended quality and dimensions, so the requirement for the correct selection of milling strategy is justified. To support this requirement, it is necessary to know the effectiveness and influence of strategies in milling free-form shapes [4,5,6].
The most frequent use of freeform surfaces is in plastic moldings. Molds, whose shape corresponds to the future product, consist mainly of free-form shapes. To achieve the required mold shape, the milling process represents the main production operation.
To achieve this, CNC machines are used, which can produce parts in three or five axes, where the NC program is generated by the CAM system [7].
For the best machining of these complex shapes, different CAM systems are used, where the user can choose the appropriate strategy to match the specific toolpath in accordance with the geometry of the part. The main disadvantage of the CAM system is that the simulation process does not provide the microsurface texture after machining, related to the cutting edge of the tool. Proper selection of the free-form milling strategy can improve the surface roughness [8]. When programming with CAM systems, strategies such as zigzag, radial, raster, or spiral curves are most useful for milling freeform surfaces [9,10]. Many researchers describe the effect of tool path strategies on roughness, but only a few studies address the effect of toolpath strategies on surface topography [11,12]. Currently, many CAD/CAM systems incorporate different strategies to select various milling shapes and to achieve recommended shapes and dimensions [13]. Therefore, it is very important to select the most appropriate strategy considering the relationship between best roughness, higher dimension accuracy, and effective time production.
Cutting tools with ball milling cutters are used in various areas of production. They are most commonly used in mold-making, automotive, aerospace, and other industries. In these areas, it is important to achieve the desired shape of the future part, which can include a variety of shapes ranging from convex and concave curves to planar surfaces or variously shaped complex surfaces. All of these surfaces must be produced based on production requirements in terms of accuracy, dimensions, and other factors.
Of the three basic machining operations, such as roughing, semi-finishing, and finishing operations, ball-end milling tools are used the most in finishing operations. It is very important to keep in mind that the tool–surface contact relationship is different from conventional milling. One of the main characteristics of shaped surface machining is that the contact between the tool and the workpiece is constantly changing. In addition, machining through the center of the cutting tool can negatively affect the surface quality [14,15]. The contact between the tool and the surface is different when milling free-form surfaces compared to milling simple shapes. In the contact position, the cutting speed varies from the programmed value. These are the areas where contact is made between the tool and the machined surface. In the first region, the tool axis is parallel to the machined surface, and in the second region, the material is cut through the center of the tool, and the position of the tool axis is almost perpendicular to the machined surface [16,17].
The advantage of using a ball end mill for multi-axis milling of free-form surfaces is the ability to change the cutting-edge contact depending on the angle between the machined surface and the tool axis [15]. Therefore, the nominal diameter of the tool changes when in contact with the machined surface [17]. In the case when the cutting speed of the tool is zero (cutting by the center of the tool), the material is removed not by the shearing process but as a result of plastic deformation, known as plowing [15]. The contact of the tool with the machined surface in the ascendant and descendant directions is shown in Figure 1a and Figure 1b, respectively.
Toh et al. [1] was involved in a free-form milling experiment using a ball end mill. He investigated the milling direction and found that better results could be obtained with an ascending milling direction than with a descending one. Milling in the ascending direction avoids the reduction of cutting speeds and the problems that arise in plastic deformation [18,19].
Scandiffio et al. [20] investigated the ascending and descending direction of the tool in the machining process and the relationship between the tool and the surface when using a ball end mill. The results showed that worse surface quality was obtained when using descending milling. The research evaluated the roughness parameter, tool wear, machining forces, and tool life. By the experiment conducted, Souza et al. [21] claim that shear cutting or plowing that occurs during free-form cutting when a ball end mill is used has an effect on the roughness parameter. The reason for the change in the roughness of the machined surface is due to the change in cutting speed during milling, which changes the contact of the tool with the machined surface and, therefore, the effective diameter of the tool with respect to the position of the tool on the toolpath.
According to Souza et al. [21], when a ball end mill is used, the roughness parameters measured on a free-form surface can be affected by the material cutting mechanism-shearing or plowing. Machining through the center of the tool can have a negative effect on the final surface quality in terms of surface roughness or surface topography [22,23]. When the tool center is used in the milling process, the machined surface can be negatively affected as a result of plastic deformation, and the surface roughness increases [21].
For free-form milling surfaces, the changing contact between the tool and machined surface area depends on the axial depth of the cut and surface geometry [15,24]. In Figure 2, the cutting edge is in contact with the machined surface, where the tool works perpendicular to the work surface (Figure 2a). Figure 2b shows tool contact with the machined surface in the ascendant direction. It is possible to see the area where the cutting tool descends lower on the machined surface, and Figure 2c describes tool contact with the machined surface in the ascendant direction with increasing effective tool diameter. In Figure 2b,c, it is also possible to see the maximum and minimum effective tool radius at the bottom of the machined surface. When milling a free surface, the contact between the tool and the machined surface changes. The value of the effective tool diameter depends on the curvature of the surface and the depth of the cut.
Boujelbene et al. [18] investigated the effect of tool orientation on cutting speed and tool life. The result was that machining with the center of the tool, where the cutting speed is zero, leads to worse roughness parameters. Liu et al. [25] studied the changing contact in the tool–workpiece relationship in terms of the predicted geometric deviation from the desired geometry. Aspinwall et al. [26] examined the effect of inclined surface milling when a ball end mill was used. The effects of tool wear, cutting force, and surface roughness were analyzed. Wojciechowski et al. [27] verified a method for the estimation of vibration and roughness during free surface milling with a ball end mill. They concluded that the tool overhang length has a significant effect on the roughness parameters. The effect of the tool path on the milling of the convex surface was evaluated by Shaghayegh et al. [28] when hardened material was used. The results showed that the radial strategy achieved the best surface texture and the spiral strategy the worst. Boujelbene et al. [18] studied the effect of tool orientation on cutting speed and tool life. They came to the conclusion that machining with the center of the tool, where the cutting speed is zero, leads to a worse roughness parameter. Käsemodel et al. [29] examined the influence of the cutting direction in free-form surface milling. The result showed that the effective radius of the tool was larger when cutting upwards, resulting in a more favorable value of effective cutting speed. On the other hand, in the opposite direction, in a downward movement, the effective tool radius was found to be much smaller, and the cutting speed may be reduced to a critical value.
A suitable, effective cutting speed is usually achieved when the tool cuts approximately tangentially. Changes in cutting speed during full surface milling can cause process instability [26] in terms of roughness parameters [30], dimensional accuracy [27] as well as geometric deviations. In the downward-cutting method of free-form surface milling, elastoplastic deformation of the material in the form of a notched effect [24] may occur on the surface of the part. In the process of cutting through the center of the tool, where the cutting speed is low, the vibrations are maximum in this area [31,32]. For this reason, the correct selection of the milling strategy is very important [33]. It can affect the contact area in the machining process, which affects the tool wear, surface texture, roughness, and vibration. According to Antoniadis [34], the choice of milling strategy for free-form surfaces has a significant impact because their selection can affect the contact area between the tool and the surface, vibration, roughness parameters, or tool wear. In this case, it is important to understand the relationship between tool–workpiece contact in free-form milling [35].
The surface quality is influenced by various inputs, including feed rate, cutting speed, or depth of cut, which are referred to as controlled inputs, and uncontrolled inputs, such as the workpiece, tool usage, or machine vibration [36,37]. Numerous studies, as reported by Toh [38], have investigated the roughness parameters in free surface milling and various geometrical features such as the scallop height, the influence of the toolpath strategy, or the cutting conditions during milling. Abuelnaga and White [39,40] elaborated on the possibilities of free-form surface machining where surface roughness and dimensional accuracy were evaluated. Shajari [28] investigated spiral, raster, radial, and 3D feed strategies in free-form milling of low-curvature convex surfaces and evaluated cutting force and surface texture. This experiment concluded that the radial strategy produced the best surface quality, and the helical strategy resulted in the worst surface quality. Ikua [41] complemented the results by stating that the poor quality of the sculpted machined surface may be influenced by the lower cutting force. Matras and Kowalczyk [42] analyzed the effect of milling strategies on the free surface topography of aluminum alloy when Z-level, radial, offset, and circular strategies were used. It was found that the lowest roughness parameter, as required, was obtained only when the tool path was circular.
The results obtained by Hao [43] show that surface topography is affected by the plastic deformation of the machined surface and, in the latter case, by cutting vibration generated during machining. The machining process incorporates a factor referred to as “cycle time,” encompassing the duration for the machine to interpret a single line of NC code and subsequently transmit this information to control machine movement. Another facet involves the time required for the control unit to rectify the machine’s motion, adjusting parameters like position, velocity, or acceleration [44]. Different toolpaths are generated in the machining process using linear interpolation, which is defined as the path between two successive cutting tool positions (CL). In a CAM system, a tolerance band, also known as chord error, can be defined to modify the toolpath segments. When the user reduces the tolerance zone, the toolpath becomes increasingly closer in resemblance to the CAD model [45]. Yau [46,47] described in more detail the problem of interpolation of linear segments (Figure 3a) and curved toolpaths Figure 3b, where the number of segments increases, and the increasing number of segments affects the size of the NC program. Figure 3 shows the trajectory view calculation for the free-shaped toolpath for the forward step (Figure 3a) and for size length, as shown in Figure 3b.
Souza et al. [48] found that the toolpaths in a CAM system appear to be the same, but each CAM system generates a different NC code when processing identical geometry. According to this different NC code, a different machining process is generated, which affects the real machining time, surface roughness, or feed rate oscillation. According to Siller et al. [49], segment length decomposition is used as an indicator of geometric composition. They used histograms to verify the relationship between surface radius and segment length, where they obtained that a small radius of curvature corresponds to a smaller segment length.
Lim et al. [50] studied surface topography in the production of molded surfaces using the ball milling process, where he investigated machining errors caused by tool deflection. He proposed a surface generation model to predict the resulting machining errors. The surface obtained was used to predict dimensional accuracy prior to actual cutting. Surface topography in ball milling machining and surface roughness evaluation were similarly dealt with by Quinsat et al. [51], who looked at the effect of machining parameters and the choice of milling strategies on the machined surface. The results emphasized the importance of obtaining the surface topography, which is necessary to determine the influence of the different parameters on the surface roughness. Bouzakis et al. [52] dealt with characteristics such as chip geometry, cutting force, and roughness in the production of shaped surfaces, using a copy-milling cutter as a tool. He predicted roughness values by defining an algorithm that accounted for tool and workpiece motions.
The evaluation of surface topography and surface roughness was investigated by Layegh et al. [53], who evaluated these surface characteristics in five-axis machining. He proposed a model that was able to predict the surface texture and roughness parameters with a 20% deviation of the correct answer. Extensive research in reviewing methods for obtaining surface topography as well as analyzing the various factors that affect the milling process was described by Sun in his study [54]. He analyzed the mechanism of machined surface topography and discussed the factors that influence it. Xu et al. [55] found that as the tool inclination angle increases beyond 6 degrees, the surface roughness improves with the use of a ball milling cutter.
Zhou et al. [56] focused on designing a model that could obtain the surface topography directly from the cutting parameters, workpiece surface geometry, and cutter placement. The relationship between machined surface quality and interpolation line was addressed by Zhang et al. [57], who developed a mathematical model of surface topography when milling shaped surfaces. In his study [58], Varga analyzed milling strategies with respect to the machined surface, where they applied the so-called fragmentation of relief surfaces.
The problem of surface quality evaluation for different materials has justification for different milling strategies. Therefore, it is necessary to search for an optimal manufacturing strategy considering the surface quality. The presented experiment was focused on verifying our predictions and obtaining input for further broader research.
The machining of 3D surfaces is specific due to a greater number of factors that can affect the cutting process. Therefore, it is necessary to deal with several areas that will help us to understand the production of these surfaces. This contribution is a part of the research, which will continue in the form of investigating other factors influencing the quality of these shapes in the production process, such as the machining method-upward milling, the use of five-axis machining and monitoring of the effect of effective diameter, tool wear, tool length, application of high-speed milling, or analysis of cutting forces acting in the cutting process.
The aim of the research presented in the next section was to compare three strategies commonly used in three-axis milling. The topography and surface roughness were evaluated, as well as the deviations of the machined surfaces. The authors of the above studies did not compare all three aspects together or use special evaluation equipment. Furthermore, the research presented in this paper offers a method for a complex assessment of the quality of machined surfaces, applicable to decisions on the production method and the use of suitable strategies.

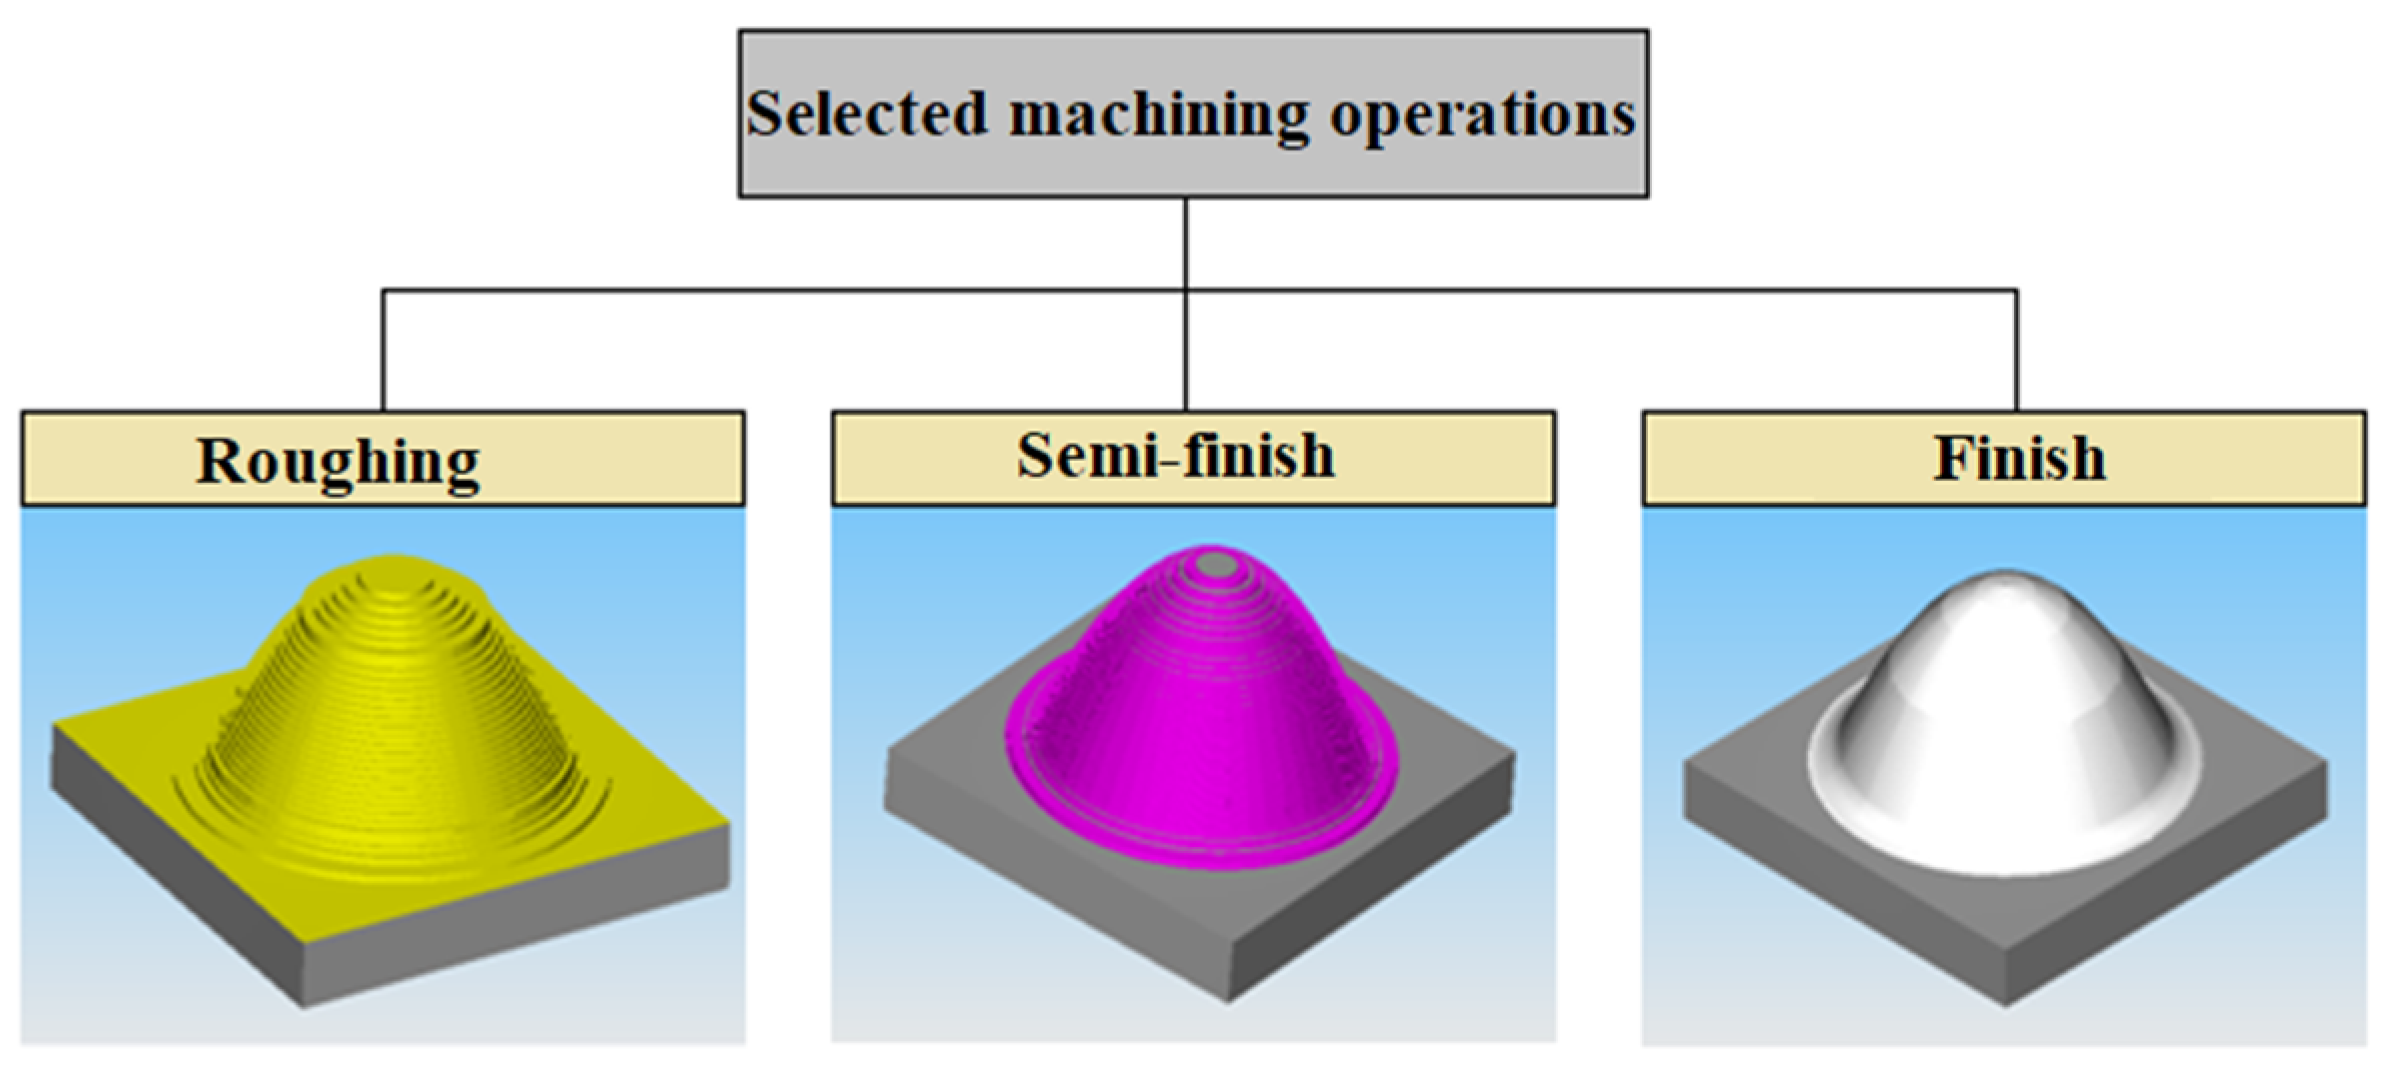
2. Materials and Methods/Research Methodology

A parabolic surface was chosen as the modeled surface to be parametrically described. For the shape surface, the following equation was defined:
y = 0.048 × x 2 + 30 ,
The CAD system Solidworks 2022 was used to design the model (Figure 4), and the CAM system SolidCAM 2022 was used to select the milling strategy. A 3D model of the test specimen is shown in Figure 4.
For the experimental research, three test specimens were produced. An aluminum alloy (AlCu4Mg, Slovalco, a. s., Žiar nad Hronom, Slovakia) with the following mechanical properties was selected for production: tensile strength = 420 MPa; yield strength = 240 MPa; hardness = 120 HB. The reason for the selection of this material is that AlCu4Mg is one of the most important aluminum alloys. Due to its strength characteristics and resistance to fatigue, it is often used in aircraft airframe structures (airframe, wings) and in the military industry in general. The experimental tests were carried out on an EMCO MILL 155 three-axis machine with a maximum spindle speed of 5000 rpm (EMCO MAIER Ges.m.b.H., Hallein, Austria), which contains a Heidenhain iTNC 530 control system. Roughing, semi-finishing, and finishing operations are mostly used in the machining process for milling free-form surfaces [59,60]. The machining operations specifically used in the experimental research are shown in Figure 5.
The roughing and semi-finishing operations were the same for all three specimens to achieve the same surface texture. Of all the operations, the finishing operation is the most challenging because the cutting speed of tool–material contact and chip formation change during milling [61,62]. The cutting parameters with the tool used for fabrication are shown in Table 1. A sintered carbide ball-end mill was used for the finishing operation using a fixed BT-40 system with a mechanical collet chuck with a tool overhang of 40 mm. Cutting parameters were selected according to the recommendations of the tool manufacturers. If a parameter was specified by a range, the midpoint of the range was selected. Due to the parametric limitations of the machine used (spindle speed), the usable cutting speed for small-diameter tools was limited by this parameter. The criteria for the surface parameters were based on the requirement to minimize finishing operations, which are often closely related to the production of 3D surfaces. A mineral oil-based emulsion coolant was used for cooling during production. The dimensions of the test specimens were 65 × 65 × 40 mm. The input data defined for the milling process of shaped surfaces are shown in Table 2.
The following methods and equipment were used in the experiment:
  • Comparison and evaluation of surface topography using a Keyence VHX-5000 digital microscope (Keyence International, Mechelen, Belgium).
  • Roughness evaluation using device Alicona InfiniteFocus G5 (Alicona Imaging GmbH, Raaba/Graz, Austria).
  • Evaluation of shape deviations using coordinate measuring machine ZEISS Duramax HTG (Carl Zeiss, Jena, Germany).

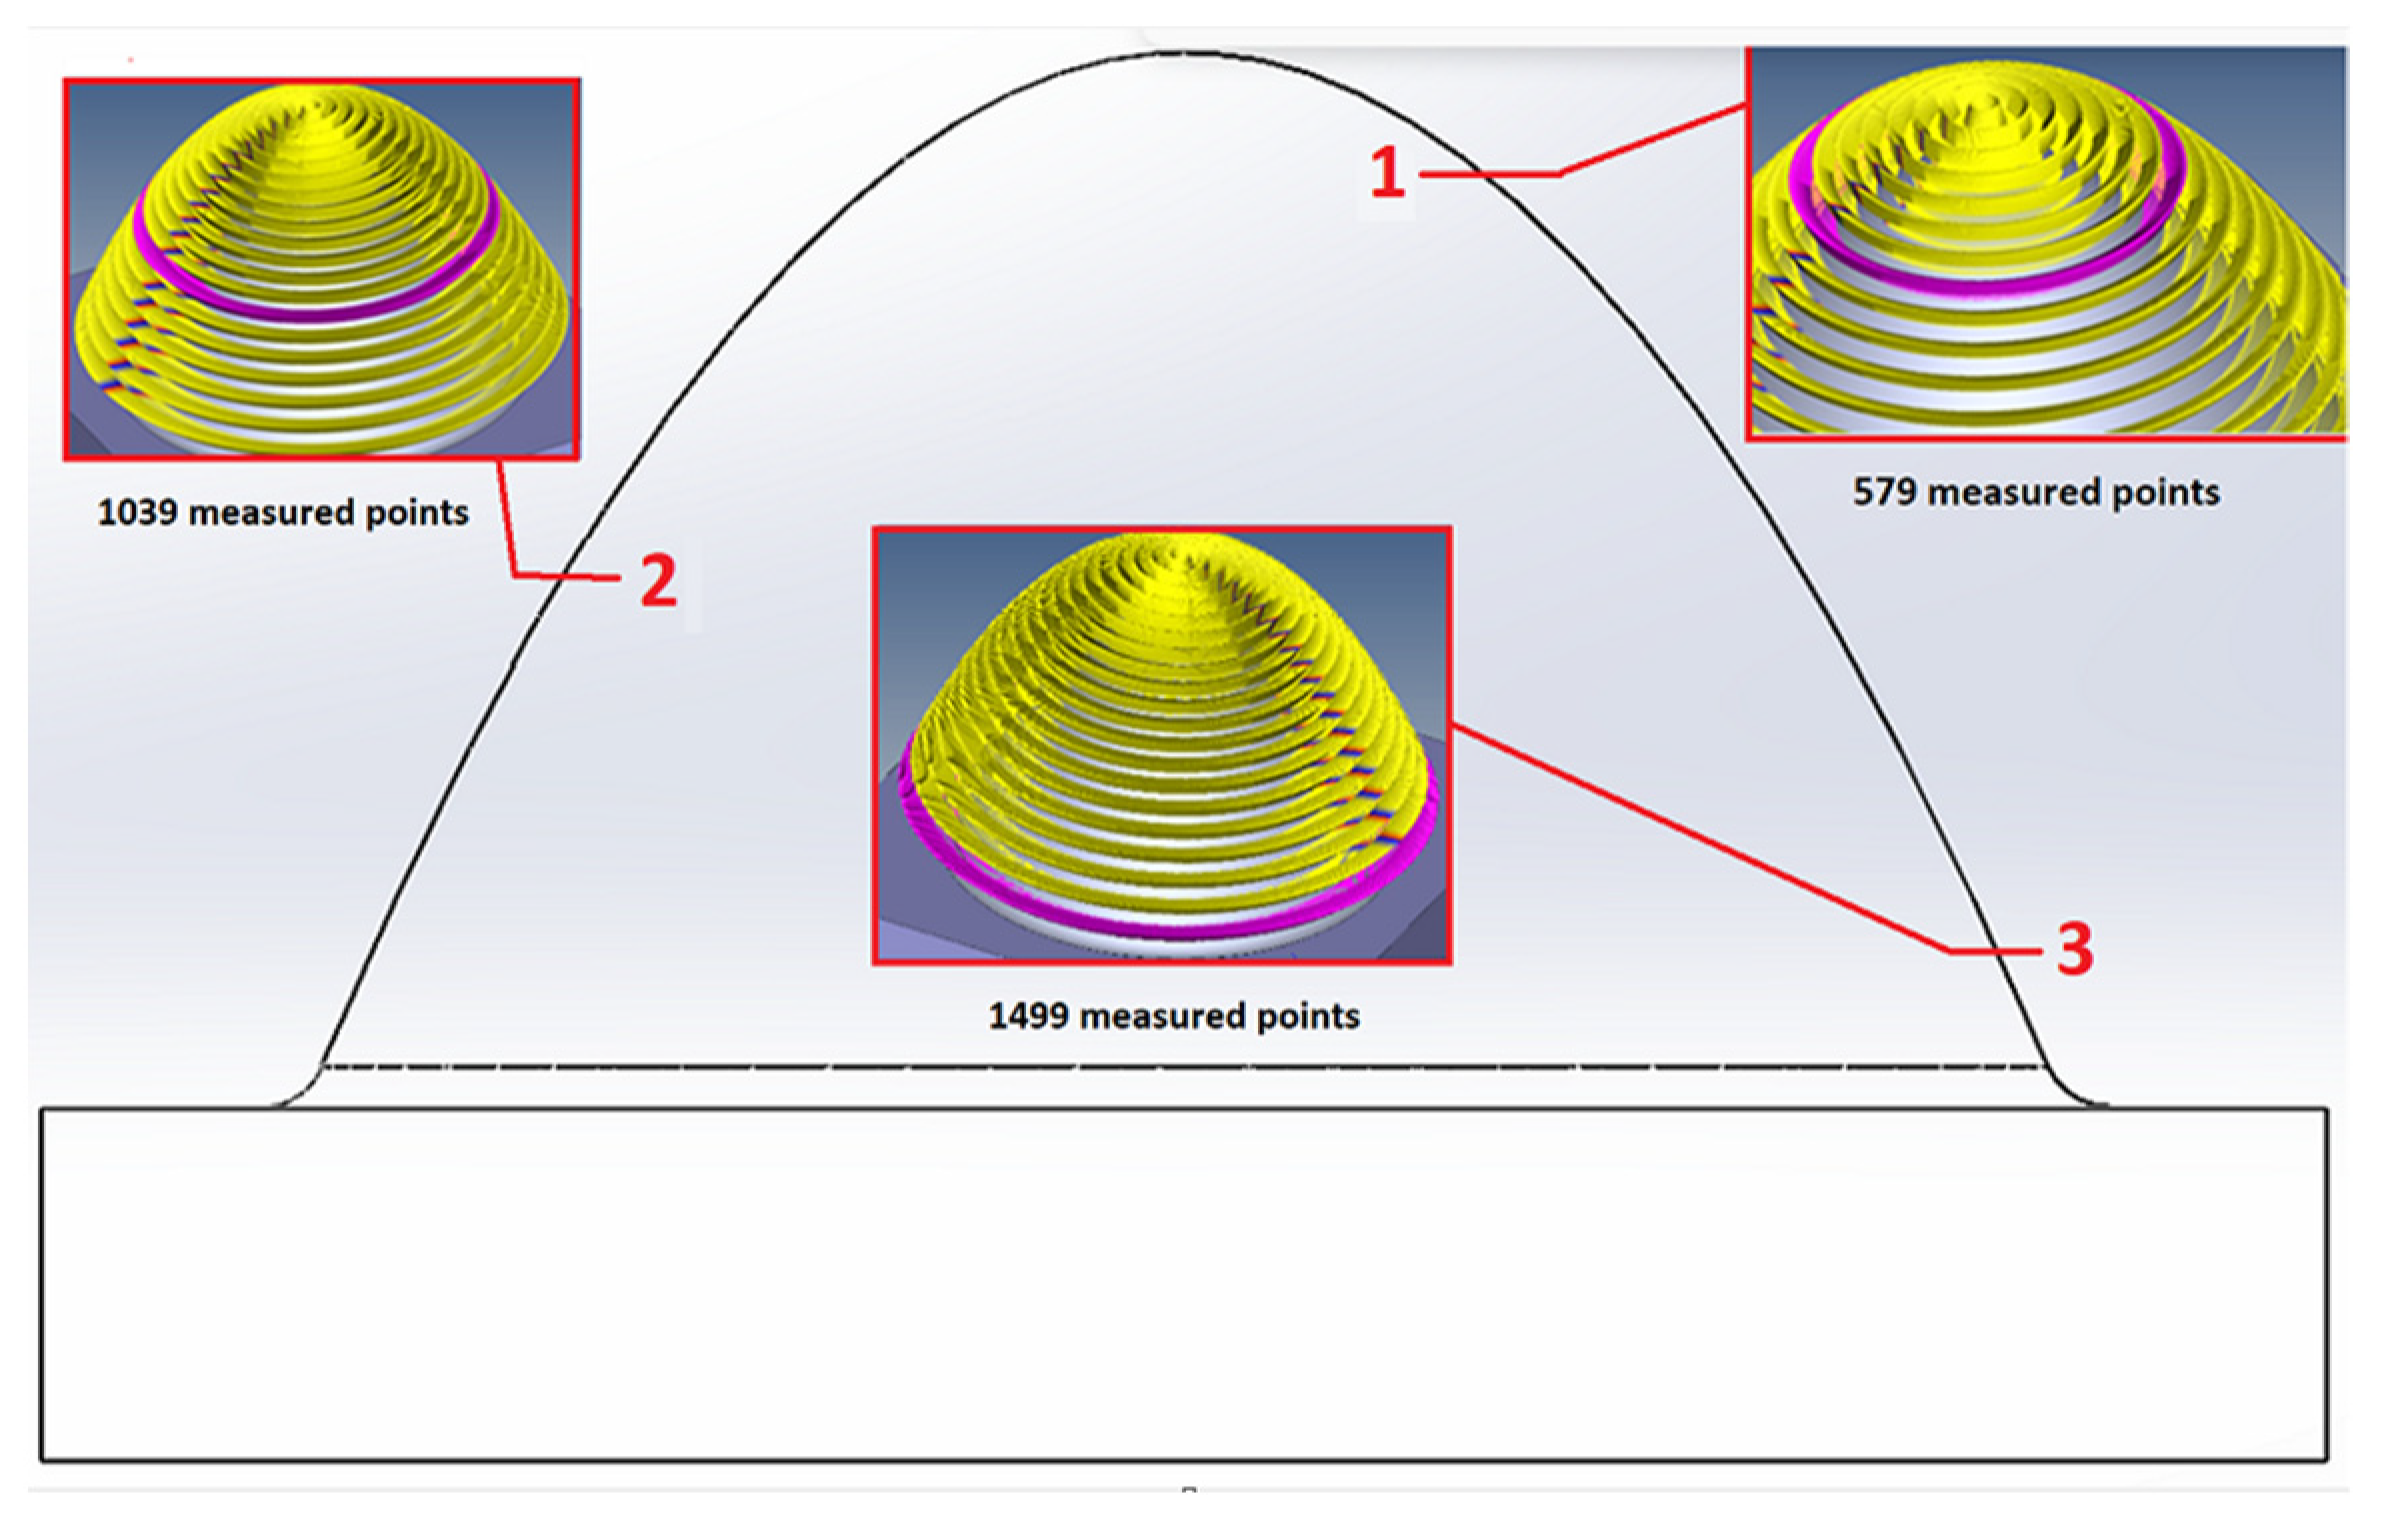
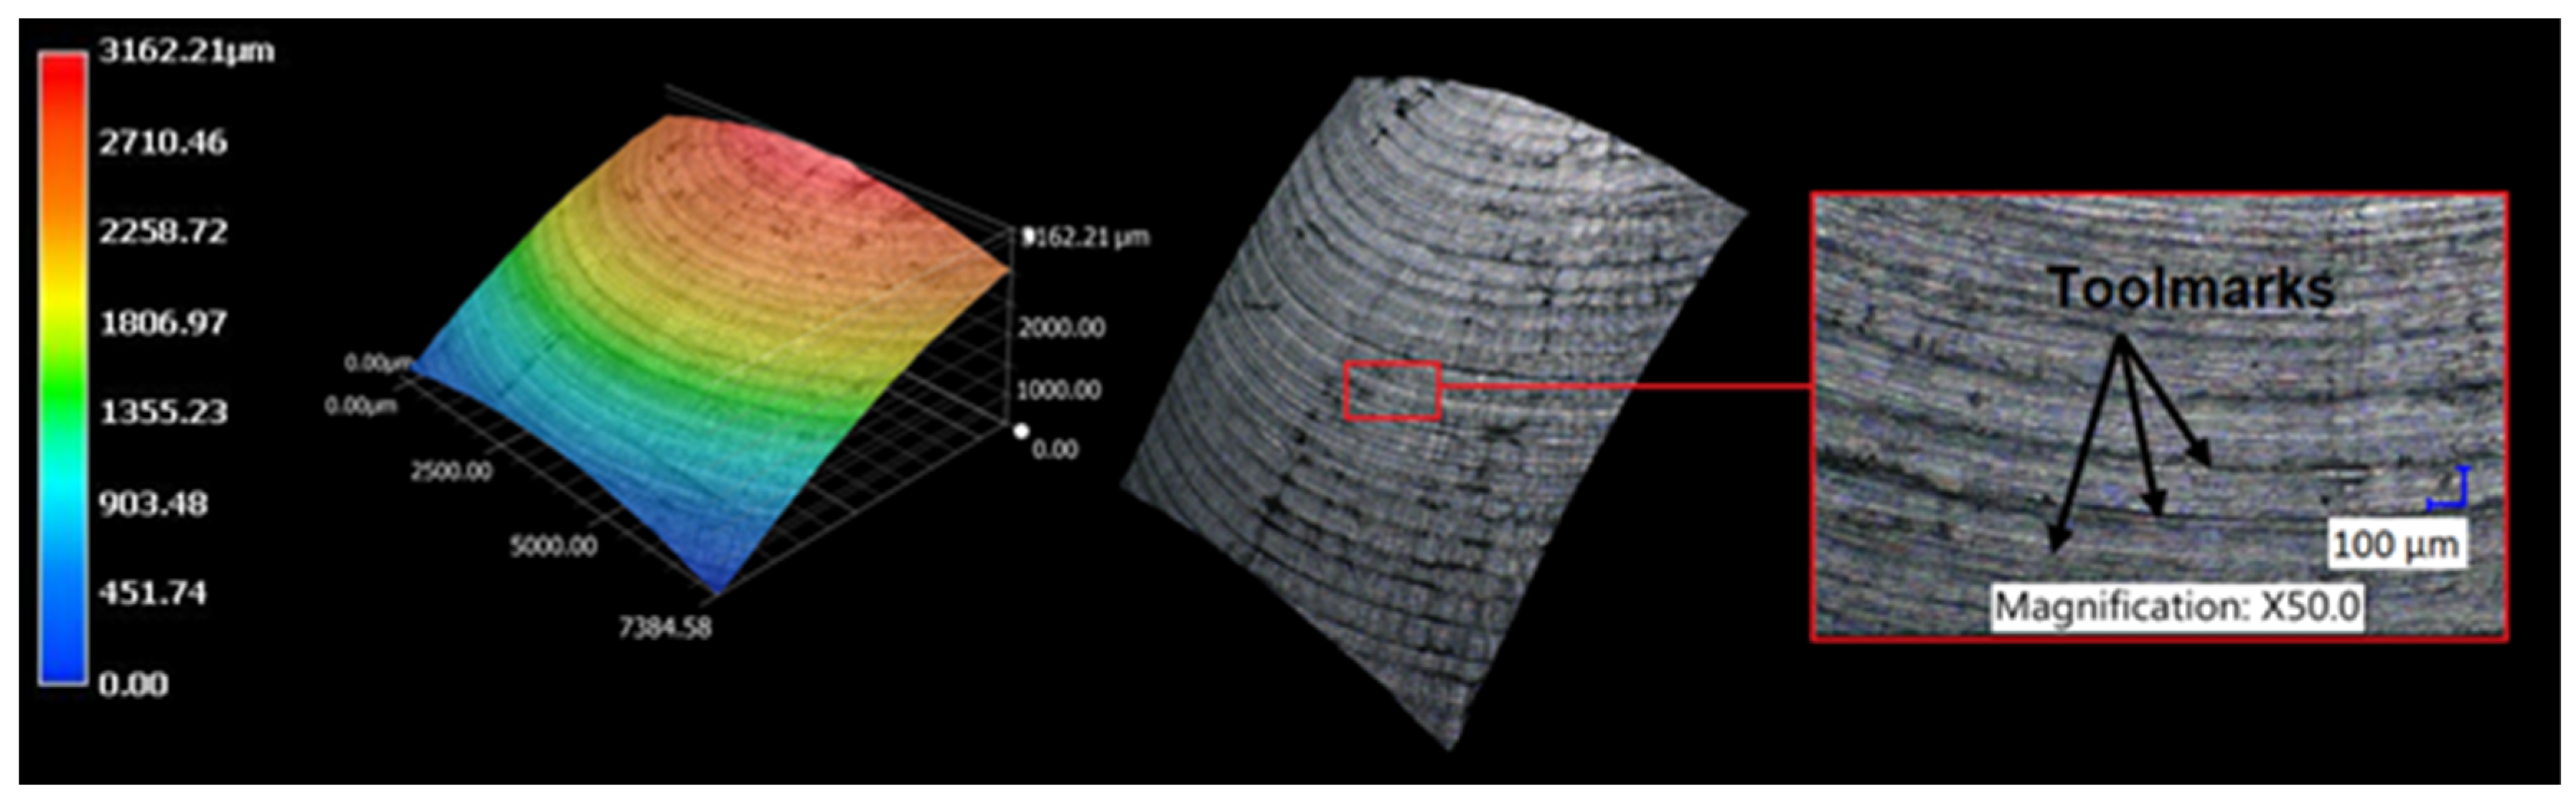
2.1. Topography Observation Methodology

Surface topography was observed at three heights on each of the specimens. These were distances from the highest point of the specimen surface downwards of 7.5 mm, 15 mm, and 22.5 mm. The effective diameter of the tool varies depending on the depth of the cut and the actual curvature of the surface.

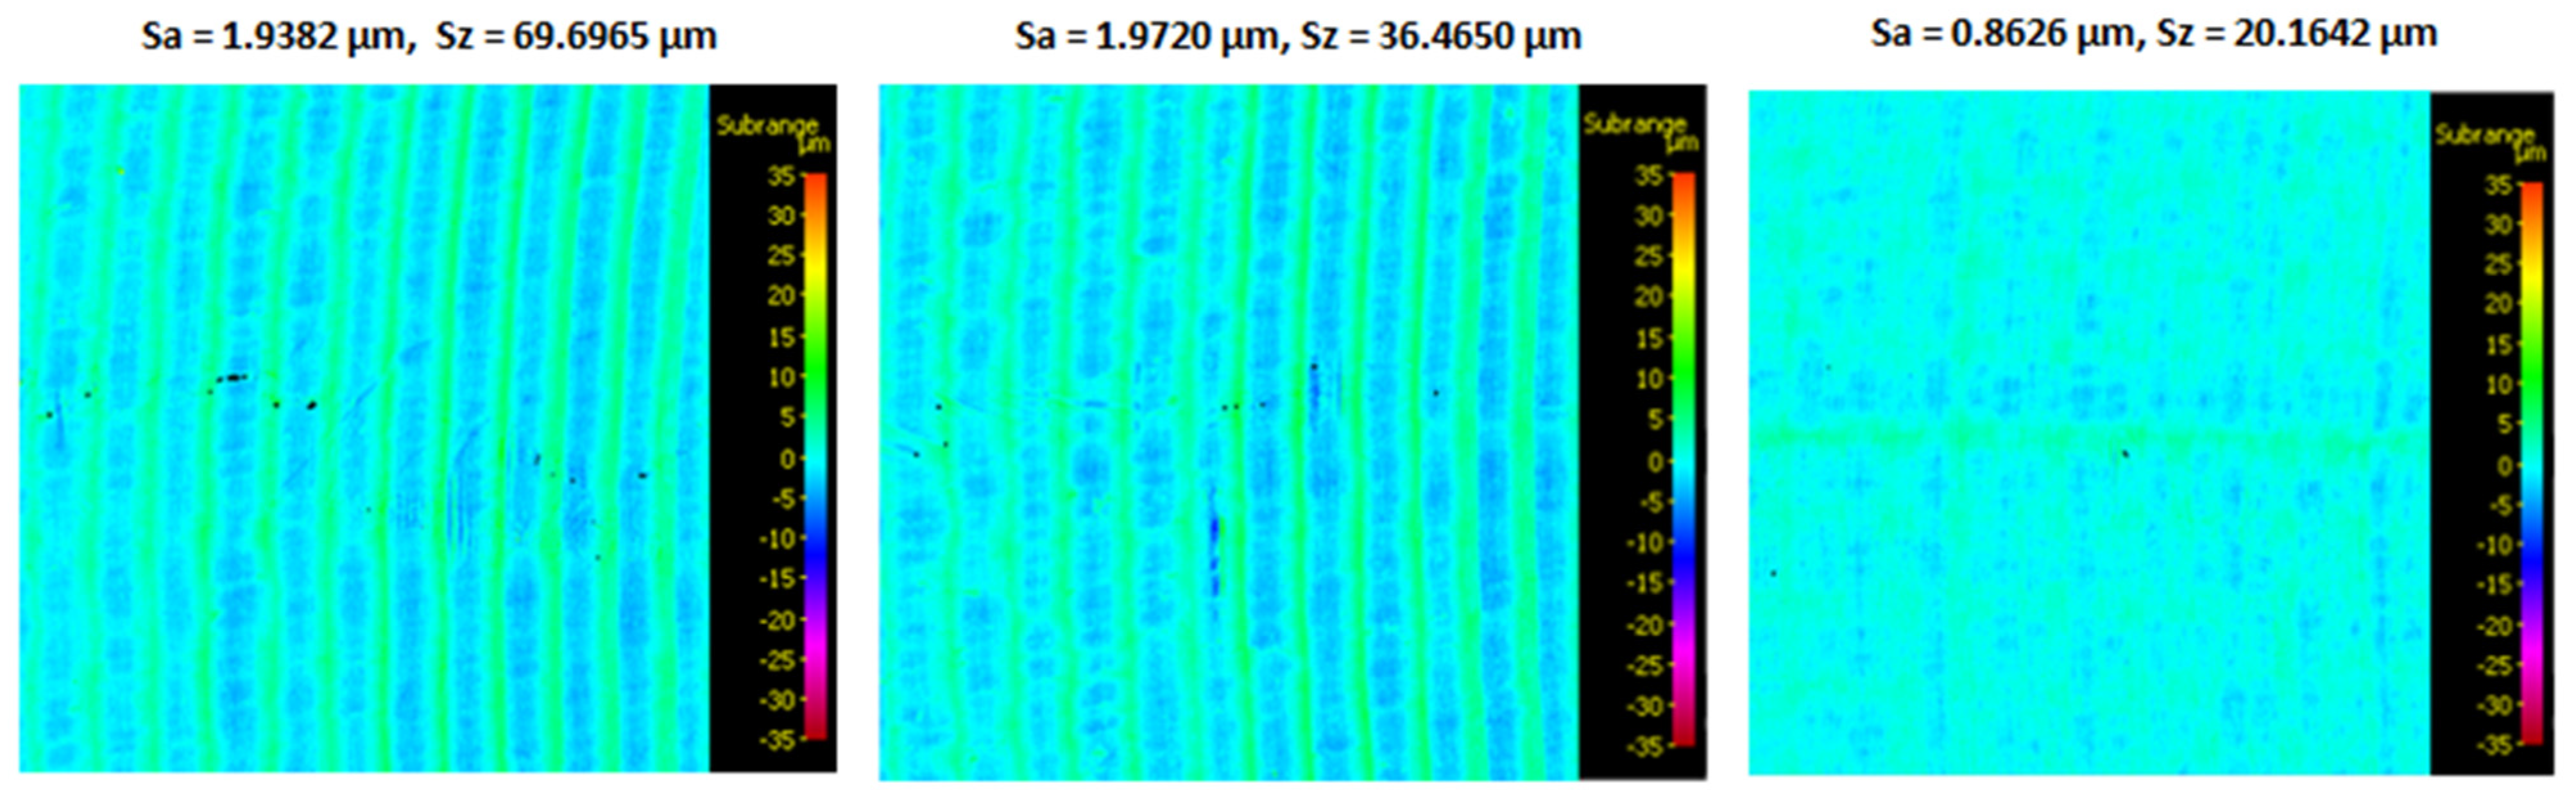
2.2. Surface Roughness Analysis Methodology

The values of the observed surface roughness parameters were evaluated (in accordance with ISO 25 178) from the extracted surface after the removal of its nominal shape (polynomial function of the paraboloid). For the purpose of the analysis, measurements were taken at three locations at specified heights. All measurements were taken at a position of 0 degrees with respect to the specimen axis. The measured areas for surface roughness assessment are shown in Figure 6. The area measured was 6 × 6 mm.
The following surface roughness parameters were evaluated in the experiment:
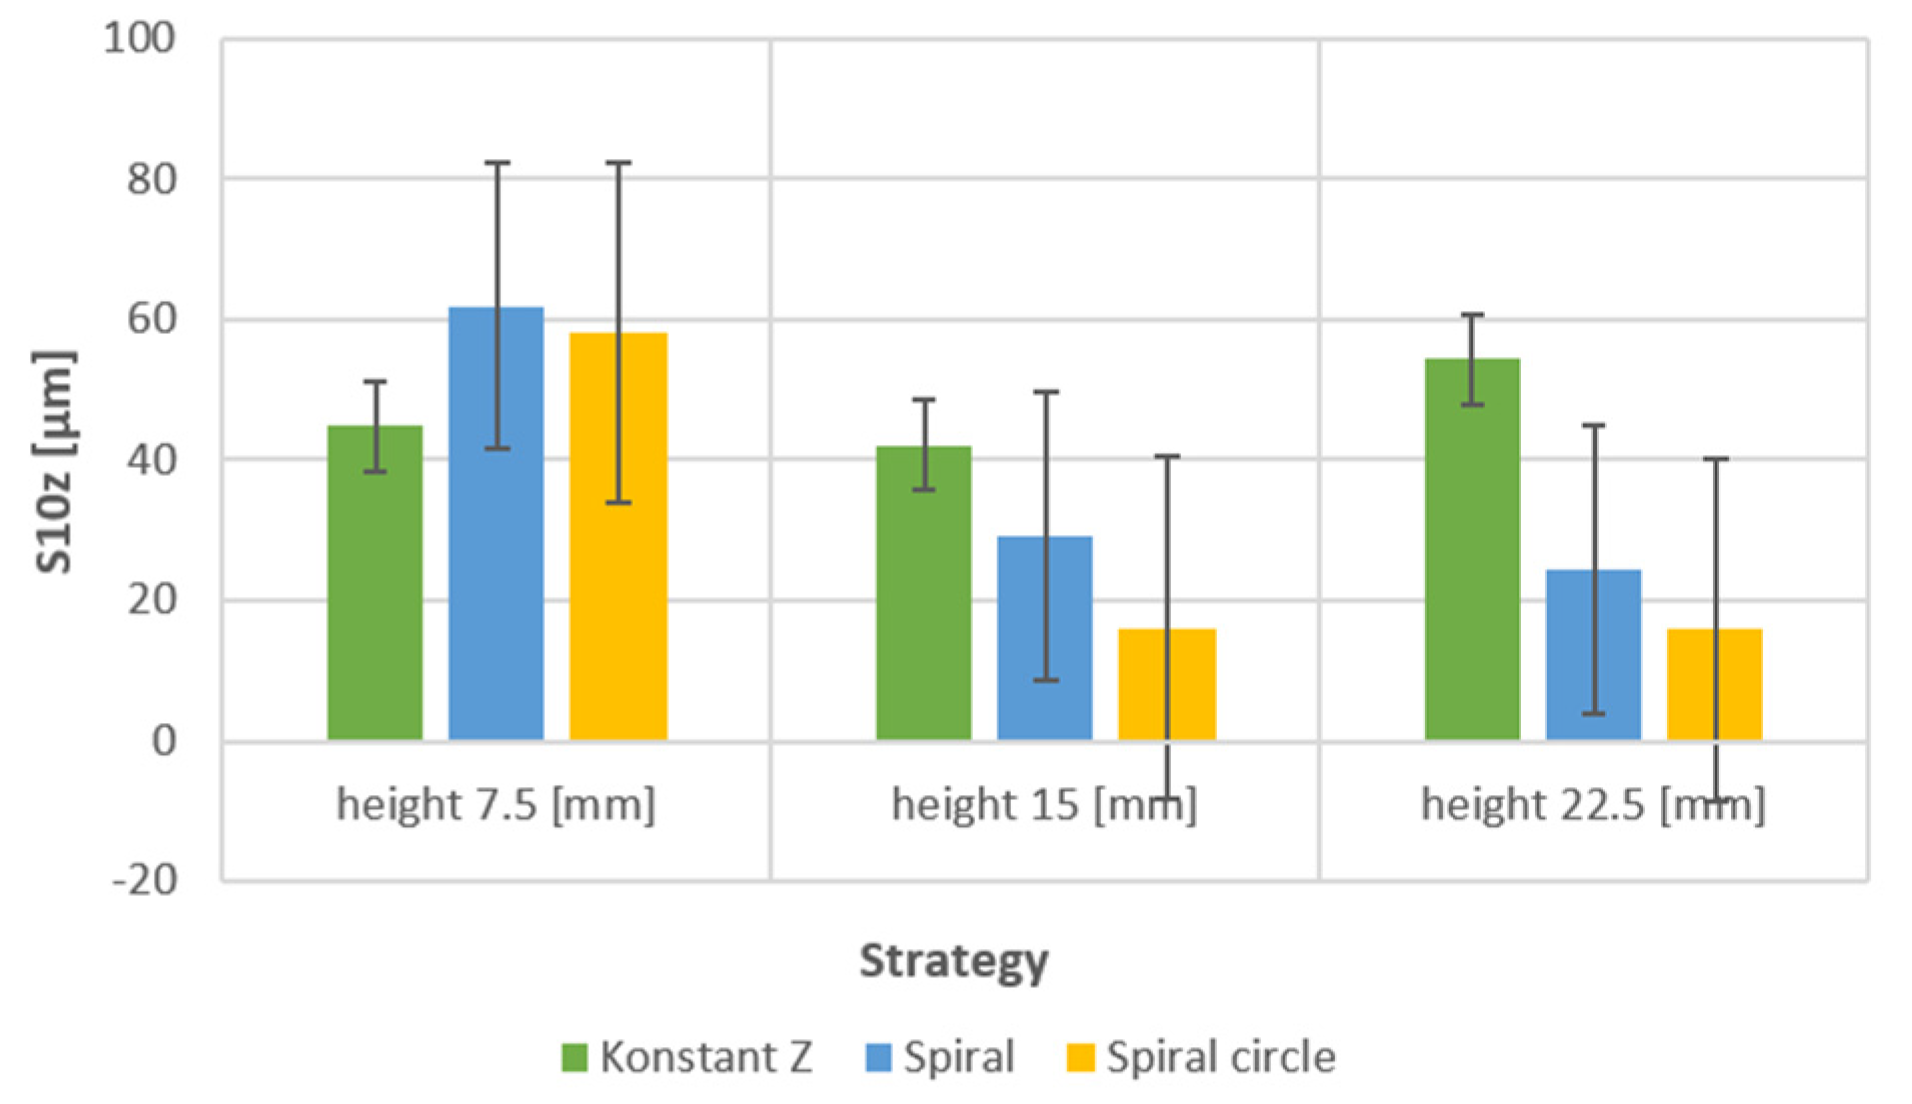
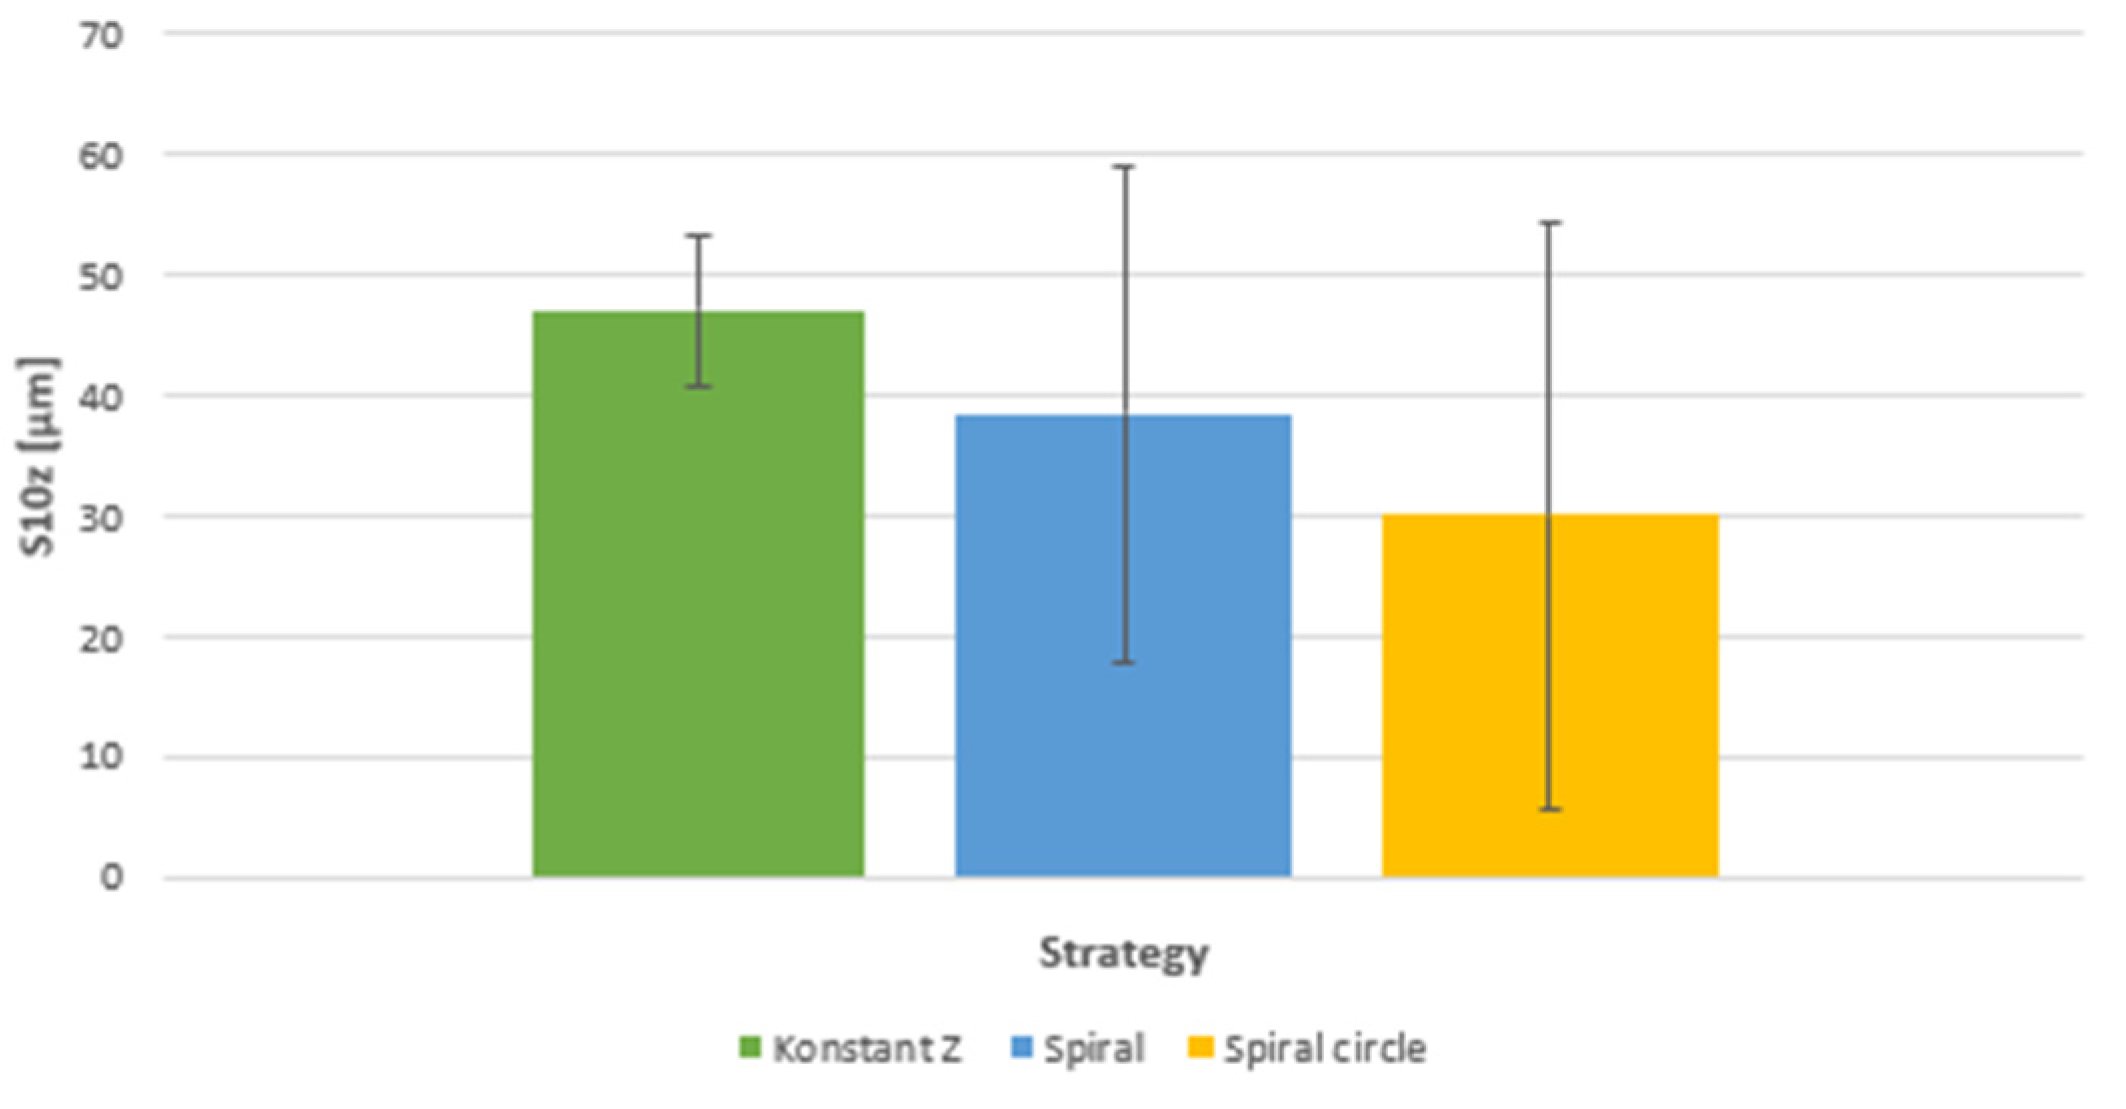
  • S10z—Sensitive to changes in the topography of the observed surface; an important parameter in evaluating the surface functionality (affects dimensional accuracy of fitted surfaces, tightness of joints, etc.).
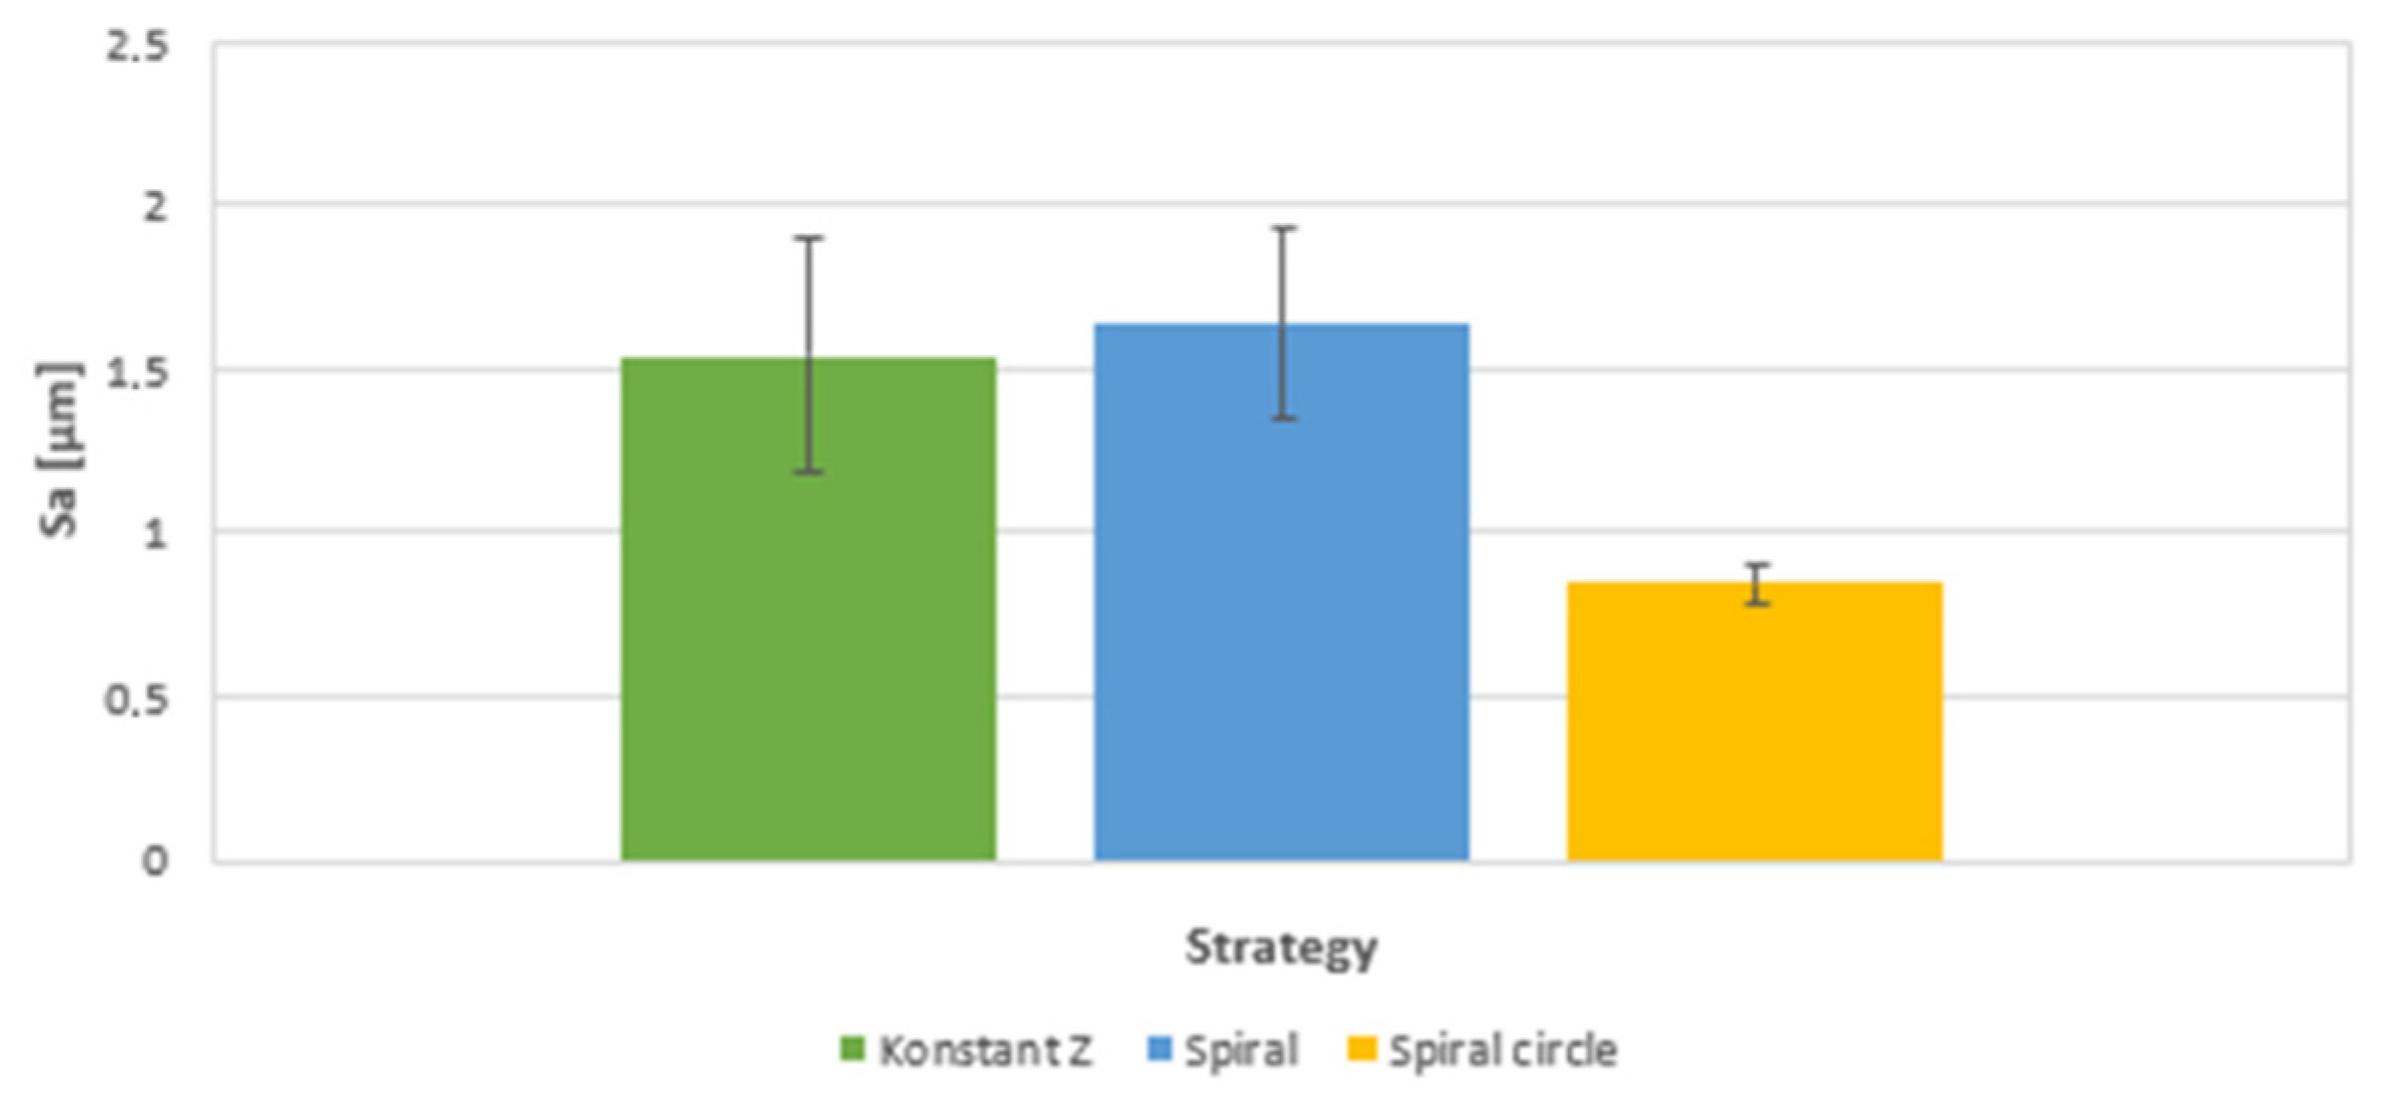
  • Sa—A powerful statistical parameter that is used to regulate and control production.
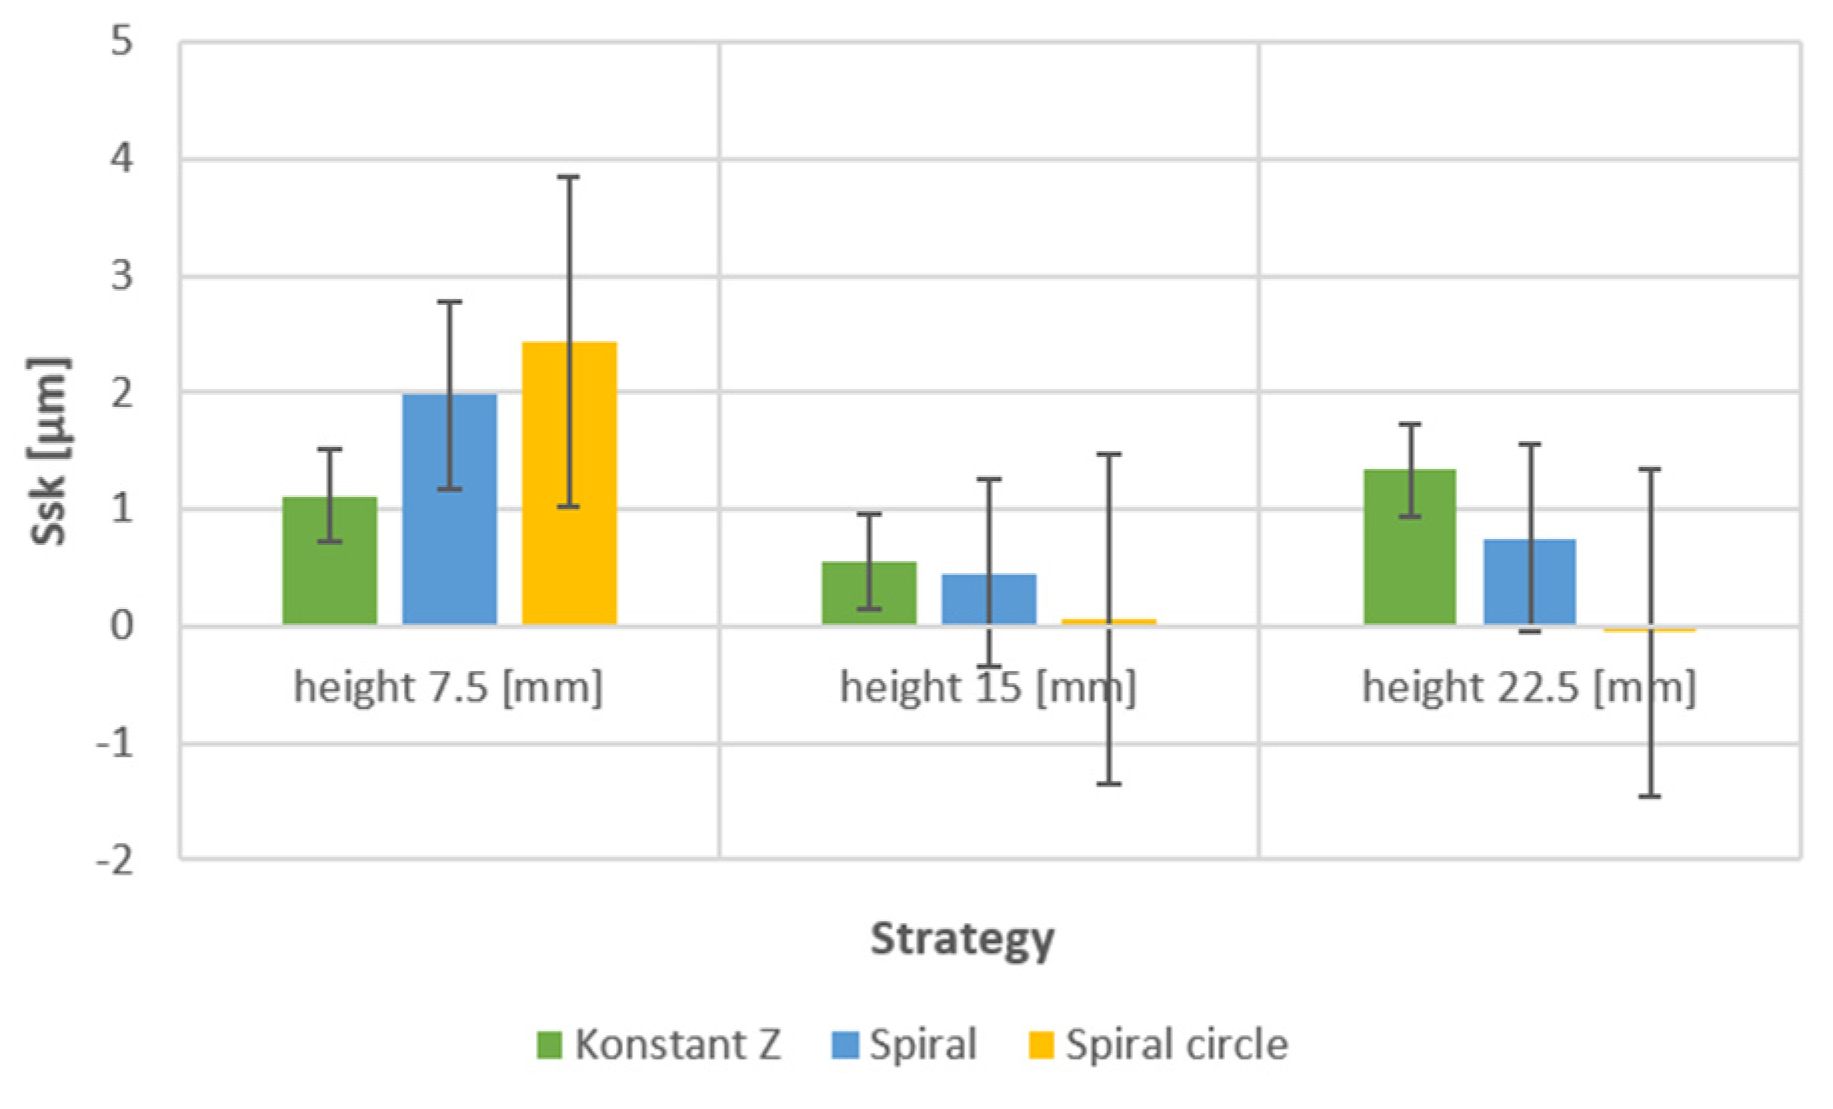
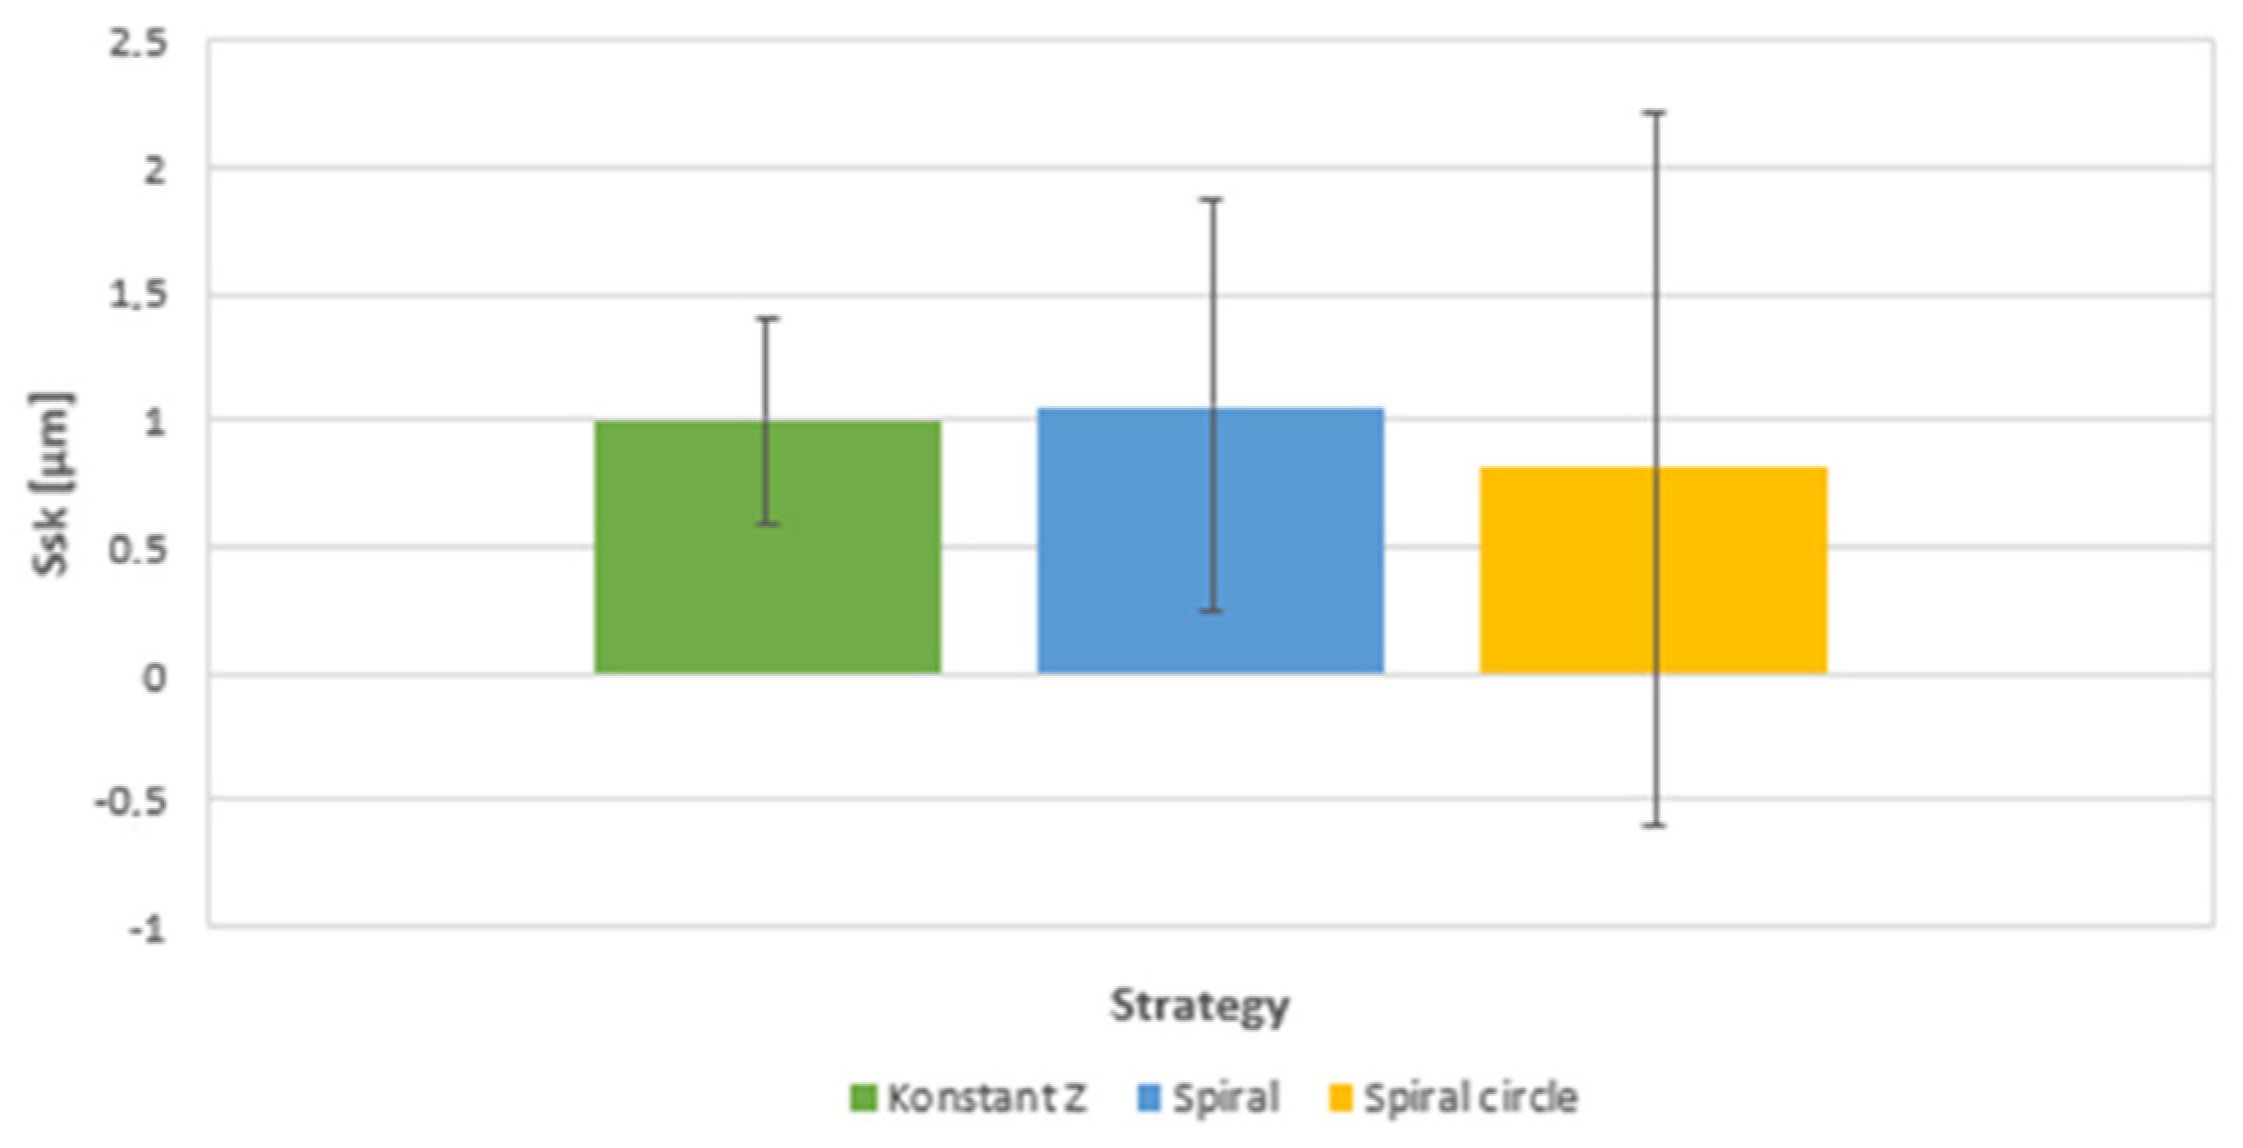
  • Ssk—Gives us information about the protrusions and depressions of the topography of the observed surface. If it takes a positive value, protrusion dominates, and if it takes a negative value, depression dominates.

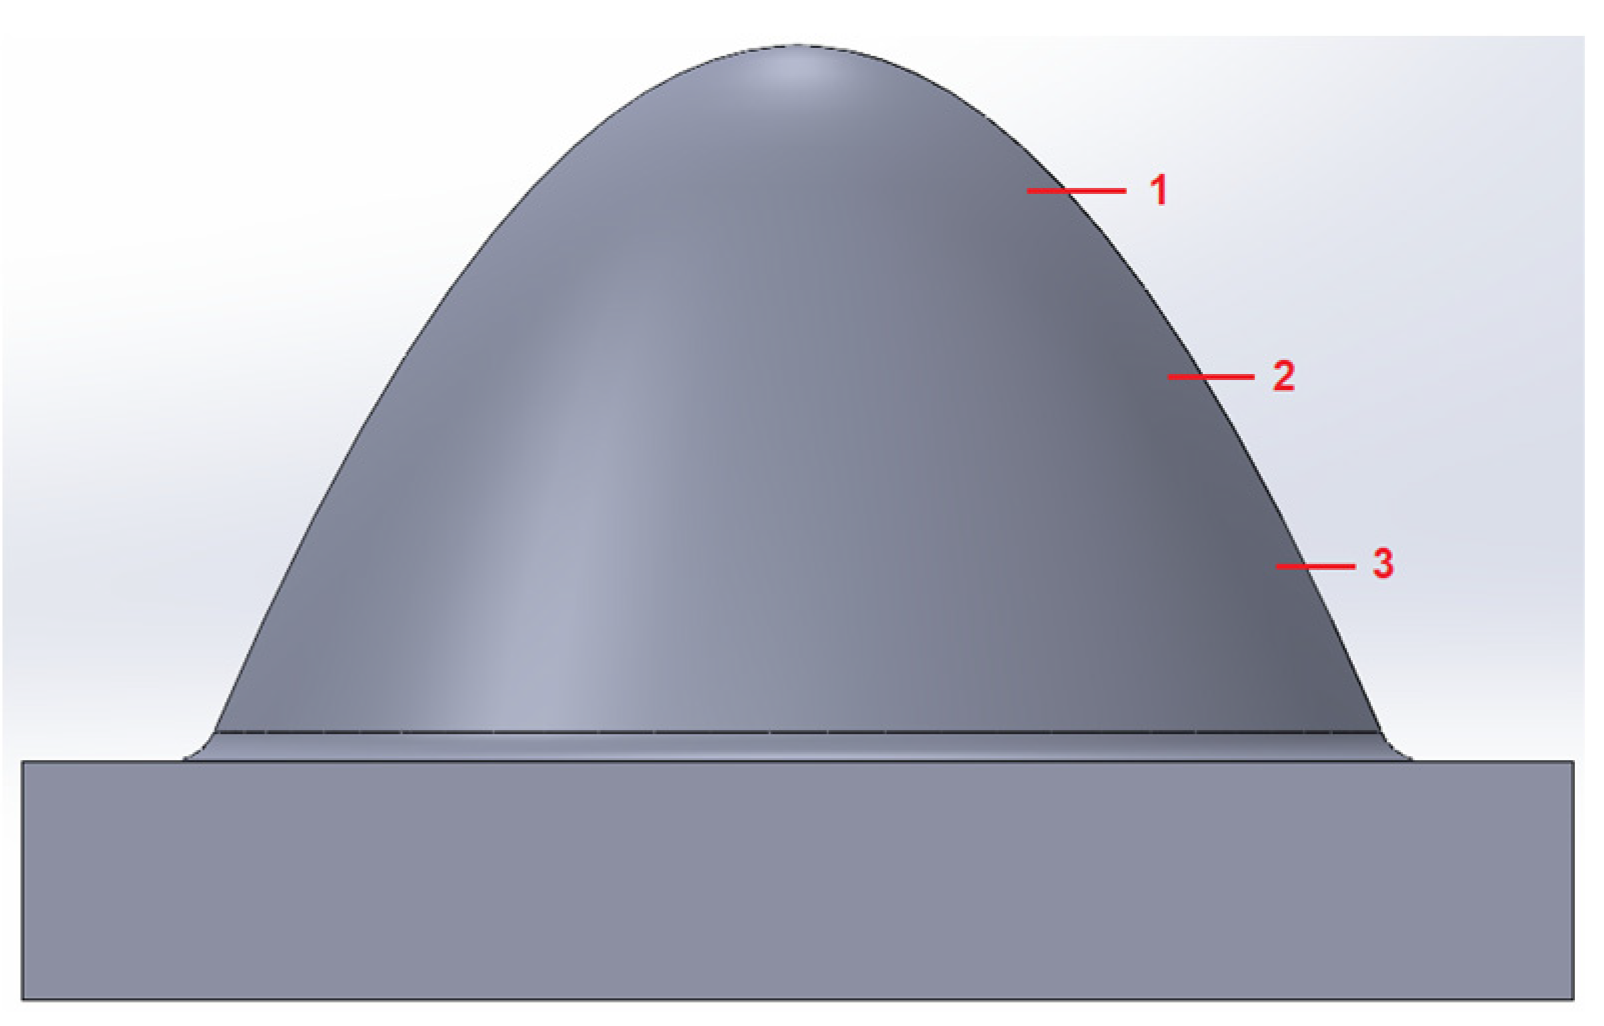
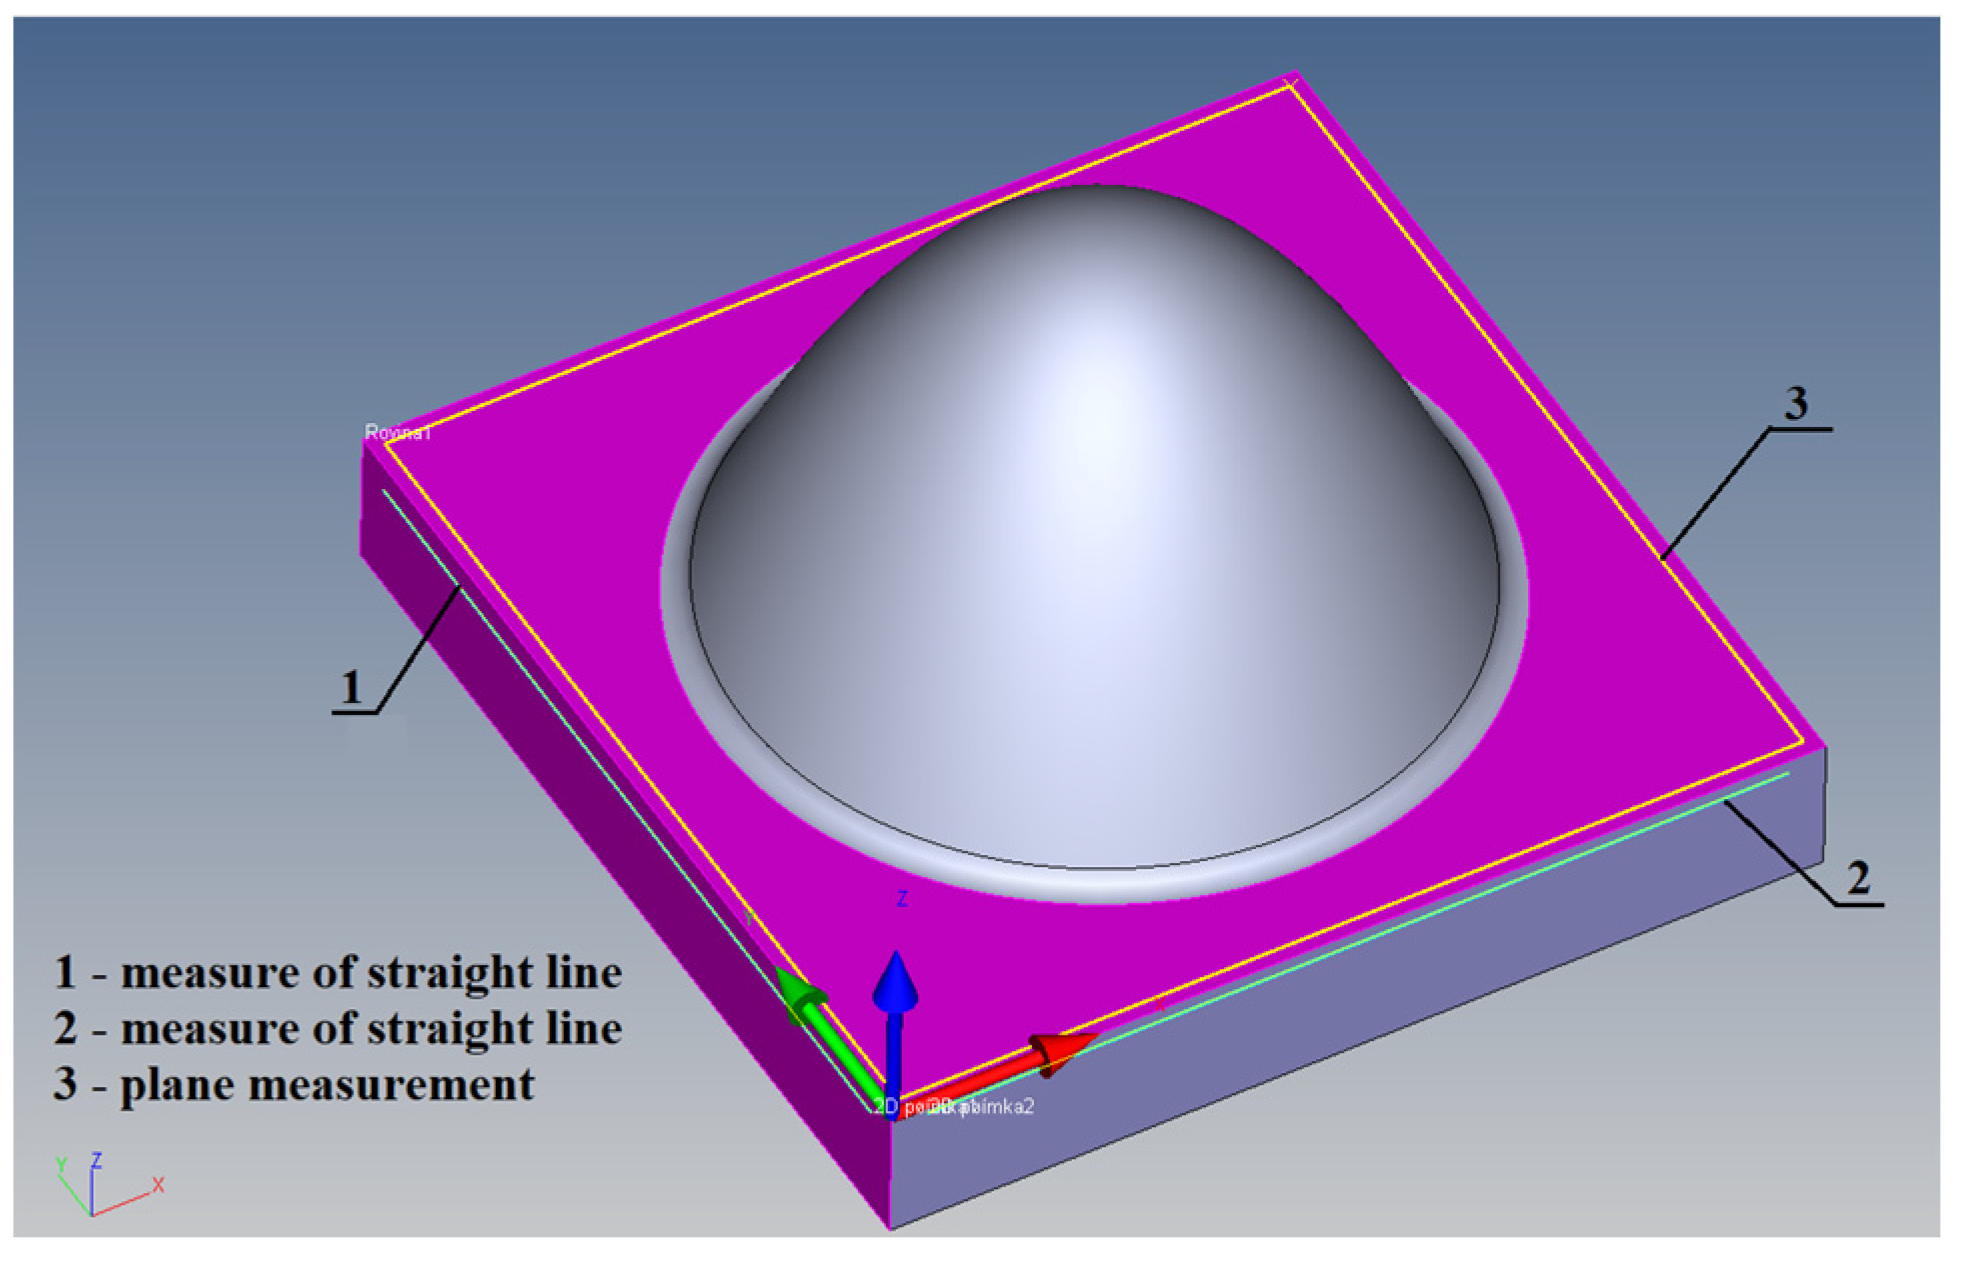
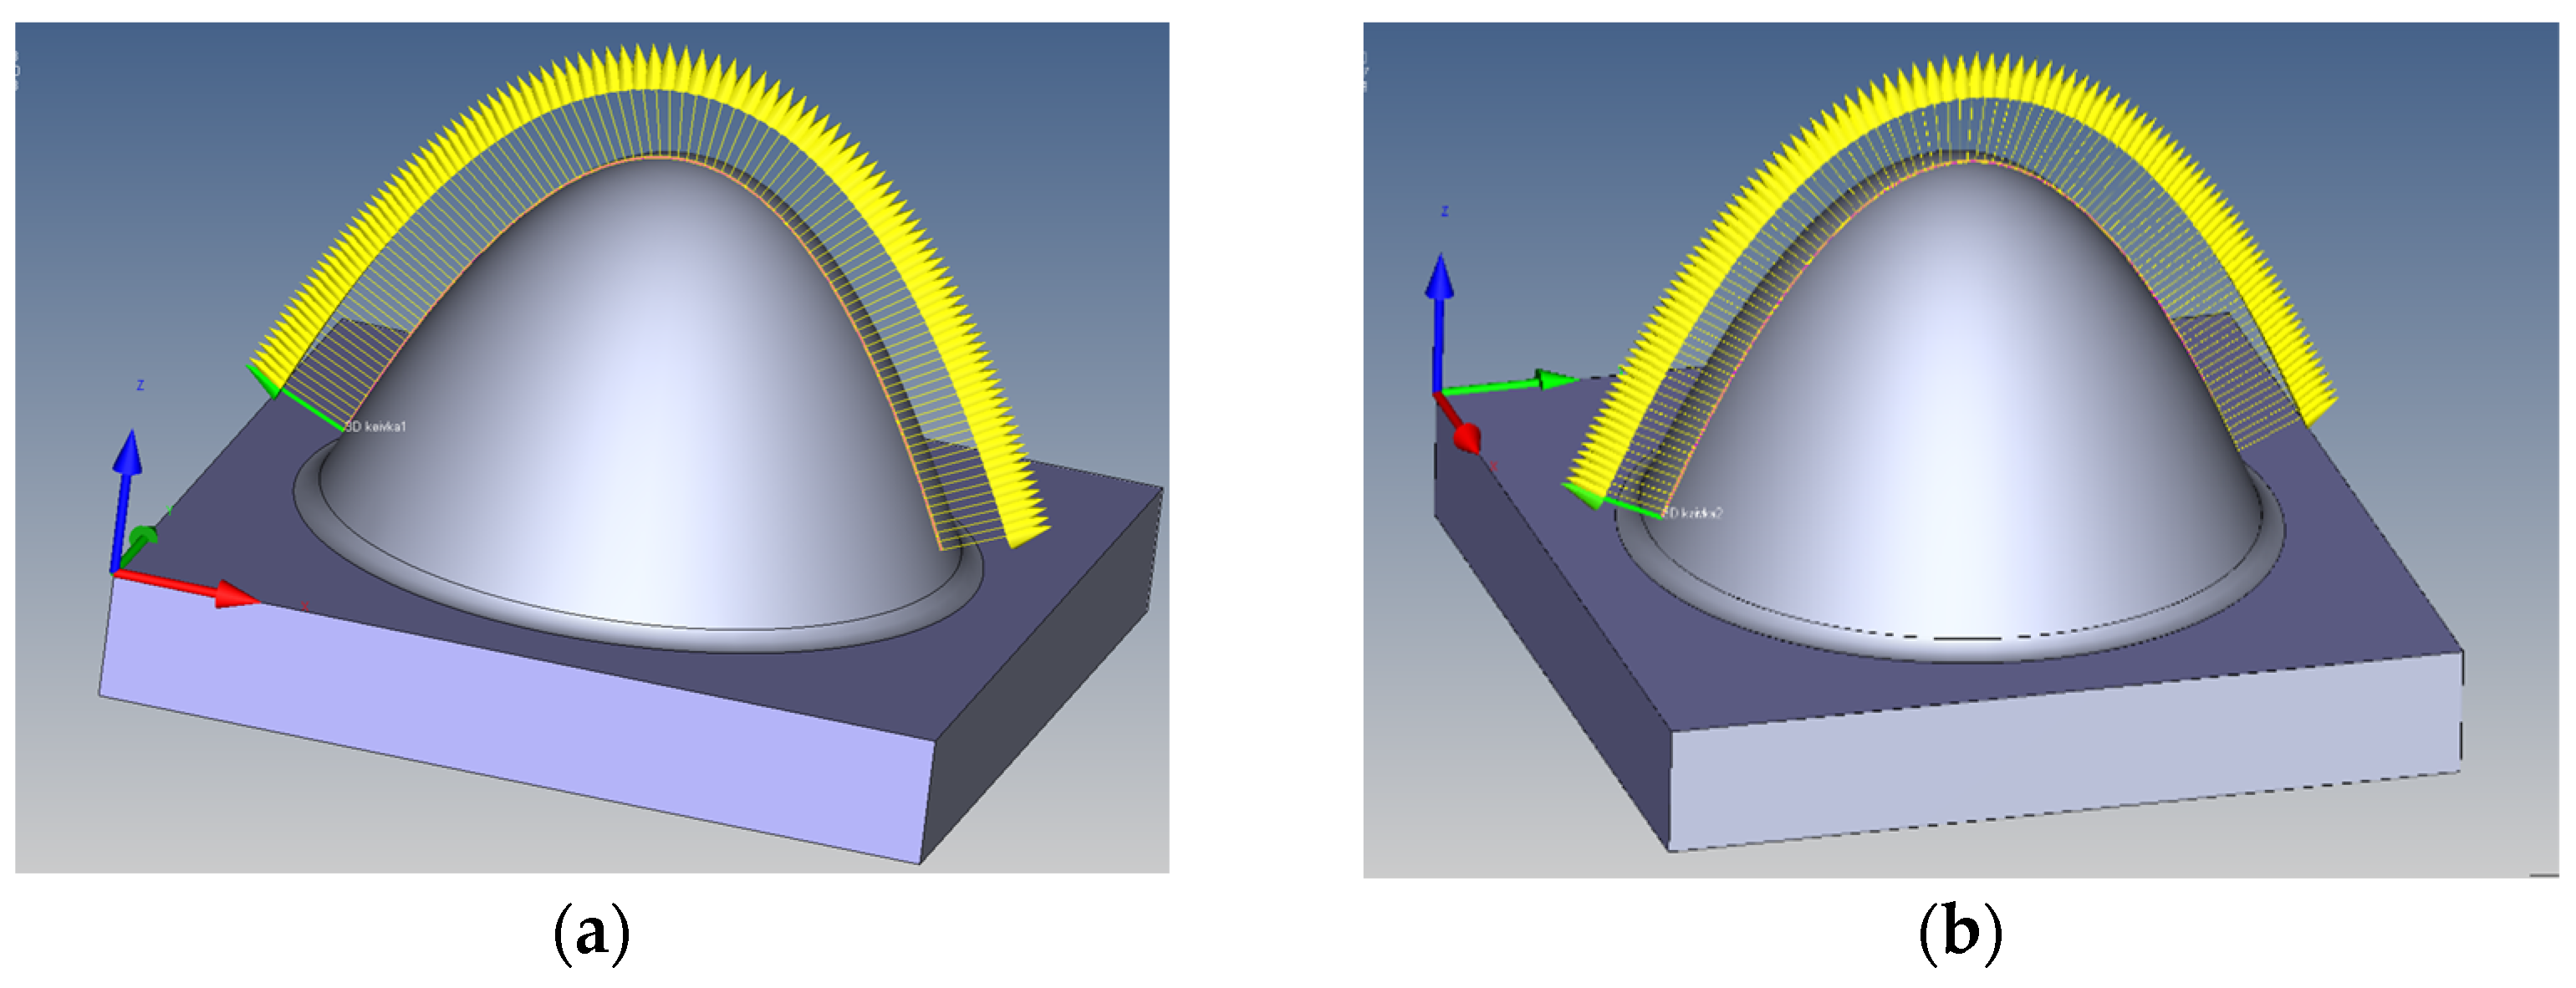
2.3. Methodology of the Shape Deviation

During the evaluation, the research area was evaluated as a whole. At a temperature of 18–22 °C, the measurement error is 2.2 + L/3 (E0 length measurement error in μm). The profile measurement was performed by scanning, which means that the sensor was always in contact with the measured area from the beginning to the end of the scan. No filter or outlier elimination was used to evaluate the measured points, as this is not recommended by the manufacturer when measuring a profile. A best-fit method was used for the evaluation so that the scanned profile is evaluated separately and is not referenced to the basic coordinate system. A whole set of values can be smoothly moved or rotated around the individual axes of the coordinate system so that the average deviation is as small as possible. ZEISS Calypso 2021 software and a sensor with a diameter D of 1 mm on a length of 45 mm with a silicon nitride bead particularly suitable for aluminum were used for the measurements. At the beginning of the measurement, it was necessary to establish the basic coordinate system, which consists of a sensing plane and two 2D lines. Focusing on the basic coordinate system-spatial alignment method 3-2-1 is shown in Figure 7.
Once the coordinate system was oriented, measurements were taken, denoted as 3D curve 1 and 3D curve 2. Basically, measurements of 3D curves were taken in two planes: the X–Z plane, as shown in Figure 8a, and the Y–Z plane, as shown in Figure 8b. The normal vectors from the measurement points are marked in yellow. The scanning step was 0.1 mm, so a point on the surface was recorded every 0.1 mm during scanning. A total of 749 measurement points were taken in one plane at a speed of 2 mm/s.
Subsequently, the 3D curve measurements were complemented by surface measurements. Circular paths were taken on the surface of the specimens, along which the sensor moved from the highest point to the lowest. The normal vectors from the measurement points are marked in yellow. The scanning step was 0.1 mm, and the measurement speed was 3 mm/s. The number of measurement points varied depending on the location and the height of the measurement on the surface on which the sensor was located. For the highest location, 579 points were recorded, 1039 points were recorded in the middle level, and 1499 points were recorded in the lowest location. The number of points measured depending on the measurement location is shown in Figure 9.
The production of 3D surfaces is growing in importance due to the expanding aerospace and military industries. Furthermore, 3D surfaces are also finding their way into the consumer products market. These take shape using tools such as injection molds, molding dies, or other forming tools. The production of tools is time-consuming and expensive, so their manufacturing processes need to be addressed. The research described thus contributes to improving the commercial application of the technologies used. In addition, the design of a milling process ensuring the lowest possible surface roughness means shortening the finishing process (grinding and polishing) and reducing costs.

3. Results

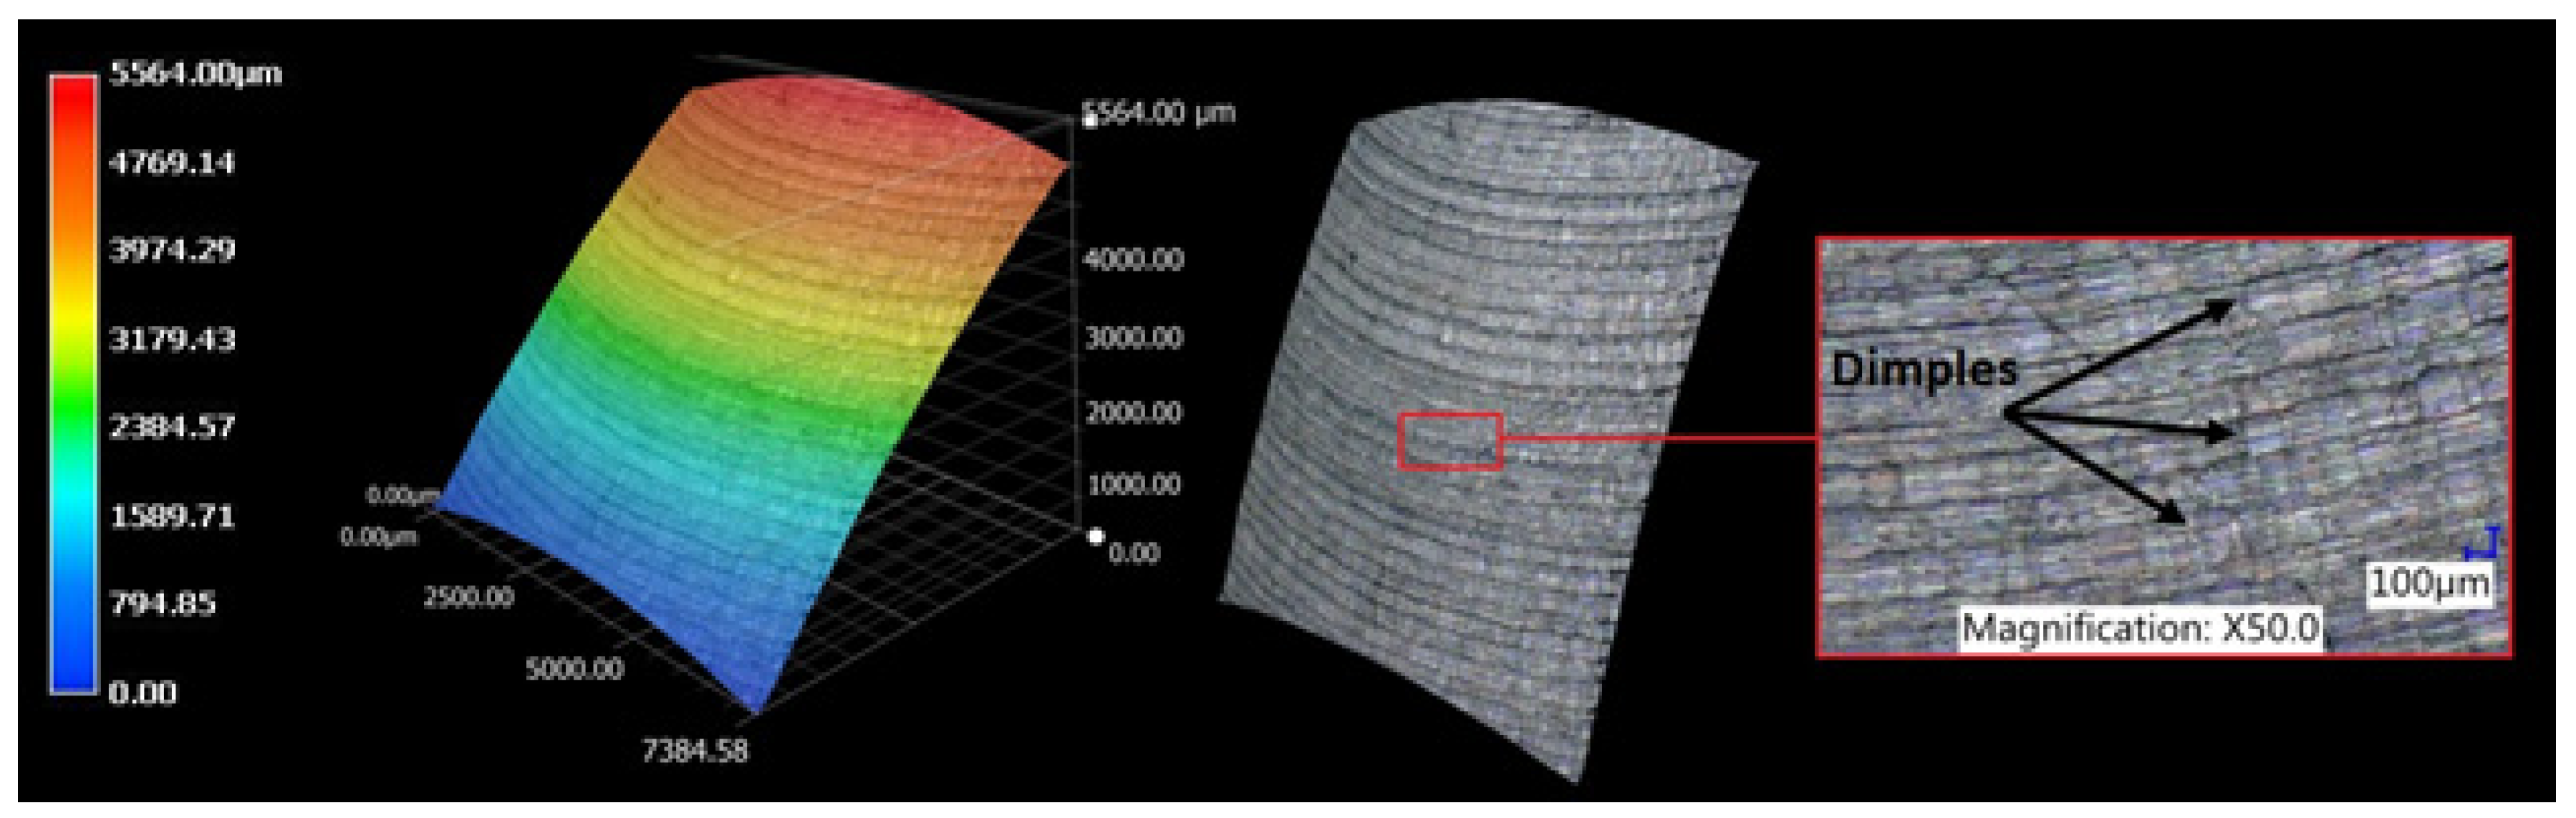
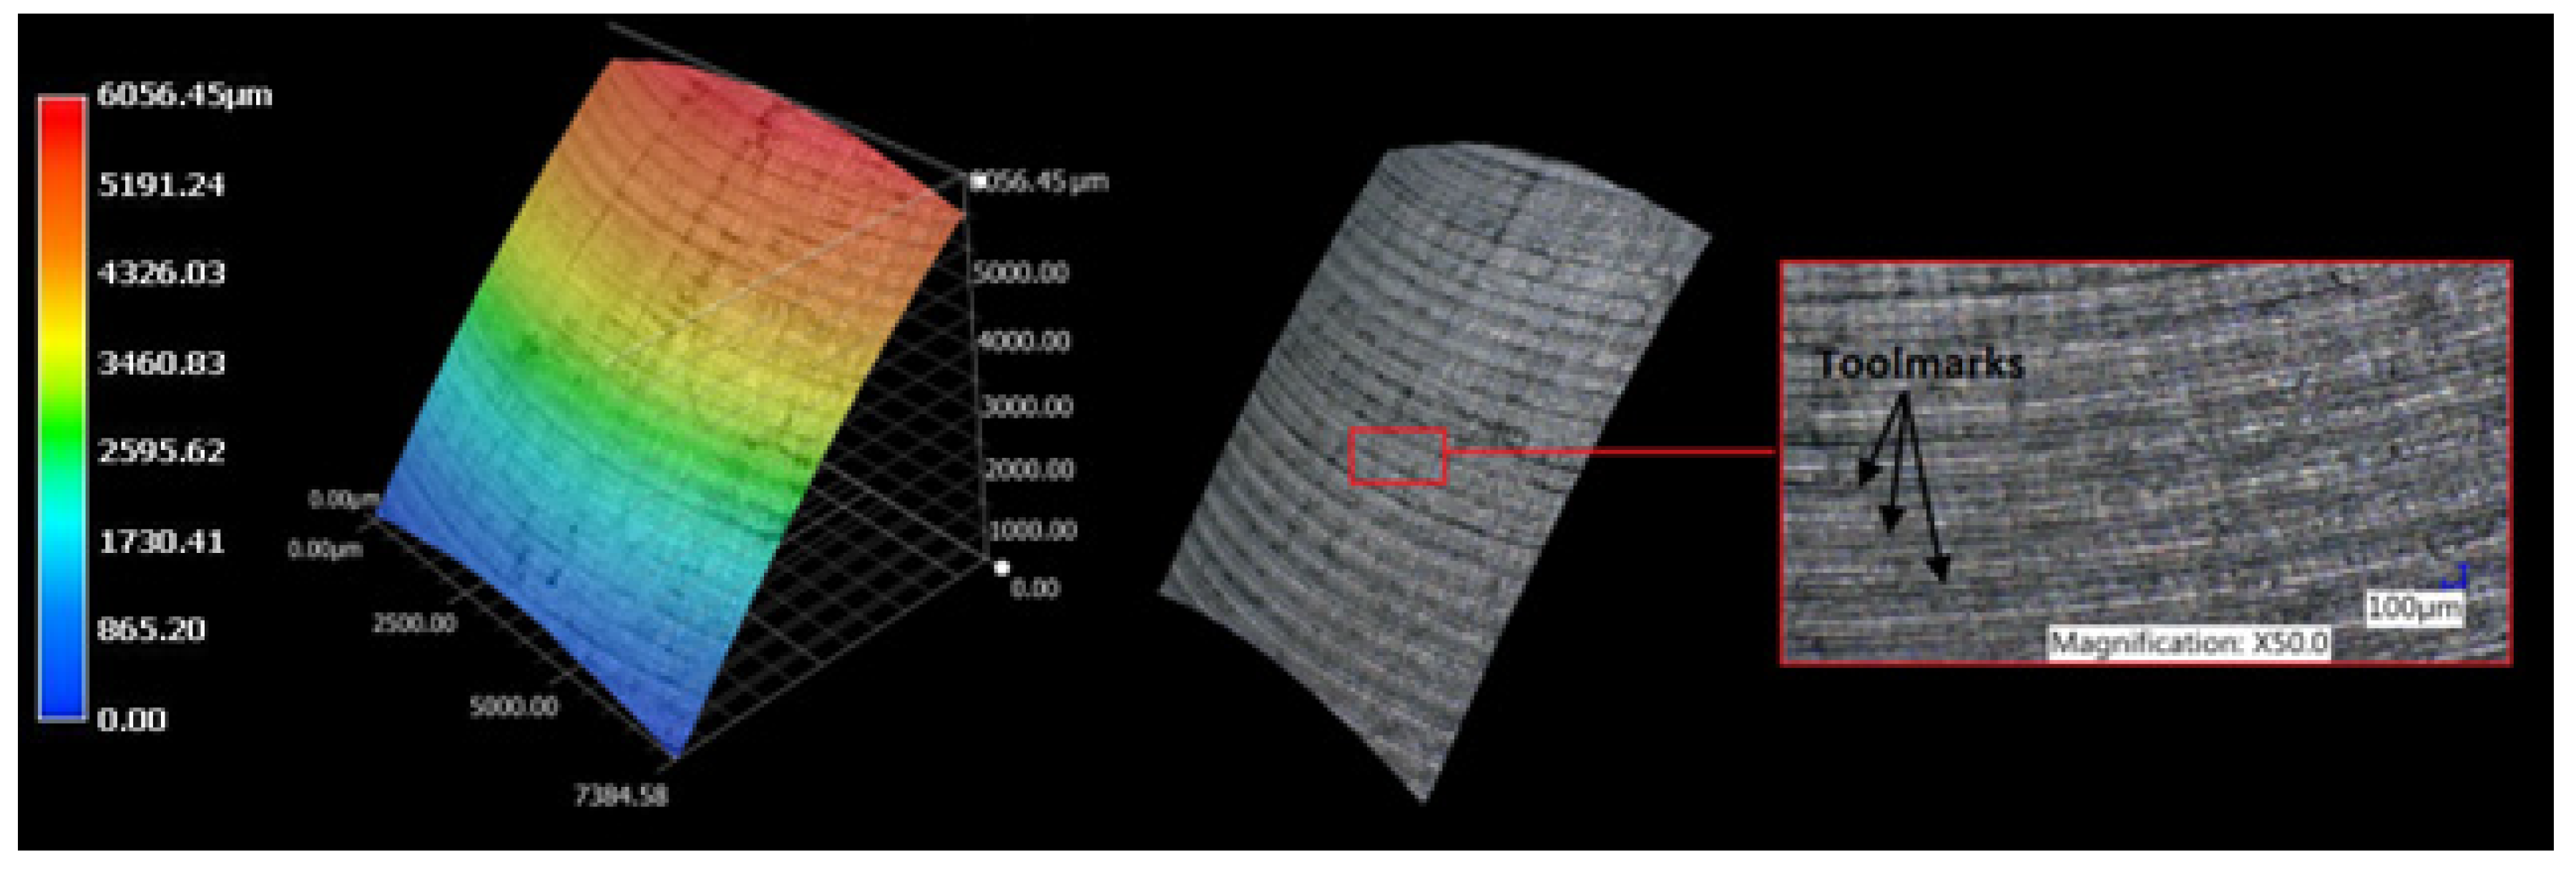
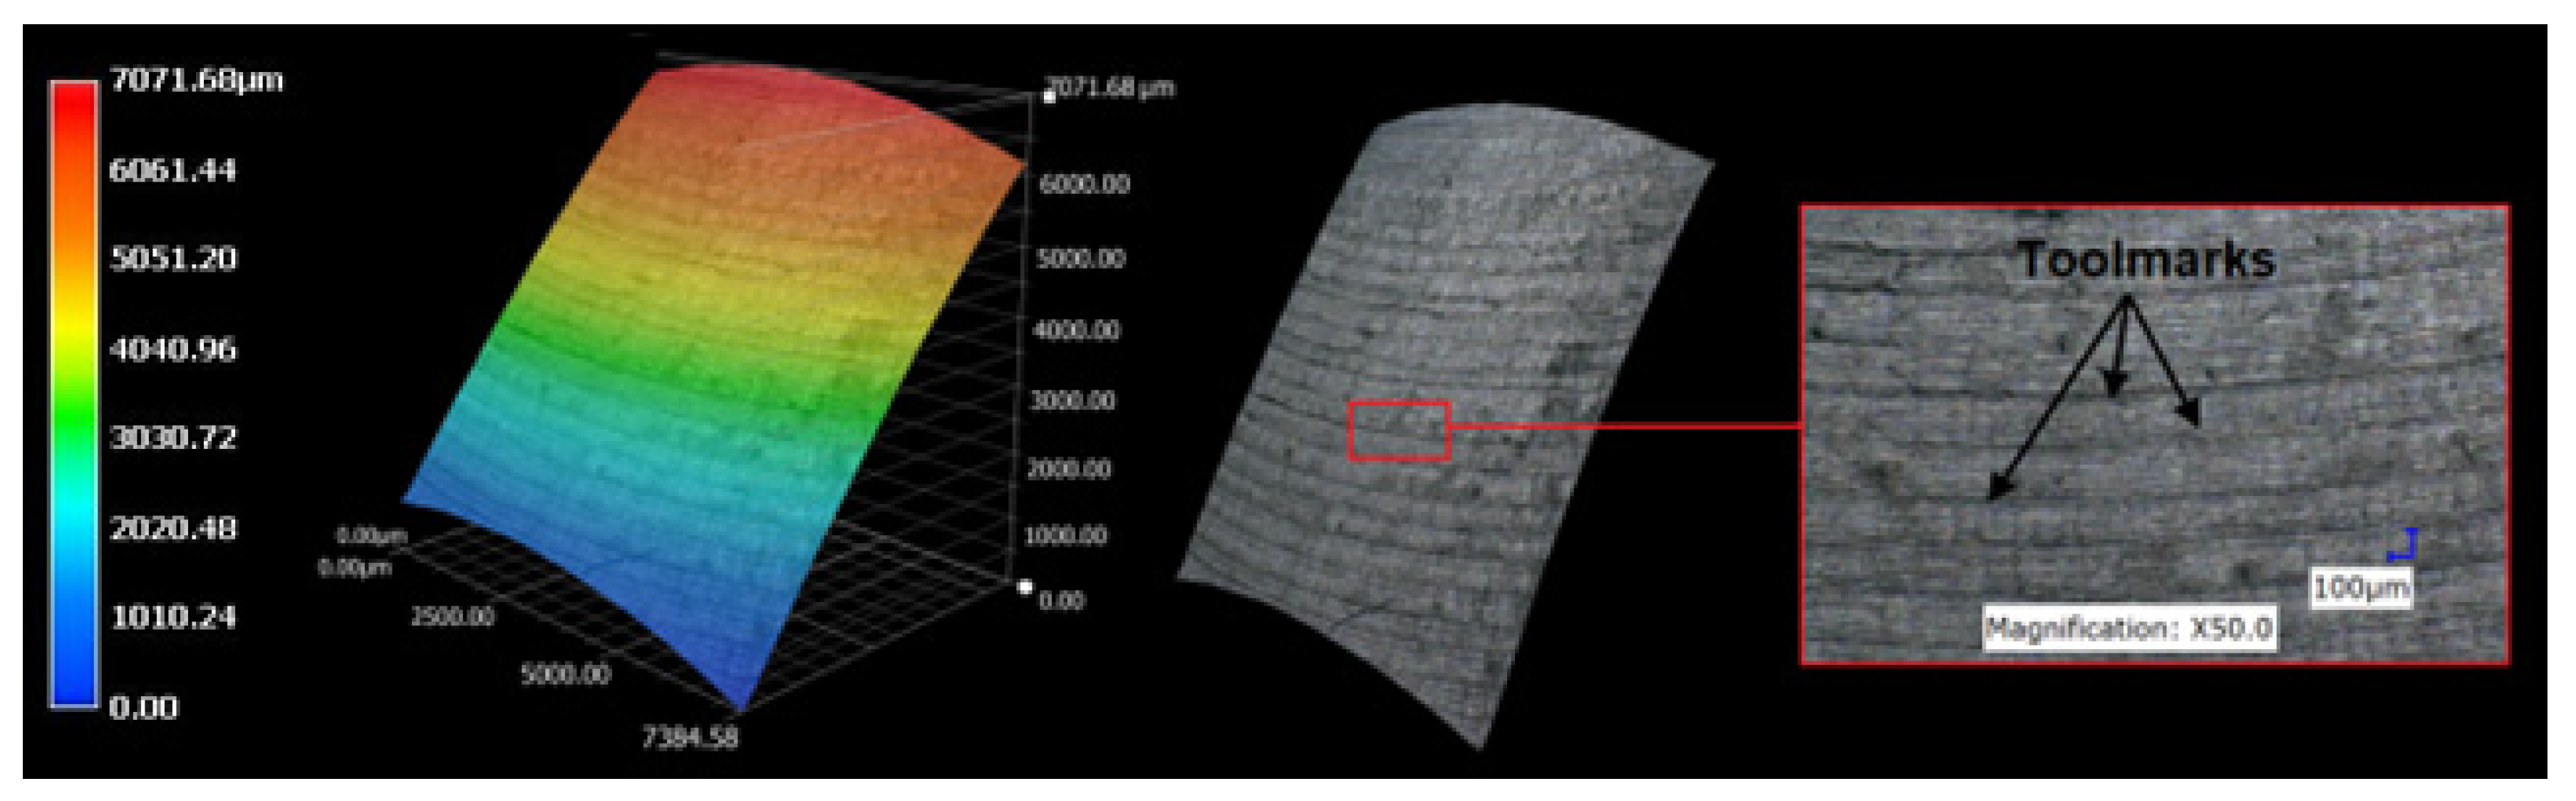
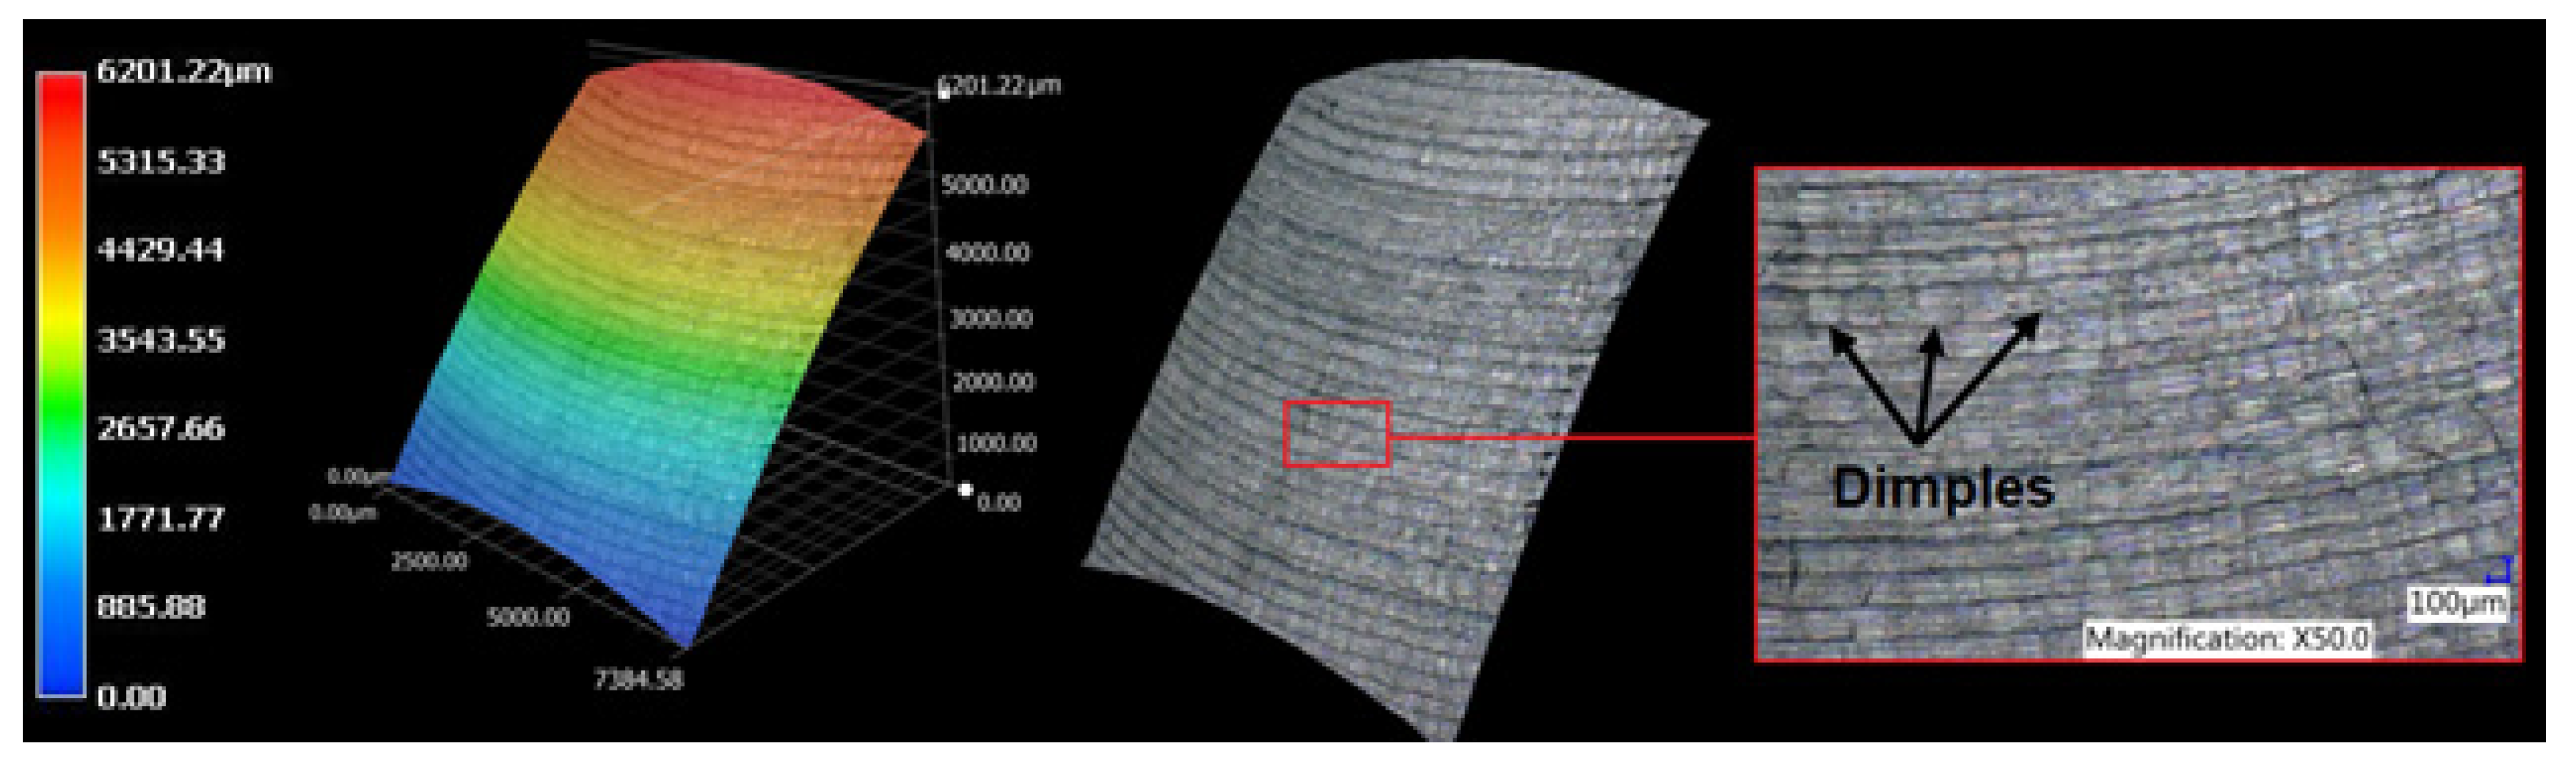
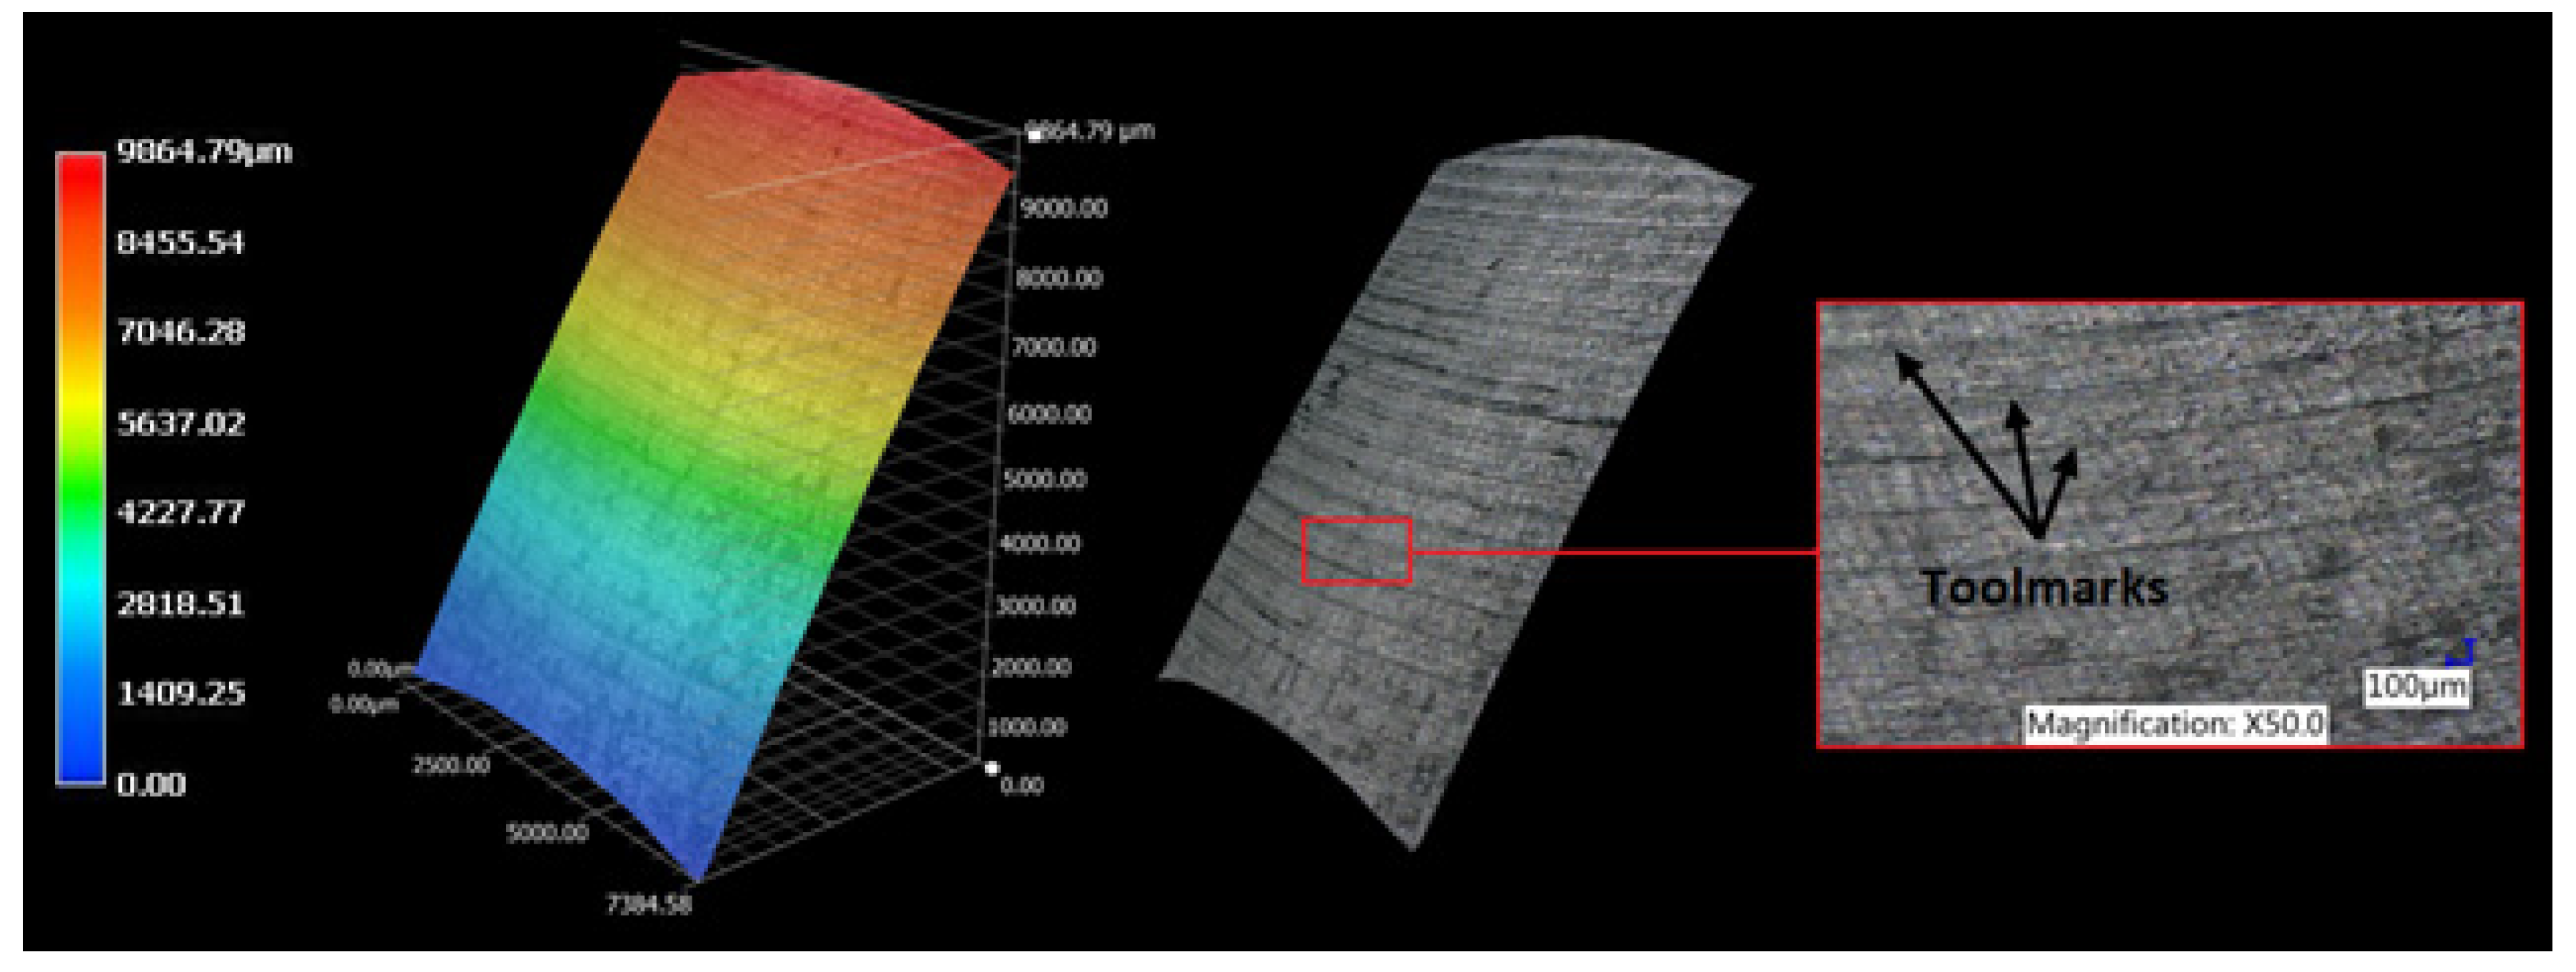
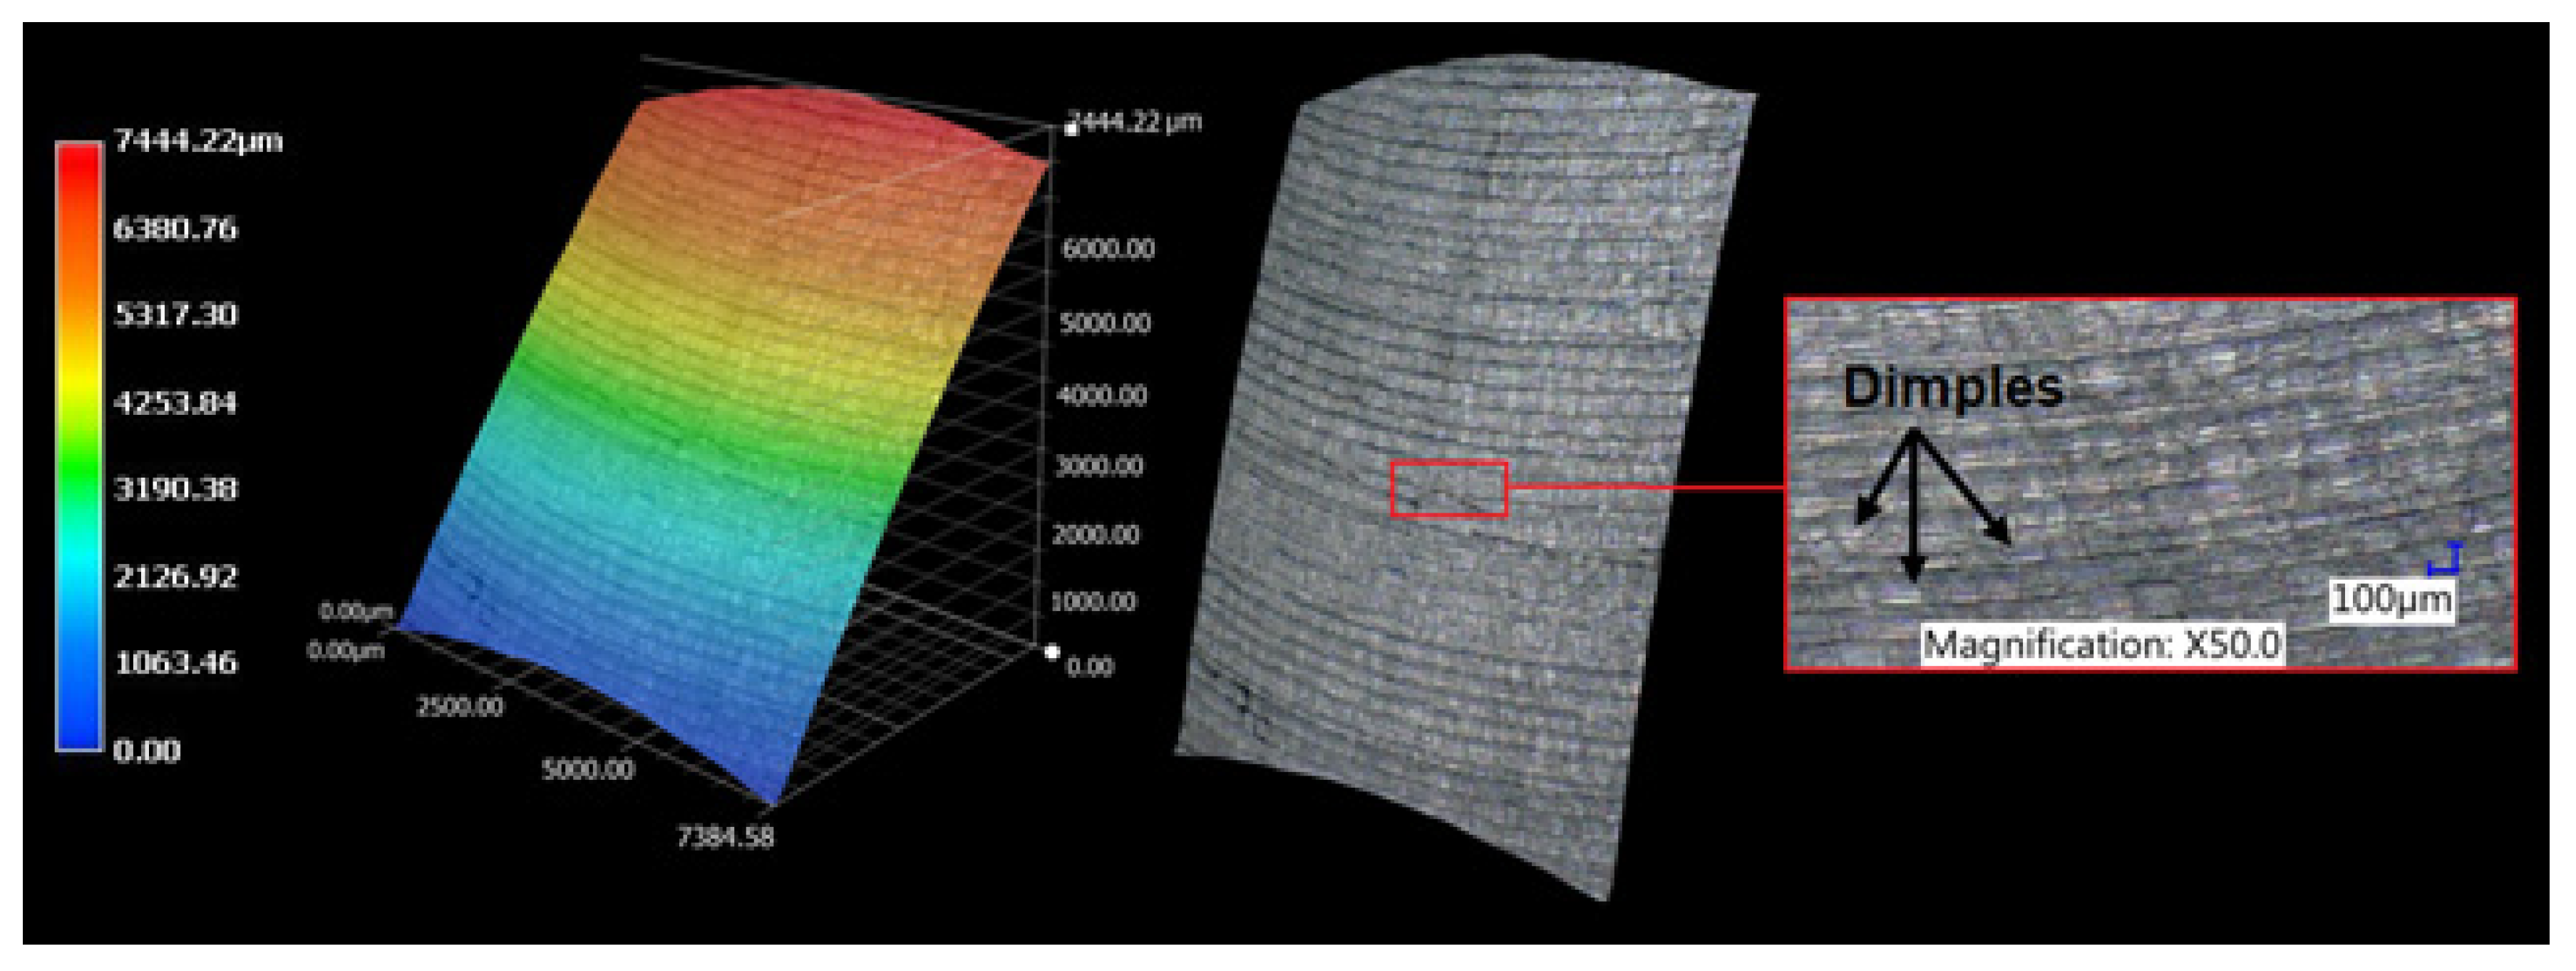
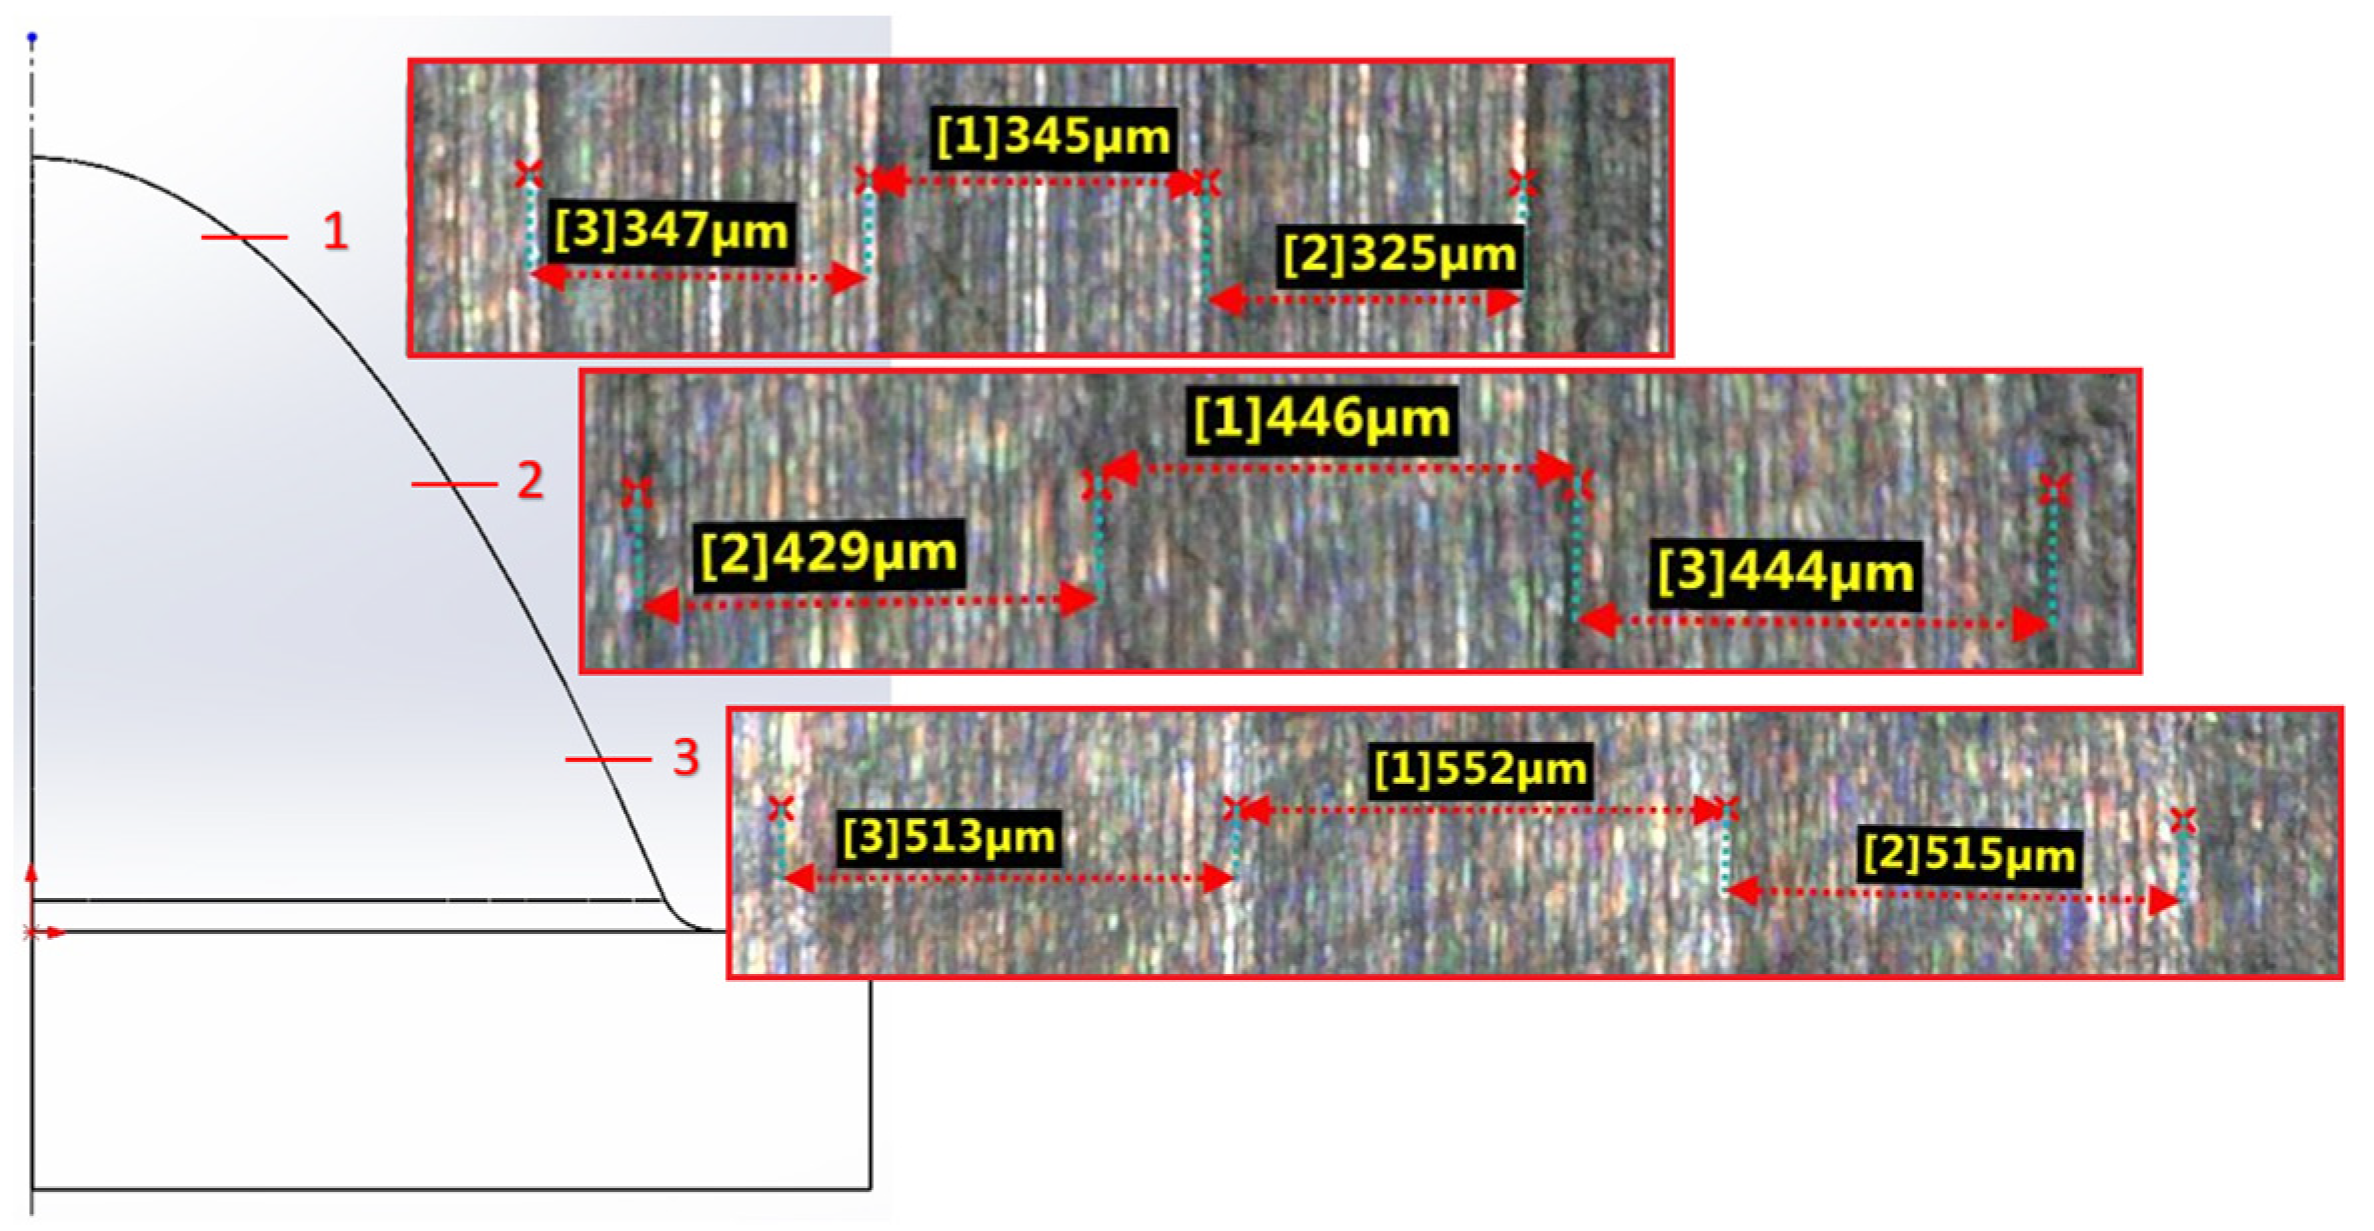
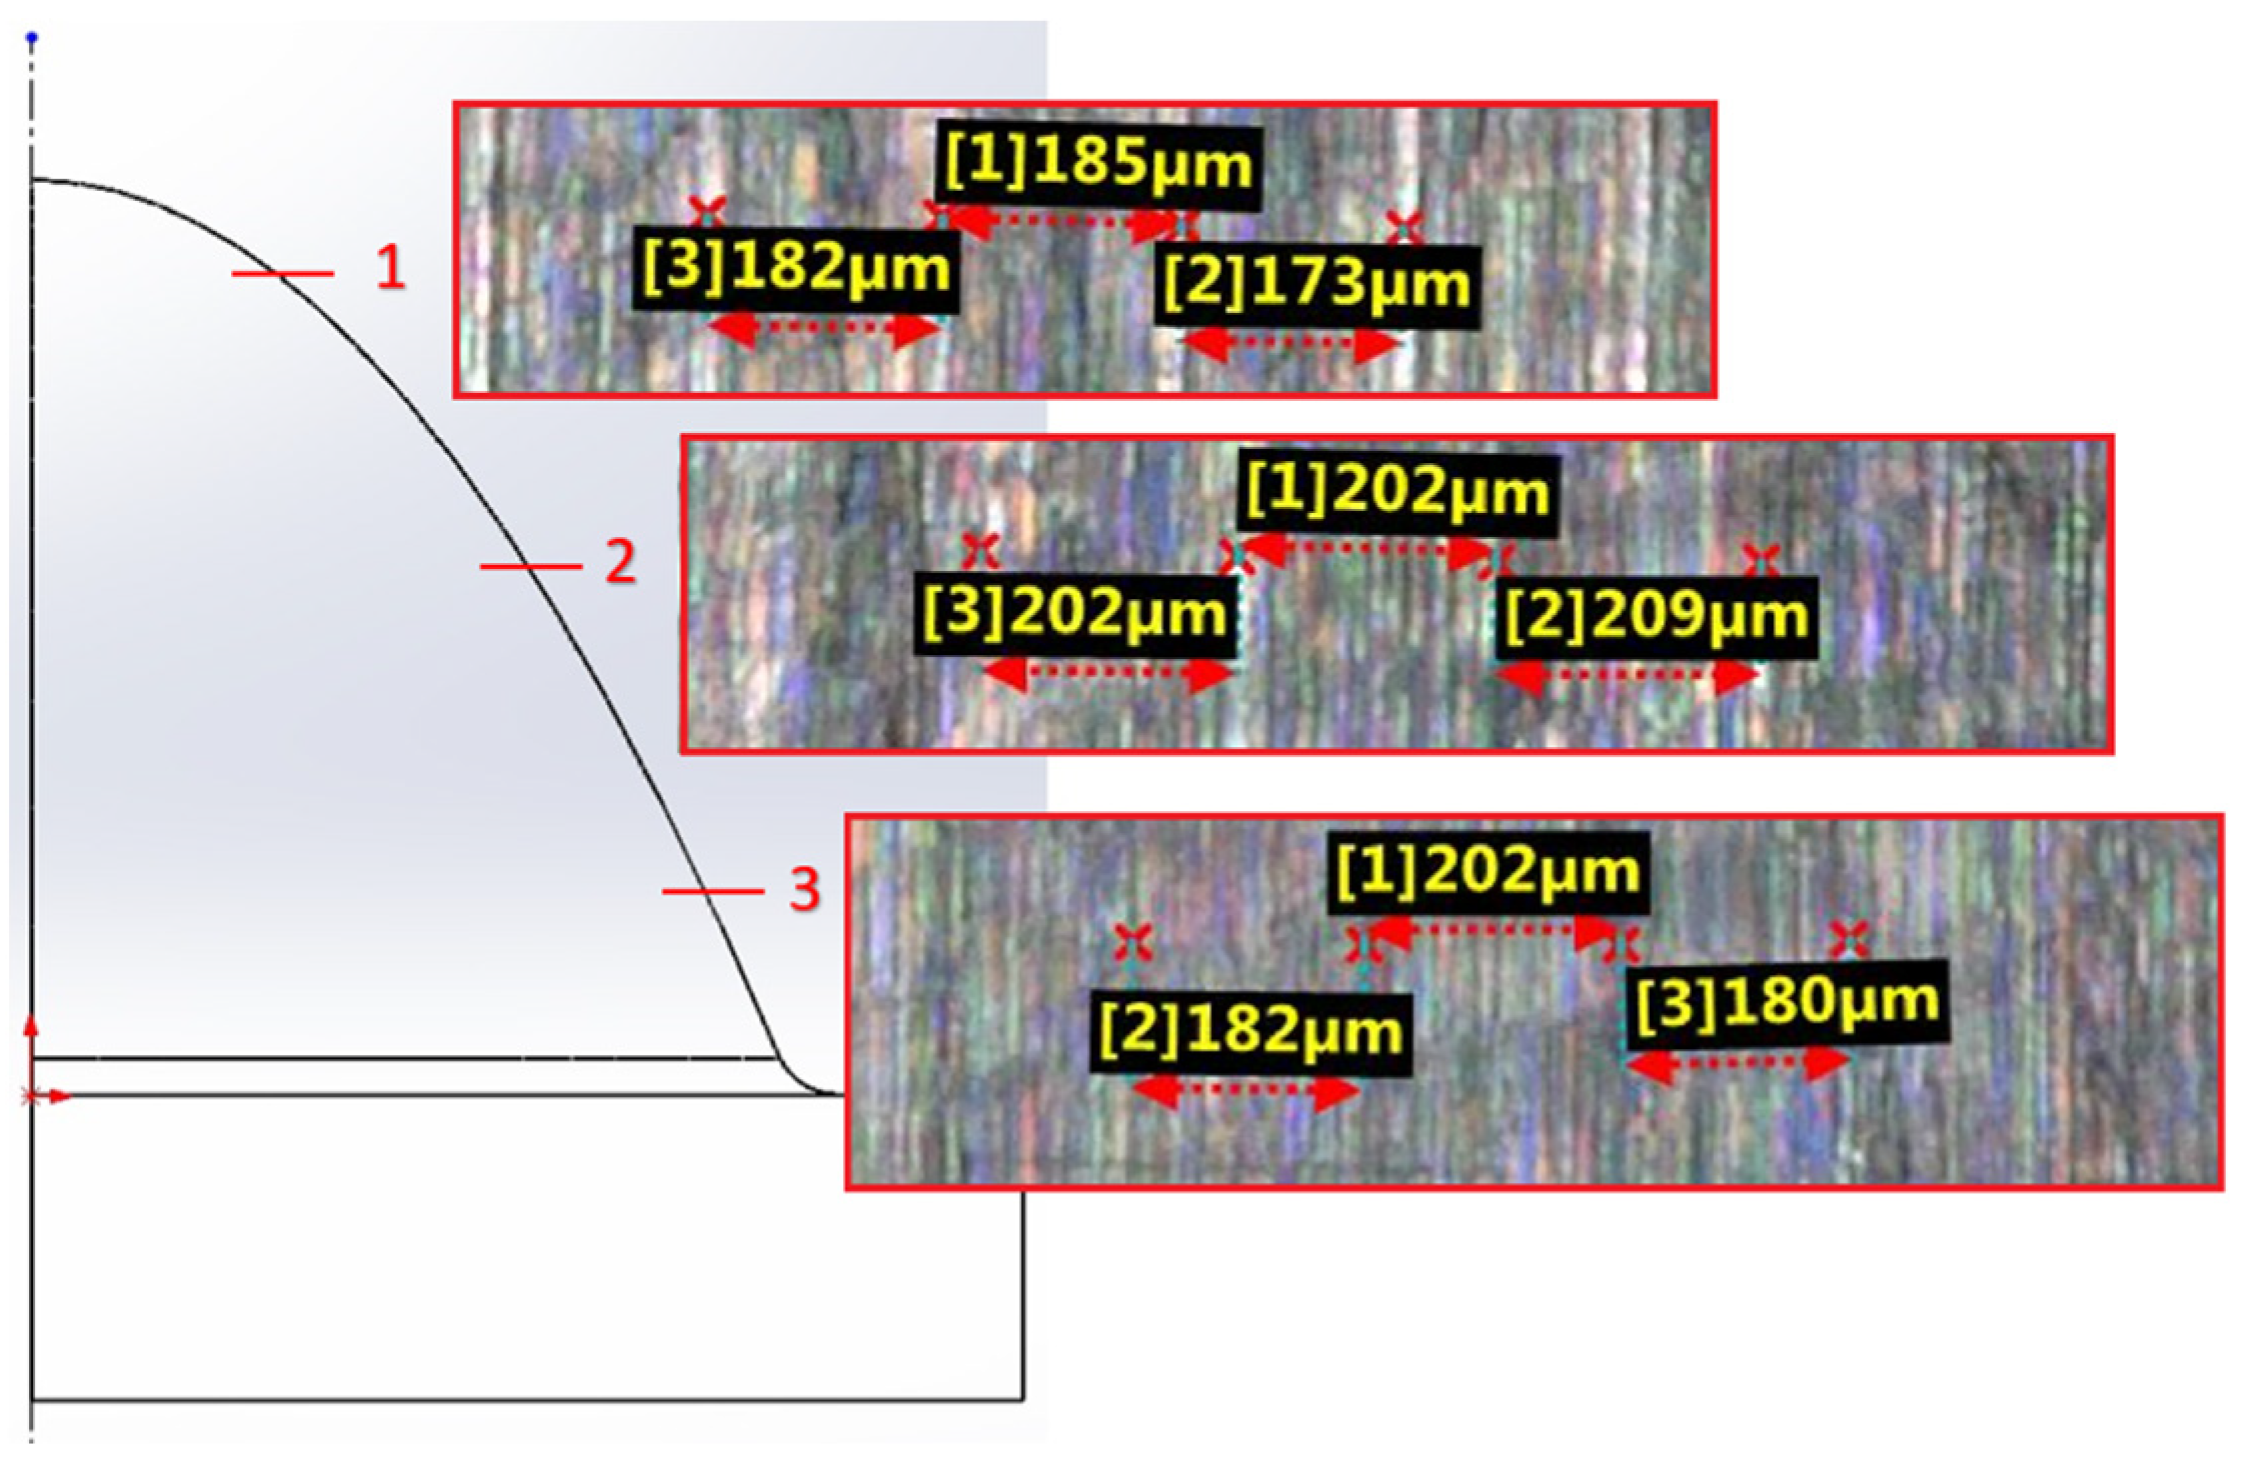
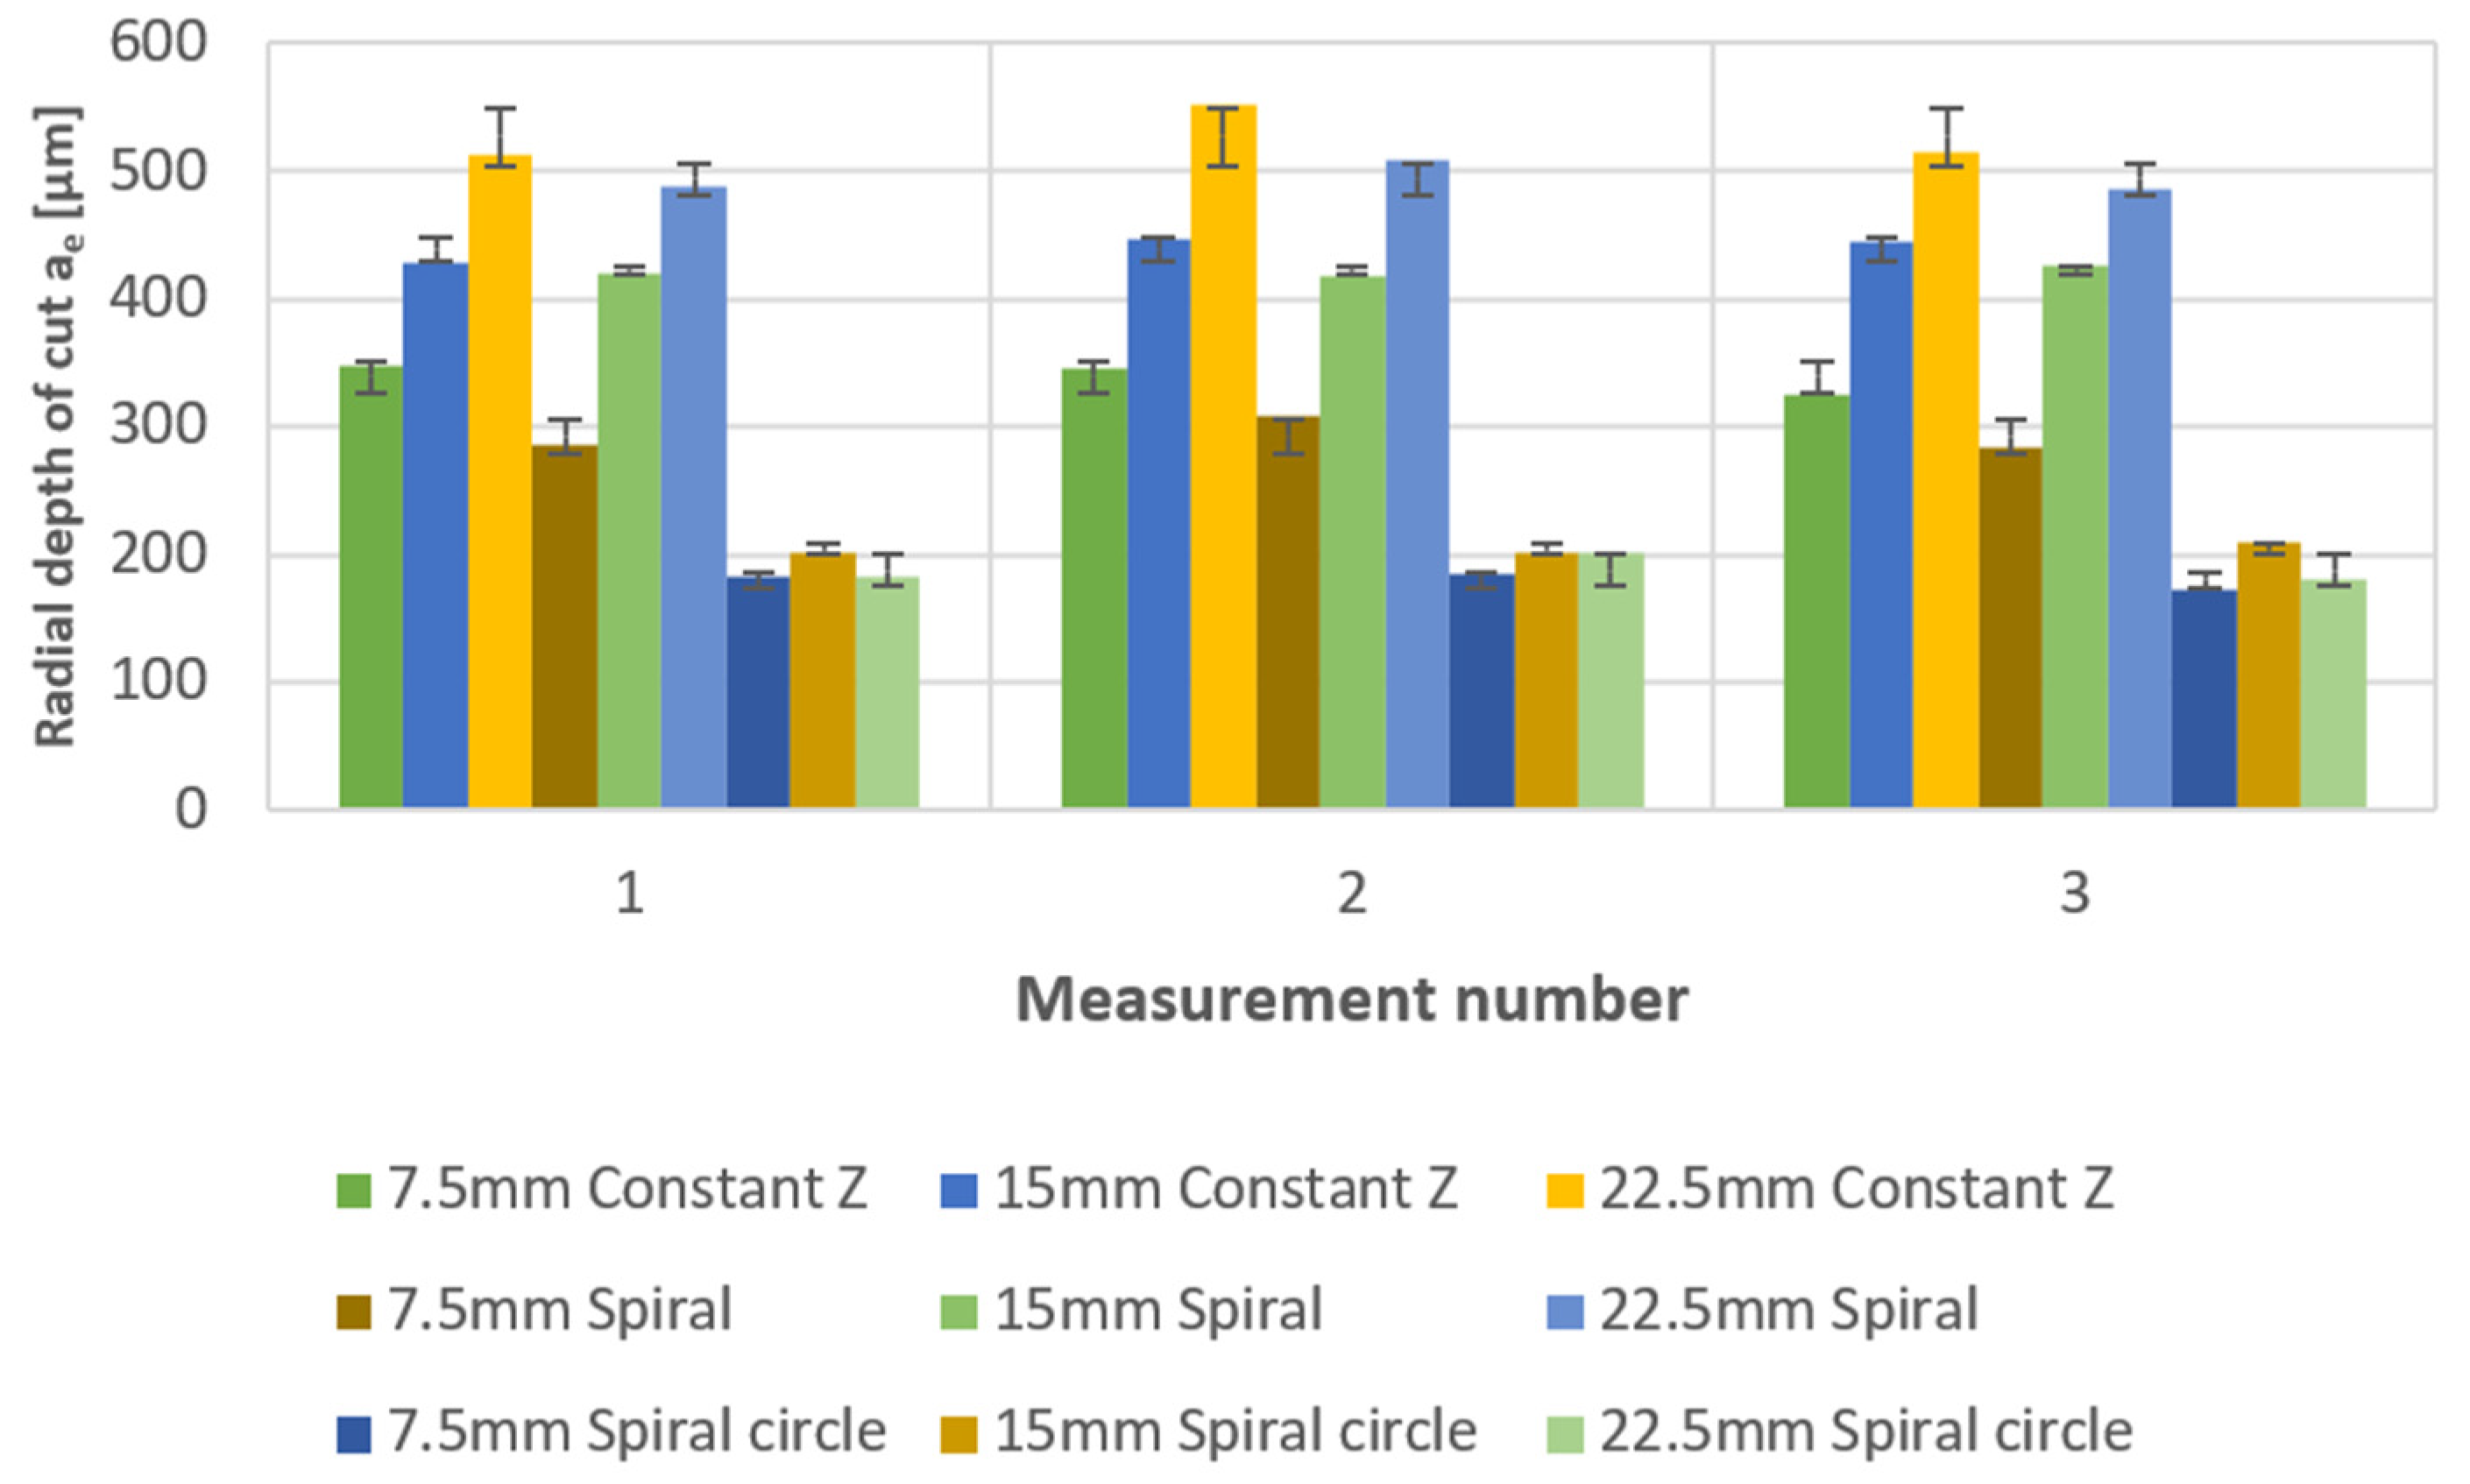
3.1. Surface Topography Evaluation

A comparison of the 3D surface topography with respect to the tool–workpiece contact points at the same height is shown in the following Figures, where the detail of the investigated surface at 7.5 mm for the Constant Z strategy is shown in Figure 10. The detail of the investigated surface at 7.5 mm for the spiral strategy is shown in Figure 11, and the last detail of the investigated surface at 7.5 mm for the spiral circle strategy is shown in Figure 12.
A comparison of the 3D surface topography with respect to the tool–workpiece contact point at 15 mm for specific strategies is shown in the following figures, where the detail of the investigated surface at 15 mm for the Constant Z strategy is shown in Figure 13. The detail of the investigated surface at 15 mm for the spiral strategy is shown in Figure 14, and the last detail of the investigated surface at 15 mm for the spiral circle strategy is shown in Figure 15. The machined surfaces of the specimens are represented by a color scale defining the contour lines. These contour lines thus give a consistent representation defining the height positioning of the tool marks. A realistic view of the machined surface element is shown in the Figure 13, Figure 14 and Figure 15 to the right.
The last comparison shows 3D surface topography with respect to the tool–workpiece contact point at the last height for specific strategies. The detail of the investigated surface at 22.5 mm for the Constant Z strategy is shown in Figure 16. The detail of the investigated surface at 22.5 mm for the spiral strategy is shown in Figure 17, and the last detail of the investigated surface at 22.5 mm for the spiral circle strategy is shown in Figure 18.
The surface topography for the Constant Z strategy is shown in Figure 19, and the surface topography for the spiral circle strategy is shown in Figure 20. In Figure 19, the toolpaths can be observed, which are arranged along the contour line and are clearly visible.
Lighter areas on the surface indicate surface defects in the form of dimples, which cause changes in the surface texture. The formation of the defects on the machined surface could have been caused by the irregular vibration of the cutting edge of the tool when using the spiral circle strategy in the cutting process. Therefore, the tool marks obtained do not achieve the ideal machined surface, which may result in a worse surface quality, as is shown in Figure 20.
At each of these heights, there was a change in the effective tool diameter with respect to the machined surface, the value of which depended on the axial depth of the cut and the curvature of the workpiece surface. Grooves separating the individual cuts during the cutting process are visible on all elements of the specimen surfaces. It can be assumed that the formation of the individual grooves was determined by the method used to grind the cutting edge of the tool. On this basis, it can be said that the grinding tool was moved in height by a step change in the setting angle. The result in the cutting process approximated a semi-spherical shape due to the number of low conical surfaces.
The specimen machined with the Constant Z strategy was the only one to present a surface free of surface defects, resulting in a regular alignment of the tool paths along the contours. For the specimens where the spiral circle strategy was used, surface defects in the form of dimples were observed at all three heights studied, compared to the spiral strategy, where the formation of dimples was only observed at the height of 22.5 mm.
As part of the evaluation, distance measurements of the radial depth parameter were made when machining in the downward direction. These were the distances from the highest point of the specimen, namely 7.5 mm, 15 mm, and 22.5 mm. A comparison of the individual radial depth of cut ae at a specific height for the Constant Z strategy is shown in Figure 21. The same comparison of the individual radial depth of cut ae at a specific height for the spiral strategy is shown in Figure 22, and the last comparison of the individual radial depth of cut ae at a specific height for the spiral circle strategy is shown in Figure 23.
From a general point of view, as the radius of curvature of the surface increases, the contact area of the tool with the workpiece increases, and consequently, the effective diameter of the tool also increases.
As depicted in Figure 21, the utilization of the Z-constant strategy validated the assumption that the effective tool diameter has a more pronounced impact on the machined area. This was affirmed by observing an increase in the radial depth of cut (ae) in the downward direction as one moves away from the highest point.
However, for the spiral (Figure 22) and spiral circle strategies (Figure 23), this assumption was not proved. The measured values of the radial depth of cut ae for 7.5 mm height are shown in Table 3, the same parameter radial depth of cut ae for 15 mm height is shown in Table 4, and the last radial depth of cut ae for 22.5 mm height is shown in Table 5.
A comparison of radial depth of cut ae at specific heights for each strategy is shown in Figure 24.

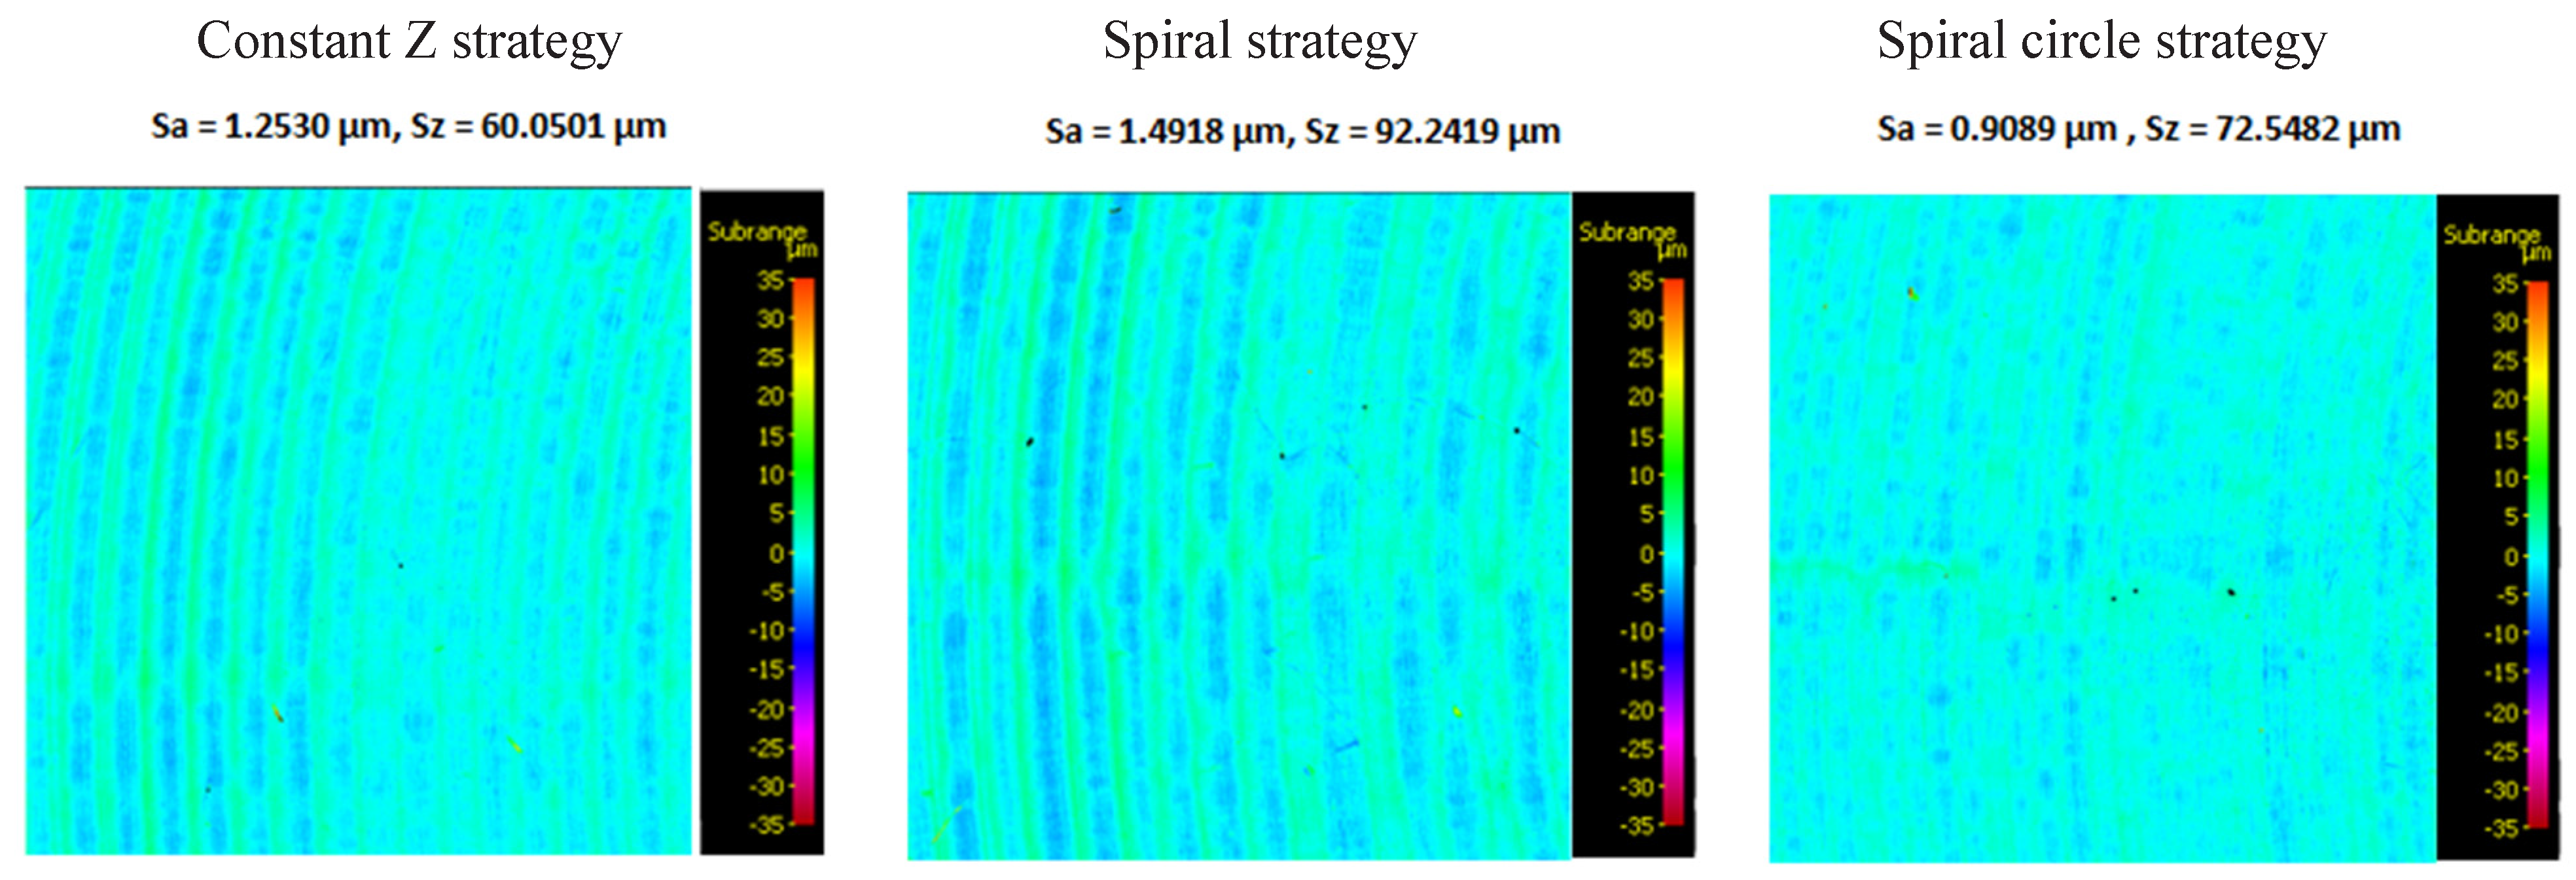
3.2. Roughness Evaluation

The comparison of surface roughness values for all three strategies at three different heights for a particular strategy is shown in the following figures. The surface roughness rating for all three strategies, with a measurement height of 7.5 mm, is presented in Figure 25. The surface roughness rating for all three strategies, measurement height of 15 mm, is shown in Figure 26, and the last surface roughness rating for all three strategies, measurement height of 22.5 mm, is shown in Figure 27.
For better visualization of the results, the measured surface roughness data is also displayed in the form of a graph, as presented in the following figures. The comparison of surface roughness Sa [µm] for different heights with respect to the strategies is shown in Figure 28, and the comparison of surface roughness Ssk [µm] for different heights with respect to the strategies is shown in Figure 29. The last comparison of surface roughness S10z [µm] for different heights with respect to the strategies is shown in Figure 30.
As shown in Figure 28, the lowest values of the surface roughness parameter Sa were obtained for the spiral circle strategy for all three heights evaluated, ranging from 0.7902 µm to 0.9089 µm. The highest values were shown for all three heights evaluated when using the spiral strategy in the range from 1.4644 µm to 1.4918 µm. Considering the surface topography, it can be concluded that this parameter decreased with possible increasing tool wear. This decreasing tendency was related to the deterioration of the surface quality and the wear of the tool, which caused “wiping” effects on the machined surface. The original single, well-visible toolpaths turned into dimples formed after the material was stripped off. Although the Sa parameter was reduced by using the spiral circle strategy, the machined surfaces showed a deterioration phenomenon due to tool wear.
For the spiral circle strategy, a negative value of Ssk = −0.0534 µm was measured (Figure 29). It can be assumed that a greater number of valleys occur in the milled area with this strategy.
In contrast, the Ssk parameters for the Constant Z and spiral strategies showed positive values for all three heights. This indicates that the milled surfaces had many peaks, and the distribution of heights was skewed below the reference plane. The slope measurement results shown indicate that the slope factor of the profile is positive for the constant Z and spiral strategies. This indicates an increase in the coefficient of friction (due to the more rounded surface roughness).
In the evaluation of the parameter S10z, the lowest values were measured using the spiral circle milling strategy for the two measured heights of 15 and 22.5 mm, as shown in Figure 30. The highest S10z values were measured with the Constant Z strategy. Average roughness values with the standard deviation are shown in Table 6. The comparison of average parameter values S10z is shown in Figure 31, and the comparison of average parameter values Ssk is described in Figure 32. Finally, the comparison of average parameter values Sa is shown in Figure 33.
The graphical representation shows that the most optimal parameter values were obtained with the Constant Z strategy, which can be applied to the shape of machined surfaces of a similar character. In the case of the Ssk parameter, the values showed a uniform characteristic over the machined surface, but for the Sa parameter, the worst values were shown for the spiral circle strategy, which reached 1.8 times lower values compared with the spiral strategy.
In terms of the statistical expression and display of standard deviations, which determine the variance of the values in the case of the roughness parameter Sa, it can be confirmed that in the case of the contact of the tool with the workpiece at a height of 7.5 mm, when a small effective diameter of the tool is used in the cutting process, there is a large variance, and in the case where the effective diameter of the tool increases in relation to the curvature of the surface, the variance decreases.
In terms of the standard deviations of the evaluation of the average roughness from the total height of the machined surface for the parameters Sa and Ssk, it is clear that the lowest variance was obtained with the Constant Z strategy. This means that for this strategy used, the standard deviation varies the least within the three measured heights compared to the spiral and spiral circle strategies. Hence, for the Constant Z strategy, the change in roughness is the smallest over the entire machined sample area.

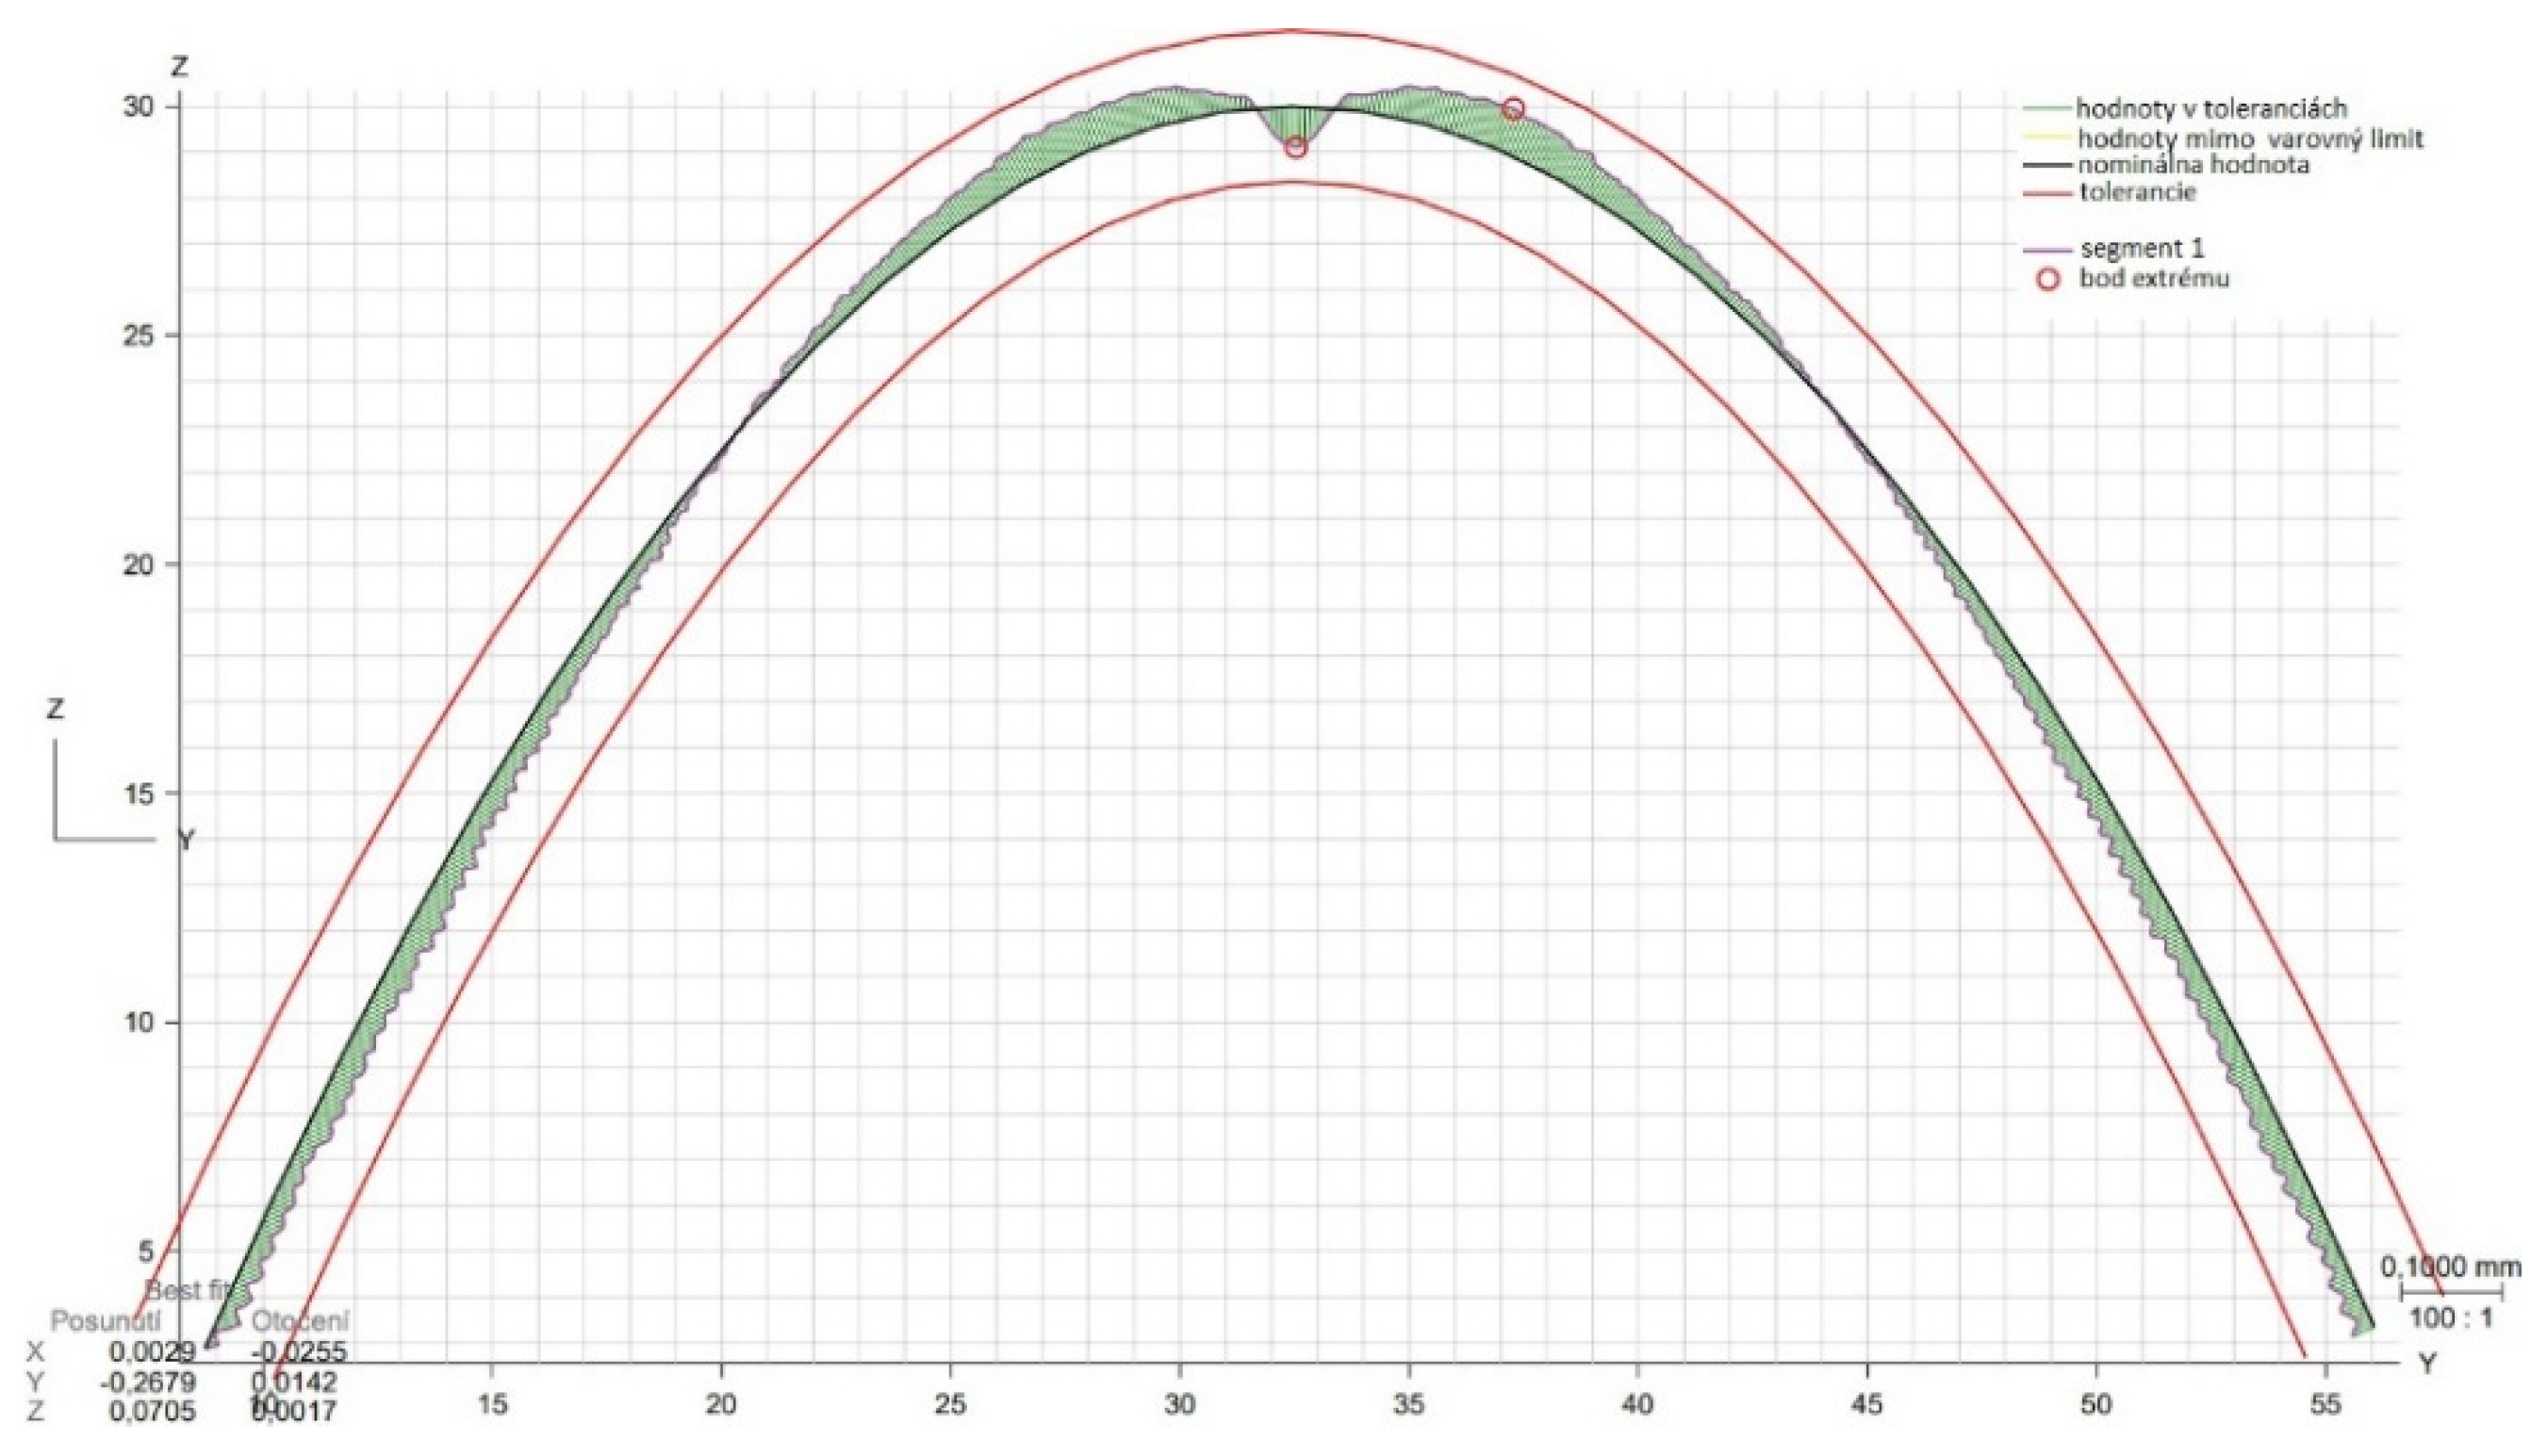
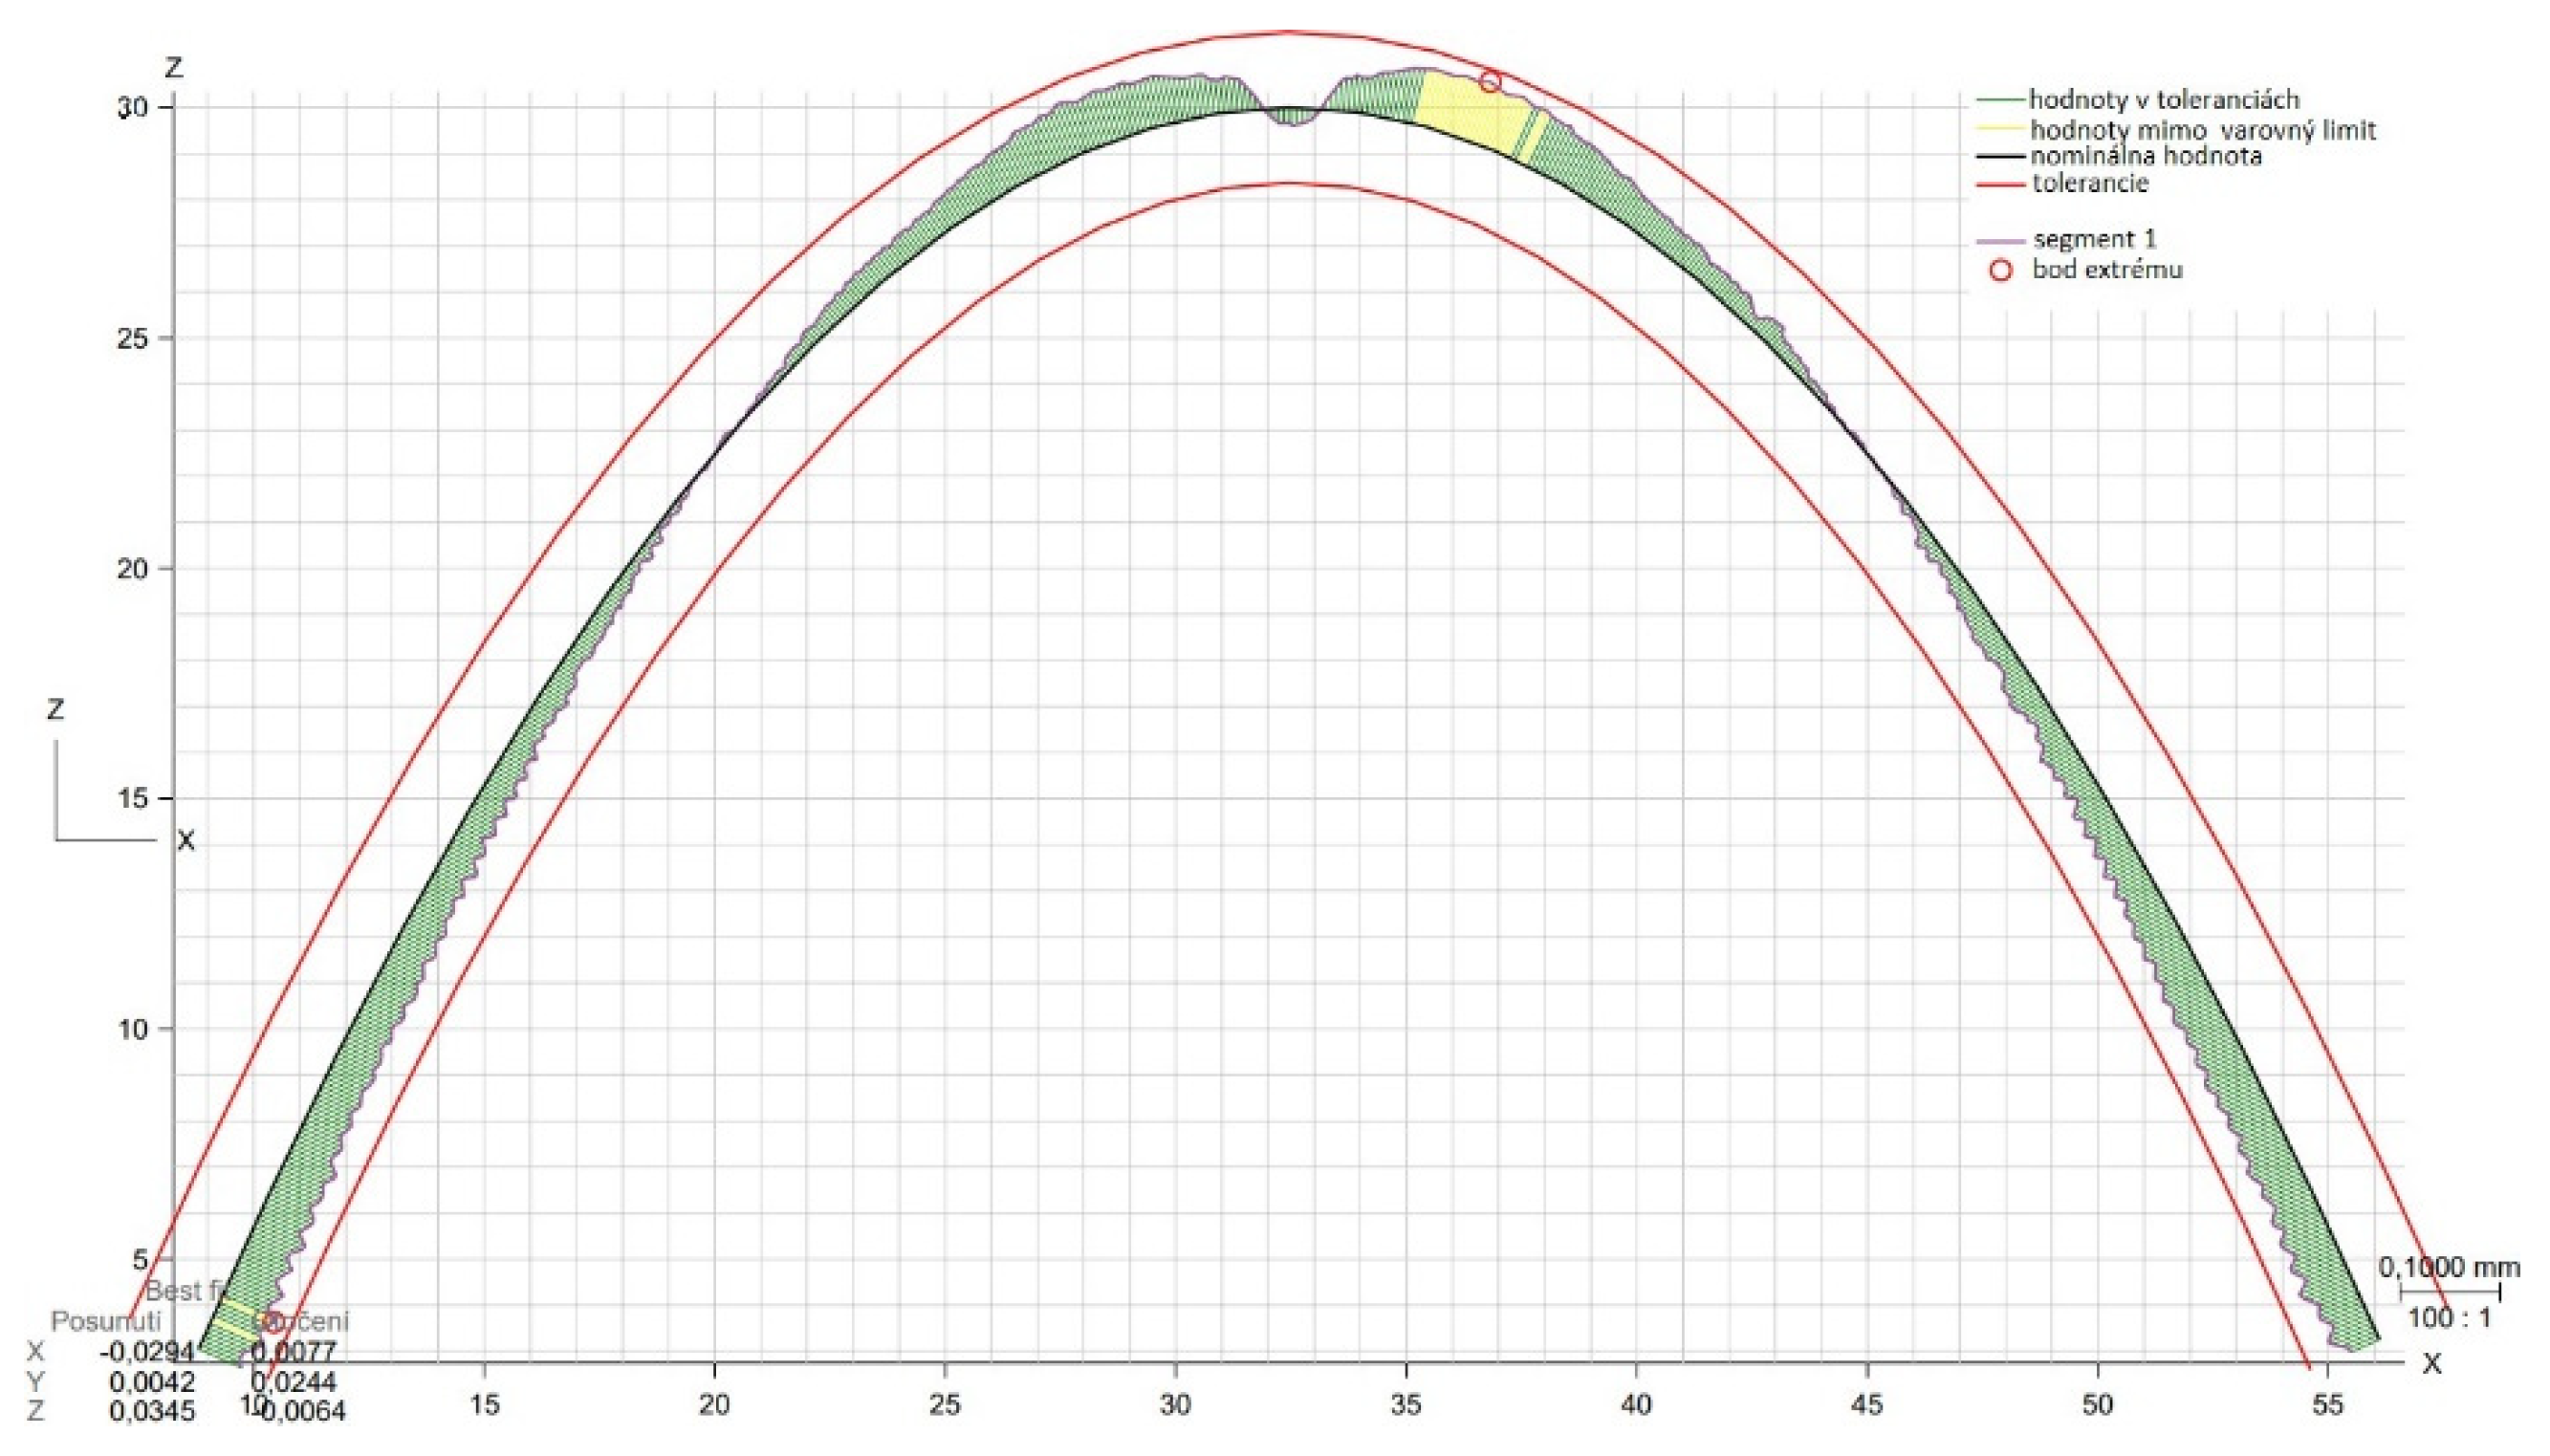
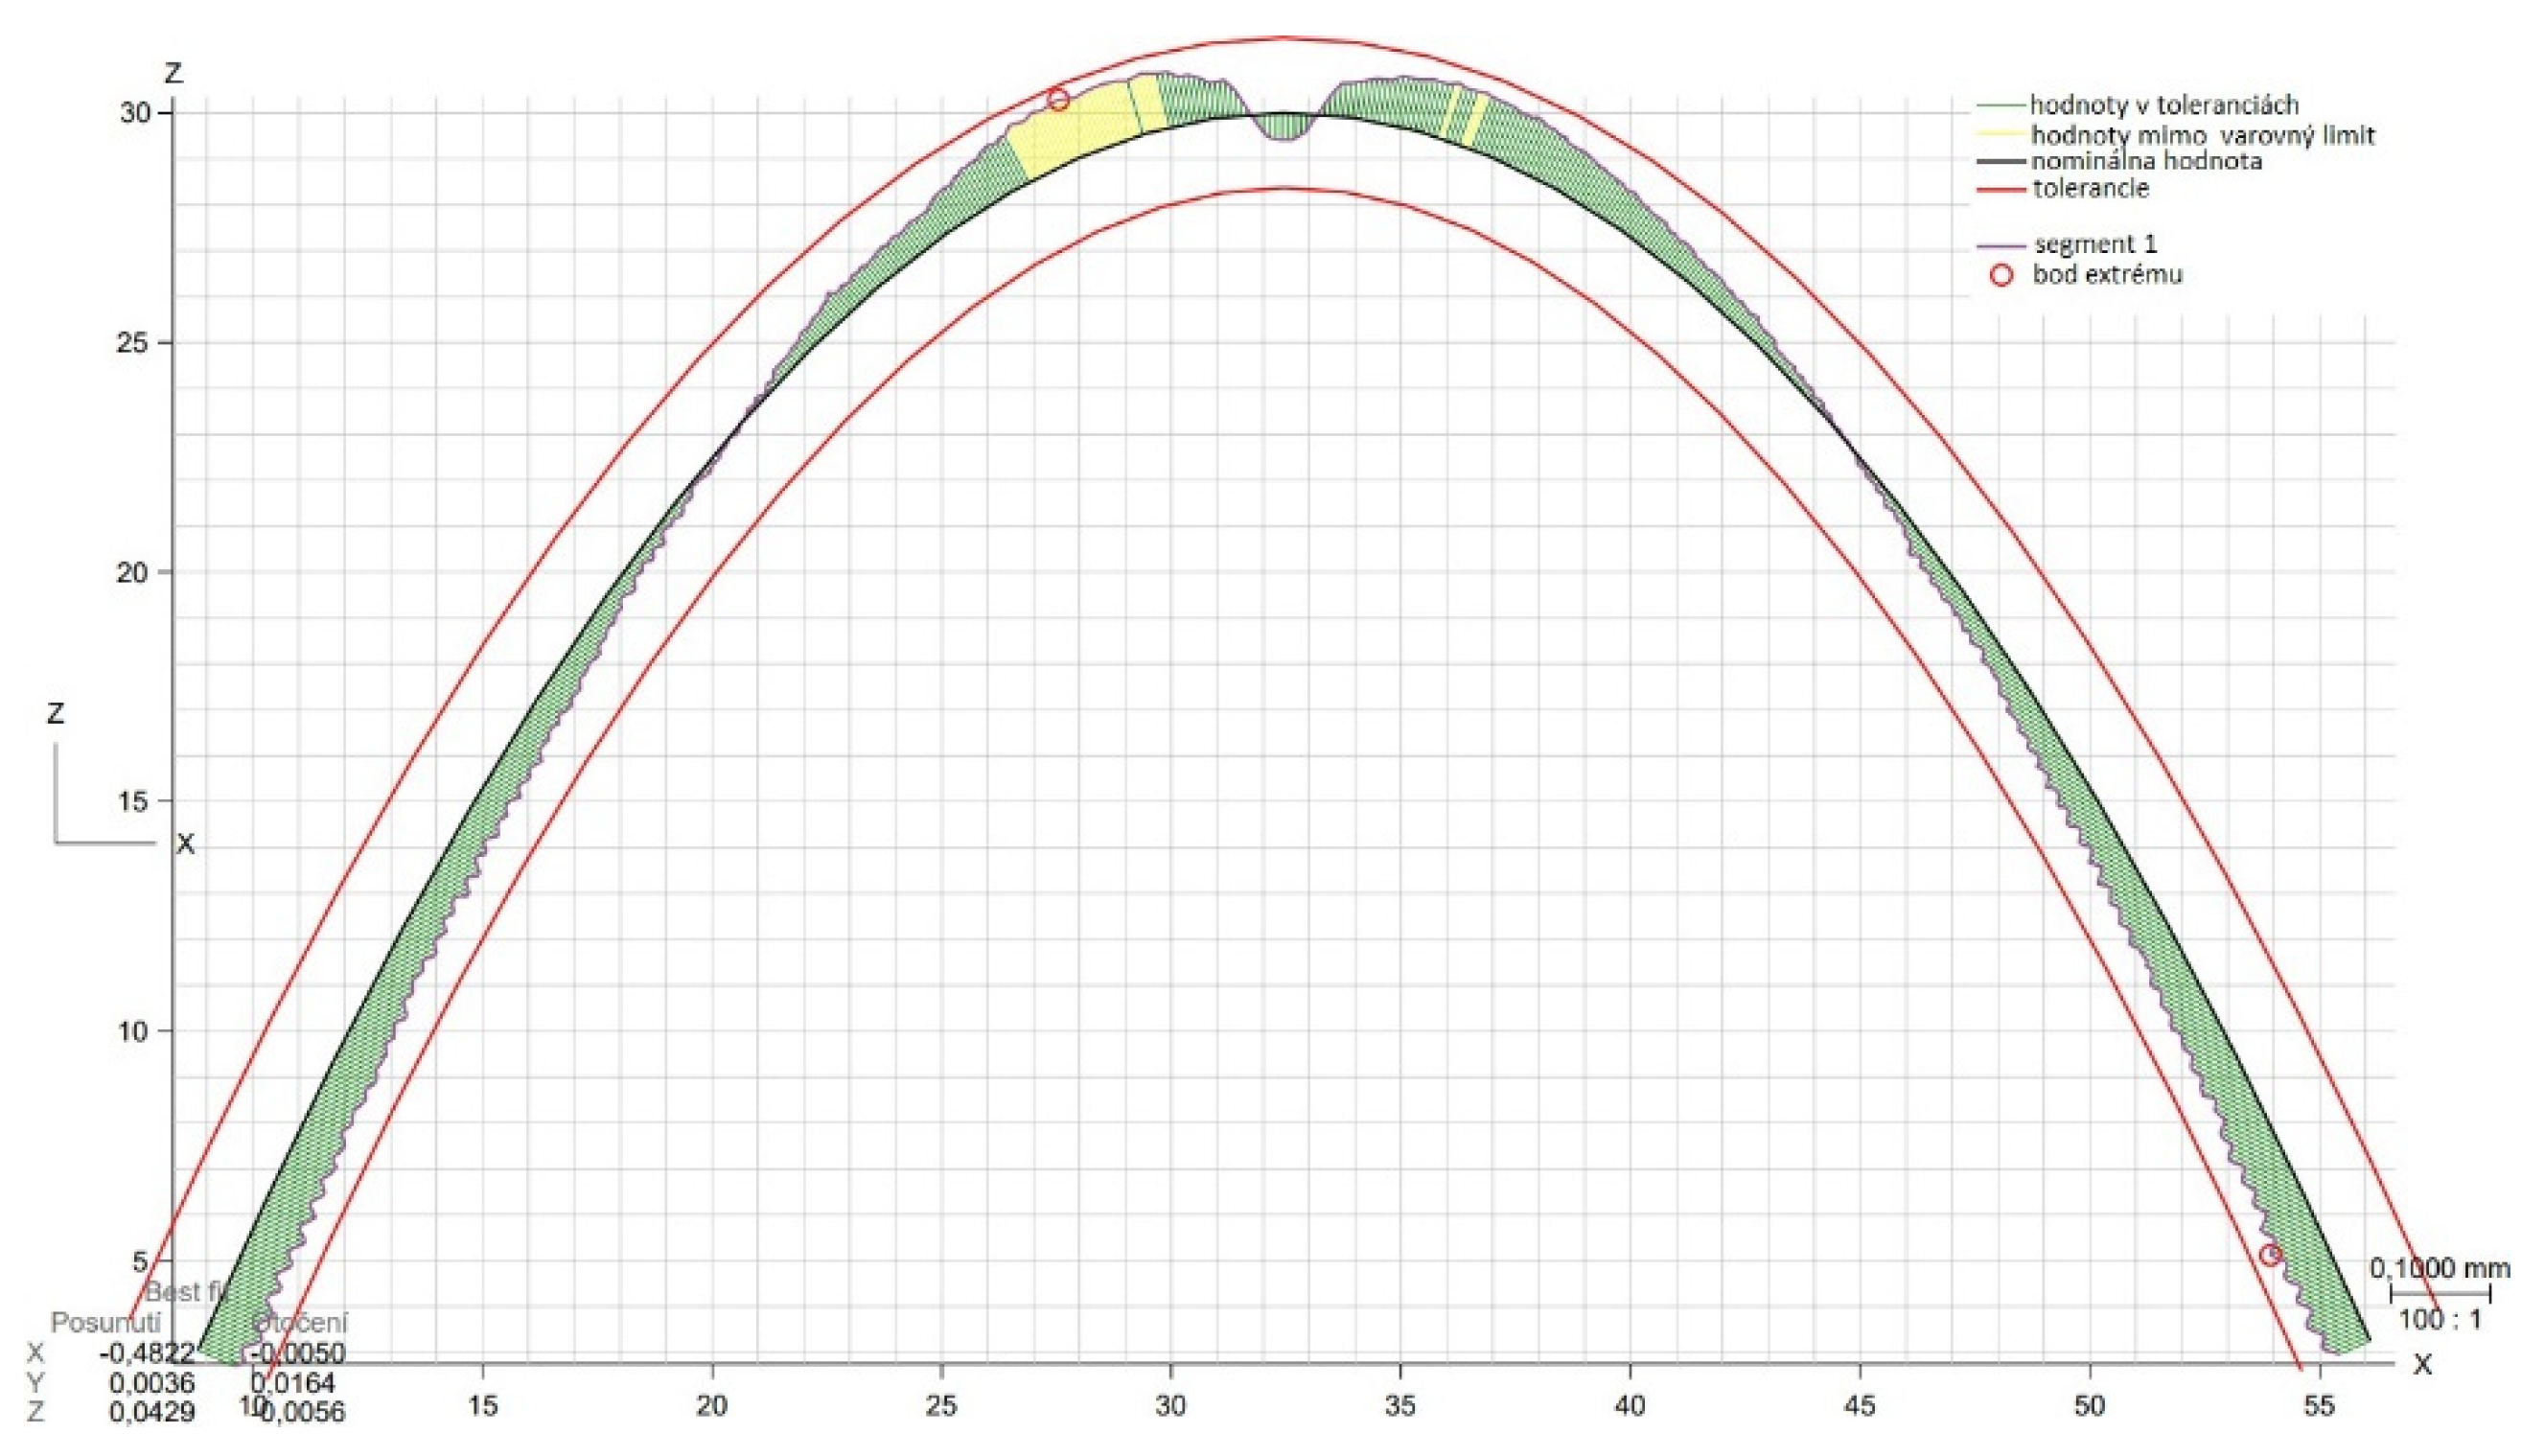
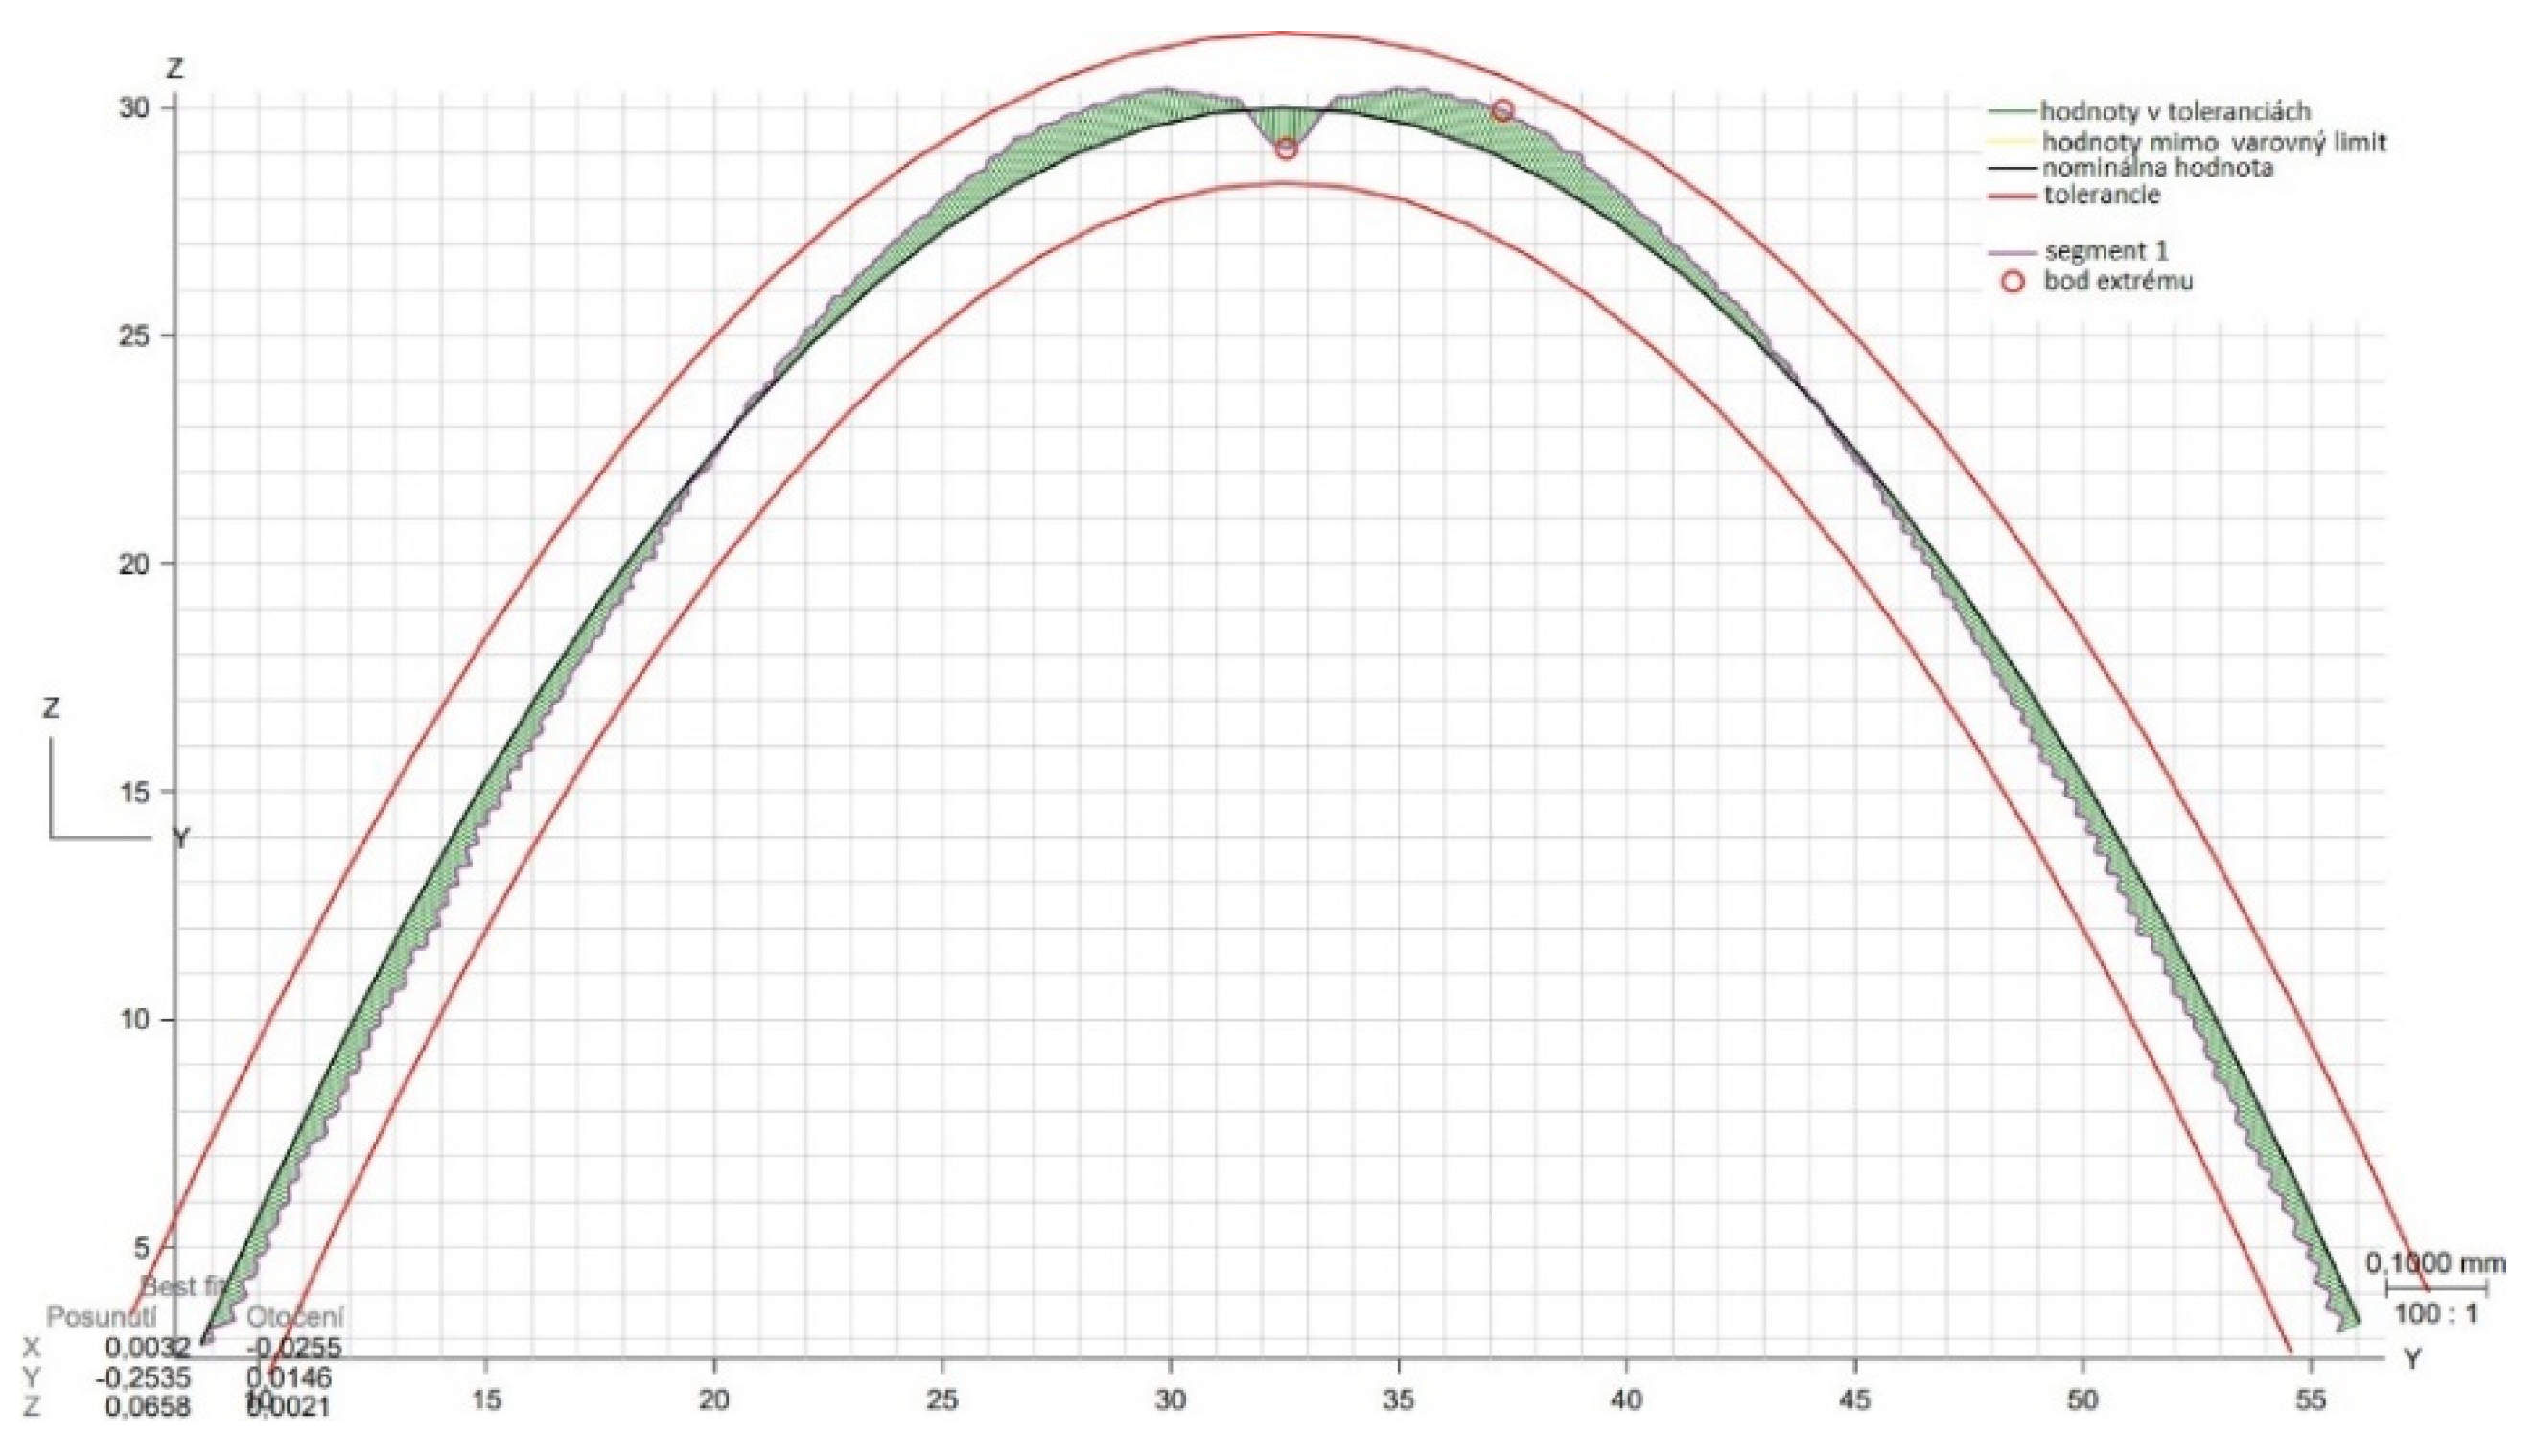
3.3. Shape Deviation Evaluation

The measured surface deviations from the ideal state are shown in Figure 34, Figure 35, Figure 36, Figure 37, Figure 38 and Figure 39. The measured deviation plot of the curve in the X–Z plane for the Constant Z strategy is shown in Figure 34, and the Y–Z plane is shown in Figure 35 for the Constant Z strategy. The measured deviation plot of the curve in the X–Z plane for the spiral strategy is shown in Figure 36, and the Y–Z plane is shown in Figure 37, also for the spiral strategy. The measured deviation plot of the curve in the X–Z plane for the spiral circle strategy is shown in Figure 38, and the Y–Z plane is shown in Figure 39, also for the spiral circle strategy. At a height of 7 mm below the top, in all cases, the positive deviation becomes negative, i.e., non-cutting becomes undercutting. The negative deviation is also present at the top of all specimens.
The obtained deviation values are also presented in the following Tables; the measured deviation values for the Constant Z strategy are shown in Table 7. The measured deviation values for the spiral strategy are shown in Table 8, and the last measured deviation values for the spiral circle strategy are shown in Table 9. Data are extended with the 3D area profile item, which achieved the largest positive deviation for the spiral strategy and the smallest for the Constant Z strategy. The largest negative deviation was for the Constant strategy Z and the spiral circle strategy, and the smallest for the spiral strategy.
Deviation comparisons of the evaluated areas for each milling strategy is shown in Figure 40.
The graph in Figure 37 compares the maximum shape deviations for all evaluated strategies.
The maximum positive and negative deviations were similar for all strategies. In the X–Z plane, the maximum positive deviations were in the range of 0.0614–0.0625 mm, and the maximum negative deviations were 0.0549–0.0580 mm. In the Y–Z plane, the range was 0.0434–0.0453 mm and 0.0411–0.044 mm. The orientation of the axes in the measurement was identical to the orientation of the axes in the milling. From the comparison of the measurements in the X–Z and Y–Z planes for all strategies, larger deviations were obtained in the X–Z plane. This fact points to a machine deviation and the need to correct the system scale factor in one of the horizontal axes.

4. Discussion

The strategies are not universal but predetermined for certain surface shapes. For surfaces with vertical walls of rotational shape, as in the case of the presented specimens, strategies with contouring in parallel planes or with radial paths are suitable. Zig-zag or raster strategies are not suitable.
The proposed approach in the experiment focused on the possibility of evaluating the surface pattern, where the contact zone between the tool and workpiece was investigated with respect to the chosen finishing machining strategy. The results of the surface roughness measurements are consistent with those published in [18,21,28,30]. Like [42], the circle strategy was the best in terms of roughness and like [28], the spiral was the worst. The evaluation of the texture of the surfaces corresponds to the findings in [33]. The results from the accuracy evaluation are like those in [39,40].
The variations in toolpaths were discernible, attributed to the impact of tool interaction in the connection between the tool and the machined surface. Better surface topography was obtained with the Constant Z strategy, which is visible and different in comparison to the spiral circle strategy. In the Constant Z strategy, the tool path was in line with the ideal machined surface and produced a uniform and periodic surface topography along the feed. This resulted in highly visible tool grooves aligned along the contours. At distances from the highest point, the radial depth of cut ae increased in a descending direction under the influence of the Constant Z strategy. When using the spiral-circle strategy, such an increase in the radial depth of cut was not confirmed. This could have been caused by the vibration of the tool in the cutting process.
In the case of the spiral circle strategy, it was possible to see an increase in the wear of the tool, which led to an increase in the number of dimples. This led to an increase in the friction between the tool and the workpiece, resulting in instability of the cutting process and the formation of defects on the surface. The cracks and dimples were caused by plastic deformation at the cutting point due to the pressure between the tool and the machined surface as the tool moved in the feed direction. Due to material extrusion and tool movement, these surfaces were plastically deformed by the blunt rounding of the cutting edges. The adhered material particles could detach and subsequently remove some part of the workpiece material and create a tear on the surface.
Among the other causes of the formation of dimples we can include:
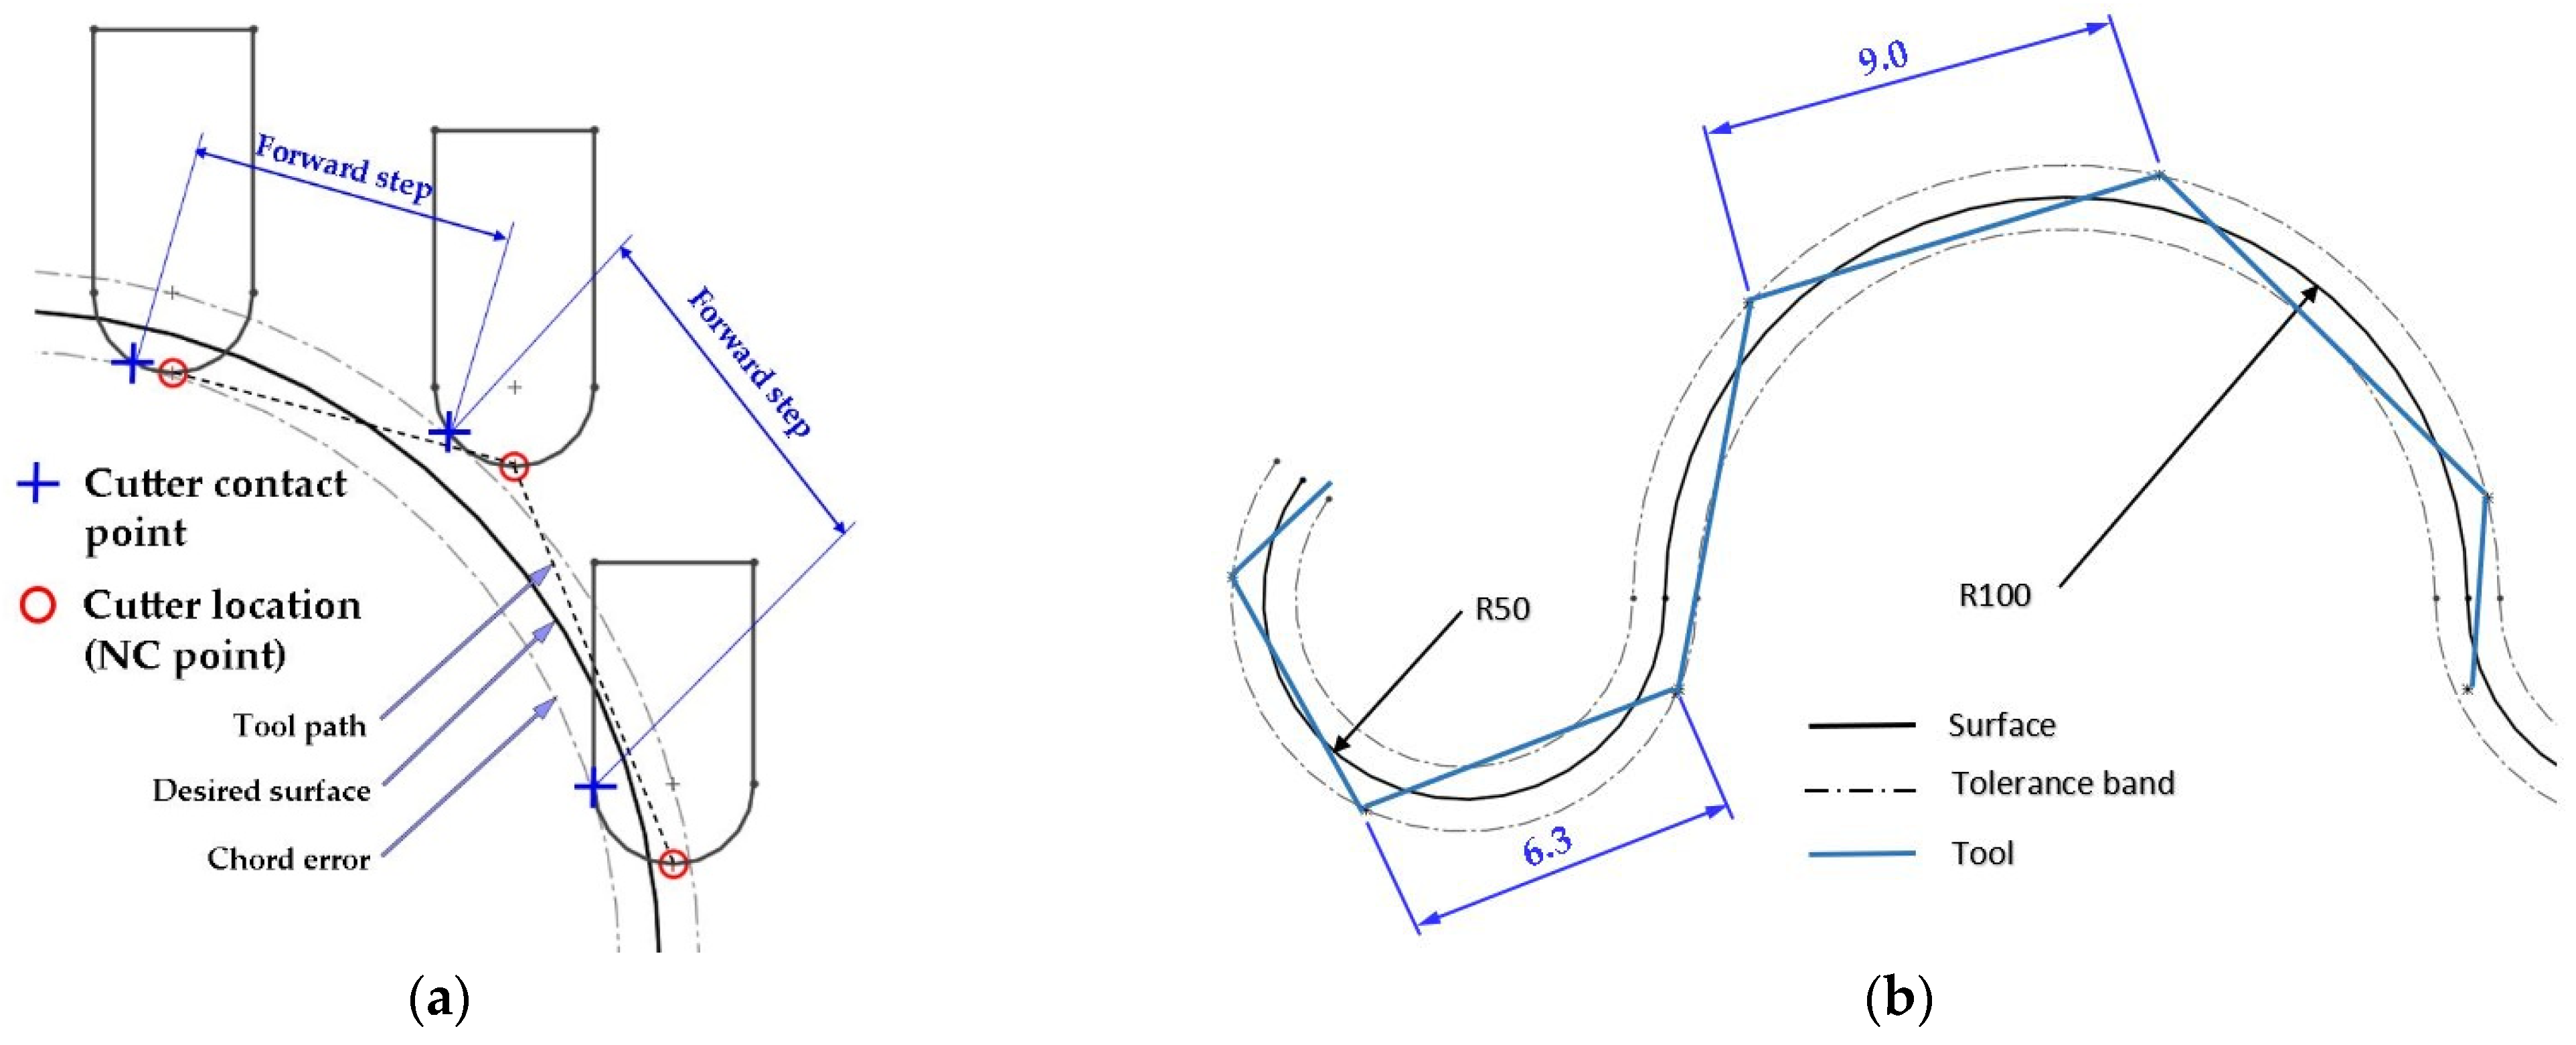
  • Dimples as the result of an inadequate control system of the CNC milling machine. The overall machining process involves a so-called cycle time, in which the control system reads the generated NC code line and then converts this data from the code line into a tool position change. Thus, in the case of creating a toolpath consisting of multiple small segments, the machine control system must recalculate a number of NC blocks in a short time. If the control system is not able to handle the calculations related to the required toolpaths and the cutting conditions in the cutting process, it will adapt to its calculation capabilities in the form of a reduced feed rate.
  • The Z-constant strategy generates toolpaths using a set of contours from surfaces that describe the shape of the surface at different levels of the Z-axis. In the spiral and spiral circle strategy, in addition to the side force of the tool against the work surface, there is also an axial force in the direction of the tool axis.
  • Insufficient sharpness of the tool. A blunt tool deforms the workpiece much more before the chip separates from the main part. This has the effect of adding cutting forces and driving the cutting edge deeper into the part as the deformation increases and then the chip suddenly breaks off, leaving a small hole. The amount of them on the surface causes the surface quality to be much lower.
  • The last reason for defects on the surface in the form of dimples may be a poor selection, or not enough coolant. The use of coolant can increase the surface quality, while insufficient cooling and lubrication leads to overheating and shorter tool life.
The evaluation of the surface roughness shows that the spiral circle strategy gives the most consistent results for the Sa parameter, while the Constant Z strategy has the highest variance. On the other hand, this strategy has the most balanced Sz parameter. The machined surface obtained by the spiral circle strategy showed regular peaks and valleys. The machined surface in micro dimensions was not smooth and presented various distinct properties. Higher degrees of surface deterioration increased significantly when using the spiral circle strategy. Surface defects on the machined surface, such as tool feed marks, grooves, plastic flows, stuck material particles, scratch marks, and cracks, were produced.
Based on the data evaluated by the ZEISS Calypso software, which is shown in Table 5, Table 6 and Table 7, it can be stated that the differences of the measured deviations were in the hundredths of a millimeter. No tolerance deviations were recorded for the Constant Z and spiral circle methods. For the spiral method, a tolerance limit was observed when scanning the 3D profile, as can be seen in Table 8 (value 0.1983). Based on the evaluation of the geometric deviations, the Constant Z and spiral circle methods can be classified as suitable and the spiral method as not suitable.

5. Conclusions

The research aimed to present the effect of finishing strategy on surface topography, surface roughness, and variations in machining curved surfaces. The choice of the specimen shape was based on the wide occurrence of such surface areas in the machining of injection molds and other shape tools where it is necessary to achieve the required quality and accuracy of production with respect to the future shape of the product. Three strategies were evaluated—Constant Z, spiral, and spiral circle, whose paths were programmed in the CAM system SolidCAM. The material used for the experiments was the aluminum alloy AlCu4Mg. The evaluation of surface topography and surface roughness was carried out at three different specimen locations selected to significantly change the effective diameter of the tool on which the tool comes into contact with the machined surface. The results showed changes in the monitored parameters due to a change in the effective diameter of the cutting tool as well as the influence of the strategy used. To produce specimens with corresponding shapes in terms of topography, the Constant Z strategy is the most suitable, in which uniform tool paths were achieved over the whole height of the specimen.
From the experiments carried out, the spiral with discontinuous circle-shaped toolpaths appears to be the most advantageous strategy. Due to the large variation of conditions when machining 3D surfaces, it should be noted that changing the conditions can cause a change in the results. Machining 3D surfaces is a very specific matter with many influencing factors. Only the gradual discovery of the regularities of this process leads to knowledge on the basis of which generally valid conclusions can be formulated. The conclusions presented added to the already-known findings and are helpful for technologists/CNC programmers when planning the technology for the production of similar surfaces.
One limitation of the study was the sample size used in the experiment. Since larger dimensions are experienced in the machining of molds and some shaped surfaces, this paper offers only a part of the further research that needs to be conducted to better understand any impact on the machining of these shapes.
The following outlines are offered for further study in this area:
  • Shape surface decomposition focused on a deeper understanding of the influence of milling strategies on surface topography.
  • To compare the machining efficiency when using three-axis and five-axis machining due to changing tool–workpiece contact, resulting in a change in effective tool diameter. This should show better surface properties not only in the case of topography but also in the case of roughness parameters or surface deviations.
  • In the case of five-axis machining, there is an opportunity to investigate the effectiveness of the tilt angle of the tool and thus specify the ideal angle for machining shaped surfaces in five-axis machining with respect to the dimensional and shape accuracy of the part.
  • One further possibility of the study is to change the milling method and use ascending instead of descending milling.
  • Similarly, a topic for further study could be to compare the effectiveness of the overhang length of the tool in the cutting process when machining shaped surfaces, where tool stiffness, cutting forces, and, therefore, tool deflection in contact with the workpiece would be evaluated.
  • Another study could analyze the type of chuck on the precision of production because, in practice, different types are used due to the shape and precision of the part we want to achieve.
  • Comparing conventional strategies with milling strategies known as HSM (High-Speed Machining) is also of importance in the field of mold and surface forming.

Author Contributions

Conceptualization, J.V.; methodology, J.V., P.I. and M.D.; validation, J.V. and M.D.; formal analysis, J.V. and Ľ.K.; investigation, J.V.; resources, J.V.; writing—original draft preparation, J.V.; writing—review and editing, J.V. and Ľ.K.; visualization, J.V.; J.B. and Ľ.K.; supervision, Ľ.K.; project administration, P.I. and M.V.; funding acquisition, M.V. All authors have read and agreed to the published version of the manuscript.

Funding

This research was funded by The Ministry of Education, Science, Research and Sport of the Slovak Republic, grant number VEGA 1/0457/21, VEGA 1/0384/20, KEGA 036TUKE-4/2021.

Data Availability Statement

The research data can be obtained from the authors.

Conflicts of Interest

The authors declare no conflict of interest. The funders had no role in the design of the study; in the collection, analyses, or interpretation of data; in the writing of the manuscript, or in the decision to publish the results.

Nomenclature

CNCcomputer numerical control
NCnumerical control
CAMcomputer-aided manufacturing
CLcutter location
CADcomputer-aided design
HBhardness Brinell
Ddiameter of milling tool
RPMrevolutions per minute
aeradial depth of cut
apdepths of cut for given strategies
fzfeed per tooth
Eff rad maxmaximum effective radius
Eff rad minminimum effective radius
Ffeed
Ttolerance
Psurface allowance
ISOInternational Organization for Standardization
S10zTen-point height of surface
SaArithmetical mean height
SskSkewness
Lccutoff
µmmicrometer
vccutting speed

References

  1. Toh, C.K. A study of the effects of cutter path strategies and orientations in milling. J. Mater. Process. Technol. 2004, 152, 346–356. [Google Scholar] [CrossRef]
  2. Daymi, A.; Boujelbene, M.; Linares, J.M.; Bayraktar, E.; Amara, A.B. Influence of workpiece inclination angle on the surface roughness in ball end milling of the titanium alloy Ti-6Al- 4V. J. Achiev. Mater. Manuf. Eng. 2009, 35, 79–86. [Google Scholar]
  3. Václav, Š.; Mareš, A.; Legutko, S.; Košťál, P.; Delgado Sobrino, D.R. Proposal of a system for estimating the assembly time in small and medium-sized enterprises. Tech. Gaz. 2020, 27, 2089–2096. [Google Scholar] [CrossRef]
  4. Razavykia, A.; Iranmanesh, S.; Esmaeilzadeh, A. The Effect of Tool Path Strategy on Surface and Dimension in High-Speed Milling. Int. J. Mech. Aerosp. Ind. Mechatron. Manuf. Eng. 2017, 35, 1475–1479. [Google Scholar]
  5. Varga, J.; Spišák, E.; Gajdoš, I.; Mulidrán, P. Comparison of milling strategies in the production of shaped surfaces. Adv. Sci. Technol. Res. J. 2022, 16, 267–274. [Google Scholar] [CrossRef]
  6. Grešová, Z.; Ižol, P.; Vrabeľ, M.; Kaščák, Ľ.; Brindza, J.; Demko, M. Influence of ball-end milling strategy on the accuracy and roughness of free form surfaces. Appl. Sci. 2022, 12, 4421. [Google Scholar] [CrossRef]
  7. Boujelbene, M.; Moisan, A.; Tounsi, N.; Brenier, B. Productivity enhancement in dies and molds manufacturing by the use of C1 continuous tool path. Int. J. Mach. Tools Manuf. 2004, 44, 101–107. [Google Scholar] [CrossRef]
  8. Ramos, A.M.; Relvas, C.; Simoes, J.A. The influence of finishing milling strategies on texture, roughness and dimensional deviations on the machining of complex surfaces. J. Mater. Process. Technol. 2003, 136, 209–216. [Google Scholar] [CrossRef]
  9. Suresh, B.V.; Raviswaran, N. Tool path generation algorithm and 3D tolerance analysis for free-form surfaces. Ethiop. J. Sci. Technol. 2006, 4, 23–30. [Google Scholar]
  10. Misra, D.; Sundararajan, V.; Wright, P. K: Zig-zag tool path generation for sculptured surface. Geom. Algorithmic Asp. Comput.-Aided Des. Manuf. 2003, 67, 265–280. [Google Scholar] [CrossRef]
  11. Toh, C.K. Surface topography analysis in high speed finish milling inclined hardened steel. Precis. Eng. 2004, 28, 386–398. [Google Scholar] [CrossRef]
  12. Ižol, P.; Brindza, J.; Vrabeľ, M.; Demko, M.; Basilio, S.E. Effect of optimization software on part shape accuracy and production times during rough milling of aluminum alloy. Machines 2022, 10, 1212. [Google Scholar] [CrossRef]
  13. Asilturk, I.; Akkus, H. Determining the effect of cutting parameters on surface roughness in hard turning using the Taguchi method. Measurement 2011, 44, 1697–1704. [Google Scholar] [CrossRef]
  14. Varga, J.; Tóth, T.; Kaščák, Ľ.; Spišák, E. The effect of the machining strategy on the surface accuracy when milling with a ball end cutting tool of the aluminum alloy AlCu4Mg. Appl. Sci. 2022, 12, 638. [Google Scholar] [CrossRef]
  15. Chiang, S.; Tsai, C.; Lee, A. Analysis of cutting forces in ball end milling. J. Mater. Process. Technol. 1995, 47, 231–249. [Google Scholar] [CrossRef]
  16. Varga, J.; Tóth, T.; Frankovský, P.; Dulebová, Ľ.; Spišák, E.; Zajačko, I.; Živčák, J. The influence of automated machining strategy on geometric deviations of machined surfaces. Appl. Sci. 2021, 11, 2353. [Google Scholar] [CrossRef]
  17. De Souza, A.F.; Bodziak, S. Advanced Free Form Manufacturing by Computer Aided Systems-Cax, 1st ed.; INTECH Open Access Publisher: Rijeka, Croatia, 2012; pp. 555–586. [Google Scholar]
  18. Boujelbene, M.; Moisan, A.; Torbaty, S. Study of the tool inclination in multi-axes milling. In Proceedings of the 15th International Conference on Manufacturing Systems-ICMaS, Bucharest, Romania, 26–27 October 2006. [Google Scholar]
  19. Ozturk, E.; Tunc, L.T.; Budak, E. Investigation of lead and tilt angle effects in 5-axis ball-end milling processes. Int. J. Mach. Tools Manuf. 2009, 49, 1053–1062. [Google Scholar] [CrossRef]
  20. Scandiffio, I.; Diniz, A.E.; Souza, A.F. Evaluating surface roughness, tool life, and machining force when milling free-form shapes on hardened AISI D6 steel. Int. J. Adv. Manuf. Technol. 2015, 82, 1–13. [Google Scholar] [CrossRef]
  21. Souza, A.F.; Berkenbrock, E.; Rodriguez, A.R.; Diniz, A.E. Influences of the tool path strategy on the machining force when milling free form geometries with a ball-end cutting tool. J. Braz. Soc. Mech. Sci. Eng. 2014, 37, 675–687. [Google Scholar] [CrossRef]
  22. Bissacco, G.; Hansen, H.N.; Chiffre, L. Size effect on surface generation in micromilling of hardened tool steel. CIRP Ann.-Manuf. Technol. 2006, 555, 593–596. [Google Scholar] [CrossRef]
  23. Ducobu, F.; Filippi, E.; Rivière, L.E. Chip formation and minimum chip thickness in micro-milling. In Proceedings of the 12th CIRP Conference on Modeling of Machining Operations, Donostia-San Sebastián, Spain, 9−14 September 2009. [Google Scholar]
  24. Tuysuz, O.; Altintas, Y.; Feng, H.Y. Prediction of cutting forces in three and five-axis ball-end milling with tool indentation effect. Int. J. Mach. Tools Manuf. 2013, 66, 66–81. [Google Scholar] [CrossRef]
  25. Liu, N.; Loftus, M.; Whitten, A. Surface finish visualization in high speed, ball nose milling applications. Int. J. Mach. Tools Manuf. 2005, 45, 1152–1161. [Google Scholar] [CrossRef]
  26. Aspinwall, D.K.; Dewes, R.C.; Ng, E.G.; Sage, C. The influence of cutter orientation and workpiece angle on machinability when high-speed milling Inconel 718 under finishing conditions. Int. J. Mach. Tools Manuf. 2007, 47, 1839–1846. [Google Scholar] [CrossRef]
  27. Wojciechowski, S.; Wiackiewicz, G.M.; Krolczyk, G.M. Study on metrological relations between instant tool displacements and surface roughness during precise ball end milling. Measurement 2018, 129, 686–694. [Google Scholar] [CrossRef]
  28. Shaghayegh, S.; Sadeghi, M.H.; Hassanpour, H. The Influence of Tool Path Strategies on Cutting Force and Surface Texture during Ball End Milling of Low Curvature Convex Surfaces. Sci. World J. 2014, 2014, 1–14. [Google Scholar] [CrossRef]
  29. Käsemodel, R.B.; Souza, A.F.; Voigt, R.; Basso, I.; Rodrigues, A.R. CAD/CAM interfaced algorithm reduces cutting force, roughness, and machining time in free-form milling. Int. J. Adv. Manuf. Technol. 2020, 107, 1883–1900. [Google Scholar] [CrossRef]
  30. Souza, A.F.; Diniz, A.E.; Rodrigues, A.R.; Coelho, R.T. Investigating the cutting phenomena in free-form milling using a ball-end cutting tool for die and mold manufacturing. Int. J. Adv. Manuf. Technol. 2014, 71, 1565–1577. [Google Scholar] [CrossRef]
  31. Kose, E.; Kurt, A.; Şeker, U. The Effects of the Feed Rate on the Cutting Tool Stresses in Machining of Inconel 718. J. Mater. Process. Technol. 2008, 231, 165–173. [Google Scholar] [CrossRef]
  32. Schulz, H.; Hock, S. High-Speed Milling of Dies and Moulds-Cutting Conditions and Technology. J. Mater. Process. Technol. 1995, 44, 35–38. [Google Scholar] [CrossRef]
  33. Cai, Y.; Zhangiang, L.; Shi, Z.; Song, Q. Optimum end milling tool path and machining parameters for micro Laval nozzle manufacturing. Proc. Inst. Mech. Eng. Part B J. Eng. Manuf. 2015, 231, 1–11. [Google Scholar] [CrossRef]
  34. Antoniadis, A.; Bilalis, N.; Balouktsis, A.; Savakis, C. Prediction of Surface Topomorphy and Roughness in Ball-End Milling. Int. J. Adv. Manuf. Technol. 2003, 21, 965–971. [Google Scholar] [CrossRef]
  35. Šimunović, G.; Šimunović, K.; Šarić, T. Modelling and simulation of surface roughness in face milling. Int. J. Simul. Model. 2013, 12, 141–153. [Google Scholar] [CrossRef]
  36. Vukelic, D.; Tadic, B.; Miljanic, D. Novel workpiece clamping method for increased machining performance. Teh. Vjesn.-Tech. Gaz. 2012, 19, 837–846. [Google Scholar]
  37. Antic, A.; Kozak, D.; Kosec, B.; Šimunović, G.; Šarić, T.; Kovačevič, D.; Čep, R. The influence of tool wear on the chip-forming mechanism and tool vibrations. Teh. Vjesn.-Tech. Gaz. 2013, 20, 105–112. [Google Scholar]
  38. Toh, C.K. Design, evaluation, and optimization of cutter path strategies when high speed milling hardened mold and die materials. Mater. Des. 2005, 26, 517–533. [Google Scholar] [CrossRef]
  39. Abuelnaga, A.M.; Dardiry, M.A. Optimization methods for metal cutting. Int. J. Mach. Tool Des. Res. 1997, 24, 11–18. [Google Scholar] [CrossRef]
  40. White, B.; Houshyar, A. Quality and optimum parameter selection in metal cutting. Comput. Ind. 1992, 20, 87–98. [Google Scholar] [CrossRef]
  41. Ikua, B.W.; Tanaka, H.; Obata, F.; Sakamoto, S.; Kishi, T.; Ishii, T. Prediction of cutting forces and machining error in ball end milling of curved surfaces—II experimental verification. Precis. Eng. 2002, 26, 69–82. [Google Scholar] [CrossRef]
  42. Matras, A.; Kowalczyk, R. Analysis of machining accuracy during free form surface milling simulation for different milling strategies. Proc. SPIE-Int. Soc. Opt. Eng. 2014, 9290, 1–7. [Google Scholar] [CrossRef]
  43. Hao, X.; Yue, C.; Liu, X.; Wang, L. Modeling of Convex Surface Topography in Milling Process. Met. -Open Access Metall. J. 2020, 10, 1218. [Google Scholar] [CrossRef]
  44. Pessoles, X.; Landon, Y.; Rubio, W. Kinematic modelling of a 3-axis NC machine tool in linear and circular interpolation. Int. J. Adv. Manuf. Technol. 2010, 47, 5–8. [Google Scholar] [CrossRef]
  45. Monreal, M.; Rodriguez, C.A. Infuence of tool path strategy on the cycle time of high-speed milling. Comput.-Aided Des. 2003, 35, 395–401. [Google Scholar] [CrossRef]
  46. Yau, H.T.; Kuo, M.J. NURBS machining and feed rate adjustment for high-speed cutting of complex sculptured surfaces. Int. J. Prod. Res. 2001, 39, 21–41. [Google Scholar] [CrossRef]
  47. Coelho, R.T.; Souza, A.F.; Roger, A.R. Mechanistic approach to predict real machining time for milling free-form geometries applying high feed rate. Int. J. Adv. Manuf. Technol. 2010, 46, 1103–1111. [Google Scholar] [CrossRef]
  48. Souza, A.F.; Käsemodel, R.B.; Arias, M.; Marin, F.; Rodriguez, A.R. Study of tool paths calculated by diferent commercial CAM systems and infuences on the real machining time and surface roughness for milling free-form geometries. J. Braz. Soc. Mech. Sci. Eng. 2019, 363, 1–12. [Google Scholar] [CrossRef]
  49. Siller, H.; Rodriguez, C.A.; Ahuett, H. Cycle time prediction in high-speed milling operations for sculptured surface finishing. J. Mater. Process. Technol. 2006, 174, 355–362. [Google Scholar] [CrossRef]
  50. Lim, E.M.; Meng, C.H. The prediction of dimensional error for sculptured surface productions using the ball-end milling process. Part 2: Surface generation model and experimental verification. Int. J. Mach. Tools Manuf. 1995, 35, 1171–1185. [Google Scholar] [CrossRef]
  51. Quinsat, Y.; Sabourin, L.; Lartigue, C. Surface topography in ball end milling process: Description of a 3D surface roughness parameter. J. Mater. Process. Technol. 2008, 195, 135–143. [Google Scholar] [CrossRef]
  52. Bouzakis, K.D.; Aichouh, P.; Efstathiou, K. Determination of the chip geometry, cutting force and roughness in free form surfaces finishing milling, with ball end tools. Int. J. Mach. Tools Manuf. 2003, 43, 499–514. [Google Scholar] [CrossRef]
  53. Layegh, S.E.; Lazoglu, I. 3D surface topography analysis in 5-axis ball-end milling. CIRP Ann. -Manuf. Technol. 2017, 66, 133–136. [Google Scholar] [CrossRef]
  54. Sun, Y.; Liu, Y.; Zheng, M.; Xu, J.; Guo, Q. A review on theories/methods to obtain surface topography and analysis of corresponding affecting factors in the milling process. Int. J. Adv. Manuf. Technol. 2023, 127, 3097–3131. [Google Scholar] [CrossRef]
  55. Xu, J.; Zhang, H.; Sun, Y. Swept surface-based approach to simulating surface topography in ball-end CNC milling. Int. J. Adv. Manuf. Technol. 2017, 98, 107–118. [Google Scholar] [CrossRef]
  56. Zhou, R.; Qilin, C. Modelling and analysis of surface topography generated in end milling process. Int. J. Adv. Manuf. Technol. 2021, 1–19. [Google Scholar] [CrossRef]
  57. Zhang, P.; Su, G. On the milling strategy in machining curved surfaces based on minimum stress concentration by a 3-axis machining center. Int. J. Adv. Manuf. Technol. 2022, 119, 1–12. [Google Scholar] [CrossRef]
  58. Varga, J.; Stahovec, J.; Beňo, J.; Vrabeľ, M. Assessment of surface quality for chosen milling strategies when producing relief surfaces. Adv. Sci. Technol. Res. J. 2014, 8, 37–41. [Google Scholar] [CrossRef]
  59. Lasemi, A.; Xue, D.; Gu, P. Recent development in CNC machining of freeform surfaces: A state-of-the-art review. Comput. Aided Des. 2010, 42, 641–654. [Google Scholar] [CrossRef]
  60. Václav, Š.; Sivtsev, N.S.; Senderská, K. Investigation of stress-strain state of a workpiece at gauge burnishing of its holes. Adv. Sci. Technol. Res. J. 2017, 11, 211–222. [Google Scholar] [CrossRef]
  61. Kaymakci, M.; Lazoglu, I. Tool path selection strategies for complex sculptured surface machining. Mach. Sci. Technol. 2008, 12, 119–132. [Google Scholar] [CrossRef]
  62. Pokorný, P.; Peterka, J.; Václav, Š. The task of 5-axis milling. Tech. Gaz. 2012, 19, 147–150. [Google Scholar]
Figure 1. Tool contact with machined surface (a) ascendant direction (b) descendant direction.
Applsci 13 10328 g001
Figure 2. Tool contact with machined surface (a) machining with the center of the tool (b) ascendant direction (c) ascendant direction in the lower area of the sample.
Applsci 13 10328 g002
Figure 3. Trajectory view calculation for free-shaped toolpath (a) forward step (b) size length.
Applsci 13 10328 g003
Figure 4. 3D model of the test specimen.
Applsci 13 10328 g004
Figure 5. Selected machining operations.
Applsci 13 10328 g005
Figure 6. Measured areas for surface roughness assessment.
Applsci 13 10328 g006
Figure 7. The basic coordinate system—spatial alignment method 3-2-1.
Applsci 13 10328 g007
Figure 8. Measurements of 3D curves (a) X–Z plane (b) Y–Z plane.
Applsci 13 10328 g008
Figure 9. The number of points measured depending on the measurement location.
Applsci 13 10328 g009
Figure 10. Detail of the investigated surface at 7.5 mm; Constant Z strategy.
Applsci 13 10328 g010
Figure 11. Detail of the investigated surface at 7.5 mm; spiral strategy.
Applsci 13 10328 g011
Figure 12. Detail of the investigated surface at 7.5 mm; spiral circle strategy.
Applsci 13 10328 g012
Figure 13. Detail of the investigated surface at 15 mm; Constant Z strategy.
Applsci 13 10328 g013
Figure 14. Detail of the investigated surface at 15 mm; spiral strategy.
Applsci 13 10328 g014
Figure 15. Detail of the investigated surface at 15 mm; spiral circle strategy.
Applsci 13 10328 g015
Figure 16. Detail of the investigated surface at 22.5 mm; Constant Z strategy.
Applsci 13 10328 g016
Figure 17. Detail of the investigated surface at 22.5 mm; spiral strategy.
Applsci 13 10328 g017
Figure 18. Detail of the investigated surface at 22.5 mm; spiral circle strategy.
Applsci 13 10328 g018
Figure 19. Surface topography for Constant Z strategy.
Applsci 13 10328 g019
Figure 20. Surface topography for Spiral circle strategy.
Applsci 13 10328 g020
Figure 21. Comparison of the radial depth of cut at a specific height for the Constant Z strategy.
Applsci 13 10328 g021
Figure 22. Comparison of the radial depth of cut at a specific height for the spiral strategy.
Applsci 13 10328 g022
Figure 23. Comparison of the radial depth of cut at a specific height for the spiral circle strategy.
Applsci 13 10328 g023
Figure 24. Comparison of radial depth of cut ae at specific heights for each strategy.
Applsci 13 10328 g024
Figure 25. Surface roughness rating for all three strategies, measurement height 7.5 mm.
Applsci 13 10328 g025
Figure 26. Surface roughness rating for all three strategies, measurement height 15 mm.
Applsci 13 10328 g026
Figure 27. Surface roughness rating for all three strategies, measurement height 22.5.
Applsci 13 10328 g027
Figure 28. Comparison of surface roughness Sa [µm] for different heights with respect to the strategies.
Applsci 13 10328 g028
Figure 29. Comparison of surface roughness Ssk [µm] for different heights with respect to the strategies.
Applsci 13 10328 g029
Figure 30. Comparison of surface roughness S10z [µm] for different heights with respect to the strategies.
Applsci 13 10328 g030
Figure 31. Comparison of average parameter values S10z.
Applsci 13 10328 g031
Figure 32. Comparison of average parameter values Ssk.
Applsci 13 10328 g032
Figure 33. Comparison of average parameter values Sa.
Applsci 13 10328 g033
Figure 34. Measured deviations plot of the curve in X–Z plane for Constant Z strategy.
Applsci 13 10328 g034
Figure 35. Measured deviations plot of the curve in the Y–Z plane for Constant Z strategy.
Applsci 13 10328 g035
Figure 36. Measured deviations plot of the curve in X–Z plane for spiral strategy.
Applsci 13 10328 g036
Figure 37. Measured deviations plot of the curve in the Y–Z plane for spiral strategy.
Applsci 13 10328 g037
Figure 38. Measured deviations plot of the curve in X–Z plane for spiral circle strategy.
Applsci 13 10328 g038
Figure 39. Measured deviations plot of the curve in the Y–Z plane for spiral circle strategy.
Applsci 13 10328 g039
Figure 40. Deviations comparison of the evaluated areas for each milling strategy.
Applsci 13 10328 g040
Table 1. Cutting parameters with the tool description.
Tool Diameter [mm]Cutting Speed [m.min−1]Feed per Tooth [mm]Spindle Frequency [RPM]Tool ProducerTool Code
End Mill D 182700.1254800Korloy
(Seoul, Republic of Korea)
AMS2018S
End Mill D81230.0294900ZPS-FN
(Zlín, Czech Republic)
273618.080
Ball End Mill D692.40.0224900ZPS-FN
(Zlín, Czech Republic)
511418.060
Table 2. Individual operations applied for sample production.
Milling OperationTool Diameter [mm]Depth of Cut ap [mm]Radial Depth of Cut ae [mm]Toolpath Tolerance T [mm]Surface Allowance P [mm]
RoughingEnd Mill D 18330.10.5
Semi finishEnd Mill D 80.50.50.10.2
FinishBall End Mill D 6-0.250.010
Table 3. Radial depth of cut ae [µm] of 7.5mm.
StrategyRadial Depth of Cut ae [µm] of 7.5 mm
Measurement 1Measurement 2Measurement 3
Constant Z347345325
Spiral286308283
Spiral circle182185173
Table 4. Radial depth of cut ae [µm] of 15mm.
StrategyRadial Depth of Cut ae [µm] of 15 mm
Measurement 1Measurement 2Measurement 3
Constant Z429446444
Spiral421419426
Spiral circle202202209
Table 5. Radial depth of cut ae [µm] of 22.5mm.
StrategyRadial Depth of Cut ae [µm] of 22.5 mm
Measurement 1Measurement 2Measurement 3
Constant Z513552515
Spiral488508486
Spiral circle182202180
Table 6. Average roughness values with the standard deviation.
Roughness
Parameter
Constant Z
Average ± Standard Deviation [mm]
Spiral
Average ± Standard Deviation [mm]
Spiral Circle
Average ± Standard Deviation [mm]
S10z47.050 ± 6.43438.444 ± 20.49930.051 ± 24.339
Ssk1.005 ± 0.4021.065 ± 0.8050.814 ± 1.409
Sa1.539 ± 0.356 1.643 ± 0.2850.854 ± 0.060
Table 7. Measured deviation values for Constant Z strategy.
Area EvaluatedCalculated
Deviation [mm]
Set Tolerance [mm]Maximum
Negative Deviation [mm]
Maximum
Positive Deviation [mm]
2D profile X–Z0.12310.15−0.05490.0616
2D profile Y–Z0.08740.15−0.04110.0437
3D area profile 0.13720.15−0.06860.0665
Table 8. Measured deviation values for spiral strategy.
Area EvaluatedCalculated
Deviation [mm]
Set Tolerance [mm]Maximum
Negative Deviation [mm]
Maximum
Positive Deviation [mm]
2D profile X–Z0.12490.15−0.05800.0625
2D profile Y–Z0.09050.15−0.04400.0453
3D area profile0.19830.15−0.05610.0991
Table 9. Measured deviation values for spiral circle strategy.
Area EvaluatedCalculated
Deviation [mm]
Set Tolerance [mm]Maximum
Negative Deviation [mm]
Maximum
Positive Deviation [mm]
2D profile X–Z0.12280.15−0.05570.0614
2D profile Y–Z0.08680.15−0.04110.0434
3D area profile0.13710.15−0.06860.0670
Disclaimer/Publisher’s Note: The statements, opinions and data contained in all publications are solely those of the individual author(s) and contributor(s) and not of MDPI and/or the editor(s). MDPI and/or the editor(s) disclaim responsibility for any injury to people or property resulting from any ideas, methods, instructions or products referred to in the content.

