Article

Three-Dimensional Mineral Prospectivity Modeling with the Integration of Ore-Forming Computational Simulation in the Xiadian Gold Deposit, Eastern China

1
Key Laboratory of Metallogenic Prediction of Nonferrous Metals and Geological Environment Monitoring Ministry of Education, School of Geosciences and Info-Physics, Central South University, Changsha 410083, China
2
Hunan Key Laboratory of Non-Ferrous Resources and Geological Hazard Detection, Changsha 410083, China
3
Zhaojin Mining Industry Co., Ltd., Yantai 265400, China
*
Author to whom correspondence should be addressed.
Appl. Sci. 2023, 13(18), 10277; https://doi.org/10.3390/app131810277
Submission received: 30 July 2023 / Revised: 26 August 2023 / Accepted: 5 September 2023 / Published: 13 September 2023

Abstract

:
Finding new, effective predictive variables for 3D mineral prospectivity modeling is both important and challenging. The 3D ore-forming numerical modeling quantitively characterizes the complex coupling-mineralization process of the structure, fluid, heat, and wall rock, which may be potential indicators for mineral exploration. We here conducted 3D mineral prospectivity modeling with the integration of ore-forming computational simulation information in the Xiadian orogenic gold deposit, China, to examine whether the simulation data input can improve the reliability of prospectivity modeling. First, we constructed the 3D models of the orebody and fault to extract the fault geometric features using spatial analysis, as they are always considered to be the crucial controls of gold distribution. Second, we performed 3D numerical modeling of the deformation–fluid–heat-coupling process of the structurally controlled hydrothermal Au system using the FLAC3D platform. Finally, the fault-geometry features (buffer, dip, dip variation, and undulation) and the ore-formation-simulation indices (volume strain, shear strain, temperature variation, and fluid flux) were integrated using Bayesian decomposition modeling, which has a promising nonlinear model ability and a flexible variable-integration ability. The prospectivity modeling results demonstrated that the model generated by combining geometry and simulation variables achieved significantly higher AUC, precision, accuracy, Kappa, and F1 scores compared to other models using a single-predictor-variable dataset. This suggests that the joint use of geometry and simulation variables construct a comprehensive association between gold and its ore-controlling factors, thereby resulting in a highly reliable prospectivity model. Thus, the approach of 3D mineral prospectivity modeling aided by ore-forming numerical simulation proves to be more useful in guiding mineral exploration, especially in the condition of fewer variables. Based on the prospectivity modeling outcomes, we identified four gold targets at depth in the Xiadian district that warrant focused exploration efforts.

1. Introduction

Mineral exploration is a crucial, long-term endeavor for governments and society that requires sustainable mineral sources. The discovery of new mineral deposits or orebodies becomes increasingly challenging in the setting of extensive exploration at shallow depths [1]. This has led to a shift from 2D mineral prospectivity modeling (MPM) at a regional scale to 3D MPM at a mine scale. The 3D MPM is theoretically superior to 2D MPM because mineralization distribution occurs in a 3D space and is primarily controlled by the 3D features of the ore-controlling factors (e.g., intrusion, fold) [2,3,4,5]. However, compared with 2D MPM, which benefits from multiple-source data to generate predictor variables, such as geology, structure, remote sensing, and geochemistry exploration [6,7,8,9,10,11], 3D MPM often faces limitations in creating the variables, owing to the lack of robust information at depth related to technique and cost issues. How to obtain effective and high-quality prediction variables, especially at depth, to conduct 3D MPM is, thus, an ongoing focus.
The development of 3D-modeling methods has greatly contributed to the analysis of promising mineral reserves and locating potential mineralization. The joint interpretation of geological, geophysical, geochemical, and other data is usually used in the 3D modeling of deep-geology units [12,13,14]. Jointly using the geochemical and geophysical data, 3D models of the deep hydrothermal alteration zone can be constructed with machine learning using the spatial association of shallow geochemical anomalies and the deep alteration zone [15]. Using an objective interpretation method, the relationship between recovered physical properties and orebodies is able to be obtained via geophysical 2D and 3D inversions [16]. Inference modeling approaches using various geophysical data [17,18,19] have the capability to accurately reconstruct the deep architectures of geological objects by integrating geological–geophysical data and knowledge, thereby furnishing essential model support for the implementation of 3D MPM. Spatial analysis is an important tool to extract useful spatial ore-controlling information from 3D models. Existing methods have a laudable ability to capture the geological body spatial features, such as field analysis, shape analysis, and model projection [20,21,22,23,24,25]. The model spatial features are commonly selected as critical predictive variables for 3D MPM, which has already contributed to new resource discoveries [12,14,26,27,28,29,30]. Notably, mineral deposit formation involves complicated geodynamic processes in both space and time, in which magma and/or fluid flow, and its evolution and interaction with wall rocks, dominate the mineralization distribution [31,32,33,34,35]. While the spatial controls on mineralization are vital for exploration, the weak or insufficient representation of metallogenic geodynamic processes (e.g., volumetric strain, temperature variation) may reduce the reliability, accuracy, and confidence of prediction.
The ore-forming numerical modeling has greatly advanced our understanding of several geological processes (e.g., structure deformation, fluid flow) and their relation to ore deposit genesis [36,37,38,39,40,41,42,43,44]. For instance, Li et al. [38,45,46,47] employed computational modeling to uncover the influence of rock difference, dip variation, and strain localization on fluid flow patterns in the structural-controlled, unconformity-related uranium system in the Athabasca Basin, Canada. Additionally, numerical modeling can also simulate temporal–spatial metal precipitation or rock stress geodynamics to delineate the fluid pathways and traps to locate potential mineralization. For example, Liu et al. [13], Hu et al. [48], and Shan et al. [49] used the dilation space, mineralization rate, and/or geochemical interaction as ore proxies to find the favorable metal deposition location at depth. Ford et al. [50] and Wilson et al. [51] discussed the fault geometry controls on the rock deformation and fluid flow regular pattern and determined the mineralization exploration strategies in strike–slip fault fluid systems. Thus, ore-forming numerical modeling has the powerful ability to provide ore-predictive information in terms of the metallogenic geodynamic system. These data, together with model spatial features, are promising to enhance 3D mineral prospectivity models.
The Jiaodong Peninsula is the largest gold province of China, boasting more than 5000 tons of Au resources (Figure 1) [52]. Gold deposits in this region show similar geology and mineralization characteristics with orogenic gold deposits, of which the regional fault control orebody localizations are ubiquitous and lack the gold affinity for lithology [53,54,55,56,57,58,59,60,61,62]. In terms of relatively simple geological characteristics, these conditions provide an excellent study objective for performing 3D-model analysis and numerical modeling. However, few previous studies have conducted systematic and comprehensive research from spatial and temporal perspectives to investigate these gold deposits and guide deep exploration. Herein, we selected the Xiadian gold deposit as a case study to perform 3D MPM with the integration of ore-forming computational simulation information to examine the added geodynamic variables‘ effects on prediction results. This research aims to provide a new way to uncover more predictor variables for 3D MPM, gain new insights into the controls on gold mineralization, and identify mineral resources responsibly and efficiently.
The rest of this paper is structured as follows. Section 2 presents the geological background of the Xiadian deposit. In Section 3, we introduce the dataset used in the case study and describe the methodologies employed for 3D modeling, feature extraction, ore-forming simulation, and prospectivity modeling. In Section 4, we first detail the modeling and simulation outcomes and further discuss the differences between the three models based on different variable sets. Section 4 concludes by presenting the target appraisal facilitated by the prospectivity model. Finally, Section 5 summarizes the contributions made by this paper.

2. Geological Background

The giant Jiaodong gold province is located at the eastern margin of the North China Craton, east of the Tan-Lu Fault Zone (Figure 1). It consists of the Jiaobei Terrane to the northwest and the Sulu Ultra-High-Pressure Metamorphic Belt to the southeast, bounded by the Wulian–Yantai lithospheric fault. As a consequence of the subduction of the Paleo–Pacific plate, the Jiaodong Peninsula suffered extensive and intense magmatic activities and crustal deformation during the Mesozoic, accompanied by large-scale gold mineralization [52,62].
The Jiaobei Terrane endows most of the gold reserves of the Jiaodong Peninsula, with basement rocks primarily comprising the Neoarchean Jiaodong Group and the Paleoproterozoic Jingshan and Fenzishan Group (Figure 1). Mesozoic magmatism in the region is widely distributed and is mainly grouped into (1) Late Jurassic granitoid associated with partial melting of the lower crust including Longlong, Kunyushan, Luanjiahe, etc.; (2) Early Cretaceous granitoid genesis from crust–mantle interactions, represented by Guojialing granitoid [64]; and (3) widely intruded mafic–felsic dykes. The vast gold mineralization is principally manifested as auriferous–quartz vein type and disseminated-/stockwork-type, with a peak age of ~120 Ma [52].
The Xiadian gold deposit is located in the southern part of the Zhaoping regional detachment fault zone (Figure 1). There are different lithologies in the hanging wall and footwall of the Zhaoping fault (Figure 2), of which the former is dominated by the metamorphic rocks of the Jingshan Group and Jiaodong Group, and the other comprises Late Jurassic Linglong granite and a few metamorphic breccias.
At Xiadian, gold mineralization is spatially endowed predominantly in the footwall of the Zhaoping fault zone (Figure 3). The Zhaoping fault, marked by the dark fault gunge, is mainly NE- and NNE-striking, yet locally N-S striking, with variable dips between 35°–55° (average 45°). The fault underwent brittle–ductile deformation, with a several-meter-thick mylonite and alteration zone developed proximal to the fault [26,65]. During the mineralization period, the Zhaoping fault ordinary demonstrated a dextral strike-slip normal sense of movement, with NE-SW compression and NW-SE extension as the dominant tectonic regimes [54], reflecting vertical compressive and horizontal tensional stresses. The deformation of the Zhaoping fault controls the localization of hydrothermal alteration–mineralization showing that (1) the majority of gold orebodies are located in the footwall of the Zhaoping fault, (2) the hydrothermal alteration–mineralization zone is distributed along the fault (Figure 3a), and (3) the occurrence of orebodies is related to the fault geometry (Figure 3b).
Gold orebodies in the Xiadian district mainly include Nos. 2, 7, Daobeizhuangzi (DBZZ), and Jiangjiayao (JJY). They are dominantly lenticular, pillar, vein-like, and discontinuous, with a NE-plunging ore shoot extending ~1400 m with an average gold grade of 3.4 g/t. Gold mineralization at Xiadian is closely associated with quartz–pyrite–sericite alteration and shows the disseminated and stockwork characteristics, with minor auriferous quartz veins in the steeply brittle fractures. Gold is mostly observed as μm-scale electrum gains in the microcracks of sulfides, or as inclusion in sulfide minerals.
Previous geochronological studies recorded a mineralization age of ~120 Ma at Xiadian, comparable to most gold deposits within the Jiaodong Peninsula. This period occurred with the rollback of the Paleo–Pacific Plate, leading to a transformation in the tectonic regime of the Jiaodong Peninsula from regional compression to extension [54,64]. Companying with the geodynamic process, large-scale crustal thinning and tectonic–magmatic activities happened in the region. The metal source of the Mesozoic gold systems in the region has been suggested to be related to the overlying sediments of the subducting Paleo–Pacific Plate undergoing subduction-associated metamorphism [52,53]. The deep-source ore-forming fluids and metals flowed upward through lithospheric-scale and regional-scale faults to the economic portion (shallow crust, <10 km) of deposits [59,65] (Figure 4). At the shallow depths of Xiadian, these fluids migrated upward along the Zhaoping fault, exhibiting an oblique feature during the coupled normal and dextral strike-slip movement. Primary fluids were active near the fault, forming the disseminated gold mineralization related to sericite–pyrite–quartz alteration. In contrast, minor fluids flowed into the fractures distal to the fault, resulting in the formation of quartz sulfide veins [26]. The precipitation of gold was ultimately caused by pressure fluctuations and sulfidation [66].

3. Methods

The 3D mineral prospectivity modeling typically involves three main steps of 3D geological modeling, predictive variable generation, and variable integration [14,27,28,29,67,68]. The works and studies in the Xiadian gold deposit have well concluded the geological and mineral characteristics and demonstrated the gold mineralization-formation process and its controls (Figure 4), of which the Zhaoping fault, the critical ore-controlling object, plays a significant role in influencing ore fluid flow pathways and gold deposition happening. Therefore, from an empirical perspective, the most vital exploration criteria for gold exploration at Xiadian is identifying the spatial and genetic association between mineralization and the Zhaoping fault. Building upon the 3D geology modeling work, we employed spatial analysis to obtain the fault geometric features and numerical simulation to get the mineralization geodynamic information (such as volume strain and temperature variation), both prediction variables input into the prospectivity model. To balance the variable difference between geometry feature and simulation information during prospectivity modeling, we used a Bayesian decomposition modeling technique. Figure 5 presents the main steps undertaken in this study.

3.1. Dataset

The generation of predictive variables and the construction of the prospectivity model depend on critical geological models, including structure, lithology, gold orebody, and mineralization distribution. To this end, we collected a comprehensive dataset that can reflect the architecture and property information of the geological objects in the Xiadian deposit. This dataset includes one 1:10,000 surface geological map, 82 1:500 subsurface horizontal sections, 70 cross-sections, 392 drill holes, 74,515 gold assays (including ore and non-ore), 13 magnetotelluric (MT) sounding profiles, and one 1:200,000 Bouguer gravity anomaly measurement.

3.2. 3D Modeling and Feature Extraction

3D modeling of mineral deposits is a powerful tool for visualizing mineralization and its underlying controls. It serves as a data foundation for generating quantitative predictive variables that facilitate mineral exploration. Based on the exploration data, we used the implicit [69] and explicit modeling methods [14] to establish the geometrical wireframe models (i.e., triangular irregular network, TIN) of the Zhaoping fault and gold orebodies in the Xiadian district. To further enhance the accuracy of the fault model at depth, We adopted the level set method, as detailed in [19]. Specifically, we first established an initial model of the fault using geological data, and subsequently reconstructed its intricate architectures by updating the initial model with the MT and gravity anomaly data. The reliability of this fault model was further validated through preserved drillholes, encompassing fault features such as location, dip, and dip variation, confirming its accuracy and consistency. Detailed methodology of 3D modeling has been described in the literature [14,19].
In addition, the wireframe model of the gold orebodies was discretized into voxels for subsequent mineralization analysis. These voxels were further endowed with the properties relating to gold grade (Au) and gold amounts (AuMet) using the Kriging interpolation [70] based on the gold assay data.
Previous studies have demonstrated that spatial analysis effectively extracts geometric features associated with mineralization [20,22,24,25,27,29,71]. In this study, we carried out morphological analysis of the Zhaoping fault model and extracted four variables (gF, vF, waF and wbF; Table 1) to comprehend their controls on the gold orebodies in the Xiadian deposit. Details methodologies of spatial analysis employed in this research, have been described in our previous work [14,26,27,72]. Furthermore, the distance analysis was performed to associate the gold orebody voxels with fault geometric variables. Specially, we calculated the minimum distance (dF) between the voxel and the fault TIN model and assigned the geometric variables of the nearest triangle to the voxel. In this way, the voxels were equipped with seven variables (Table 1), where Au and AuMet reflect the mineralization information, while the variables dF, gF, vF, waF and wbF represent the ore-controlling effect of the Zhaoping fault.

3.3. Ore-Forming Simulation

3.3.1. Numerical Method
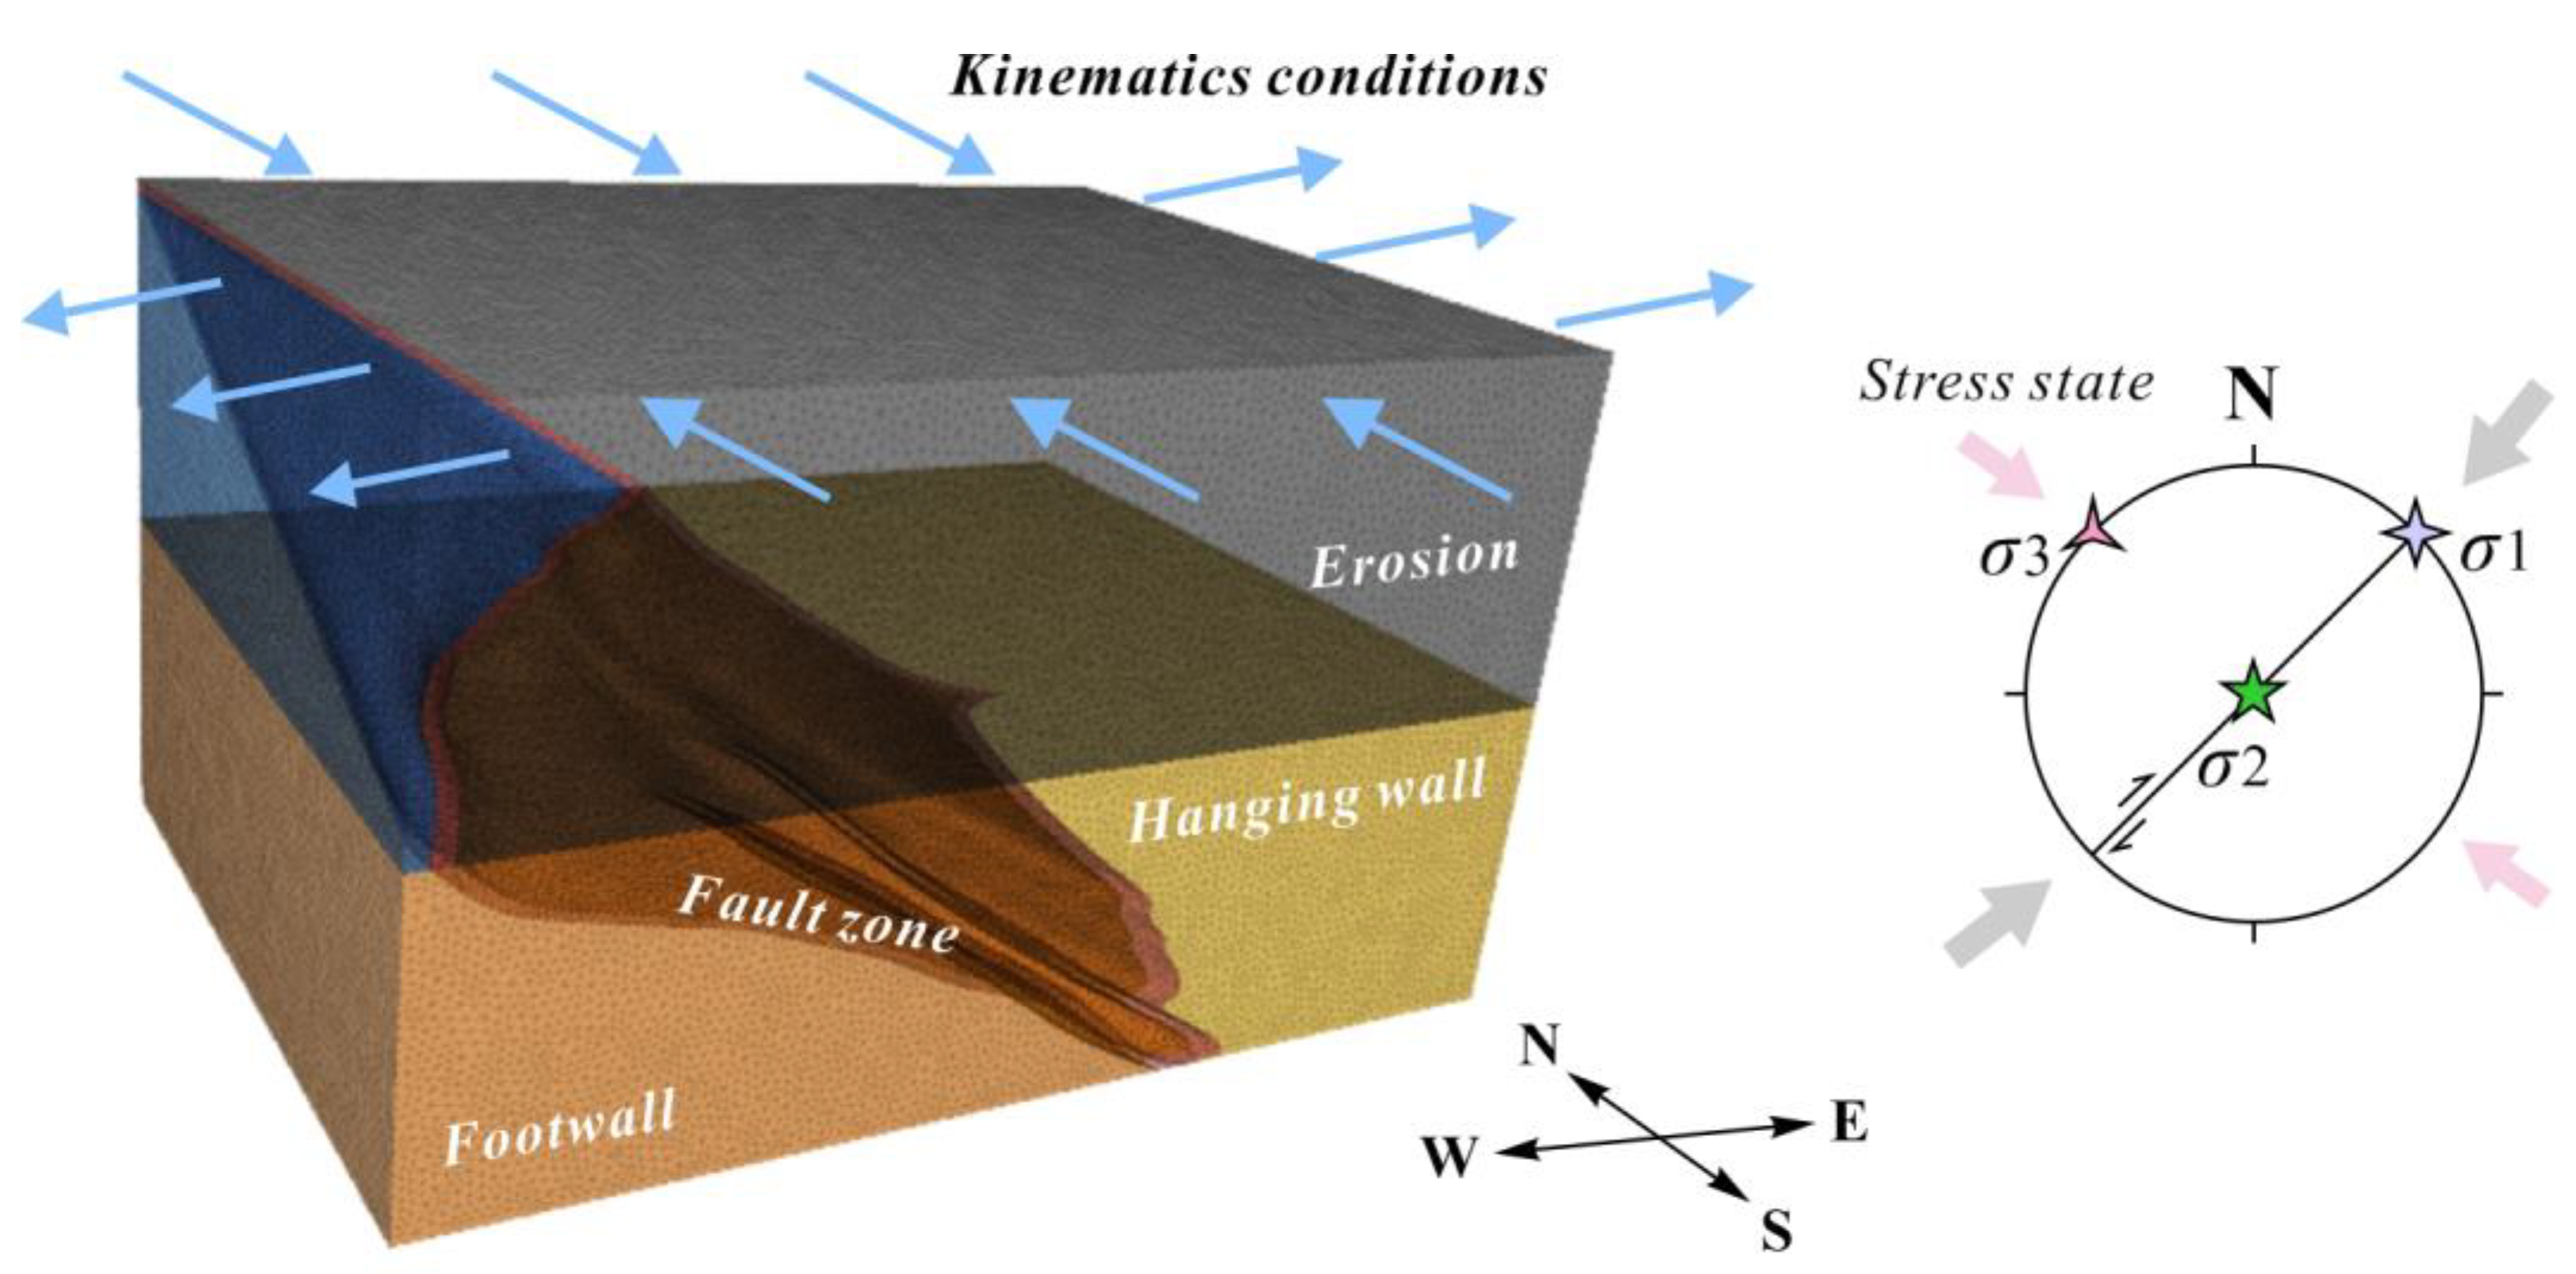
Typically, the complex ore-forming process is considered to be thermal–hydraulic–mechanical–chemical coupling processes [37,44]. In a numerical simulation study, such processes can be approximated and characterized by a series of partial differential equations, including Darcy’s Law (describing fluid activities), Fourier’s Law (describing thermal convection), the Mohr–Coulomb constitutive model (describing the mechanical behavior of materials), and the mass and energy conservation equation (describing the coupled effects of the thermal–hydraulic–mechanical and chemical processes). These governing equations have been specifically reviewed in many prior studies [36,38,41,44,73,74,75,76], and further elaboration is beyond the scope of the study. The basic principle of numerical simulation is to discretize the geological body model of the study area into grids or elements. At each defined grid point, the partial differential equations are transformed into algebraic equations using the finite element method or the finite difference method. These equations are subsequently solved using a number of variable parameters as initial and boundary conditions (e.g., hydraulic potential, temperature, and pore pressure; [36,76,77]). This process can be carried out in a series of codes or commercial software.
Given the impracticality of universally simulating all relevant natural processes, it is necessary to choose the most appropriate software or codes related to numerical simulation, for specifically defined geological processes. In this study, the FLAC3D 5.0 software (Fast Lagrangian Analysis of Continua in Three Dimensions [78], was employed. This powerful software allows for the simulation of fluid flow and heat transport in relation to tectonic deformation, and has been successfully applied to simulation in hydrothermal–structural coupling ore-forming systems [38,73,79]. FLAC3D employs hexahedral elements for mesh discretization, which ensures good convergence and stability in the numerical calculations. In some scenarios with more complex geometries, polyhedral zones of other shapes (e.g., tetrahedral-shaped and pyramid zones) are deployed to create models. These discretizations can be performed in other software platforms such as SKUA-GOCAD 17 or ANSYS, and subsequently converted into a data format suitable for viewing and processing in FLAC3D by computer programs. The mechanical, hydraulic and thermodynamic parameters of the materials such as density, permeability, porosity and conductivity are assigned to the zone, representing the nature of rocks in the actual ore-forming system. The simulation process in FLAC3D proceeds through a cyclic iterative approach. During each iteration, FLAC3D computes stress, strain, and other physical quantities for each element based on the selected constitutive model, initial and boundary conditions. It then updates nodal displacements and other variables according to results obtained from the execution of the previous cycle [80].

3.3.2. Model Setup

Previous researchers have generally concluded that fault zones and fractures are conduits for ore-forming fluid flow [81,82,83]. Refined architectures of the regional fault are essential, as the strain distribution and fluid migration occurs in fault zones [42,73]. Here we manually refined the Xiadian fault surface model constructed above to avoid the post-ore cutoff or deformation. A conceptual model (Figure 6), including the Xiadian fault zone, hanging wall (Jiaodong Group Precambrian metamorphic rocks), footwall (Linglong granite), and erosion cover, is necessary for ore-forming numerical modeling [47,49,84]. In this study, the dimensions of the overall model spanned 7 km horizontally and 10 km vertically. Before simulation, the meticulous mesh definition of these models was imperative to ensure accurate numerical results [44,85,86,87,88]. We used the tetrahedral elements for mesh discretization (Figure 6) via the software GoCAD 17, and converted to FLAC3D tetrahedron-discretization model utilizing a new computer program [45]. This choice was motivated by the undulation features (see below models) generally displayed in the fault zone, which can lead to topological errors after refining the fault model using hexahedral meshes. Tetrahedral meshes, on the other hand, can be small or dense enough to adequately capture the geometric details of the fault model. For different units, meshes are distributed as uniformly as possible and their shape is generally similar as possible. As a result, the whole computational domain is simulated by 1,908,076 tetrahedral elements, including erosion (384,251 elements), fault zone (87,291 elements), footwall (704,938 elements) and hanging wall (731,596 elements). All units were treated as homogeneous porous zones, which are simplified respectively as the Jiaodong Group (hanging wall), Linglong granite (footwall), and fault damage zone with high permeability and low mechanical properties [82,89]. The specific mechanical, hydraulic and thermodynamic parameters of rocks are given in Table 2. These values are based on rock mechanical experiment data or related hand book and numerical simulation experiments in Jiaodong [49,84,90].

3.3.3. Initial and Boundary Conditions

According to the general model [91], the initial pore pressure was set as hydrostatic pressure in the Jiaodong Group and granite, and set as hydrostatic pressure with gradient variation in the fault zone, for the starting condition of the simulation. The initial temperature of the top surface was 25 °C and kept fixed, and the temperature gradient was 20 °C/km. The initial temperature of the top of the fault zone was set to 180 °C, a temperature range consistent with the gold mineralization [49,84,90].
Field geologic observations and published complications have concluded that the Xiadian gold deposit experienced a NW-SE extensional stress regime during the ore-forming period, and the fault zone underwent dextral strike-slip movement [26,54,92,93]. As such, this study set the NW-SE extensional stress regime as the boundary condition (Figure 6). This extensional stress was applied normally to the NW-SE direction boundaries vertically downward according to the gradient of 1.5 × 10⁴ N/m, with zero extensional stress at the top. The two NE-SW direction boundaries and the bottom boundary were all fixed.

3.4. 3D Prospectivity Modeling

The MPM task aims to resolve the complicated nonlinear relationships between the predictor and mineralization variables, ultimately establishing the quantitative association model. Currently, multivariate statistical and machine learning approaches have achieved significant results in MPM [7,11,15,67,94,95,96]. However, the predictor variables in this study contain two distinct types: geometry-related variables and simulation-related variables. Therefore, a hierarchical modeling approach is used to combine these two types of predictor variables and understand their contributions to MPM. The Bayesian decomposition modeling (BDM) is an MPM approach that integrates nonlinearity and interpretability [97]. More importantly, the BDM method can integrate multi-type variables using the “decomposition–integration” strategy. Thus, the BDM was applied to MPM in this study.
To integrate the two types of predictor variables, we realize MPM by two levels of BDM. At the bottom level, individual geometry- and simulation-related predictor variables are integrated to generate their distinctive feature representations. At the top level, we integrate geometry- and simulation-related feature representations and map them to ore-bearing probability.
Firstly, assuming that the geometry- and simulation-related variable sets are denoted as E g and E s , respectively, the mineralization probability based on the Bayes’ rule can be expressed as:
P ( O r e = 1 | E g , E s ) = P E g , E s | O r e = 1 P O r e = 1 P E g , E s .
According to the derivation in [97], Equation (1) can be formulated as:
P ( O r e = 1 | E g , E s ) = 1 1 + exp θ g ϕ g E g + θ s ϕ s E s + b ,
where θ g and θ s are the relevant indices that express the correlation among the variable sets E g and E s , while ϕ g E g , ϕ s E s and b represent the nonlinear mapping functions (NMFs) and the prior correction, respectively:
ϕ g E g = log P O r e   =   1 | E g P O r e   =   0 | E g = log P O r e   =   1 | E g 1 P O r e   =   1 | E g ϕ s E s = log P O r e   =   1 | E s P O r e   =   0 | E s = log P O r e   =   1 | E s 1 P O r e   =   1 | E s b = 1 θ g θ s log P O r e   =   1 P O r e   =   0   .
To model ϕ g E g and ϕ s E s ,   we express the posteriors P O r e = 1 | E g , and P O r e = 1 | E s with another level of BDM:
P ( O r e = 1 | E ) = 1 1 + exp i = 1 n θ , i ϕ i E , i + b .
where E denotes E g or E s , E , i denotes i -th predictor variables in E , ϕ i E , i is the nonlinear mapping function (NMF) for E , i is quantified by local linear regression [98] as used in [40], θ , i is the corresponding regression coefficient.
After obtaining the estimation of the NMFs, we can learn the regression coefficients θ g , θ s and θ , and the prior correction term b and b in Equations (2) and (4) from the training data E g j , E s j ; Y j j = 1 N and E j ; Y j j = 1 N in a maximum likelihood estimation fashion, which is converted to logistic regression problems:
θ g , θ s , b = arg max θ g , θ s , b j = 1 N log P O r e j E g j , E s j ; θ A , θ B , b . θ , b = arg max θ , b j = 1 N log P O r e j E j ; θ , b .

4. Results and Discussion

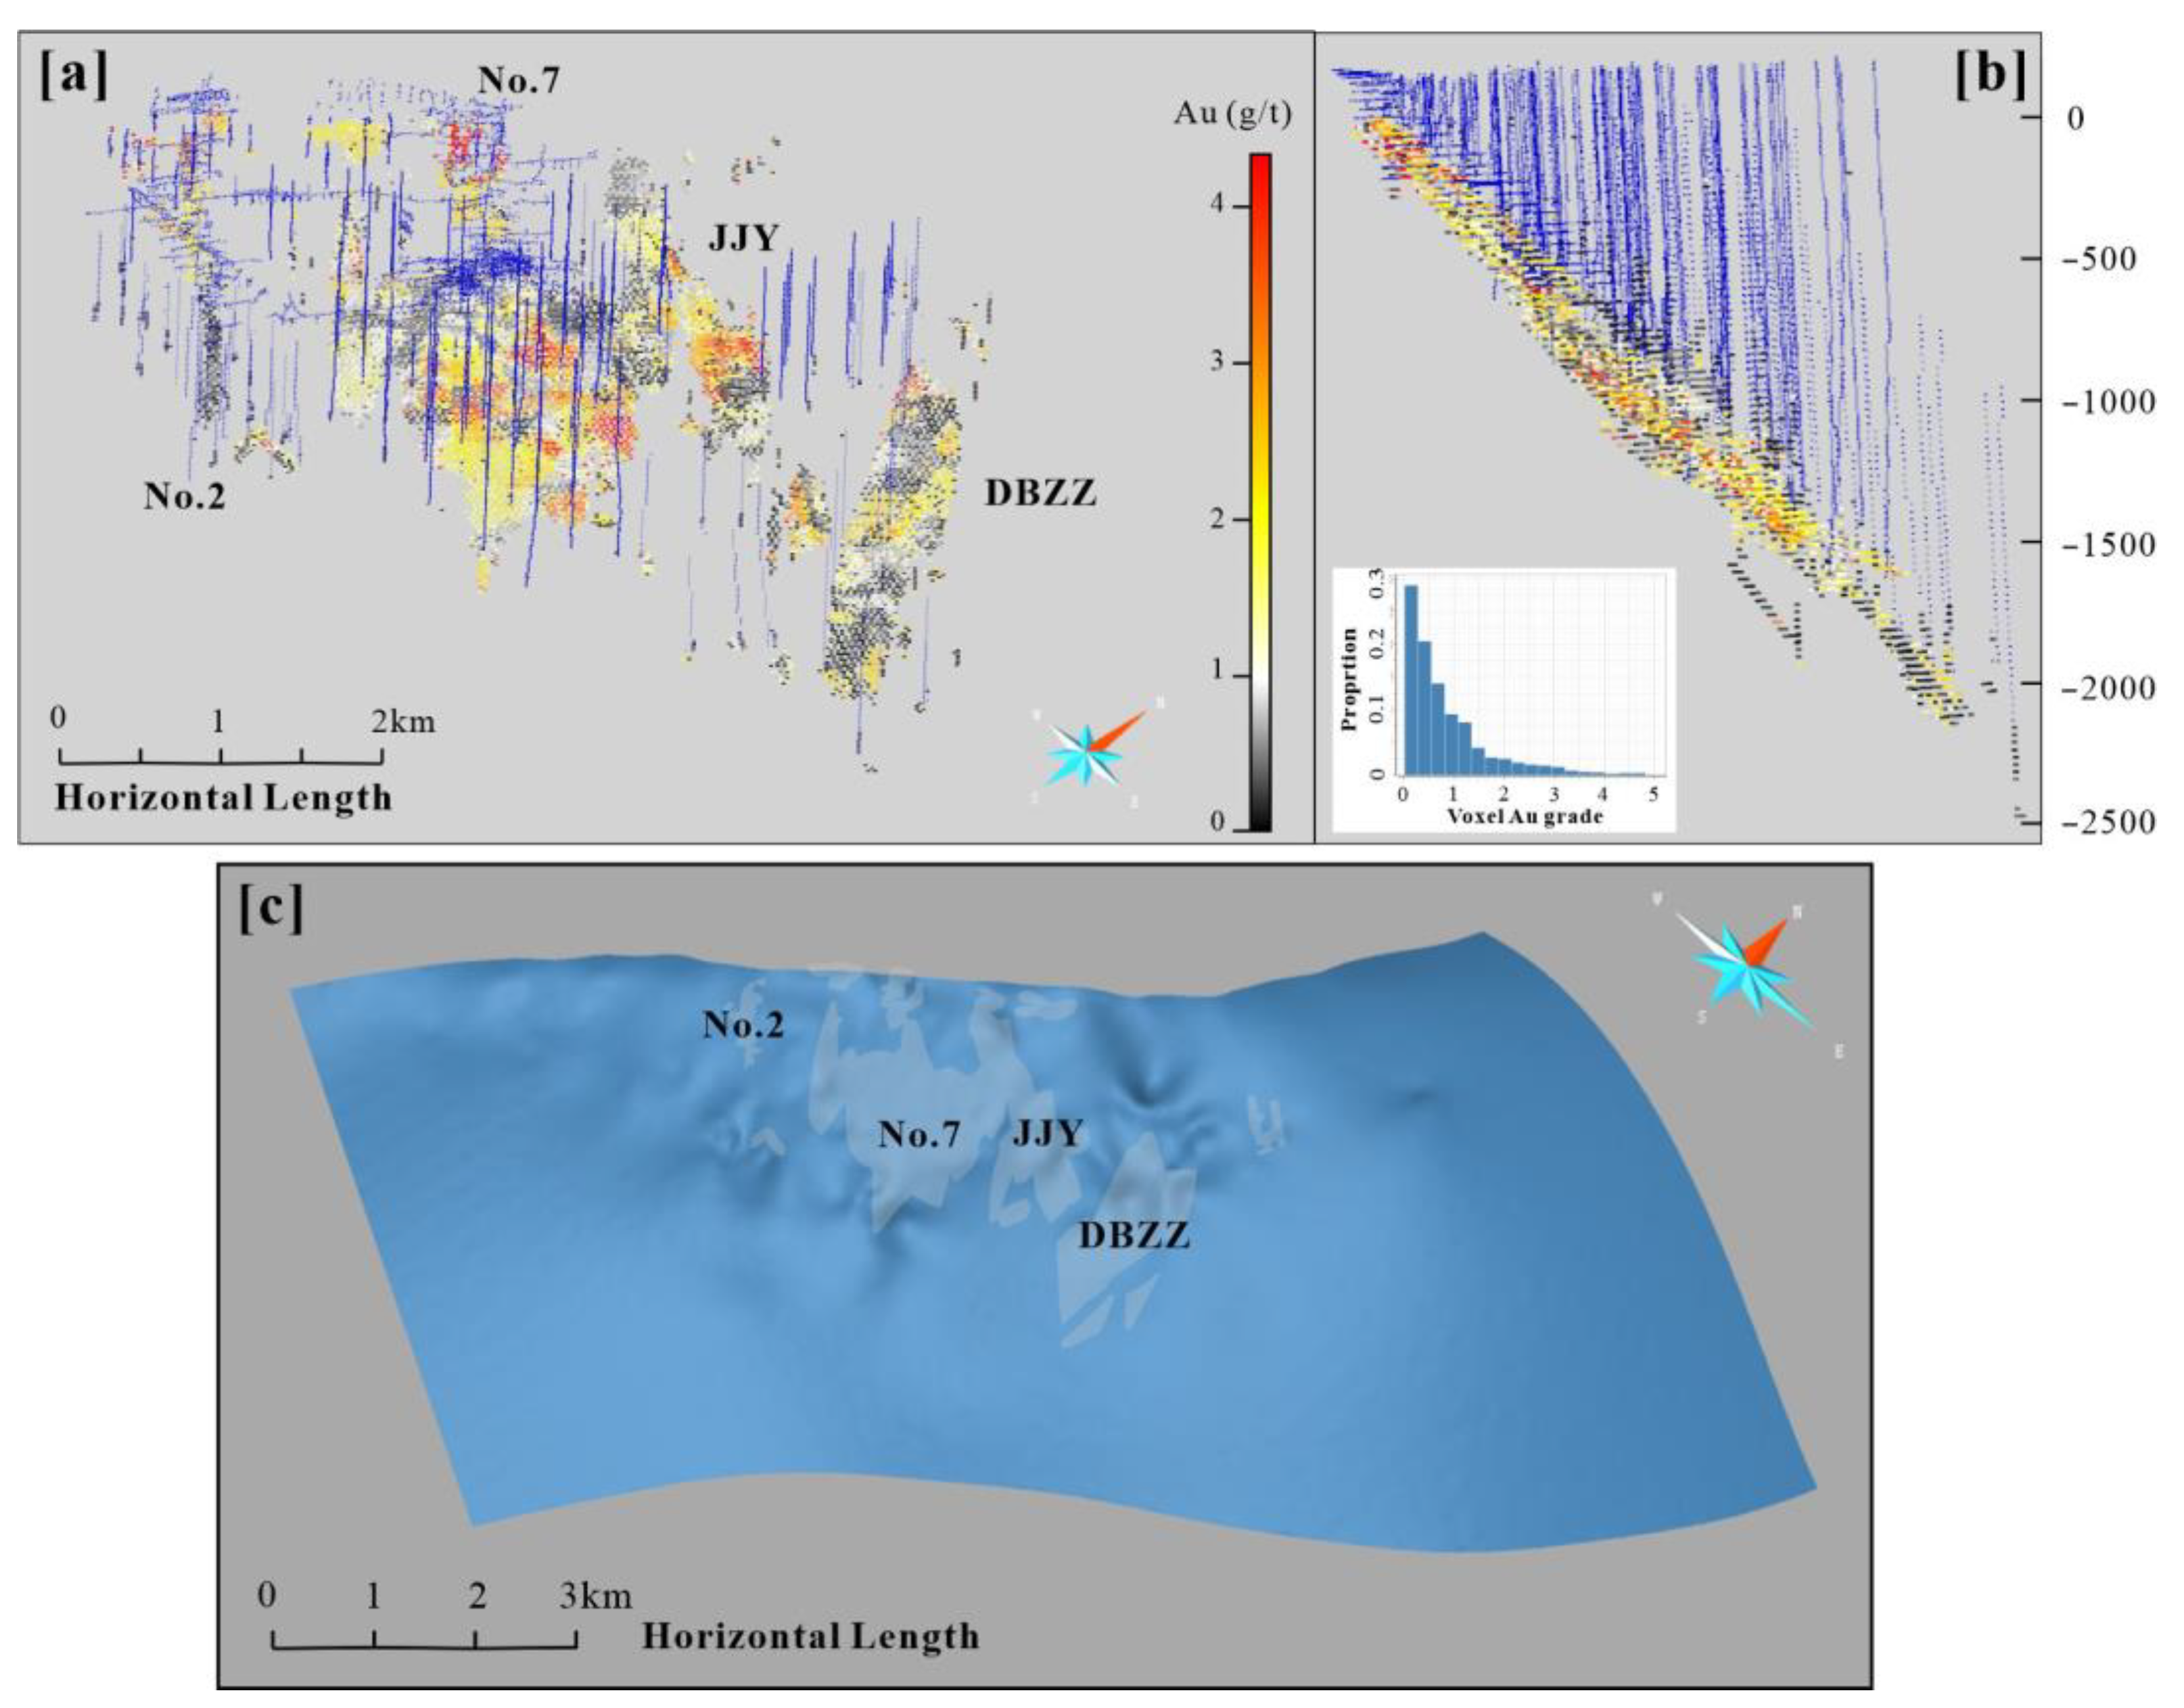
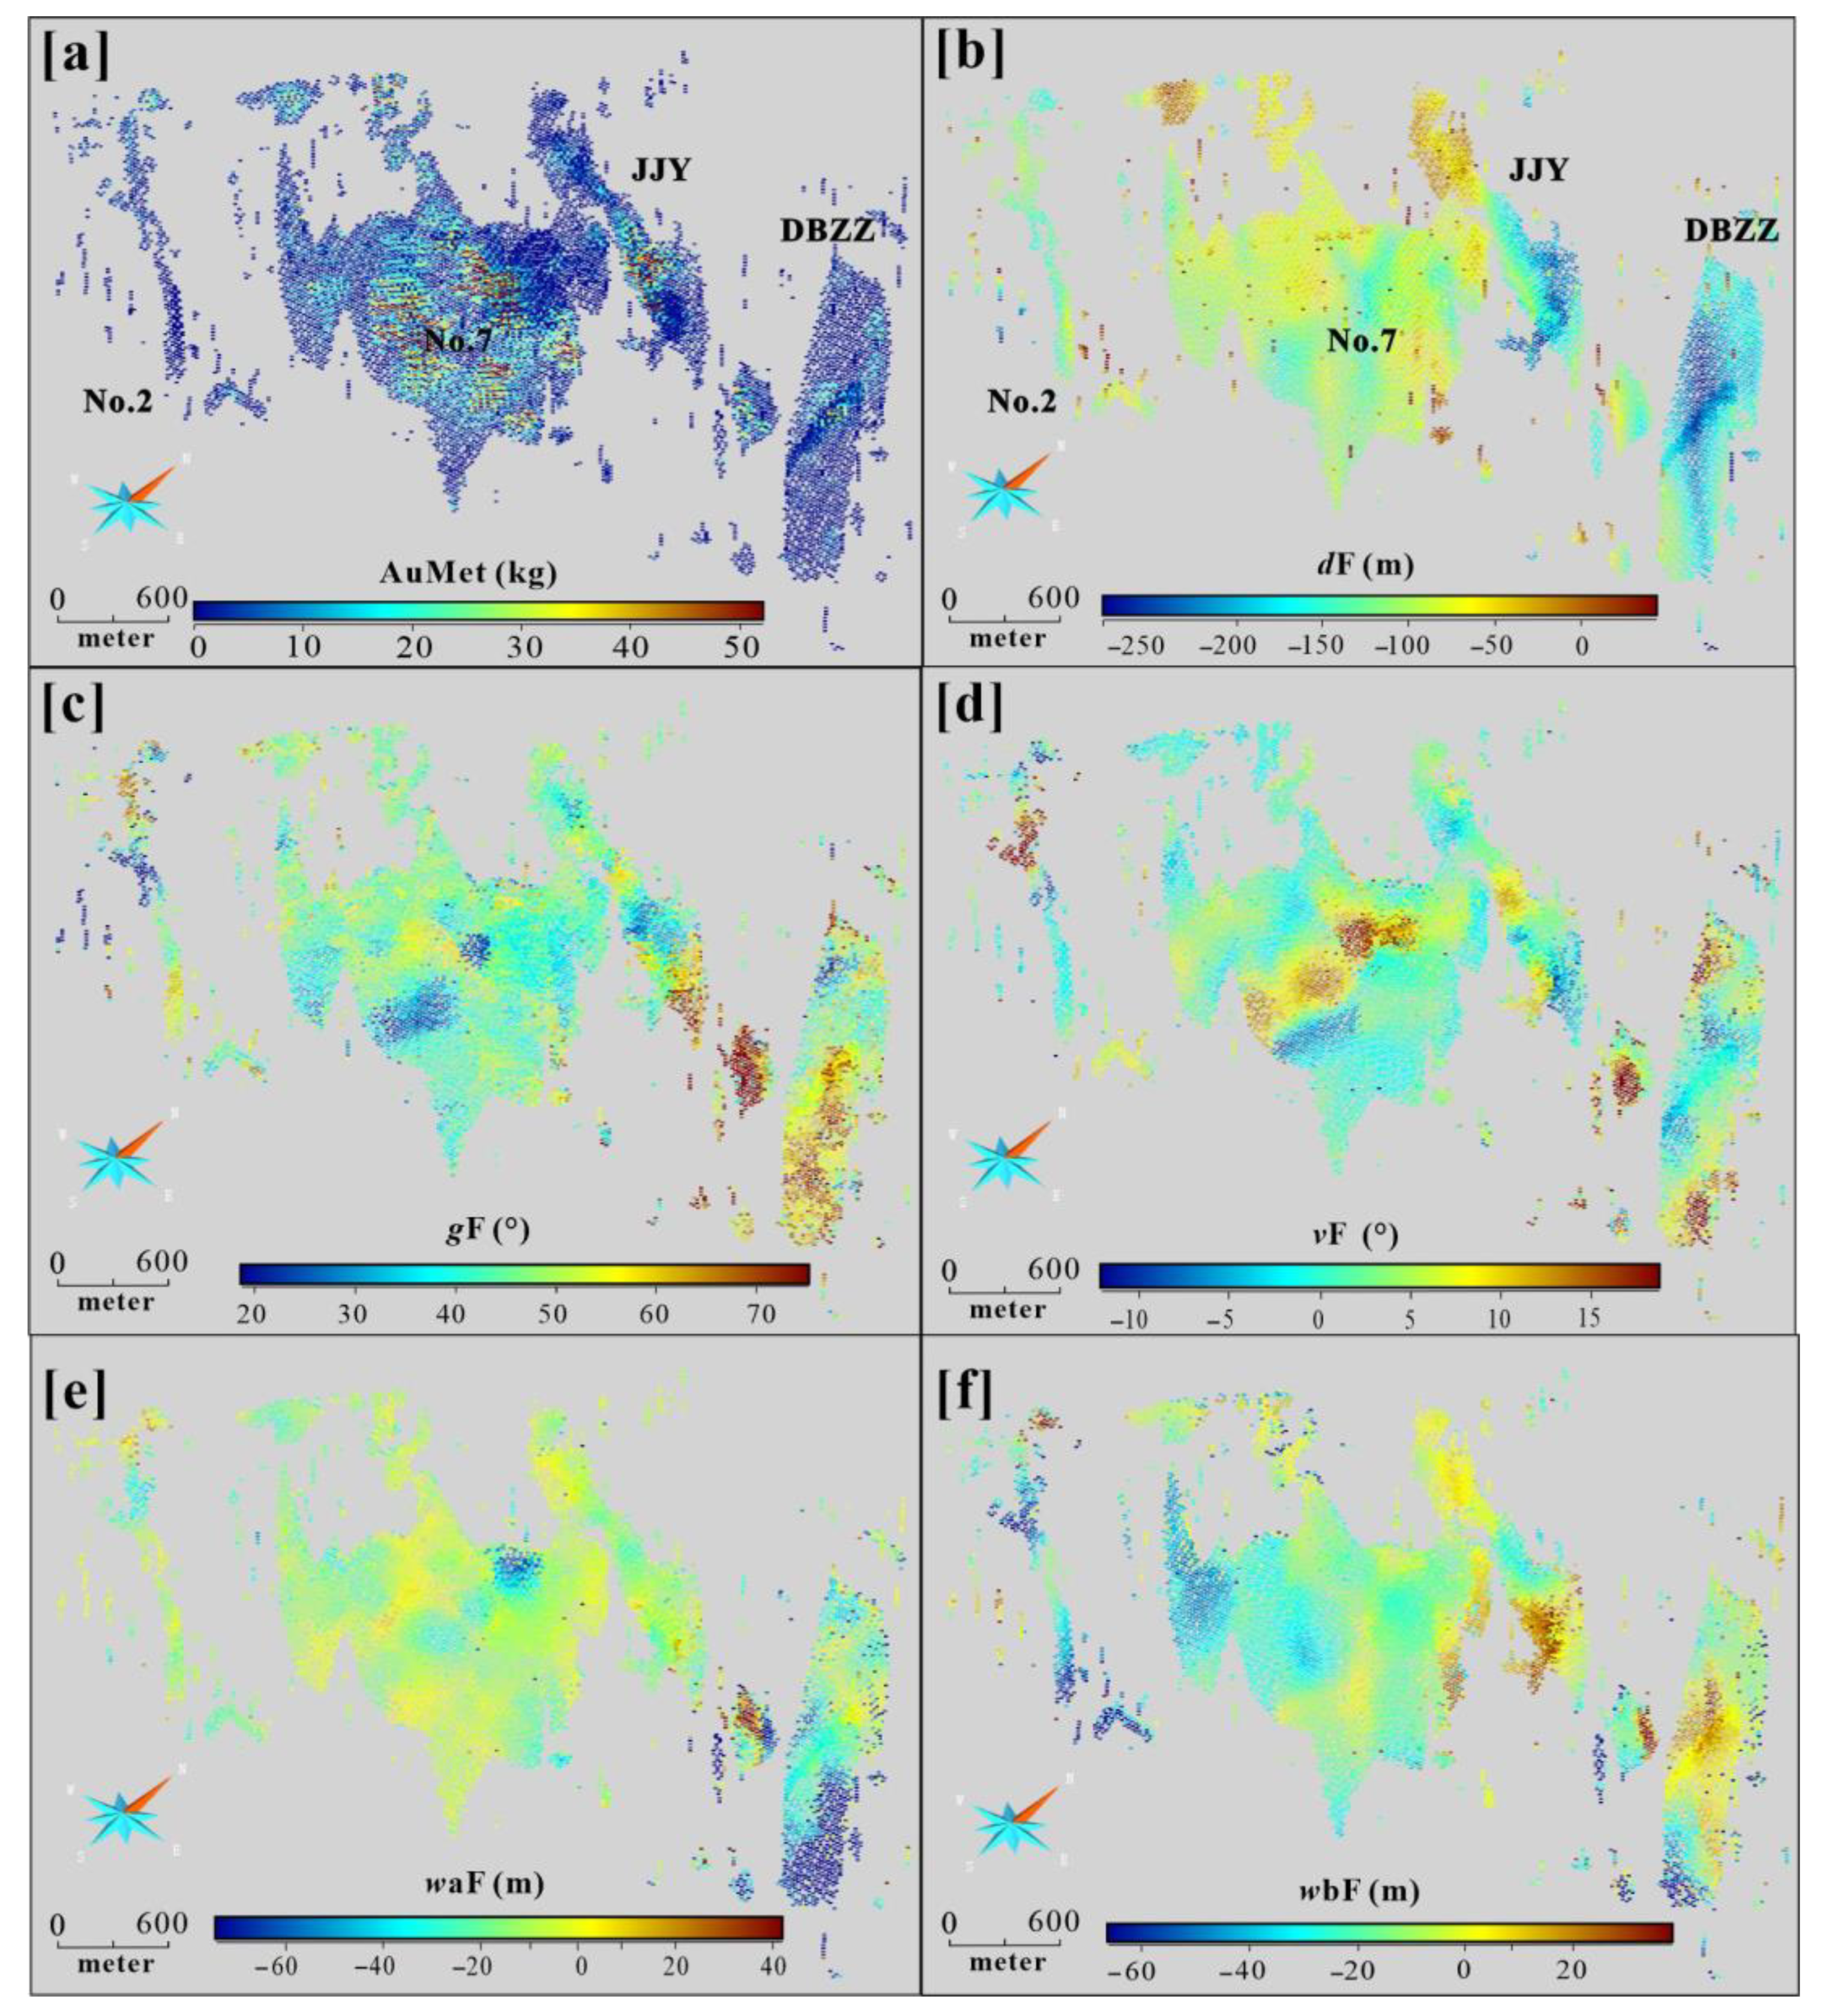
4.1. Model and Feature Visualization

The models show the gold orebodies in the Xiadian district are distributed unevenly, consisting of several Au enrichment segments, of which No. 7 is the largest gold orebody and others have a long-lensed feature (Figure 7a). The general dip of gold mineralization is weakly variable (~45°), but there is a notable increase in thickness at depths ranging from −500 m to −1300 m compared to the shallow and deep regions. Additionally, there are downward branches from the main gold zone at deep, displaying a gradual decrease in gold mineralization density. The statistics of Au grade of voxels, including drill holes, show the voxels of high Au grade (>4 g/t) occupy a small proportion and are distributed irregularly in the No. 5 and JJY orebodies. The majority of voxels exhibit low gold grades, ranging from 0 to 3 g/t (Figure 7b).
The Zhaoping fault model entirety presents the fault spatial features in a 3D view, making it easier to understand the mineralization location association with the fault geometry. The models reveal that the Zhaoping fault has many local undulations that company variations in both dip and strike (Figure 7c). These geometric features play a significant role in controlling ore body formation, particularly evident in the segments of the deep No. 7 and the shallow DBZZ, where both orebodies pinch out, and substantial transitions in fault shape (Figure 7c). On a larger scale, the boundaries of No. 7 orebodies are often characterized by fault dip or strike variations, while the areas near the inner parts of the orebodies show inconspicuous changes in geometry.
To better elucidate the complicated controls of fault geometry variation on mineralization, we present the orebody model with attributes of fault features and their quantitative correlation with gold mineralization (Figure 8 and Figure 9). The results highlight the models with a heterogeneous distribution of the effects of fault features (Figure 8) and the correlation is nonlinear (Figure 9). The distance between ore and fault generally ranges from 50 to −300 m, with a majority falling within −200 to 0 m, consistent with the footwall distribution characteristics. Overall, the No. 7 including high ore-bearing units is situated closer to the fault than (No. 2, JJY and DBZZ; Figure 8a and Figure 9a). Gold is widely distributed in the ranges of fault dip, but mostly in the dips from 30° to 60° (Figure 9b). The large fault dip occurs in the deep segments of JJY and DBZZ where ore branching occurs. The fault dip changes are generally variable near 0 with a SE-plunging distribution feature (Figure 8d and Figure 9c). The high degree (>10°) of dip variation is all positive, reaching up to 40°, which also influences the formation of high ore-bearing bodies. This means the fault from gentle to steep can promote the formation of high-grade ore, which supports the vein ore affinity to deep fractures. Notably, the locally consistent distribution of fault dip and orebodies (e.g., No. 7 center, JJY and DBZZ) well supports the model of fault geometry controls on gold (Figure 4). The presence of two scales of fault undulation reveals the main ore voxels are confined to areas with negative (convex parts; Figure 8e,f and Figure 9d,e), with no presence of very large fault undulations, which aligns with gentle feature observed (Figure 7c). Overall, the geometric features of the Zhaoping fault aptly reflect the structural controls on gold pattern of ore-forming model (Figure 4). Thus, they can be selected as predictive variables for gold prospectivity modeling.

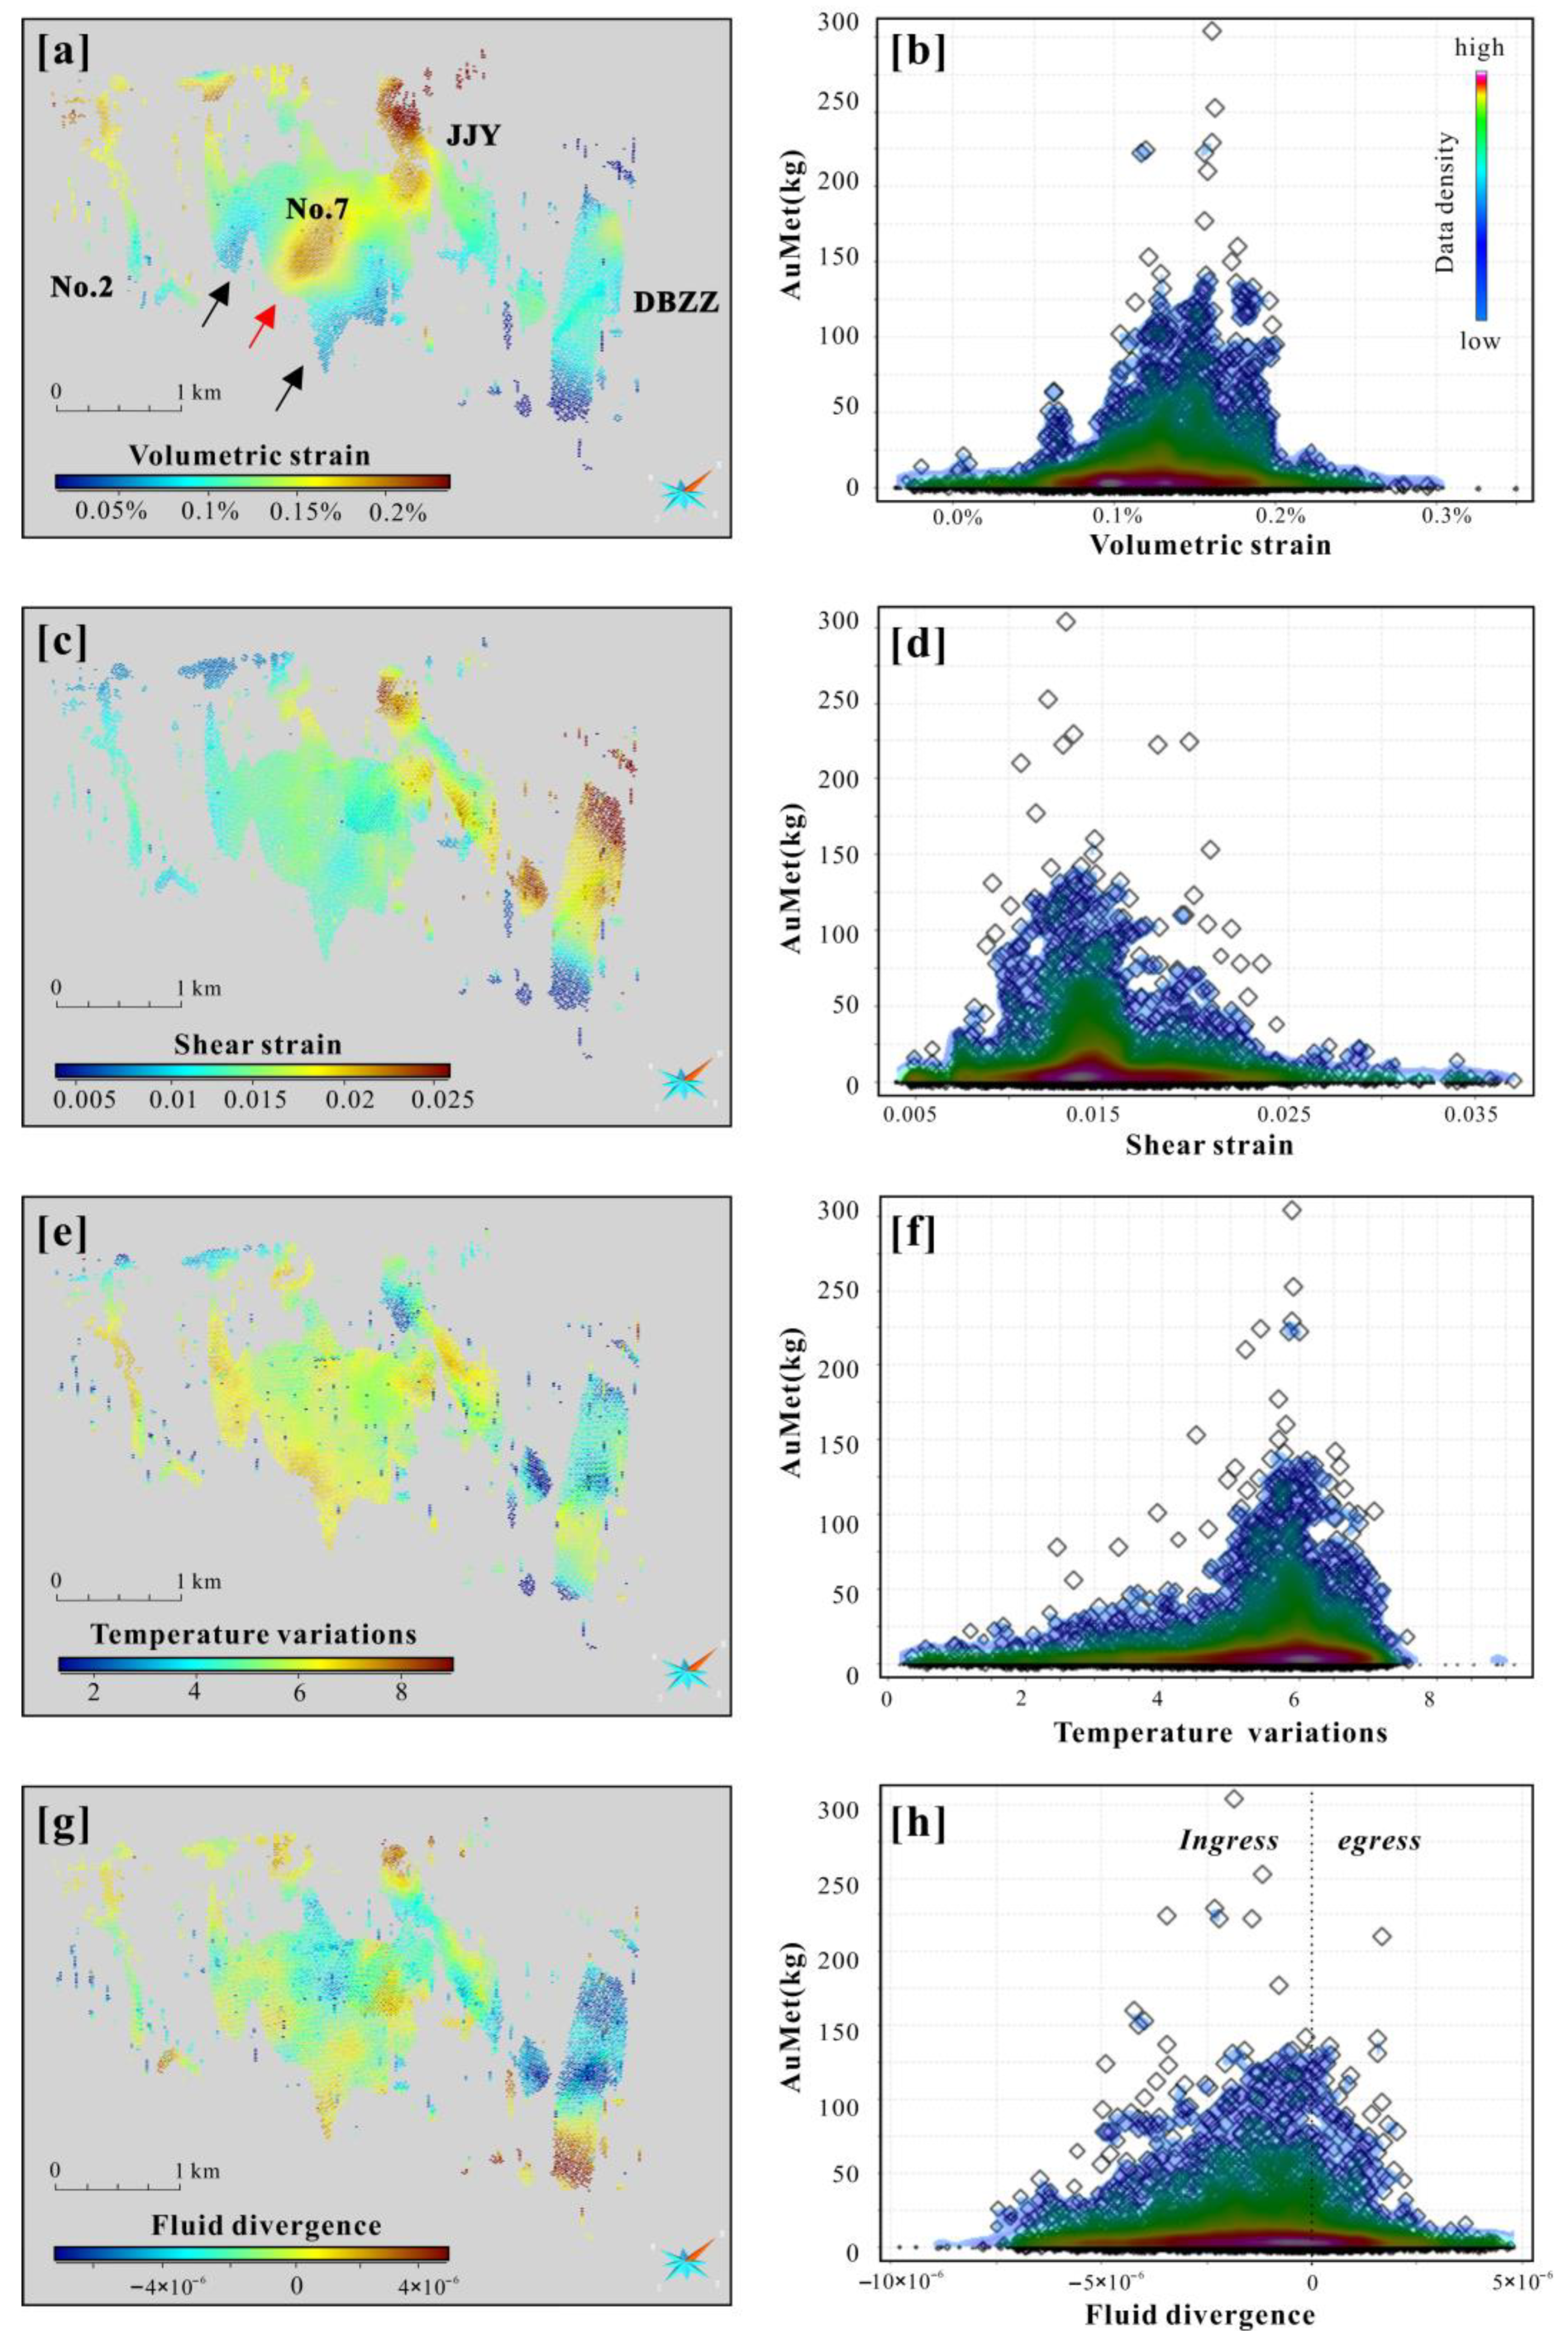
4.2. Ore-Forming Simulation Results

The ore-forming computational simulation provides a series of parameters related to structure deformation, stress, heat, and fluid flow, which record the geodynamic conditions contributing to mineralization. Based on the proposed metallogenic model of the Xiadian and other Jiaodong gold deposits, we have chosen to focus on four critical parameters: volumetric strain, shear strain, temperature variation, and fluid divergence, to discuss the geodynamic controls on gold deposition (Figure 10). The reasons for selecting these parameters are (1) volumetric strain is related to the rock dilation or shrinkage and commonly used in understanding orebody localization in structure–hydrothermal systems, (2) shear strain reflects the shear or tensile failure degree in the strike-slip fault systems, which is relevant to the gold mineralization process, (3) temperature variation can impact the stability of gold complexes and consequently control gold deposition, and (4) fluid divergence denotes the ingress or egress of fluids in one voxel during ore-forming stage, which is crucial for understanding fluid movement during mineralization. The volumetric strain and shear strain are directly obtained by FLAC3D, while temperature variation and fluid divergence are calculated using the Sobel operator. Here, the absolute values of temperature variation are used and the negative fluid divergence represents the fluid ingress into a voxel, while positive values represent fluid egress. Although all these indices are related to gold mineralization, we have singled out volumetric strain as a key indicator to validate the modeling results by following the strategies of previous studies [13,45,49,50,99,100]. This choice is driven by the fact that gold mineralization zones are always distinct to the surrounding rocks (non-mineralized areas) in the volumetric strain.
The simulation results show that the known gold orebodies in Xiadian are generally consistent with the distribution of high volumetric strain, moderate shear strain, high temperature variation, and negative fluid divergence (Figure 10). Specifically, a majority of Au-bearing voxels are concentrated within the volumetric strain range of 0.1% to 0.2%, and very minor units (shallow JJY) exhibit volumetric strain exceeding 0.2% (Figure 10a,b). This observation suggests that auriferous fluids tend to preferentially flow into areas characterized by relatively high dilation (permeability improved, tectonic stress releasing). But the low dilatation and extremely high dilatation may have limited ability of fluid transporting or trapping, respectively, resulting in the weak mineralization. This is also evidenced by the close association between thick gold orebodies and interval distribution of high and low dilatations in the No. 7 orebodies (Figure 10a). This distribution pattern of gold and volumetric strain underscores the combined influence of dilation and shrinkage as controlling factors in the ore-forming processes.
The shear strain presents a similar correlation with gold amounts as volumetric strain (Figure 10c,d). Most Au-bearing units have a shear strain from 0.01 to 0.02. Overall, the JJY and DBZZ have higher shear strain values than No. 2 and 7 orebodies, which is reflected in the bimodal distribution characteristic in Figure 10d. Notably, the areas of JJY and DBZZ occur the strike changes of the Zhaoping fault, displaying an eastward-bending feature (Figure 7c). Given that the Zhaoping fault underwent a dextral strike-slip deformation during the mineralization period, such variations in the strike would accelerate shear strain, resulting in a local, high strain accumulation. This may influence the distinct ore-shooting features at JJY (NE-plunging) and DBZZ (SE-plunging).
Temperature variation exhibits a noteworthy correlation with gold mineralization that most ore-bearing units occur the high temperature variations (Figure 10e) and the No. 7 orebody occurs slightly higher temperature changes than others. This suggests the gold deposition is at least partly influenced by temperature variation. However, we noticed that non-ore units can also undergo similar, high temperature changes (Figure 10e,f). Thus, gold-mineralization is most likely controlled by multiple factors at Xiadian, of which pressure fluctuation and water–rock interaction (i.e., sulfidation) have been recognized as important ore-forming mechanisms [57,63,65,66,101].
The fluid divergence records the fluid flow process in individual voxels. The voxels in the Xiadian gold deposits exhibit a wide range of fluid divergence and most of them (approximately 82%, 73 t) occur the ingress fluid flow (negative fluid divergence) (Figure 10g,h). Nevertheless, there are still some voxels with high gold contents and positive fluid divergence that appear to be irregularly distributed in space. We tentatively infer that while the fluid divergence indicates fluid flux characteristic, the orogenic gold deposit formed in an open structural–hydrothermal system in which fluid ingress and egress are common but not directly equivalent to gold precipitation or dissolution. Consequently, the relationship between fluid divergence and gold mineralization is complex.
In summary, the geodynamic indices of mineralization demonstrate a significant correlation with gold distribution and provide different controls on mineralization compared to fault geometry. Therefore, these indicators can be reasonably utilized as predictor variables for exploration.

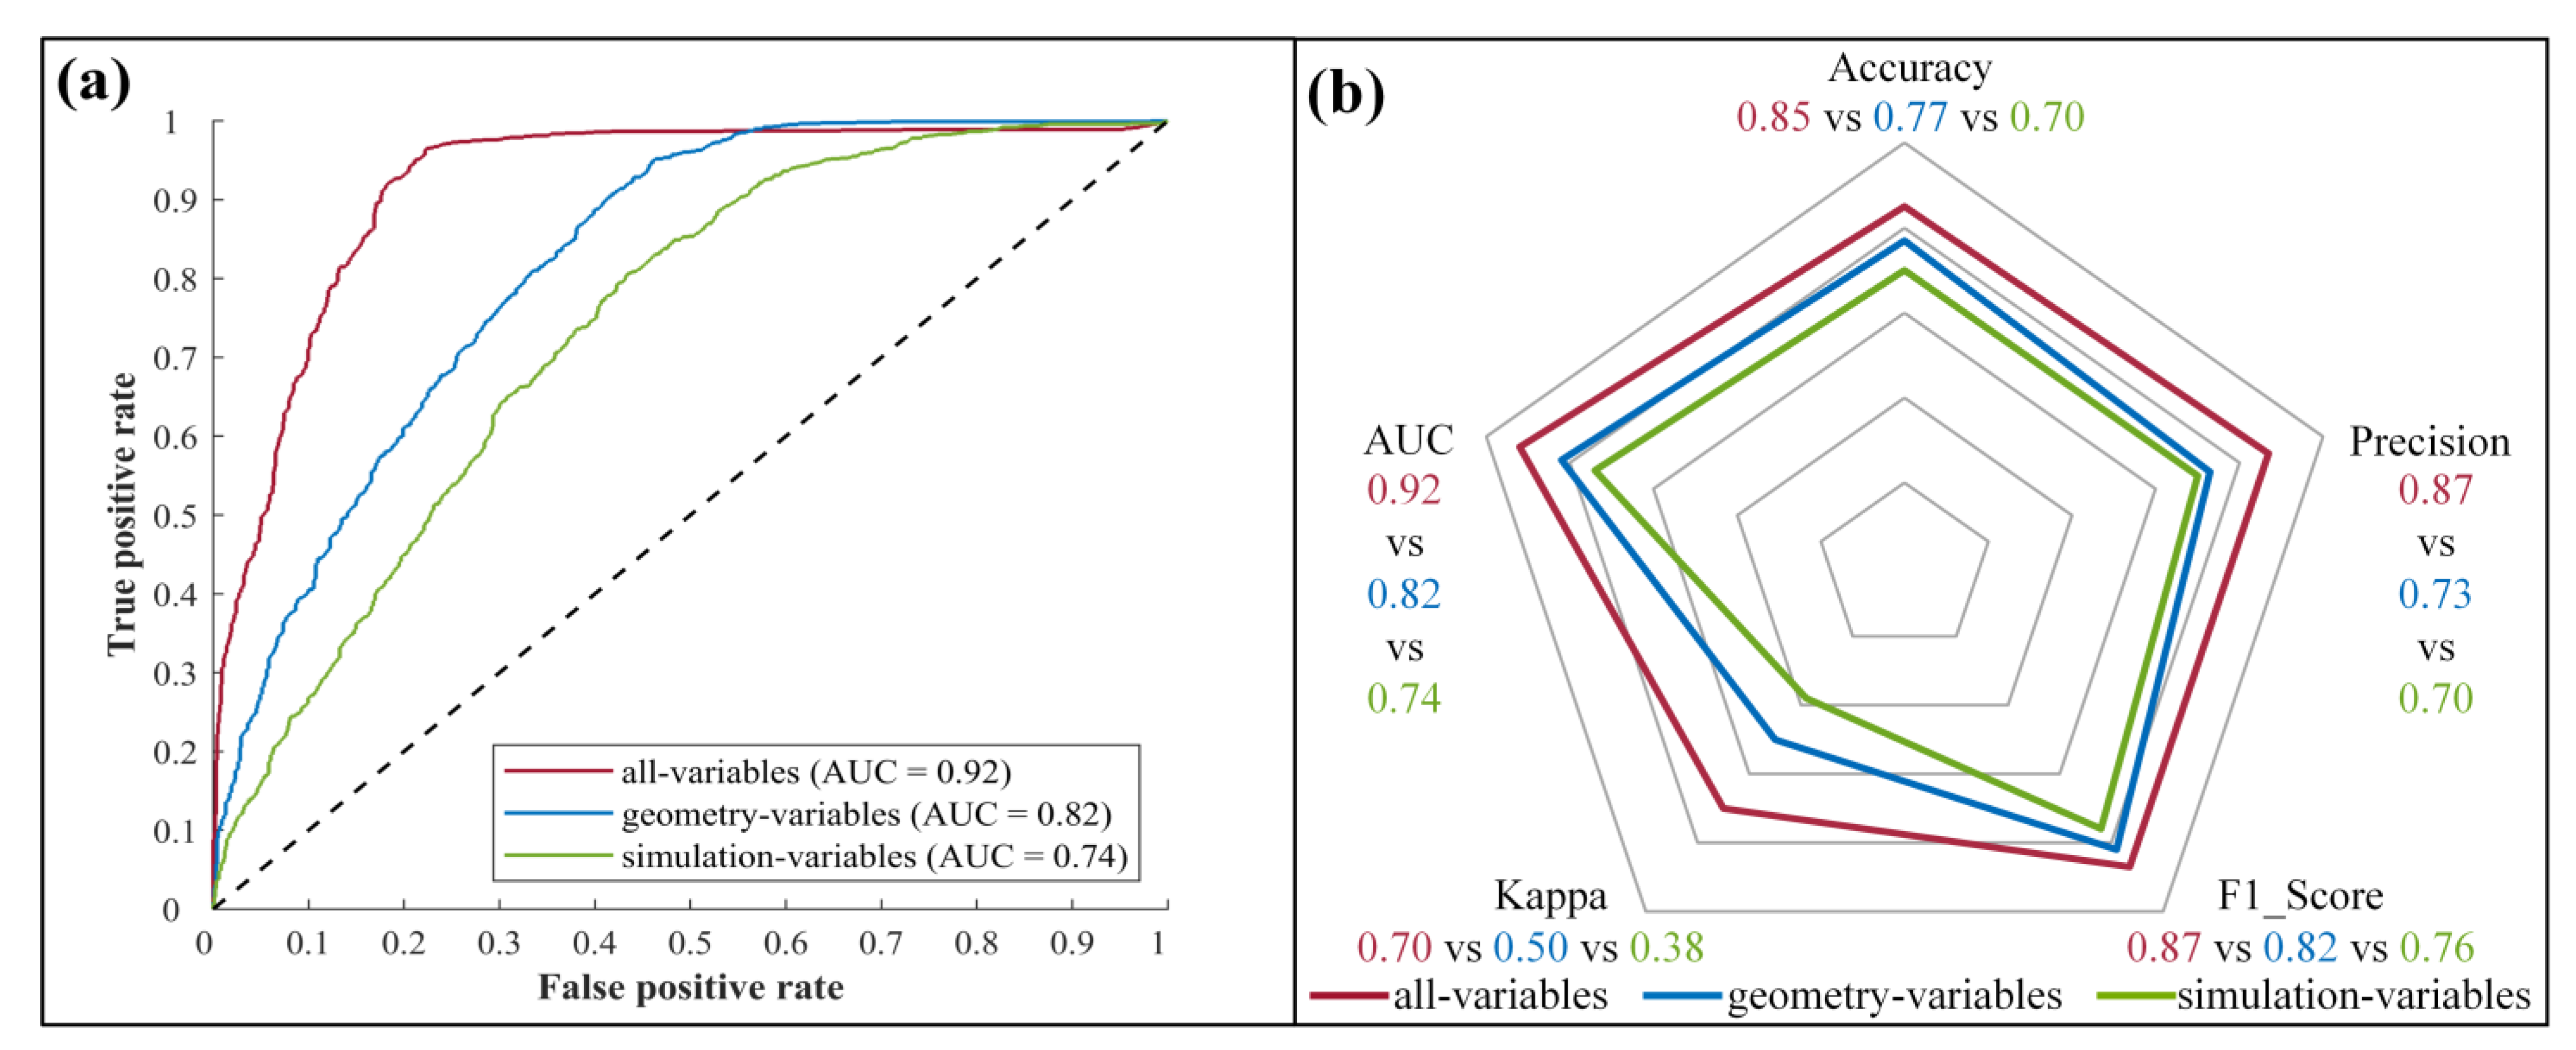
4.3. Model Comparison

In this study, we conducted three experiments of prospectivity modeling using different sets of variables: (1) all variables, (2) only geometry variables, and (3) only geodynamic variables (simulation variables). To assess the impact of these variable sets on prospectivity modeling, we evaluated the regression and classification performance of three predictive models using various metrics. The regression model is conducted based on the gold amounts in each voxel. Table 3 presents performance comparisons of these regression models, encompassing error metrics (MAE, MSE, and RMSE) and correlation metrics (R and R2). The outcomes indicate that the all-variable model displays the least error (MAE of 2.74, MSE of 41.60, and RMSE of 6.45) in contrast to the geometry and simulation variable models. In terms of correlation, the regression results of the all-variable model exhibit the highest significance (R of 0.92 and R2 of 0.85) when compared to actual gold amounts. This is followed by the geometry variable model (R of 0.79 and R2 of 0.62), whereas the simulation variable model shows the lowest significance (R of 0.74 and R2 of 0.55).
In the assessment of classification performance, we used the receiver operating characteristic (ROC) curve [102], the area under the ROC curve (AUC), accuracy, precision, F1_score and kappa. The shape of the ROC curves reflects the predictive performance, and a curve that is convex towards the upper-left corner indicates better model performance. The AUC is a quantitative parameter of a ROC curve, similar to the other four metrics, where values closer to 1 indicate better model performance. Figure 11 illustrates the ROC curves and calculation of AUC, accuracy, precision, F1_score and kappa. Our findings reveal that the performance of the model incorporating all variable sets (red line) demonstrates significantly better performance than the two models based on individual variable sets, with the largest AUC (0.92), accuracy (0.85), precision (0.87), F1_source (0.87) and kappa (0.7; Figure 11). Besides, the geometry variable model (marked by the blue line) presents superior predictive capability than the simulation variable model (marked by the green line) but is not remarkable (AUC: 0.82 vs. 0.74; accuracy: 0.77 vs. 0.70; precision: 0.73 vs. 0.70; F1_source: 0.82 vs. 0.76; kappa: 0.50 vs. 0.38).
Furthermore, we used some reserved areas that are detected by drill holes to verify the generalization ability of three prospectivity modes (Figure 12). The results reveal that prospectivity models utilizing only single geometric or geodynamic variables yield the wrong prediction at depth (Figure 12; green arrow), while the model using all variables performs satisfactorily. These findings suggest that: (1) the geometry variables are more advantageous in indicating mineralization distribution compared to simulation variables; (2) the combination of the two variable sets dramatically enhances the model’s performance; in other words, the incorporation of simulation-related variables allows the prospectivity model to more comprehensively represent the quantitative associations between gold mineralization and its controls factors. This improvement is likely attributed to the input of key information about fluid flow and the ore-forming environment. Hence, we recommend using the 3D prospectivity model with joint geometric and geodynamic variables to identify potential gold mineralization at Xiadian.

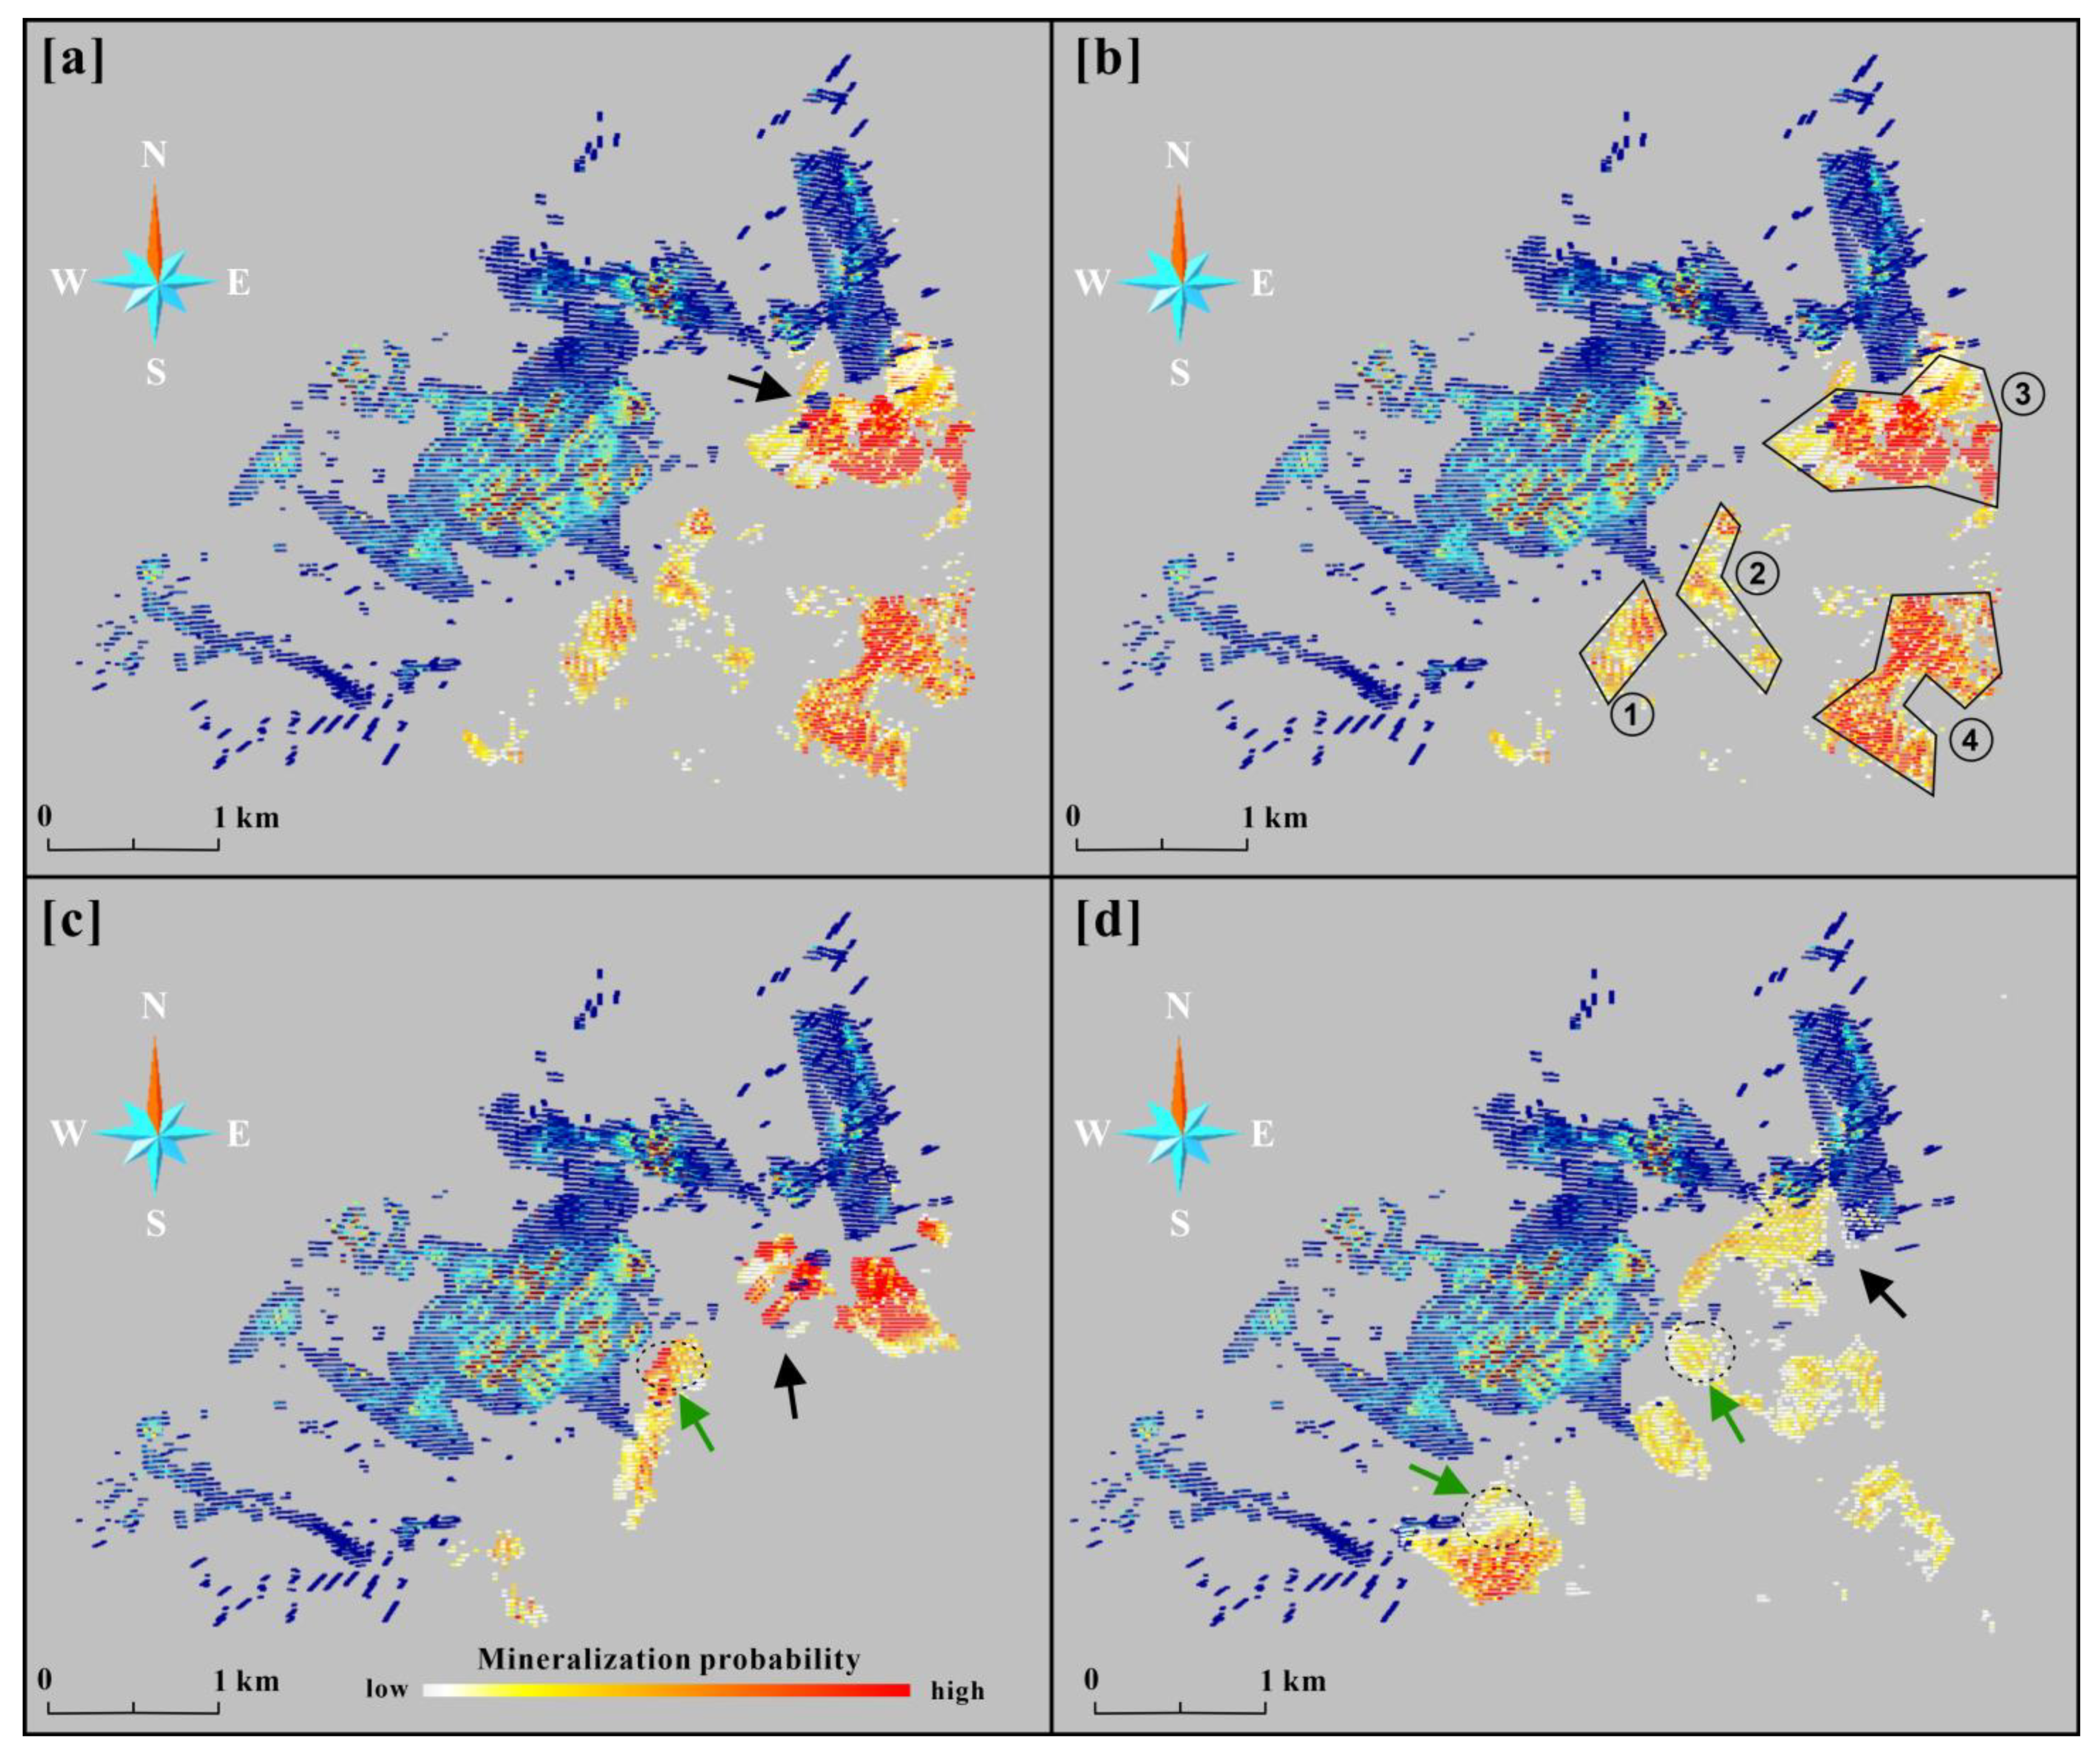
4.4. Target Appraisal

Based on the prospectivity modeling results, we determined four gold exploration targets in the Xiadian gold deposit (Figure 12b), which may contribute to effective decision-making in next mineral exploration endeavors. Targets ① and ②, located in the depth of No. 7 orebody with elevations ranging from −1300 to −1700 m, are generally continuously along the known orebody. This is consistent with the common spatially continuous fluid flow pathways. Target ③ is sited in the deep regions of JJY and DBZZ, displaying the highest mineralization probability and the largest potential areas in all targets. It has an elevation of −2000 to −2500 m. The target contains some known mineralization determined by drill holes and is located to NE and SE stretching farther along the JJY and DBZZ orebodies. It mostly likely represents the branch of the known orebody. Target ④ with elevations of −2200 to −2500 m also has a very high mineralization potential. It is uncontinous with known mineralization or other prediction areas and likely presents a new, concealed gold enrichment zone, which existence possibility has been proven in other gold belts [56,103,104]. The details of target location are listed in the Table S1.

5. Conclusions

In this study, the 3D prospectivity modeling with incorporating spatial analysis data and ore-forming computational simulation data through Bayesian decomposition modeling was conducted in the Xiadian orogenic gold deposit. The results of spatial analysis of the ore-controlling Zhaoping fault find its significant influence on ore shooting or branching, which is primarily driven by variations in fault dip or strike. Most gold mineralization tends to concentrate in the convex areas of the fault zone. The numerical modeling results demonstrate that gold mineralization at Xiadian is closely linked to high rock permeability, but its localization is also influenced by the combination of dilation and shrinkage. Using multiple statistic examinations, this approach is proved to outperform traditional prospectivity modeling methods, likely due to the more systematic incorporation of predictor variables that encompass spatial and geodynamic ore controls information. The proposed 3D prospectivity modeling has successfully identified four gold targets in the Xiadian district. Among these targets, the depth of Jiangjiayao and Daobeizhuangzi orebodies exhibits the highest potential, likely indicating the presence of ore branching. Additionally, the No. 7 orebody at depth is anticipated to potentially host concealed gold mineralization.
While the 3D prospectivity modeling approach is promising to be applied in the mineral exploration of various deposits, it is still limited in the aspects that (1) there is no geochemical and geophysical data directly related to deep possible mineralization as prediction variables, and (2) the ore-forming simulation validation can be further improved to decrease the uncertainty and bias, like [86,87,88]. In the future, we will (1) contact the Xiadian gold mine to verify these targets by drillholes, (2) integrate the geochemical and geophysical variables into the prospectivity modeling using the Bayesian decomposition model and deep learning techniques, and (3) develop an automatic optimization method for ore-forming simulations to enhance result reliability.

Supplementary Materials

The following supporting information can be downloaded at: https://www.mdpi.com/article/10.3390/app131810277/s1, Table S1: The detailed coordinates of controls point for gold targets at Xiadian.

Author Contributions

Conceptualization, Z.L. and J.W.; methodology, Z.L., J.W., W.S. and H.Z.; software, W.S. and Z.G.; investigation, Z.L. and Y.C.; resources, R.W.; data curation, R.W. and J.C.; writing—original draft preparation, Z.L., Z.G. and J.W.; writing—review and editing, R.W., H.D. and X.M.; supervision, J.C. and X.M.; project administration, Z.L. and X.M. All authors have read and agreed to the published version of the manuscript.

Funding

This study was supported by projects of National Natural Science Foundation of China (42030809 and 42202332), Natural Science Foundation of Hunan Province (2023JJ40715), and the science and technology innovation Program of Hunan Province (2021RC4055).

Institutional Review Board Statement

Not applicable.

Informed Consent Statement

Not applicable.

Data Availability Statement

The authors do not have permission to share data.

Acknowledgments

Peijie Du, Shoulei Li, Haibin Yang, Zhengkai Fu, Yunjia Sun and Jia Sun are thanked for their assistance during field work.

Conflicts of Interest

The authors declare no conflict of interest.

References

  1. Vearncombe, J.R.; Phillips, G.N. The importance of brownfields gold exploration. Miner. Depos. 2019, 55, 189–196. [Google Scholar] [CrossRef]
  2. McCuaig, T.C.; Beresford, S.; Hronsky, J. Translating the mineral systems approach into an effective exploration targeting system. Ore Geol. Rev. 2010, 38, 128–138. [Google Scholar] [CrossRef]
  3. Hagemann, S.G.; Lisitsin, V.A.; Huston, D.L. Mineral system analysis: Quo vadis. Ore Geol. Rev. 2016, 76, 504–522. [Google Scholar] [CrossRef]
  4. Wyman, D.A.; Cassidy, K.F.; Hollings, P. Orogenic gold and the mineral systems approach: Resolving fact, fiction and fantasy. Ore Geol. Rev. 2016, 78, 322–335. [Google Scholar] [CrossRef]
  5. Ford, A.; Peters, K.J.; Partington, G.A.; Blevin, P.L.; Downes, P.M.; Fitzherbert, J.A.; Greenfield, J.E. Translating expressions of intrusion-related mineral systems into mappable spatial proxies for mineral potential mapping: Case studies from the Southern New England Orogen, Australia. Ore Geol. Rev. 2019, 111, 102943. [Google Scholar] [CrossRef]
  6. Carranza, E.J.M.; Laborte, A.G. Random forest predictive modeling of mineral prospectivity with small number of prospects and data with missing values in Abra (Philippines). Comput. Geosci. 2015, 74, 60–70. [Google Scholar] [CrossRef]
  7. Rodriguez-Galiano, V.; Sanchez-Castillo, M.; Chica-Olmo, M.; Chica-Rivas, M. Machine learning predictive models for mineral prospectivity: An evaluation of neural networks, random forest, regression trees and support vector machines. Ore Geol. Rev. 2015, 71, 804–818. [Google Scholar] [CrossRef]
  8. Yousefi, M.; Nykänen, V. Data-driven logistic-based weighting of geochemical and geological evidence layers in mineral prospectivity mapping. J. Geochem. Explor. 2016, 164, 94–106. [Google Scholar] [CrossRef]
  9. Zhang, N.; Zhou, K.; Du, X. Application of fuzzy logic and fuzzy AHP to mineral prospectivity mapping of porphyry and hydrothermal vein copper deposits in the Dananhu-Tousuquan island arc, Xinjiang, NW China. J. Afr. Earth Sci. 2017, 128, 84–96. [Google Scholar] [CrossRef]
  10. Li, B.; Liu, B.; Guo, K.; Li, C.; Wang, B. Application of a Maximum Entropy Model for Mineral Prospectivity Maps. Minerals 2019, 9, 556. [Google Scholar] [CrossRef]
  11. Wang, J.; Zuo, R.; Xiong, Y. Mapping Mineral Prospectivity via Semi-supervised Random Forest. Nat. Resour. Res. 2019, 29, 189–202. [Google Scholar] [CrossRef]
  12. Li, X.; Yuan, F.; Zhang, M.; Jia, C.; Jowitt, S.M.; Ord, A.; Zheng, T.; Hu, X.; Li, Y. Three-dimensional mineral prospectivity modeling for targeting of concealed mineralization within the Zhonggu iron orefield, Ningwu Basin, China. Ore Geol. Rev. 2015, 71, 633–654. [Google Scholar] [CrossRef]
  13. Liu, L.; Li, J.; Zhou, R.; Sun, T. 3D modeling of the porphyry-related Dawangding gold deposit in south China: Implications for ore genesis and resources evaluation. J. Geochem. Explor. 2016, 164, 164–185. [Google Scholar] [CrossRef]
  14. Mao, X.; Ren, J.; Liu, Z.; Chen, J.; Tang, L.; Deng, H.; Bayless, R.C.; Yang, B.; Wang, M.; Liu, C. Three-dimensional prospectivity modeling of the Jiaojia-type gold deposit, Jiaodong Peninsula, Eastern China: A case study of the Dayingezhuang deposit. J. Geochem. Explor. 2019, 203, 27–44. [Google Scholar] [CrossRef]
  15. Chen, J.; Mao, X.; Deng, H.; Liu, Z.; Wang, Q. Three-dimensional modelling of alteration zones based on geochemical exploration data: An interpretable machine-learning approach via generalized additive models. Appl. Geochem. 2020, 123, 104781. [Google Scholar] [CrossRef]
  16. Malehmir, A.; Thunehed, H.; Tryggvason, A. The Paleoproterozoic Kristineberg mining area, northern Sweden: Results from integrated 3D geophysical and geologic modeling, and implications for targeting ore deposits. Geophysics 2009, 74, B9–B22. [Google Scholar] [CrossRef]
  17. Li, W.; Qian, J.; Li, Y. Joint inversion of surface and borehole magnetic data: A level-set approach. Geophysics 2020, 85, J15–J32. [Google Scholar] [CrossRef]
  18. Li, W.; Lu, W.; Qian, J. A level-set method for imaging salt structures using gravity data. Geophysics 2016, 81, G27–G40. [Google Scholar] [CrossRef]
  19. Wang, J.; Mao, X.; Peng, C.; Chen, J.; Deng, H.; Liu, Z.; Wang, W.; Fu, Z.; Wang, C. Three-dimensional refined modelling of deep structures by using the level set method: Application to the Zhaoping detachment fault, Jiaodong Peninsula, China. Math. Geosci. 2023, 55, 229–262. [Google Scholar] [CrossRef]
  20. Nykänen, V.; Ojala, V.J. Spatial Analysis Techniques as Successful Mineral-Potential Mapping Tools for Orogenic Gold Deposits in the Northern Fennoscandian Shield, Finland. Nat. Resour. Res. 2007, 16, 85–92. [Google Scholar] [CrossRef]
  21. Lu, Y.; Liu, L.; Xu, G. Constraints of deep crustal structures on large deposits in the Cloncurry district, Australia: Evidence from spatial analysis. Ore Geol. Rev. 2016, 79, 316–331. [Google Scholar] [CrossRef]
  22. Haddad-Martim, P.M.; Souza Filho, C.R.d.; Carranza, E.J.M. Spatial analysis of mineral deposit distribution: A review of methods and implications for structural controls on iron oxide-copper-gold mineralization in Carajás, Brazil. Ore Geol. Rev. 2017, 81, 230–244. [Google Scholar] [CrossRef]
  23. Parsa, M.; Maghsoudi, A.; Yousefi, M. Spatial analyses of exploration evidence data to model skarn-type copper prospectivity in the Varzaghan district, NW Iran. Ore Geol. Rev. 2018, 92, 97–112. [Google Scholar] [CrossRef]
  24. Nguemhe Fils, S.C.; Mimba, M.E.; Nyeck, B.; Nforba, M.T.; Kankeu, B.; Njandjock Nouck, P.; Hell, J.V. GIS-Based Spatial Analysis of Regional-Scale Structural Controls on Gold Mineralization along the Bétaré-Oya Shear Zone, Eastern Cameroon. Nat. Resour. Res. 2020, 29, 3457–3477. [Google Scholar] [CrossRef]
  25. Wang, F.-y.; Mao, X.-c.; Deng, H.; Zhang, B.-y. Manganese potential mapping in western Guangxi-southeastern Yunnan (China) via spatial analysis and modal-adaptive prospectivity modeling. Trans. Nonferrous Met. Soc. China 2020, 30, 1058–1070. [Google Scholar] [CrossRef]
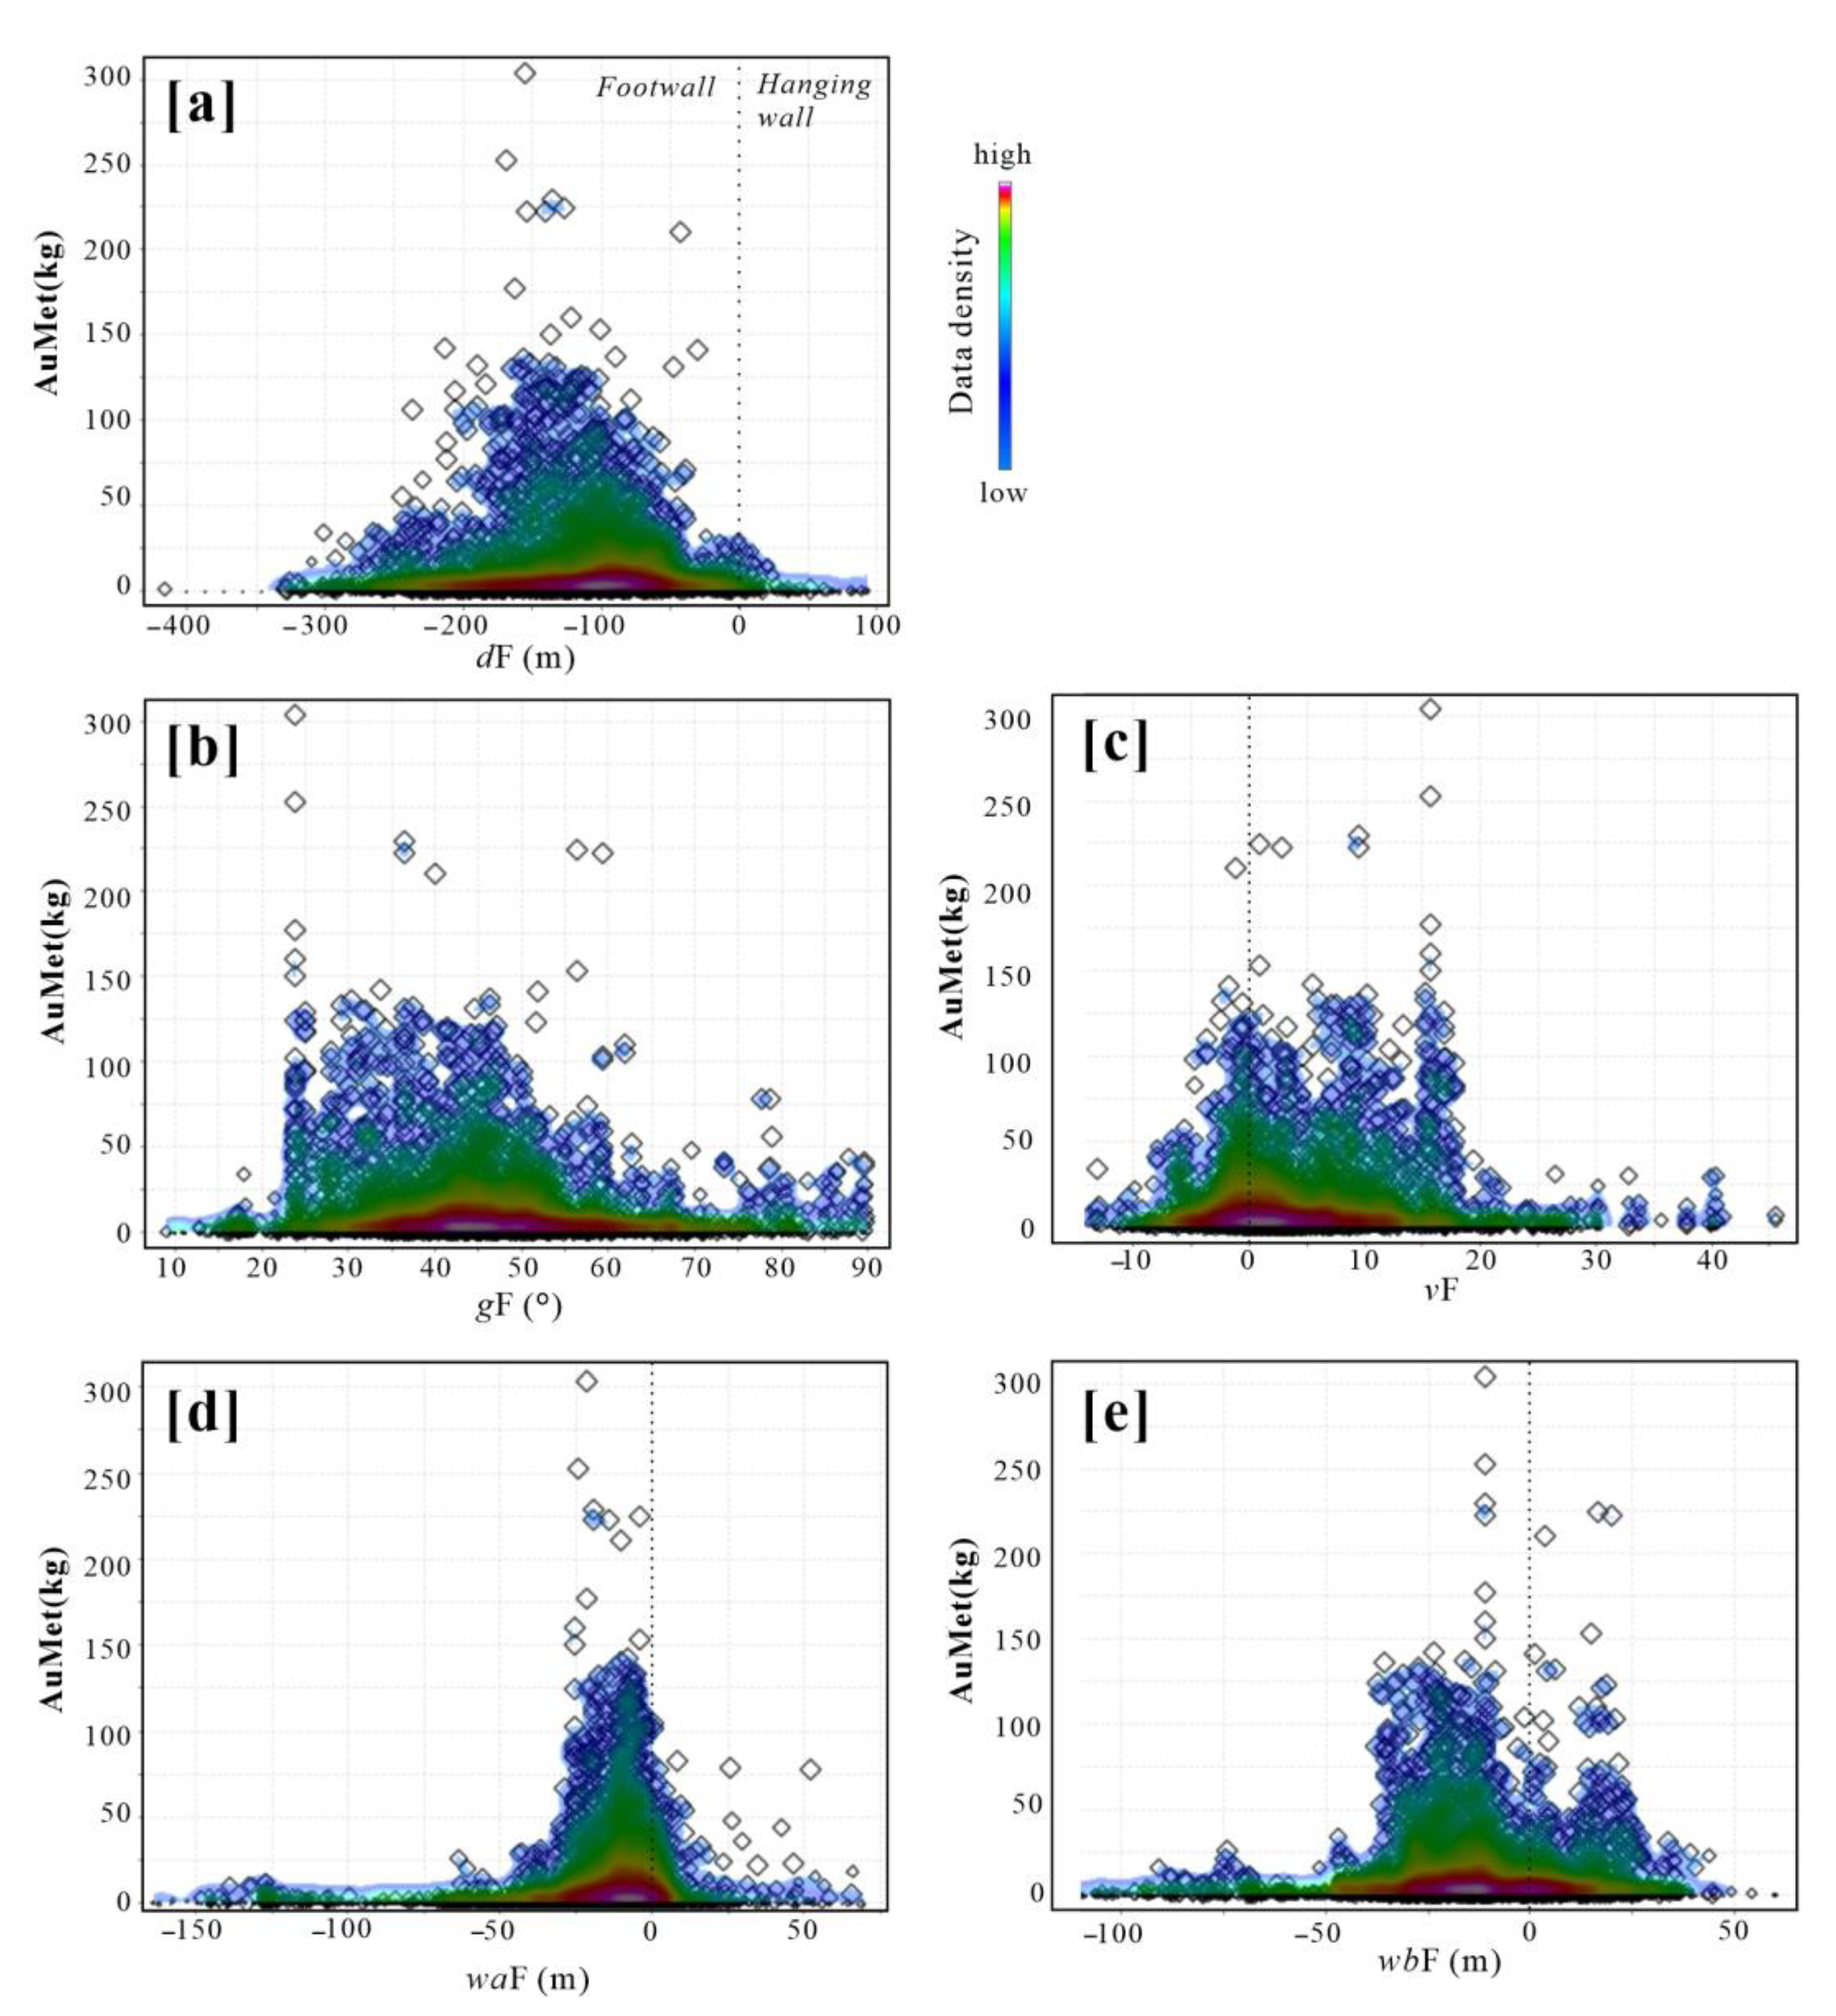
  26. Liu, Z.; Chen, J.; Mao, X.; Tang, L.; Yu, S.; Deng, H.; Wang, J.; Liu, Y.; Li, S.; Bayless, R.C. Spatial association between orogenic gold mineralization and structures revealed by 3D prospectivity modeling: A case study of the Xiadian gold deposit, Jiaodong Peninsula, China. Nat. Resour. Res. 2021, 30, 3987–4007. [Google Scholar] [CrossRef]
  27. Mao, X.; Zhang, W.; Liu, Z.; Ren, J.; Bayless, R.C.; Deng, H. 3D mineral prospectivity modeling for the low-sulfidation epithermal gold deposit: A case study of the Axi gold deposit, Western Tianshan, NW China. Minerals 2020, 10, 233. [Google Scholar] [CrossRef]
  28. Yuan, F.; Li, X.; Zhang, M.; Jowitt, S.M.; Jia, C.; Zheng, T.; Zhou, T. Three-dimensional weights of evidence-based prospectivity modeling: A case study of the Baixiangshan mining area, Ningwu Basin, Middle and Lower Yangtze Metallogenic Belt, China. J. Geochem. Explor. 2014, 145, 82–97. [Google Scholar] [CrossRef]
  29. Li, N.; Bagas, L.; Li, X.; Xiao, K.; Li, Y.; Ying, L.; Song, X. An improved buffer analysis technique for model-based 3D mineral potential mapping and its application. Ore Geol. Rev. 2016, 76, 94–107. [Google Scholar] [CrossRef]
  30. Hu, X.; Yuan, F.; Li, X.; Jowitt, S.M.; Jia, C.; Zhang, M.; Zhou, T. 3D characteristic analysis-based targeting of concealed Kiruna-type Fe oxide-apatite mineralization within the Yangzhuang deposit of the Zhonggu orefield, southern Ningwu volcanic basin, middle-lower Yangtze River metallogenic Belt, China. Ore Geol. Rev. 2018, 92, 240–256. [Google Scholar] [CrossRef]
  31. Barnes, S.J.; Robertson, J.C. Time scales and length scales in magma flow pathways and the origin of magmatic Ni–Cu–PGE ore deposits. Geosci. Front. 2019, 10, 77–87. [Google Scholar] [CrossRef]
  32. Berger, B.R.; Tingley, J.V.; Drew, L.J. Structural localization and origin of compartmentalized fluid flow, Comstock Lode, Virginia City, Nevada. Econ. Geol. 2003, 98, 387–408. [Google Scholar] [CrossRef]
  33. Koegelenberg, C.; Kisters, A.F.M.; Harris, C. Structural controls of fluid flow and gold mineralization in the easternmost parts of the Karagwe-Ankole Belt of north-western Tanzania. Ore Geol. Rev. 2016, 77, 332–349. [Google Scholar] [CrossRef]
  34. Torremans, K.; Kyne, R.; Doyle, R.; Güven, J.F.; Walsh, J.J. Controls on metal distributions at the Lisheen and Silvermines deposits: Insights into fluid flow pathways in Irish-type Zn-Pb deposits. Econ. Geol. 2018, 113, 1455–1477. [Google Scholar] [CrossRef]
  35. Walsh, J.J.; Torremans, K.; Güven, J.; Kyne, R.; Conneally, J.; Bonson, C. Fault-Controlled Fluid Flow Within Extensional Basins and Its Implications for Sedimentary Rock-Hosted Mineral Deposits. In Metals, Minerals, and Society; Society of Economic Geologists: Littleton, CO, USA, 2018. [Google Scholar] [CrossRef]
  36. Chi, G.; Xue, C. An overview of hydrodynamic studies of mineralization. Geosci. Front. 2011, 2, 423–438. [Google Scholar] [CrossRef]
  37. Hobbs, B.; Zhang, Y.; Ord, A.; Zhao, C. Application of coupled deformation, fluid flow, thermal and chemical modelling to predictive mineral exploration. J. Geochem. Explor. 2000, 69, 505–509. [Google Scholar] [CrossRef]
  38. Li, Z.; Chi, G.; Bethune, K.M.; Eldursi, K.; Quirt, D.; Ledru, P.; Thomas, D. Interplay between thermal convection and compressional fault reactivation in the formation of unconformity-related uranium deposits. Miner. Depos. 2021, 56, 1389–1404. [Google Scholar] [CrossRef]
  39. Oliver, N.H.; McLellan, J.G.; Hobbs, B.E.; Cleverley, J.S.; Ord, A.; Feltrin, L. Numerical models of extensional deformation, heat transfer, and fluid flows across basement-cover interfaces during basin-related mineralization. Econ. Geol. 2006, 101, 1–31. [Google Scholar] [CrossRef]
  40. Ord, A.; Hobbs, B.; Zhang, Y.; Broadbent, G.; Brown, M.; Willetts, G.; Sorjonen-Ward, P.; Walshe, J.; Zhao, C. Geodynamic modelling of the century deposit, Mt Isa Province, Queensland. Aust. J. Earth Sci. 2002, 49, 1011–1039. [Google Scholar] [CrossRef]
  41. Zhang, Y.; Lin, G.; Roberts, P.; Ord, A. Numerical modelling of deformation and fluid flow in the Shuikoushan district, Hunan Province, South China. Ore Geol. Rev. 2007, 31, 261–278. [Google Scholar] [CrossRef]
  42. Zhang, Y.; Schaubs, P.; Zhao, C.; Ord, A.; Hobbs, B.; Barnicoat, A. Fault-related dilation, permeability enhancement, fluid flow and mineral precipitation patterns: Numerical models. Geol. Soc. Spec. Publ. 2008, 299, 239–255. [Google Scholar] [CrossRef]
  43. Zhao, C.; Hobbs, B.; Ord, A. Investigating porosity structure effects on hydrothermal mineralization patterns within permeable horizontal layers of fluid-saturated rocks: Semi-analytical approach through generic models. Ore Geol. Rev. 2022, 150, 105116. [Google Scholar] [CrossRef]
  44. Zhao, C.; Reid, L.B.; Regenauer-Lieb, K. Some fundamental issues in computational hydrodynamics of mineralization: A review. J. Geochem. Explor. 2012, 112, 21–34. [Google Scholar] [CrossRef]
  45. Li, Z.; Chi, G.; Bethune, K.M.; David, T.; Gerard, Z. Structural controls on fluid flow during compressional reactivation of basement faults: Insights from numerical modeling for the formation of unconformity-related uranium deposits in the Athabasca Basin, Canada. Econ. Geol. 2017, 112, 451–466. [Google Scholar] [CrossRef]
  46. Li, Z.; Chi, G.; Bethune, K.M.; Eldursi, K.; Quirt, D.; Ledru, P.; Gudmundson, G. Numerical simulation of strain localization and its relationship to formation of the Sue unconformity-related uranium deposits, eastern Athabasca Basin, Canada. Ore Geol. Rev. 2018, 101, 17–31. [Google Scholar] [CrossRef]
  47. Li, Z.; Chi, G.; Bethune, K.M.; Eldursi, K.; Thomas, D.; Quirt, D.; Ledru, P. Synchronous egress and ingress fluid flow related to compressional reactivation of basement faults: The Phoenix and Gryphon uranium deposits, southeastern Athabasca Basin, Saskatchewan, Canada. Miner. Depos. 2018, 53, 277–292. [Google Scholar] [CrossRef]
  48. Hu, X.; Li, X.; Yuan, F.; Ord, A.; Jowitt, S.M.; Li, Y.; Dai, W.; Ye, R.; Zhou, T. Numerical Simulation Based Targeting of the Magushan Skarn Cu–Mo Deposit, Middle-Lower Yangtze Metallogenic Belt, China. Minerals 2019, 9, 558. [Google Scholar] [CrossRef]
  49. Shan, W.; Mao, X.; Liu, Z.; Deng, H.; Tang, L.; Wang, D.; Pan, Y.; Liu, Y. Computational simulation of the ore-forming processes associated with the Sanshandao-Haiyu gold belt, Jiaodong Peninsula, eastern China: Implications for the duration of ore formation. Front. Earth Sci. 2023, 11, 1154945. [Google Scholar] [CrossRef]
  50. Ford, A.; Blenkinsop, T.G.; McLellan, J. Factors affecting fluid flow in strike–slip fault systems: Coupled deformation and fluid flow modelling with application to the western Mount Isa Inlier, Australia. Geofluids 2009, 9, 2–23. [Google Scholar] [CrossRef]
  51. Wilson, C.J.; Osborne, D.J.; Robinson, J.A.; Miller, J.M. Structural constraints and localization of gold mineralization in Leather Jacket Lodes, Ballarat, Victoria, Australia. Econ. Geol. 2016, 111, 1073–1098. [Google Scholar] [CrossRef]
  52. Deng, J.; Yang, L.-Q.; Groves, D.I.; Zhang, L.; Qiu, K.-F.; Wang, Q.-F. An integrated mineral system model for the gold deposits of the giant Jiaodong province, eastern China. Earth Sci. Rev. 2020, 208, 103274. [Google Scholar] [CrossRef]
  53. Goldfarb, R.J.; Santosh, M. The dilemma of the Jiaodong gold deposits: Are they unique? Geosci. Front. 2014, 5, 139–153. [Google Scholar] [CrossRef]
  54. Deng, J.; Yang, L.-Q.; Li, R.-H.; Groves, D.I.; Santosh, M.; Wang, Z.-L.; Sai, S.-X.; Wang, S.-R.; Li, S. Regional structural control on the distribution of world-class gold deposits: An overview from the Giant Jiaodong Gold Province, China. Geol. J. 2019, 54, 378–391. [Google Scholar] [CrossRef]
  55. Guo, L.-N.; Goldfarb, R.J.; Wang, Z.-L.; Li, R.-H.; Chen, B.-H.; Li, J.-L. A comparison of Jiaojia- and Linglong-type gold deposit ore-forming fluids: Do they differ? Ore Geol. Rev. 2017, 88, 511–533. [Google Scholar] [CrossRef]
  56. Song, M.; Song, Y.; Ding, Z.; Wei, X.; Sun, S.; Song, G.; Zhang, J.; Zhang, P.; Wang, Y. The discovery of the Jiaojia and the Sanshandao giant gold deposits in Jiaodong Peninsula and discussion on the relevant issues. Geotecton. Metallog. 2019, 43, 92–110. [Google Scholar] [CrossRef]
  57. Yang, L.-Q.; Deng, J.; Wang, Z.-L.; Guo, L.-N.; Li, R.-H.; Groves, D.I.; Danyushevsky, L.V.; Zhang, C.; Zheng, X.-L.; Zhao, H. Relationships between gold and pyrite at the Xincheng gold deposit, Jiaodong Peninsula, China: Implications for gold source and deposition in a brittle epizonal environment. Econ. Geol. 2016, 111, 105–126. [Google Scholar] [CrossRef]
  58. Yang, L.; Zhao, R.; Wang, Q.; Liu, X.; Carranza, E.J.M. Fault geometry and fluid-rock reaction: Combined controls on mineralization in the Xinli gold deposit, Jiaodong Peninsula, China. J. Struct. Geol. 2018, 111, 14–26. [Google Scholar] [CrossRef]
  59. Yu, X.; Shan, W.; Xiong, Y.; Geng, K.; Sun, Y.; Chi, N.; Guo, B.; Li, D.; Li, H.; Song, Y. Deep structural framework and genetic analysis of gold concentration areas in the Northwestern Jiaodong Peninsula, China: A new understanding based on high-resolution reflective seismic survey. Acta Geol. Sin.-Engl. Ed. 2018, 92, 1823–1840. [Google Scholar] [CrossRef]
  60. Zhang, L.; Groves, D.I.; Yang, L.-Q.; Wang, G.-W.; Liu, X.-D.; Li, D.-P.; Song, Y.-X.; Shan, W.; Sun, S.-C.; Wang, Z.-K. Relative roles of formation and preservation on gold endowment along the Sanshandao gold belt in the Jiaodong gold province, China: Importance for province- to district-scale gold exploration. Miner. Depos. 2020, 55, 325–344. [Google Scholar] [CrossRef]
  61. Fan, H.R.; Zhai, M.G.; Xie, Y.H.; Yang, J.H. Ore-forming fluids associated with granite-hosted gold mineralization at the Sanshandao deposit, Jiaodong gold province, China. Miner. Depos. 2003, 38, 739–750. [Google Scholar] [CrossRef]
  62. Li, L.; Santosh, M.; Li, S.-R. The ‘Jiaodong type’ gold deposits: Characteristics, origin and prospecting. Ore Geol. Rev. 2015, 65, 589–611. [Google Scholar] [CrossRef]
  63. Liu, Z.; Mao, X.; Jedemann, A.; Bayless, R.C.; Deng, H.; Chen, J.; Xiao, K. Evolution of pyrite compositions at the Sizhuang gold deposit, Jiaodong Peninsula, Eastern China: Implications for the genesis of Jiaodong-type orogenic gold mineralization. Minerals 2021, 11, 344. [Google Scholar] [CrossRef]
  64. Yang, K.-F.; Jiang, P.; Fan, H.-R.; Zuo, Y.-B.; Yang, Y.-H. Tectonic transition from a compressional to extensional metallogenic environment at ∼120 Ma revealed in the Hushan gold deposit, Jiaodong, North China Craton. J. Asian Earth Sci. 2018, 160, 408–425. [Google Scholar] [CrossRef]
  65. Liu, Z.; Hollings, P.; Mao, X.; Lawley, C.J.M.; Yang, B.; Tang, L. Metal remobilization from country rocks into the Jiaodong-type orogenic gold systems, Eastern China: New constraints from scheelite and galena isotope results at the Xiadian and Majiayao gold deposits. Ore Geol. Rev. 2021, 134, 104126. [Google Scholar] [CrossRef]
  66. Liu, J.; Wang, J.; Liu, Y.; Tian, J.; Li, X.; Zhang, H.; Somerville, I. Ore genesis of the Xiadian gold deposit, Jiaodong Peninsula, East China: Information from fluid inclusions and mineralization. Geol. J. 2018, 53, 77–95. [Google Scholar] [CrossRef]
  67. Li, X.; Yuan, F.; Zhang, M.; Jowitt, S.M.; Ord, A.; Zhou, T.; Dai, W. 3D computational simulation-based mineral prospectivity modeling for exploration for concealed Fe–Cu skarn-type mineralization within the Yueshan orefield, Anqing district, Anhui Province, China. Ore Geol. Rev. 2019, 105, 1–17. [Google Scholar] [CrossRef]
  68. Xiang, J.; Xiao, K.; Carranza, E.J.M.; Chen, J.; Li, S. 3D mineral prospectivity mapping with random forests: A case study of Tongling, Anhui, China. Nat. Resour. Res. 2019, 29, 395–414. [Google Scholar] [CrossRef]
  69. Macêdo, I.; Gois, J.P.; Velho, L. Hermite radial basis functions implicits. In Comput Graph Forum; Blackwell Publishing Ltd.: Oxford, UK, 2011; pp. 27–42. [Google Scholar]
  70. Stein, M.L. Interpolation of Spatial Data: Some Theory for Kriging; Springer Science & Business Media: Berlin/Heidelberg, Germany, 1999. [Google Scholar]
  71. Carranza, E.J.M. Controls on mineral deposit occurrence inferred from analysis of their spatial pattern and spatial association with geological features. Ore Geol. Rev. 2009, 35, 383–400. [Google Scholar] [CrossRef]
  72. Deng, H.; Huang, X.; Mao, X.; Yu, S.; Chen, J.; Liu, Z.; Zou, Y. Generalized mathematical morphological method for 3D shape analysis of geological boundaries: Application in identifying mineralization-associated shape features. Nat. Resour. Res. 2021, 31, 2103–2127. [Google Scholar] [CrossRef]
  73. Gessner, K. Coupled models of brittle-plastic deformation and fluid flow: Approaches, methods, and application to Mesoproterozoic mineralisation at Mount Isa, Australia. Surv. Geophys. 2009, 30, 211–232. [Google Scholar] [CrossRef]
  74. Cui, T.; Yang, J.; Samson, I.M. Tectonic deformation and fluid flow: Implications for the formation of unconformity-related uranium deposits. Econ. Geol. 2012, 107, 147–163. [Google Scholar] [CrossRef]
  75. Liu, L.; Cao, W.; Liu, H.; Ord, A.; Qin, Y.; Zhou, F.; Bi, C. Applying benefits and avoiding pitfalls of 3D computational modeling-based machine learning prediction for exploration targeting: Lessons from two mines in the Tongling-Anqing district, eastern China. Ore Geol. Rev. 2022, 142, 104712. [Google Scholar] [CrossRef]
  76. Zhao, C. Advances in numerical algorithms and methods in computational geosciences with modeling characteristics of multiple physical and chemical processes. Sci. China Technol. Sci. 2015, 58, 783–795. [Google Scholar] [CrossRef]
  77. Zhao, C.; Hobbs, B.E.; Ord, A. Fundamentals of Computational Geoscience: Numerical Methods and Algorithms; Springer Science & Business Media: Berlin/Heidelberg, Germany, 2009; Volume 122. [Google Scholar]
  78. Itasca. FLAC3D 5.0 (Fast Lagrangian Analysis of Continua in 3 Dimensions) Manual; Itasca Consulting Group Inc.: Minneapolis, MN, USA, 2012. [Google Scholar]
  79. Eldursi, K.; Chi, G.; Bethune, K.; Li, Z.; Ledru, P.; Quirt, D. New insights from 2-and 3-D numerical modelling on fluid flow mechanisms and geological factors responsible for the formation of the world-class Cigar Lake uranium deposit, eastern Athabasca Basin, Canada. Miner. Depos. 2021, 56, 1365–1388. [Google Scholar] [CrossRef]
  80. Leader, L.D.; Robinson, J.A.; Wilson, C.J. Numerical modelling of fluid infiltration constrained by fault and bedding relationships in the Fosterville goldfield, Victoria, Australia. Ore Geol. Rev. 2012, 48, 384–402. [Google Scholar] [CrossRef]
  81. Cox, S.F. Faulting processes at high fluid pressures: An example of fault valve behavior from the Wattle Gully Fault, Victoria, Australia. J. Geophys. Res. Solid Earth 1995, 100, 12841–12859. [Google Scholar] [CrossRef]
  82. Cox, S.F. Coupling between deformation, fluid pressures, and fluid flow in ore-producing hydrothermal systems at depth in the crust. Econ. Geol. 2005, 100, 39–75. [Google Scholar] [CrossRef]
  83. Cox, S.F.; Knackstedt, M.A.; Brown, J. Principle of structural control on permeability and fluid flow in hydrothermal systems. In Structural Control on Ore Genesis. Reviews in Economic Geology; Richards, J.P., Tosdal, R.M., Eds.; Society of Economic Geologists: Littleton, CO, USA, 2001; Volume 14, pp. 1–24. [Google Scholar]
  84. Xie, S.; Mao, X.; Liu, Z.; Deng, H.; Chen, J.; Xiao, K. Determining the paleostress regime during the mineralization period in the Dayingezhuang Orogenic Gold Deposit, Jiaodong Peninsula, Eastern China: Insights from 3D numerical modeling. Minerals 2022, 12, 505. [Google Scholar] [CrossRef]
  85. Forcellini, D.; Alzabeebee, S. Seismic fragility assessment of geotechnical seismic isolation (GSI) for bridge configuration. Bull. Earthq. Eng. 2023, 21, 3969–3990. [Google Scholar] [CrossRef]
  86. Coleman, J.L.; Bolisetti, C.; Whittaker, A.S. Time-domain soil-structure interaction analysis of nuclear facilities. Nucl. Eng. Des. 2016, 298, 264–270. [Google Scholar] [CrossRef]
  87. Forcellini, D. Assessment of geotechnical seismic isolation (GSI) as a mitigation technique for seismic hazard events. Geosciences 2020, 10, 222. [Google Scholar] [CrossRef]
  88. Su, L.; Lu, J.; Elgamal, A.; Arulmoli, A.K. Seismic performance of a pile-supported wharf: Three-dimensional finite element simulation. Soil Dyn. Earthq. Eng. Struct. Dyn. 2017, 95, 167–179. [Google Scholar] [CrossRef]
  89. Caine, J.S.; Evans, J.P.; Forster, C.B. Fault zone architecture and permeability structure. Geology 1996, 24, 1025–1028. [Google Scholar] [CrossRef]
  90. Huang, L.; Wang, G.; Carranza, E.J.M.; Du, J.; Li, J.; Zhou, Z.; Zhang, Z.; Wang, H.; Liu, X.; Peng, Y. Multi-scale numerical simulation and 3D modeling for deep mineral exploration in the Jiaojia Gold District, China. Nat. Resour. Res. 2020, 29, 415–438. [Google Scholar] [CrossRef]
  91. Fournier, R.O. Hydrothermal processes related to movement of fluid from plastic into brittle rock in the magmatic-epithermal environment. Econ. Geol. 1999, 94, 1193–1211. [Google Scholar] [CrossRef]
  92. Charles, N.; Chen, Y.; Augier, R.; Gumiaux, C.; Lin, W.; Faure, M.; Monié, P.; Choulet, F.; Wu, F.; Zhu, R.; et al. Palaeomagnetic constraints from granodioritic plutons (Jiaodong Peninsula): New insights on Late Mesozoic continental extension in Eastern Asia. Phys. Earth Planet. Inter. 2011, 187, 276–291. [Google Scholar] [CrossRef]
  93. Yang, L.-Q.; Deng, J.; Wang, Z.-L.; Zhang, L.; Goldfarb, R.J.; Yuan, W.-M.; Weinberg, R.F.; Zhang, R.-Z. Thermochronologic constraints on evolution of the Linglong Metamorphic Core Complex and implications for gold mineralization: A case study from the Xiadian gold deposit, Jiaodong Peninsula, eastern China. Ore Geol. Rev. 2016, 72, 165–178. [Google Scholar] [CrossRef]
  94. Zuo, R.; Xiong, Y. Big data analytics of identifying geochemical anomalies supported by machine learning methods. Nat. Resour. Res. 2017, 27, 5–13. [Google Scholar] [CrossRef]
  95. Zuo, R.; Xiong, Y.; Wang, J.; Carranza, E.J.M. Deep learning and its application in geochemical mapping. Earth Sci. Rev. 2019, 192, 1–14. [Google Scholar] [CrossRef]
  96. Sun, T.; Chen, F.; Zhong, L.; Liu, W.; Wang, Y. GIS-based mineral prospectivity mapping using machine learning methods: A case study from Tongling ore district, eastern China. Ore Geol. Rev. 2019, 109, 26–49. [Google Scholar] [CrossRef]
  97. Mao, X.; Wang, J.; Deng, H.; Liu, Z.; Chen, J.; Wang, C.; Liu, J. Bayesian Decomposition Modelling: An Interpretable Nonlinear Approach for Mineral Prospectivity Mapping. Math. Geosci. 2023, 1–46. [Google Scholar] [CrossRef]
  98. Fan, J. Local linear regression smoothers and their minimax efficiencies. Ann. Stat. 1993, 21, 196–216. [Google Scholar] [CrossRef]
  99. Jessell, M.W.; Bons, P.D.; Evans, L.; Piazolo, S. Numerical Experiments into the Localization of Deformation during Recrystallization Flow. Mater. Sci. Forum 2004, 467–470, 647–652. [Google Scholar] [CrossRef]
  100. Zhang, Y.; Robinson, J.; Schaubs, P.M. Numerical modelling of structural controls on fluid flow and mineralization. Geosci. Front. 2011, 2, 449–461. [Google Scholar] [CrossRef]
  101. Wen, B.-J.; Fan, H.-R.; Santosh, M.; Hu, F.-F.; Pirajno, F.; Yang, K.-F. Genesis of two different types of gold mineralization in the Linglong gold field, China: Constrains from geology, fluid inclusions and stable isotope. Ore Geol. Rev. 2015, 65, 643–658. [Google Scholar] [CrossRef]
  102. Fawcett, T. An introduction to ROC analysis. Pattern Recognit. Lett. 2006, 27, 861–874. [Google Scholar] [CrossRef]
  103. Yu, X.; Yang, D.; Li, D.; Dan, W.; Xiong, Y.; Chi, N.; Liu, P.; Yu, L. Mineralization characteristics and geological significance in 3000m depth of Jiaojia gold metallogenic belt, Jiaodong Peninsula. Acta Petrol. Sin. 2019, 39, 2893–2910. [Google Scholar]
  104. Liu, G.; Wen, G.; Liu, C.; Bao, Z.; Sun, Z.; Fan, J.; Li, S.; Yan, C.; Guo, Z. Discovery, characteristics and prospecting direction of Shuiwangzhuang deep super-large gold deposit in the northern section of Zhaoping fault. Gold Sci. Technol. 2017, 25, 38. [Google Scholar] [CrossRef]
Figure 1. (a) Schematic map showing the position of the North China Craton. (b) Geological map of the Northwestern Jiaodong Peninsula (Modified from [57,63]).
Applsci 13 10277 g001
Figure 2. Geological map of the Xiadian gold deposit. The location of representative sections (Figure 3a,b) are also shown.
Applsci 13 10277 g002
Figure 3. Geological sections of (a) No. 7 and (b) No. Jiangjiayao, illustrating the distribution of mineralization, alteration, fault, and wall rocks. Note the fault dip variation controls the orebody formation in (b). The location of sections are shown in Figure 2.
Applsci 13 10277 g003
Figure 4. Schematic model illustrating the metallogeny of structural-hydrothermal gold system at Xiadian. Gold mineralization localization is dominant by structure geometry and fluid flow pattern [26].
Applsci 13 10277 g004
Figure 5. Workflow for 3D prospectivity modeling in this study.
Applsci 13 10277 g005
Figure 6. Concept model for 3D numerical modeling in the Xiadian deposit.
Applsci 13 10277 g006
Figure 7. 3D raster models of gold orebodies (a,b) and implicit model of the Zhaoping fault model (c). Note the fault model covers the peripheral areas of the Xiadian gold deposit. Note the orebody (transparent, grey areas) is located in the fault footwall.
Applsci 13 10277 g007
Figure 8. 3D voxel models displaying the effects of fault geometry attributes on known voxels (mostly ore-bearing) in the Xiadian gold deposit. (a) gold amounts in voxels for comparison; (b) fault buffer; (c) fault dip; (d) dip variations; (e,f) fault undulation.
Applsci 13 10277 g008
Figure 9. Binary plots displaying the effects of fault geometry attributes on known voxels (mostly ore-bearing) in the Xiadian gold deposit. (a) fault buffer (dF); (b) fault dip (gF); (c) dip variations (vF); (d,e) fault undulation at small (waF) and large scales (wbF).
Applsci 13 10277 g009
Figure 10. 3D voxel models (left subplot) and binary plots (right subplot) displaying the effects of ore-forming simulation-related attributes on known voxels (mostly ore-bearing) in the Xiadian gold deposit. (a,b) Volumetric strain; (c,d) Shear strain; (e,f) Temperate variations (absolute values); (g,h) Fluid divergence. Note the arrows in a show the interval distribution of high volumetric strain.
Applsci 13 10277 g010
Figure 11. Performance comparisons of three classification models. (a) ROC curves and (b) radar chart of accuracy–precision–AUC–kappa-F1 score.
Applsci 13 10277 g011
Figure 12. 3D gold prospectivity modeling results (a,c,d) and gold targets (b) in the Xiadian deposit. (a) all variables; (c) only geometry variables; (d) only simulation variables. The target numbers are shown in (b). The dashed black circles and green arrow indicate the wrong prediction of reserved known areas and the black arrow points right prediction.
Applsci 13 10277 g012
Table 1. Model geometric feature and ore attribute description.
VariableDefinitionsUnitRange/Mean
AuGold grade of one voxelg/t0~13.4/0.92
AuMetGold amounts of one voxelg0~303,532/7784
dFMinimum distance to the Zhaoping faultm−416~113/−117
gFDip of the Zhaoping fault°8.8~89/47
vFDip variation of the Zhaoping fault in a 100 m buffer°/100 m−15.2~45.6/3.2
waFUndulation relative to trending surface of the Zhaoping fault in a 180 m bufferm−164~96/−15.7
wbFUndulation relative to trending surface of the Zhaoping fault in a 360 m bufferm−111~101/−13.5
Table 2. Numerical simulation parameters used in this study.
PropertyHanging Wall (Metamorphic Rocks)Footwall
(Granite)
Fault Zone
Density ( k g / m 3 ) 2.672.62.0
Bulk modulus ( P a )3.285.330.52
Shear modulus ( P a )0.560.320.031
Cohesion ( P a )8.933.616.9
Tensile strength (Pa)3.775.162.97
Friction angle (°)283320
Dilation angle (°)3.25.36.0
Porosity0.290.190.4
Permeability ( m 2 )2.09 × 10−111.81 × 10−111.00 × 10⁻¹⁰
Conductivity ( J / ( m ) )2.633.054.0
Thermal expansion
coefficient (°C−1)
5.40 × 10−66.70 × 10−66.70 × 10⁻⁶
Specific heat
capacity ( J / ( k g ) )
803803783
Table 3. Performance comparisons of three regression models.
ModelsMAEMSERMSERR2
all-variable model2.7441.606.450.920.85
geometry variable model3.2644.896.700.790.62
simulation variable model4.4465.448.090.740.55
Note: MAE, mean absolute error; MSE, mean squared error; RMSE, root mean squared error; R, correlation coefficient; R2, coefficient of determination.
Disclaimer/Publisher’s Note: The statements, opinions and data contained in all publications are solely those of the individual author(s) and contributor(s) and not of MDPI and/or the editor(s). MDPI and/or the editor(s) disclaim responsibility for any injury to people or property resulting from any ideas, methods, instructions or products referred to in the content.

