Article

Sex-Related Variations in the Brain Motor-Network Connectivity at Rest during Puberty

by
Lucero Pacheco-Blas
*,
Gabriela González-González
and
Alicia Ortega-Aguilar
*
Departamento de Bioquímica, Facultad de Medicina, Universidad Nacional Autónoma de México, Av. Universidad 3000, Coyoacán 04510, Mexico
*
Authors to whom correspondence should be addressed.
Appl. Sci. 2023, 13(18), 10006; https://doi.org/10.3390/app131810006
Submission received: 22 July 2023 / Revised: 28 August 2023 / Accepted: 31 August 2023 / Published: 5 September 2023
(This article belongs to the Section Applied Neuroscience and Neural Engineering)

Abstract

:
The development of functional neuroimaging technologies has resulted in a flood of mathematical models that investigate functional brain connections in health and disease. Motor network activity in the resting state and its response to puberty remains to be investigated. Variations between sexes in puberty may appear not just in brain regions involved in sexual and emotional activities, but also in cognitive and motor abilities that are active even when the individual is resting. The aim of this study was to investigate the interactions of the motor subnetwork in the resting state of healthy males and females aged 12 and 16. This study used the OpenNeuro Dataset ds004169:1.0.7, Queensland Twin IMaging. The MRI signals were preprocessed to get adjacency matrices from the sensory/somatomotor and cerebellar networks in the Power atlas. Network topology was analyzed using the centrality measures of strength, hubness, and leverage. The strength of the nodes increases with age in both sex groups. Both sexes had right hemisphere dominance in the cerebellar-mouth subnetwork and left dominance in the cerebellar-hand subnetwork. Eleven leverage centrality regions were common to all groups, the most relevant were the Precuneus, the cingulum postcentral and the supplementary motor area. In both sexes, hubs at age 12 were detected only in the right hemisphere. This dominance was reduced at age 16. Understanding connectivity changes in the brain during rest may enable the identification of neurophysiological mechanisms of cognitive and behavioral development that may contribute to long-term psychological well-being in adolescents.

1. Introduction

Puberty and adolescence mark a child’s transition into adulthood. Biologists have typically viewed puberty from an endocrine standpoint since the characteristic signs of reproductive maturation are driven by hormonal changes that occur throughout this stage of development. Although puberty and adolescence are commonly used interchangeably, the term puberty is related to the stimulation of the hypothalamic-pituitary-gonadal axis, whereas adolescence refers to the period between childhood and adulthood when there is a significant physical, psychological, cognitive, and social transformation [1].
Hormonal fluctuations lead to essential variations in every tissue and organ, including the human brain. Sex hormone receptors are present in several areas of the brain. Sex-specific reproductive behaviors become more determinant at the beginning of puberty, for example, small hormonal fluctuations during the menstrual cycle predispose females to mood disorders related to brain changes [2]. The brain transition from childhood to puberty is marked by an increase in the main neural fiber tracts prompting new brain area connectivity, caused by an increase in fiber density, myelination, synaptic remodeling, competitive elimination, and apoptosis [3]. Although basic cognitive skills develop during childhood, more complicated self-regulatory abilities such as control of voluntary movement develops after puberty [4]. Development of selective motor response inhibition has been demonstrated to peak at around age 12 [5], whereas retaining an already triggered motor response, known to be a more challenging task, has been observed to peak at around age 16 [6]. Furthermore, it has been demonstrated that the ability to self-regulate proactive or reactive inhibition connected to movement is highly established during puberty [7]. After all, motor control is a very complex mechanism of neural circuitry and integrity of skeletal muscle’s mechanical and sensorial functions, tissue that comprises almost 50% of the body weight.
Myelin production in the central nervous system regulates conduction velocity, which is a critical component of rapid and efficient information processing and functional connectivity in the brain [8,9]. White matter is the main substance in the sensory/somatomotor cortex composed of long myelinated axons, which transfer information between various cortical and subcortical gray matter regions and with distant connections to the cerebellum and spinal cord. Myelination begins during early fetal life and brain size increases rapidly during the first three years [10]. White matter mass increases more than gray matter mass during childhood peaking around puberty [11], which is related to increased gonadal and Glia cell synthesis of sex hormones [12]. Testosterone increases oligodendrocyte proliferation favoring myelination as well as cerebellar cell volume increases in males [13], while estradiol delays the exit of oligodendrocyte progenitor cells from the cell cycle [14], allowing oligodendrocytes to undergo additional rounds of cell division and increase proliferation but reducing the rate of myelinization in females.
The brain is connected to the cerebellum via afferent and efferent pathways, whose myelination is completed early in childhood, through the Superior and Inferior Cerebellar Peduncles. On the other hand, the Middle Cerebellar Peduncle ends development in puberty and only allows afferent information from the pontine nuclei (PN) to reach the cerebellum [15]. The cerebellum contains more than 100 billion neurons, accounting for more than 80% of total brain neurons [16]. The cerebellum and motor cortex network actively participate in the inhibition of voluntary movement, emotional behavior, and cognition. Together, the cerebellum and motor cortex network constitute the motor-subnetwork, a major portion of the resting brain. The resting state brain consumes 20% of the glucose available for all metabolism, therefore, motor-subnetwork connectivity at rest must be highly active. It can particularly be observed when comparing 12-year-old to 16-year-old individuals. Different expressions and responses to sex hormones related to the motor network in the resting brain will be analyzed.
The present work aims to study connectivity on the motor network while awake with eyes closed, providing evidence on the default activity of this network. This network is notable for its extensive connectivity to the rest of the brain involved in decision-making and motor control in a body subjected to continuous sex hormonal changes, particularly during puberty. The motor network is also receiving constant proprioceptive information, the sense that lets us perceive the location, movement, and action of parts of the body. This fMRI analysis would provide a potential standard to compare fMRI data obtained to analyzed behavioral disorders that often occur during puberty and adolescence.

2. Materials and Methods

2.1. Participants

A subset of the OpenNeuro Dataset ds004169:1.0.7 [17], Queensland Twin IMaging (QTIM) was used. The QTIM study was approved by the Human Research Ethics Committees of the QIMR Berghofer Medical Research Institute, University of Queensland, and Uniting Health Care, Wesley Hospital. Written informed consent was obtained for each participant. The selected participants for this study were those ages 12 or 16. The final sample consisted of 107 subjects, 50 12-year-olds (22 males/28 females), and 57 16-year-olds (20 males/27 females).

2.2. Image Acquisition

As reported by Sinclair, et al. [18] a 4 Tesla Bruker Medspec whole-body scanner was used to acquire a T1-weighted (T1w) 3D structural image (MPRAGE, repetition time TR = 1500 ms; echo time TE = 3.35 ms; inversion time TI = 700 ms; flip angle = 8°; field of view FOV = 230 mm3, pixel size 0.9 × 0.9 × 0.9 mm). Additionally, the BOLD (Blood Oxygen Level Dependent) signal was obtained through a T2*-weighted gradient echo and an echo planar imaging (GE-EPI) sequence (TR = 2100 ms; TE = 30 ms; flip angle = 90°; FOV = 230 × 230 mm, pixel size 3.6 × 3.6 mm 36 coronal 3.0 mm slices with 0.6 mm gap, 150 volumes, and a total scan time of 315 s) were acquired under the instructions to remain at rest with their eyes closed, not to fall asleep and not to think of anything in particular. Participants were excluded if they reported any history of psychiatric disease, brain injury, substance abuse, or MR incompatibility.

2.3. Anatomical Data Preprocessing

Data preprocessing was carried out using fMRIPrep software v23.0.2 [19]. The T1w image was corrected for intensity non-uniformity, then skull-stripped and used as a reference throughout the workflow. Brain tissue segmentation of cerebrospinal fluid (CSF), white-matter (WM), and gray-matter (GM) was performed using FAST (FSL 5.0.9) [20]. Volume-based spatial normalization to the standard template ICBM 152 Asymmetrical template version 2009c (MNI152NLin2009cAsym).

2.4. Functional Data Preprocessing

A skull-stripped reference volume was generated, this reference was co-registered (with nine degrees of freedom) to the T1w reference using flirt [21]. Head-motion parameters with respect to the BOLD reference volume were estimated using FSL’s MCFLIRT (Motion Correction FSL Linear Image Registration Tool) [22]. These preprocessed BOLD time-series were resampled into the standard space (MNI152NLin2009cAsym). Confounding time-series, such as framewise displacement and standardized derivative of root mean squared variance over voxels (DVARS), were calculated from the generated reference volume using the implementations in Neuroimaging in Python: Pipelines and Interfaces (Nipype) [23]. Additionally, a set of regressors was extracted to allow for component-based noise correction (CompCor) [24] within the CSF, the WM, and the whole-brain masks as well as for a set of physiological regressors.

2.5. Atlas Selection

The functional Power Atlas was selected for this study [25]. A nilearn python [26] code was used to select 5 mm spheres with centers according to the 264 regions. The nilearn function input_data.NiftiSpheresMasker was used to create 5 mm sphere masks with a FWHM smoothing filter of 6 mm and a band pass filter between 0.009–0.08 Hz, and tr = 0.930 s. The time series were extracted using the function parcellation.fit_transform with confounds strategy using “high_pass”, “motion”, “wm_csf” and “global_signal”.
Figure 1 shows a schematic representation of the workflow, alongside anatomical and functional data preprocessing and brain network construction.

2.6. Network Construction

Time series from the Power Atlas were used to calculate an adjacency matrix for each subject using Pearson correlation. In order to use the highest possible density of only positive values, the correlation matrices were thresholded in order to keep a connectivity density of 0.46. The analysis was then limited to the motor subnetwork that comprises regions from the Cerebellar (4 regions), Sensory/Somatomotor Hand (30 regions), and Sensory/Somatomotor Mouth (5 regions) networks. Table 1 shows the selected regions’ coordinates.

2.7. Network Analysis

Each network was obtained from the selected regions’ matrix. The network measure of node strength was then calculated. Node strength is the weighted variant of the degree of the node, which denotes the number of edges connected to a node [28]. Weighted measures account for the heterogeneity of the correlations within network topology.
k i w = j N w i j
A subsequent analysis was done recalculating the node strength for the subnetwork for each independent hemisphere. An analogous analysis was done for the cerebellar-mouth and the cerebellar-hand regions, with their respective hemisphere subnetworks.
Centrality measures of hubness and leverage were calculated for the entire network for each study group. Hubness centrality as defined previously [29], accounts for the highest node strength and betweenness centrality and low characteristic path length and clustering coefficient. In this study, a region was considered to be a hub if the hubness score was equal, or greater than 2 and at least 45% of the subjects in the group had this region as a hub. The leverage centrality (li) [30], accounts for the relationship between the degree of a given node (ki) and the degree of its neighbors (kj) averaged over all neighbors (Ni):
l i = 1 k i N i k i k j k i + k j
where li can result in values between −1 and 1. Negative values correspond to nodes that are influenced by their neighbors, while positive leverage values correspond to nodes that influence their neighbors. In order to obtain a single measure for each region, the leverage centrality score of each region was added over all subjects, only regions with positive values were reported.

2.8. Statistical Analysis

The node strength values were used to calculate the kernel density estimate for each population (12-year-old males n = 22, 16-year-old males n = 20, 12-year-old females n = 28, and 16-year-old females n = 37). The kernel density estimate, which will be referred to as the probability density function (PDF) estimates the likelihood that a continuous random variable (in this case the node strength) will be in a particular set of values and provides information about the skewness and multimodality in the data. The PDF was calculated using R function density with a Gaussian kernel and a bandwidth of h = 0.9 m i n σ , R 1.34 n 1 5 [31], where σ corresponds to the standard deviation and R to the interquartile range.
The difference between the corresponding PDF of male groups (12- and 16-year-olds) and the PDF of female groups (12- and 16-year-olds) was determined. PDF differences were evaluated using a Kolmogorov-Smirnov test, and D statistic and p-values were reported. The D statistic reports the maximum difference between the cumulative distributions of the compared data; p-values were corrected for multiple comparisons with a false discovery rate. Same sex, age, and interhemispheric analysis was done for the entire motor-subnetwork (MsN). The cerebellar-mouth and cerebellar-hand MsN were also analyzed as described above in Section 2.7.
Principal Component Analysis (PCA) was carried out as a complement to visualize the diversity of the population. PCA is a method to reduce the number of variables in a dataset by using a linear transformation into a coordinate system that explains the variation of the data. It was performed with R function PCA, using the values of the strength and leverage, that is, feature one corresponds to the strength value of region 1 for each subject, feature 39, corresponds to the strength value of region 39, and so on, feature 78 corresponds to the leverage value of region 39.

3. Results

3.1. Differences of the Motor-Subnetwork in 12- and 16- Year-Old Male and Female Groups

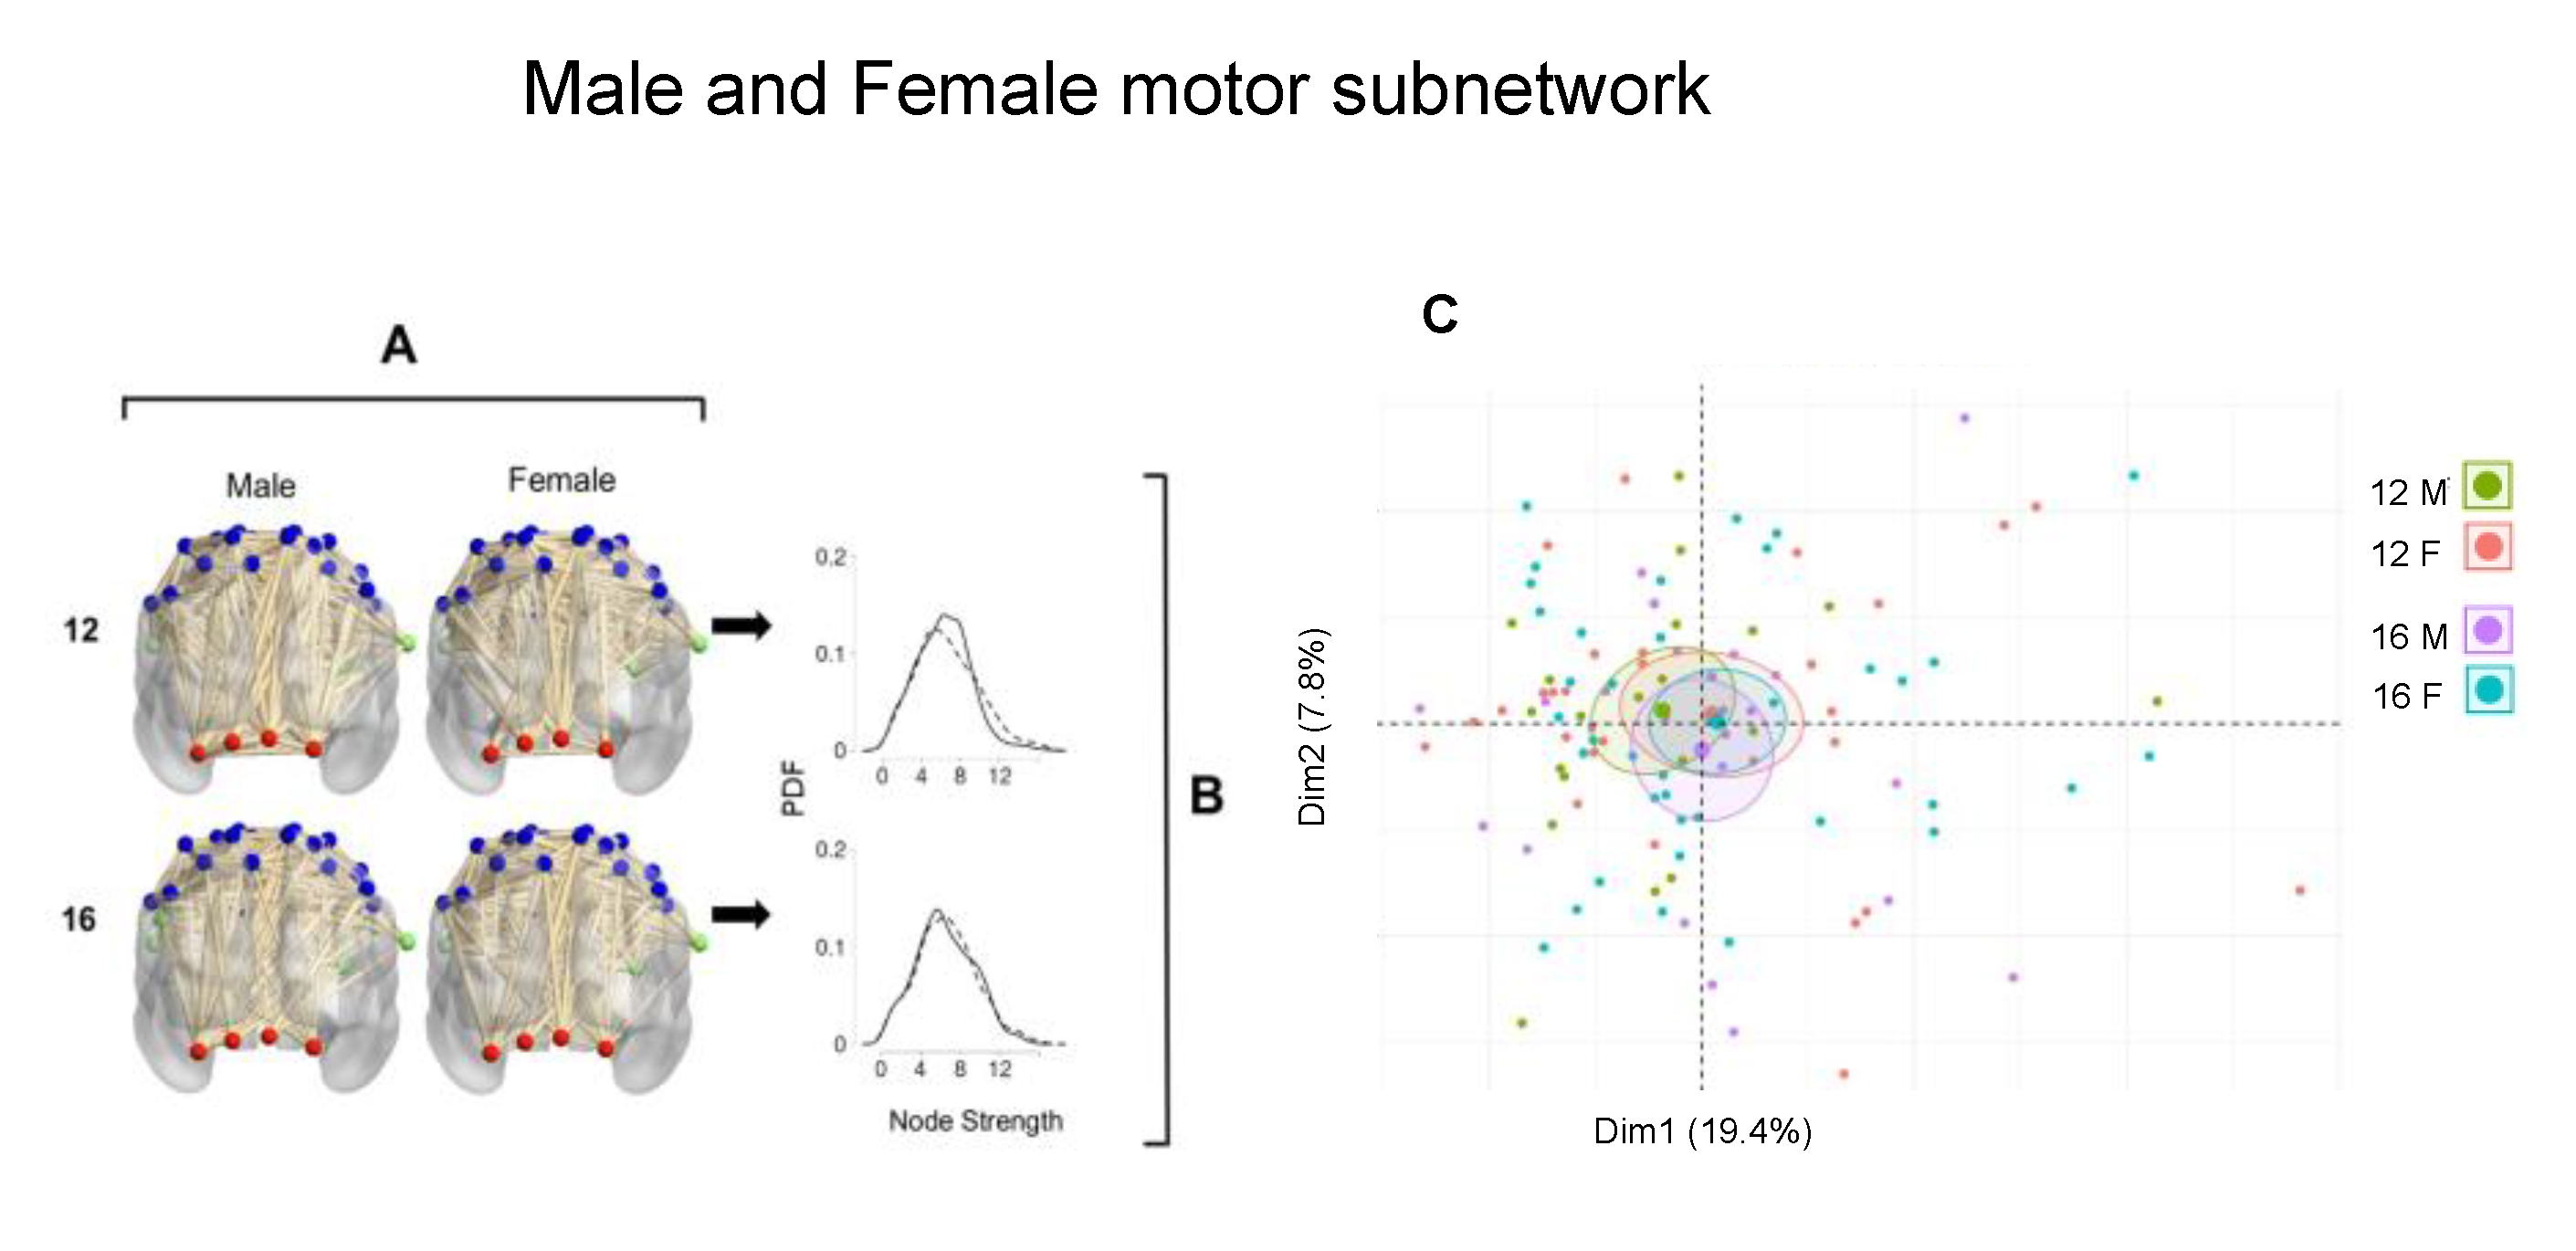
Figure 2 shows the comparison between male and female groups at age 12. Figure 2A is a representative coronal view of the MsN of a male and a female at age 12. The nodes in the motor regions were taken from the Power 264 region atlas. These network visualizations display the difference in the edge weight, which is related to the strength of the connections of a node. Figure 2B shows the PDF of the entire MsN, the arrows point to the corresponding comparison, in this case between the male and female group. Node strength values in the male group (solid line) span between 0 and 12, with strength values centered around 6. The female group showed more strength values between 10 and 12 than males, with most connections having a strength value around 5. The difference between the PDF of each sex at age 12 was greater in males than females (D = 0.141, p-value = 0.0001). At age 16, both groups had PDFs with values around 6, and the female group had male and female groups had no statistically significant difference (D = 0.078, p-value = 0.0779).
Figure 2C shows the points of the individuals of the sample in the first and second components from the PCA analysis was carried out using the strength and leverage values; age and sex were considered categorical variables. The first component explains 19.4% of the variance, and the second is 7.8%. The male and female groups at age 12, which were found to have differences in the probability density comparison, correspond to the green and red dots, respectively. The female groups (red and blue) have the closest means. Visually, the male groups show distant means in this space. At age 12, the geometrical mean in the male group has higher negative values in the first component and almost zero in the second component, while at 16 the inverse is true, the mean has negative values in the second component and is zero in the first component. Females are both in the first quadrant at both ages.
Top ten regions in the first component:
Precentral.R2_Strength, Parietal_Inf.L1_Strength, Paracentral_Lobule.L1_Strength, Precentral.R3_Strength, Supp_Motor_Area.R2_Strength, Cingulum_Post.L1_Strength, Precuneus.R1_Strength, Supp_Motor_Area.R1_Strength, Postcentral.L4_Strength, Precuneus.L1_Strength
Top ten regions in the second component:
Insula.R1_Strength, Postcentral.R7_Strength, Precentral.R4_Strength, Postcentral.L7_Strength Paracentral_Lobule.R1_Strength, Postcentral.L6_Strength, Precentral.R5_Strength Precentral.L2_Strength, Paracentral_Lobule.R1_Leverage, Postcentral.R6_Strength
In conclusion, when the entire MsN was evaluated, there was a statistically significant difference in the node strength at age 12: the male group’s node strength values are greater than those in the female group, while differences at age 16 are not significant. In the PCA analysis, 12-year-old females and males have visually different geometrical mean in the first and second component space. Female groups have a very similar geometrical mean, and 16-year-old males have almost orthogonal geometrical means, which suggests these populations undergo significant connectivity pattern changes.

3.2. Hemisphere Differences of the MsN in 12- and 16-Years-Old Male Groups

Figure 3A shows a representative coronal, left, and right view of MsN in a male at age 12 and a male at age 16. The first row corresponds to the male group at age 12 (n = 22) and the second to the male group at age 16 (n = 20). Figure 3B is a comparison between the left (solid line) and right (dashed line) hemisphere node strength PDFs of the male groups age 12 and age 16 of the entire MsN. At age 12, the right hemisphere had greater node strength than the left hemisphere, with node strength values around 3 (D = 0.193, p-value of 0). At age 16, both hemispheres had more connections than at age 12, with node strength values above 4. The PDF shows that the left hemisphere had an evenly distributed thicker right tail, while the right hemisphere had a PDF with three peaks: one centered around 0, 3, and 5. The PDFs of right hemisphere node strength were statistically greater when compared to the left (D = 0.143, p-value of 0.0001).
Figure 3C shows the comparison of the male subnetwork for age 12 and 16 groups. With age, the entire MsN (D = 0.133, p-value = 0.0003), left hemisphere (D = 188, p-value of 0), and right hemisphere (D = 0.100, p-value = 0.0124) had different distributions. The plot following the vertical arrow in the first column corresponds to the PDFs of the entire MsN (below the coronal view) for each age group; at age 16, there were more connections than at age 12, with node strength values above 8. The second column corresponds to the comparison of the left hemisphere node strength PDFs for each age group. At age 16, there were more node strength values above 5. The third column corresponds to the comparison of the right hemisphere node strength PDFs for each age group. The main differences occur around a node strength of 4, for which there were more connections with this value at age 12, while the values in the tail are very similar.
In conclusion, at both ages, the right hemisphere had higher node strength values. The right hemisphere decreased node strength from 12 to 16 years of age, while the left hemisphere and the entire MsN increased node strength values from 12 to 16.

3.3. Hemisphere Differences of the MsN in 12- and 16-Year-Old Female Groups

Figure 4A shows a representative coronal, left, and right view of a female MsN at age 12 and a female at age 16. The first row corresponds to the female group at age 12 (n = 28) and the second to the female group at age 16 (n = 37). Figure 4B is a comparison between the left (solid line) and right (dashed line) hemisphere node strength PDFs of the female groups aged 12 and 16 of the entire MsN. Female groups at age 12 and 16 had higher node strength values in the right hemisphere (D = 0.109, p-value = 0.0109; D = 0.100, p-value = 0.0155, respectively).
Figure 4C shows the comparison of the female MsN for age 12 and 16 groups. The plot following the vertical arrow in the first column corresponds to the PDFs of the entire MsN (below the coronal view) for each age group, the second and third columns correspond to the hemispheric comparisons where no statistically significant differences were found (p-values 0.0862, 0.0732, 0.0732, respectively).
In conclusion, in both age groups the right hemisphere had higher node strength values. Age comparisons showed no significant differences.

3.4. Hemisphere Differences of the Cerebellar-Mouth MsN in Male Groups at Ages 12 and 16

Figure 5A shows a representative coronal, left and right view of the cerebellar-mouth MsN of a male at age 12 and a male at age 16. Figure 5B is a comparison between the left (solid line) and right (dashed line) hemisphere node strength PDFs of the male groups age 12 and 16 of the subnetwork. In both age groups, the right hemisphere had greater node strength values (D = 0.422, p-value = 0; D = 0.344, p-value = 0, respectively).
Figure 5C shows the comparison of the male cerebellar-mouth MsN for age 12 and 16 groups. The plot following the vertical arrow in the first column corresponds to the PDFs of the entire cerebellar-mouth subnetwork (below the coronal view) for each age group, node strength values were higher at age 12 (D = 0.117, p-value = 0.0022). The second column corresponds to the comparison of the left hemisphere node strength PDFs for each age group; at age 16, there were significantly greater node strength values (D = 0.131, p-value of 0.0003). The third column corresponds to the comparison of the right hemisphere node strength PDFs for each age group; at age 12, there were significantly greater node strength values (D = 0.145, p-value = 0.0001).
In conclusion, at both ages, the right hemisphere had greater node strength values. When comparing changes with age per hemisphere, the entire cerebellar-mouth MsN and the right hemisphere, node strength values were greater at age 12, while at 16 the left hemisphere had greater node strength values.

3.5. Hemisphere Differences of the Cerebellar-Mouth MsN in Female Groups at Ages 12 and 16

Figure 6A shows a representative cerebellar-mouth MsN in coronal, lateral left, and right views of a female at age 12 and a female at age 16. Figure 6B is a comparison between the left (solid line) and right (dashed lines) hemisphere node strength PDFs of the female groups aged 12 and 16 of the subnetwork. In both age groups, the right hemisphere had greater node strength values (D = 0.326, p-value = 0; D = 0.391, p-value = 0, respectively).
Figure 6C shows the comparison of the female cerebellar-mouth MsN for age 12 and 16 groups. The plot following the vertical arrow in the first column corresponds to the PDFs of the entire cerebellar-mouth MsN (below the coronal view) for each age group, node strength values were higher at age 12 (D = 0.217, p-value = 0.0022). The second column corresponds to the comparison of the left hemisphere node strength PDFs for each age group; at age 16, there were greater node strength values (D = 0.170, p-value of 0). The third column corresponds to the comparison of the right hemisphere node strength PDFs for each age group; at age 12, there were greater node strength values (D = 0.254, p-value = 0).
In conclusion, at both ages the right hemisphere had greater node strength values.

3.6. Hemisphere Differences of the Cerebellar-Hand MsN in Male Groups at Ages 12 and 16

Figure 7A shows a representative cerebellar-hand MsN in coronal, lateral left, and right views of a male at age 12 and a male at age 16. Figure 7B is a comparison between the left (solid line) and right (dashed lines) hemisphere node strength PDFs of the male groups aged 12 and 16 of the subnetwork. In both age groups, the left hemisphere had greater node strength values (D = 0.211, p-value = 0; D = 0.152, p-value = 0, respectively).
Figure 7C shows the comparison of the male cerebellar-hand MsN for age 12 and 16 groups. The plot following the vertical arrow in the first column corresponds to the PDFs of the entire cerebellar-hand MsN (below the coronal view) for each age group, node strength values were higher at age 12 (D = 0.250, p-value = 0). The second column corresponds to the comparison of the left hemisphere node strength PDFs for each age group; at age 12, there were greater node strength values (D = 0.221, p-value of 0). The third column corresponds to the comparison of the right hemisphere node strength PDFs for each age group; at age 16, there were greater node strength values with a statistically significant difference (D = 0.127, p-value = 0.0004).
In conclusion, at both ages, the left hemisphere had greater node strength values. In the entire cerebellar-hand MsN and in the right hemisphere node strength values are greater at age 12, while at age 16, the left hemisphere has greater node strength values.

3.7. Hemisphere Differences of the Cerebellar-Hand MsN in Female Groups at Ages 12 and 16

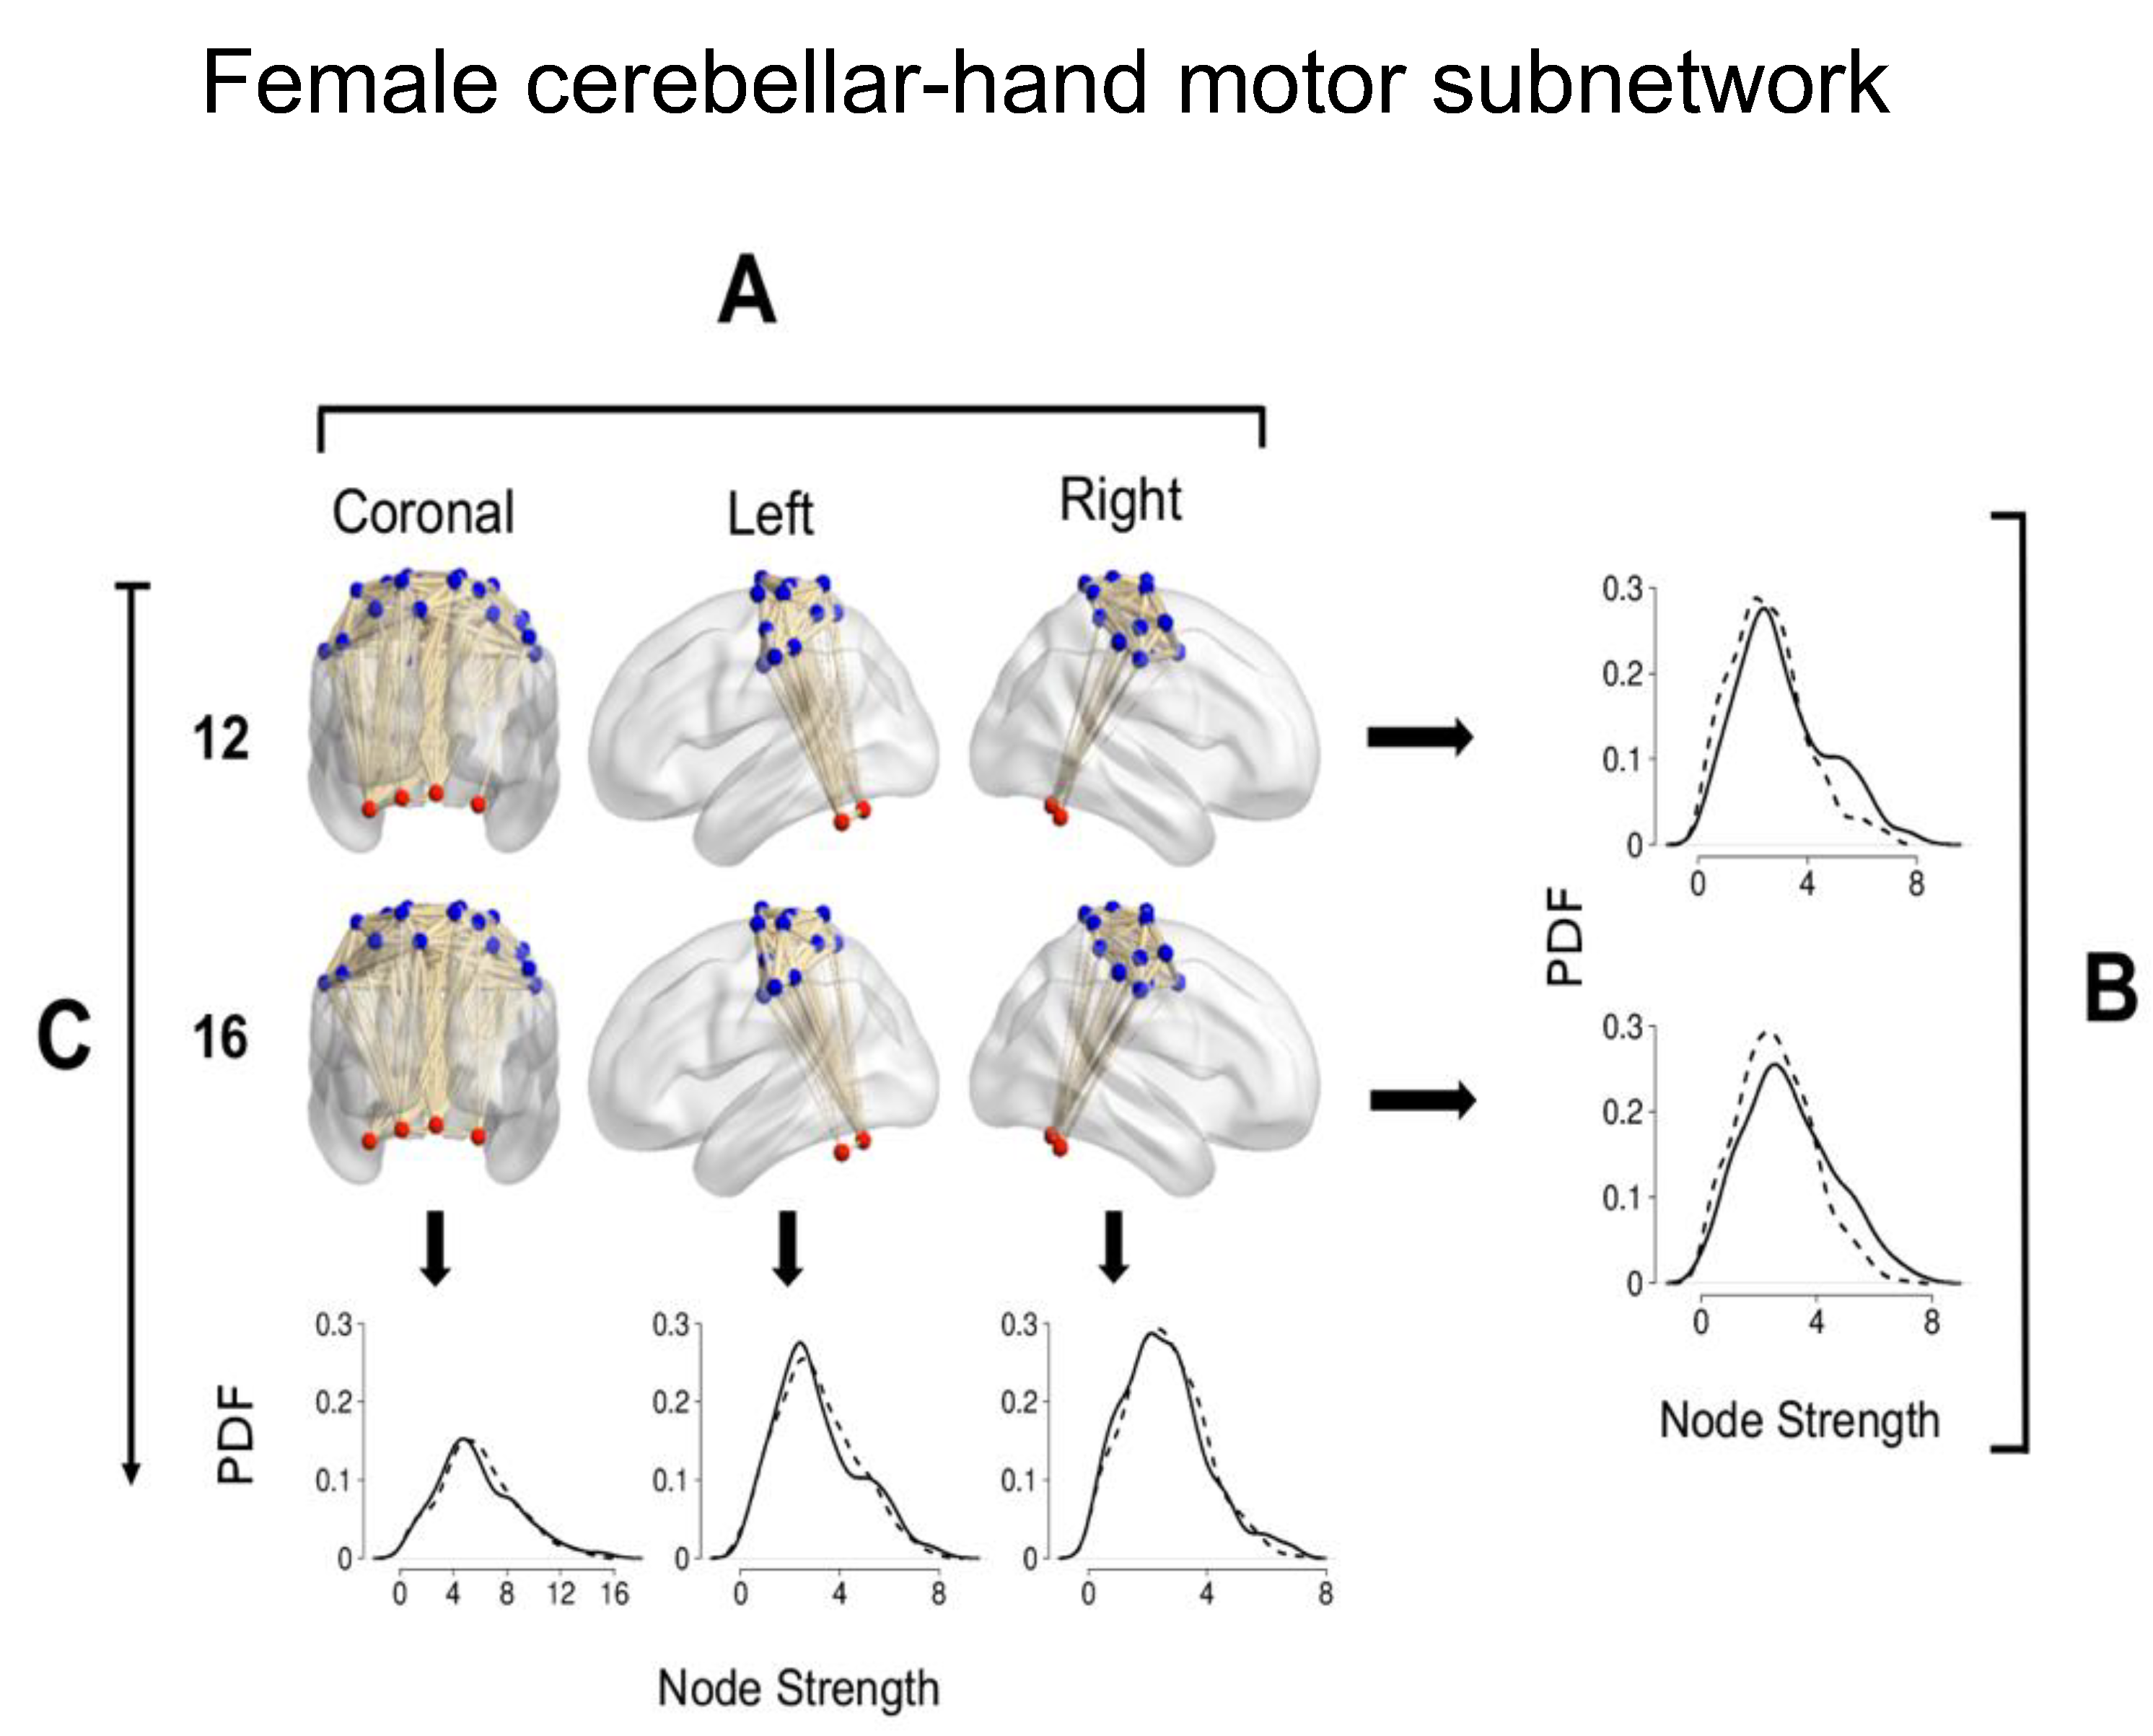
Figure 8A shows a representative cerebellar-hand MsN in coronal, lateral left, and right views of a female at age 12 and a female at 16. Figure 8B is a comparison between the left (solid line) and right (dashed lines) hemisphere node strength PDFs of the female groups aged 12 and 16 of the subnetwork. In both age groups, the left hemisphere had greater node strength values (D = 0.115, p-value = 0; D = 0.152, p-value = 0, respectively).
Figure 8C shows the comparison of the female cerebellar-hand MsN for age 12 and 16 groups. The plot following the vertical arrow in the first column corresponds to the PDFs of the entire cerebellar-hand MsN (below the coronal view) for each age group, node strength values were higher at age 12 (D = 0.074, p-value = 0.0745). The second column corresponds to the comparison of the left hemisphere node strength PDFs for each age group; at age 12, there were greater node strength values (D = 0.090, p-value of 0.0267). The third column corresponds to the comparison of the right hemisphere node strength PDFs for each age group; there was no statistically significant difference between age groups (p-value = 0.1724).
In conclusion, at both ages, the left hemisphere has greater node strength values. In the entire cerebellar-hand MsN node strength values were greater at age 12, the left hemisphere had greater node strength values at age 16, and there was no significant difference in the right hemisphere node strengths.

3.8. Sex and Age Differences in Leverage Centrality in the MsN

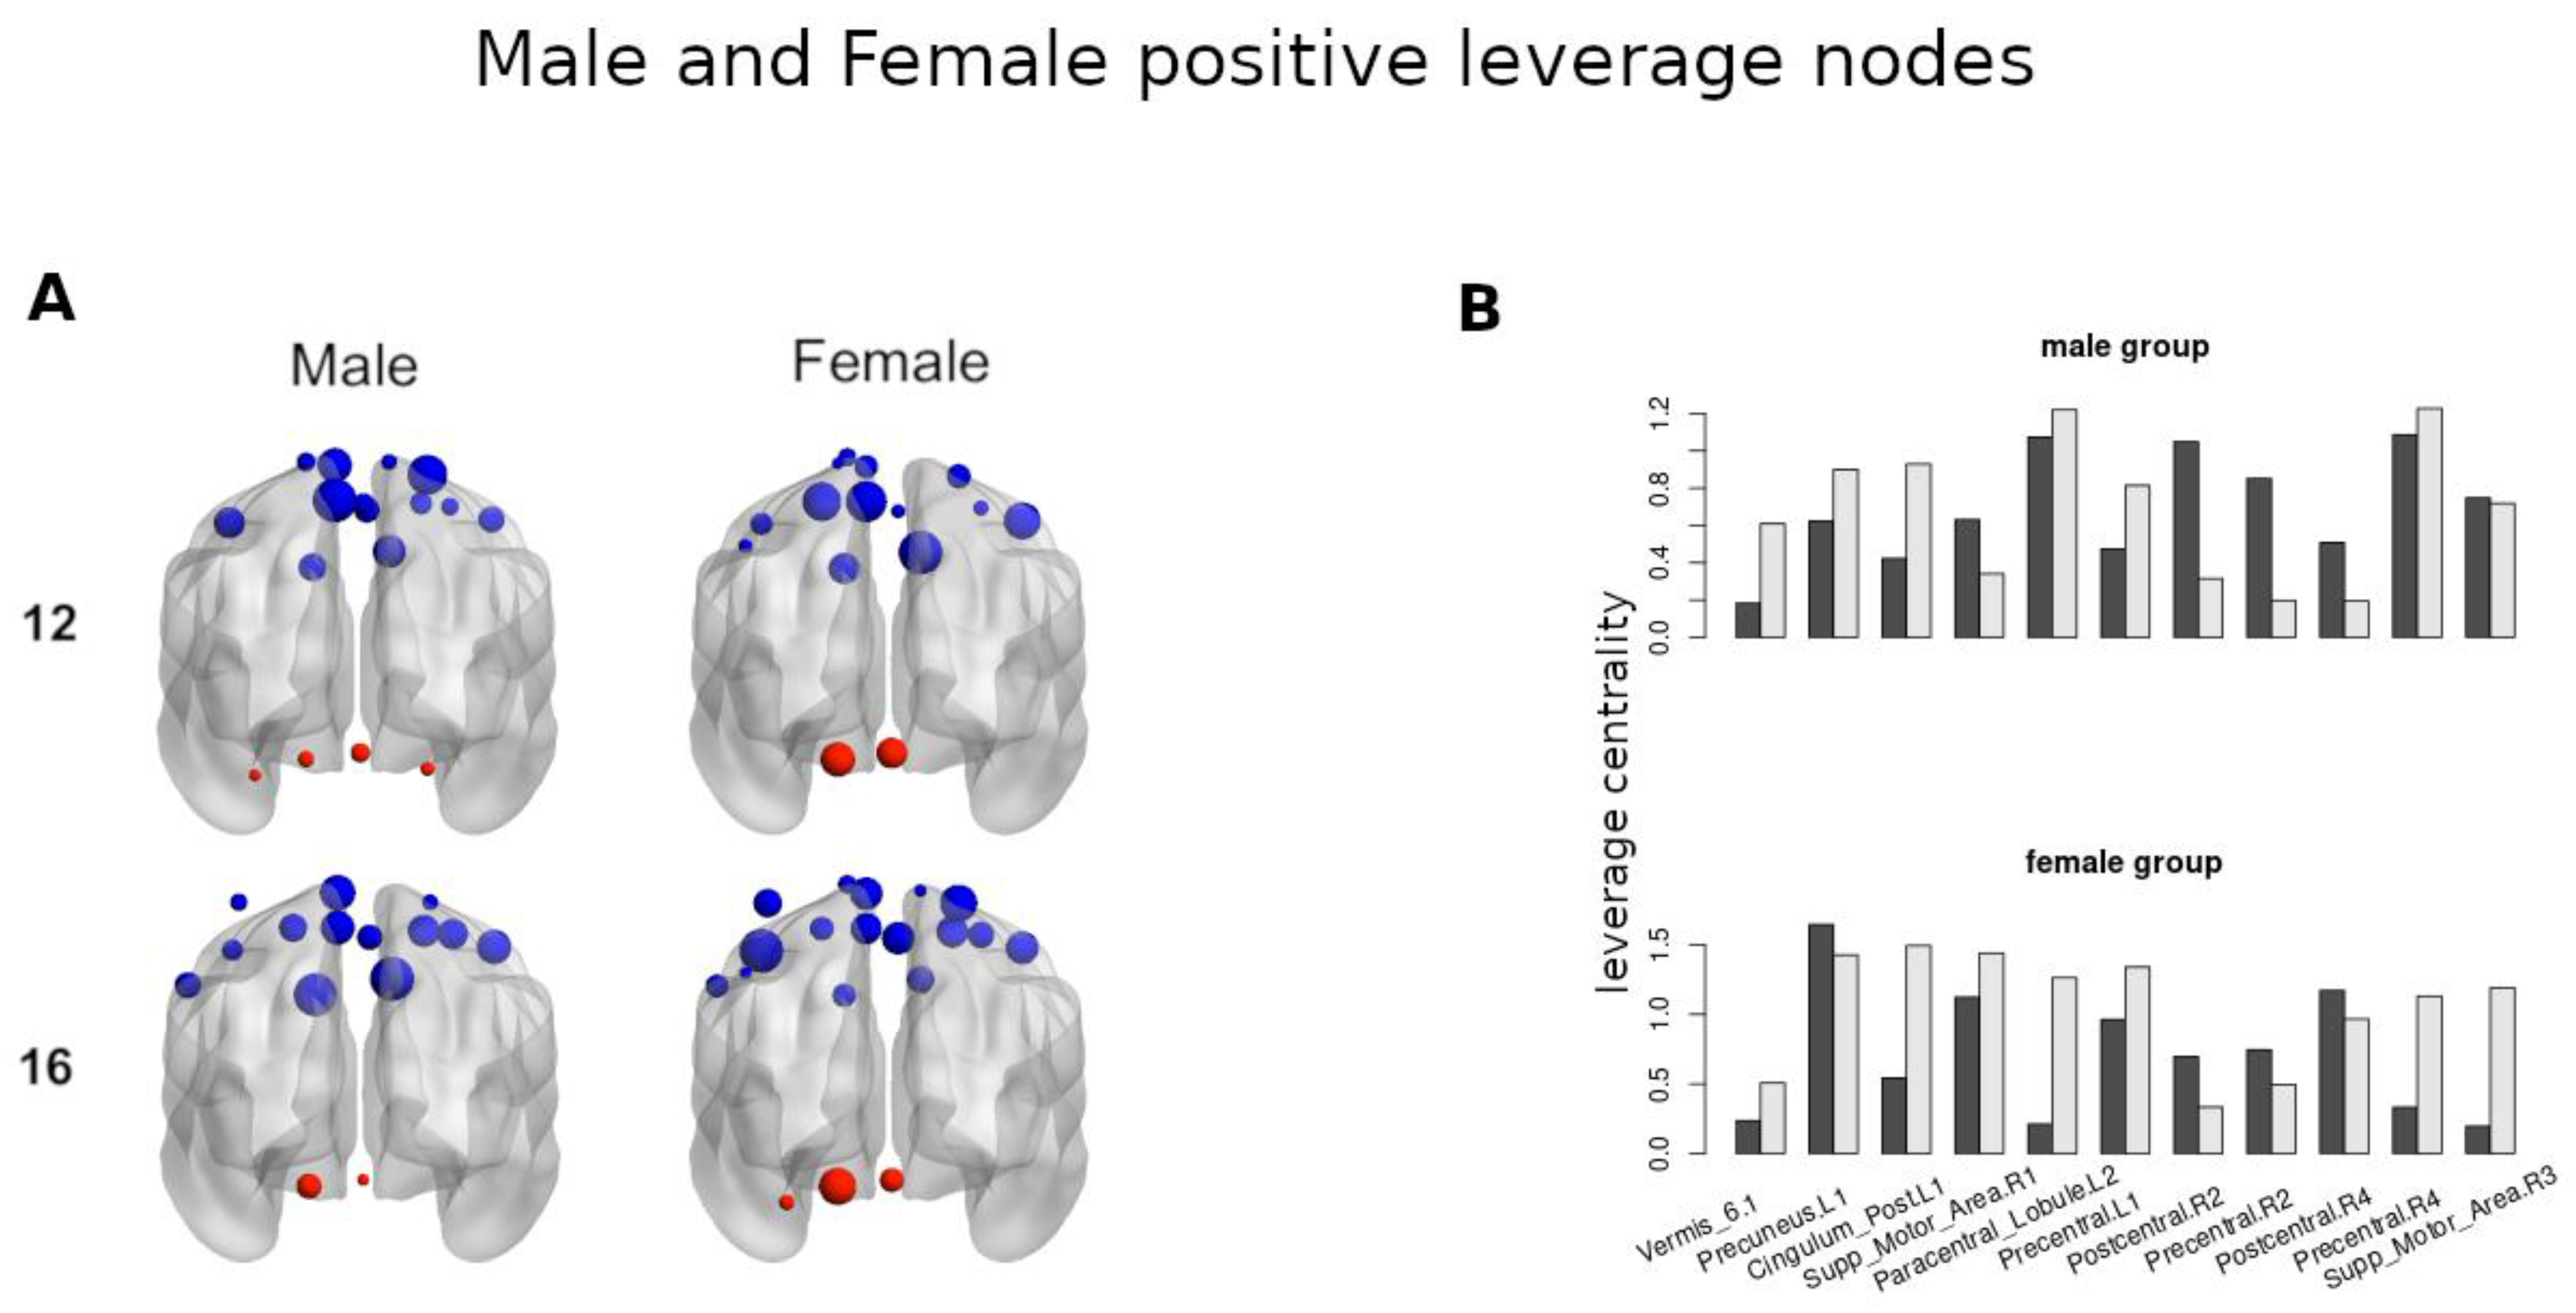
Figure 9 shows the brain regions with positive leverage values. Figure 9A (left) corresponds to the male groups at ages 12 and 16, which had 17 and 15 positive leverage-valued regions, respectively. At age 12, the three largest valued regions were the Precuneus.L1, Postcentral.R4, Paracentral_Lobule.L2, and at age 16, the two largest valued regions were the Supp_Motor_Area.R1, Cingulum_Post.L1. In the cerebellum, four regions are present, the Vermis_6.1 being the largest at age 12. At age 16, only two regions were present, the Cerebellum_6.L1 being the largest.
Figure 9A (right) corresponds to the female groups at ages 12 and 16, which had 15 and 19 positive leverage-valued regions, respectively. At age 12, the three largest regions were the Supp_Motor_Area.R1, Precuneus.L1, Precentral_R4, and at age 16, the three largest regions were the Precentral.L1, Postcentral.R4, Precentral_R4. In the cerebellum, only two regions were present, with the Cerebellum_6.L1 being the largest at age 12. At age 16, three regions were present, with the Cerebellum_6.L1 being the largest. When comparing the strength of the cerebellar region between ages, Cerebellum_6.L1 at age 16 is larger than Cerebellum_6.L1 at age 12. Figure 9B shows the common eleven positive leverage-valued regions in female and male groups for both age groups.

3.9. Sex and Age Differences in Hub Centrality in the MsN

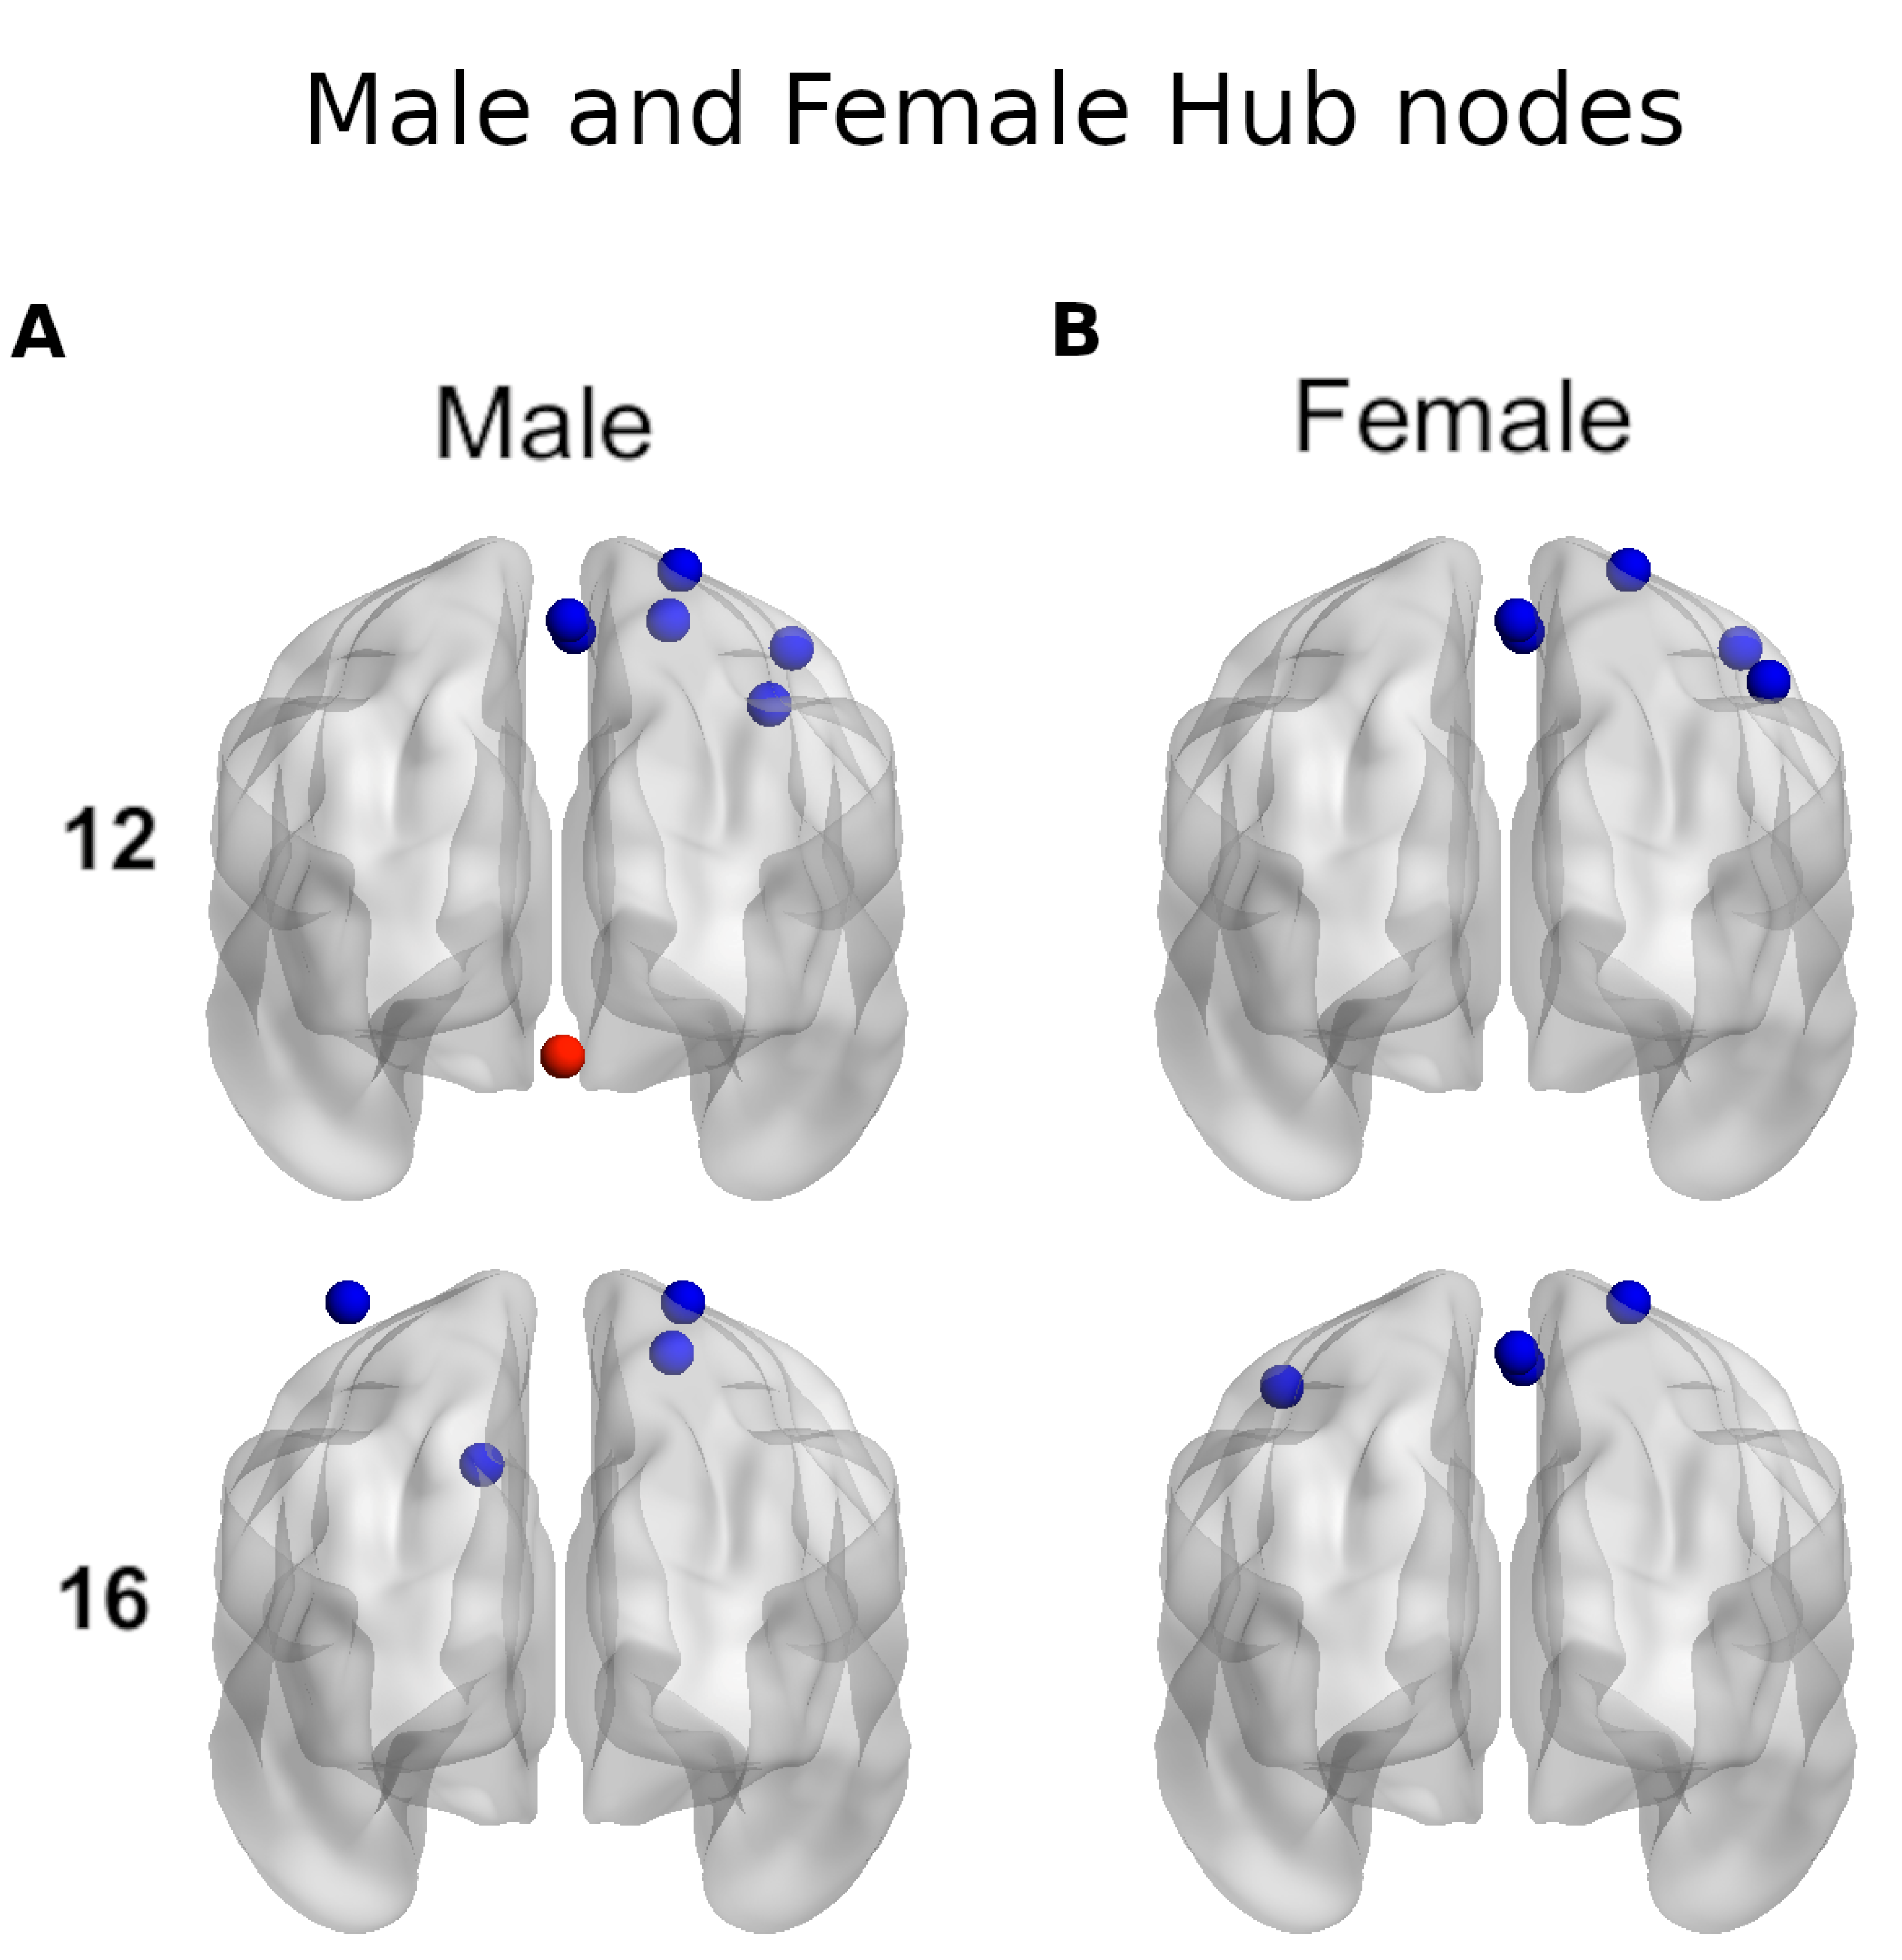
Figure 10 shows the regions with a hubness score greater or equal to 2 in at least 45% of individuals in each group. Figure 10A corresponds to the male groups of age 12 and 16, which had 7 and 4 hub regions, respectively. At age 12, the 7 hubs were in the right hemisphere and only one in the cerebellum at Vermis_6.1. At age 16, there were two hubs in the right and two in the left hemisphere, none present in the cerebellum. Figure 10B corresponds to the female groups of age 12 and 16 which had 5 and 4 hub regions, respectively. At age 12, the 5 hubs were in the right hemisphere and at age 16, there were three hubs in the right hemisphere and one in the left at Precentral.L1. There were no hubs present in the cerebellum for the female groups.

4. Discussion

Puberty is an essential stage in sexual development as sexual hormones reach their highest levels. Sexual hormones influence metabolism in a variety of tissues, including the brain. Four major findings from this study will be discussed: (1) Comparative changes in motor network connectivity between males and females during puberty, (2) sex-related changes in MsN connectivity at rest, (3) asymmetry of the cerebellar-mouth and cerebellar-hand MsN, and (4) the centrality variation of MsN regions in by age and sex.
(1)
Comparative changes in MsN connectivity in males and females during puberty.
When comparing same sex groups by age we found that there were changes in node strength values in the male group and no significant change in the female group between ages 12 and 16. A close examination of the PDFs between ages 12 and 16 shows there was an increase in node strength. Puberty is characterized by two main phases: adrenarche and gonadarche. Both phases have different onset ages depending on sex, normally occurring earlier in females. As a result, the concentration and influence of released hormones in the brain are sex-specific between ages 12 and 16. In males, adrenarche begins around 7 years old and in females around 6 years old, while gonadarche can begin between 10–15 years of age and in females between 9–14 years of age [32,33]. Adrenarche and gonadarche are associated with the secretion of adrenal androgen, which is indexed by a rise in dehydroepiandrosterone sulfate (DHEAS) and testosterone secretion.
The differences observed in our results between the MsN connectivity of males at age 12 and 16 may be associated with the levels of DHEAS and testosterone, since it has been reported to be lower in males between 6 and 13 years old compared to males between ages 13 and 16 [33,34]. Brain DHEAS concentration participates in several neurodevelopmental processes, such as modulation of neurotransmitter synaptic transmission, postsynaptic receptor activity, dendrite outgrowth, neuronal motility, and formation of gap junctions [35]. Also, testosterone increases the volume of motor-related regions such as the cerebellar cortex, caudate, putamen, and pallidum [34].
In females, no significant change occurred between the ages of 12 and 16. This result must be carefully interpreted, since DHEAS and estradiol levels are higher at age 16 and estrogen and progesterone cycles are regular when compared to age 12 in females. The connectivity of the MsN observed in this study is consistent with changes during the maturation of the cerebellum in the pubertal female [34,36], where cerebellar trajectories to the anterior lobe (primarily concerned with motor function), superior posterior, and inferior posterior lobes reach their highest volume at 11.8 years of age [36]. During this peak, volumetric changes are caused by increased neuropil, neuronal size, dendritic or axonal arborization, glia, and angiogenesis [37]. After this point, cerebellar volume decreases, which can be related to our observed decrease in cerebellar connectivity in females between these ages. Cerebellar structural change along with concentrations of hormones resulted in no significant differences in MsN connectivity when compared to females at age 12 and 16.
(2)
Sex-related changes in MsN connectivity at rest.
At the age of 12, there were higher node strength values in the male group than female group. Differential connectivity was expected due to onset of puberty phases in males and females [38].
The higher connectivity of age 12 males than females of the same age can be associated with the higher secretion levels of DHEAS and testosterone in males between 6 and 13 years old than in females [33]. The increased node strength in the male group over the female group of the same age could be attributed to these hormones as well, since testosterone has been related to neural and behavioral indices of complex motor cortical dynamics and performance [39,40].
Additionally, testosterone has been associated with increased volume of cortical and subcortical structures in the brain and cerebellum of males during adolescence [34]. Thus, node strength increases in males at age 12 can be related to distinct trajectories of regional brain maturation produced by hormonal effects on the sensory and motor cortices and cerebellum.
Between ages 15 and 16 DHEAS levels are equivalent in males and females [33], although testosterone is lower in females, they have higher estradiol levels, which is relevant in cerebellum development due to its capability of increasing dendritic spine density and of modulating synaptic connectivity, synaptogenesis, and neurogenesis [41].
(3)
Asymmetry of the cerebellar-mouth and cerebellar-hand MsN
The cerebellar-mouth MsN showed higher node strength values in the right hemisphere at both ages and sexes. The right lateralization in the cerebellar-mouth MsN was attributed to right and left node asymmetry; with two postcentral regions in each hemisphere and an additional posterior insula region in the right. The insula is involved in somatosensory, vestibular, and motor integration [42] and is activated during swallowing [43], therefore, it is a region with high functionality in cerebellar-mouth MsN even when the subject is registered at rest. Additionally, the cerebellar regions that were selected in the atlas of this study activate during lip and tongue movement [44], hence, they have a functional relationship with the insula, strengthening right subnetwork connectivity.
The cerebellar-hand MSN showed higher node strength values in the left hemisphere at both ages and sexes. The left lateralization was related to the greater number of node connections of the hand subnetwork. The cerebellar nodes (HVI and VI areas) used in this study are not related to hand and finger movement, except for the vermis, which is associated with contralateral motor activity in right-handed individuals. Therefore, the contralateral dorsolateral premotor cortex and primary motor cortex activity support our findings of greater connectivity of right-handers in the resting state, as expected and previously seen [45].
(4)
The centrality variation of the regions in the MsN by age and sex.
The most relevant MsN brain areas for leverage centrality were the Cerebellum _6.L1, Vermis_6.1, Precuneus.L1, Cingulum_Post.L1, and Supp_Motor_Area.R1.
The Precuneus consistently exhibits high leverage values in the 4 groups studied. According to studies done in macaque, this region has substantial connections in both hemispheres with the dorsal premotor area [46], the supplementary motor area (SMA), and the anterior cingulate cortex [47]. The precuneus’s major subcortical connections include corticostriatal projections to the dorsolateral caudate nucleus and putamen (basal ganglia), as well as efferent projections to brainstem structures with connections to the pontine nuclei (PN). Because PN projections reach a specific set of cerebellar regions, the precuneus gains access to multiple cerebellar circuits. Myelination of afferent connections from the PN to the cerebellum is one of the last to develop and is completed during puberty and flows through the Middle Cerebellar Peduncle, establishing somatomotor network connectivity [15]. Precuneus function has been found to be more responsive during motor imagery than during real-world movement execution [48]. More recently, using fMRI to compare the functional neuroanatomy of motor execution and motor imagery, subjects were required to perform sequential finger-tapping as either a movement execution or an imagery mode in response to visually presented stimuli. The frontal precentral sulcus zone and the posterior superior parietal cortex, which extended bilaterally to the precuneus, were imagery-dominant areas [49]. It has been observed that the precuneus has no connections with the sensory thalamic nuclei, implying that the precuneus does not share thalamic connectivity pattern of the parietal somatosensory cortical regions. This implies adolescent subjects exposed to fMRI in a resting state are actively engaged in virtual movement execution without sensory input. Therefore, it is expected that this region will function as an influencer node in all groups.
The Cingulum_Post.L1 and Supp_Motor_Area.R1 showed high leverage values and similar dynamics when compared by sex and age. The dorsal anterior cingulate cortex is hypothesized to play a role in behavior regulation by serving as a primary interface between sensory and cognitive processing [50]. Motor control is an important and distinct type of control that supports a variety of complex activities, particularly the integration of motor responses with cognitive assessment. The dorsal anterior cingulate cortex is known to be neurodevelopmentally dynamic throughout adolescence [51] and to play a role in modulating fundamental motor control [52]. Therefore, the cingulum may contribute to motor control by enhancing the execution of suitable responses and/or preventing the execution of unsuitable ones. Such a modulatory impact would be especially useful for changing behavior in demanding contexts such as a voluntary resting state. Our findings suggest that males at age 12 may have lesser motor control than females at age 12 and that males at age 16 have stronger motor control than females at age 16 at rest.
Evidence points to a functional link between the cingulum motor regions with the motor system and the origin of limb movements and finger force exertion [53]. Additionally, there are neurophysiological connections between the cingulum and the supplementary motor area (SMA); where neurons with movement activity were more common in the cingulum and neurons with both fixed and movement activity were more common in SMA [54]. In addition, it has been demonstrated that movement activity begins in the SMA and lasts less than movement activity in the cingulum [54]. The earlier average onset and shorter length of movement activity in SMA suggest that this area plays a major role in initiating movement, whereas the later onset and longer duration of movement activity in the Cingulum suggests that this area plays a more influential role in movement execution. Whereas the SMA is thought to be involved in higher-order organization and preparation of voluntary movements [55], the Cingulum motor cortex is thought to be important in cognitive aspects of intentional motor control and preparation for contextually adaptive actions [56]. Voluntary motor control and voluntary movement inhibition are two types of control that support a wide range of complex brain activities, particularly the integration of motor responses with cognitive decisions that shape behavior.
Cerebellar nodes in both female groups show greater positive values in both age groups when compared to males. Estradiol improves cerebellum connection with the motor and premotor cortices, as well as neuronal cerebellar processes relevant to females’ puberty [41]. It is interesting to note that the cerebellar nodes selected in this work have been reported to exhibit bilateral activation during movement of the lips and tongue [44,57]. Considering that in this study, the task is to remain at rest with eyes closed, it comes to attention that the regions with the highest negative values are the mouth regions, which suggests that in females these regions are more influenced than in males. The cerebellum responds to steroid, sexual, and adrenocortical hormones and produces both estradiol and progesterone during development. Estrogens regulate both excitatory and inhibitory balance in the developing cerebellum and affect not just motor coordination but also memory and mood regulation [58]. With respect to male cerebellum sex difference, there is a noticeable increased cerebellum volume due to testosterone. However, our study shows cerebellar volume is not necessarily associated with greater leverage values in the MsN of adolescents from the QTIM dataset. It is still possible that leverage nodes in males can be associated with cerebellar mass given that there is correspondence between structural and resting state functional connectivity but these were not contemplated in this analysis [59]. Although the cerebellum has traditionally been associated with balance, motor control, and the ability to learn complex motor sequences, a growing body of literature indicates that the cerebellum also plays a prominent role in higher cognitive functions. In accordance with this, our findings indicate that cerebellar areas in females had greater leverage values than males, which could be associated with cognitive and emotional functions rather than motor skills since the highest leverage values were found in the precuneus.
Concerning hubness, it was interesting to note that at the age of 12, all nodes were lateralized to the right side in both sexes, which was not expected given that all participants were right-handed and side preference corresponds to the contralateral hemisphere. Left hemispheric dominance in planned motor control and force development in right-handed individuals is well documented during motor execution. However, specifically in the default motor activity at rest, there is no available information. Using resting state data, another study classified hubs by connectivity or by high information traffic in the entire brain network in participants between 10- and 20-years-old, their results show that high connectivity and traffic hubs were predominantly in the right hemisphere, while hubs with only high traffic were predominantly in the left [60]. This supports what was observed in the right hemisphere for both sexes in our study. Although we found a statistically significant variation in the strength of the nodes of the total motor network between the sexes, it is minor. All other factors analyzed reveal no substantial difference between the sexes, which is interesting to investigate from the biological point of view. The brain, like other tissues in the human body, has distinct receptors for sex hormones that express differently between sexes. The current variability in our results could be due to a variety of factors, ranging from genetic to psychosocial, that we did not intentionally account for in our study.

5. Conclusions

Our study aimed to investigate the characteristics of motor network connectivity in an eyes-closed resting state in adolescents at the onset of puberty when registered by fMRI. The resting state brain connectivity in motor areas showed differences between 12- and 16-year-olds. At age 12, a statistically detectable variation in the node strength of the total motor network between the sexes was found, this difference was not observed at age 16. Males had increased node strength in the entire and left networks and decreased node strength in the right hemisphere network with age, in contrast with females who showed no significant change. When considering cerebellar-mouth and cerebellar-hand subnetworks, males and females showed right and left lateralization, respectively, at both ages. Males and females have a similar distribution in connectivity centrality at ages that changes with age in both sexes.
During resting state MRI acquisition, which is a stressful condition that results in voluntary inhibition of movement, we recognized the activity of the motor network, which is perhaps the most extensively connected network in the brain for it receives constant proprioceptive information and is connected to areas involved in decision-making and motor control. This work highlights the fact that the motor network does not comprise brain regions alone, but also consists of the input received from a large body source, the muscle, accounting for at least 50% of the body. Input sensors, located in muscle and skin cells, as well as glia, are influenced by hormonal production during puberty. The connectivity differences, slight as they might be, were found to be significant, even during a resting state task, where movement is actively inhibited during an MRI scan. The current variability in our results could be due to a variety of factors, ranging from genetic to psychosocial, that we did not intentionally account for in our study.
The results of this fMRI research could provide a clinical tool for often occurring behavioral disorders during adolescence, some of which are more common in females, such as depression, or in males, such as autism, attention deficit hyperactivity disorder, addiction, or schizophrenia. Nevertheless, male and female brain routes underlying behavioral changes expressed by motor control are partially distinct in healthy conditions and should be considered. It is shown that there are variations in brain connectivity between males and females as well as age differences in puberty, therefore, the treatment approach to adolescent behavioral disorders, a growing public health concern, should consider this fact.

Author Contributions

L.P.-B.: Conceptualization, methodology, formal analysis, data curation, writing original draft. G.G.-G.: Formal analysis, data curation, writing-review, results discussion. A.O.-A.: Conceptualization, formal analysis, writing original draft, review and editing, supervision and project administration. All authors have read and agreed to the published version of the manuscript.

Funding

This study was partially supported by grants DGAPA (Dirección General del Personal Académico, Universidad Nacional Autónoma de México (UNAM)) IN215123 (A.O.A.).

Institutional Review Board Statement

Data analysis was authorized by the Research and Ethical Committee of the Research Division, Faculty of Medicine, National Autonomous University of Mexico under number 018/2023.

Informed Consent Statement

Written, informed consent was obtained from all participants, including a parent or guardian for those aged under 18 years, and the study was approved by the Human Research Ethics Committee at the QIMR Berghofer Medical Research Institute (Ref#P701).

Data Availability Statement

Data was downloaded from OpenNeuro database. Code is available upon request to Lucero Pacheco-Blas.

Acknowledgments

María del Lucero Pacheco Blas is a doctoral student, from Programa de Doctorado en Ciencias Biomédicas, Universidad Nacional Autónoma de México (UNAM) and received fellowship CVU619496 from Consejo Nacional de Ciencia y Tecnología (CONACyT). We thank Strike, Lachlan T. and Blokland, Gabriella A.M. and Hansell, Narelle K. and Martin, Nicholas G. and Toga, Arthur W. and Thompson, Paul M. and de Zubicaray, Greig I. and McMahon, Katie L. and Wright, Margaret J. (2023). Queensland Twin IMaging (QTIM). OpenNeuro. [Dataset] doi: doi:10.18112/openneuro.ds004169.v1.0.7. We thank; Claudia González-González for statistical analysis discussion and Ibrahim A. Ramirez-Soto from the Department of Kinesiology, University of Waterloo, Canada, for proofreading the manuscript ([email protected]).

Conflicts of Interest

The authors declare no conflict of interest.

References

  1. Blakemore, S.-J. The social brain in adolescence. Nat. Rev. Neurosci. 2008, 9, 267–277. [Google Scholar] [CrossRef]
  2. Rehbein, E.; Hornung, J.; Sundström Poromaa, I.; Derntl, B. Shaping of the Female Human Brain by Sex Hormones: A Review. Neuroendocrinology 2020, 111, 183–206. [Google Scholar] [CrossRef] [PubMed]
  3. Corrigan, N.M.; Yarnykh, V.L.; Hippe, D.S.; Owen, J.P.; Huber, E.; Zhao, T.C.; Kuhl, P.K. Myelin development in cerebral gray and white matter during adolescence and late childhood. NeuroImage 2021, 227, 117678. [Google Scholar] [CrossRef] [PubMed]
  4. Cope, L.M.; Hardee, J.E.; Martz, M.E.; Zucker, R.A.; Nichols, T.E.; Heitzeg, M.M. Developmental maturation of inhibitory control circuitry in a high-risk sample: A longitudinal fMRI study. Dev. Cogn. Neurosci. 2020, 43, 100781. [Google Scholar] [CrossRef]
  5. Levin, H.S.; Culhane, K.A.; Hartmann, J.; Evankovich, K.; Mattson, A.J.; Harward, H.; Ringholz, G.; Ewing-Cobbs, L.; Fletcher, J.M. Developmental changes in performance on tests of purported frontal lobe functioning. Dev. Neuropsychol. 1991, 7, 377–395. [Google Scholar] [CrossRef]
  6. Williams, A.M.; Grant, A. Training perceptual skill in sport. Int. J. Sport Psychol. 1999, 30, 194–220. [Google Scholar]
  7. Pas, P.; Hulshoff Pol, H.E.; Raemaekers, M.; Vink, M. Self-regulation in the pre-adolescent brain. Dev. Cogn. Neurosci. 2021, 51, 101012. [Google Scholar] [CrossRef]
  8. Fields, R.D. White matter in learning, cognition and psychiatric disorders. Trends Neurosci. 2008, 31, 361–370. [Google Scholar] [CrossRef]
  9. Nave, K.-A. Myelination and support of axonal integrity by glia. Nature 2010, 468, 244–252. [Google Scholar] [CrossRef]
  10. Dekaban, A.S.; Sadowsky, D. Changes in brain weights during the span of human life: Relation of brain weights to body heights and body weights. Ann. Neurol. 1978, 4, 345–356. [Google Scholar] [CrossRef]
  11. Groeschel, S.; Vollmer, B.; King, M.D.; Connelly, A. Developmental changes in cerebral grey and white matter volume from infancy to adulthood. Int. J. Dev. Neurosci. 2010, 28, 481–489. [Google Scholar] [CrossRef] [PubMed]
  12. Garcia-Segura, L.M.; Melcangi, R.C. Steroids and glial cell function. Glia 2006, 54, 485–498. [Google Scholar] [CrossRef] [PubMed]
  13. Cerghet, M.; Skoff, R.P.; Bessert, D.; Zhang, Z.; Mullins, C.; Ghandour, M.S. Proliferation and Death of Oligodendrocytes and Myelin Proteins Are Differentially Regulated in Male and Female Rodents. J. Neurosci. 2006, 26, 1439–1447. [Google Scholar] [CrossRef]
  14. Marin-Husstege, M.; Muggironi, M.; Raban, D.; Skoff, R.P.; Casaccia-Bonnefil, P. Oligodendrocyte Progenitor Proliferation and Maturation Is Differentially Regulated by Male and Female Sex Steroid Hormones. Dev. Neurosci. 2005, 26, 245–254. [Google Scholar] [CrossRef]
  15. Buyanova, I.S.; Arsalidou, M. Cerebral White Matter Myelination and Relations to Age, Gender, and Cognition: A Selective Review. Front. Hum. Neurosci. 2021, 15, 662031. [Google Scholar] [CrossRef]
  16. Andersen, B.B.; Korbo, L.; Pakkenberg, B. A quantitative study of the human cerebellum with unbiased stereological techniques. J. Comp. Neurol. 1992, 326, 549–560. [Google Scholar] [CrossRef]
  17. Strike, L.T.; Hansell, N.K.; Chuang, K.-H.; Miller, J.L.; de Zubicaray, G.I.; Thompson, P.M.; McMahon, K.L. The Queensland Twin Adolescent Brain Project, a longitudinal study of adolescent brain development. Sci. Data 2023, 10, 195. [Google Scholar] [CrossRef] [PubMed]
  18. Sinclair, B.; Hansell, N.K.; Blokland, G.A.; Martin, N.G.; Thompson, P.M.; Breakspear, M.; de Zubicaray, G.I.; Wright, M.J.; McMahon, K.L. Heritability of the network architecture of intrinsic brain functional connectivity. Neuroimage 2015, 121, 243–252. [Google Scholar] [CrossRef]
  19. Esteban, O.; Markiewicz, C.J.; Blair, R.W.; Moodie, C.A.; Isik, A.I.; Erramuzpe, A.; Kent, J.D.; Goncalves, M.; DuPre, E.; Snyder, M.; et al. fMRIPrep: A robust preprocessing pipeline for functional MRI. Nat. Methods 2019, 16, 111–116. [Google Scholar] [CrossRef]
  20. Zhang, Y.; Brady, M.; Smith, S. Segmentation of brain MR images through a hidden Markov random field model and the expectation-maximization algorithm. IEEE Trans. Med. Imaging 2001, 20, 45–57. [Google Scholar] [CrossRef] [PubMed]
  21. Jenkinson, M.; Smith, S. A global optimisation method for robust affine registration of brain images. Med. Image Anal. 2001, 5, 143–156. [Google Scholar] [CrossRef] [PubMed]
  22. Jenkinson, M.; Bannister, P.; Brady, M.; Smith, S. Improved Optimization for the Robust and Accurate Linear Registration and Motion Correction of Brain Images. NeuroImage 2002, 17, 825–841. [Google Scholar] [CrossRef] [PubMed]
  23. Gorgolewski, K.J.; Gorgolewski, K.J.; Esteban, O.; Ellis, D.G.; Notter, M.P.; Ziegler, E.; Johnson, H.; Hamalainen, C.; Yvernault, B.; Burns, C.; et al. Nipype: A Flexible, Lightweight and Extensible Neuroimaging Data Processing Framework in Python. Front. Neuroinformatics 2017, 5, 13. [Google Scholar] [CrossRef] [PubMed]
  24. Behzadi, Y.; Restom, K.; Liau, J.; Liu, T.T. A component based noise correction method (CompCor) for BOLD and perfusion based fMRI. NeuroImage 2007, 37, 90–101. [Google Scholar] [CrossRef]
  25. Power, J.D.; Cohen, A.L.; Nelson, S.M.; Wig, G.S.; Barnes, K.A.; Church, J.A.; Vogel, A.C.; Laumann, T.O.; Miezin, F.M.; Schlaggar, B.L.; et al. Functional Network Organization of the Human Brain. Neuron 2011, 72, 665–678. [Google Scholar] [CrossRef]
  26. Finc, K. Nilearn/Nistats Pipelines for Task-Based Functional Connectivity Analysis. 2022. Available online: https://github.com/kfinc/nilearn-task-networks (accessed on 16 March 2023).
  27. Watson, C.G.; Stopp, C.; Newburger, J.W.; Rivkin, M.J. Graph theory analysis of cortical thickness networks in adolescents with d-transposition of the great arteries. Brain Behav. 2018, 8, e00834. [Google Scholar] [CrossRef]
  28. Barrat, A.; Barthelemy, M.; Pastor-Satorras, R.; Vespignani, A. The architecture of complex weighted networks. Proc. Natl. Acad. Sci. USA 2004, 101, 3747–3752. [Google Scholar] [CrossRef]
  29. van den Heuvel, M.P.; Mandl, R.C.W.; Stam, C.J.; Kahn, R.S.; Pol, H.E.H. Aberrant Frontal and Temporal Complex Network Structure in Schizophrenia: A Graph Theoretical Analysis. J. Neurosci. 2010, 30, 15915–15926. [Google Scholar] [CrossRef]
  30. Joyce, K.E.; Laurienti, P.J.; Burdette, J.H.; Hayasaka, S. A New Measure of Centrality for Brain Networks. PLoS ONE 2010, 5, e12200. [Google Scholar] [CrossRef]
  31. Silverman, B.W. Density Estimation for Statistics and Data Analysis; CRC Springer: Berlin, Germany, 1986. [Google Scholar] [CrossRef]
  32. Biro, F.M.; Pinney, S.M.; Huang, B.; Baker, E.R.; Walt Chandler, D.; Dorn, L.D. Hormone Changes in Peripubertal Girls. J. Clin. Endocrinol. Metab. 2014, 99, 3829–3835. [Google Scholar] [CrossRef]
  33. Rosenfield, R.L.; Cooke, D.W.; Radovick, S. 16—Puberty in the Female and Its Disorders. In Sperling Pediatric Endocrinology, 5th ed.; Sperling, M.A., Ed.; Elsevier: Amsterdam, The Netherlands, 2021; pp. 528–626. [Google Scholar] [CrossRef]
  34. Wierenga, L.M.; Bos, M.G.; Schreuders, E.; vd Kamp, F.; Peper, J.S.; Tamnes, C.K.; Crone, E.A. Unraveling age, puberty and testosterone effects on subcortical brain development across adolescence. Psychoneuroendocrinology 2018, 91, 105–114. [Google Scholar] [CrossRef] [PubMed]
  35. Dong, Y.; Zheng, P. Dehydroepiandrosterone Sulphate: Action and Mechanism in the Brain. J. Neuroendocrinol. 2011, 24, 215–224. [Google Scholar] [CrossRef] [PubMed]
  36. Tiemeier, H.; Lenroot, R.K.; Greenstein, D.K.; Tran, L.; Pierson, R.; Giedd, J.N. Cerebellum development during childhood and adolescence: A longitudinal morphometric MRI study. NeuroImage 2010, 49, 63–70. [Google Scholar] [CrossRef]
  37. Chechik, G.; Meilijson, I.; Ruppin, E. Neuronal Regulation: A Mechanism for Synaptic Pruning During Brain Maturation. Neural Comput. 1999, 11, 2061–2080. [Google Scholar] [CrossRef] [PubMed]
  38. Laube, C.; van den Bos, W.; Fandakova, Y. The relationship between pubertal hormones and brain plasticity: Implications for cognitive training in adolescence. Dev. Cogn. Neurosci. 2020, 42, 100753. [Google Scholar] [CrossRef] [PubMed]
  39. Fung, M.H.; Heinrichs-Graham, E.; Taylor, B.K.; Frenzel, M.R.; Eastman, J.A.; Wang, Y.P.; Calhoun, V.D.; Stephen, J.M.; Wilson, T.W. The development of sensorimotor cortical oscillations is mediated by pubertal testosterone. NeuroImage 2022, 264, 119745. [Google Scholar] [CrossRef]
  40. Killanin, A.D.; Taylor, B.K.; Embury, C.M.; Picci, G.; Wang, Y.-P.; Calhoun, V.D.; Stephen, J.M.; Heinrichs-Graha, E.; Wilson, T.W. Testosterone levels mediate the dynamics of motor oscillatory coding and behavior in developing youth. Dev. Cogn. Neurosci. 2023, 61, 101257. [Google Scholar] [CrossRef]
  41. Dieni, C.V.; Contemori, S.; Biscarini, A.; Panichi, R. De Novo Synthesized Estradiol: A Role in Modulating the Cerebellar Function. Int. J. Mol. Sci. 2020, 21, 3316. [Google Scholar] [CrossRef]
  42. Namkung, H.; Kim, S.-H.; Sawa, A. The Insula: An Underestimated Brain Area in Clinical Neuroscience, Psychiatry, and Neurology. Trends Neurosci. 2017, 40, 200–207. [Google Scholar] [CrossRef]
  43. Lowell, S.Y.; Poletto, C.J.; Knorr-Chung, B.R.; Reynolds, R.C.; Simonyan, K.; Ludlow, C.L. Sensory stimulation activates both motor and sensory components of the swallowing system. NeuroImage 2008, 42, 285–295. [Google Scholar] [CrossRef]
  44. Grodd, W.; Hülsmann, E.; Lotze, M.; Wildgruber, D.; Erb, M. Sensorimotor mapping of the human cerebellum: fMRI evidence of somatotopic organization. Hum. Brain Mapp. 2001, 13, 55–73. [Google Scholar] [CrossRef]
  45. Pool, E.-M.; Rehme, A.K.; Eickhoff, S.B.; Fink, G.R.; Grefkes, C. Functional resting-state connectivity of the human motor network: Differences between right- and left-handers. NeuroImage 2015, 109, 298–306. [Google Scholar] [CrossRef]
  46. Goldman-Rakic, P.S. Motor Control Function of the Prefrontal Cortex. In Ciba Foundation Symposium 132—Motor Areas of the Cerebral Cortex; John Wiley & Sons, Ltd.: Chichester, UK, 2007; pp. 187–200. [Google Scholar] [CrossRef]
  47. Leichnetz, G.R. Connections of the medial posterior parietal cortex (area 7 m) in the monkey. Anat. Rec. 2001, 263, 215–236. [Google Scholar] [CrossRef]
  48. Malouin, F.; Richards, C.L.; Jackson, P.L.; Dumas, F.; Doyon, J. Brain activations during motor imagery of locomotor-related tasks: A PET study. Hum. Brain Mapp. 2003, 19, 47–62. [Google Scholar] [CrossRef] [PubMed]
  49. Hanakawa, T.; Immisch, I.; Toma, K.; Dimyan, M.A.; Van Gelderen, P.; Hallett, M. Functional Properties of Brain Areas Associated with Motor Execution and Imagery. J. Neurophysiol. 2003, 89, 989–1002. [Google Scholar] [CrossRef]
  50. Carter, C.S.; van Veen, V. Anterior cingulate cortex and conflict detection: An update of theory and data. Cogn. Affect. Behav. Neurosci. 2007, 7, 367–379. [Google Scholar] [CrossRef]
  51. Eshel, N.; Nelson, E.E.; Blair, R.J.; Pine, D.S.; Ernst, M. Neural substrates of choice selection in adults and adolescents: Development of the ventrolateral prefrontal and anterior cingulate cortices. Neuropsychologia 2007, 45, 1270–1279. [Google Scholar] [CrossRef]
  52. Paus, T.; Petrides, M.; Evans, A.C.; Meyer, E. Role of the human anterior cingulate cortex in the control of oculomotor, manual, and speech responses: A positron emission tomography study. J. Neurophysiol. 1993, 70, 453–469. [Google Scholar] [CrossRef]
  53. Dettmers, C.; Fink, G.R.; Lemon, R.N.; Stephan, K.M.; Passingham, R.E.; Silbersweig, D.; Holmes, A.; Ridding, M.C.; Brooks, D.J.; Frackowiak, R.S. Relation between cerebral activity and force in the motor areas of the human brain. J. Neurophysiol. 1995, 74, 802–815. [Google Scholar] [CrossRef] [PubMed]
  54. Russo, G.S.; Backus, D.A.; Ye, S.; Crutcher, M.D. Neural Activity in Monkey Dorsal and Ventral Cingulate Motor Areas: Comparison with the Supplementary Motor Area. J. Neurophysiol. 2002, 88, 2612–2629. [Google Scholar] [CrossRef] [PubMed]
  55. Shibasaki, H.; Hallett, M. What is the Bereitschaftspotential? Clin. Neurophysiol. 2006, 117, 2341–2356. [Google Scholar] [CrossRef] [PubMed]
  56. Shima, K.; Tanji, J. Role for Cingulate Motor Area Cells in Voluntary Movement Selection Based on Reward. Science 1998, 282, 1335–1338. [Google Scholar] [CrossRef] [PubMed]
  57. Mottolese, C.; Richard, N.; Harquel, S.; Szathmari, A.; Sirigu, A.; Desmurget, M. Mapping motor representations in the human cerebellum. Brain 2013, 136, 330–342. [Google Scholar] [CrossRef]
  58. Hedges, V.L.; Ebner, T.J.; Meisel, R.L.; Mermelstein, P.G. The cerebellum as a target for estrogen action. Front. Neuroendocrinol. 2012, 33, 403–411. [Google Scholar] [CrossRef] [PubMed]
  59. Hagmann, P.; Cammoun, L.; Gigandet, X.; Meuli, R.; Honey, C.J.; Wedeen, V.J.; Sporns, O. Mapping the Structural Core of Human Cerebral Cortex. PLoS Biol. 2008, 6, e159. [Google Scholar] [CrossRef]
  60. Hwang, K.; Hallquist, M.N.; Luna, B. The Development of Hub Architecture in the Human Functional Brain Network. Cereb. Cortex 2013, 23, 2380–2393. [Google Scholar] [CrossRef]
Figure 1. Workflow of graph construction. (A) Atlas selection. (B) Extraction of the time series of each region of the selected networks. (C) Adjacency matrix construction from Pearson correlation. (D) Graph construction and analysis.
Applsci 13 10006 g001
Figure 2. Sex and age differences in MsN of adolescents. (A) MsN coronal view of a representative male and female at ages 12 and 16. (B) The curves are the probability density function of the node strength for the MsN for males at age 12 (solid line) n = 22 and females at age 12 (dashed line) n = 28 (D = 0.141, p-value = 0). For males at age 16 (solid line) n = 20 and females at age 16 (dashed lines) n = 37 (D = 0.078, p-value = 0.044). Hand regions (30 blue spheres), mouth regions (5 green spheres) and cerebellar regions (4 red spheres). (C) Principal Component Analysis (PCA) using the strength and leverage values from the 39 regions. The colors as shown correspond to the 12- and 16-year-old female (F) and male (M) groups. The ellipses represent the confidence around the geometrical mean.
Applsci 13 10006 g002
Figure 3. Node strength brain asymmetry of the MsN in male adolescents. (A) Coronal, left and right views of the MsN from 12 and 16-year-old males, respectively. (B) The curves following the horizontal arrows represent the probability density function of the node strength for the entire network. Comparison of the networks of the left (solid line) and right (dashed line) hemispheres in the 12 year-old male group (n = 22, left hemisphere greater node strength D = 0.193, p-value = 0.0) and comparison of the networks of the left (solid line) and right (dashed line) hemispheres in the 16 year-old male group (n = 20, right greater node strength, D = 0.143, p-value = 0.0001). (C) The curves following the vertical arrows represent the probability density function of the node strength for the entire network (D = 0.133, p-value = 0.0003). Comparison of the entire MsN (coronal view) between 12 (solid line) and 16-year-old (dashed line) males. Comparison of the left hemisphere nodes between 12 (solid line) and 16-year-old (dashed line) male groups (D = 0.188, p-value = 0.0); comparison of the networks of the right hemisphere nodes between 12 (solid line) and 16-year-old (dashed line) male groups (D = 0.100, p-value = 0.0078). Hand regions (30 blue spheres), mouth regions (5 green spheres) and cerebellar regions (4 red spheres).
Applsci 13 10006 g003
Figure 4. Node strength brain asymmetry of the MsN in female adolescents. (A) Corresponds to a coronal, left and right views of the MsN from 12- and 16-year-old females, respectively. (B) The curves following the horizontal arrows represent the probability density function of the node strength for the entire network. Comparison of the networks of the left (solid line) and right (dashed line) hemispheres in the 12-year-old female group (n = 28, right hemisphere greater node strength values D = 0.109 p-value = 0.0109); comparison of the networks of the left (solid line) and right (dashed line) hemispheres in 16-year-old male group (n = 37, right hemisphere had greater node strength values D = 0.100, p-value = 0.0155). (C) The curves following the vertical arrows represent the probability density function of the node strength for the entire MsN. Comparison of the entire network (coronal view) between 12-year-old (solid line) and 16-year-old (dashed line) female groups (no significant differences p-value = 0.0862) groups. Comparison of the left hemisphere nodes between 12- (solid line) and 16-year-old (dashed line) female groups (no significant differences p-value = 0.0732). Comparison of the networks of the right hemisphere nodes between 12- (solid line) and 16-year-old (dashed line) female groups (no significant differences p-value = 0.0732). Hand regions (30 blue spheres), mouth regions (5 green spheres) and cerebellar regions (4 red spheres).
Applsci 13 10006 g004
Figure 5. Cerebellar-mouth MsN node strength asymmetry in male adolescents. (A) Corresponds to a coronal, left and right views of the MsN from 12- and 16-year-old males, respectively. (B) The curves following the horizontal arrows represent the probability density function of the node strength for the entire network. Comparison of the networks of the left (solid line) and right (dashed line) hemispheres in the 12-year-old male group (n = 22, right hemisphere greater node strength values D = 0.422, p-value = 0.0); comparison of the networks of the left (solid line) and right (dashed line) hemispheres in 16 year-old male group (n = 20, D = 0.344, p-value = 0.0). (C) The curves following the vertical arrows represent the probability density function of the node strength for the entire network. Comparison of the entire subnetwork (coronal view) between 12- (solid line) and 16-year-old (dashed line) (16 year-olds greater node strength values D = 0.117, p-value = 0.0022) groups. Comparison of the left hemisphere nodes between 12- (solid line) and 16-year-old (dashed line) male groups (12-year-olds greater node strength values D = 0.131, p-value = 0.0003) and comparison of the networks of the right hemisphere nodes between 12-year-old (solid line) and 16-year-old (dashed line) male groups (12-year-olds greater node strength values D = 0.145, p-value = 0.0001). Mouth regions (5 green spheres) and cerebellar regions (4 red spheres).
Applsci 13 10006 g005
Figure 6. Cerebellar-mouth MsN node strength asymmetry in female adolescents. (A) Corresponds to a coronal, left and right representation of the motor network from 12- and 16-year-old female groups, respectively. (B) The curves following the horizontal arrows represent the probability density function of the node strength for the entire network. Comparison of the networks of the left (solid line) and right (dashed line) hemispheres in the 12-year-old female group (n = 28, right hemisphere had greater node strength values, D = 0.326, p-value = 0.0) and comparison of the networks of the left (solid line) and right (dashed line) hemispheres in 16-year-old male group (n = 37, right hemisphere had greater node strength values D = 0.391 p-value = 0.0). (C) The curves following the vertical arrows represent the probability density function of the node strength for the entire subnetwork. Comparison of the entire subnetwork (coronal view) between 12 (solid line) and 16-year-old (dashed line) (12-year-olds greater node strength values D = 0.217, p-value = 0.0) groups. Comparison of the left hemisphere nodes between 12- (solid line) and 16-year-old (dashed line) female groups (16-year-olds greater node strength values D = 0.170, p-value = 0.0) and comparison of the networks of the right hemisphere nodes between 12 (solid line) and 16-year-old (dashed line) female groups (12-year-olds greater node strength values D = 0.254, p-value = 0.0). Mouth regions (5 green spheres) and cerebellar regions (4 red spheres).
Applsci 13 10006 g006
Figure 7. Cerebellar-hand MsN node strength asymmetry in male adolescents. (A) Corresponds to a coronal, left and right representation of the cerebellar-hand subnetwork from 12- and 16-year-old males, respectively. (B) The curves following the horizontal arrows represent the probability density function of the node strength for the entire subnetwork. Comparison of the networks of the left (solid line) and right (dashed line) hemispheres in the 12-year-old male group (n = 22, left hemisphere had greater node strength values D = 0.211, p-value = 0); comparison of the networks of the left (solid line) and right (dashed line) hemispheres in 16-year-old male group (n = 20, left hemisphere had greater node strength values D = 0.152, p-value = 0). (C) The curves following the vertical arrows represent the probability density function of the node strength for the entire network. Comparison of the entire network (coronal view) between 12- (solid line) and 16-year-old (dashed line) (12-year-old greater node strength values D = 0.250 p-value = 0.0) groups. Comparison of the left hemisphere nodes between 12- (solid line) and 16-year-old (dashed line) male groups (12-year-olds greater node strength values D = 0.221, p-value = 0.0) and comparison of the networks of the right hemisphere nodes between 12- (solid line) and 16-year-old (dashed line) male groups (12-year-olds greater node strength values D = 0.127, p-value = 0.0004). Hand regions (30 blue spheres) and cerebellar regions (4 red spheres).
Applsci 13 10006 g007
Figure 8. Cerebellar-hand MsN node strength asymmetry in female adolescents. (A) Corresponds to a coronal, left and right representation of the cerebellar-hand subnetwork from 12- and 16-year-old females, respectively. (B) The curves following the horizontal arrows represent the probability density function of the node strength for the entire network. Comparison of the networks of the left (solid line) and right (dashed line) hemispheres in 12-year-old female group (n = 28, left hemisphere had greater node strength values D = 0.115, p-value = 0.0028); comparison of the networks of the left (solid line) and right (dashed line) hemispheres in 16-year-old male group (n = 37, left hemisphere had greater node strength values D = 0.152, p-value = 0.0). (C) The curves following the vertical arrows represent the probability density function of the node strength for the entire network. Comparison of the entire network (coronal view) between 12-year-old (solid line) and 16-year-old (dashed line) (no significant difference was found p-value = 0.0745) groups. Comparison of the left hemisphere nodes between 12- (solid line) and 16-year-old (dashed line) female groups (12-year-olds greater node strength values D = 0.090, p-value = 0.0267) and comparison of the networks of the right hemisphere nodes between 12- (solid line) and 16-year-old (dashed line) female groups (16-year-olds greater node strength values D = 0.098, p-value = 0.0379). Hand regions (30 blue spheres) and cerebellar regions (4 red spheres).
Applsci 13 10006 g008
Figure 9. Male and female positive leverage nodes at each age group. (A) Coronal view of the nodes with leverage positive group sum values. Hand regions (blue spheres) and cerebellar regions (red spheres). (B) Leverage values of each sex group, the dark bars correspond to the 12-year-olds and the light bars to the 16-year-olds.
Applsci 13 10006 g009
Figure 10. Male and female hub nodes at each age group. Coronal view of the nodes that were a hub in at least 45% of the population in each group. Hand regions (blue spheres) and cerebellar regions (red spheres). (A) male groups, (B) female groups.
Applsci 13 10006 g010
Table 1. Region names, coordinates, and anatomical location from the Cerebellar, Sensory/Somatomotor Hand and Sensory/Somatomotor Mouth networks from the Power atlas as reported in brainGraph R package [27].
NetworkNameAnatomical Locationxyz
CerebellarCerebellum_6.L1Cerebellum Exterior−16−65−20
Cerebellum_6.L2Cerebellum Exterior−32−55−25
Cerebellum_6.R1Cerebellum Exterior22−58−23
Vermis_6.1Cerebellar Vermal Lobules I-V1−62−18
Sensory/Somatomotor HandPrecuneus.L1Cerebral White Matter−7−5261
Cingulum_Post.L1Supplementary Motor Cortex−14−1840
Supp_Motor_Area.L1NA0−1547
Supp_Motor_Area.R1Supplementary Motor Cortex10−245
Paracentral_Lobule.L1Precentral Gyrus Medial Segment−7−2165
Paracentral_Lobule.L2Precentral Gyrus−7−3372
Postcentral.R1Postcentral Gyrus13−3375
Parietal_Inf.L1Postcentral Gyrus−54−2343
Precentral.R1Precentral Gyrus29−1771
Precuneus.R1Precuneus10−4673
Postcentral.L1Postcentral Gyrus−23−3072
Precentral.L1Precentral Gyrus−40−1954
Postcentral.R2Superior Parietal Lobule29−3959
Postcentral.R3Postcentral Gyrus50−2042
Postcentral.L2Postcentral Gyrus−38−2769
Precentral.R2Postcentral Gyrus20−2960
Precentral.R3Precentral Gyrus44−857
Postcentral.L3Superior Parietal Lobule−29−4361
Supp_Motor_Area.R2Precentral Gyrus10−1774
Postcentral.R4Postcentral Gyrus22−4269
Postcentral.L4NA−45−3247
Postcentral.L5Postcentral Gyrus−21−3161
Paracentral_Lobule.L3Precentral Gyrus−13−1775
Precentral.R4Precentral Gyrus42−2055
Precentral.L2Precentral Gyrus−38−1569
Parietal_Sup.L1Postcentral Gyrus−16−4673
Paracentral_Lobule.R1NA2−2860
Supp_Motor_Area.R3Precentral Gyrus Medial Segment3−1758
Precentral.R5Postcentral Gyrus38−1745
Postcentral.R5NA47−3049
Sensory/Somatomotor MouthPostcentral.L6Precentral Gyrus−49−1135
Insula.R1Posterior Insula36−914
Postcentral.R6Precentral Gyrus51−632
Postcentral.L7Postcentral Gyrus−53−1024
Postcentral.R7Postcentral Gyrus66−825
Coordinates are in MNI space.
Disclaimer/Publisher’s Note: The statements, opinions and data contained in all publications are solely those of the individual author(s) and contributor(s) and not of MDPI and/or the editor(s). MDPI and/or the editor(s) disclaim responsibility for any injury to people or property resulting from any ideas, methods, instructions or products referred to in the content.

