Article

Prediction of Cotton Yarn Quality Based on Attention-GRU

Key Laboratory of Modern Textile Machinery & Technology of Zhejiang Province, Zhejiang Sci-Tech University, Hangzhou 310018, China
*
Authors to whom correspondence should be addressed.
Appl. Sci. 2023, 13(18), 10003; https://doi.org/10.3390/app131810003
Submission received: 17 August 2023 / Revised: 31 August 2023 / Accepted: 1 September 2023 / Published: 5 September 2023

Abstract

:
With the diversification of spinning order varieties and process parameters, the conventional method of determining production plans through trial spinning no longer satisfies the processing requirements of enterprises. Currently, deficiencies exist in predicting spinning quality relying on manual experience and traditional methods. The back propagation (BP) neural network within the realm of deep learning theory faces challenges in handling time series data, while the long short-term memory (LSTM) neural network, despite its intricate mechanism, exhibits an overall lower predictive accuracy. Consequently, a more precise predictive methodology is imperative to assist production personnel in efficiently ascertaining cotton-blending schemes and processing parameters, thereby elevating the production efficiency of the enterprise. In response to this challenge, we propose an attention-GRU-based cotton yarn quality prediction model. By employing the attention mechanism, the model is directed towards the input features most significantly impacting yarn quality. Real-world performance indicators of raw cotton and process parameters are utilized to predict yarn tensile strength. A comparative analysis is conducted against prediction results of BP, LSTM, and gated recurrent unit (GRU) neural networks that do not incorporate the attention mechanism. The outcomes reveal that the GRU model enhanced with the attention mechanism demonstrates reductions of 56.3%, 38.5%, and 36.4% in root mean square error (RMSE), along with 0.367%, 0.158%, and 0.190% in mean absolute percentage error (MAPE), respectively. The model attains a coefficient of determination R-squared of 0.954, indicating a high degree of fitness. This study underscores the potential of the proposed attention-GRU model in refining cotton yarn quality prediction and its consequential implications for process optimization and enhanced production efficiency within textile enterprises.

1. Introduction

As a preliminary process in weaving, the spinning process plays a crucial role in the quality of the resultant fabric. The quality of the yarn produced directly impacts the final product’s quality. Additionally, the cost of raw cotton constitutes a minimum of 50% of the overall fabric production expenses. Consequently, it is imperative to establish cotton-blending strategies and processing parameters based on yarn quality indices. [1,2]. However, the current production in spinning workshops is driven by orders, and specific production processes are planned according to order requirements. With the diversification of order varieties and processing parameters, the previous approach of determining production schemes through extensive trial spinning can no longer meet the processing demands of enterprises [3]. Furthermore, due to the diversity of raw materials and the complexity of process routes, relying solely on the personal experience of technical personnel results in uncertainties in controlling yarn quality.
Real-time analysis of production parameter characteristics of cotton yarn during the manufacturing process to achieve accurate predictions of yarn quality in spinning is a crucial measure for enhancing yarn quality in spinning mills [4]. In response to this situation, scholars both domestically and internationally have proposed a series of data-driven methods for predicting yarn quality. For instance, Ogulata et al. [5] optimized the input parameter quality of artificial neural networks using linear regression. They employed variables, such as stretching rate and maximum load of elastic fabrics, as input parameters for the model, thereby facilitating predictions of fabric elongation and recovery. Balci et al. [6], through the LM algorithm, predicted color values of cotton samples under different peel levels by adjusting the model’s hidden layer node count and input quantity. Gharehaghaji et al. [7] employed a method of multiple linear regression to assess the performance of their developed model. This assessment was carried out by validating the model using test data to predict the mean squared error (MSE) and the correlation coefficient (R-value). Through this approach, they achieved the prediction of the stretchability of cotton-wrapped nylon core yarn. The model’s validation on predicting yarn elongation exhibited a mean squared error of 0.365 for the validation dataset. Yang et al. [8] established an applied regression (AR) mathematical model to predict and control spinning tension, with the aim of achieving real-time and effective tension control in the spinning process. Lv et al. [9] employed an optimized support vector machine (SVM) model for quality prediction in small-sample spinning processes. Despite achieving a 3% enhancement in predictive accuracy compared to a conventional SVM prediction model, this optimized model exhibited sensitivity to parameter selection and the choice of kernel function. Yan et al. [10] established a multivariate linear regression model between cotton bale/slap and yarn strength, as well as sliver CV quality indicators, effectively reducing raw cotton waste. However, it struggles to adapt well to complex nonlinear relationships. Zhou et al. [3] studied the impact of synthetic-fiber-spinning process parameters on winding tension using a gray prediction model, providing an applicable approach for predicting spinning tension, yet lacking sufficient predictive accuracy. With the rapid advancement of deep learning theory, its advantages in nonlinear data processing have gradually emerged. Researchers have continuously optimized and extensively utilized the BP neural network for yarn quality prediction. Liu et al. [11] introduced a four-layer backpropagation neural network with dual hidden layers for the prediction of cotton yarn quality in the spinning process. In comparison to a three-layer network, this four-layer architecture exhibited improvements in both training steps and average error. Specifically, the relative average error for predicting yarn tensile strength was reduced by 2.1%. Li et al. [12,13] optimized the weight and threshold of the BP neural network using bio-inspired algorithms, such as genetic algorithms and fireworks algorithms, thereby enhancing the optimization speed and accuracy of the yarn quality prediction model. In summary, leveraging the potential of deep learning theory, particularly the BP neural network, presents a promising avenue for refining the prediction of yarn quality, catering to the intricacies of spinning processes and contributing to enhanced production outcomes.
However, the spinning process involves a time-series task scenario characterized by interconnected pre-processing and post-processing stages [14,15]. Most prediction models based on BP neural networks primarily utilize physical indicators of raw cotton as input parameters and analyze the production parameters of cotton yarn only at the same time point. They rarely involve the input of process parameters from different preceding and subsequent stages of production. Even if such consideration is made, the temporal influence of processing stages on yarn quality is often overlooked. Consequently, these models fail to establish connections among the temporal characteristics of various spinning workshop production stages, leading to an inability to meet the accuracy requirements of actual quality inspections for yarn spinning.
As a network sensitive to time sequences, the LSTM neural network has found widespread application in scenarios involving sequential data. Hu Zhenlong [16] optimized the input feature parameters of the LSTM neural network through the use of the convolutional neural networks (CNN) algorithm. Furthermore, they fine-tuned cotton fiber performance indicators and production parameters based on the sequence of yarn processing. This approach led to predictions of quality metrics, such as yarn strength and total cotton content. The average absolute error of their model’s predictive results was recorded as 0.080, which was lower than comparative models, such as the BP neural network. However, the complexity of their network structure inadvertently compromised the overall operational efficiency of yarn quality prediction.
In conclusion, this study addresses the challenges in cotton-spinning production related to raw cotton properties, process parameters, and yarn quality data. By integrating actual production process requirements from workshops and employing an attention mechanism-improved GRU neural network, we establish a cotton yarn quality prediction model that accounts for processing temporalities. This approach aims to enhance the accuracy of prediction results, which may otherwise suffer due to the sequential nature of spinning processes and production procedures. Ultimately, this model assists production personnel in efficiently determining cotton-blending strategies and processing parameters, thereby contributing to improved enterprise production efficiency. The primary contributions of this study are outlined as follows:
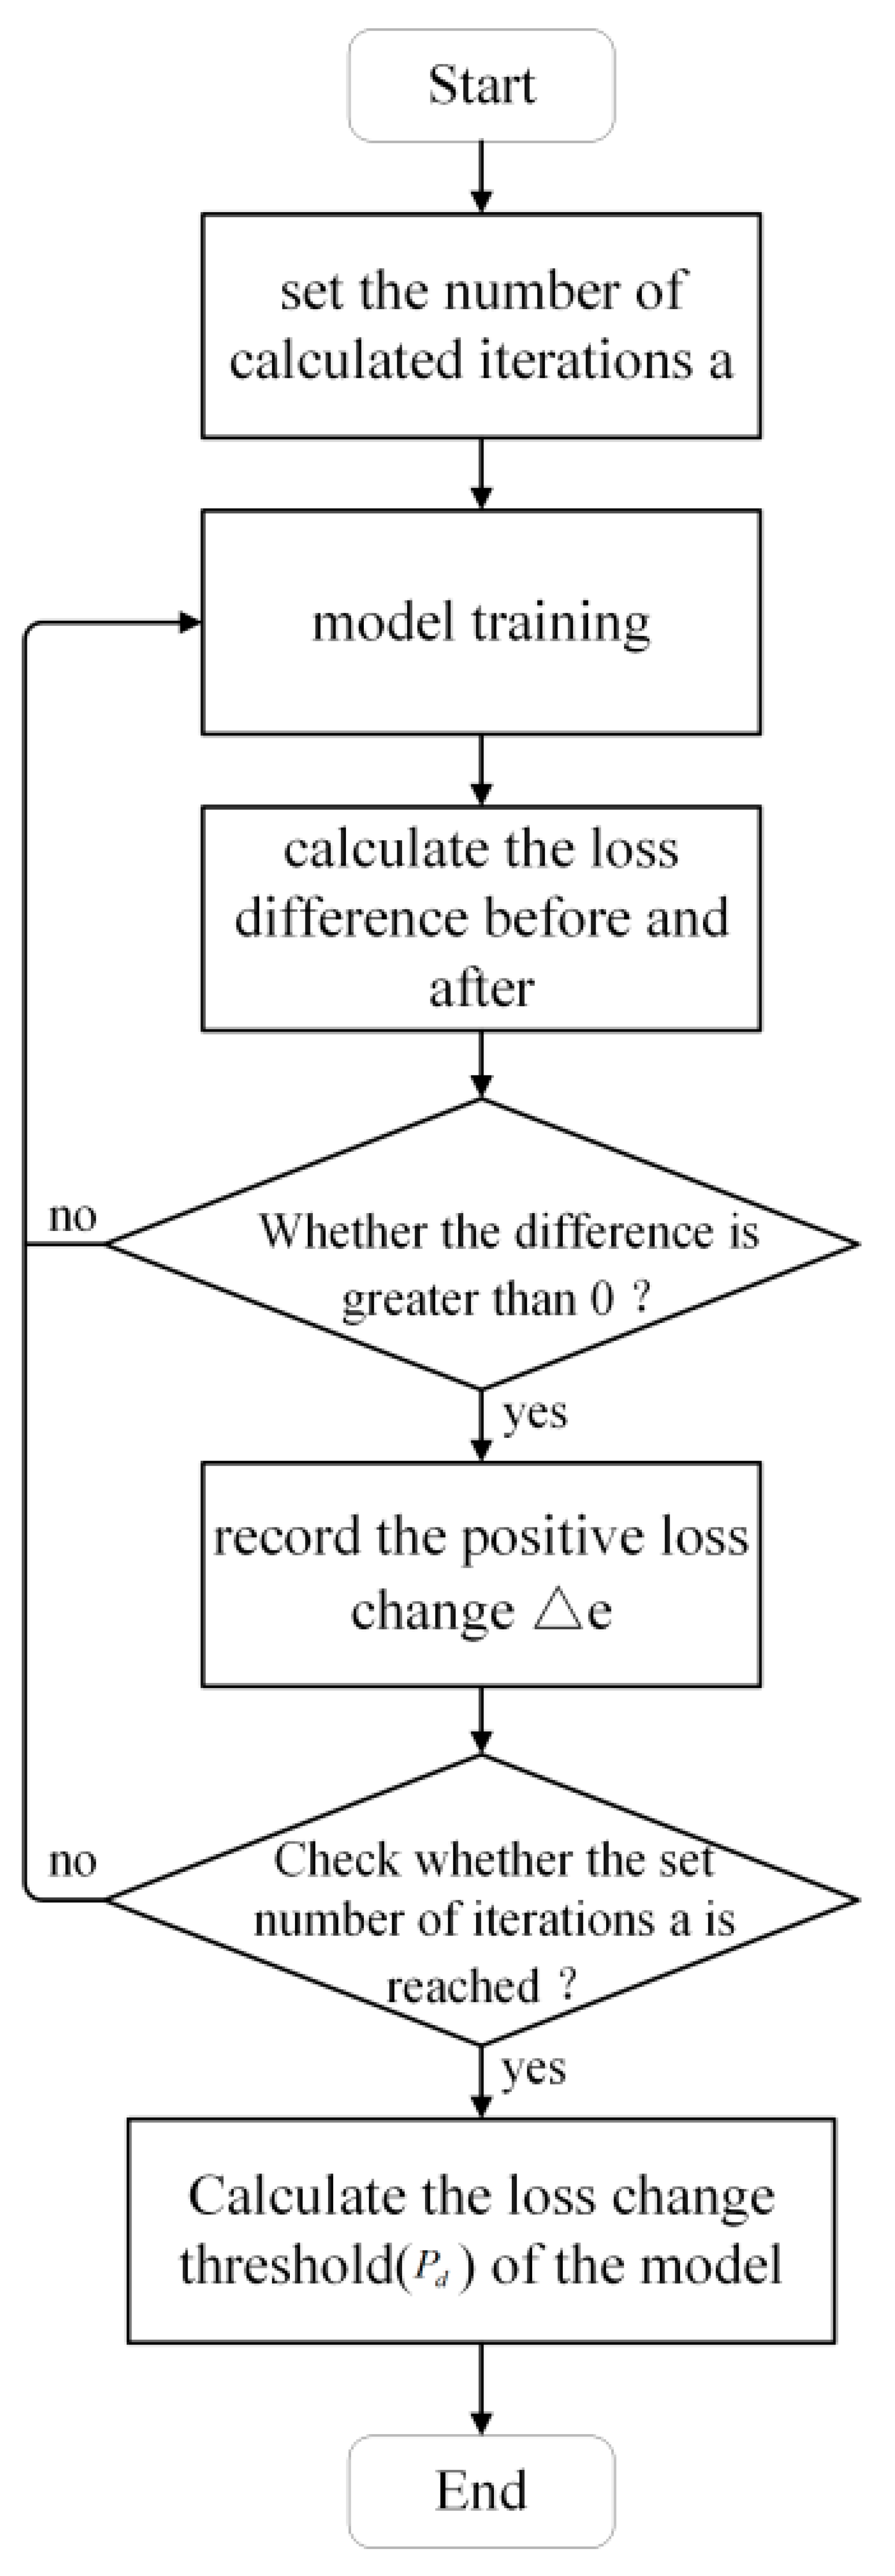
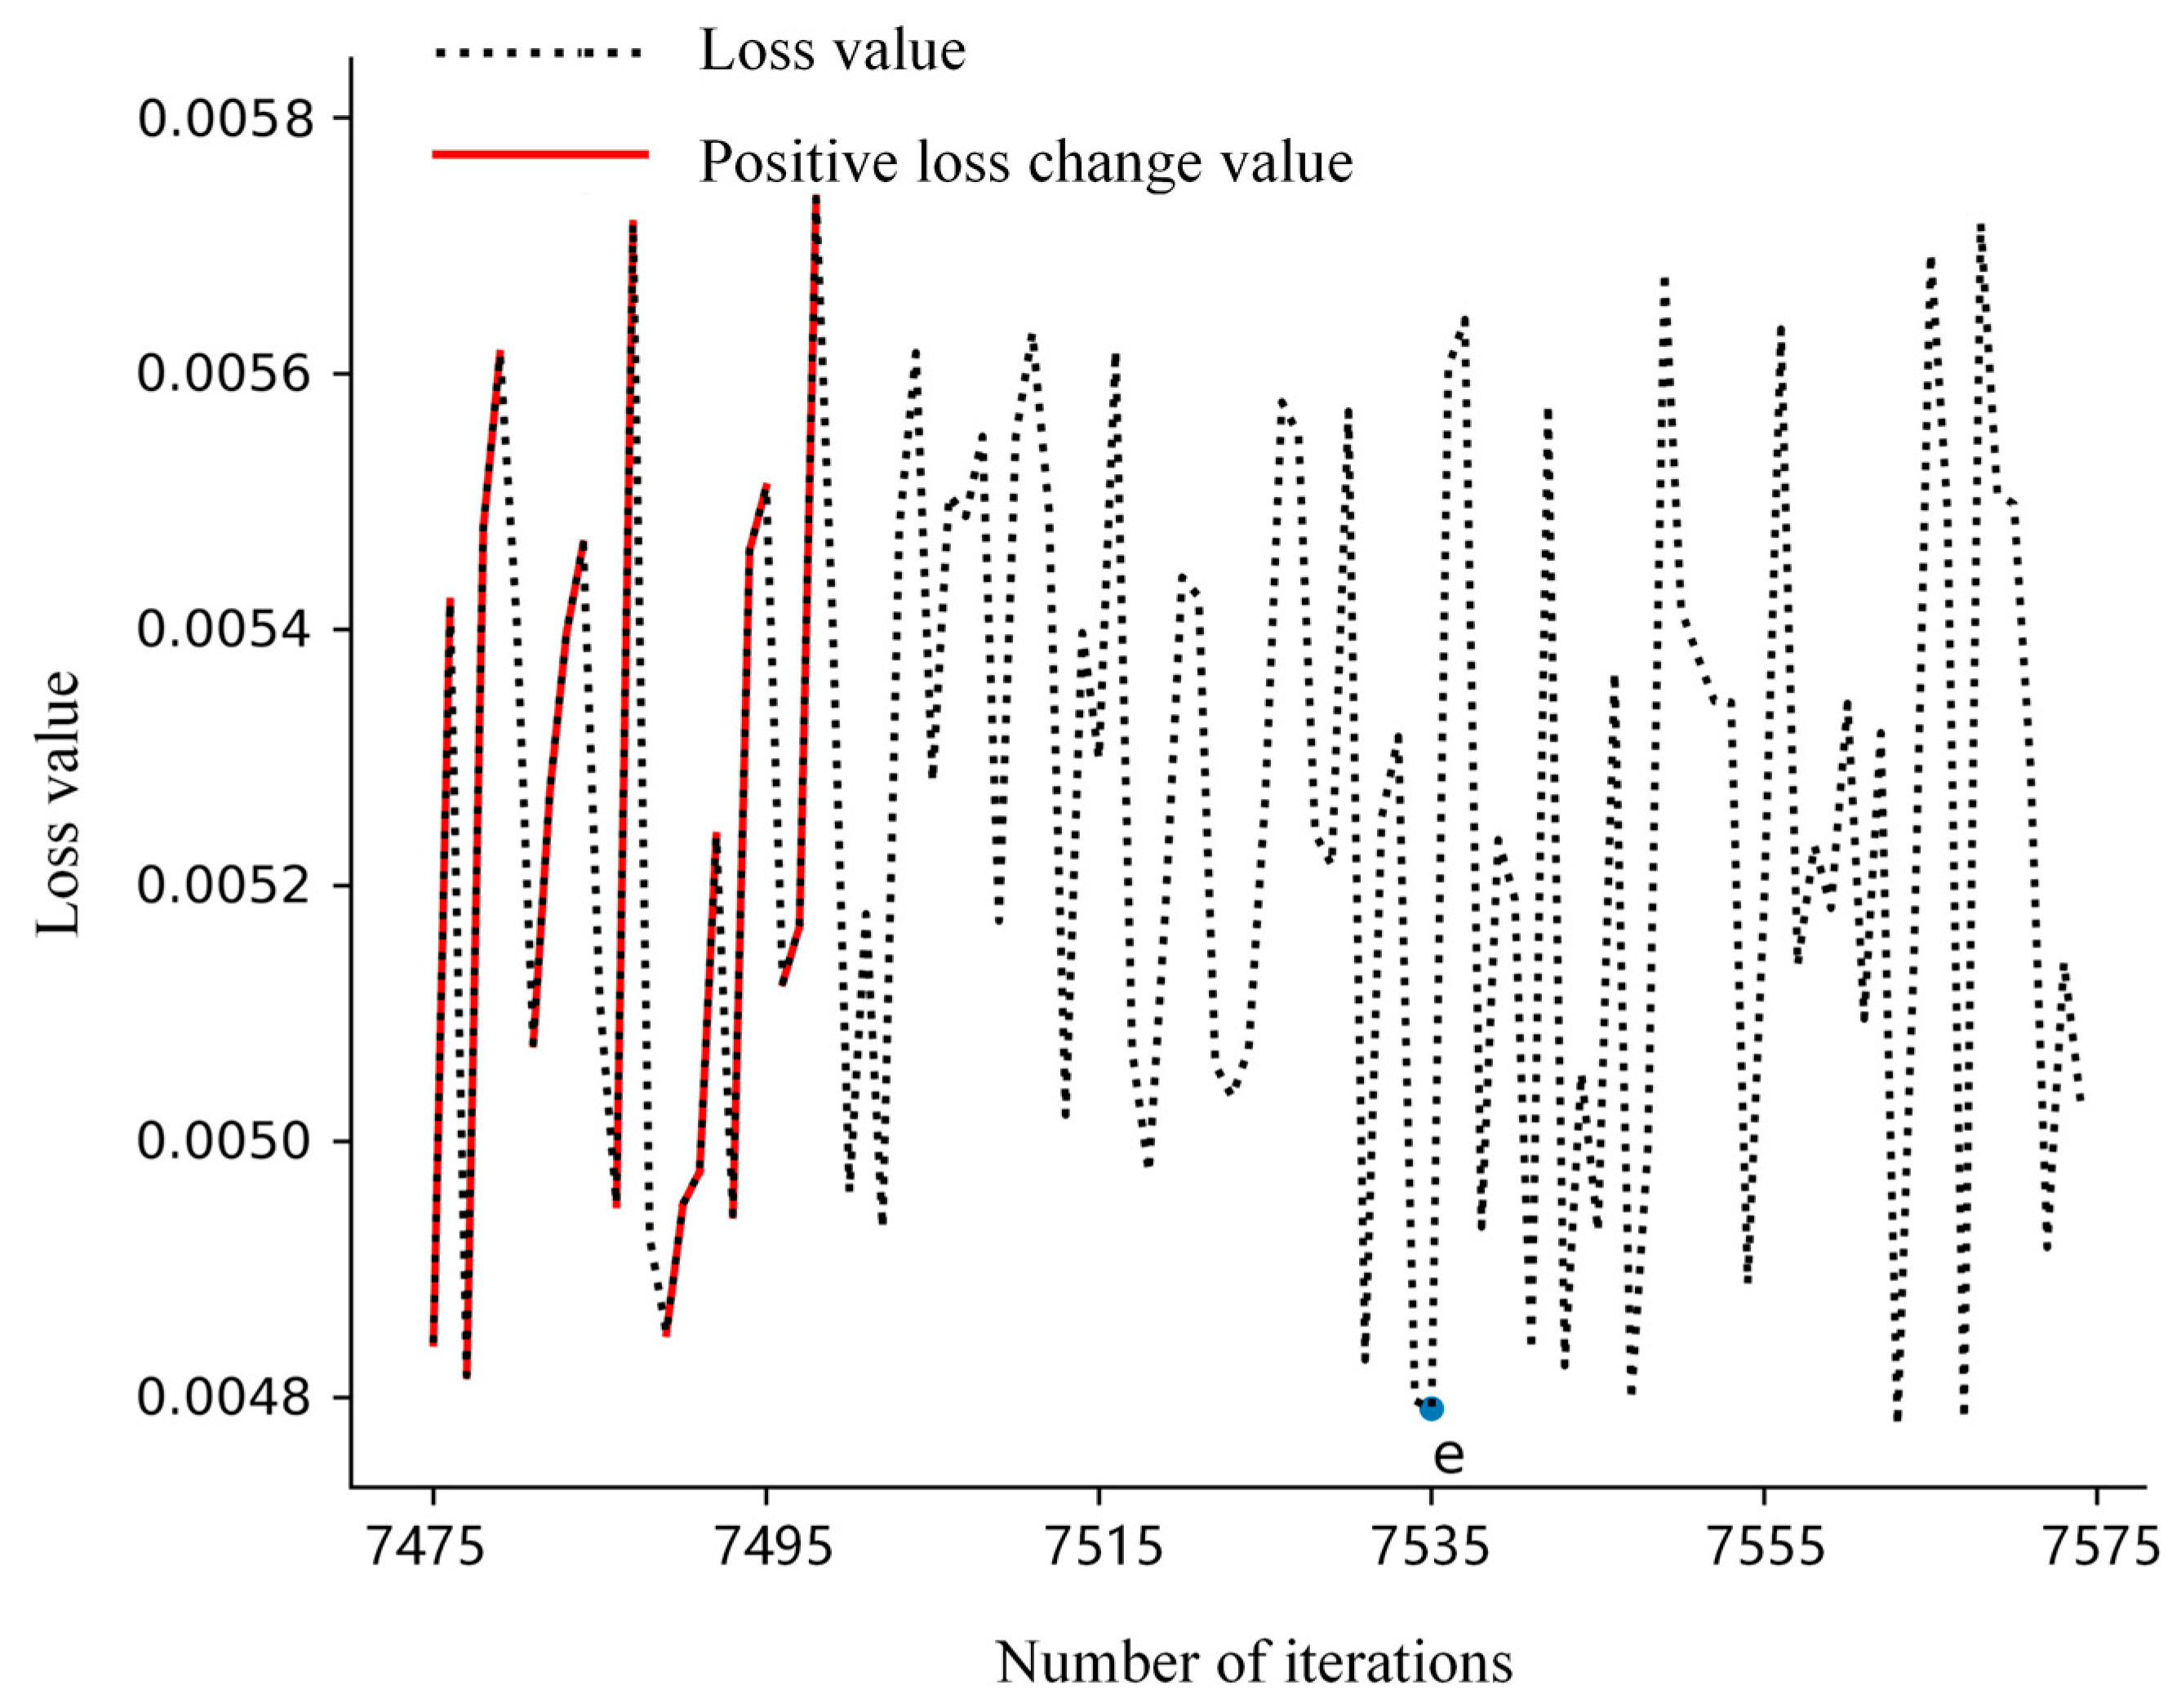
  • A cotton yarn quality prediction model based on attention-GRU was devised. This model incorporates an attention mechanism that directs the model’s focus towards the most significant input features influencing yarn quality. Additionally, a dynamic adaptation of the loss change threshold has been introduced to determine the optimal number of iterations for different datasets. This approach not only enhances the precision of model predictions but also boosts prediction efficiency.
  • A research dataset was constructed incorporating raw cotton performance indicators and data from the regular carding process. By organizing raw cotton performance indicators and processing information from the spinning workshop, a driving dataset was established for the model, aligning it more closely with practical scenarios in cotton yarn spinning.
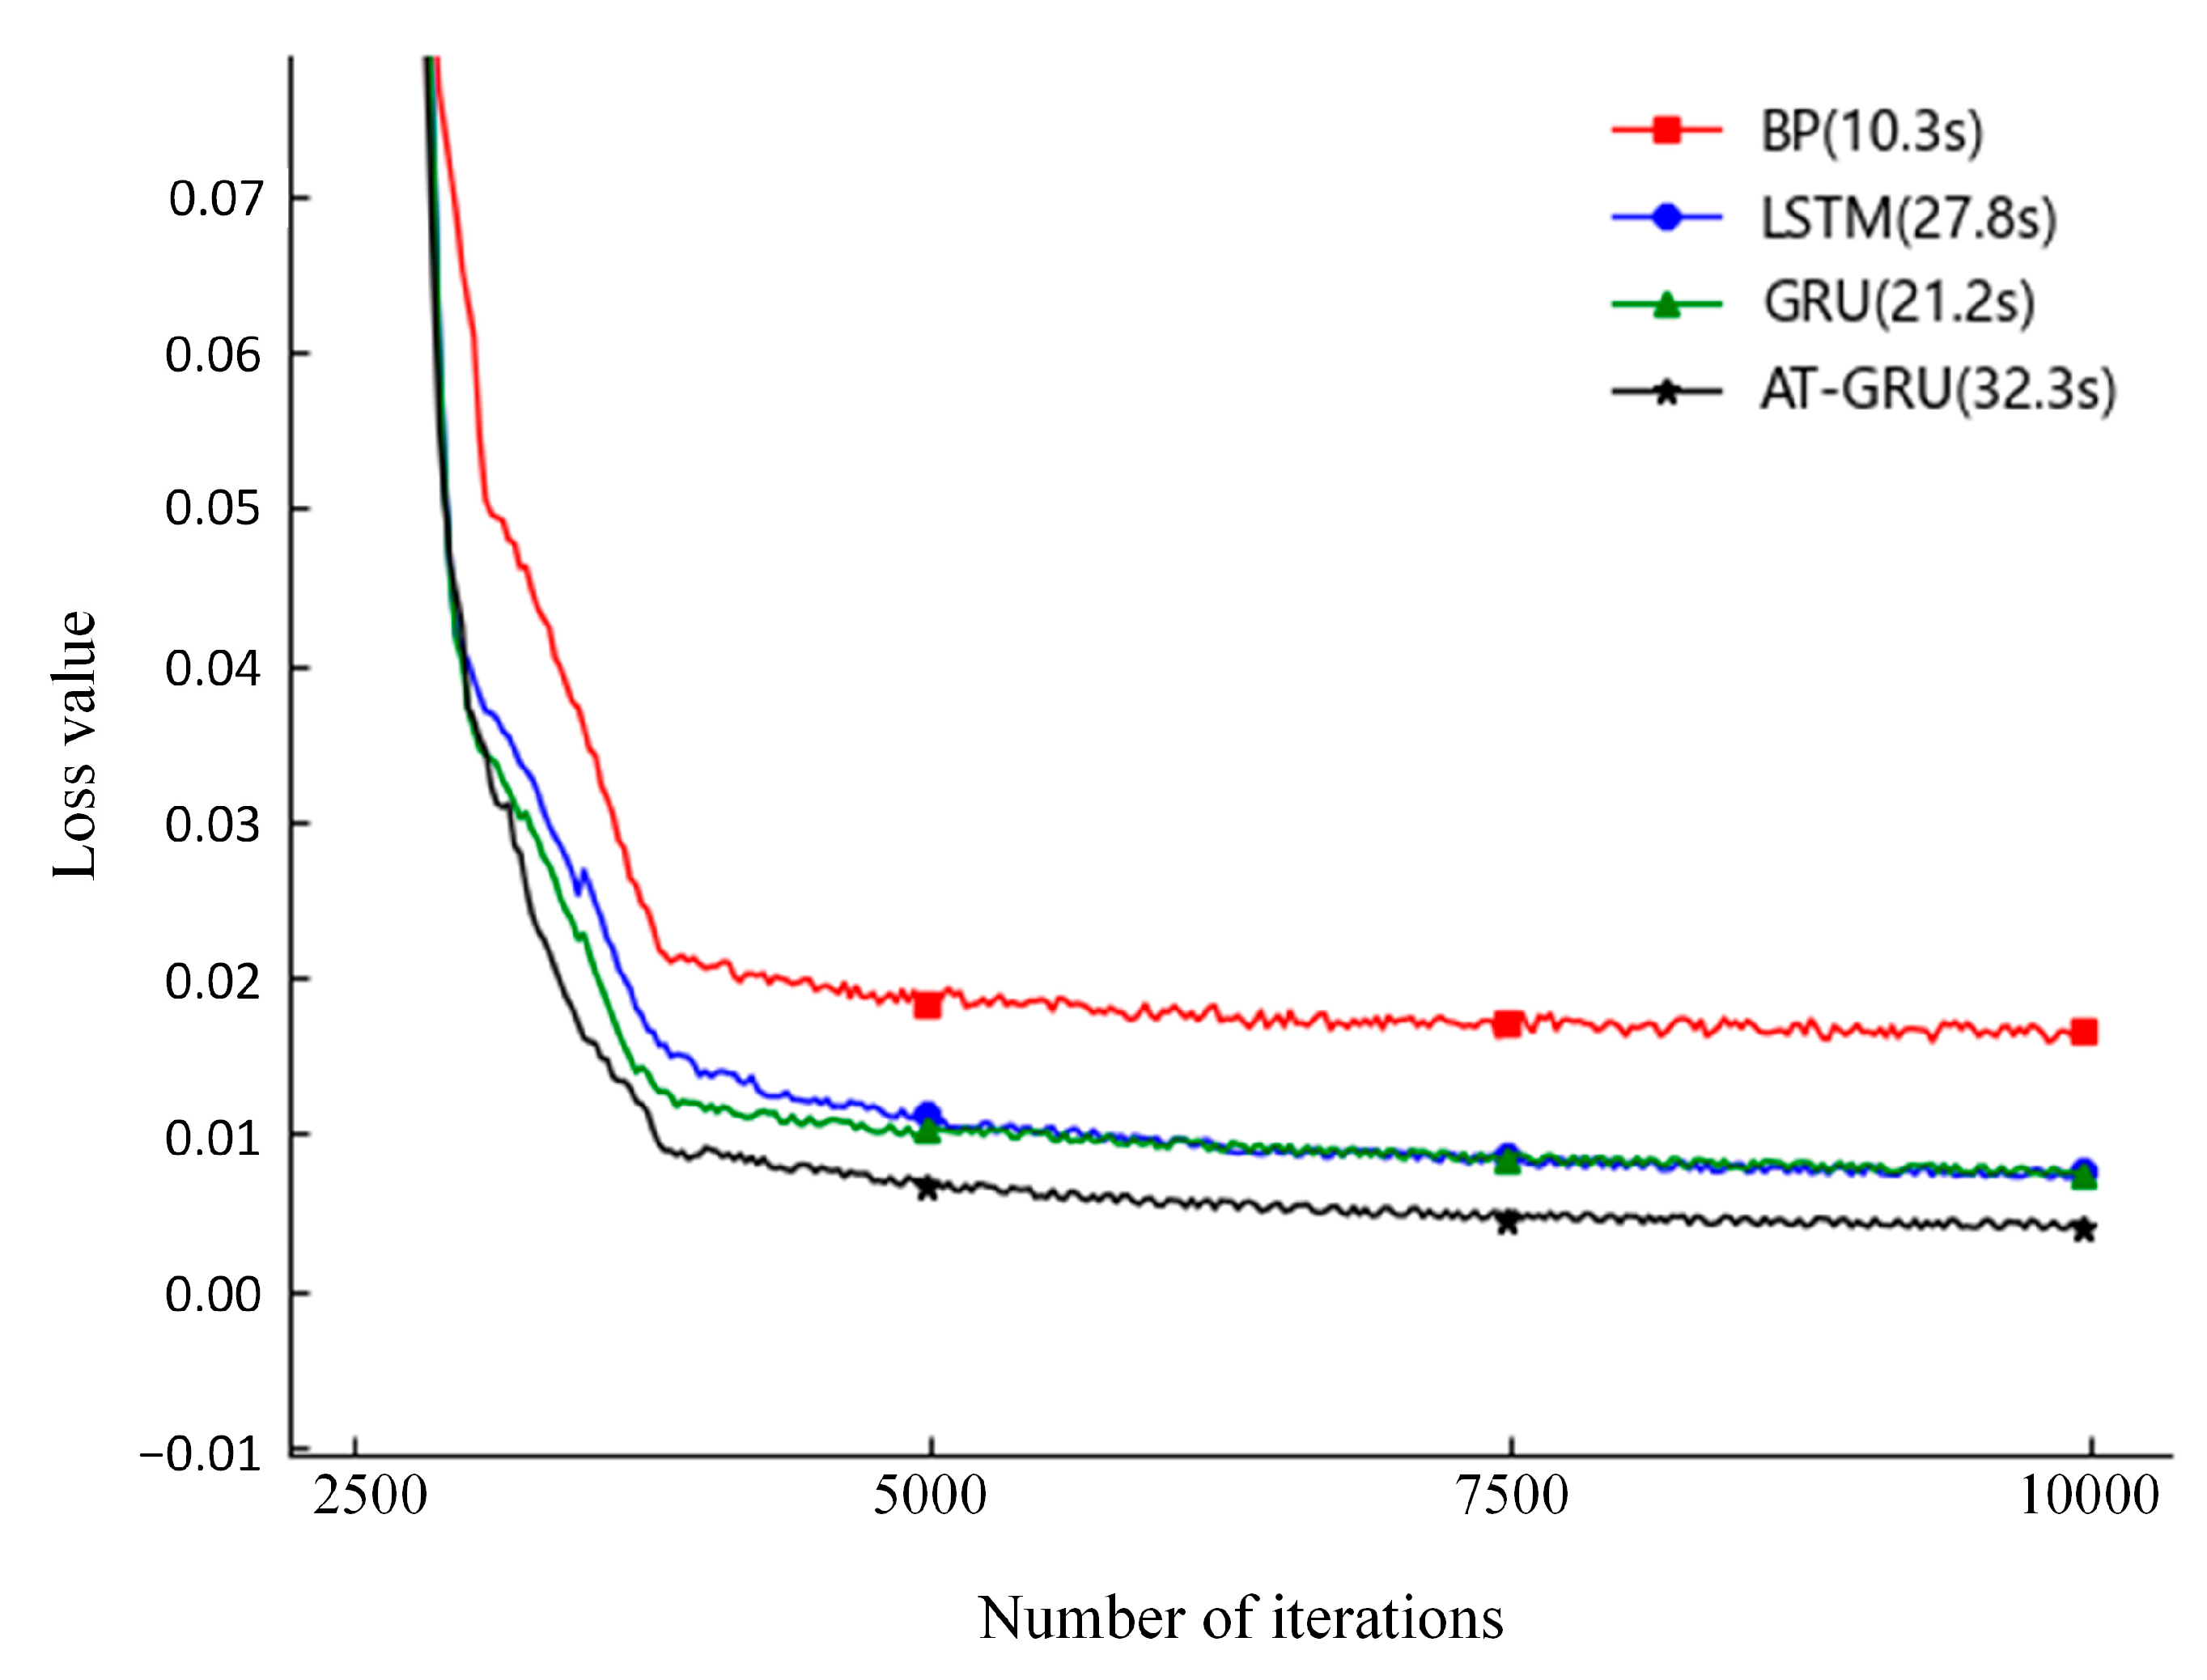
  • Through performance comparisons with BP, LSTM, and GRU prediction models, the practical utility of the cotton yarn prediction model developed in this study was validated. This offers valuable insights for researchers in the field of yarn production quality prediction and serves as a reference for their endeavors.

2. Cotton Yarn Quality Prediction Model

Cotton spinning is the process of transforming cotton fibers into cotton yarn and thread. This spinning process is divided into two main processing routes: regular carding and fine carding, as illustrated in Figure 1. The processing stages encompass cotton carding, sliver drafting, coarse yarn spinning, and fine yarn spinning, among others [17].
Based on the manufacturing characteristics of cotton spinning, it is evident that the outcomes of preceding processing stages will impact subsequent stages. Taking the relationship among the last drafting, coarse yarn spinning, and fine yarn spinning as an example, the unevenness in the weight of fine yarn and the CV value of sliver stiffness determine whether pronounced weft-wise or warp-wise streaks appear in the final cotton fabric [18]. Both of these factors are influenced by the internal fiber structure of coarse yarn. Similarly, enhancing the structural coherence of coarse yarn necessitates addressing the fiber straightness in the last drafting process. Furthermore, in the context of carding, the regular carding process involves directly supplying carded cotton sliver for drafting, while the fine carding process entails passing the carded sliver through a pre-drafting and coiling process before undergoing further combing [19,20]. These two processes yield distinct differences in texture, durability, and uniformity in the resulting yarn.
Consequently, when predicting yarn quality, it becomes imperative to consider the output of the preceding processing stage as input parameters for the subsequent stage. However, the predictive approach of the BP neural network involves feeding multiple spinning parameters into the network model simultaneously at a given moment [as depicted in Figure 2], thereby failing to unearth the temporal dependencies within the spinning process. To cater to the demand for analyzing temporal data within the spinning process, this study introduces recurrent neural networks (RNNs) to establish interconnections between input spinning parameters, enabling the model to capture the sequential nature of the spinning process.
This paper focuses on the spinning production workshop of a company situated in Shijiazhuang, Hebei Province, China. The spinning process of this company is predominantly centered around cotton spinning and cotton blending.

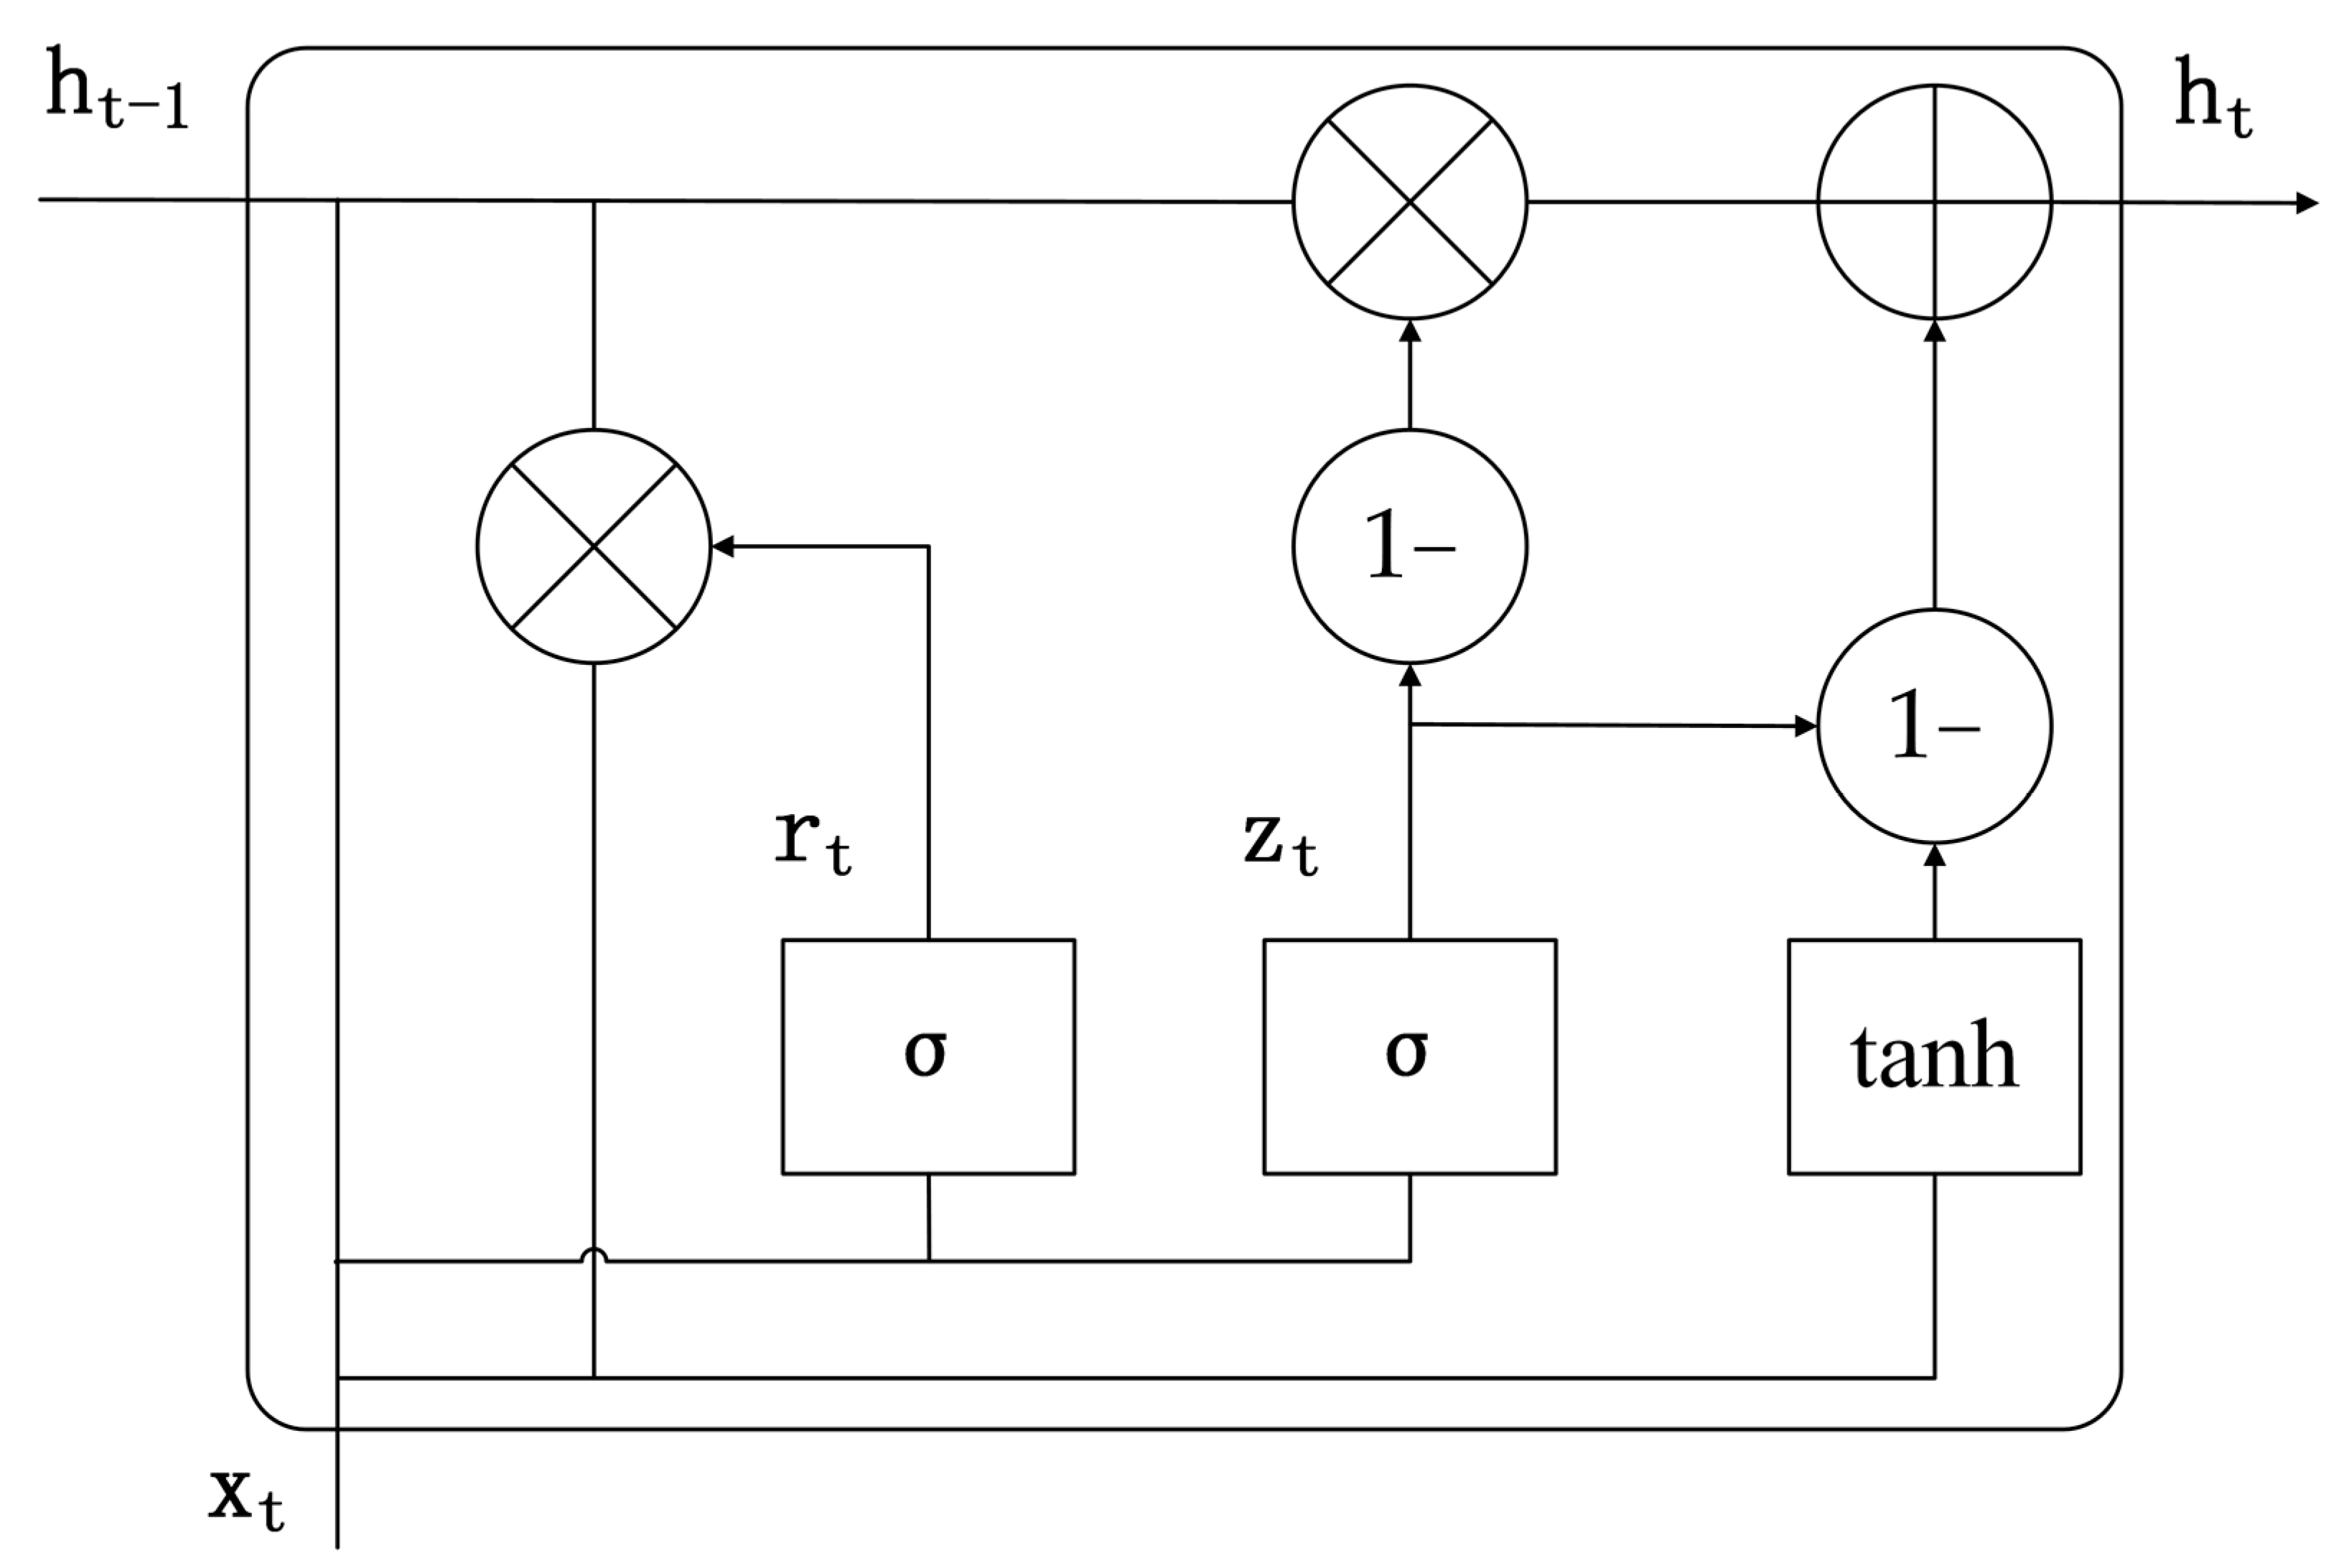
2.1. The GRU Neural Network

Currently, the long short-term memory (LSTM) network, a type of recurrent neural network (RNN) designed to alleviate the vanishing gradient problem, has emerged as a predominant method in text processing and time-series forecasting [21,22]. Nevertheless, the intricate architecture of LSTM considerably extends the training time of neural networks, thereby reducing operational efficiency. Addressing this concern, Cho et al. [23] introduced the gated recurrent unit (GRU) neural network, which builds upon the foundation of LSTM and effectively enhances model-training speed while also mitigating overfitting tendencies. The internal network structure of GRU resembles that of LSTM (as depicted in Figure 3).
It is evident that distinct from LSTM’s three gates—output, input, and forget—GRU incorporates only two gates: the update gate and the reset gate. The information propagation process within the GRU cell is illustrated by Equation (1):
{ r t = σ ( W r x c + W r h h t 1 ) h ˜ = tanh ( W h x x t + W h h ( r t h t 1 ) ) z t = σ ( W z x x t + W z h h t 1 ) h t = ( 1 z t ) h t 1 + z t h ˜
where: x t represents the input at time step t; h t 1 denotes the hidden state at time step t 1 ; σ signifies the sigmoid activation function; r t stands for the reset gate; h ˜ represents the candidate information at time step t ; z t signifies the update gate; h t denotes the hidden state at time step t; W r x , W r h , W h x , W h h , W z x , W z h represent the weight parameters of the unit.
Therefore, within the GRU neural network, the reset gate selectively discards the previous output information based on the current input, while the update gate determines the extent to which the prior output information is integrated into the current output information. By employing this mechanism, GRU continuously forgets less significant historical data and retains crucial new information, facilitating a more effective capture of temporal dependencies within sequential data.

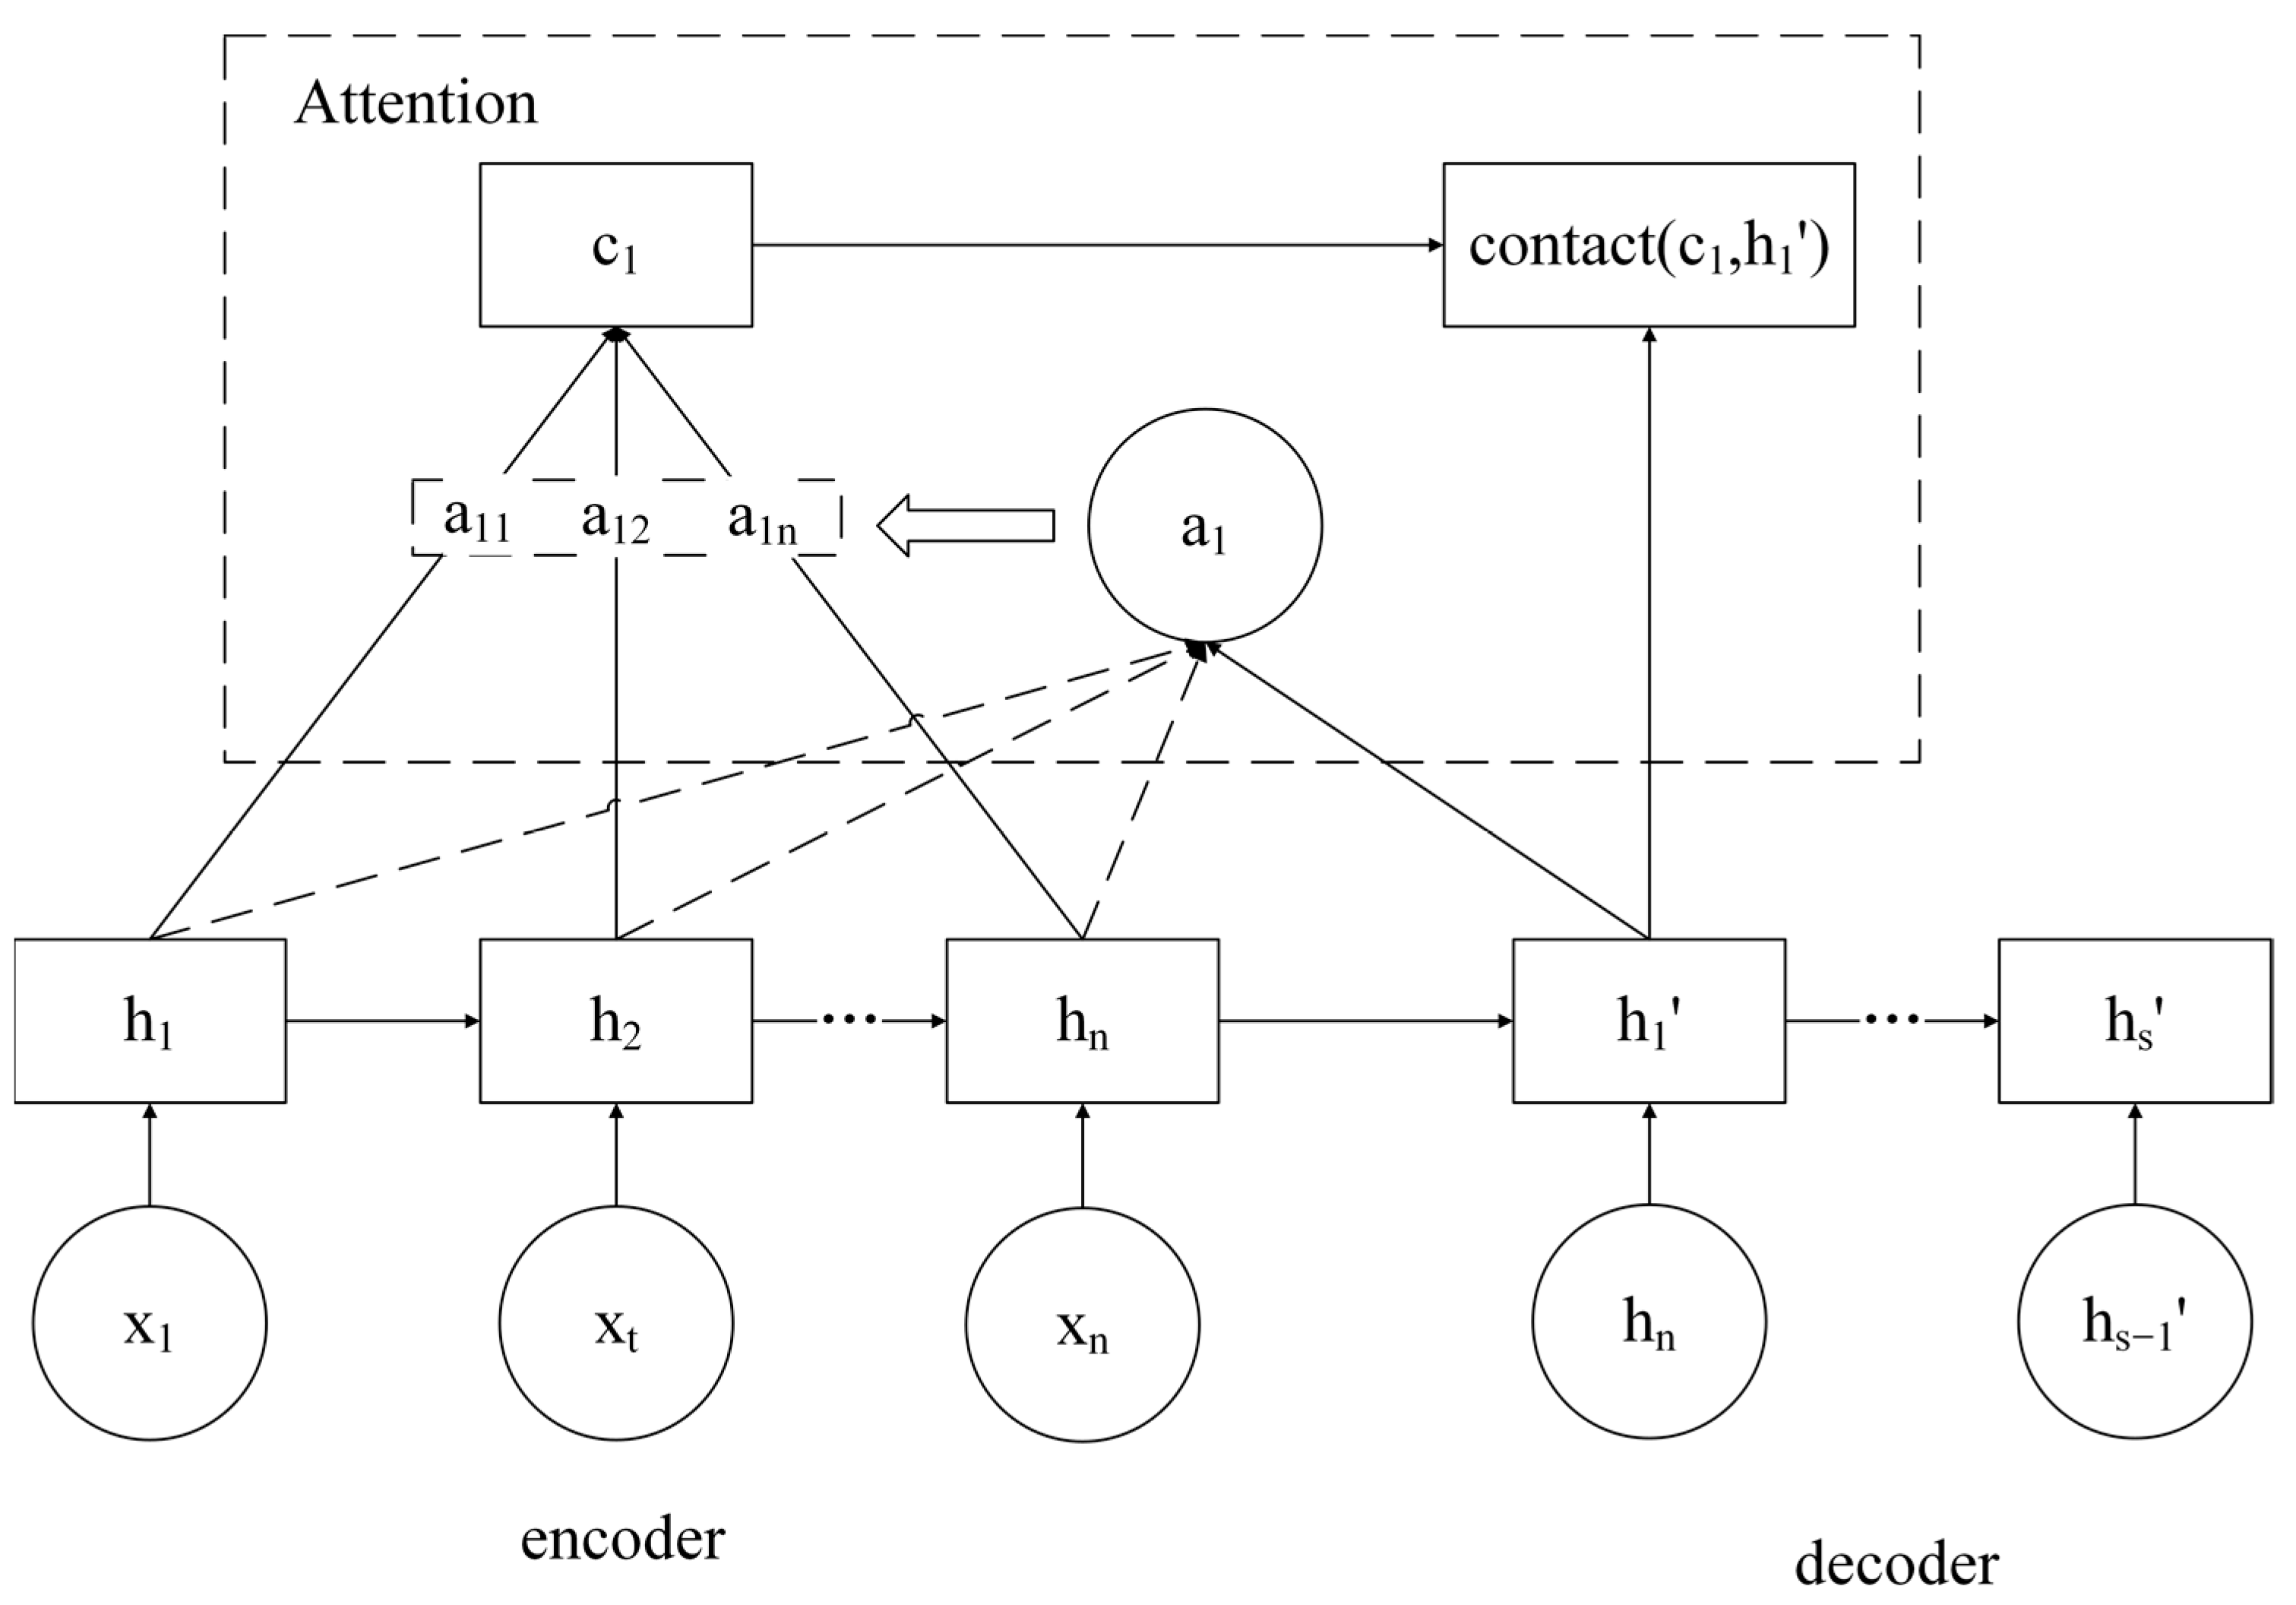
2.2. The Attention Mechanism

In practical scenarios, cotton yarn quality undergoes continuous variations due to various factors. The impact of raw cotton performance indicators and distinct processing stages on yarn quality often exhibits variations. Conventional GRU neural networks, however, do not differentiate among these feature inputs, making it challenging to discern critical information from the inputs. The attention mechanism emulates the resource allocation mechanism of human attention, concentrating focus on pivotal elements while diminishing attention on non-critical elements [24]. The attention mechanism is commonly employed to enhance Seq-to-Seq models. The Seq-to-Seq model, originally introduced in the field of machine translation, concatenates two RNNs (LSTM, GRU) where the input RNN functions as an encoder convert input sequences into hidden states before transmitting them to another RNN, referred to as the decoder. This process facilitates the mapping of variable-length output sequences. Employing the encoder–decoder architecture for training not only resolves the challenge of fixed input and output lengths in traditional tasks but also enhances training efficiency. As illustrated in Figure 4, the Seq-to-Seq model with the incorporation of the attention mechanism operates by performing correlation calculations between the hidden states of the encoder and a specific unit within the decoder [25]. After obtaining the weighting values, the encoder’s hidden states are weighted and summed. The summation result is then concatenated with the hidden state of the respective unit, yielding the model’s prediction output with the attention mechanism integrated.
Therefore, this study aims to enhance the predictive accuracy of the model by employing the attention mechanism to allocate weights to the hidden states of the GRU neural network. This adaptive allocation enables the model to focus on the most influential input features affecting yarn quality, thereby improving its predictive precision.

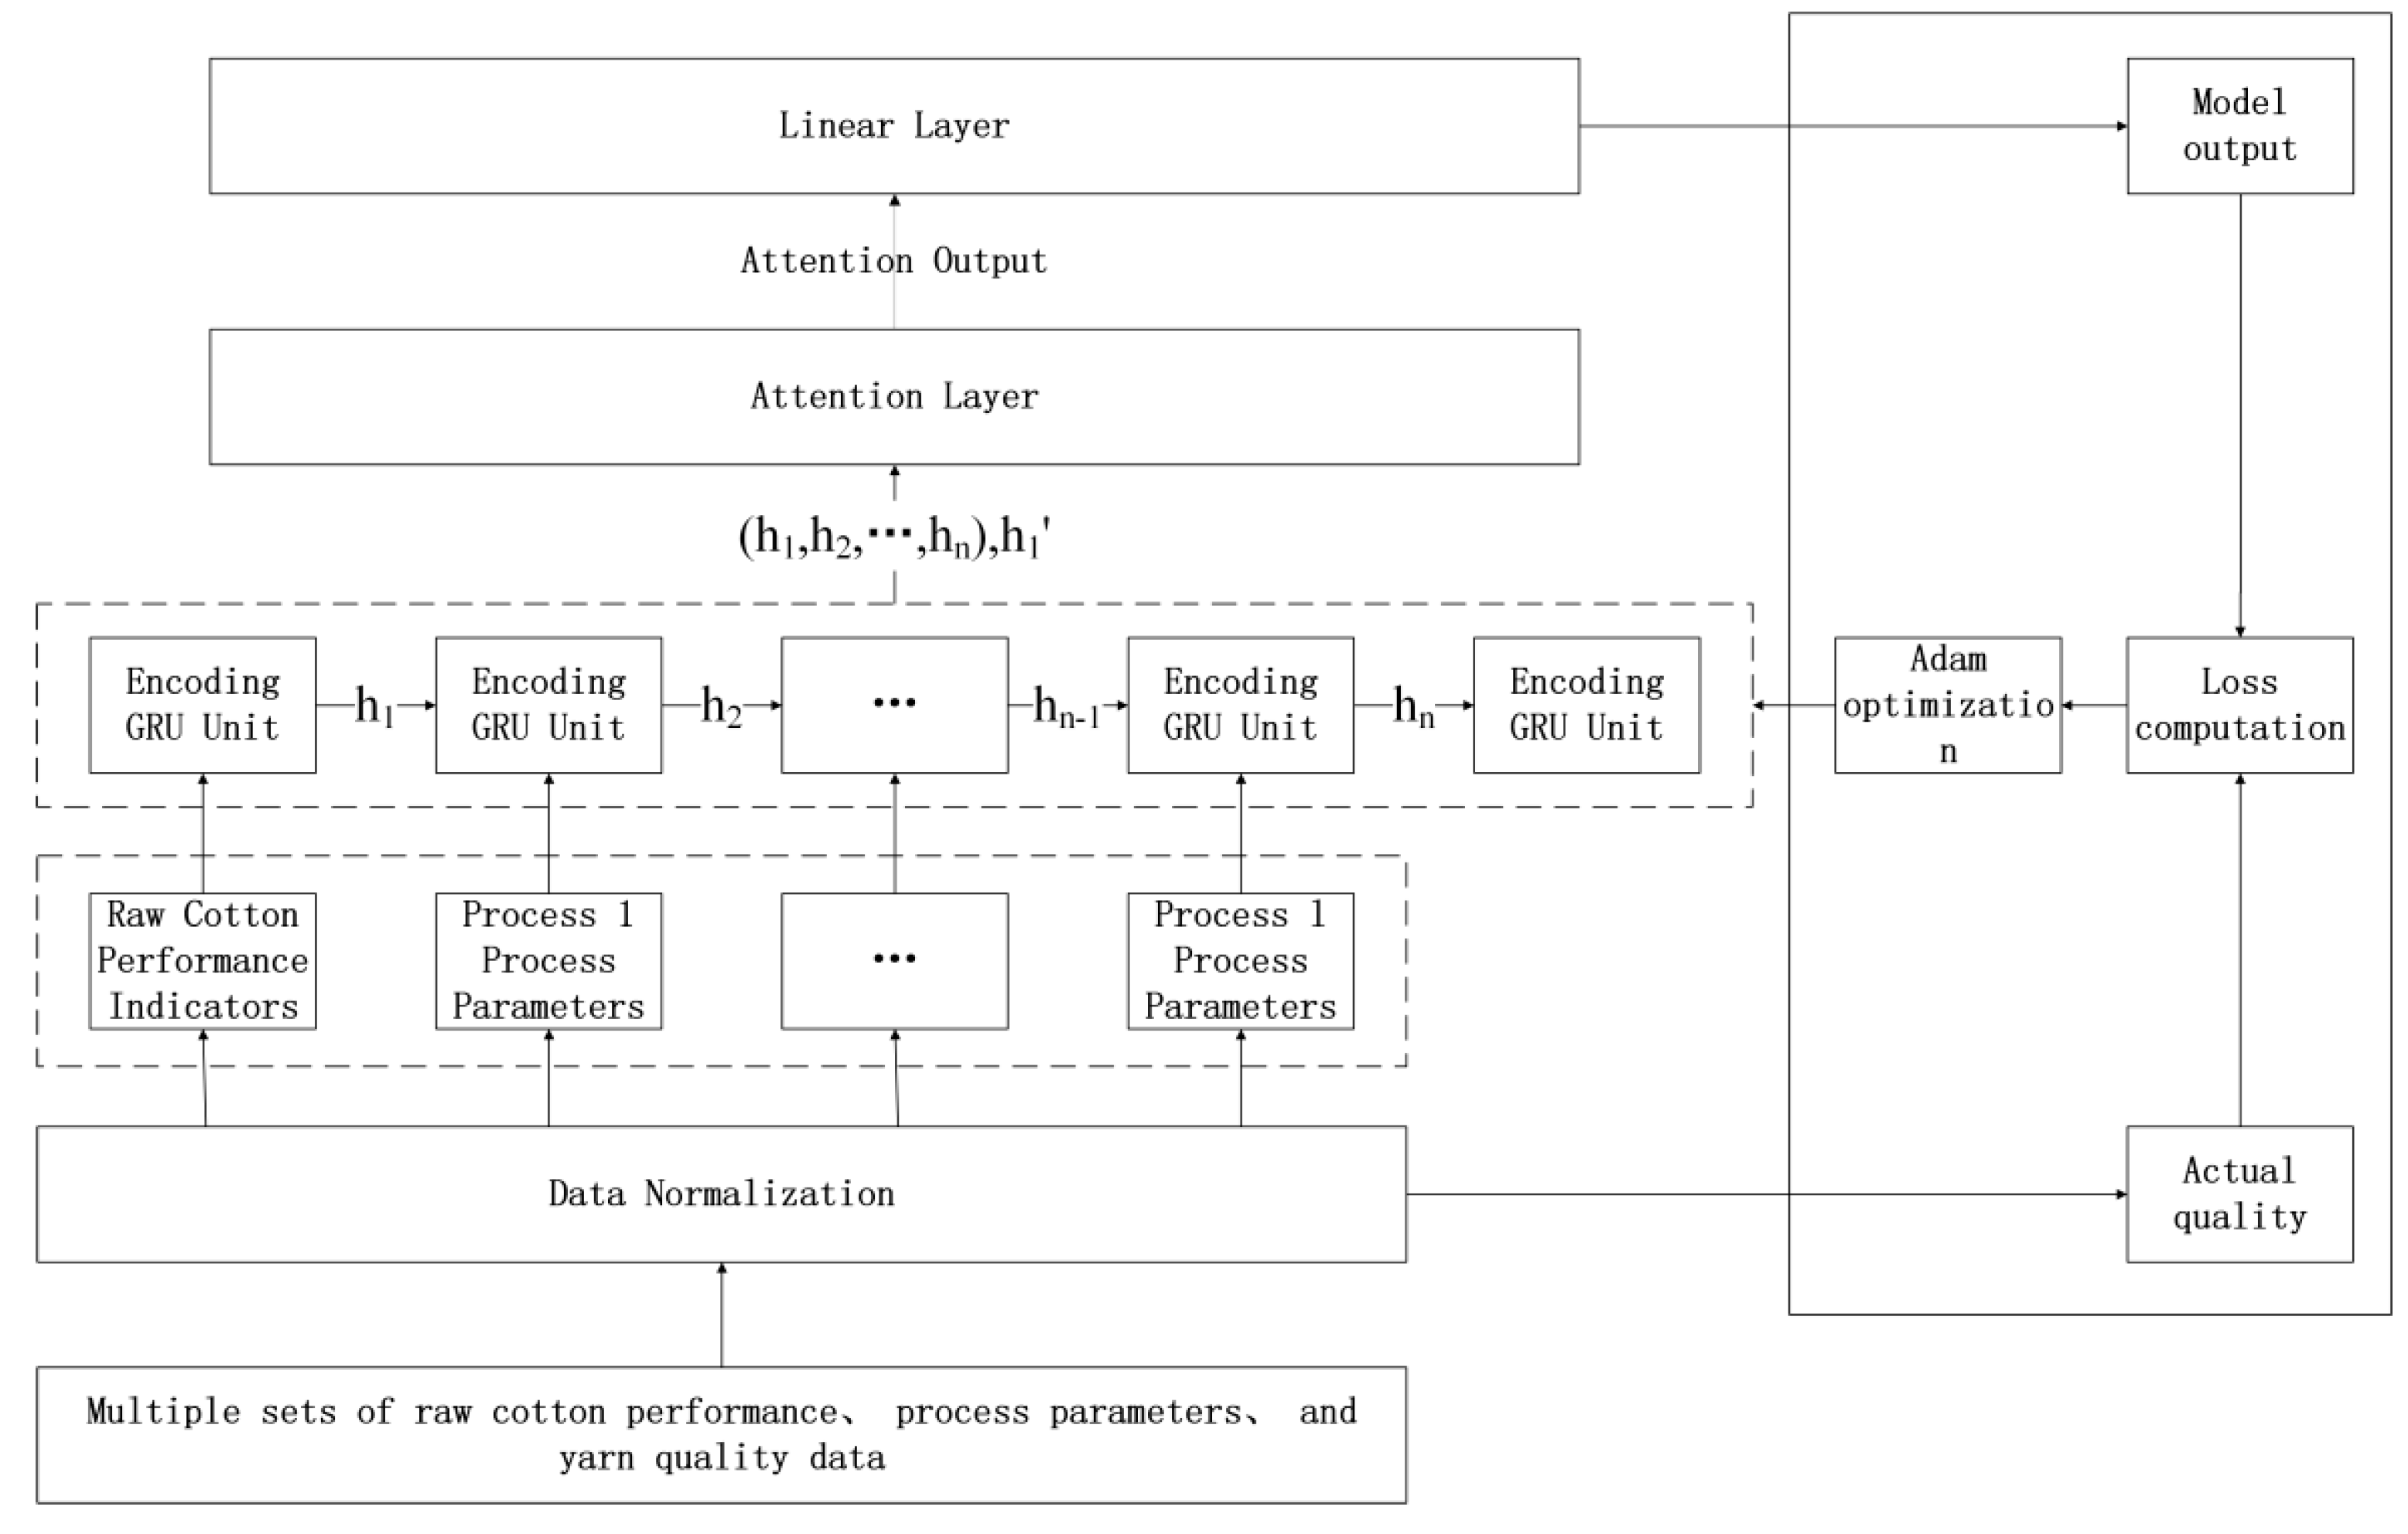
2.3. Attention-GRU Prediction Model

Drawing upon the aforementioned analysis, this paper introduces an attention-enhanced GRU-based model for predicting yarn quality in spinning (illustrated in Figure 5). The model’s detailed description is provided below:
(1) The raw cotton performance indicators and process parameters of each processing stage are essentially independent time series. In order to integrate these influential features impacting cotton yarn quality, this study draws inspiration from word-embedding techniques employed in natural language processing [26]. Assuming there are N raw cotton performance indicators, these are transformed into N-dimensional feature vectors, denoted as ( x 1 1 , x 1 2 , , x 1 N ) , and utilized as the initial input. The formula for calculating the input dataset of the model for raw cotton is given by Equation (2).
X = [ x 1 1   , x 1 2   , x 1 3   ,   , x 1 l   , x 1 l + 1 x 2 1   , x 2 2   , x 2 3   ,   , x 1 l   , x 2 l + 1                    x N 1 , x N 2 , x N 3 ,   , x 1 l   , x N l + 1 ]
Furthermore, for the ease of model training, the original input data is normalized using the min–max normalization method to fall within the range of (−1,1), as expressed by Equation (3).
x = x x m i n x m a x x m i n
where: x represents the original input data, xmax and xmin denote the maximum and minimum values of the input data, respectively, and x signifies the normalized input data after the min–max normalization process.
(2) Constructing a single-layer GRU neural network architecture facilitates a comprehensive learning of the input feature information, enabling the capture of temporal dependencies within the sequential data. This architecture aims to predict yarn quality by employing the data from the past l + 1 time steps to forecast the data at the subsequent time step, necessitating only a single decoding step. The output of the GRU layer comprises two components: the hidden state sequence H   ( h 1 , h 2 , , h n ) from the encoder and the first hidden state parameter h 1 from the decoder. The computation formula for the GRU output vector is depicted by Equation (4).
H G R U = ( h 1 , h 2 , , h n ) , h 1
(3) The attention layer analyzes the significance of feature information at different time steps based on the magnitude of weights, continuously iterating to update and optimize the optimal weight parameters. The calculation formula for the attention mechanism is presented in Equation (5).
{ e t = score ( h t , h 1 ) a t = softmax ( e t ) C = t = 1 n a t h t s = contact ( C , h 1 )
where: h t corresponds to the hidden state at time t within the set H; t = 1 , 2 , , n score denote the similarity function utilized for calculating the cosine similarity score e t between h t and h 1 ; softmax stands for the normalized exponential function, transforming e t into weight values a t for each hidden state; contact signifies the concatenation function; and s signifies the prediction output with the attention mechanism incorporated.
(4) The output from the attention layer is connected to a fully connected neural network where the output end of the fully connected network aggregates information, yielding the predicted value of yarn quality. This process is formulated in Equation (6).
y = L 11 s 1 + L 12 s 2 + + L 1 n s n
where: y represents the predicted value of yarn quality by the model, and L denotes the aggregation coefficients of the various units within the fully connected layer.
(5) Utilizing the loss function, the model’s output y is subjected to loss calculation in comparison to the actual quality y. The Adam optimizer is then chosen to optimize the model’s parameters. Adam achieves parameter optimization by computing both the first and second moments of gradients, which facilitates the design of independent adaptive learning rates for different parameters. This mechanism enables the neural network’s weights to be iteratively updated based on training data, ultimately steering the output value of the loss function towards its optimal state. The model employs the mean squared error (MSE) algorithm as its loss function, as represented in Equation (7).
E m s e = 1 n i = 1 n ( y ¯ i y i )
where: n denotes the number of samples; y ¯ i and y i , respectively, represent the predicted value and the actual value for the i-th sample; and E m s e signifies the degree of loss.
(6) An adaptive loss change threshold is utilized to dynamically determine the optimal number of iterations for the model across different datasets. This method involves recording the positive loss change values obtained from the initial ‘a’ training iterations of the model. These values are then employed to calculate the loss change threshold tailored to the corresponding training dataset. With the loss change threshold as a reference, the training iteration count for the model is dynamically determined. The formula for calculating the adaptive loss change threshold and the training iteration positioning benchmark is presented in Equation (8). The procedure for computing the adaptive loss change threshold for the model is depicted in Figure 6.
{ Δ e   =   l o s s b + 1 l o s s b P d   =   1 a i = 1 a Δ e i t o   : ( l o s s b + a + 1 l o s s b + a ) > P d
where: lossb represents the loss value for the model at the ‘b’-th training iteration, and Δ e denotes the positive loss change value corresponding to the ‘b + 1’-th training iteration of the model where Δ e is greater than zero. Pd signifies the loss change threshold calculated for the initial ‘a’ training iterations of the model, and t o indicates the optimal iteration count for training determined by positioning the model based on the loss change threshold tailored to the specific dataset.

3. Case Analysis

To validate the effectiveness of the predictive model, this section will utilize yarn quality data from a textile enterprise in the city of Shijiazhuang. The attention-GRU model will be constructed using the PyTorch library in Python. Through this, experimental validation of the predictive model will be conducted. Furthermore, a comparative study will be undertaken, contrasting the results with those of the GRU, LSTM, and BP neural network predictions where the attention mechanism has not been introduced.

3.1. Dataset Preparation

Considering the variations in spinning methods, process workflows, and spinning equipment among different yarn varieties, we have selected yarn type C27.8 as the subject of experimentation for this section. This particular yarn variety follows a processing route of pure cotton carding and encompasses the utilization of key spinning equipment, including the TC5-1 type cotton-carding machine, the FA306 type drawing frame, the RSB-D45c type drawing frame, the FA468E type roving frame, and the JWF1516JM type ring-spinning frame.
The chosen output parameter for the model is yarn tensile strength, which serves as a crucial indicator of yarn quality. Yarn tensile strength directly determines the processing performance and final application of the yarn. In the field of cotton spinning, factors influencing yarn strength primarily encompass fiber properties and yarn structure. Higher fiber strength, finer fineness, and longer length result in higher yarn strength. Conversely, yarn strength decreases when the yarn experiences folding, bending, or kinking. Furthermore, both fiber properties and yarn structure are significantly influenced by the process parameters of each spinning stage. Therefore, employing the regular carding process as a case study, we proceed to conduct an in-depth analysis of the influence exerted by each individual processing stage on yarn tensile strength:
  • The speed of the carding roller and the tin roller in the carding machine is one of the key factors influencing the carding quality [27].
  • Increasing the speed effectively enhances the carding rate and area, thereby reducing cotton knots and impurities. However, higher speeds intensify the increase in short fiber content where for every 1% increase in short fiber content below 16 mm in cotton yarn, there is a corresponding decrease in yarn strength by 1–2% [28].
  • The blending process in the drawing frame elongates and evens out cotton fibers. The spinning speed of the drawing frame can impact the uniformity of fiber blending, thus influencing yarn strength [29].
  • There exists a parabolic relationship between the coefficients of the coarse and fine yarn processes and cotton yarn tensile strength [30,31]. As the twist coefficient increases, the intermolecular cohesion of cotton fibers strengthens. However, the introduction of additional twist reduces axial forces, leading to uneven fiber breakage. Furthermore, spindle speed in both processes is a critical factor affecting yarn strength.
Therefore, in the selection of input indicators, we consider six parameters, such as the micronaire value as indicators of raw cotton performance. Meanwhile, we utilize the collected crucial spinning equipment information as indicators for the process parameters of each stage. Subsequently, based on these indicators, 50 sets of training samples and 10 sets of testing samples for the neural network model are selected. (All yarns are spun under the same production environment). Table 1 presents a subset of the sample data used in this section.

3.2. Parameter Configuration

To effectively compare the predictive results of yarn quality, it is necessary to maintain consistency in the selection of basic parameters for the BP, LSTM, and GRU neural networks, as shown in Table 2. In the table, the BP neural network, being a feedforward neural network, has different dimensions and quantities of input units compared to the recurrent neural networks. Following the performance indicators of the raw cotton and the process steps of regular carding, the numbers of input units for the BP, LSTM, and GRU neural networks are set to 14, 6, and 6, respectively.

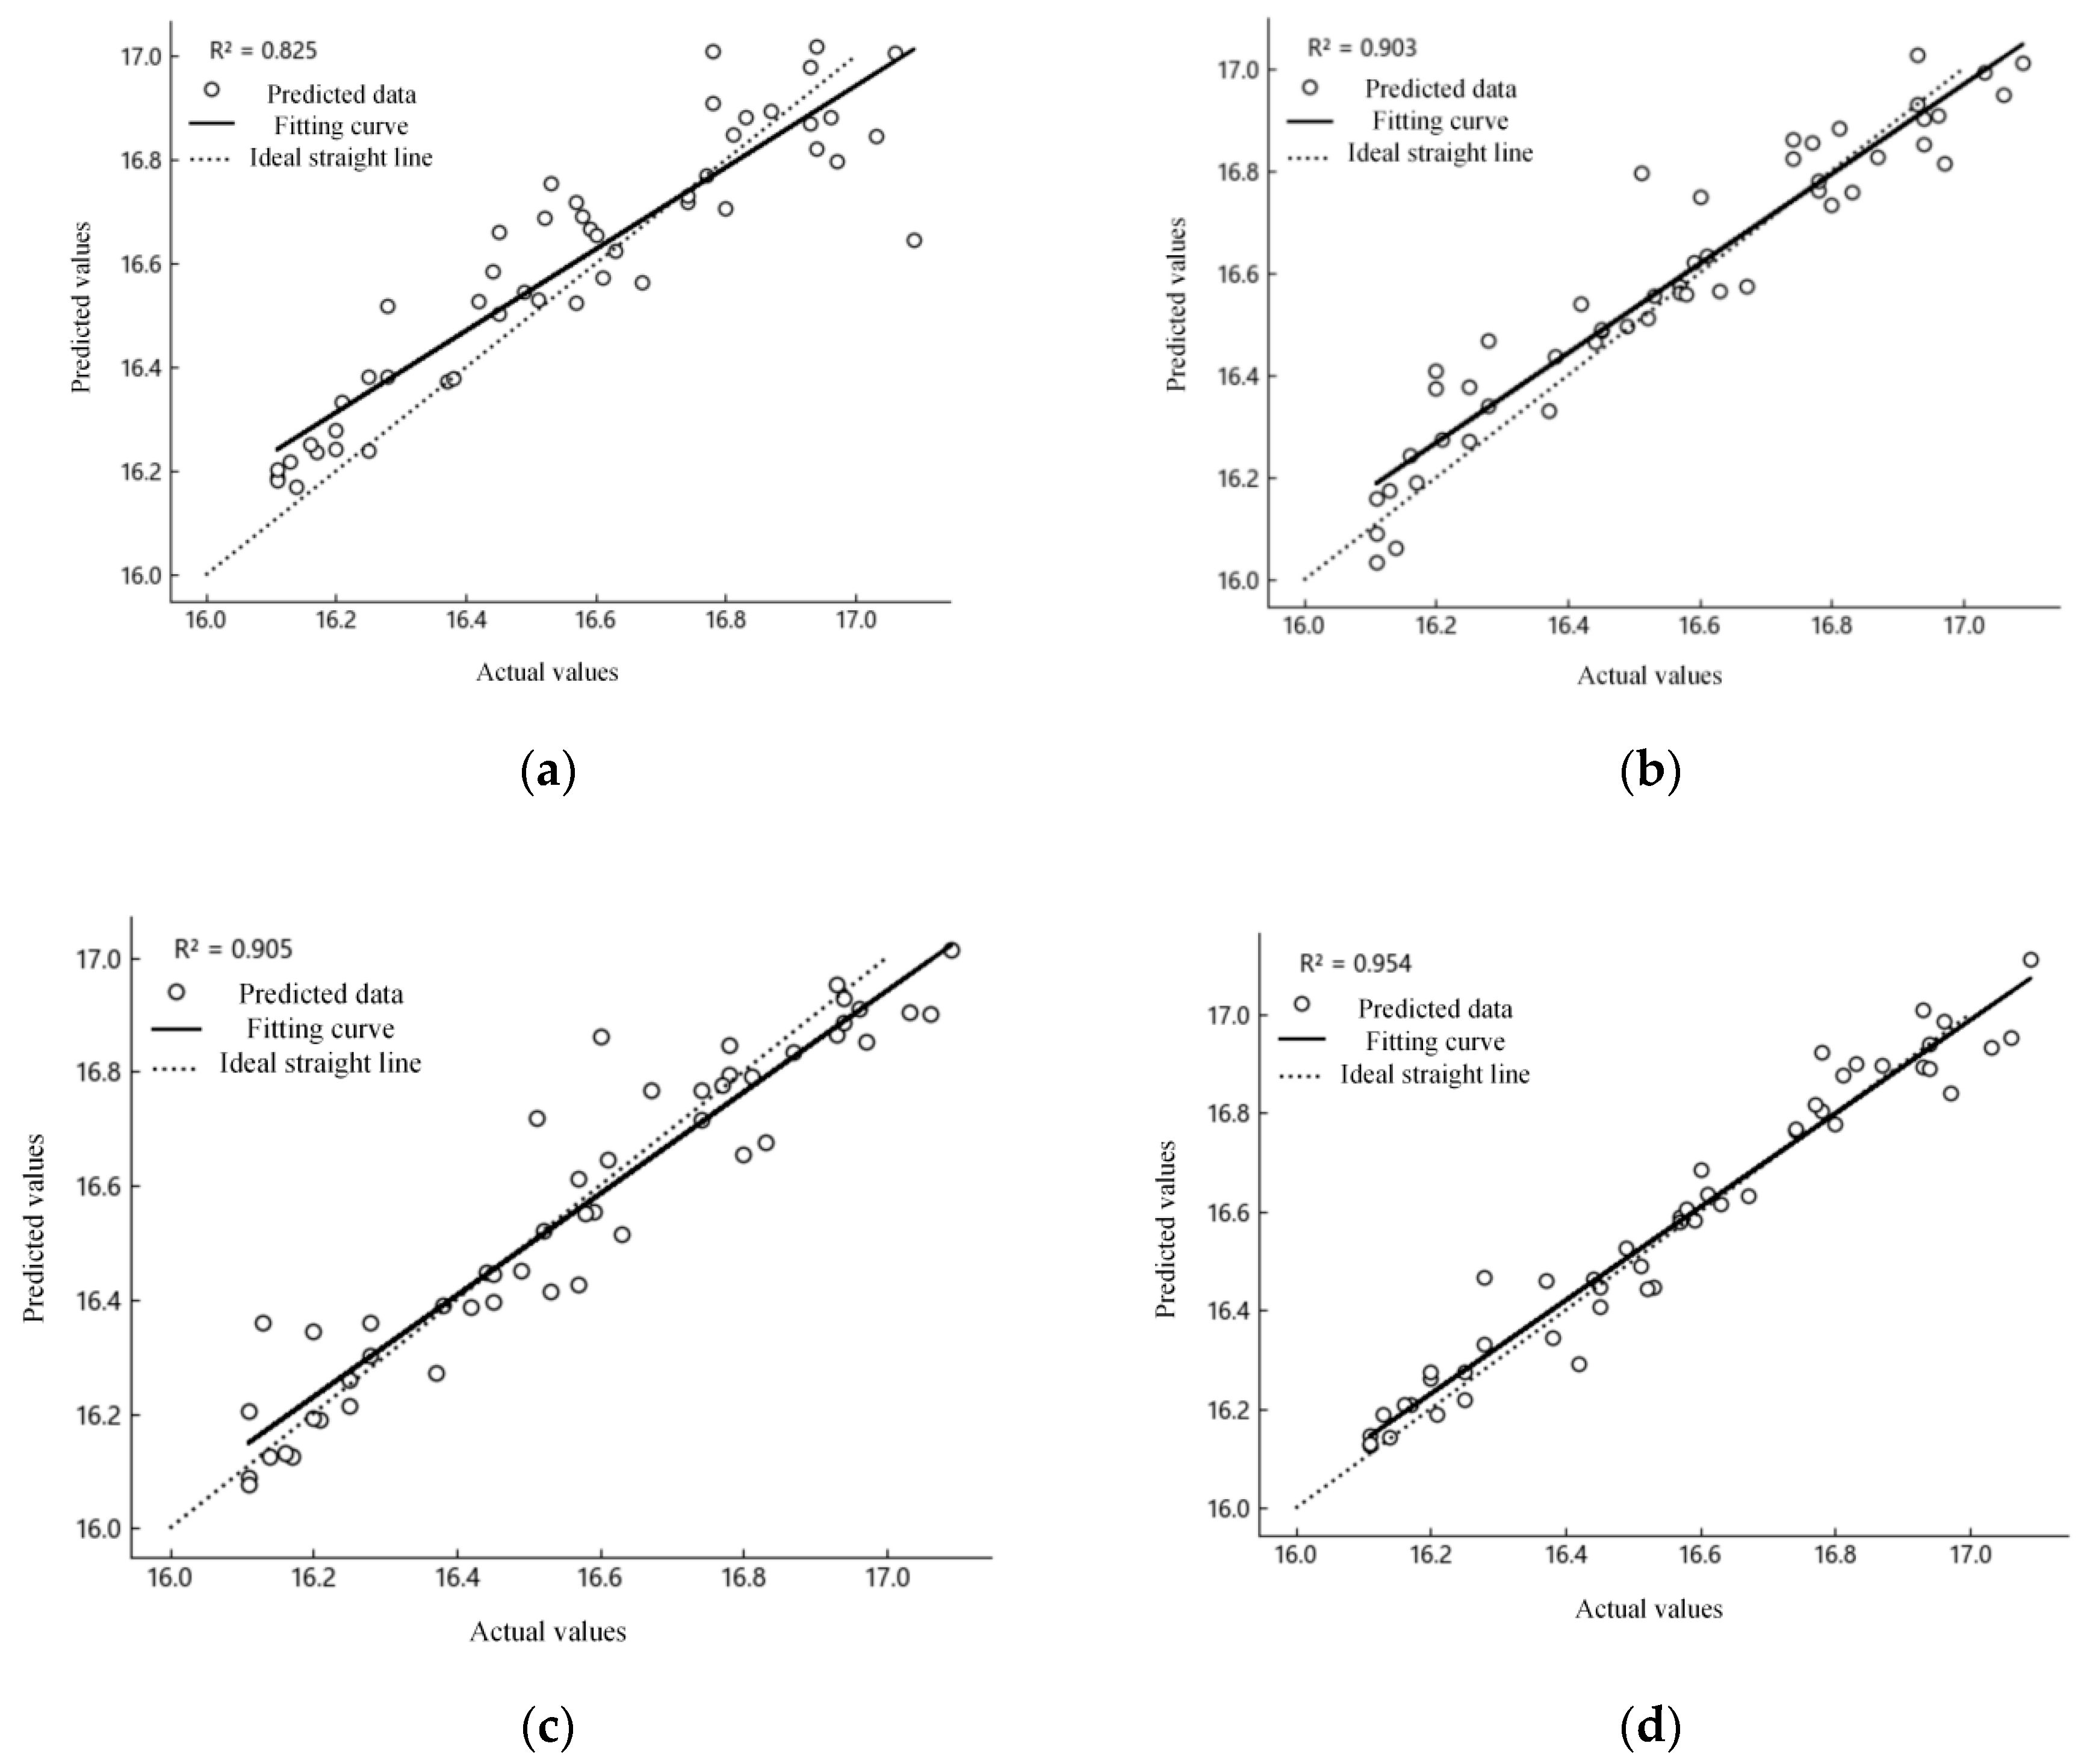
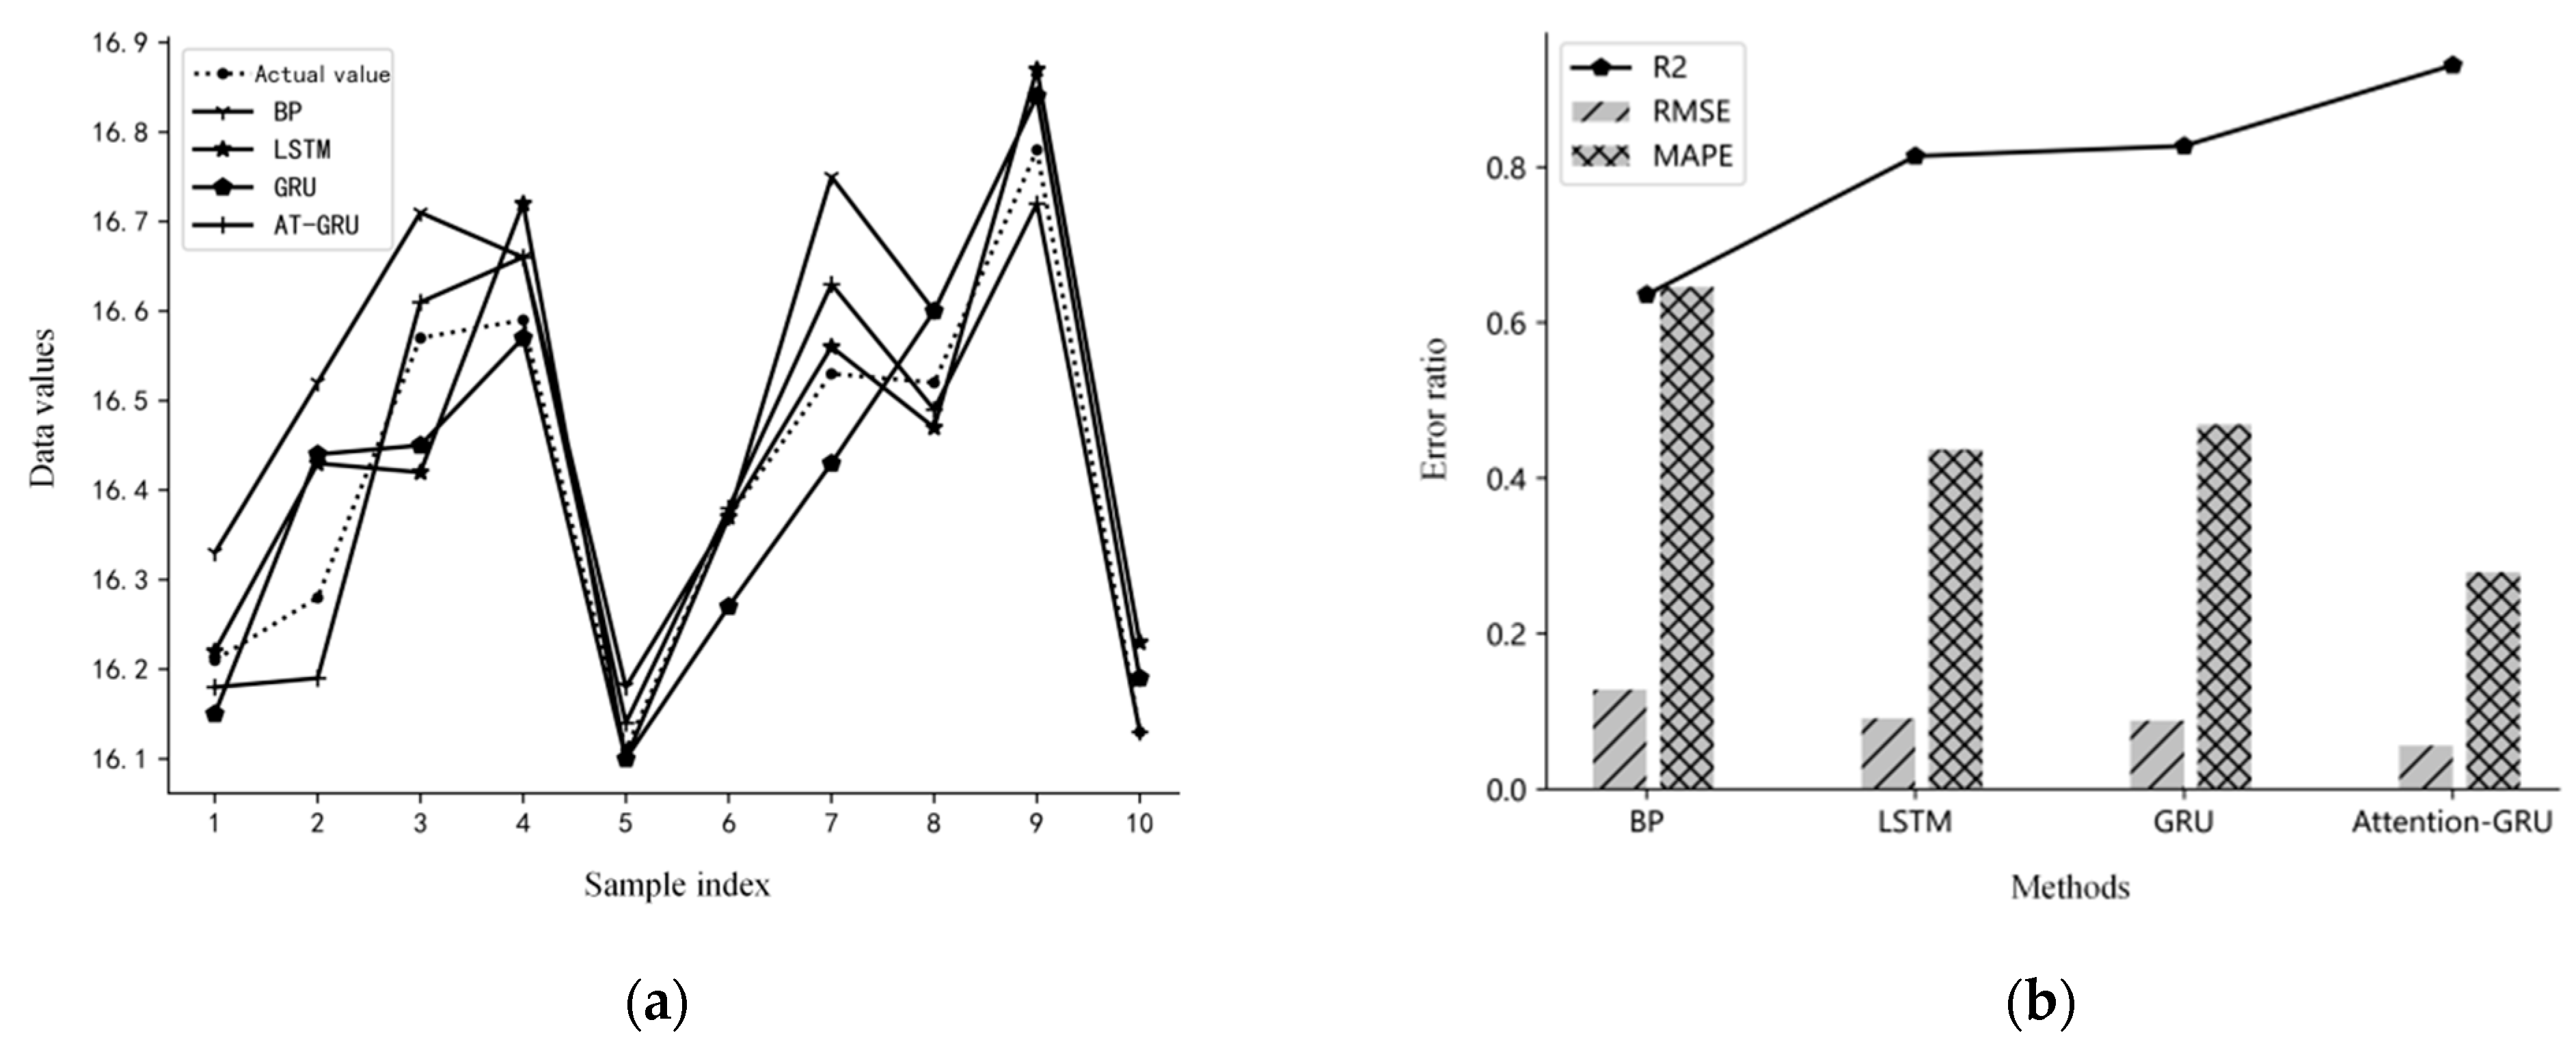
3.3. Model Testing and Comparison

Firstly, the training of the four models was conducted using the provided dataset, resulting in the derivation of iterative loss values and training durations for each model.
The training performance parameters of each model can be inferred from Figure 7 and Table 3. It is observed that the BP neural network exhibits the fastest training speed; however, its loss consistently remains at a higher level and cannot be reduced. In contrast, the GRU model demonstrates a 14.3% reduction in training duration compared to LSTM. Furthermore, the attention-GRU predictive model, which has undergone optimization through attention mechanisms to enhance input parameter quality, achieves the lowest average training loss of 0.005.
From the point of view of actual yarn production cycle and cost of spinning mill, although the attention-GRU model after adding attention mechanism will increase a certain second time cost in training time compared with ordinary GRU, in fact, textile enterprises can accept the time cost of this second level. On the contrary, if the quality of the yarn is not guaranteed, the impact on production is huge. Because the production cycle of yarn is long, once the yarn quality problem occurs, it can only be found at the end of the yarn production process, which greatly extends the reaction adjustment time of the corresponding process and cannot be dealt with in time so that a large number of yarn quality is not up to standard, resulting in production waste, which is unacceptable to textile enterprises. Thus, despite the extension of training duration due to the attention mechanism within the attention-GRU model, it ultimately attains the lowest loss value among the four models. This highlights the efficacy of this mechanism in enhancing the model’s ability to discern complex patterns within the dataset, thereby substantiating its effectiveness in predicting the quality of regular carded yarn.
With the objective of maintaining the superior predictive accuracy of the attention-GRU model proposed in this paper while further reducing the number of model iterations and training time and enhancing predictive efficiency, a strategy involving the implementation of an adaptive loss change threshold was employed for model retraining, as illustrated in Figure 8. Taking the total iteration count from the model parameter settings table in Section 3.2 as a reference, corresponding positive loss change values were calculated for the first three-quarters of the total iteration count. This calculation yielded an adaptive loss change threshold of 0.00074 for the current training dataset. Ultimately, the optimal iteration count for the model was determined as 7535 iterations, corresponding to a loss value of 0.0048 (point ‘e’). Following model optimization, the training duration was reduced to 24.35 s.
After the training process, a correlation analysis was conducted on the final data of the four models. To assess the degree of proximity between the actual quality data and the predicted values of the models, the coefficient of determination R 2 was introduced. The formula is represented as follows:
R 2 = 1 i = 1 n ( y ¯ i y i ) 2 i = 1 n ( y y i ) 2
where: y represents the average value of n instances of y i .
As shown in Figure 9, the coefficients of determination R2 for the four models are 0.825, 0.903, 0.905, and 0.954, respectively. The experimental results indicate that the attention-GRU model exhibits a higher training fit between predicted and actual values in the context of yarn quality prediction, compared to the GRU, LSTM, and BP neural network prediction models without the incorporation of the attention mechanism.
To further evaluate the predictive performance of the proposed models, each trained model is used to predict the outcomes of 10 test samples. The predictive feedback times for each model on the test samples are presented in Table 4.
As evident from Table 4, the predictive feedback times for the test data among the four models range from 11.23 ms to 36.97 ms. Among these, the BP neural network demonstrates the shortest predictive feedback time. While the attention-GRU prediction model proposed in this study does not achieve the optimal prediction feedback time, its millisecond-level predictive feedback time is of minimal consequence for textile production characterized by long production cycles. This slight variation in feedback time is not expected to significantly impact the value of the model’s predictive results.
In addition, the models were quantitatively evaluated using two loss functions that represent regression errors: mean absolute percentage error (MAPE) and root mean square error (RMSE). Smaller values of these metrics indicate more accurate quality prediction results. The formulas are as follows:
E m a p e = 100 % n i = 1 n ( y ¯ i y i ) 2
E r m s e = 1 n i = 1 n ( y ¯ i y i ) 2
The predicted outcomes and the predictive performance of each model are presented in Figure 10 and Table 5, respectively. Figure 10 illustrates that the prediction curve generated by the attention-GRU model closely approximates the curve of actual quality values.
As shown in Table 5, the attention-GRU model demonstrates superior performance compared to the other three methods in terms of root mean square error (RMSE). It showcases substantial reductions of 56.3%, 38.5%, and 36.4% when compared to the other methods, respectively. Moreover, the mean absolute percentage error (MAPE) values for the attention-GRU model decreased by 0.367%, 0.158%, and 0.190% when contrasted with the other methods. In addition, Table 4 provides insight into the goodness of fit of the models on the test dataset. Considering the earlier discussion on training fit, it is evident that the attention-GRU model exhibits the least degree of overfitting. This can be attributed to the attention-GRU cotton quality prediction model’s capability to seamlessly incorporate temporal correlations between preceding and subsequent production processes. By simultaneously considering cotton indicator parameters and process production data, the model aligns more effectively with the actual production processes. The incorporation of the attention mechanism further enhances the model’s ability to select and optimize driving parameters, leading to a notable reduction in prediction errors.
The aforementioned analysis indicates that the application of the proposed attention-GRU model maintains a leading position in the context of yarn quality prediction. It demonstrates the lowest fit loss value on the training dataset. Moreover, by implementing an adaptive loss change threshold, the training time of the model has been reduced, further enhancing the predictive efficiency of the model. Additionally, during the quantitative evaluation of predictive results on the test dataset, the proposed attention-GRU model showcases the lowest predictive loss value. This emphasizes that the model’s predictions closely approximate the actual values of yarn tensile strength, demonstrating its strong generalization ability and effectiveness in the context of yarn quality prediction applications.

4. Conclusions

In this study, we proposed an improved GRU neural network model with the incorporation of the attention mechanism for predicting the tensile strength of cotton yarn, considering the temporal nature of processing stages and their impact on yarn quality. Through a comparative analysis using real sample data, the following conclusions were drawn:
(1) Compared to the BP neural network, GRU and LSTM neural networks have demonstrated their capability to effectively capture the temporal nature of the spinning process and the influence of process parameters on yarn quality. Their predictive models exhibit relatively lower training loss values on the training data for yarn production.
(2) By employing the strategy of adapting the loss change threshold for the proposed Attention-GRU model, the optimal number of iterations and corresponding training loss values for the model have been dynamically determined. This adjustment has resulted in a reduction of the training time from 32.31 s to 24.35 s. While ensuring the model’s superior predictive accuracy, this approach further enhances the predictive efficiency of the model.
(3) The attention mechanism can effectively highlight key information in factors affecting yarn quality. By comparing the predictive performance of various models using test data, the attention GRU model has an overall better predictive performance than GRU, LSTM, and BP neural networks without the attention mechanism. Its average prediction error MAPEs have been reduced by 0.367%, 0.158%, and 0.190%, respectively.
The proposed model and methodology for predicting cotton yarn tensile strength can serve as a foundation for future research into understanding and managing the impact factors and strategies for quality control in other textile production processes.

Author Contributions

Conceptualization, N.D. and X.H.; methodology, H.J. and K.X.; software, H.J. and K.X.; validation, H.J. and K.X.; formal analysis, N.D. and H.J.; investigation, H.J. and K.X.; resources, X.H. and Y.Y.; data curation, N.D. and H.J.; writing—original draft preparation, H.J. and K.X.; writing—review and editing, N.D., X.H. and W.S.; visualization, H.J. and K.X.; supervision, N.D. and H.J.; project administration, N.D. and H.J.; funding acquisition, N.D. and X.H. All authors have read and agreed to the published version of the manuscript.

Funding

This research was funded by The Zhejiang Provincial Postdoctoral Research Program First Class, China (No. ZJ2021038), the Science and Technology Program of Zhejiang Province, China (No. 2022C01202, No.2022C01065), and the Zhejiang Sci-Tech University Research Start-up Fund, China (No.23242083-Y).

Institutional Review Board Statement

Not applicable.

Informed Consent Statement

Not applicable.

Data Availability Statement

Data will be made available on request.

Conflicts of Interest

The authors declare no conflict of interest.

References

  1. Yang, S.; Gordon, S. Accurate prediction of cotton ring-spun yarn quality from high-volume instrument and mill processing data. Text. Res. J. 2017, 87, 1025–1039. [Google Scholar] [CrossRef]
  2. Cirio, G.; Lopez-Moreno, J.; Miraut, D. Yarn-level simulation of woven cloth. ACM Trans. Graph. 2014, 33, 1–11. [Google Scholar] [CrossRef]
  3. Zhou, Q.; Wei, T.; Qiu, Y.; Tang, F.; Gan, X. Prediction and optimization of chemical fiber spinning tension based on grey system theory. Text. Res. J. 2019, 89, 3067–3079. [Google Scholar] [CrossRef]
  4. Ding, Y.; Gao, L.L.; Lu, W.K. Sensitivity Optimization of Surface Acoustic Wave Yarn Tension Sensor Based on Elastic Beam Theory. Sensors 2022, 22, 9368. [Google Scholar] [CrossRef]
  5. Ogulata, S.N.; Sahin, C.; Ogulata, R.T.; Balci, O. The Prediction of Elongation and Recovery of Woven Bi-Stretch Fabric Using Artificial Neural Network and Linear Regression Models. Fibres Text. East. Eur. 2006, 14, 46–49. [Google Scholar]
  6. Balci, O.; Oulata, S.N.; Ahin, C.; Oulata, R.T. An artificial neural network approach to prediction of the colorimetric values of the stripped cotton fabrics. Fibers Polym. 2008, 9, 604–614. [Google Scholar] [CrossRef]
  7. Gharehaghaji, A.A.; Shanbeh, M.; Palhang, M. Analysis of Two Modeling Methodologies for Predicting the Tensile Properties of Cotton-covered Nylon Core Yarns. Text. Res. J. 2007, 77, 565–571. [Google Scholar] [CrossRef]
  8. Yang, X.B.; Hao, F.M. Apply time sequence model to predict and control spinning tension. Basic Sci. J. Text Univ. 2002, 15, 232–235. [Google Scholar]
  9. Lv, Z.J.; Yang, J.G.; Xiang, Q. GA Based Parameters Optimization on Prediction Method of Yarn Quality. J. Donghua Univ. (Nat. Sci.) 2012, 38, 519–523. [Google Scholar]
  10. Yan, X.B.; Sheng, C.H.; Zhang, Y.X. Reserch on Yarn Quality Prediction Technology Based on XJ120 Test Data. Adv. Text. Technol. 2017, 25, 27–30. [Google Scholar]
  11. Cha, L.G.; Xie, C.Q. Prediction of cotton yarn quality based on four-layer BP neural network. J. Text. Res. 2019, 40, 52–56+61. [Google Scholar]
  12. Li, X.F.; Qasim, S.Q.; Chong, W.Y. Influence of GA-BP Artificial Neural Network Based on PCA Dimension Reduction in Yarn Tenacity Prediction. Adv. Mater. Res. 2014, 1048, 358–366. [Google Scholar] [CrossRef]
  13. Ma, C.T.; Shao, J.F. Prediction Model Based on Improved BP Neural Network with Fireworks Algorithm and Its Application. Control Eng. China 2020, 27, 1324–1331. [Google Scholar]
  14. Elrys, S.M.M.E.; El-Habiby, F.F.; Eldeeb, A.S.; El-Hossiny, A.M.; Elkhalek, R.A. Influence of core yarn structure and yarn count on yarn elastic properties. Text. Res. J. 2022, 92, 3534–3544. [Google Scholar] [CrossRef]
  15. Yan, J.W.; Zhu, W.; Shi, J.; Morikawa, H. Effect of silk yarn parameters on the liquid transport considering yarn interlacing. Text. Res. J. 2022, 92, 3808–3815. [Google Scholar] [CrossRef]
  16. Hu, Z.L. Prediction model of rotor yarn quality based on CNN-LSTM. J. Sens. 2022, 2022. [Google Scholar] [CrossRef]
  17. Jorgo, M. Influence of Polymer Concentration and Nozzle Material on Centrifugal Fiber Spinning. Polymers 2020, 12, 575. [Google Scholar]
  18. Qiao, X.; Shunqi, M.; Xiao, Y.; Islam, M.M.; Zhen, C.; Shaojun, W. Analysis of the magnetic field and electromagnetic force of a non-striking weft insertion system for super broad-width looms, based on an electromagnetic launcher. Text. Res. J. 2019, 89, 4620–4631. [Google Scholar] [CrossRef]
  19. Lu, B. Design of knitted garment design model based on mathematical image theory. J. Sens. 2022, 2022. [Google Scholar] [CrossRef]
  20. Akgun, M.; Eren, R.; Suvari, F. Effect of different yarn combinations on auxetic properties of plied yarns. Autex Res. J. 2021, 23, 77–88. [Google Scholar] [CrossRef]
  21. Peng, W.; Wang, Y.; Yin, S.Q. Short-term Load Forecasting Model Based on Attention-LSTM in Electricity Market. Power Syst. Technol. 2019, 43, 1745–1751. [Google Scholar]
  22. Lal, K.; Ammar, A.; Afaq, K.M.; Chang, S.T. Deep Sentiment Analysis Using CNN-LSTM Architecture of English and Roman Urdu Text Shared in Social Media. Appl. Sci. 2022, 12, 2694. [Google Scholar]
  23. Cho, K.; Bart, M.; Caglar, G.; Fethi, B.; Holger, S.; Yoshua, B. Learning Phrase Representations using RNN Encoder-Decoder for Statistical Machine Translation. Comput. Sci. 2014, 10, 1724–1734. [Google Scholar]
  24. Dzmitry, B.; Kyunghyun, C.; Yoshua, B. Neural Machine Translation by Jointly Learning to Align and Translate. arXiv 2014, arXiv:1409.0473. [Google Scholar]
  25. Lu, Q.S. New Media Public Relations Regulation Strategy Model Based on Generative Confrontation Network. Mob. Inf. Syst. 2022, 2022. [Google Scholar] [CrossRef]
  26. Yao, M.; Zhuang, L.; Wang, S.; Li, H. PMIVec: A word embedding model guided by point-wise mutual information criterion. Multimed. Syst. 2022, 28, 2275–2283. [Google Scholar] [CrossRef]
  27. Sehit, H.; Kadoglu, H. A study on the parameters effecting yarn snarling tendency. Text. Appar. 2020, 30, 2–49. [Google Scholar]
  28. Shao, Y.H.; Zhang, M.G.; Cao, J.P.; Guo, X.; Han, X.J. Effect of speed ratio between cylinder and taker-in on carding quality. J. Text. Res. 2020, 41, 39–44. [Google Scholar]
  29. Zhang, C.H.; Li, M. Relationship between raw cotton property and yarn strength. J. Text. Res. 2005, 26, 52–53. [Google Scholar]
  30. Jiang, H.Y. Research of New Spinning Technology on Flax Blended Yarn; Qiqihar University: Qiqihar, China, 2014. [Google Scholar]
  31. Wu, Z.G.; Zhang, S.G.; Xu, J.; Yu, C.G. Influence of Fiber Property and Spun Yarn Twist Factor on Breaking Tenacity of Cotton Yarn. Cotton Text. Technol. 2020, 48, 1–5. [Google Scholar]
Figure 1. Cotton-spinning process flow.
Applsci 13 10003 g001
Figure 2. Spinning quality prediction model based on BP neural network.
Applsci 13 10003 g002
Figure 3. GRU unit structure.
Applsci 13 10003 g003
Figure 4. Attention mechanism structure.
Applsci 13 10003 g004
Figure 5. Structure of spinning quality prediction model based on attention-GRU.
Applsci 13 10003 g005
Figure 6. Adaptive loss change threshold calculation process.
Applsci 13 10003 g006
Figure 7. Iteration loss of each prediction model.
Applsci 13 10003 g007
Figure 8. Adaptive partial loss curve before and after iteration number.
Applsci 13 10003 g008
Figure 9. Correlation analysis comparison chart: (a) correlation analysis chart of BP neural network prediction results; (b) correlation analysis chart of LSTM neural network prediction result; (c) correlation analysis chart of GRU neural network prediction results; (d) attention-GRU prediction results correlation analysis chart.
Applsci 13 10003 g009
Figure 10. Comparative analysis of model prediction accuracy and performance: (a) predicted results curves of each model; (b) comparative performance of predictive models.
Applsci 13 10003 g010
Table 1. Partial sample data.
Micronaire ValueFiber StrengthFiber FinenessFiber MaturityShort Fiber Rate(%)Fiber NepsCarding Cylinder Speed (r/min)Carding Doffer Speed (r/min)Feed Roller Speed (m/min)Final Drafting Roller Speed (m/min)Rough Yarn Twist CoefficientRough Yarn Spindle Speed (r/min)Fine Yarn Twist CoefficientFine Yarn Spindle Speed (r/min)Tensile Strength (cn/tex)
4.6829.51740.8610.8243100747335040111595035013,68316.38
4.5030.41720.8511.1249102247034541011393335613,61216.11
4.6129.81710.8510.6244107346736040411596635213,63016.57
4.5731.81710.8510.424898848035039511595734813,66717.09
4.5428.21700.8611.224199446934539912098234013,68216.45
4.7129.71730.8610.4240103947135039512092335313,62516.37
4.4931.91720.8510.724399047835540011495235513,70816.54
4.3429.81740.8611.0243101746535041011497536013,68016.13
4.4231.01710.8611.1245105646935040612099035813,70216.21
4.6629.21720.8610.624298647134539411097334813,63316.52
Table 2. Comparison model parameter settings.
Parameter NameBPLSTMGRU
Number of Hidden Layer Neurons242424
Activation Functionrelusigmoidsigmoid
Loss FunctionMSEMSEMSE
Optimization AlgorithmAdamAdamAdam
Learning Rate0.00010.00010.0001
Number of Iterations10,00010,00010,000
Training Batch Size505050
Input Dimension and Quantity(50,14)(50,6,6)(50,6,6)
Table 3. Training duration and average loss value of each model.
MethodBPLSTMGRUAT-GRU
Training Duration (s)10.3227.8421.2732.31
Average Loss Value0.0190.0090.0080.005
Table 4. Comparison of model prediction feedback time.
Test Sample No.Predictive Model
BPLSTMGRUAttention-GRU
11.032.172.043.81
21.492.342.063.62
30.981.992.174.17
41.322.031.883.73
51.212.152.003.89
60.862.452.304.61
71.081.761.833.29
81.142.222.013.76
91.032.032.142.48
101.092.421.623.61
Total Time(ms)11.2321.5620.0536.97
Table 5. Comparison of model prediction results.
Test Sample No.Actual ValueBPLSTMGRUAttention-GRU
PredictionErrorPredictionErrorPredictionErrorPredictionError
116.2116.330.1216.220.0116.150.0616.180.03
216.2816.520.2416.430.1516.440.1616.190.09
316.5716.710.1416.420.1516.450.1216.610.04
416.5916.660.0716.720.1316.570.0216.660.07
516.1116.180.0716.100.0116.100.0116.140.03
616.3716.370.0016.370.0016.270.1016.380.01
716.5316.750.2216.560.0316.430.1016.630.10
816.5216.600.0816.470.0516.600.0816.490.03
916.7816.840.0616.870.0916.840.0616.720.06
1016.1316.190.0616.230.1016.190.0616.130.00
Ermse 0.128 0.091 0.088 0.056
Emape/% 0.646 0.437 0.469 0.279
R2 0.636 0.814 0.827 0.931
Disclaimer/Publisher’s Note: The statements, opinions and data contained in all publications are solely those of the individual author(s) and contributor(s) and not of MDPI and/or the editor(s). MDPI and/or the editor(s) disclaim responsibility for any injury to people or property resulting from any ideas, methods, instructions or products referred to in the content.

