Abstract
Using experimental methods to study the influence of hole and cracks on the mechanical properties and fracture characteristics of rock-like mortar materials under biaxial compression conditions. The double crack specimens with hole depths from 0–100 mm are prefabricated to study the strength and deformation characteristics of the specimens under different lateral loads σ2 = 0–6 MPa. The evolution process of secondary crack initiation, development, and connection of the hole-crack specimens are recorded. The results show that: (1) One type of rock mortar test material is prepared, and its main physical and mechanical parameters are all within the range of sandstone, which can effectively simulate the stress deformation characteristics of sandstone. (2) When the depth of the holes in cracked samples exceeds 50% of the length, the strength and deformation of the samples undergo a sudden change. When the depth of the hole in the crack specimen increases from 40 mm to 60 mm, the peak stress decreases most significantly. Moreover, the maximum values of the strain value at peak strength and lateral strain both occur at a hole depth of 60 mm. (3) When the cracked specimen contains through-holes, the failure mode is composite fracture and shear composite fracture. When the depth of the hole is different, the fracture forms include tension composite fracture, shear composite fracture, and composite fracture.
1. Introduction
In various rock engineering projects, most of the rock destabilization is due to the change in the natural stress field of the rock mass during the construction process, such as the excavation of underground caverns, the drilling of anchor holes during the support process, the change in pore water pressure after water injection, etc. The internal cracks of the rock are disturbed by the construction process, resulting in the initiation, expansion, and penetration, forming a macroscopic fracture zone, which eventually leads to the collapse and failure of the rock mass.
Therefore, several scholars have conducted research on the deformation and failure characteristics of rock masses containing multiple cracks and compound defective cracks. Wong [1] and Wong, et al. [2] prefabricated cracks inside granite, and observed the propagation and fracture mechanism of cracks under uniaxial compression. The authors [3,4,5,6,7,8,9] have conducted numerous studies and summaries on the expansion pattern of prefabricated fractures in cracked rock. Yang, et al. [10,11,12] summarized the multi-fracture interaction, penetration, and linkage mechanisms, and analyzed the influence law of the parameters and geometric distribution of fractures on the deformation and damage characteristics of marble. The authors [13,14,15,16,17] carried out experimental studies of rock damage with combined hole-crack defects, hole-hole, and different hole shapes under compression. Yang [18] analyzed the effects of the coplanar angle and ligament angle on the mechanical parameters and fracture process of red sandstone containing prefabricated elliptical holes. Gratchev et al. [19] proposed that the longer and wider the crack, the lower the strength of the specimen, and that the damage to the specimen is mainly caused by shear cracks. Fakhimi et al. [20] conducted biaxial compression tests on single-hole sandstone to simulate the damage of brittle rock during underground excavation.
In real rock materials, there are many defects, such as joints and cracks, with varying shapes and disorderly distribution. It is also difficult to arrange built-in cracks, so it is difficult to summarize the crack propagation law and its impact on the mechanical properties of materials using rock for testing. This study formulated a brittle mortar material. Through physical and mechanical parameter testing of the mortar material, the results compared with sandstone showed that the mortar material is a heterogeneous material with good brittleness, and its physical and mechanical parameters are all within the range of sandstone. As a substitute for sandstone, testing can effectively simulate its stress deformation characteristics. On this basis, biaxial compression experiments are conducted on the samples to investigate the generation, development, and association of secondary cracks in the cracked samples under different hole depths and compression loads, to study the mechanism of crack propagation, and to obtain damage modes under different excavation depths.
2. Test Program
Preparation of the Rock-like Material Mortar Model
The field test process is relatively rough, and it is easily influenced by the surrounding environment and human factors during the testing process. Therefore, based on the advantages of the similar physical model, such as simple fabrication and easy control of crack joints, indoor similar physical model experiments are conducted to study the crack propagation law during compression.
The use of similar material solutions instead of natural rock to simulate the physico-mechanical properties of rocks requires the determination of proportionality relationships between the two. Therefore, the selection of similar materials is crucial [21], and the well-known theory of the similarity three theorems [22] is used to determine these proportional relationships.
1. Selection of Similar Materials
Firstly, based on existing research results and comprehensive experimental research needs, rock-like materials are determined, and finally cement, river sand, and water are selected as the raw materials for making mortar samples. To obtain the similarity ratio relationship between sandstone and model materials, domestic and foreign model experiments were analyzed and summarized. Finally, based on various experimental results and extensive proportioning tests, the following similar material proportions were determined: ordinary Portland cement, natural river sand, and water, in the ratio of 1:0.5:0.4. Cement is selected as C42.4 Portland cement, and river sand is screened using a particle-size sieve with a particle size of 0.5 mm.
2. Selection of molds and prefabrication of holes and cracks
Select a standard size mold of 100 mm × 100 mm ×100 mm, as shown in Figure 1a. The inner surface of the mold is smooth, and there is an air inlet in the center of the bottom. There is a fixed buckle left outside the hole for fixing the air outlet of the demolding air gun, which uses pneumatic non-destructive demolding. The demolding air gun outlet is shown in Figure 1b.
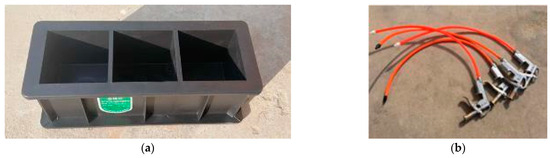
Figure 1.
The sample mold and the demolding air gun. (a) The standard size mold of 100 mm × 100 mm ×100 mm. (b) The demolding air gun.
The pre-crack in the sample is a pre-cut mica sheet placed in the mold, as shown in Figure 2a. The thickness of the mica sheet is 0.3 mm. It is composed of polysilicon Muscovite, quartz, garnet, and Rutile. The mica sheet has the advantages of toughness, flexibility and easy cutting. When prefabricating holes, stainless steel round rods with different diameters are selected, as shown in Figure 2b. After pouring is completed, the stainless steel rods are inserted into the sample, and the length of insertion can be arbitrarily selected to achieve the purpose of making holes of different depths.
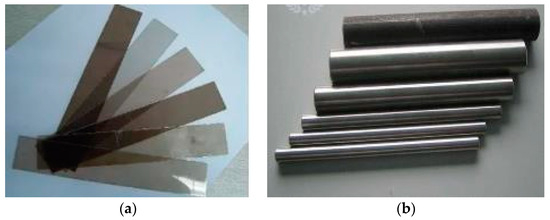
Figure 2.
The mica sheet and the stainless steel rods. (a) The mica sheet. (b) The stainless steel rods.
3. Procedure for Making Samples
(1) Weighing and mixing of raw materials
According to the determined proportion of the three materials, use electronic scales to weigh cement, river sand, and water according to the weight percentage, then put the cement and river sand into the mixer for thorough mixing, and slowly add the mixed materials to the corresponding proportion of water and mix well.
(2) Apply mold release agent
Apply release agent to the metal round rod and the inner side wall and bottom of the mold. After comparing the experimental results of various release agents, high-precision silicone grease is chosen as the release agent for metal round rods and molds. The release agent is applied in a thin, transparent, and uniform form, and is appropriately thickened at the small holes at the bottom of the mold to prevent slurry leakage.
(3) Pouring of specimens and making of holes and cracks
After the cut mica sheet is placed in the designed position of the mold, the mixed material is poured into the mold pre-coated with lubricating oil. Then, a metal round rod is inserted into the mortar, and the metal round rod is fixed with a fixture to prevent the mortar from sinking during the curing process. Finally, it is knocked and vibrated for 2–3 min before being allowed to stand.
(4) Demolding
Place the prepared specimen into a standard constant temperature and humidity curing box for 24 h. After the mortar solidifies, remove the metal round rod. Care must be taken during the removal process to prevent new damage to the interior of the preliminarily solidified mortar sample. Subsequently, use a demolding air gun for demolding. Due to the presence of lubricants, the sample can be demolded smoothly. After demolding, place the sample in a constant temperature and humidity curing box and cure it for 28 days according to the concrete curing standards.
(5) Grinding and leveling of specimens
Grind and level the upper and lower surfaces of the cured specimen to form a cube-size specimen (L × W × H = 100 mm × 100 mm× 100 mm). The finished sample diagram is shown in Figure 3.
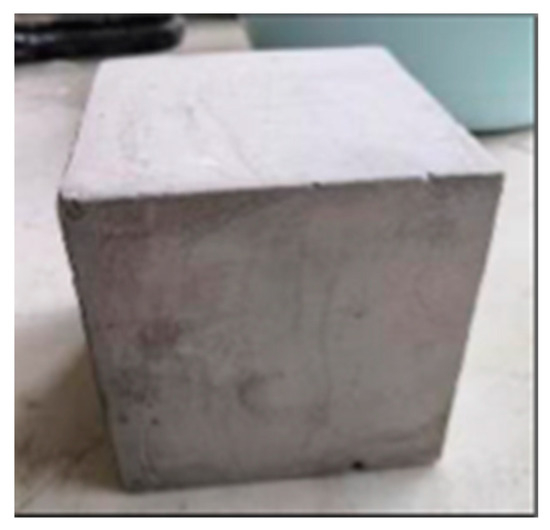
Figure 3.
The mortar sample.
3.1. Mechanical Performance Testing of the Rock-like Material Mortar Model
1. Uniaxial compression test
Conduct uniaxial compression on the mortar sample and compare it with natural sandstone. The mechanical parameters to be tested include the compressive strength, elastic modulus, tensile strength, Poisson’s ratio, etc. Uniaxial compression is carried out through the RMT-150B Rock mechanics test system in Figure 4.
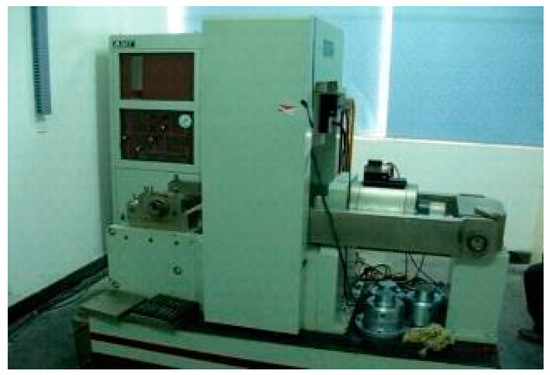
Figure 4.
RMT-150B rock mechanics test system.
The testing machine records the axial strain and transverse strain of the specimen, which automatically generates the stress–strain curve from the collected data, and obtains the physical and mechanical indicators such as the elastic modulus, compressive strength, and Poisson’s ratio of the specimen. The test results are shown in Figure 5. Although the peak strength of the mortar sample is somewhat lower than that of natural sandstone [23], the stress–strain curve of both samples is consistent. After a brief period of compaction, the specimens entered the elastic stage. At the stage of approaching peak strength, significant plasticity appeared, and the slope of the stress–strain curve gradually decreased. During the middle stage of loading, small cracks appeared on the surface of the mortar sample. As the sample approached its peak, small cracks gradually expanded, and as the load continued to increase, larger cracks formed. The sample suddenly fractured, and the axial stress rapidly decreased after the peak. The fracture mode of the complete mortar sample was also relatively consistent with the traditional uniaxial compression failure mode of rocks, both of which were shear failure with an inclination angle of nearly 45°.
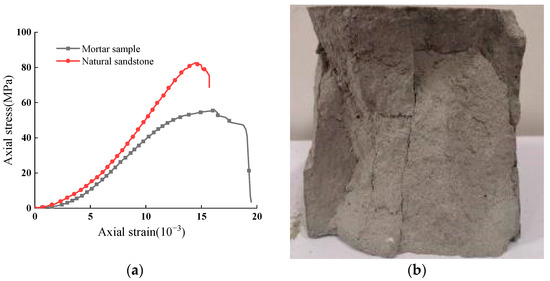
Figure 5.
The stress–strain curve and failure diagram of complete mortar specimens. (a) The stress–strain curves of sandstone and mortar specimens. (b) Uniaxial compression failure diagram of mortar specimens.
The comparison of physical indicators between the tested mortar samples and natural sandstone is shown in Table 1.

Table 1.
Comparison of mechanical parameters between mortar and natural sandstone.
2. Brazilian splitting test
The tensile strength of similar materials can be obtained using the Brazilian disc splitting test on the RMT-150B rock mechanics testing system. In the splitting test, the specimen is subjected to a line-concentrated load on the press, and a cylindrical specimen with dimensions of φ50 mm × 25 mm is made for the test according to the optimal mixing ratio scheme for similar materials in the uniaxial compression test. The well-maintained specimen was placed on the testing machine, and a uniform load was applied to the specimen on the testing machine at a rate of 0.3 MPa/s until the specimen was split.
According to the elastic mechanics formula, the tensile strength of the model specimen is calculated as
where σt denotes the tensile strength of the model, MPa; P denotes the maximum load of the model at the time of damage, kN; D denotes the diameter of the model, mm; and H denotes the thickness of the model, mm. The test results are shown in Figure 6.
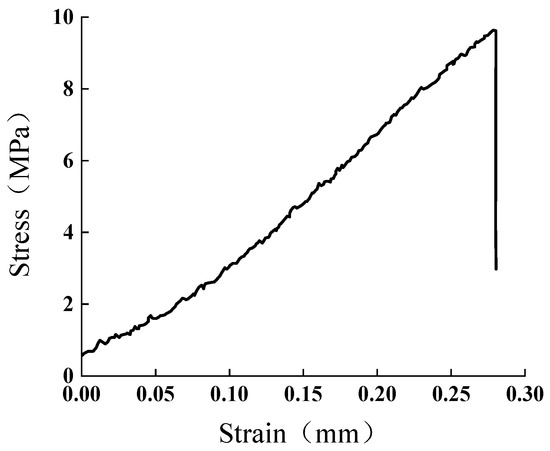
Figure 6.
Stress–strain curve of Brazilian disc splitting test.
3.2. Specimen Preparation
In the mortar sample, the holes of different depths are prefabricated, and the holes are horizontal and pass through the center of the sample, while penetrating cracks with an inclination of 45° passing through the center of the prefabricated holes.
The finished specimen and the schematic diagram are shown in Figure 7. As shown in Figure 7, D is the diameter of the hole and H is the depth of the hole. In the sample, the diameter D = 10 mm, the crack length C = 30 mm, and the crack is a penetrating crack. This test is a total of six groups; respectively, H = 0 mm, H = 20 mm, H = 40 mm, H = 60 mm, H = 80 mm, and H = 100 mm, and each group of biaxial compression specimen number is three groups.
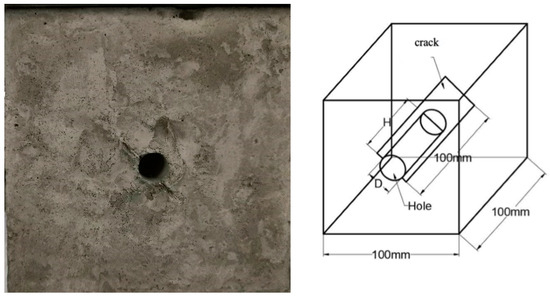
Figure 7.
The hole-crack specimen and its perspective structure diagram.
3.3. Test Loading
The biaxial compression test was conducted using a true triaxial electro-hydraulic servo rock fracture seepage testing machine from the Nanjing Hydraulic Research Institute, as shown in Figure 8. The electro-hydraulic servo true triaxial shear test testing machine for rock mass is mainly composed of a host machine, seepage water cylinder, oil source, and electric control system. The equipment is equipped with precision stress and displacement sensors, as well as three sets of mutually perpendicular loading actuators. The range of these loading actuators is 100 t, and their pressure source is provided by a special oil pipe through an oil pump. The axial deformation and load are synchronously recorded by the built-in stress displacement sensor, with a maximum error of ±1% for the load sensor and ±0.0005 mm for the displacement sensor. Accurate measurement and recording of displacement and deformation can be achieved, and the sensor transmits the test data to the control system.
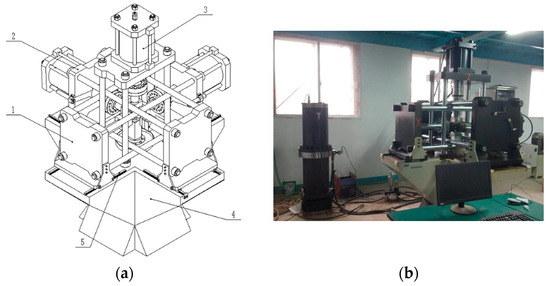
Figure 8.
The true triaxial electro-hydraulic servo rock fracture seepage testing machine (from the Nanjing Hydraulic Research Institute). (a) 1. X-axis loading system, 2. Y-axis loading system, 3. normal loading system, 4. base platform, 5. pressure rail. (b) Instrument image.
1. Host system
The test host system consists of five major components, as shown in Figure 8; namely, the X-axis loading system, Y-axis loading system, normal loading system, base platform, and pressure rail. Both the X and Y loading systems and the normal loading system can independently apply force to the sample, with a static load of 1000 kN and an actuator stroke of 140 mm. The servo valve is precisely controlled. The X (Y) direction loading system consists of a servo actuator, anti-rotation device, oil cylinder support plate, pull rod, load sensor, deformation measurement system, reaction support plate, and pressure head. It achieves free movement in the X (Y) direction through a guide rail installed on the bottom platform. The pressure head structure is composed of a universal head and a pressure plate, which can effectively compensate for the test force bias caused by sample shape and position errors. The normal loading system mainly consists of servo actuators, anti-rotation devices, oil cylinder support plates, columns, load sensors, etc.
2. Testing machine control system
The computer can display and record the load, displacement, deformation, and other parameters generated during the experiment in full digital real-time, and draw the results into a test curve, as shown in Figure 9. The system can collect and store test conditions, sample parameters, and test data. The test process has protection functions such as overload and setting conditions.
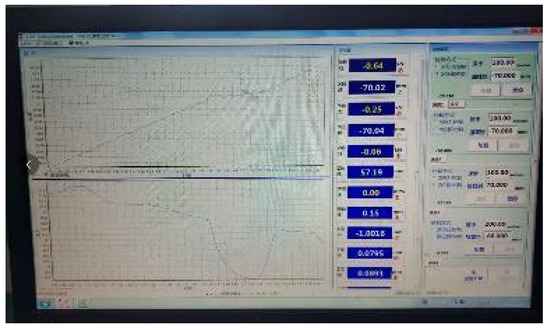
Figure 9.
The control system.
3. Hydraulic source
The hydraulic source system consists of an oil tank, a 7.5 kW electric motor, a 10 L/min axial piston pump, a cooling system, a valve group, a control cabinet, etc., as shown in Figure 10. The valve group includes a one-way valve and a manual overflow valve, which can adjust the required pressure according to different tests and be observed through a pressure gauge. A precision oil filter is used to ensure the cleanliness of the system oil.
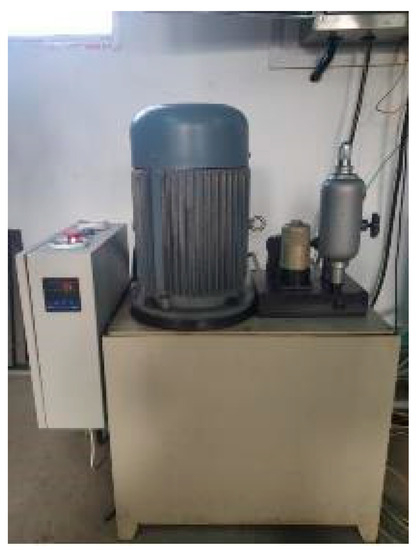
Figure 10.
The oil source system.
This test uses an electro-hydraulic servo rock triaxial testing machine. After applying lubricating oil to the contact surface between the sample and the loading head, the sample is loaded with a predetermined load in both the axial and lateral directions, maintaining a value of σ1 = σ2. The axial load is continuously applied to the specimen while keeping the lateral load stable. The loading mode is carried out by displacement control at a rate of 0.005 mm/s until the specimen is damaged, and the loading mode is schematically shown in Figure 11.
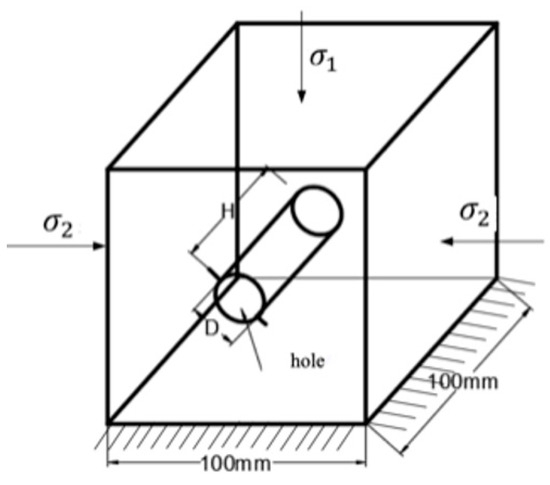
Figure 11.
Diagram of biaxial compression loading.
4. Strength Characteristics and Crack Evolution of Hole-Crack Specimens under Biaxial Compression
4.1. Characterization of Strength Properties with Lateral Pressure in Through-Type Hole-Cracked Rock-like Specimens
Biaxial compression tests of through-type hole-crack specimens are carried out, keeping the steady lateral pressure σ2 at 0 MPa, 2 MPa, 4 MPa, and 6 MPa. As shown in Figure 12, when there is no lateral pressure (σ2 = 0 MPa), the peak strength of the specimen is 21.22 MPa. When the lateral pressure σ2 = 2 MPa, the peak strength is 48.55 MPa: an increase of 273%, which significantly increased the peak strength of the specimen. Also, the peak strain is significantly reduced compared to no lateral pressure, due to the limitation of lateral stress. With the increase in lateral pressure, the peak strength of the specimens shows varying degrees of increase. At the lateral pressure σ2 = 4 MPa, the peak strength of the specimen is 51.21 MPa, which is an increase of about 5.5% compared to the peak strength at σ2 = 2 MPa. At the lateral pressure σ2 = 6 MPa, the peak strength of the specimen is 61.44 MPa, which is a 16.7% increase compared to the peak strength at σ2 = 4 MPa. According to the trend of peak stress and crack initiation stress shown in Figure 13, both peak stress and crack initiation stress increase with the increase in lateral pressure. In particular, when the lateral pressure is increased from nothing to something, the increase in peak strength increases significantly. As the lateral pressure continues to increase, the increase in peak strength decreases. The mechanical properties of the specimens under different lateral pressures are shown in Table 2.
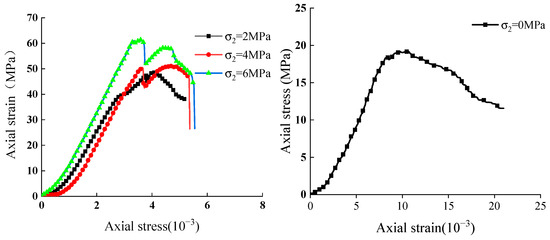
Figure 12.
Axial Stress–strain curve of hole-crack specimen.
Figure 13.
Variation curves of peak stress and crack initiation stress with lateral stress of hole-crack specimen.
Table 2.
Mechanical properties of hole-crack specimens under biaxial compression.
Deformation is one of the important factors in determining the stability of rock masses. Therefore, a study of the specimen peak strain is carried out. The variation in peak strain with lateral stress in the test for through-type hole-cracked rocks is shown in Figure 14. The strain value at peak strength is in the range of 3.5 × 10⁻³–5 × 10⁻³; it does not show an increase with the increase in lateral pressure, and the larger value of the peak strain appears at the lateral pressure σ2 = 4 MPa. The lateral displacement of the specimens under different lateral pressures is also different, and the variation in lateral displacement with load is shown in Figure 15. The lateral displacements change gently in the pre-loading period. The lateral displacement shows a sharp upward trend in the middle and late stages of loading, which is due to the beginning of severe plastic damage of the specimen and weakening of the bearing capacity, resulting in a significant increase in lateral displacement. As shown in Figure 16, the peak lateral strain decreases with increasing lateral pressure. When the lateral pressure σ2 = 2 MPa and σ2 = 4 MPa, the reduction in lateral strain is smaller. At the lateral pressure σ2 = 6 MPa, the lateral strain decreases significantly, reflecting that its lateral confinement effect becomes more prominent as the lateral pressure increases.
Figure 14.
Variation curve of peak strain with lateral stress of hole-crack specimen.
Figure 15.
Lateral strain and axial stress curve of hole-crack specimens.
Figure 16.
Variation curve of peak lateral strain with lateral stress of hole-crack specimens.
4.2. Strength Characteristics of Hole-Crack Specimens with Hole Depth Changes
In order to analyze the variation in the mechanical properties of the hole-crack rock with hole depth, specimens with hole depths of 0 mm, 20 mm, 40 mm, 60 mm, 80 mm, and 100 mm, and with penetration cracks, are made. The steady lateral pressure of σ2 = 4 MPa is chosen for the test, and the axial stress–strain curve obtained is shown in Figure 17. Under the action of lateral pressure, the peak strength of the specimen shows a decrease with the increase in hole depth, but the magnitude of change is relatively gentle, and the peak stress is maintained between 50 MPa–70 MPa.
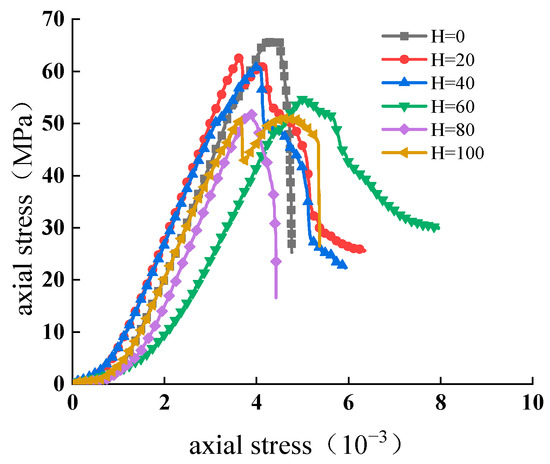
Figure 17.
Axial stress–strain curves of specimens with different hole depths under lateral stress σ2 = 4 MPa.
The variation curve of peak stress and cracking stress is shown in Figure 18. When the hole depth in the hole-crack specimen is from 40 mm to 60 mm, the peak stress decreases more significantly, by about 10%. In this process, the hole depth exceeds 50% of the specimen length. The main deformation area of the sample is the hole and crack area, which changes the stress distribution structure. Excessive deformation on the porous side leads to inconsistent deformation before and after the test, leading to unstable failure of the sample. This is also confirmed by the consistent trend of the crack initiation stress with the peak stress in the graph. Except for the rest of the hole depth variation stages, the peak stress decreases by about 3% for every 20 mm increase in hole depth.
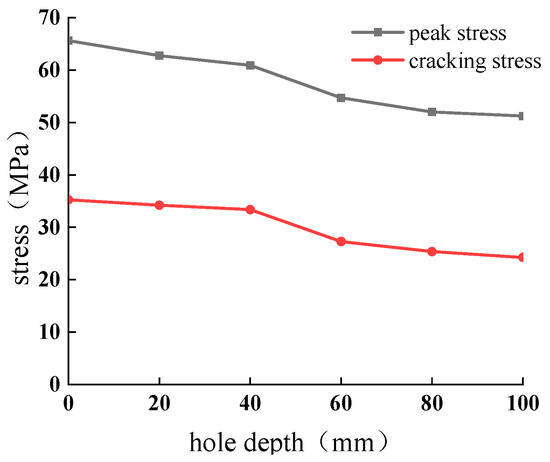
Figure 18.
Crack initiation stress and peak stress of specimens with different hole depths.
Figure 19 shows the trend of the axial peak strain of the specimens. At 4 MPa lateral pressure, the axial peak strain does not increase linearly with increasing hole depth, and the maximum peak strain occurs at a hole depth of 60 mm. The variation in the lateral strain curve with axial stress is shown in Figure 20. Due to the restraining effect of lateral pressure, the curve changes gently in the early stage with a small slope, and then the curve suddenly becomes steeper and the slope increases rapidly when it approaches the peak stress. The variation curve of lateral peak strain with hole depth is shown in Figure 21. Similarly to the axial peak strain, the maximum value of the lateral peak strain occurs at a hole depth of 60 mm. The mechanical properties of the specimens with different hole depths under 4 MPa lateral pressure are shown in Table 3.
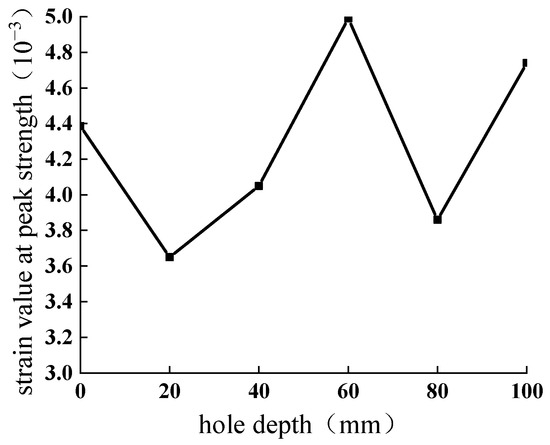
Figure 19.
Strain value at peak strength of specimens with different hole depths under lateral stress σ2 = 4 MPa.
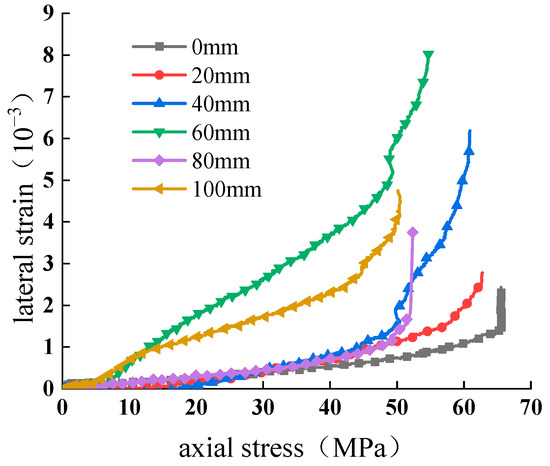
Figure 20.
Lateral strain and axial stress of specimens with different hole depths under lateral stress σ2 = 4 MPa.
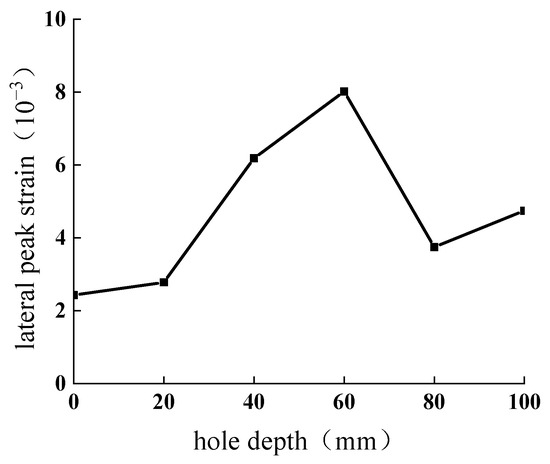
Figure 21.
Lateral peak strain of hole-crack specimens with different hole depths under lateral stress σ2 = 4 MPa.
Table 3.
Mechanical properties of hole-crack specimens with different hole depths under lateral stress σ2 = 4 MPa.
4.3. Crack Extension Evolutionary Characteristics of Hole-Crack Specimens under Biaxial Loading
The images of hole-crack specimens during loading damage are collected, and the extended damage mechanisms such as crack initiation, extension, and penetration of the specimens are obtained by analyzing these images. Figure 22, Figure 23 and Figure 24 represent the damage processes of the penetration hole-cracked specimens at different lateral pressures σ2 = 2 MPa, 4 MPa, and 6 MPa. Figure 25, Figure 26, Figure 27, Figure 28 and Figure 29 represent the damage process of hole-crack specimens with different hole depths at a steady lateral pressure σ2 = 4 MPa.
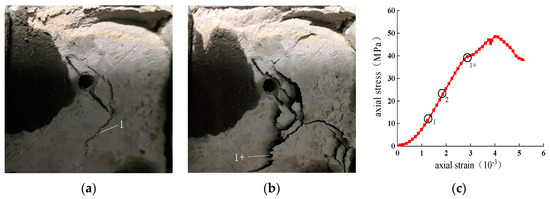
Figure 22.
H = 100 mm, σ2 = 2 MPa crack propagation pattern and stress–strain curve. (a) σ = 25%σmax (b) σ = 90%σmax (c) H = 100 mm, σ = 2 MPa stress–strain curve.
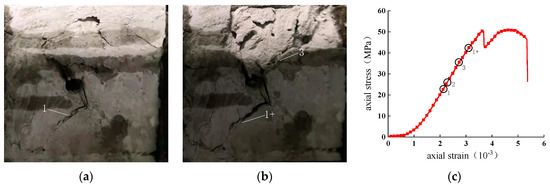
Figure 23.
H = 100 mm, σ2 = 4 MPa crack propagation pattern and stress–strain curve. (a) σ = 65%σmax (b) σ = 95%σmax (c) H = 100 mm, σ = 4 MPa stress–strain curve.
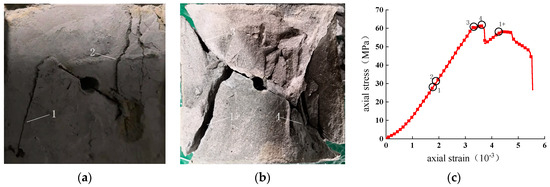
Figure 24.
H = 100 mm, σ2 = 6 MPa crack propagation pattern and stress–strain curve. (a) σ = 65%σmax (b) σ = 100%σmax (c) H = 100 mm, σ = 6 MPa stress–strain curve.
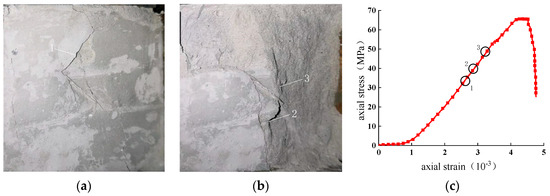
Figure 25.
H = 0 mm, σ2 = 4 MPa crack propagation pattern and stress–strain curve. (a) σ = 40%σmax (b) σ = 70%σmax (c) H = 0 mm, σ = 4 MPa stress–strain curve.
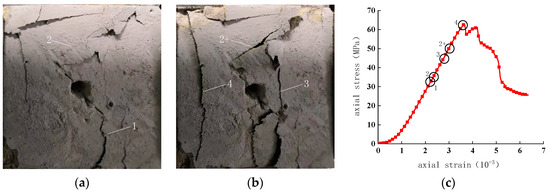
Figure 26.
H = 20 mm, σ2 = 4 MPa crack propagation pattern and stress–strain curve. (a) σ = 55%σmax (b) σ = 100%σmax (c) H = 20 mm, σ = 4 MPa stress–strain curve.
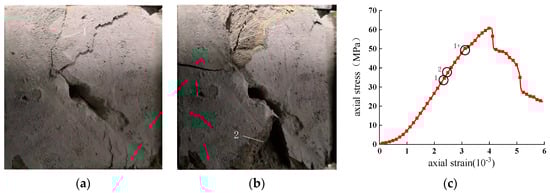
Figure 27.
H = 40 mm, σ2 = 4 MPa crack propagation pattern and stress–strain curve. (a) σ = 60%σmax (b) σ = 95%σmax (c) H = 40 mm, σ = 4 MPa stress–strain curve.
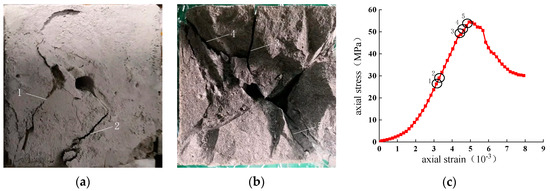
Figure 28.
H = 60 mm, σ2 = 4 MPa crack propagation pattern and stress–strain curve. (a) σ = 60%σmax (b) σ = 100%σmax (c) H = 60 mm, σ = 4 MPa stress–strain curve.
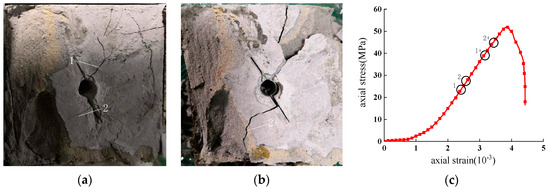
Figure 29.
H = 80 mm, σ2 = 4 MPa crack propagation pattern and stress–strain curve. (a) σ = 55%σmax (b) σ = 95%σmax (c) H = 80 mm, σ = 4 MPa stress–strain curve.
- (1)
- H = 100 mm, σ2 = 2 MPa
The secondary crack initiation point of the specimen is at the tip of the prefabricated crack. It is shown that the stress concentration caused by cracks is more pronounced during the compression process due to the difference in geometric characteristics of cracks and holes. The initial crack initiation angle is larger compared to the control test without lateral pressure. As shown in Figure 22a, crack No. 1 is a standard wing crack with an extension angle of 90° at about 37% of the peak stress. With the increase in load, the No. 2 wing crack appears at 50% of the peak strength, and the No. 2 wing crack extension angle is also 90°. Unlike the results of the uniaxial control test, the expansion direction of the wing crack does not shift to the main stress direction with the increase in the load, but continues to expand in the crack initiation direction until penetration, and the wing crack gradually widens with the increase in the axial load, as shown in Figure 22b, 1+. As the crack becomes wider, the slope of the curve decreases significantly at 82.4% of the peak. Near the peak strength, the potential energy is converted into the surface potential energy required for crack expansion due to the continuous expansion and widening of existing cracks, releasing most of the potential energy so that no new cracks are generated until the specimen is completely destroyed at the peak load. The stress–strain curve of the specimen and the crack stress point location are shown in Figure 22c.
- (2)
- H = 100 mm, σ2 = 4 MPa
When the lateral stress σ2 = 4 MPa, the peak strength of the specimen is elevated and the initial cracking stress of the crack is higher at the same time. The initial crack at the No. 1 wing crack in Figure 23a appears at 24 MPa, which is about 48% of the peak strength, followed by a No. 2 wing crack at 50% of the peak strength at the upper end of the pre-crack of the specimen, with an extension angle of about 90°. The precast hole is a penetration hole, so a stress concentration point is formed at the intersection of the hole and the crack, and the No. 3 wing crack in Figure 23b appears at this intersection when the stress reaches 72% of the peak strength, and the extension angle is still 90°. All of the wing cracks do not shift the crack expansion angle during the expansion process, and all of them expand according to the initial crack angle until they penetrate the specimen. The stress–strain curves of the specimens are shown in Figure 23c. The appearance of cracks 1 and 2 can be attributed to the extension of the prefabricated cracks without significant fluctuations in the stress–strain curves. However, the appearance of crack No. 3 lead to large stress fluctuations in the specimen, and although there is no complete loss of load capacity, the curve already shows obvious plastic characteristics, and then the specimen is rapidly destroyed.
- (3)
- H = 100 mm, σ2 = 6 MPa
Unlike the specimens at lateral pressure σ2 = 2 MPa and 4 MPa, when the lateral pressure σ2 = 6 MPa, the initial cracking of the precast cracks appears at the crack tip and the secondary cracks start in the opposite direction, as in crack No.1 and 2 in Figure 24a, which are in the anti-wing cracking direction. The initial cracking is at 30 MPa stress, which is about 48% of the peak strength. As the load continues to increase to the peak strength, cracks No. 1 and 2 continue to widen and new crack faces are created inside. After the upper and lower wing cracks penetrate the specimen, wing cracks No. 3 and 4 appear in Figure 24b. From the Figure 24c stress–strain curve, the appearance of cracks No. 3 and No. 4 leads to a significant stress retraction, and the residual stress is more obvious due to the presence of lateral pressure, but the specimen is completely destroyed at this time.
- (4)
- H = 0 mm, σ2 = 4 MPa
At this time, the lateral pressure σ2 = 4 MPa and the specimen contains only prefabricated single cracks, the crack extension evolution process and stress–strain curve obtained are shown in Figure 25. As shown in Figure 25a, the starting point of the secondary crack appears at the tip of the precast crack and the standard wing crack appears at the upper end, appearing and expanding at an angle of extension of 90°. For example, the No. 1 crack appears at 53% of the peak strength with a stress of about 35 MPa, and the No. 2 wing crack appears at 40 MPa; the No. 3 anti-wing crack appears at about 70% of the peak strength. Compared with no lateral pressure, the wing cracks appear later and have a larger crack initiation angle. There is no tendency of vertical bias in the direction of secondary wing crack expansion. This is similar to the results of biaxial compression tests on specimens with penetration holes, indicating that lateral stresses have an effect on the direction of crack extension.
- (5)
- H = 20 mm, σ2 = 4 MPa
When the depth of the hole H = 20 mm, under a lateral pressure of 4 MPa, the secondary crack propagation and stress–strain curve of the sample are shown in Figure 26. The wing cracks No. 1 and No. 2 at the upper and lower ends of the specimen appear at an extension angle of 90°, and there is no shift in the direction of the main stress during the extension. The presence of the holes causes the wing cracks to appear earlier, at about 34 MPa, which is at 54% of the peak stress. When the stress reaches 70% of the peak stress, the hole undergoes significant dislocation along the prefabricated crack, leading to the appearance of the No. 3 anti-wing crack, which extends vertically, as shown in Figure 26b. When the load exceeds 70% of the peak strength, the wing crack penetrates and widens significantly, and the No. 4 crack with vertical splitting appears at the side of the hole, and the specimen reaches the peak strength after the No. 4 crack appears. The stress–strain curve is shown in Figure 26c, and the specimen has a certain residual stress under the lateral pressure after the peak.
- (6)
- H = 40 mm, σ2 = 4 MPa
At H = 40 mm, the No. 1 wing crack appears first at 54% of the peak strength, as shown in Figure 27a. As the load increases, the width of the No. 1 crack increases and the No. 2 wing crack with a cracking angle of 90° appears at the lower end, when the load is about 60% of the peak stress. The wing cracks in the upper and lower of the specimen widen continuously under the axial load, causing obvious dislocation of the holes along the prefabricated cracks. And, the internal cracks gradually crack completely leading to the splitting of the specimen into two parts, as shown in Figure 27b. The stress–strain curve develops a clear plastic characteristic after the obvious widening of crack No. 1, with the continued widening of cracks No. 1 and No. 2, as shown in Figure 27c where the specimen reaches its peak after position 1+.
- (7)
- H = 60 mm, σ2 = 4 MPa
When H = 60 mm, the hole size exceeds 50% of the specimen, and at 50% of the peak strength, the first secondary crack appears as an anti-wing crack at the upper end, such as crack No. 1 in Figure 28a. The wing crack No. 2 appears at the lower end of the precast crack when the stress increases to 55% of the peak strength. As the load increases, the surface of the specimen falls off severely, and wing cracks are generated at the upper end of the prefabricated cracks. During the propagation process, the direction of propagation shifts towards the direction of the main stress, as shown in crack No.3 in the figure. The appearance of crack No. 3 leads to a significant fluctuation in stress, as shown in point 3 in Figure 28c. As the load approaches the peak stress, the holes are more misaligned along the precast cracks under the axial stress, producing shear cracks along the precast cracks, as shown in cracks 4 and 5 in Figure 28b.
- (8)
- H = 80 mm, σ2 = 4 MPa
When H = 80 mm, the hole is close to penetration, the stress–strain curve compression phase is also relatively long, and the specimen strength is low and close to that of the penetration specimen. The initial crack of the specimen is an anti-wing crack. Crack No. 1 in Figure 29a, which appears at the lower end point of the upper precast crack, has a strength of about 48.8% of the peak strength. At 55% of the peak strength, a No. 2 wing crack appears at the lower end of the prefabricated crack, with a 90° crack initiation angle. As shown in Figure 29b, the anti-wing crack gradually shifts to the axial stress direction with the expansion of the crack. And, as the load increases, the secondary crack gradually widens through the specimen, and the stress reaches the peak after penetration, and the specimen is divided into two parts by the prefabricated crack and the secondary crack, as shown in Figure 29c, and the stress decreases rapidly.
5. Discussion
The presence of cracks leads to stress concentration at the tip, which makes the initiation point of secondary cracks in the specimen appear at the prefabricated crack tip. The analysis is carried out for different types of crack extension damage of the specimen according to the final failure pattern of the specimen. When the lateral pressures of the specimens containing penetration cracks are σ2 = 2 MPa and 4 MPa, the secondary crack classification diagram is shown in Figure 30a. Due to the limitation of the lateral pressure, the expansion direction of secondary cracks is not shifted to the axial stress direction, and the crack expansion mode is mainly compound cracks. When the lateral pressures of the specimens containing penetration cracks are σ2 = 6 MPa, the crack extension pattern is shown in Figure 30b. The high lateral pressure increases the peak strength and leads to severe misalignment of the specimen holes along the prefabricated crack. The secondary cracks are not only compound cracks, but also coplanar shear cracks that crack along the direction of the prefabricated cracks.
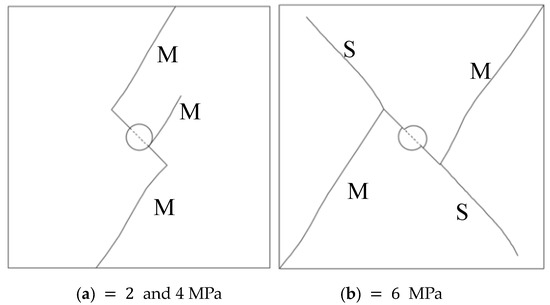
Figure 30.
Types of fracture propagation in specimens with penetrating hole-crack under different lateral stress (M—compound crack; S—shear crack).
At the lateral pressure σ2 = 4 MPa, specimens with different hole depths exhibit different cracking patterns. When the hole depth is H = 0 mm and 20 mm, it is a specimen with single crack or shallow hole, and the cracking pattern is shown in Figure 31a. The specimen exhibits a wing crack pattern of vertical prefabricated cracks, which is determined to be a composite crack. However, the anti-wing cracks that appear in the later stage are tensile cracks perpendicular to axial stress, and the final fracture mode is tensile composite fracture. At the hole depth H = 60 mm, the expansion pattern of the specimen is similar to that of the specimen with a penetration hole at a lateral pressure of σ2 = 6 MPa, and its main propagation mode is compound-shear fracture, as shown in Figure 31c. At the specimen hole depth H = 80 mm, the hole is close to penetration, which can be regarded as the hole that divides the prefabricated crack into upper and lower parts, resulting in wing cracks above and below the hole, respectively, and the fracture mode is compound fracture, as shown in Figure 31d.
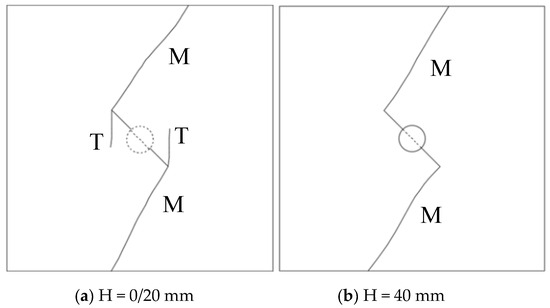
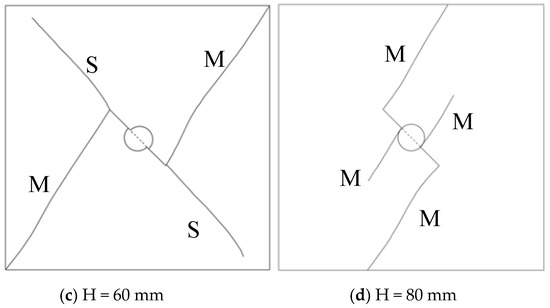
Figure 31.
Types of crack propagation in hole-crack specimens with different hole depths under lateral stress σ2 = 4 MPa (M—compound crack; S—shear crack; T—wing crack).
6. Conclusions
Selecting sandstone as the raw rock material, based on the principle of similarity, the optimal ratio is obtained through experiments, and a mortar rock-like material model with hole and cracks is produced. We conduct biaxial compression experiments on samples under different lateral pressures and hole depths to simulate the strength and deformation failure characteristics of sandstone surrounding rock tunnels during engineering excavation. The results achieved are as follows
(1) One type of rock mortar test material is prepared, and its main physical and mechanical parameters are all within the range of sandstone, which can effectively simulate the stress deformation characteristics of sandstone.
(2) When the depth of the hole in cracked rock-like material samples exceeds 50% of the length, the strength and deformation of the samples undergo a sudden change. Under the stable lateral pressure σ2 = 4 MPa, the peak strength decreases with the increase in hole depth, but the amplitude of the change is relatively gentle. The peak stress remains between 50 MPa–70 MPa, and for every 20 mm increase in hole depth, the peak stress decreases by about 3%. However, when the depth of the holes in the cracked specimen increases from 40 mm to 60 mm, the peak stress decreases significantly, with a decrease of about 10%. Moreover, the maximum values of strain value at peak strength and lateral strain both occur at a hole depth of 60 mm.
(3) When the cracked specimen contains through-holes, under lateral pressure σ2 = 2 MPa and 4 MPa, the propagation direction of secondary cracks does not turn towards the axial stress direction, and the crack propagation mode is mainly composite cracks. When the lateral pressure σ2 = 6 MPa, there are not only composite cracks, but also coplanar shear cracks that crack along the direction of the prefabricated crack.
(4) At the stable lateral pressure σ2 = 4 MPa, different hole depths exhibit different cracking patterns. When the hole depth is H = 0 mm and 20 mm, the fracture mode of the sample is tension composite fracture. When the depth of the hole H = 40 mm, the fracture mode is composite fracture. When the hole depth H = 60 mm, the sample exhibits shear composite fracture. When the depth of the hole H = 80 mm, the fracture mode is composite fracture.
Author Contributions
Methodology, Y.T.; Writing—original draft, X.L.; Supervision, B.H., K.S. and J.L. All authors have read and agreed to the published version of the manuscript.
Funding
This study was supported by the Zhejiang Province Water Resource Department Program (RC2105) of China, and the Zhejiang Province Education Department Program (Z20230040) of China.
Data Availability Statement
Demand data used to support the findings of this study are available from the first author upon request.
Conflicts of Interest
The authors declare that there are no conflict of interest regarding the publication of this paper.
References
- Wong, T.F. Micromechanics of faulting in Westerly granite. Int. J. Rock Mech. Min. Sci. Geomech. Abstr. 1982, 19, 49–64. [Google Scholar] [CrossRef]
- Wong, T.; Wong, R.; Jiao, M.R.; Chau, K.; Tang, C.A. Micromechanics and rock failure process analysis. Key Eng. Mater. 2004, 261–263, 39–44. [Google Scholar] [CrossRef]
- Cook, N.G.W. The failure of rock. Int. J. Rock Mech. Min. Sci. 1965, 21, 389–403. [Google Scholar] [CrossRef]
- Fairhurst, C.; Cook, N. The phenomenon of rock splitting parallel to the direction of maximum compression in the neighborhood of a surface. In Proceedings of the 1st Congress of the International Society of Rock Mechanics, Lisbon, Portugal, 25 September–1 October 1966; pp. 687–692. [Google Scholar]
- Hoek, E.; Bieniawski, Z.T. Brittle fracture propagation in rock under compression. Int. J. Fract. 1965, 1, 137–155. [Google Scholar] [CrossRef]
- Hoek, E.; Brown, E.T. Underground Excavations in Rock; Elserier Press: London, UK, 1980; pp. 105–106. [Google Scholar]
- Kemeny, J.; Cook, N. Effective moduli, non-linear deformation and strength of a cracked elastic solid. Int. J. Rock Mech. Min. Sci. Geomech. Abstr. 1986, 23, 107–118. [Google Scholar] [CrossRef]
- Kemeny, J.M.; Cook, N.G. Micromechanics of deformation in rocks. In Toughening Mechanisms in Quasi-Brittle Materials; Springer: Berlin/Heidelberg, Germany, 1991; pp. 155–188. [Google Scholar]
- Salamon, M. Elastic moduli of a stratified rock mass. Int. J. Rock Mech. Min. Sci. Geomech. Abstr. 1968, 5, 519–527. [Google Scholar] [CrossRef]
- Yang, S. Study of strength failure and crack coalescence behavior of sandstone containing three pre-existing fissures. Rock Soil Mech. 2013, 34, 31–39. [Google Scholar]
- Yang, S.; Dai, Y.; Han, L.; He, Y.; Li, Y. Uniaxial compression experimental research on deformation and failure properties of brittle marble specimen with pre-existing fissures. Chin. J. Rock Mech. Eng. 2009, 28, 2391–2404. [Google Scholar]
- Yang, S.; Huang, Y.; Liu, X. Particle flow analysis on tensile strength and crack coalescence behavior of brittle rock containing two pre-existing fissures. J. China Univ. Min. Technol. 2014, 43, 220–226. [Google Scholar]
- Du, M.; Jing, H.; Su, H. Effects of holes’ geometrical shape on strength and failure characteristics of a sandstone sample containing a single hole. Eng. Mech. 2016, 33, 190–196. [Google Scholar]
- Zhu, T.; Jing, H.; Su, H.; Yin, Q.; Du, M. Experimental investigation on mechanical behavior of sandstone with coupling effects under uniaxial compression. J. China Coal Soc. 2015, 40, 1518–1525. [Google Scholar]
- Zhu, T.; Jing, H.; Su, H.; Yin, Q.; Du, M. Mechanical behavior of sandstone containing double circular cavities under uniaxial compression. Chin. J. Geotech. Eng. 2015, 6, 1047–1056. [Google Scholar]
- Du, M.; Jing, H.; Su, H.; Zhu, T. Experimental study of strength and failure characteristics of sandstone containing prefabricated elliptical hole. J. China Univ. Min. Technol. 2016, 45, 1164–1171. [Google Scholar]
- Xiong, F.; Jing, H.; Zhu, T.; Su, H. Numerical Simulation of Shape Effect on Rock Containing a Single Pre-existing Hole. Coal Technol. 2016, 35, 112–115. [Google Scholar]
- Yang, S.Q.; Huang, Y.H.; Tian, W.L.; Zhu, J.B. An experimental investigation on strength, deformation and crack evolution behavior of sandstone containing two oval flaws under uniaxial compression. Eng. Geol. 2017, 217, 35–48. [Google Scholar] [CrossRef]
- Gratchev, I.; Kim, D.H.; Yeung, C.K. Strength of Rock-Like Specimens with Pre-existing Cracks of Different Length and Width. Rock Mech. Rock Eng. 2016, 49, 4491–4496. [Google Scholar] [CrossRef]
- Fakhimi, A.; Carvalho, F.; Ishida, T.; Labuz, J.F. Simulation of failure around a circular opening in rock. Int. J. Rock Mech. Min. Sci. 2002, 39, 507–515. [Google Scholar] [CrossRef]
- Jaeger, J.C.; Cook, N.G.W. Fundamentals of Rock Mechanics; Science Press: Beijing, China, 1981. [Google Scholar]
- Li, X. Experimental Simulation Technology of Rock Mechanics; Science Press: Beijing, China, 2007. [Google Scholar]
- Kou, Z. Study on the Influence of Prefabricated Cracks on the Mechanical Properties of Red Sandstone. Ph.D. Thesis, Shijiazhuang Tiedao University, Shijiazhuang, China, 2021. [Google Scholar]
Disclaimer/Publisher’s Note: The statements, opinions and data contained in all publications are solely those of the individual author(s) and contributor(s) and not of MDPI and/or the editor(s). MDPI and/or the editor(s) disclaim responsibility for any injury to people or property resulting from any ideas, methods, instructions or products referred to in the content. |
© 2023 by the authors. Licensee MDPI, Basel, Switzerland. This article is an open access article distributed under the terms and conditions of the Creative Commons Attribution (CC BY) license (https://creativecommons.org/licenses/by/4.0/).