Abstract
Original fracture structures always present discontinuity in the real rock mass, and many invisible fractures hide inside the rock mass, which may cause serious engineering safety issues. To mimic the true 3D fracture structures through the experimental method, the gypsum rock-like samples containing both 2D through-type and 3D internal-type preset flaws are prepared, and multiple sets of inclination angles of the twin parallel flaws are set in the test. By applying the AE and DIC monitoring technologies during the uniaxial compression tests, the main results are as follows: (1) The flaw inclination angle presents a direct influence on the surface cracks distribution, maximum principal strain field, and the density of secondary failure in the middle rock; (2) AE events initially distribute around the internal 3D preset flaw, while the gradient inclination angle shows a slight impact on the events’ location before reaching the UCS status of samples; (3) mutations in b-values and S values can serve as evidence for predicting local damage, and the final failures quickly form at various scales and energy levels; (4) when the statistical analysis grid is divided sufficiently, the data window width and moving step length have little impact on the evaluation results, while the recommended bin width of event magnitude is 0.5 or 1.0.
1. Introduction
Original fractured structures (including flaws, joints, cracks, and faults) distributed in rock mass commonly led to severe damage in mining engineering, civil engineering, the construction of hydropower stations, and other underground artificial structures. It is thus important to study the failure characteristics and the corresponding mechanisms of fractured rock to ensure the safety of underground constructions. Many studies have focused on various types of fracture conditions of rock mass, which simulate the conditions including single flaw (hole) [1,2,3,4,5,6,7], double parallel/nonparallel flaws (elliptical holes) [8,9,10,11], and non-persistent flaws [12,13,14].
Gerolymatou and Traiantafyllidis [15] carried out the shear tests on a series of gypsum specimens with intermittent joints. The experimental results have been simulated and reduced by the hypothesis of averaged cohesion and the theory of fracture mechanics, and the latter is more suitable for the situation of crack interaction. Taking the joint’s mechanical and geometrical parameters into account, Jiang et al. [16] proposed a method for estimating the spatial anisotropy deformation of a jointed rock mass based on the joint deformation tensor method combined with the elastic anisotropy index. The effectiveness of the proposed method has been tested and verified by numerical modelling and in situ triaxial compressive experiments. Cao et al. [17] examined the peak uniaxial compressive strength (UCS) and failure patterns of ubiquitous joint rock-like specimens by similar material testing and PFC 2D numerical simulation. The results showed that the failure patterns of specimens can be classified into four types: stepped path failure, planar failure, shear-I failure, and shear-II failure. Yang et al. [18] conducted the uniaxial compression test to investigate the interaction of parallel joints and its influence on the mechanical behavior of jointed rock mass models; subsequently, four basic failure modes have been identified. Liu et al. [19] have investigated the fatigue mechanical properties of synthetic jointed rock models under various cyclic conditions, namely, four loading frequencies, four maximum stresses, and four amplitudes. The experimental results have revealed that three different crack coalescence patterns are identified between two adjacent joints. Lin et al. [20,21] tested and analyzed the effect of joint inclination and joint spacing on the strength behavior of the rock mass with double holes specimen under compression–shear loading based on DIC and DEM modelling. Four typical failure modes and five types of crack coalescence surrounding the holes and adjacent joints have been found.
Digital image correlation (DIC) technology is widely applied to monitor the development of the deformation field and visible secondary crack shown on the sample surface. Xing et al. [22,23] have conducted a series of dynamic tests on sandstones using a split Hopkinson pressure bar (SHPB), and the high-speed three-dimensional digital image correlation (3D-DIC) method is used to characterize the evolution of strain field of rock materials. Liu et al. [24] have examined the failure mechanism of filling samples by the split Hopkinson pressure bar tests combined with the high-speed DIC method. Fakhimi et al. [25] have conducted physical experiments on specimens and used DIC to obtain the displacement patterns as the fracture evolved, which aimed at investigating the rock fracture and the induced displacement field. In addition, application of the both DIC and acoustic emission (AE) technology helps to detect the full scales of secondary failures during the rock mechanism tests. Miao et al. [26] have proposed a novel DIC-based method for the quantitative identification of the crack path and fracture mechanism of the initiated cracks in rock. The proposed method has revealed that the crack evolution of flawed marble specimens is closely related to infilling conditions. Zhang and Zhou [27,28] applied the DIC and AE methods to study the deformation and failure characteristics of flawed rocks, and the FPZ (fracture process zone) was proposed to explain the failure mechanism of rock samples. Zhao et al. [29,30] utilized the DIC and AE systems for monitoring the developments of external and internal secondary failures caused by the true 3D internal-type preset flaws, which proved that the internal 3D preset flaw presents a slight influence on the deformation and visible cracks shown on the sample surface. Similar works finished by Lei et al. [31,32], Huang et al. [33], and Zhang et al. [34] studied influences of the filling condition of the preset flaws, the dissimilar layer of a rock sample, and flaw inclination angle, respectively.
In this study, the brittle rock samples containing parallel twin flaws (both 2D through type and 3D internal type) were prepared for the uniaxial compression test; the DIC and AE monitoring units were used to capture the surface and internal secondary failures during the test. Data of the strain field, surface secondary crack, AE rate, cumulative AE number, AE event location, and AE magnitude (based on post-processing of signal’s magnitude and energy) were gathered to analyze the failure characteristics of the sample, calculate the severity of failure behaviors, and detect the relationship between surface and internal damages.
2. Laboratory Tests
2.1. Test Design
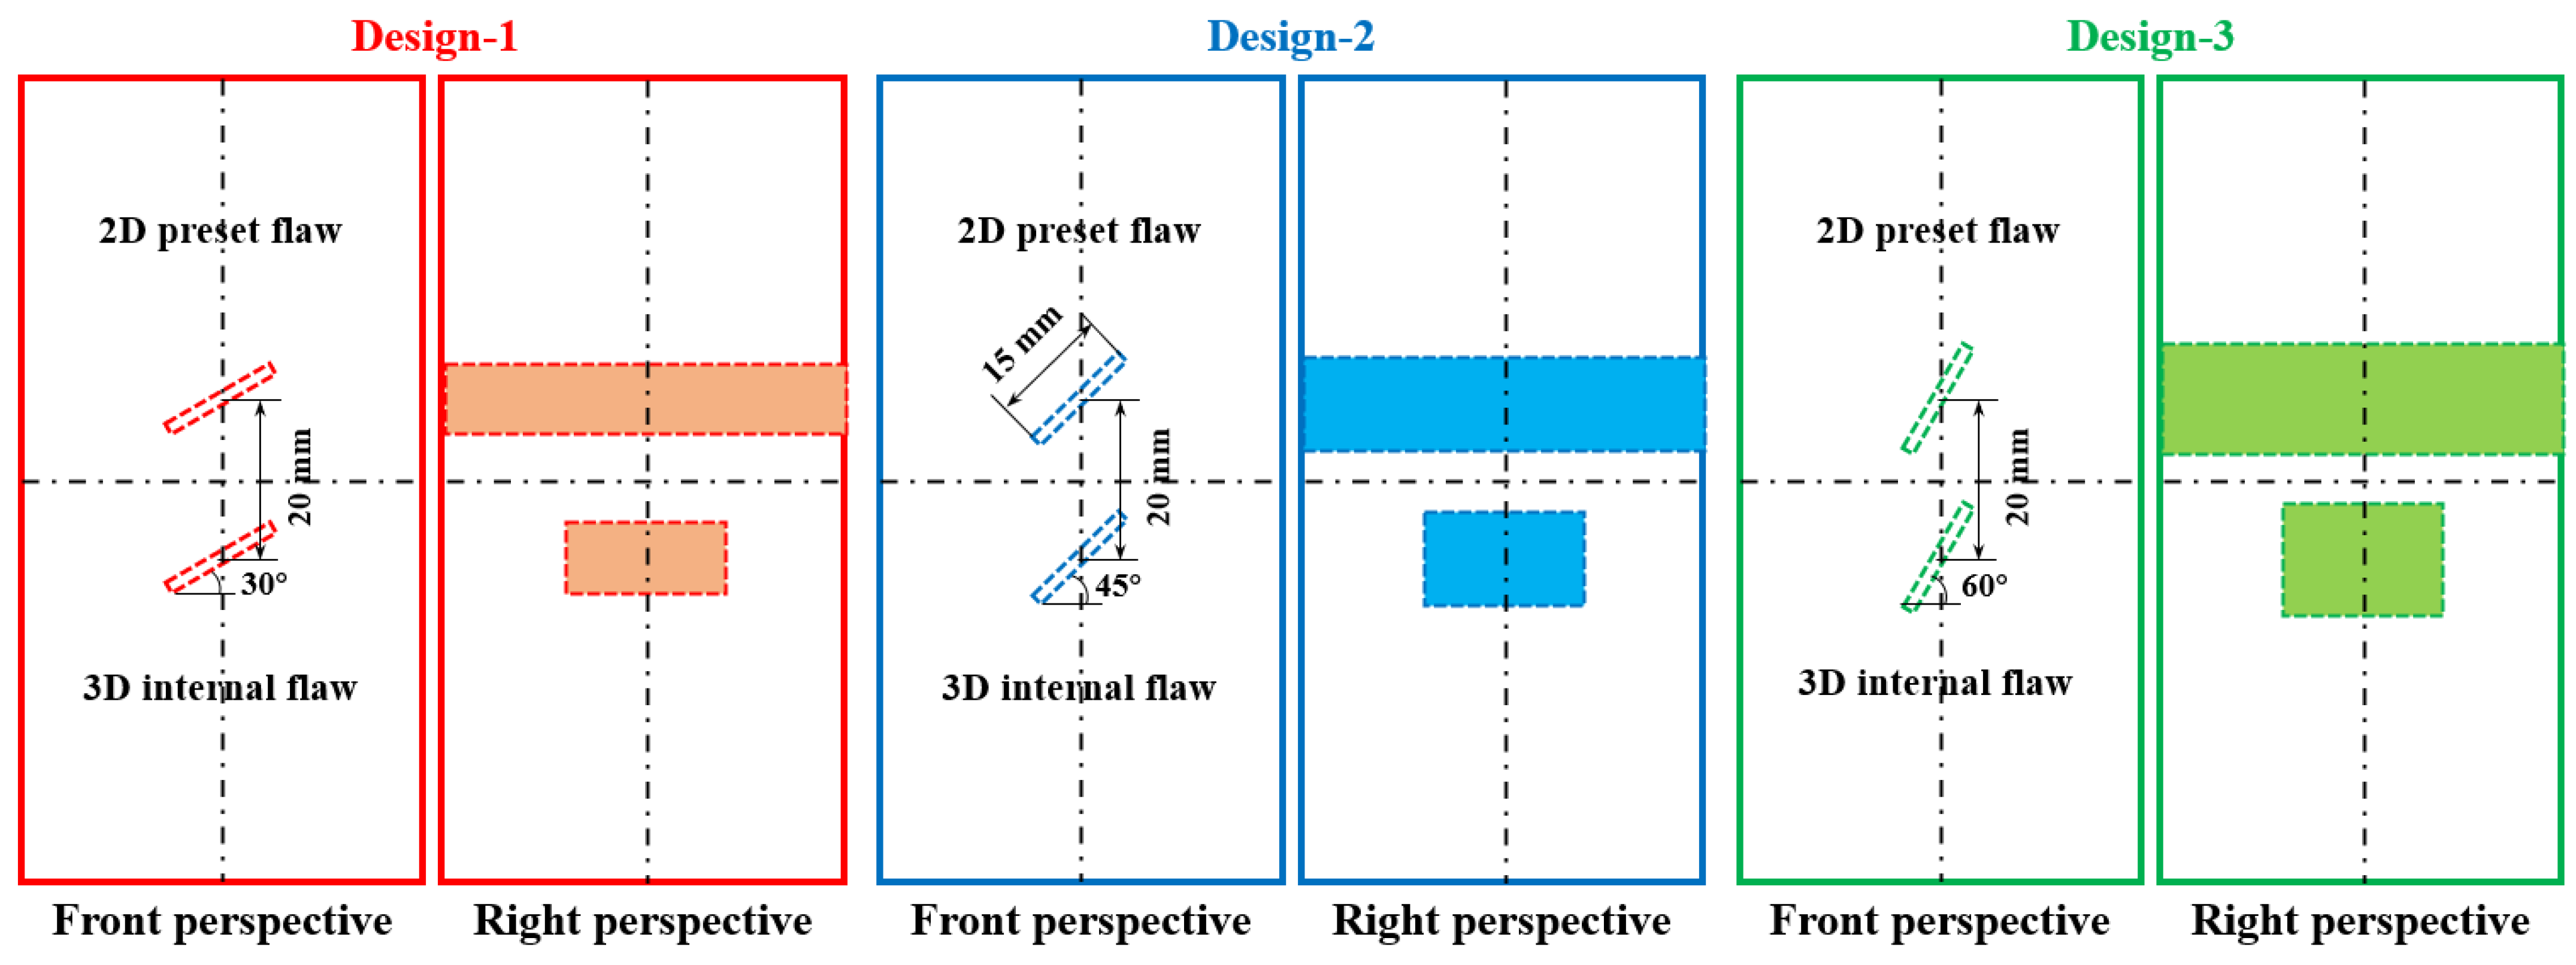
Based on the previous similar results conducted by Zhao et al. [29], a brittle gypsum specimen was selected to prepare the fractured rock-like sample, and the related physical and mechanical properties of the gypsum rock-like specimen are detailed in reference [29]. Table 1 presents the main properties of the rock-like sample. Figure 1 shows the design of the sample and parallel flaws (the length, width, and height of cuboid specimens are 50 mm, 50 mm, and 100 mm, respectively); in addition to the previous work (for samples with blue marks in Figure 1, the flaw inclination angle is 45°), two groups of samples with inclination angles of 30° and 60° are involved in this study; as the inclination angle increases, the length of rock bridge and the size of middle rock between twin flaws shrink gradually, which may influence the initiation, development, and final distribution of the secondary failures.

Table 1.
Main parameters of the gypsum rock-like specimen.
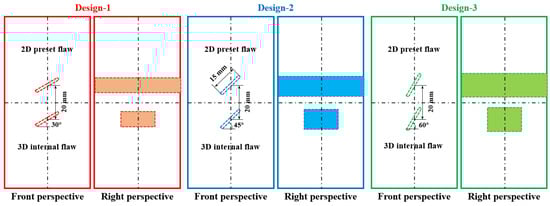
Figure 1.
Design of the specimen containing 2D and 3D preset fractures.
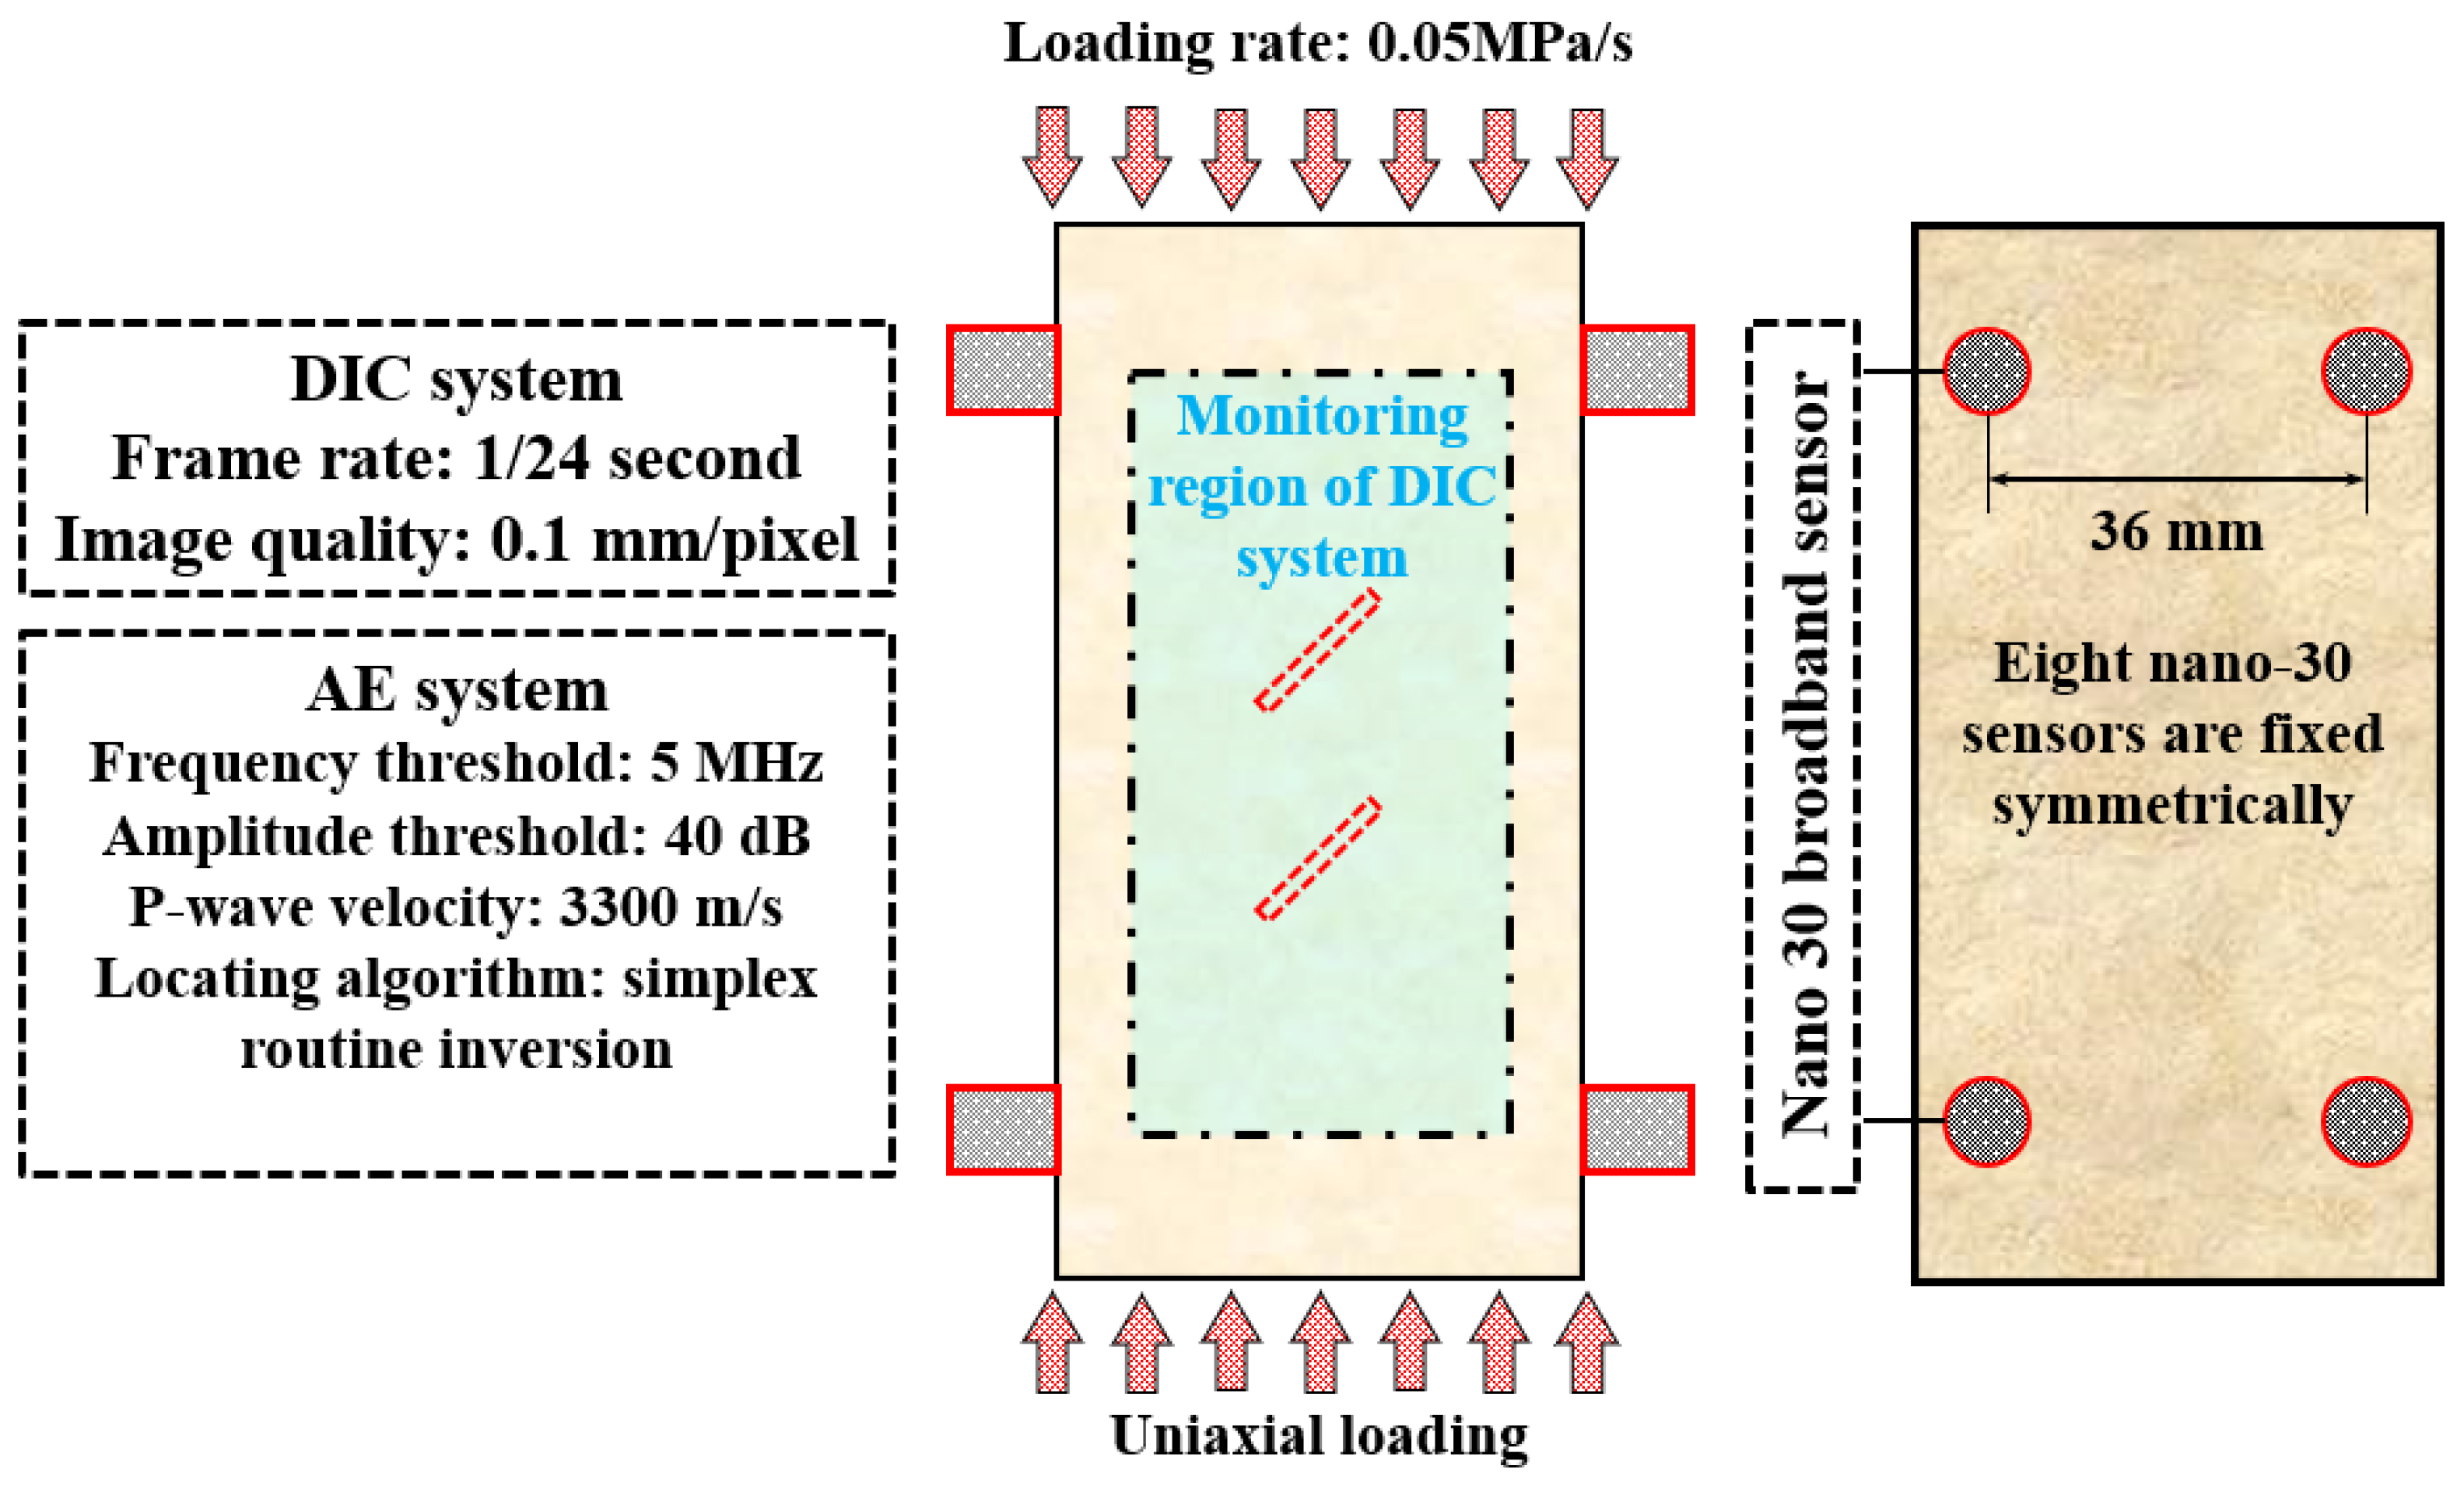
The uniaxial compression test was finished with a loading rate of 0.05 MPa/s, and the schematic diagram of the test and monitoring system is shown in Figure 2. The InSite-Lab AE monitoring system is produced by ITASCA Ltd. (US Minneapolis); eight Nano-30 sensors (resonant frequency is 300 kHz, and the monitoring frequency range is 125–750 kHz) are symmetrically positioned on both sides of the sample. The P-wave velocity in this type of rock-like specimen was 3300 m/s, and the event location is calculated by the Simplex Algorithm method; the detailed settings are introduced in reference [35]. The vic-2D software is applied for carrying out the DIC post-processing, and the original frames are captured by the Canon EOS camera. Previous similar studies proved that the maximum principal strain field obtained by the DIC technology can help to identify the final distribution of secondary cracks (accompanied by the relatively large maximum principal strain, abbreviated as the LMPS regions).
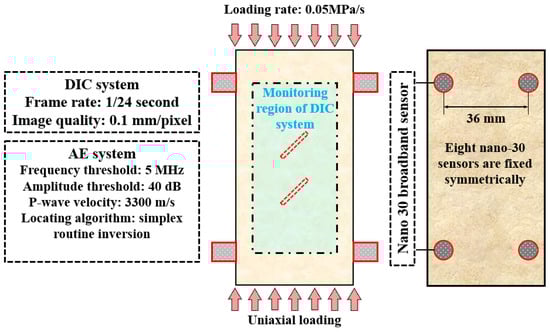
Figure 2.
Design of the uniaxial compression test and the monitoring systems.
2.2. Mechanical–Acoustic–Optical Results
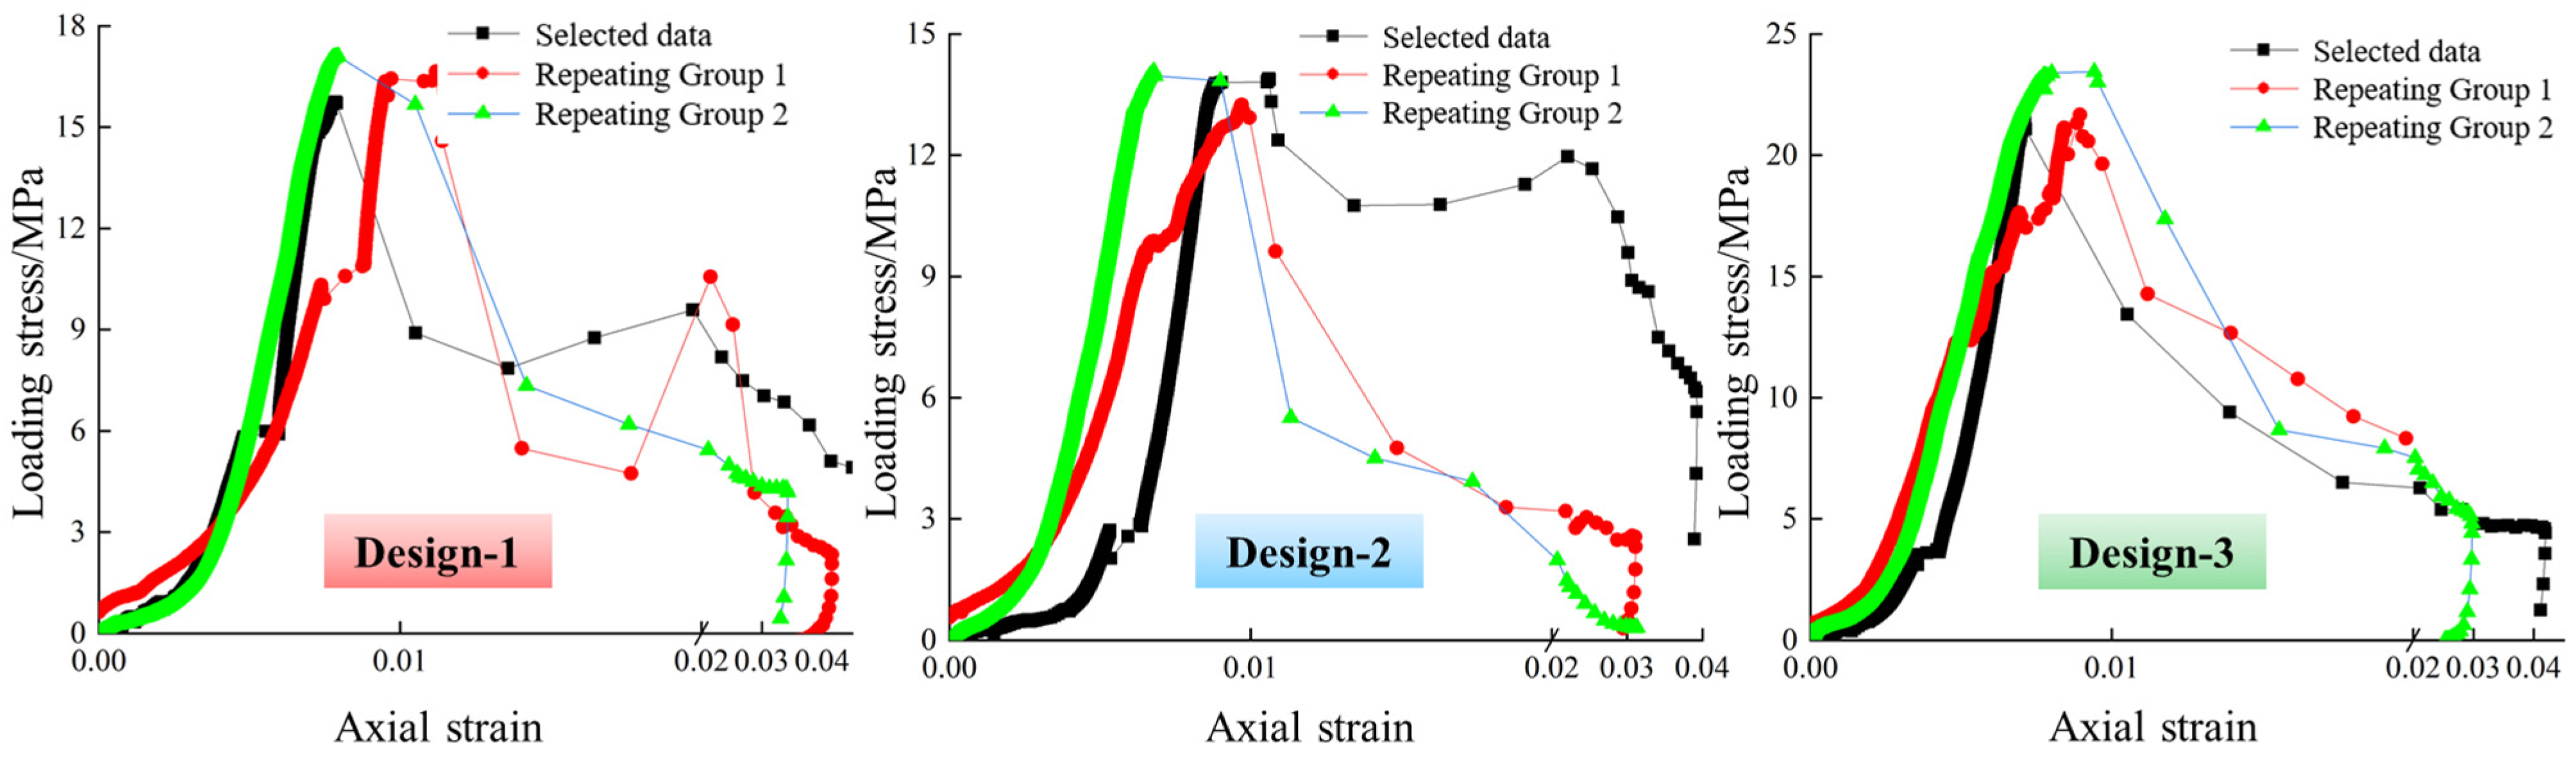
The stress–strain relationships of all rock-like samples are shown in Figure 3, and the results in each group show good consistency in sample strength and curve slope; the maximum and minimum average UCS values occur in Design-3 and Design-2, respectively. When the samples reach the UCS status, the corresponding axial strains are commonly lower than 0.01.
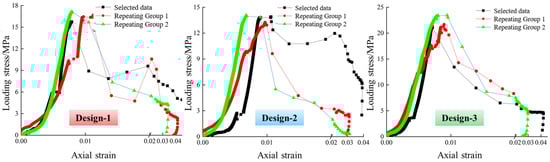
Figure 3.
Strain–stress relationships of all groups of samples.
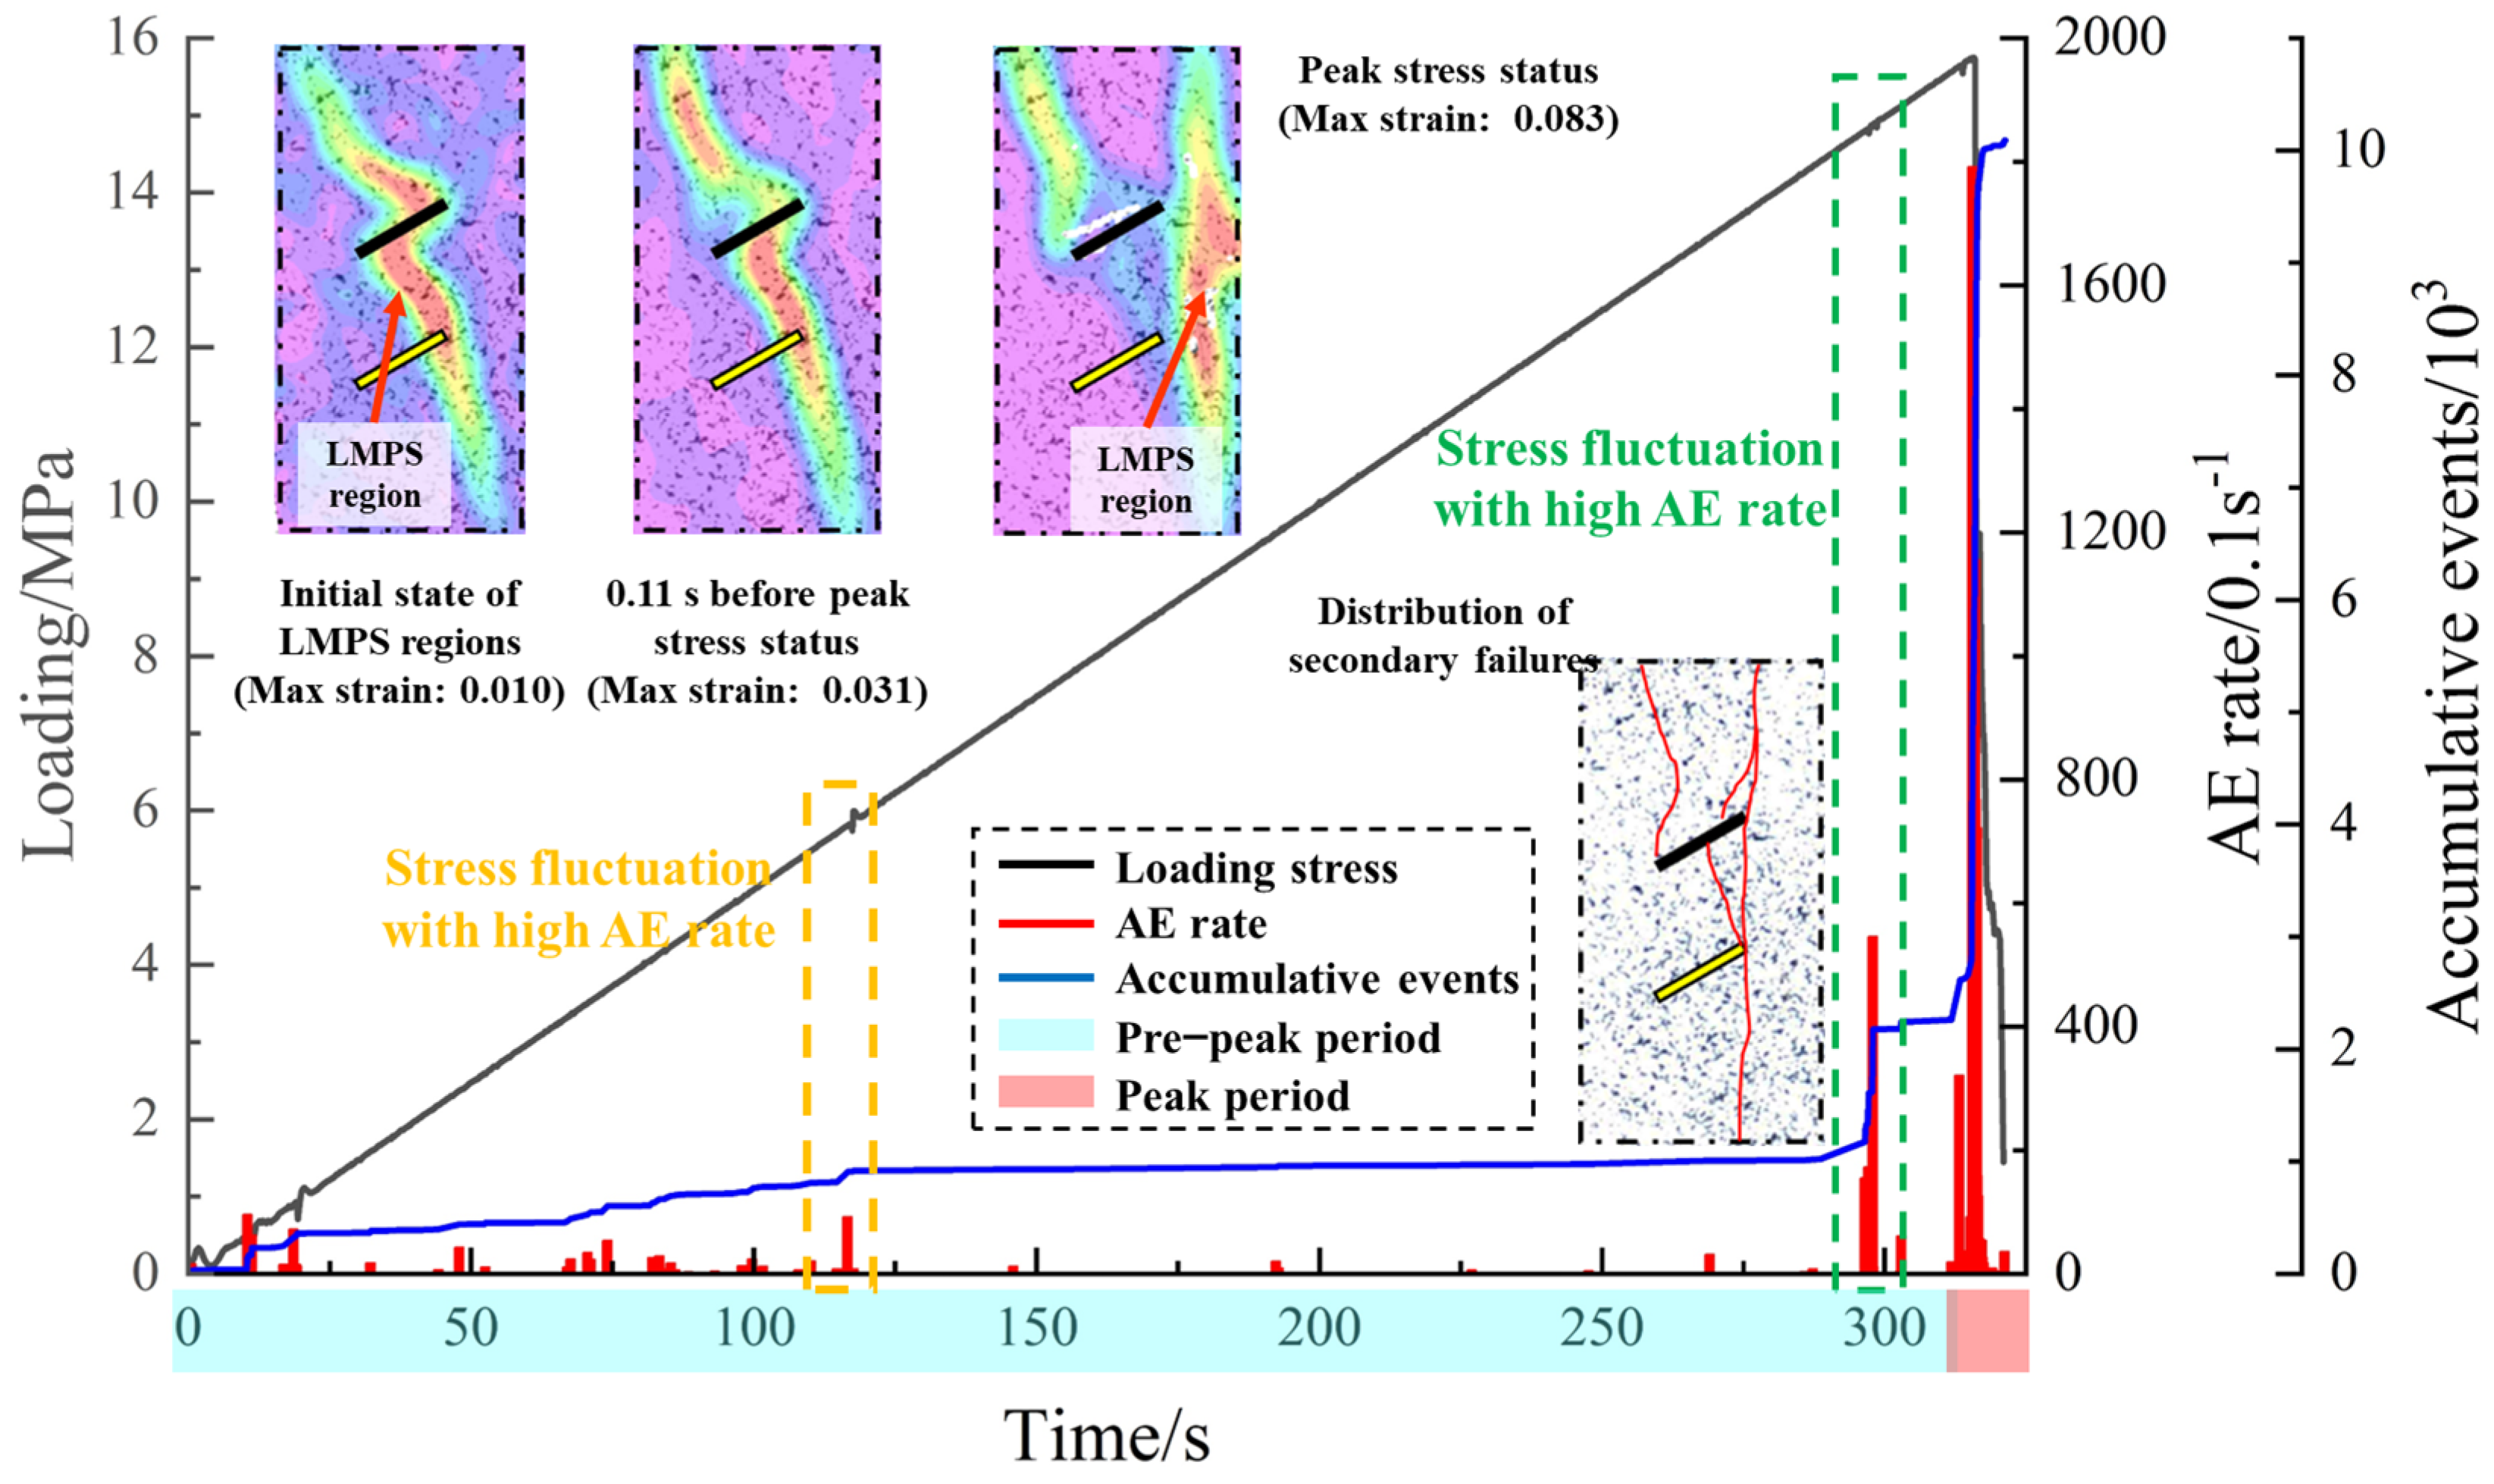
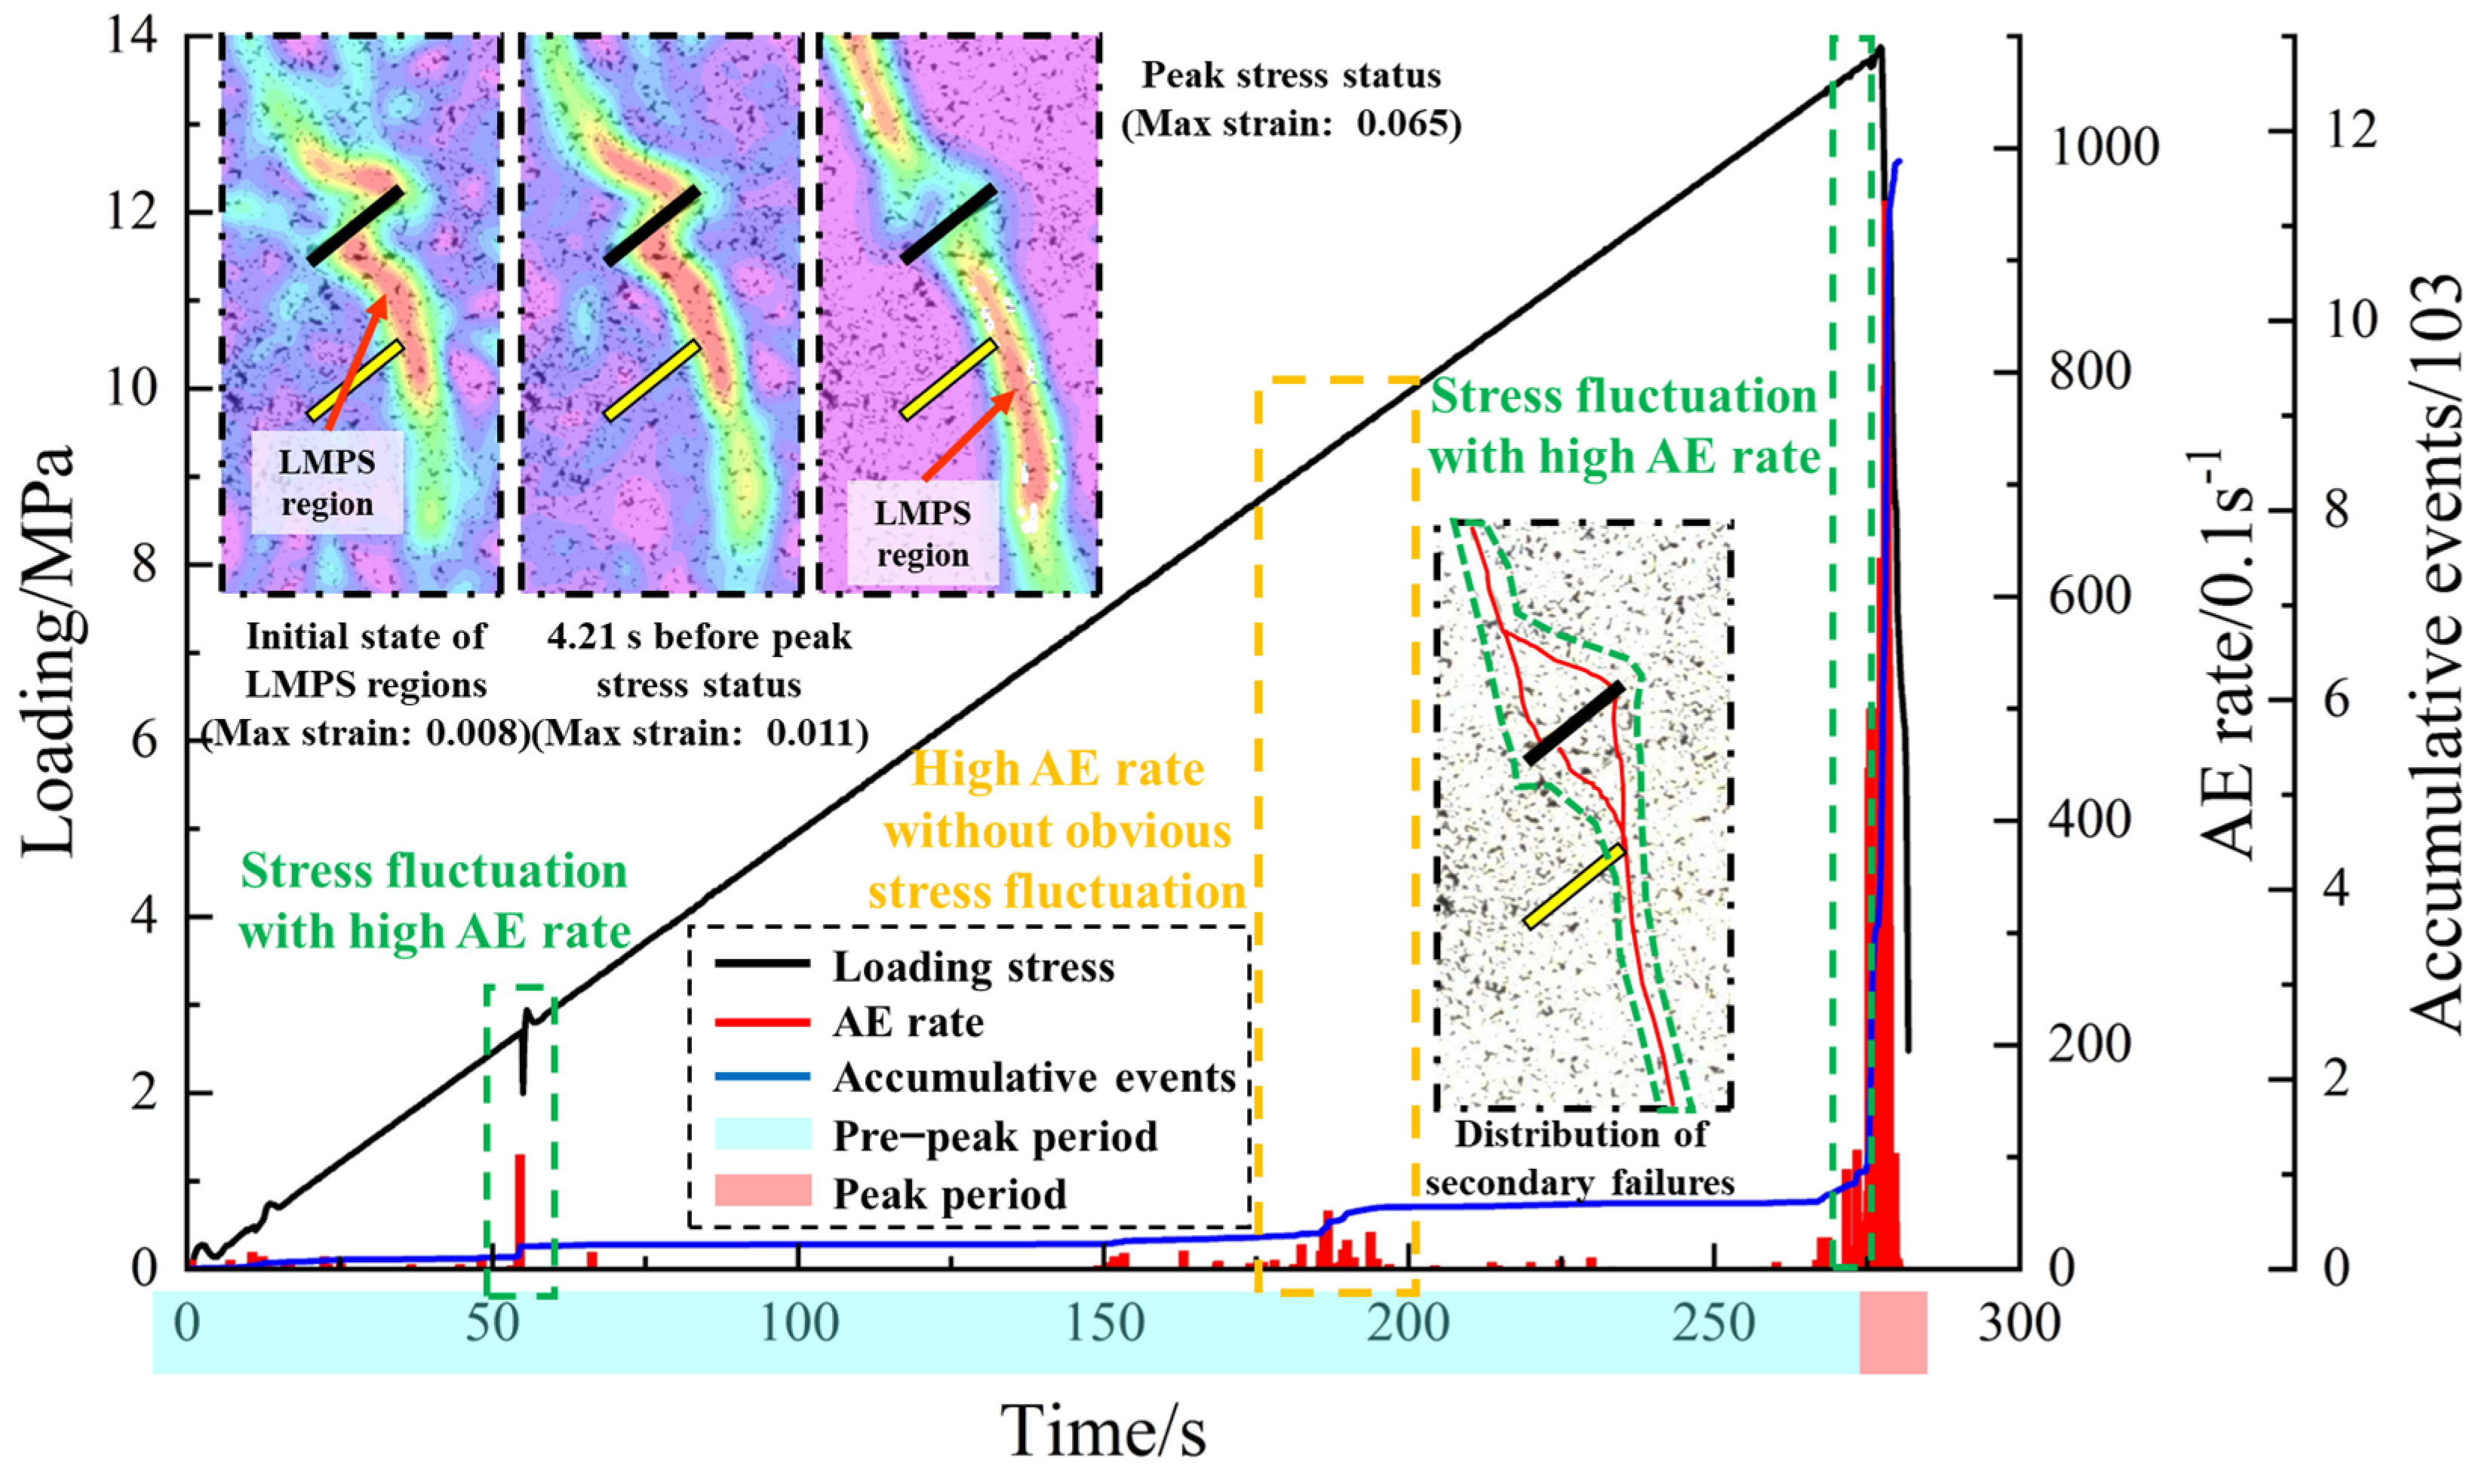
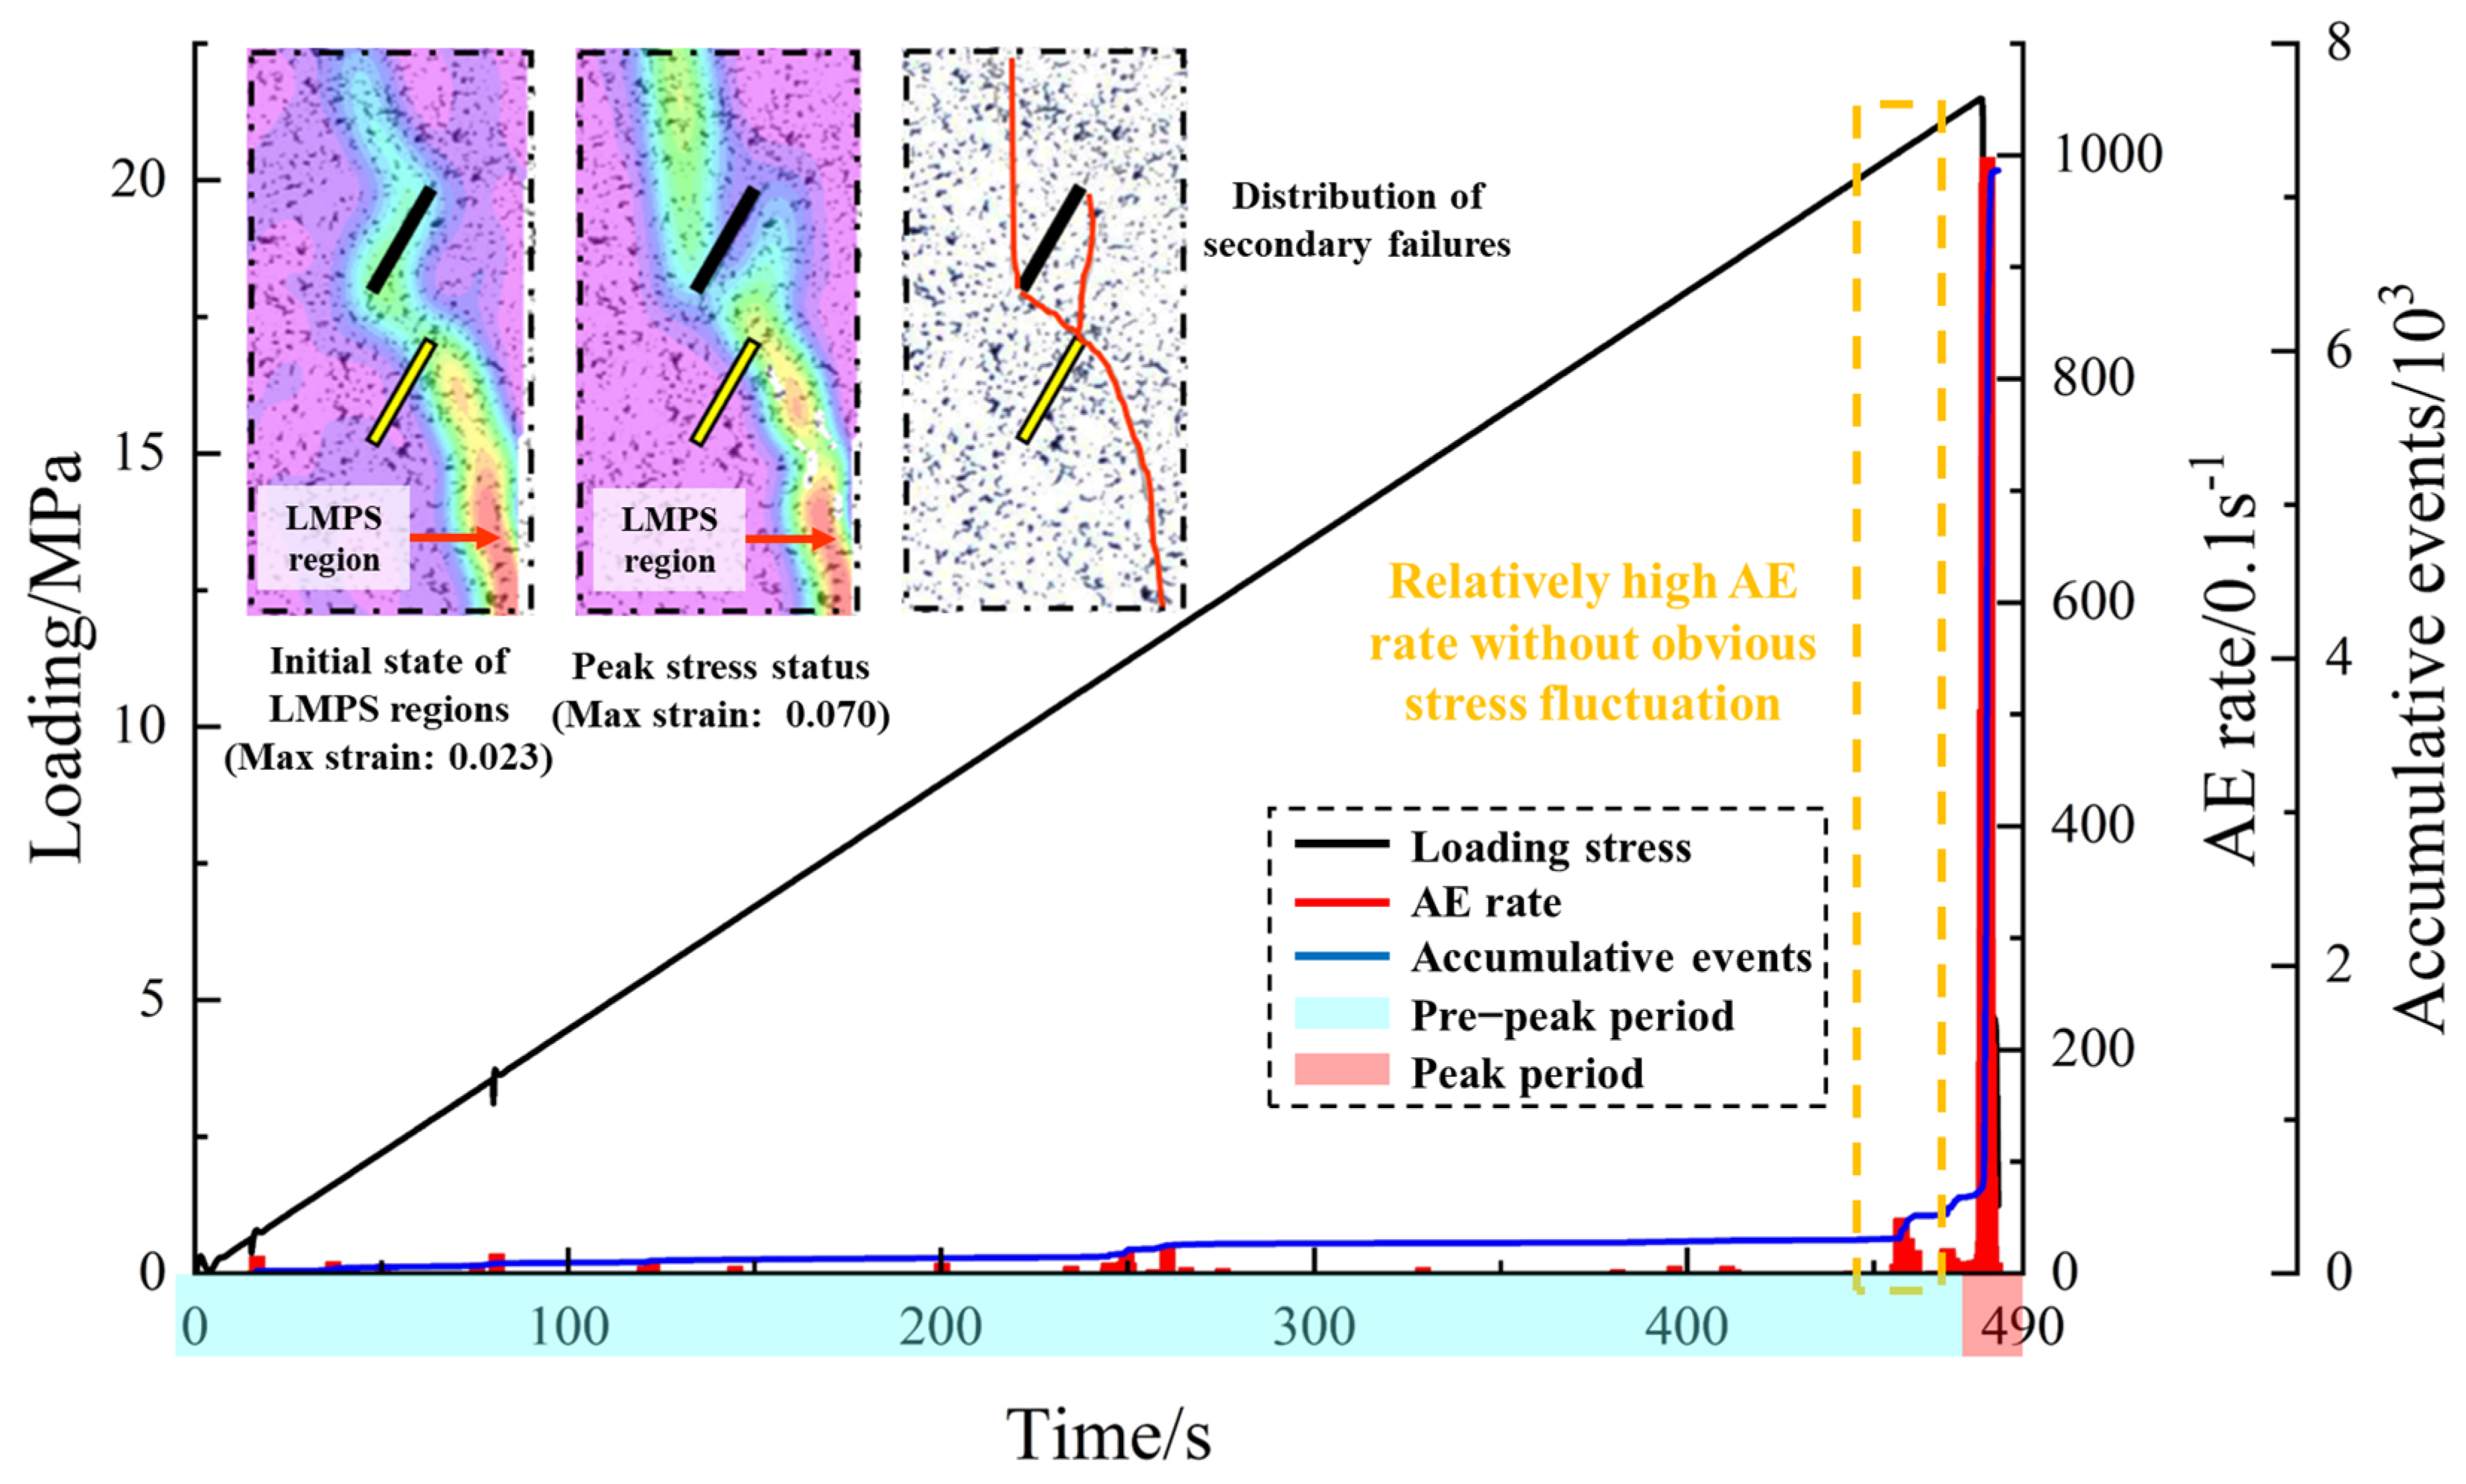
The mechanical–acoustic–optical results captured in three groups of samples (the intermediate value is selected in each group) are shown in Figure 4, Figure 5 and Figure 6; the maximum UCS belongs to the Design-3 sample (21.49 MPa), and the minimum UCS appears in the Design-2 sample (13.87 MPa).
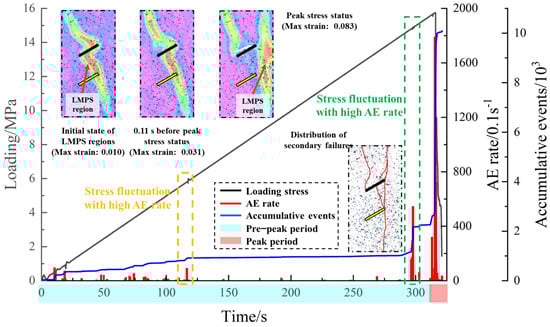
Figure 4.
Test results of samples with fracture inclination of 30°.

Figure 5.
Test results of samples with fracture inclination of 45° (modified from the reference).

Figure 6.
Test results of samples with fracture inclination of 60°.
The majority of AE events densely appear neighboring to the UCS status, and the corresponding peak AE rate is over 950 events/0.1 s; as the flaw inclination angle increases, the proportion of accumulative AE events during the UCS period gradually decreases, weakening the severity of the final destruction. Several local failures (illustrated as high AE rates) appear before the final destruction in the Design-1 and Design-2 samples, and the occurrence of local failure may not necessarily be accompanied by fluctuations in the stress curves.
The maximum principal strain fields obtained from all samples indicate that the LMPS regions initiate from the tips of the 2D preset flaws, show a typical S-shaped distribution, and contact with the right-top corner of the 3D internal flaws. In addition, when the loadings approach the UCS status, the upper part of LMPS regions (above the 2D flaw) extends to the left corner of the 2D flaws (in all samples), and the lower part of LMPS regions remains in a stable distribution.
As the flaw inclination angle increases, the final surface cracks continuously connect the right tips of the twin flaws, and the cracks start from the left tip of the 2D flaw and stably extend upwards; cracks initiate from the middle point of the 2D preset flaw (Design-1 and 2 samples) and develop downwards and finally connect to the right tip of the 3D flaw; all cracks in the Design-3 sample only start from the flaw tips.
Accordingly, the above results prove that changes in the inclination angle of preset twin flaws will gradually change the intensity of the final failure of the sample, surface strain field, and distribution characteristics of secondary cracks. Moreover, the internal 3D flaws show little influence on the distributions of the surface strain fields and cracks, which are mainly controlled by the 2D preset flaws.
2.3. AE Event Locating Results
The InSite-Lab AE monitoring system can output the event location data based on the built-in simplex routine inversion algorithm. AE events shown in Figure 7 are marked by red balls with various diameters (controlled by the location magnitude of the signal). AE events before the final destruction (near the UCS status) densely gather around the internal 3D flaw. Events in the Desgin-1 and 2 samples mainly distribute in the middle rock of twin flaws, while events in the Design-3 sample appear on both sides of the internal 3D flaw. During the peak stress periods of the tests, many events occur in the middle rock of twin flaws in the Design-1 and 2 samples, which indicates that dense secondary failures appear in these regions; AE events still clustered around the internal 3D flaw in the Design-3 sample, and the AE event density and average intensity in the lower part of the sample are greater than those in the upper part.
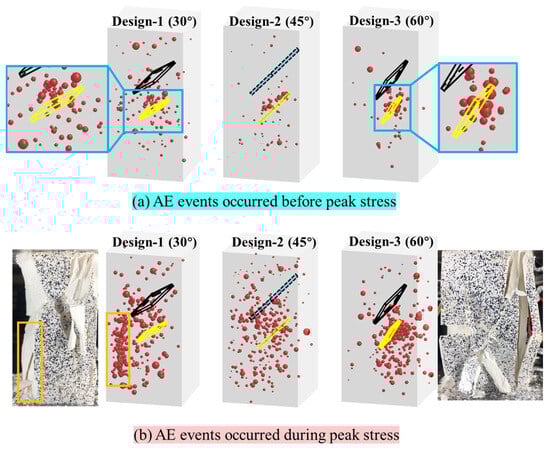
Figure 7.
AE events locating results of all samples: (a) AE events occurred before peak stress and (b) AE events occurred during peak stress.
Therefore, the gradient inclination angle of preset twin flaws shows a slight influence on the distribution of AE events before the peak stress period, while the destructiveness of the middle rock between the parallel flaws declines gradually as the flaw inclination angle increases.
3. Discussions
3.1. Estimations of Failure Size
The b-value is statistical data for quantifying the crack behavior and failure severity and reflecting the development trend of cracks at different scales [36]. The concept of parameter b originated from earthquake research is first proposed by Guternberg and Richter [37], which describes the size distribution scaling and is often referred to as the b-value. As a technical parameter within AE, the b-value can reflect the changes in the scale of microcracks within rock mass, and its sudden change can also serve as a precursor to the macroscopic failure of rock mass [38,39,40,41]. Based on the discussions of the effect of both size distribution and attenuation on the b-value, Liu et al. [42] have proposed a new method to estimate the b-value for rock AE testing and its application confirms that the b-value depends on material heterogeneity and stress. Rahul et al. [43] have made an effort to rectify the inherent shortcomings of the b-value estimation method, which has been verified to be lightly implemented and better improved by some experimental datasets.
The corresponding calculation formula is as follows:
where b is a physical quantity that characterizes the level of acoustic emission activity; A is the signal amplitude (dB); N is the statistical cumulative frequency of acoustic emissions at magnitude intervals; a is an empirical constant.
lg N = a − b (A/20)
3.2. Estimations of Failure Size
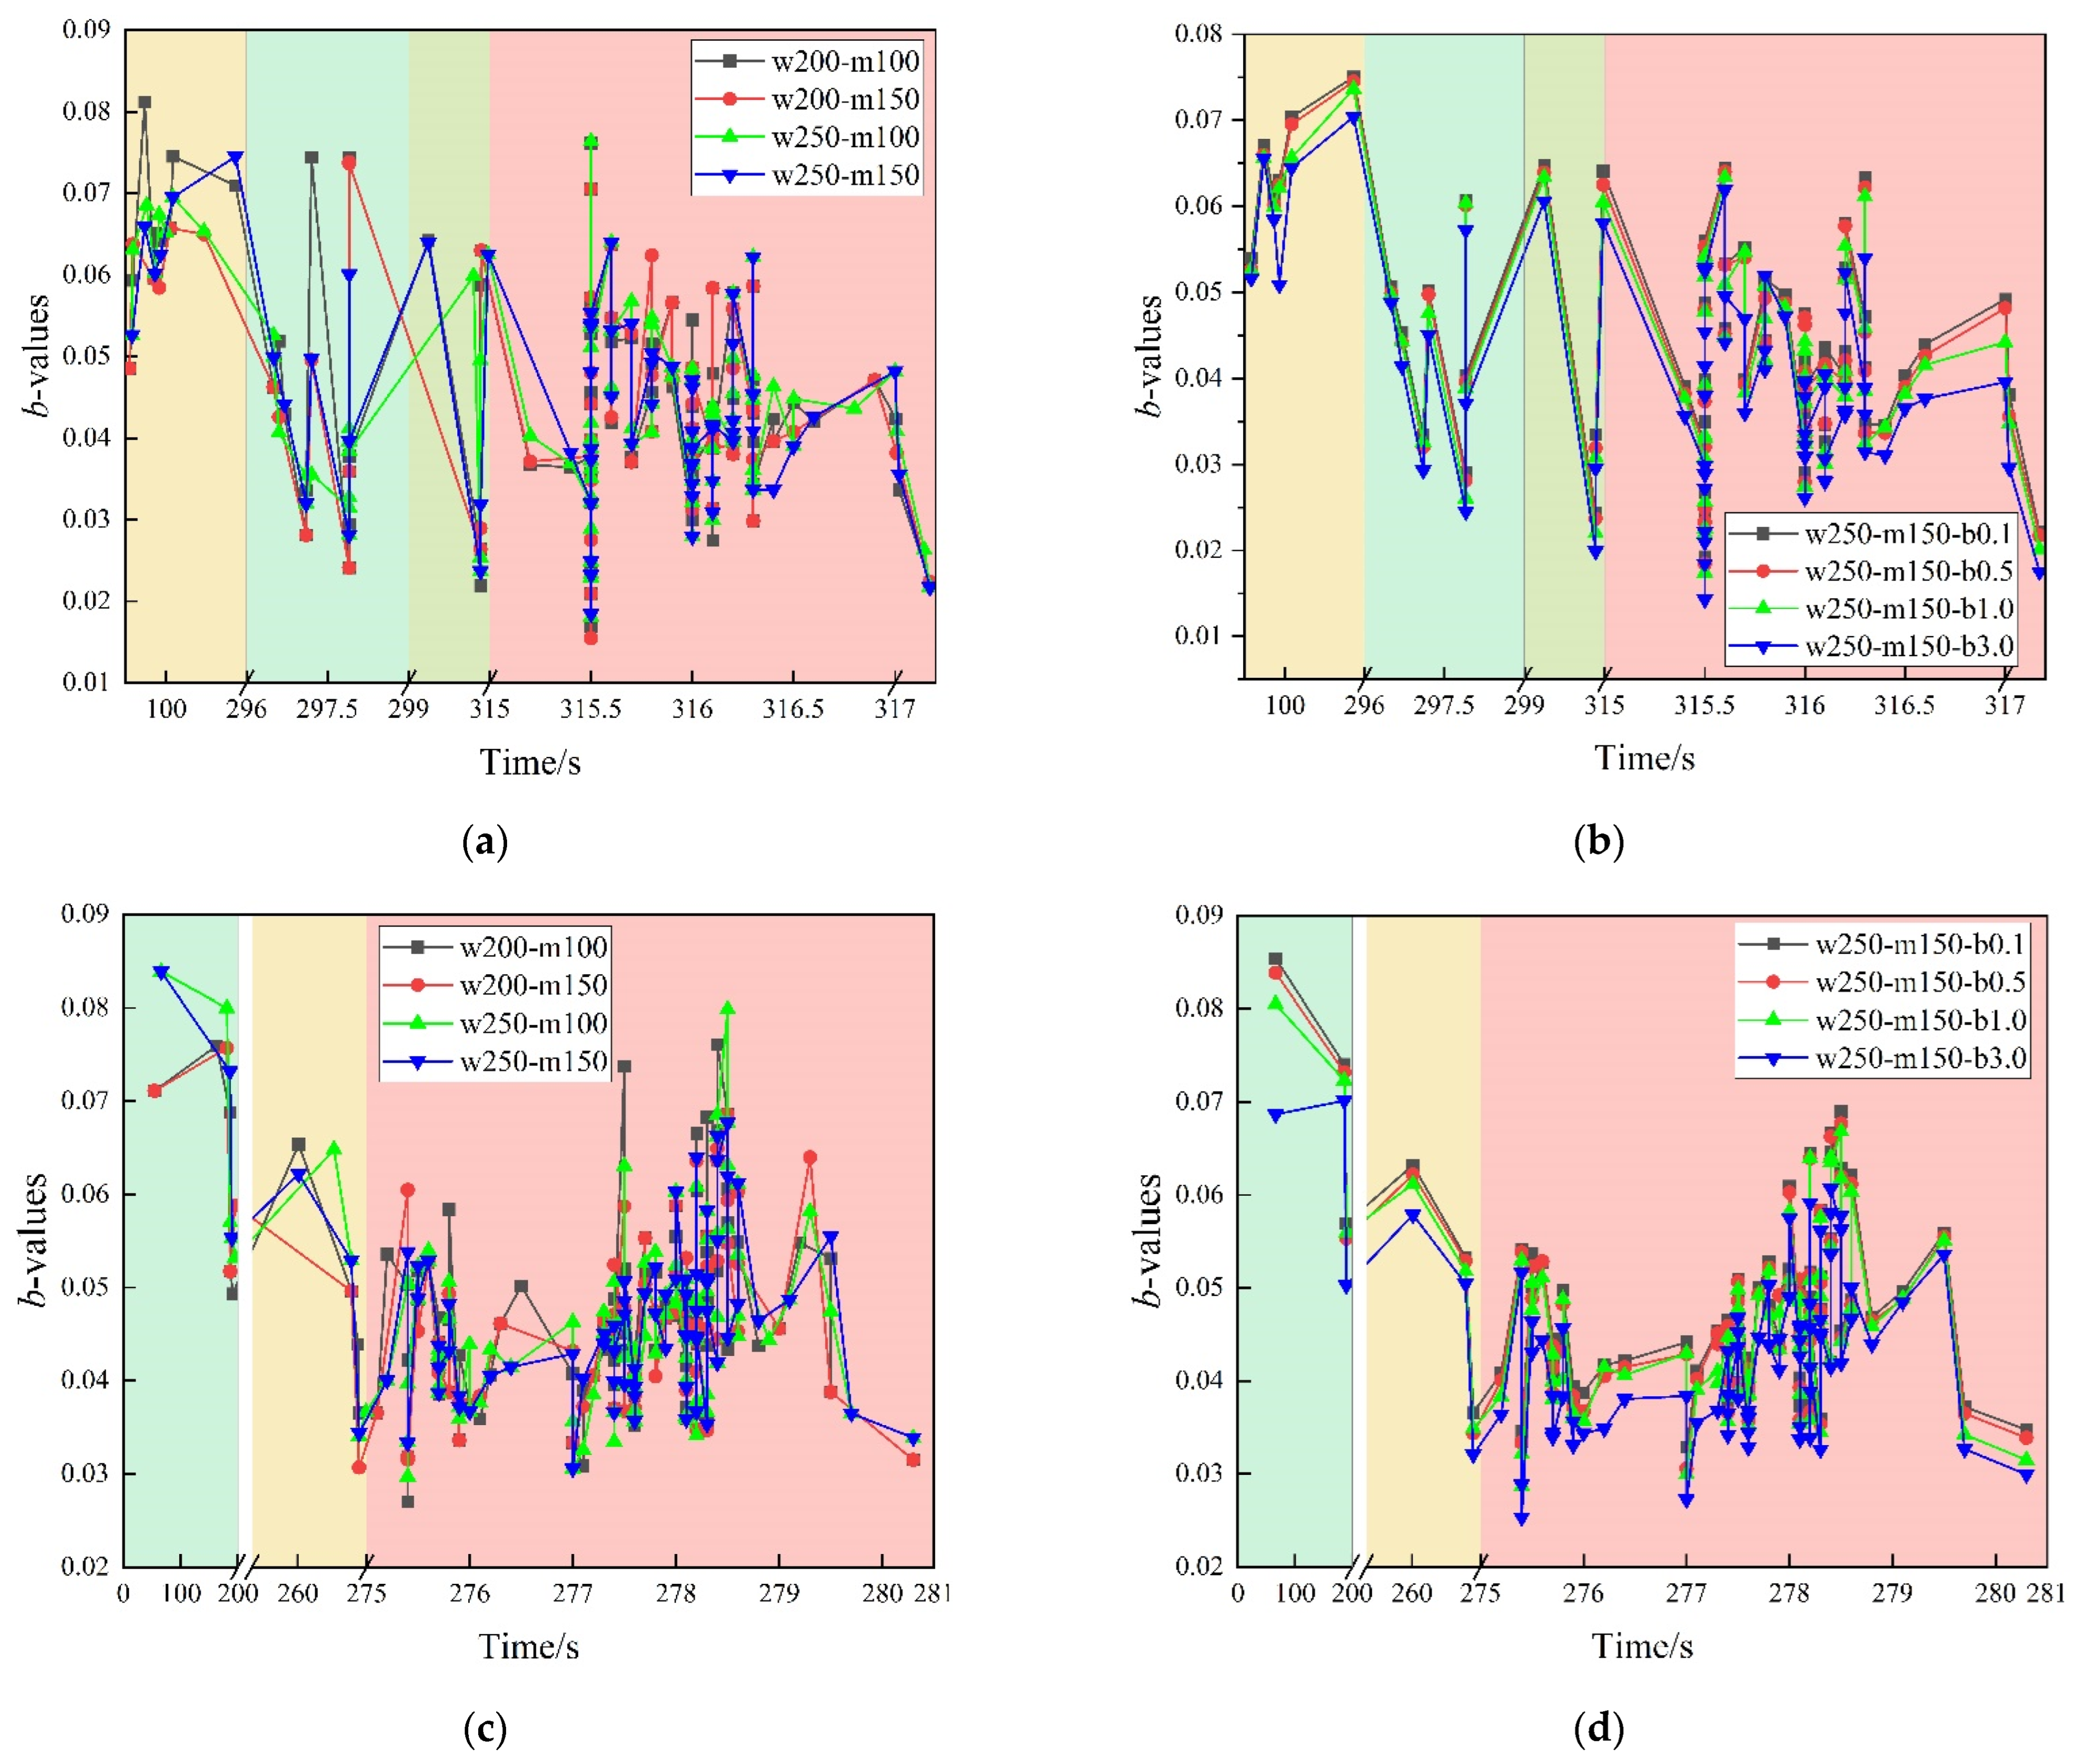
Because the b-value is derived from statistical analysis (only related to AE event time and magnitude), the data window width (abbreviated as “w” in the following figures), moving step length (abbreviated as “m” in the following figures), and bin width of magnitude (abbreviated as “b” in the following figures) are thus important factors influencing the speed and accuracy of calculations. Based on the previous works [42], the suggested minimum AE event number for severity estimation is 200; we thus set the data window width to 200 and 250 and set the moving step length to 100 and 150.
Figure 8a,c,e show the estimation results of three types of samples via different w and m values. The first finding is that the curves with the same data window width present similar changing times, trends, and ranges before the largest macroscope destructions (earth tones and blue-green background colors). In addition, four groups of curves show the almost same changing characteristics during and after the largest macroscope destructions (pink background). Therefore, when microscopic and macroscopic damage develops rapidly in the samples, the two influencing factors (w and m) have little impact on the evaluation results due to the instantaneous occurrence of massive AE signals.

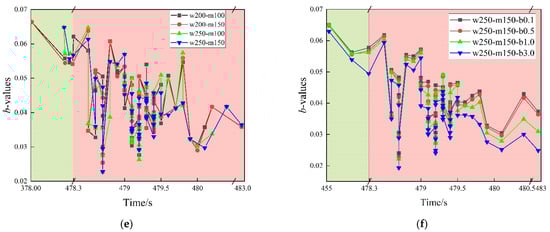
Figure 8.
Influence of statistical analysis parameters on the b-values: (a) several groups of windows and moving steps in Design-1; (b) several groups of bin widths in Design-1; (c) several groups of windows and moving steps in Design-2; (d) several groups of bin widths in Design-2; (e) several groups of windows and moving steps in Design-3; (f) several groups of bin widths in Design-3.
When the b (bin widths of magnitude are set as 0.1, 0.5, 1.0, and 3.0 in Figure 8b,d,f) is the unique variable, the increase in the value of b will result in an overall decrease in the calculation result of b-values; the results obtained by group w250–m150–b3.0 are much lower than those of other three groups of data. Accordingly, to obtain more stable statistical results, it is recommended to set the bin width of magnitude to 0.5 or 1 in future post-processing calculations.
3.3. Failure Intensity Estimations Based on the S Value
The S value (used to quantify AE activity) comprehensively estimates the time, space, and intensity of secondary failures in a rock sample. It involves the event rate, average energy, and maximum energy, which help to reflect the concentration degree and energy scale of AE sources inside the rock mass [44]. The corresponding calculation formula is as follows:
where msi is the magnitude of each AE event, and ms is the magnitude of the maximum AE event amplitude in the statistical window.
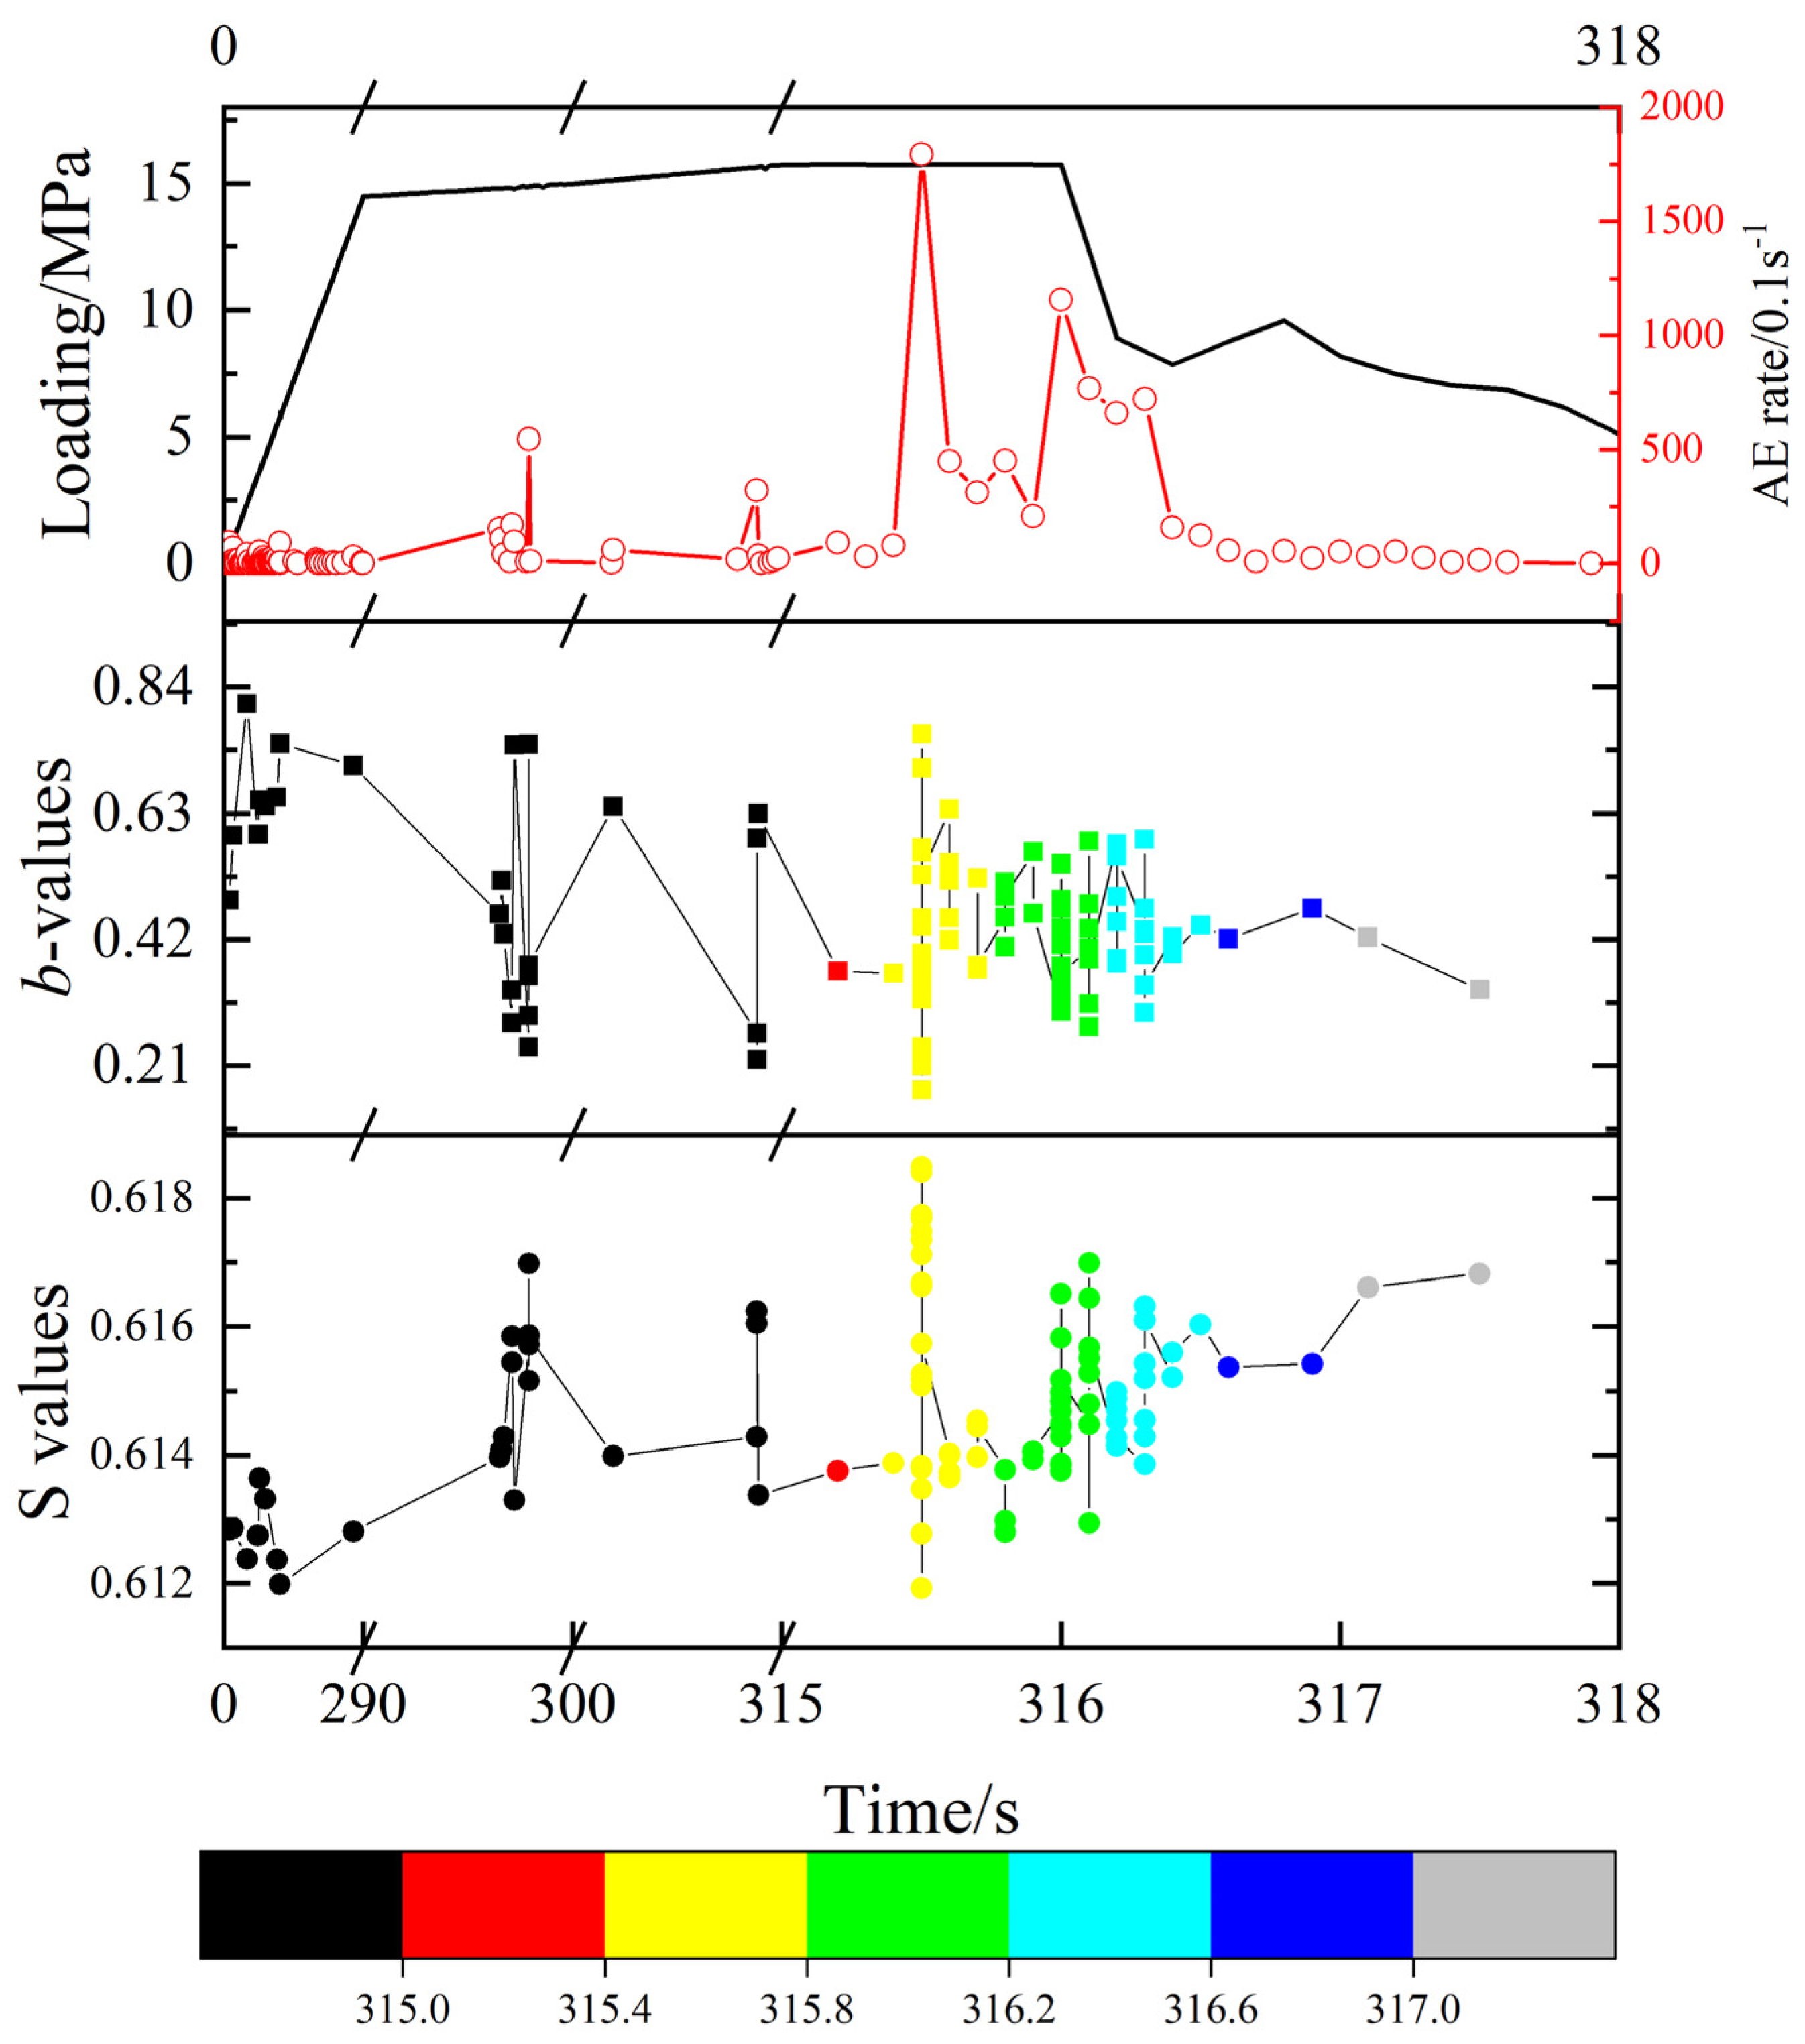
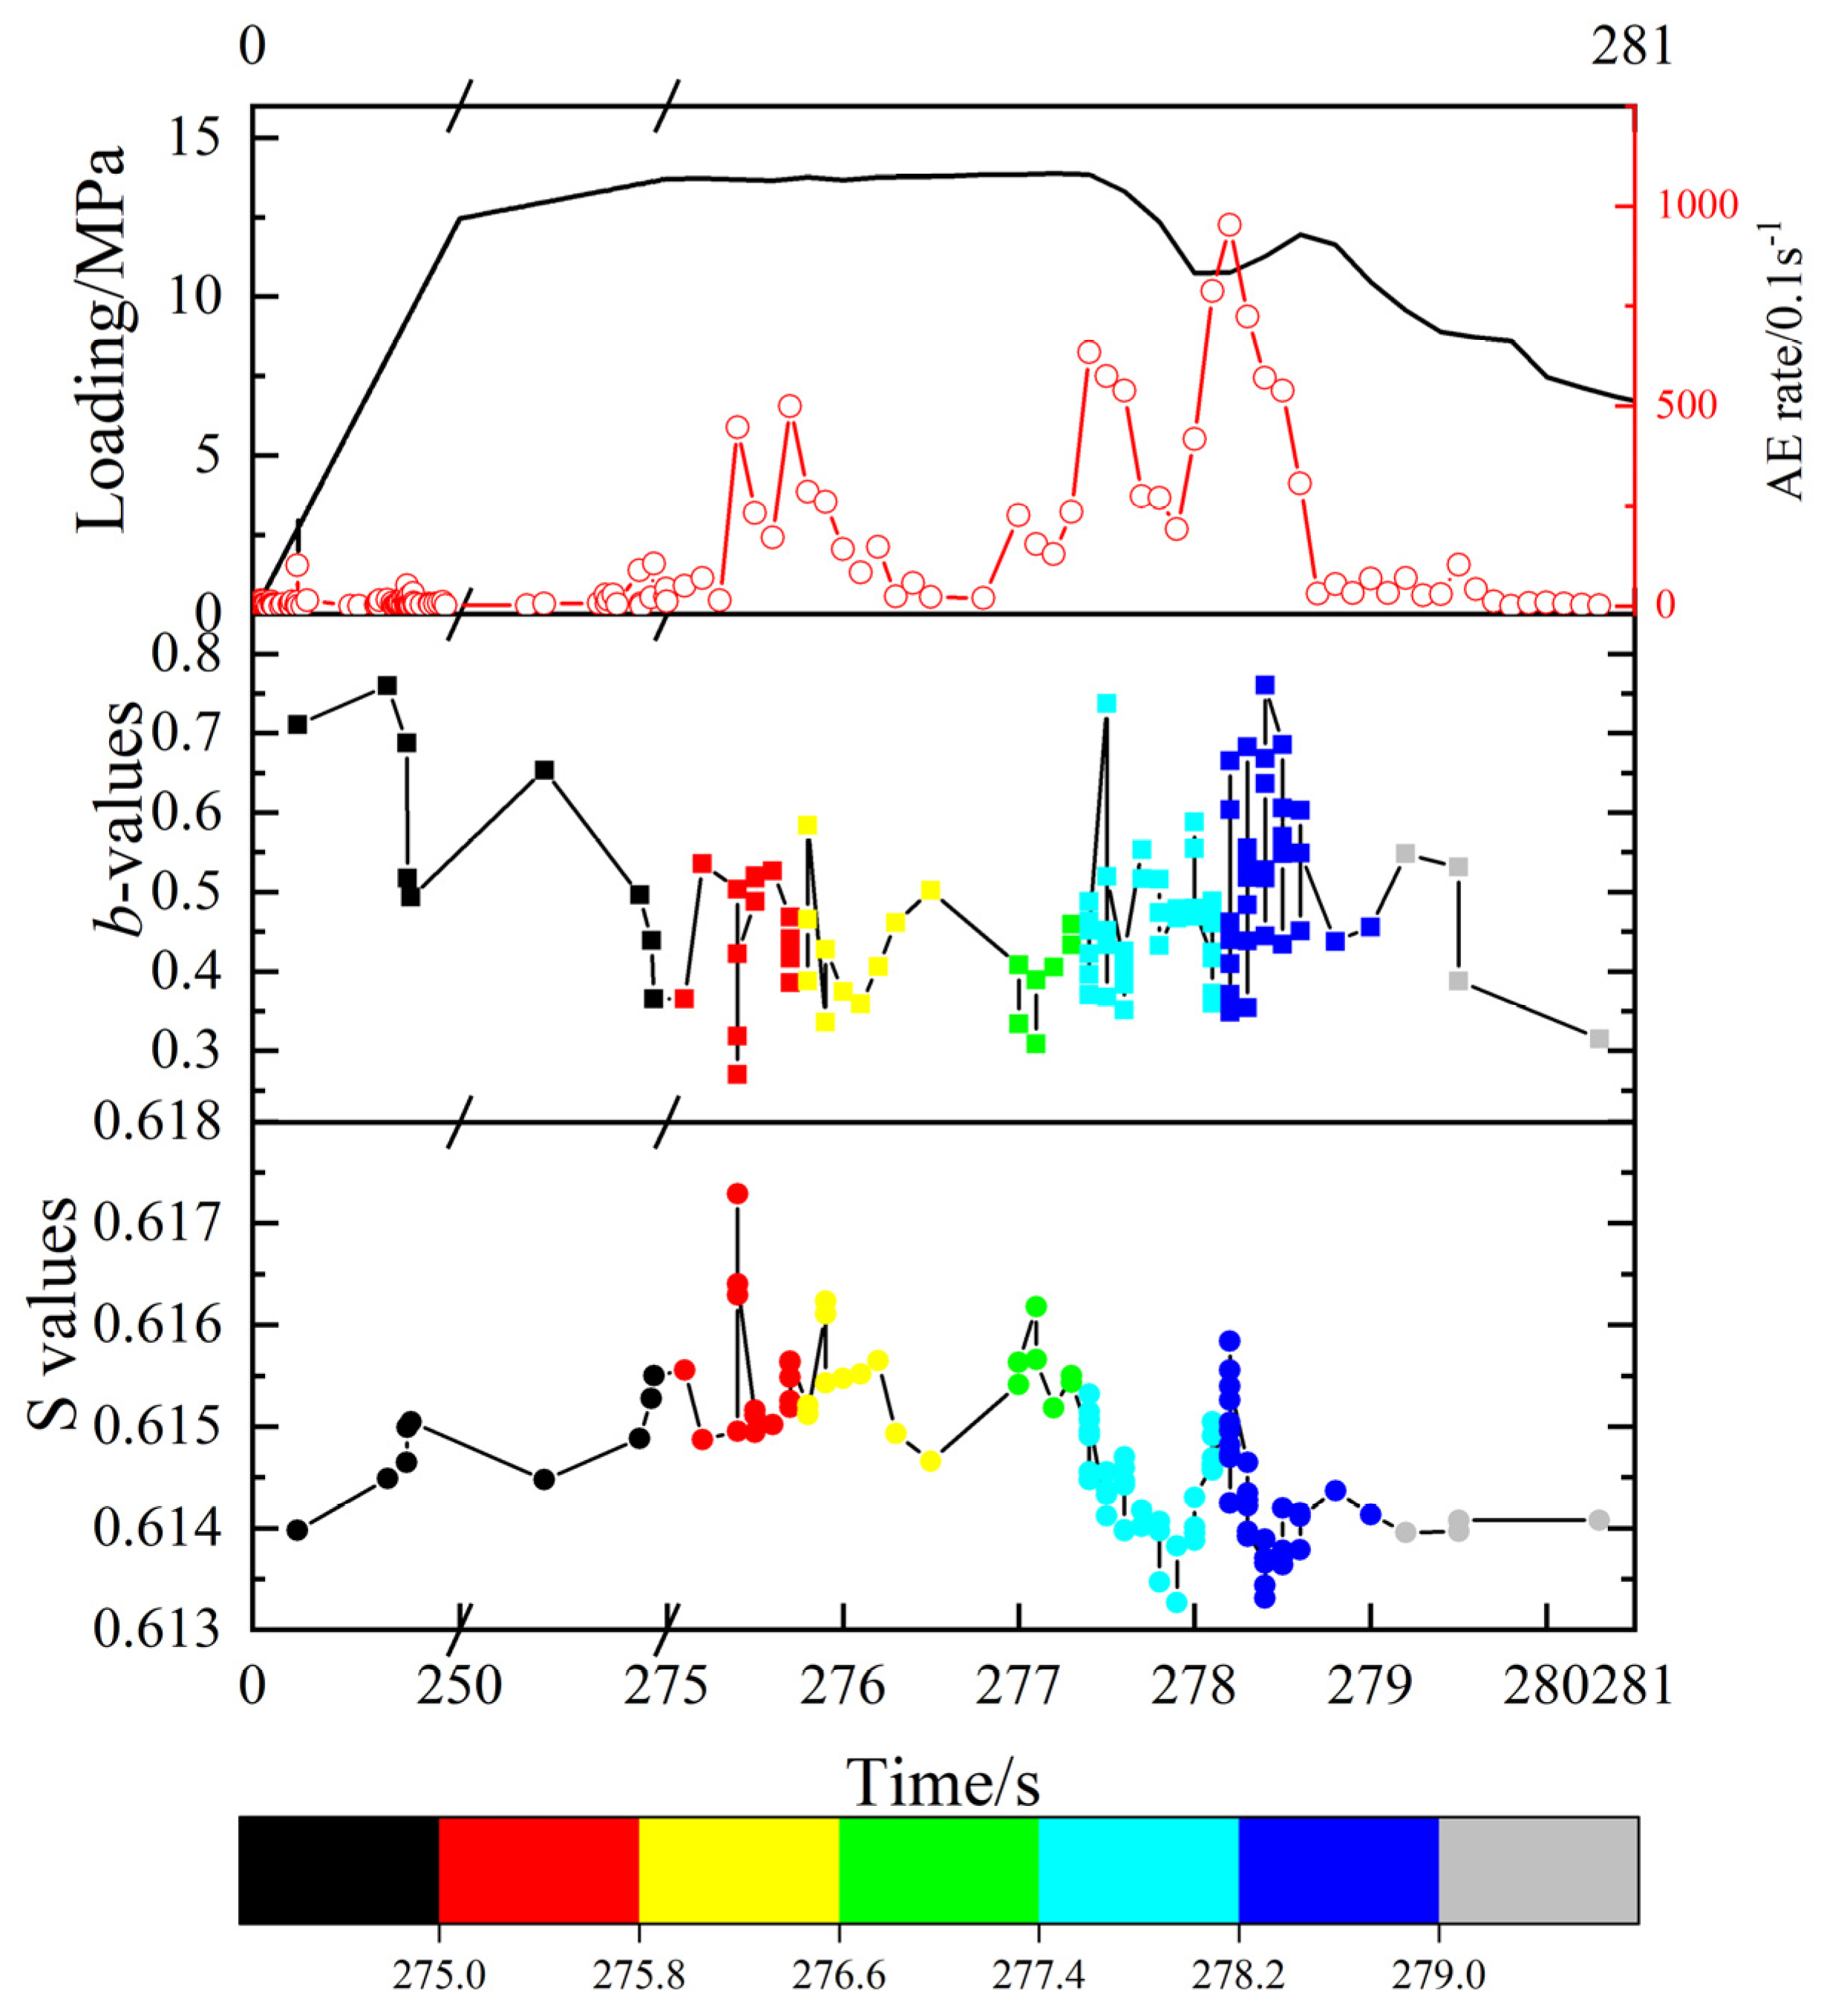
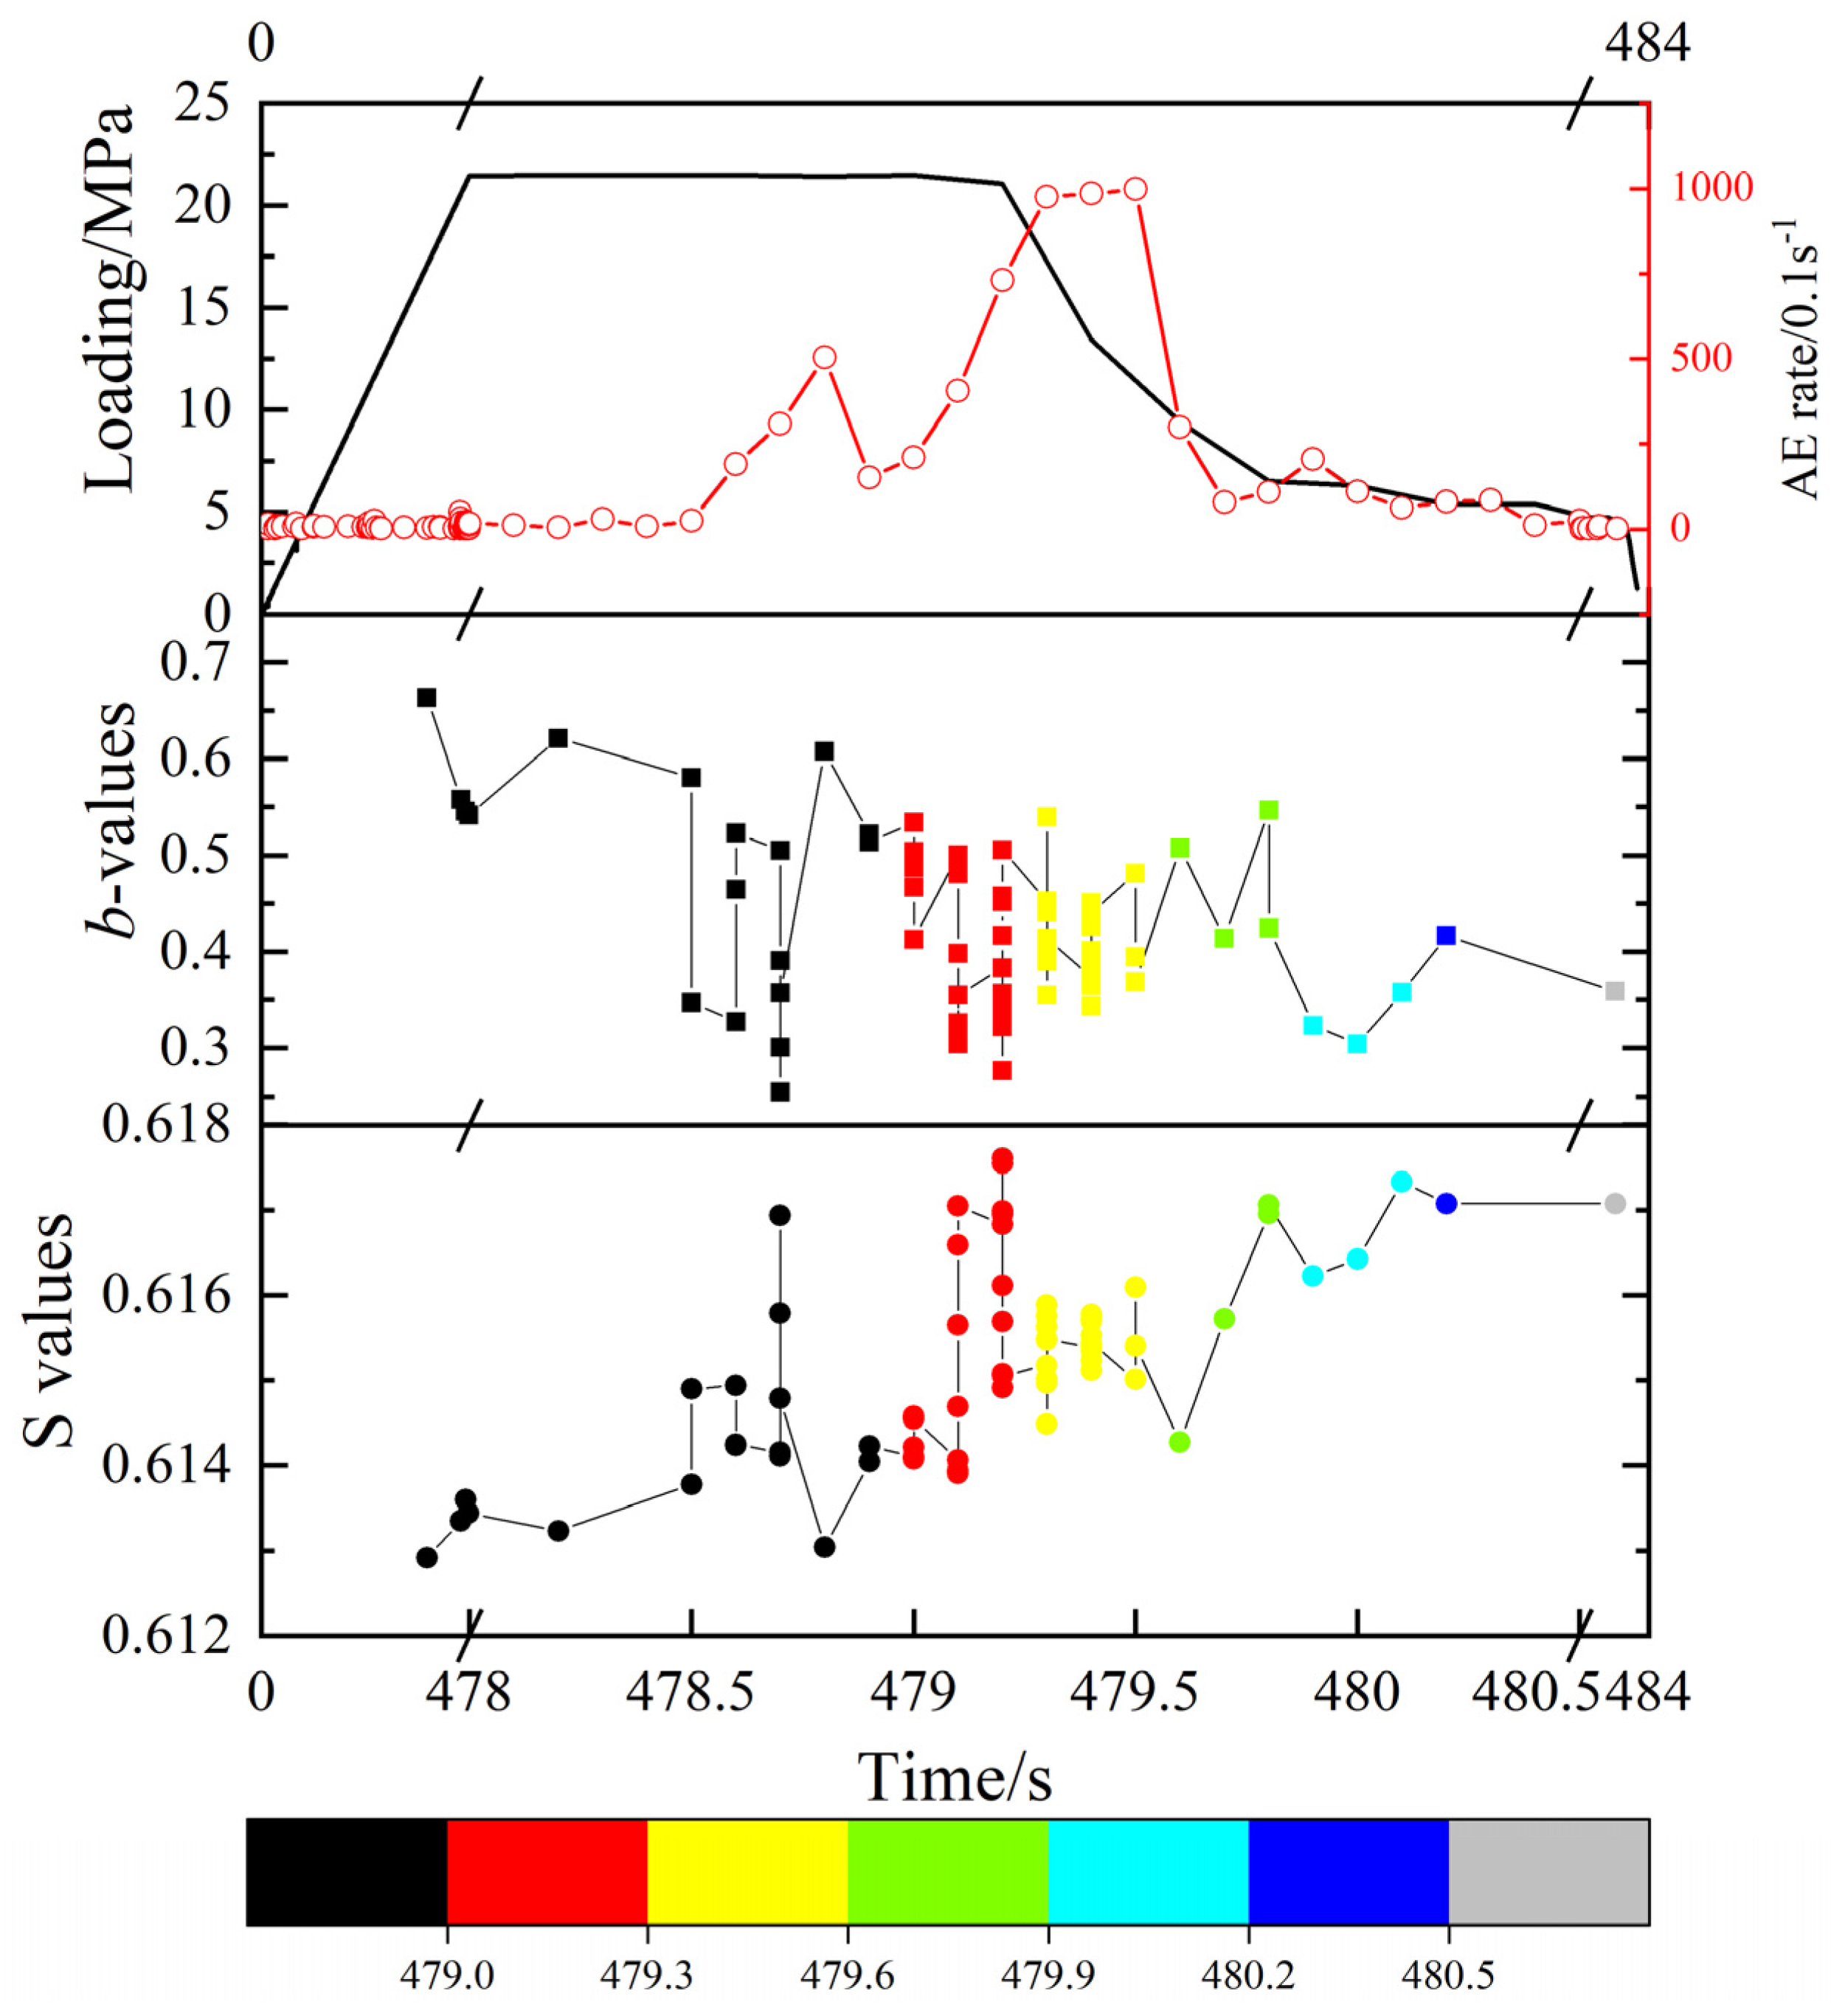
Because the majority of AE events are captured during the final period of the test, Figure 9, Figure 10 and Figure 11 focus on the AE results neighboring to the UCS status, and the corresponding period is marked by various colors. The main conclusions are as follows:
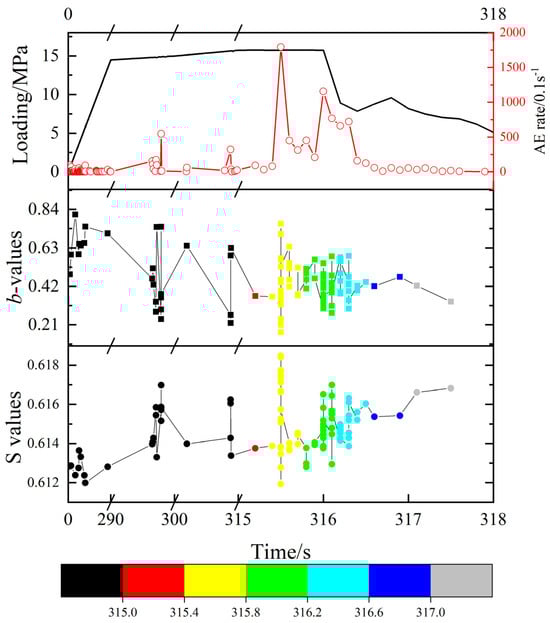
Figure 9.
Curves of the loading stress, b-values, and S values (Design-1 sample).
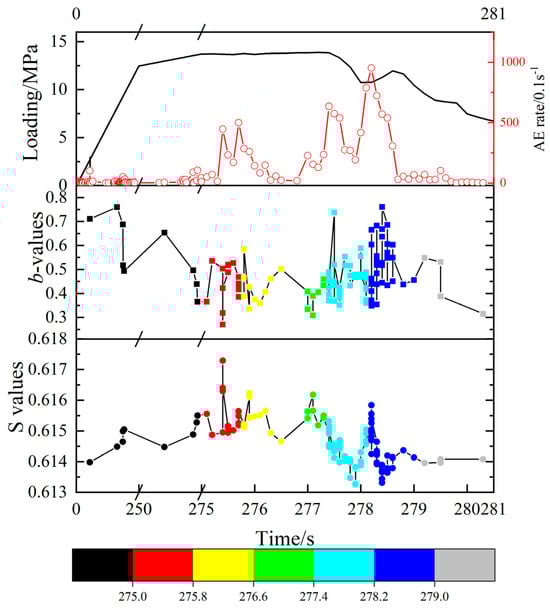
Figure 10.
Curves of the loading stress, b-values, and S values (Design-2 sample).
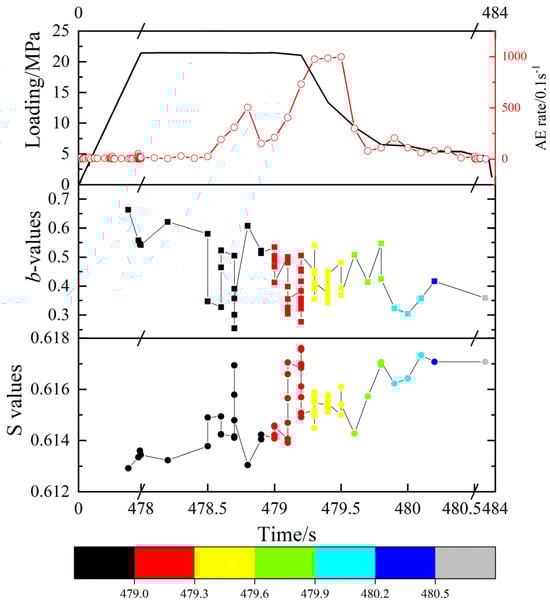
Figure 11.
Curves of the loading stress, b-values, and S values (Design-3 sample).
- (1)
- The relatively high b-values and low S values remain for a long time (0–290 s in the Design-1 sample, 0–275 s in the Design-2 sample, and 0–478 s in the Design-3 sample), which proves that the small and micro-scale destruction continues to develop, and no macroscopic large-scale damage occurs.
- (2)
- Before the final destructions of the sample, the b-values usually decline before the AE rates sharply rise (over 400 events/0.1 s); meanwhile, the S values show the opposite characteristic (290–296 s and 314–315 s in the Design-1 sample, 275–276 s and 277–278 s in the Design-2 sample, and 478.5–479 s in the Design-3 sample). During these periods, the scale of local failure expands, the macroscopic secondary cracks gradually form, and the energy released during the fracture process gradually increases.
- (3)
- When the AE rate reaches its maximum, the b-values and S values oscillate rapidly in a short period of time; the destruction is completed instantly within 0.01 s, which can be considered as the simultaneous generation of multi-scale and multi-level destructions. The duration of this type of period shall not exceed 1 s, and it is also the fastest period of secondary damage development.
- (4)
- AE rates sharply drop after reaching the UCS status of the tests, and the b-values gradually decline in the remaining period, while the S values present the opposite trend (increase) simultaneously. The above results indicate that the size and severity of secondary failures during this period gradually rise, and the macroscale and large-scale destruction ultimately take place.
Accordingly, the long-term accumulation of small-scale damage is observed during the majority of the test duration; there will be clear premonitory features in the b-values and S values before the formation of local failures; the final failures quickly form at various scales and energy levels, then the macroscale destruction dominates in subsequent periods.
3.4. Mechanism of AE Events Neighboring to the 3D Internal Flaw before UCS Status
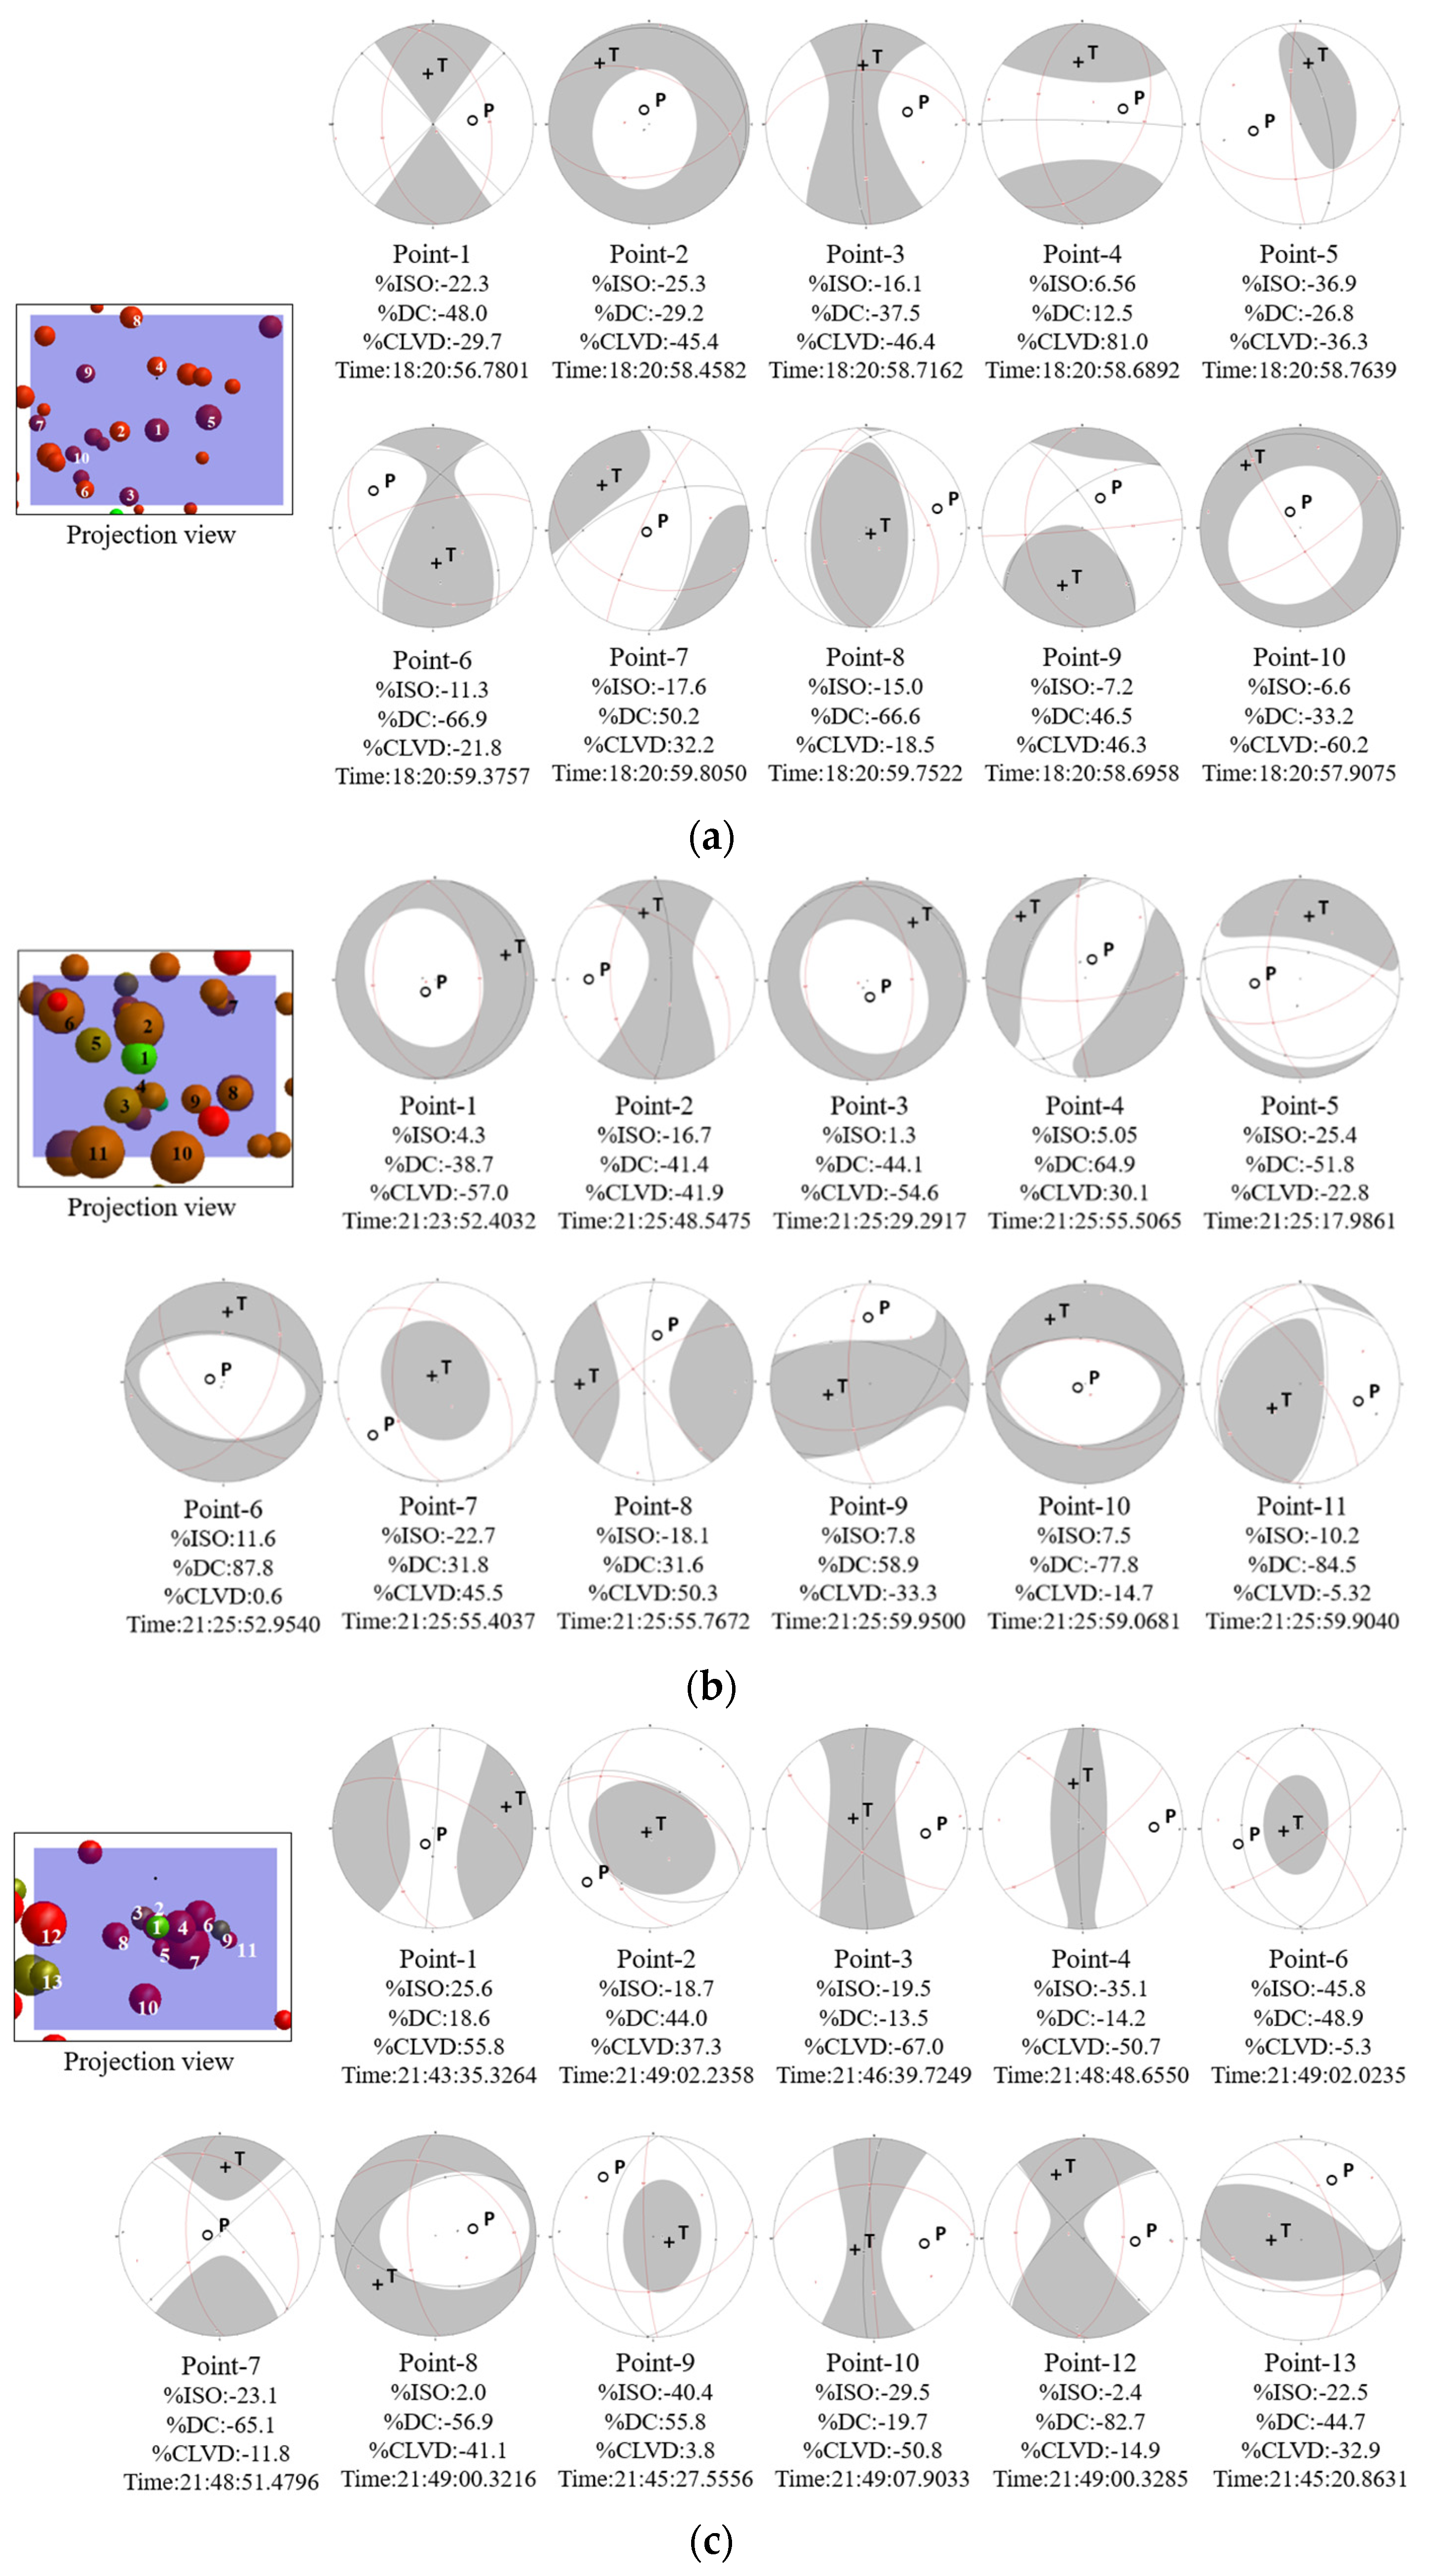
Figure 7 illustrates that many AE events initially gather around the 3D internal preset flaw before reaching the UCS status, and the detailed mechanism of AE events is explained by the Moment tensor inversion method [45]. Based on this method, the moment tensor of an AE event can be separated into three components, isotropic (ISO), double couple (DC), and compensated linear vector dipole (CLVD) [46], and the corresponding calculation formula is expressed as follows:
where tr(m) is the trace of the matrix; mi*(i = 1,2,3) are the three eigenvalues of the deviatoric component of the moment tensor.
Petruzalek [47] sets the DC percentage (%DC) to the standards, and the AE event is defined as a shear failure when the %DC is more than 70. The typical tensile failure occurs as the %DC is less than 40, while events accompanied by %DC between 40 and 70 represent mixed tensile-shear failures.
Figure 12 presents the event mechanism by the beach ball, and the selected events are neighboring to the internal 3D flaw. The %DC of all events in the Design-1 sample are less than 70 (tensile failures play the dominant role), and 50% of events belong to the typical tensile failure (%DC is less than 40). In the Design-2 and 3 samples, events that are located at the middle position in the projection view belong to the pure tensile or tensile-shear failures, and events that occur near the flaw boundary present as the typical shear failures.
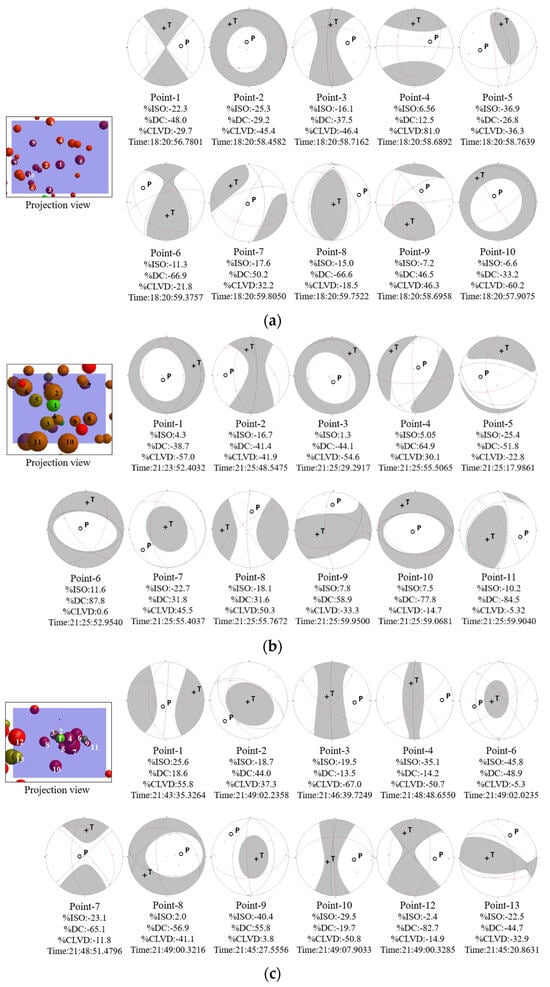
Figure 12.
Location and beach ball figures of AE events neighboring to the internal 3D flaw before reaching the UCS status: (a) calculation results of the Design-1 sample; (b) calculation results of the Design-2 sample; (c) calculation results of the Design-3 sample.
Based on previous theoretical analysis results [48], it can be concluded that the relatively large non-uniform deformation occurs in the upper and lower free surfaces of the internal 3D flaw, and its central position is more prone to tensile failure; as the inclination angle of the preset flaw increases, its boundary position is more prone to shear failure.
4. Conclusions
The laboratory uniaxial compression test was conducted accompanied by DIC monitoring and AE positioning monitoring. As the inclination angle of preset twin flaws increases, the distribution and development characteristics of surface cracks and internal local failures illustrate different characteristics, and the main conclusions are as follows:
- (1)
- The inclination angle of preset twin flaws gradually changes the intensity of the final failure of the sample, surface strain field, and distribution characteristics of secondary cracks. In addition, the internal 3D flaws show little influence on the distributions of the maximum principal strain fields and visible cracks on the sample surface, which are mainly controlled by the 2D preset flaws. The above results are consistent with previous similar test results.
- (2)
- The gradient inclination angle of preset twin flaws shows a slight influence on the distribution of AE events before reaching the UCS status of samples, while the destructiveness of the middle rock between the parallel flaws declines gradually as the flaw inclination angle increases. Furthermore, as the flaw inclination angle increases, the central position of the internal free surfaces (built by the internal 3D open-type preset flaw) is more prone to typical tensile failure, and the boundary position is more prone to shear failure.
- (3)
- Based on the acoustic data monitored by the InSite-Lab system, the long-term accumulation of small-scale damage is observed during the majority of the test duration; there will be clear premonitory features in the b-values and S values before the formation of local failures; the final failures quickly form at various scales and energy levels, then the macroscale destruction dominates in subsequent periods.
- (4)
- When calculating the b-values, the two influencing factors (data window width and moving step length) have little impact on the evaluation results due to the instantaneous occurrence of massive AE signals; in addition, it is suggested to set the bin width of magnitude to 0.5 or 1.0 for obtaining more stable statistical results.
- (5)
- The laboratory test only focused on the failure characteristics of the fractured brittle rock under the uniaxial compression condition, which can only simulate an underground pillar; however, the surrounding rock of underground engineering is mostly in a biaxial or even true triaxial stress state. By applying the true triaxial compressive loading system at Fuzhou University, we will continue to prepare relevant samples (the true 3D preset flaws) in future work and expand the experiment to true triaxial conditions.
Author Contributions
Conceptualization and methodology, T.L.; formal analysis and writing, S.C.; review, B.L. All authors have read and agreed to the published version of the manuscript.
Funding
This research was funded by the Natural Science Foundation of Fujian, grant number 2022J01567.
Institutional Review Board Statement
Not applicable.
Informed Consent Statement
Not applicable.
Data Availability Statement
The data used to support the results of this study are included in the paper.
Conflicts of Interest
The authors declare no conflict of interest.
References
- Bobet, A. The initiation of secondary cracks in compression. Eng. Fract. Mech. 2000, 66, 187–219. [Google Scholar] [CrossRef]
- Li, X.; Zhou, T.; Li, D. Dynamic strength and fracturing behavior of single-flawed prismatic marble specimens under impact loading with a Split-Hopkinson Pressure Bar. Rock Mech. Rock Eng. 2017, 50, 29–44. [Google Scholar] [CrossRef]
- Liu, L.; Li, H.; Li, X.; Wu, R. Full-field strain evolution and characteristic stress levels of rocks containing a single pre-existing flaw under uniaxial compression. Bull. Eng. Geol. Environ. 2000, 79, 3145–3161. [Google Scholar] [CrossRef]
- Shan, R.; Bai, Y.; Dou, H.; Han, T.; Yan, F. Experimental study on the mechanical properties and damage evolution of red sandstone containing a single ice-filled flaw under triaxial compression. Arab. J. Geosci. 2020, 13, 630. [Google Scholar] [CrossRef]
- Yang, S.; Jing, H. Strength failure and crack coalescence behavior of brittle sandstone samples containing a single fissure under uniaxial compression. Int. J. Fract. 2011, 168, 227–250. [Google Scholar] [CrossRef]
- Yang, S.; Tian, W.; Huang, Y.; Ma, Z.; Fan, L.; Wu, Z. Experimental and discrete element modeling on cracking behavior of sandstone containing a single oval flaw under uniaxial compression. Eng. Fract. Mech. 2018, 194, 154–174. [Google Scholar] [CrossRef]
- Zhang, X.; Zhang, Q.; Wu, S. Acoustic emission characteristics of the rock-like material containing a single flaw under different compressive loading rates. Comput. Geotech. 2017, 83, 83–97. [Google Scholar] [CrossRef]
- Bobet, A.; Einstein, H. Fracture coalescence in rock-type materials under uniaxial and biaxial compression. Int. J. Rock Mech. Min. Sci. 1998, 35, 863–888. [Google Scholar] [CrossRef]
- Lin, Q.; Cao, P.; Wen, G.; Meng, J.; Cao, R.; Zhao, Z. Crack coalescence in rock-like specimens with two dissimilar layers and pre-existing double parallel joints under uniaxial compression. Int. J. Rock Mech. Min. Sci. 2021, 139, 104621. [Google Scholar] [CrossRef]
- Pan, W.; Wang, X.; Liu, Q.; Yuan, Y.; Zuo, B. Non-parallel double-crack propagation in rock-like materials under uniaxial compression. Int. J. Coal Sci. Technol. 2019, 6, 372–387. [Google Scholar] [CrossRef]
- Zhuang, X.; Zhou, S. An experimental and numerical study on the influence of filling materials on double-crack propagation. Rock Mech. Rock Eng. 2020, 53, 5571–5591. [Google Scholar] [CrossRef]
- Asadizadeh, M.; Hossaini, M.F.; Moosavi, M.; Masoumi, H.; Ranjith, P. Mechanical characterisation of jointed rock-like material with non-persistent rough joints subjected to uniaxial compression. Eng. Geol. 2019, 260, 105224. [Google Scholar] [CrossRef]
- Cao, R.; Yao, R.; Meng, J.; Lin, Q.; Lin, H.; Li, S. Failure mechanism of non-persistent jointed rock-like specimens under uniaxial loading: Laboratory testing. Int. J. Rock Mech. Min. Sci. 2020, 132, 104341. [Google Scholar] [CrossRef]
- Yang, S.; Yin, P.; Zhang, Y.; Chen, M.; Zhou, X.; Jing, H.; Zhang, Q. Failure behavior and crack evolution mechanism of a non-persistent jointed rock mass containing a circular hole. Int. J. Rock Mech. Min. Sci. 2019, 114, 101–121. [Google Scholar] [CrossRef]
- Gerolymatou, E.; Triantafyllidis, T. Shearing of materials with intermittent joints. Rock Mech. Rock Eng. 2016, 49, 2689–2700. [Google Scholar] [CrossRef]
- Jiang, Q.; Cui, J.; Feng, X.; Zhang, Y.; Zhang, M.; Zhong, S.; Ran, S. Demonstration of spatial anisotropic deformation properties for jointed rock mass by an analytical deformation tensor. Comput. Geotech. 2017, 88, 111–128. [Google Scholar] [CrossRef]
- Cao, R.; Cao, P.; Fan, X.; Xiong, X.; Lin, H. An experimental and numerical study on mechanical behavior of ubiquitous-joint brittle rock-like specimens under uniaxial compression. Rock Mech. Rock Eng. 2016, 49, 4319–4338. [Google Scholar] [CrossRef]
- Yang, X.; Jing, H.; Tang, C.; Yang, S. Effect of parallel joint interaction on mechanical behavior of jointed rock mass models. Int Int. J. Rock Mech. Min. Sci. 2017, 92, 40–53. [Google Scholar] [CrossRef]
- Liu, Y.; Dai, F.; Dong, L.; Xu, N.; Feng, P. Experimental investigation on the fatigue mechanical properties of intermittently jointed rock models under cyclic uniaxial compression with different loading parameters. Rock Mech. Rock Eng. 2018, 51, 47–68. [Google Scholar] [CrossRef]
- Lin, Q.; Cao, P.; Meng, J.; Cao, R.; Zhao, Z. Strength and failure characteristics of jointed rock mass with double circular holes under uniaxial compression: Insights from discrete element method modelling. Theor. Appl. Fract. Mech. 2020, 109, 102692. [Google Scholar] [CrossRef]
- Lin, Q.; Cao, P.; Liu, Y.; Cao, R.; Li, J. Mechanical behaviour of a jointed rock mass with a circular hole under compression-shear loading: Experimental and numerical studies. Theor. Appl. Fract. Mech. 2021, 114, 102998. [Google Scholar] [CrossRef]
- Xing, H.; Zahng, Q.; Ruan, D.; Dehkhoda, S.; Lu, G.; Zhao, J. Full-field measurement and fracture characterisations of rocks under dynamic loads using high-speed three-dimensional digital image correlation. Int. J. Impact Eng. 2018, 113, 61–72. [Google Scholar] [CrossRef]
- Xing, H.; Zhang, Q.; Zhao, J. Stress Thresholds of crack development and Poisson’s ratio of rock material at high strain rate. Rock Mech. Rock Eng. 2018, 51, 945–951. [Google Scholar] [CrossRef]
- Liu, B.; Gao, Y.; Jin, A.; Wang, X. Dynamic characteristics of superfine tailings–blast furnace slag backfill featuring filling surface. Constr. Build. Mater. 2020, 242, 118173. [Google Scholar] [CrossRef]
- Fakhimi, A.; Lin, Q.; Labuz, J.F. Insights on rock fracture from digital imaging and numerical modeling. Int. J. Rock Mech. Min. Sci. 2018, 107, 201–207. [Google Scholar] [CrossRef]
- Miao, S.; Pan, P.; Li, S.; Chen, J.; Konicek, P. Quantitative fracture analysis of hard rock containing double infilling flaws with a novel DIC-based method. Eng. Fract. Mech. 2021, 252, 107846. [Google Scholar] [CrossRef]
- Zhang, J.; Zhou, X. AE event rate characteristics of flawed granite: From damage stress to ultimate failure. Geophys. J. Int. 2020, 222, 795–814. [Google Scholar] [CrossRef]
- Zhou, X.; Zhang, J. Damage progression and acoustic emission in brittle failure of granite and sandstone. Int. J. Rock Mech. Min. Sci. 2021, 143, 104789. [Google Scholar] [CrossRef]
- Zhao, Y.; Gao, Y.; Wu, S. Influence of different concealment conditions of parallel double flaws on mechanical properties and failure characteristics of brittle rock under uniaxial compression. Theor. Appl. Fract. Mech. 2020, 109, 102751. [Google Scholar] [CrossRef]
- Zhao, Y.; Gao, Y.; Wu, S.; Chen, L.; Zhang, C. Experimental and numerical study of failure characteristics of brittle rocks with single internal 3D open-type flaw. Acta Geotech. 2021, 16, 3087–3113. [Google Scholar] [CrossRef]
- Lei, R.; Zhang, Z.; Berto, F.; Ranjith, P.; Liu, L. Cracking process and acoustic emission characteristics of sandstone with two parallel filled-flaws under biaxial compression. Eng. Fract. Mech. 2020, 237, 107253. [Google Scholar] [CrossRef]
- Lei, R.; Zhang, Z.; Ge, Z.; Berto, F.; Wang, G.; Zhou, L. Deformation localization and cracking processes of sandstone containing two flaws of different geometric arrangements. Fatigue Fract. Eng. Mater. Struct. 2020, 43, 1959–1977. [Google Scholar] [CrossRef]
- Huang, Y.; Yang, S.; Dong, J. Experimental study on fracture behaviour of three-flawed sandstone specimens after high-temperature treatments. Fatigue Fract. Eng. Mater. Struct. 2020, 43, 2214–2231. [Google Scholar] [CrossRef]
- Zhang, J.; Zhou, X.; Zhou, L.; Berto, F. Progressive failure of brittle rocks with non-isometric flaws: Insights from acousto-optic-mechanical (AOM) data. Fatigue Fract. Eng. Mater. Struct. 2019, 42, 1787–1802. [Google Scholar] [CrossRef]
- Zhao, Y.; Chen, C.; Wu, S.; Guo, P.; Li, B. Effects of 2D&3D nonparallel flaws on failure characteristics of brittle rock-like samples under uniaxial compression: Insights from acoustic emission and DIC monitoring. Theor. Appl. Fract. Mech. 2022, 120, 103391. [Google Scholar] [CrossRef]
- Liu, X.; Pan, M.; Li, X.; Wang, J. Acoustic emission b-value characteristics of granite under dynamic loading and static loading. Chin. J. Rock Mech. Eng. 2017, 36 (Suppl. S1), 3148–3155. [Google Scholar] [CrossRef]
- Gutenberg, B.; Richter, C.F. Frequency of earthquakes in California. Bull. Seism. Soc. Am. 1944, 34, 185–188. [Google Scholar] [CrossRef]
- Scholz, C.H. The frequency-magnitude relation of micro-fracturing in rock and its relation to earthquakes. Bull. Seism. Soc. Am. 1968, 58, 399–415. [Google Scholar] [CrossRef]
- Schorlemmer, D.; Wiemer, S.; Wyss, M. Variations in earthquake-size distribution across different stress regimes. Nature 2005, 437, 539–542. [Google Scholar] [CrossRef]
- Shi, H.; Meng, L.; Zhang, X.; Chang, Y.; Yang, Z.; Xie, W.; Fu, B.; Han, P. Decrease in b-value prior to the Wenchuan earthquake (MS8.0). Chin. J. Geophy. 2018, 61, 1874–1881. [Google Scholar]
- Scholz, C.H. On the stress dependence of the earthquake b-value. Geophys. Res. Lett. 2015, 42, 1399–1402. [Google Scholar] [CrossRef]
- Liu, X.; Han, M.; Li, X.; Chen, D. A new b value estimation method in rock acoustic emission testing. J. Geophys. Res. Solid Earth 2020, 125, e2020JB019658. [Google Scholar] [CrossRef]
- Sheoran, R.; Datt, P.; Shahi, J.S.; Srivastava, P.K. Improvements in the estimation of b value: Limits of the power law. Struct. Control. Heal. Monit. 2022, 29, e3072. [Google Scholar] [CrossRef]
- Dong, L.; Zhang, Y.; Sun, D.; Chen, Y.; Tang, Z. Stage characteristics of acoustic emission and identification of unstable crack state for granite fractures. Chin. J. Rock Mech. Eng. 2022, 41, 120–131. [Google Scholar] [CrossRef]
- Ren, Y.; Vavrycuk, V.; Wu, S.; Gao, Y. Accurate moment tensor inversion of acoustic emissions and its application to Brazilian splitting test. Int. J. Rock Mech. Min. Sci. 2021, 141, 104707. [Google Scholar] [CrossRef]
- Sun, W.; Wu, S. A study of crack initiation and source mechanism in the Brazilian test based on moment tensor. Eng. Fract. Mech. 2021, 264, 107622. [Google Scholar] [CrossRef]
- Petružálek, M.; Jechumtálová, Z.; Kolář, P.; Adamova, P.; Svitek, T.; Šílený, J.; Lokajicek, T. Acoustic emission in a laboratory: Mechanism of microearthquakes using alternative source models. J. Geophys. Res. Solid Earth 2018, 123, 4965–4982. [Google Scholar] [CrossRef]
- Zhao, Y.; Gao, Y.; Wu, S. Experimental and theoretical study of failure characteristics of rock containing single 3D internal open-type flaws. Arab. J. Sci. Eng. 2021, 46, 5071–5088. [Google Scholar] [CrossRef]

Disclaimer/Publisher’s Note: The statements, opinions and data contained in all publications are solely those of the individual author(s) and contributor(s) and not of MDPI and/or the editor(s). MDPI and/or the editor(s) disclaim responsibility for any injury to people or property resulting from any ideas, methods, instructions or products referred to in the content. |
© 2023 by the authors. Licensee MDPI, Basel, Switzerland. This article is an open access article distributed under the terms and conditions of the Creative Commons Attribution (CC BY) license (https://creativecommons.org/licenses/by/4.0/).