Article

Mobile Customer Satisfaction Scoring Research Based on Quadratic Dimension Reduction and Machine Learning Integration

1
Key Laboratory of Metallurgical Equipment and Control Technology of Ministry of Education, Wuhan University of Science and Technology, Wuhan 430081, China
2
Hubei Key Laboratory of Mechanical Transmission and Manufacturing Engineering, Wuhan University of Science and Technology, Wuhan 430081, China
*
Author to whom correspondence should be addressed.
Appl. Sci. 2023, 13(17), 9681; https://doi.org/10.3390/app13179681
Submission received: 30 July 2023 / Revised: 15 August 2023 / Accepted: 23 August 2023 / Published: 27 August 2023
(This article belongs to the Special Issue Computation and Complex Data Processing Systems)

Abstract

:
Customer satisfaction is a measure of the degree of satisfaction of customer experience. Among the three major operators in China, China Mobile plays an important role in the communication field. A study of customer satisfaction with China Mobile will have a significant positive impact on the sustainable development of the entire communication industry. In order to respond to customer needs accurately, a mobile customer satisfaction research method based on quadratic dimensionality reduction and machine learning integration is proposed. Firstly, the core evaluation system of impact satisfaction is established, through the integration of systematic clustering and exploratory factor analysis for quadratic dimensionality reduction. Then, unreasonable data in the core influencing factors are eliminated. Finally, the gradient-boosted decision tree (GBDT) machine learning algorithm is applied to predict satisfaction, with a prediction accuracy of up to 99%, and the highly accurate satisfaction prediction can quickly respond to customer needs and feedback to improve customer experience and satisfaction.

1. Introduction

Customer satisfaction is a measure of how satisfied customers are with a product, service or overall experience. It has a direct impact on the survival and success of an organization [1,2]. This is because satisfied customers tend to remain loyal, tell others about the company and continue to buy, while dissatisfied customers can lead to churn and lost revenue [3,4,5]. By understanding customer needs and improving products and services, organizations can increase their competitive advantage and ensure continued growth [6].
With the continuous development of the network, the communication industry is paying more and more attention to the customer’s communication experience [7,8]. In the era of big data, users’ needs and expectations for communication services continue to improve, and only by meeting users’ needs and providing high-quality services can operators stand out in the competitive market and gain more market share [9].
The 2022 China Mobile data [10] showed that China Mobile ranked last among the three major operators in a number of indicators such as network download speeds, broadband latency and user experience, with China Telecom and China Unicom not far behind. And in the user rating of operators, China Mobile scored the lowest, with just 4.54 points. Meanwhile, China Mobile had negative net customer additions on the mobile side in October 2022 [11], with 786,000 fewer customers on the mobile side. This problem is also being faced abroad, with Amazon losing more than 1 million subscribers to its mobile apps in the UK market since the beginning of 2023 [12]. And with Japan’s Rakuten Group predicting that its mobile business will remain in the red for four consecutive years until 2023 [13], the GSMA’s Mobile Economy APAC 2023 Report [14] reveals that nearly half of the Asia-Pacific population (47%) still lacks access to the mobile internet, despite significant improvements in service. The challenges faced by operators in terms of user experience and customer churn are common, not just for China Mobile, Japan’s Rakuten Group and Amazon’s mobile subscribers in the UK market but also across the Asia-Pacific region. In the highly competitive telecoms and internet industries, delivering a good user experience and effective customer retention are key to business success.
To avoid churn, operators need to gain a deeper understanding of their customers’ needs and experiences [15,16]. Currently, this is mainly achieved by conducting regular customer satisfaction surveys to gather user feedback and opinions [17]. In addition, advanced data analytics can be used to mine subscriber behaviors and network usage data to identify subscriber preferences and pain points [18,19]. Such a data-driven approach can help operators better understand user needs and target key factors for improvement and optimization.
At present, although there are many studies on customer satisfaction [19,20,21], there are few studies on communication user satisfaction. For example, Zi Ye [22] conducted a study on the use of linked table analysis and binary choice model analysis. The study firstly explored the relationship between user characteristics and satisfaction, then a validation analysis of the relationship between five-dimensional variables and customer satisfaction of mobile communication services was conducted. However, when selecting the core influencing factors through the correlation, there are too many choices of indicators, making it difficult for the operator to find an effective solution. Jing Li [23] used the decision tree algorithm to predict satisfaction research. The decision tree was improved using cost-sensitive ideas, which considered the cost of different types of classification errors. By integrating the generated decision tree using the random forest principle, the accuracy and stability of the model were improved. However, the accuracy of the decision tree model was only about 75%, which was not high enough to accurately assess the impact of the improved core factors. Ferreira et al. [24] used the Kano model to evaluate customer satisfaction factors and classified them into different categories based on customer feedback. Although this evaluation method helps companies understand customer needs and improve their products and services to increase customer satisfaction, it lacks quantitative indicators to reflect the magnitude of the impact of each indicator on customer needs. Lucini et al. [25] used a text mining approach to analyze online customer reviews (OCR). This approach helps companies understand customer opinions and sentiments, but it faces challenges and limitations in terms of data quality, semantic understanding, and technical support. Therefore, in practical applications, it is crucial to decompose reviews into representative factors to ensure the accuracy and validity of the analysis results.
In summary, improving customer satisfaction through core factors is crucial for communication operators. Through continuous improvement of core factors and innovative services, operators can win the favor of subscribers, enhance customer loyalty and gain an advantage in the fierce market competition to achieve sustainable and steady development and promote the development of the communication industry [26]. There are fewer related research studies and a lack of high-level quantitative models and reliable evaluation systems.
In order to establish a reliable core evaluation system, as well as to achieve high-precision prediction of satisfaction, a customer satisfaction scoring prediction based on the combination of secondary dimensionality reduction and machine learning is established. Firstly, based on data cleaning and systematic clustering, the preliminary dimensionality reduction of user-satisfaction-influencing factors is carried out to establish a preliminary user satisfaction evaluation index system. Then, based on exploratory factor analysis, the preliminary evaluation indexes are downscaled twice, and the core evaluation index system of user satisfaction is established. Finally, the data are re-cleaned by removing the unreasonable scores of the core influencing factors and then predicted using the gradient-boosted decision tree (GBDT) algorithm.
This study can provide communication operators with core influencing factors with less information redundancy, and operators can improve the core influencing factors and carry out high-precision prediction after improvement to test the improvement effect.
This paper is organized as follows. Section 2 briefly describes the schematic framework of systematic clustering, exploratory factor analysis and the GBDT algorithm. Section 3 describes the establishment of the core indicator system through the combination of systematic clustering and exploratory factor analysis. Section 4 describes the implementation of the GBDT algorithm prediction under the established core indicator system. Section 5 summarizes the work.

2. Literature Review

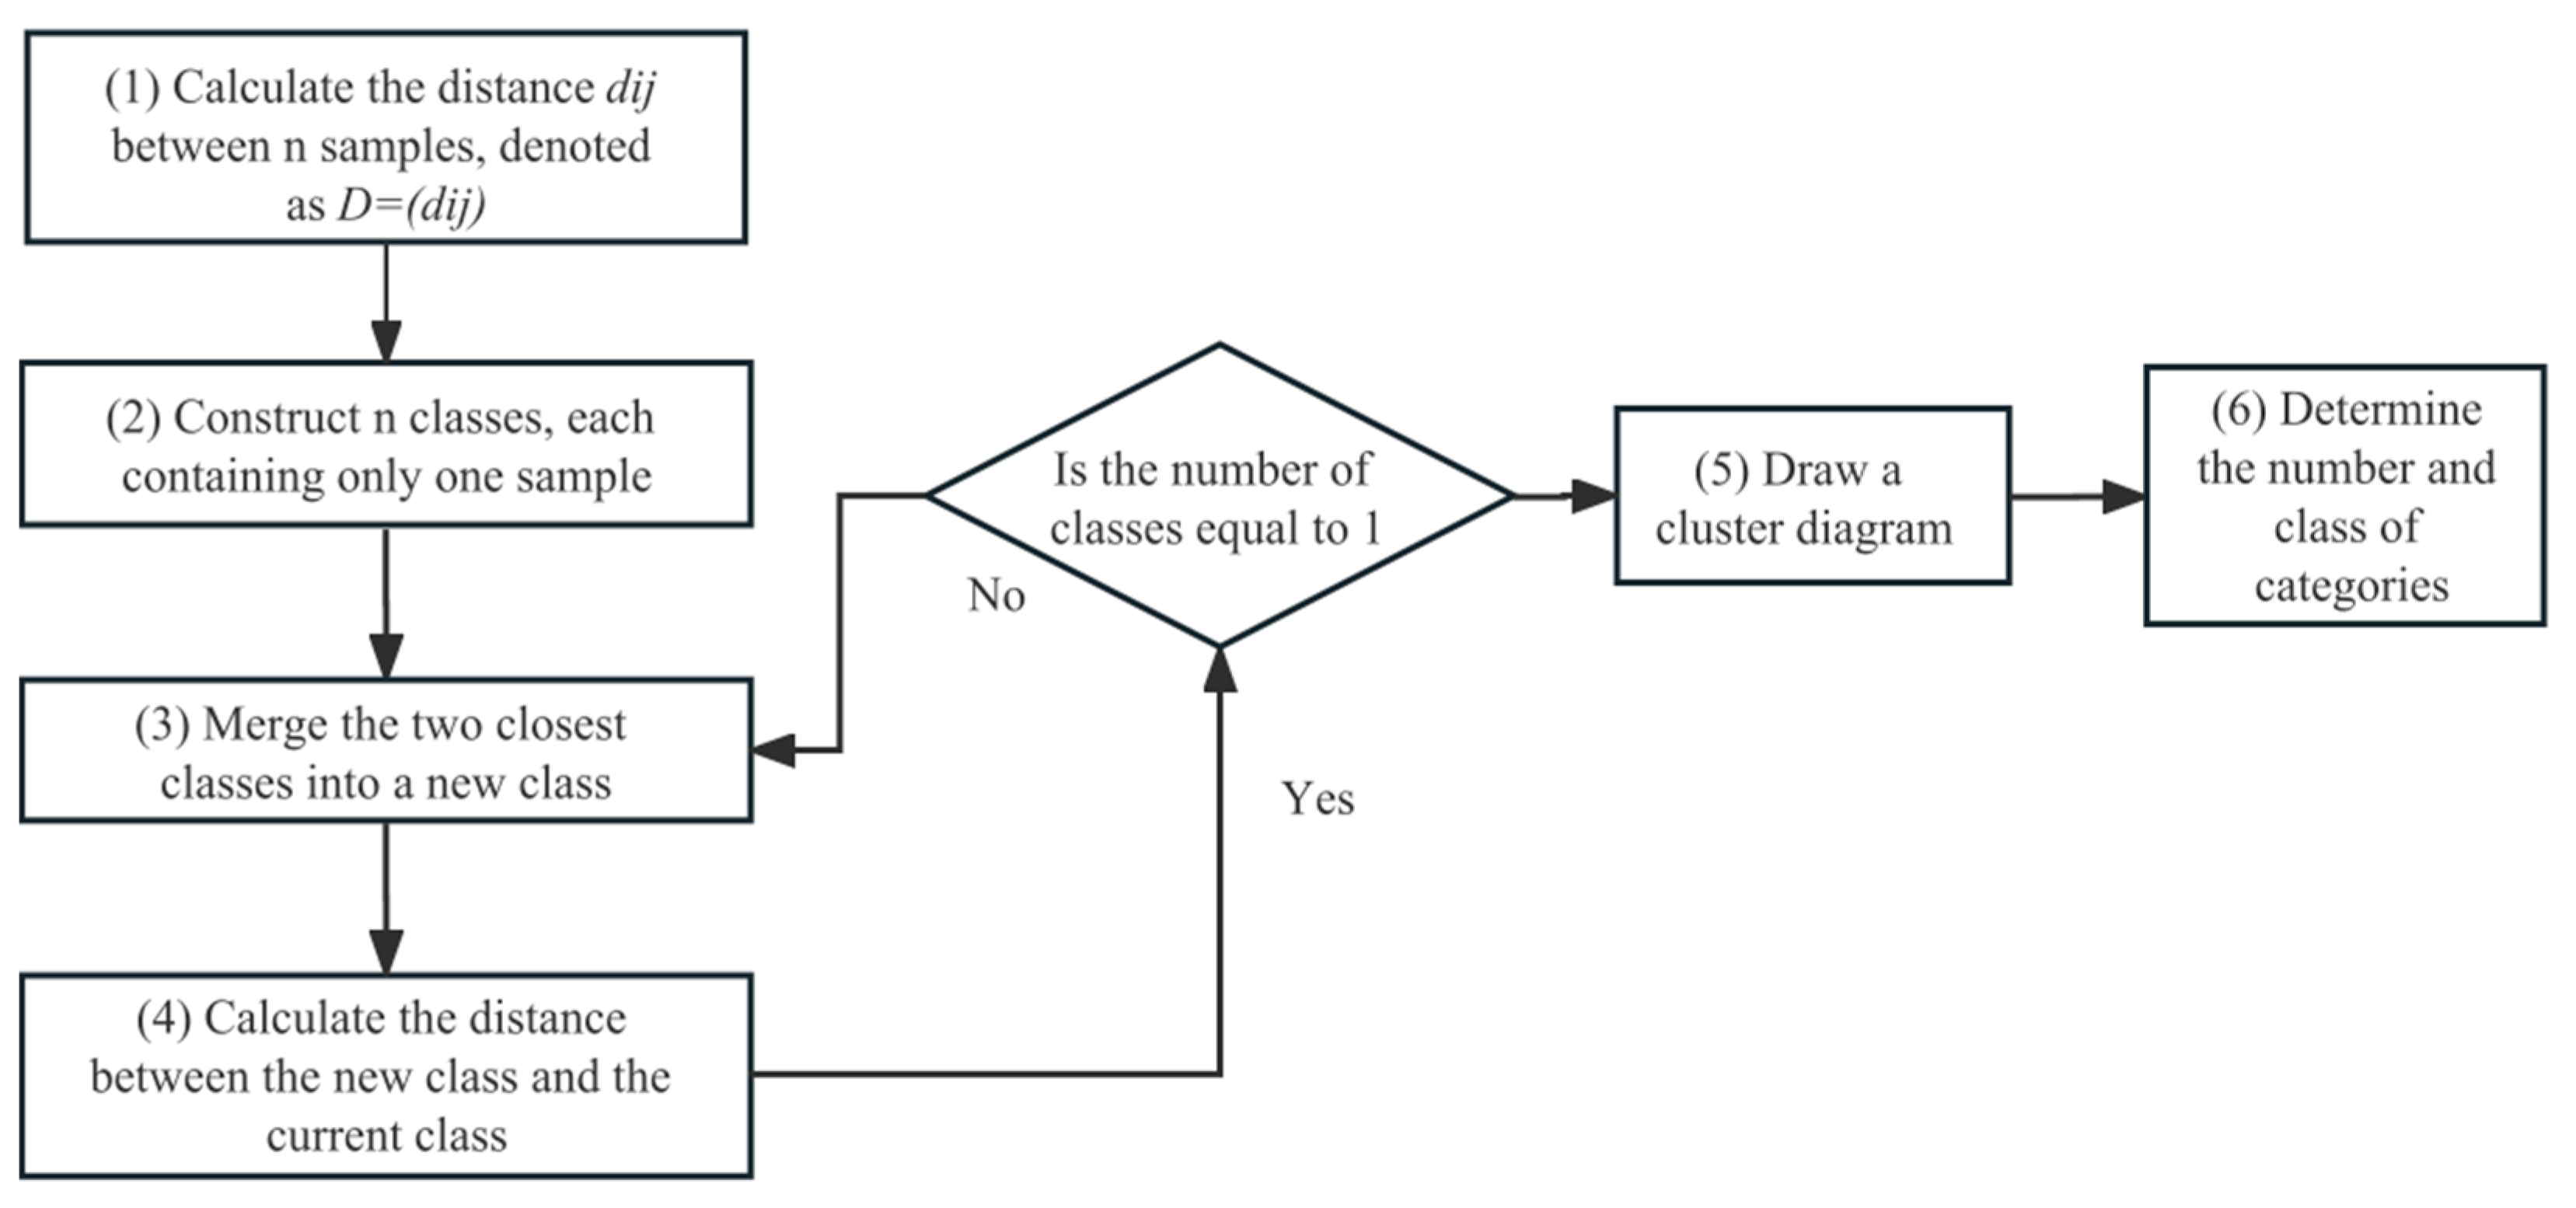
2.1. Systematic Clustering

When conducting satisfaction studies, the data on satisfaction impact factors involved are often large in size [27]. In this case, systematic clustering is able to group similar influence factors into the same category, thereby effectively reducing the dimensionality of the data and transforming complex, high-dimensional data into relatively low-dimensional representations [28].
In this way, systematic clustering helps to retain key information while reducing data redundancy, making data processing more efficient and also providing more valuable information in the analysis and decision-making stages, thus enhancing the depth and usefulness of the study. So in this paper, one dimensionality reduction is achieved through systematic clustering.
The basic idea is to divide the sample into different classes and merge the two classes that are closest to each other. After each merger, the distance between classes should be recomputed, and this process continues to merge until all samples are grouped into one category. Finally, these merged classes can be presented in a systematic clustering diagram [29].
The systematic clustering method process is shown in Figure 1.

2.2. Exploratory Factor Analysis (EFA)
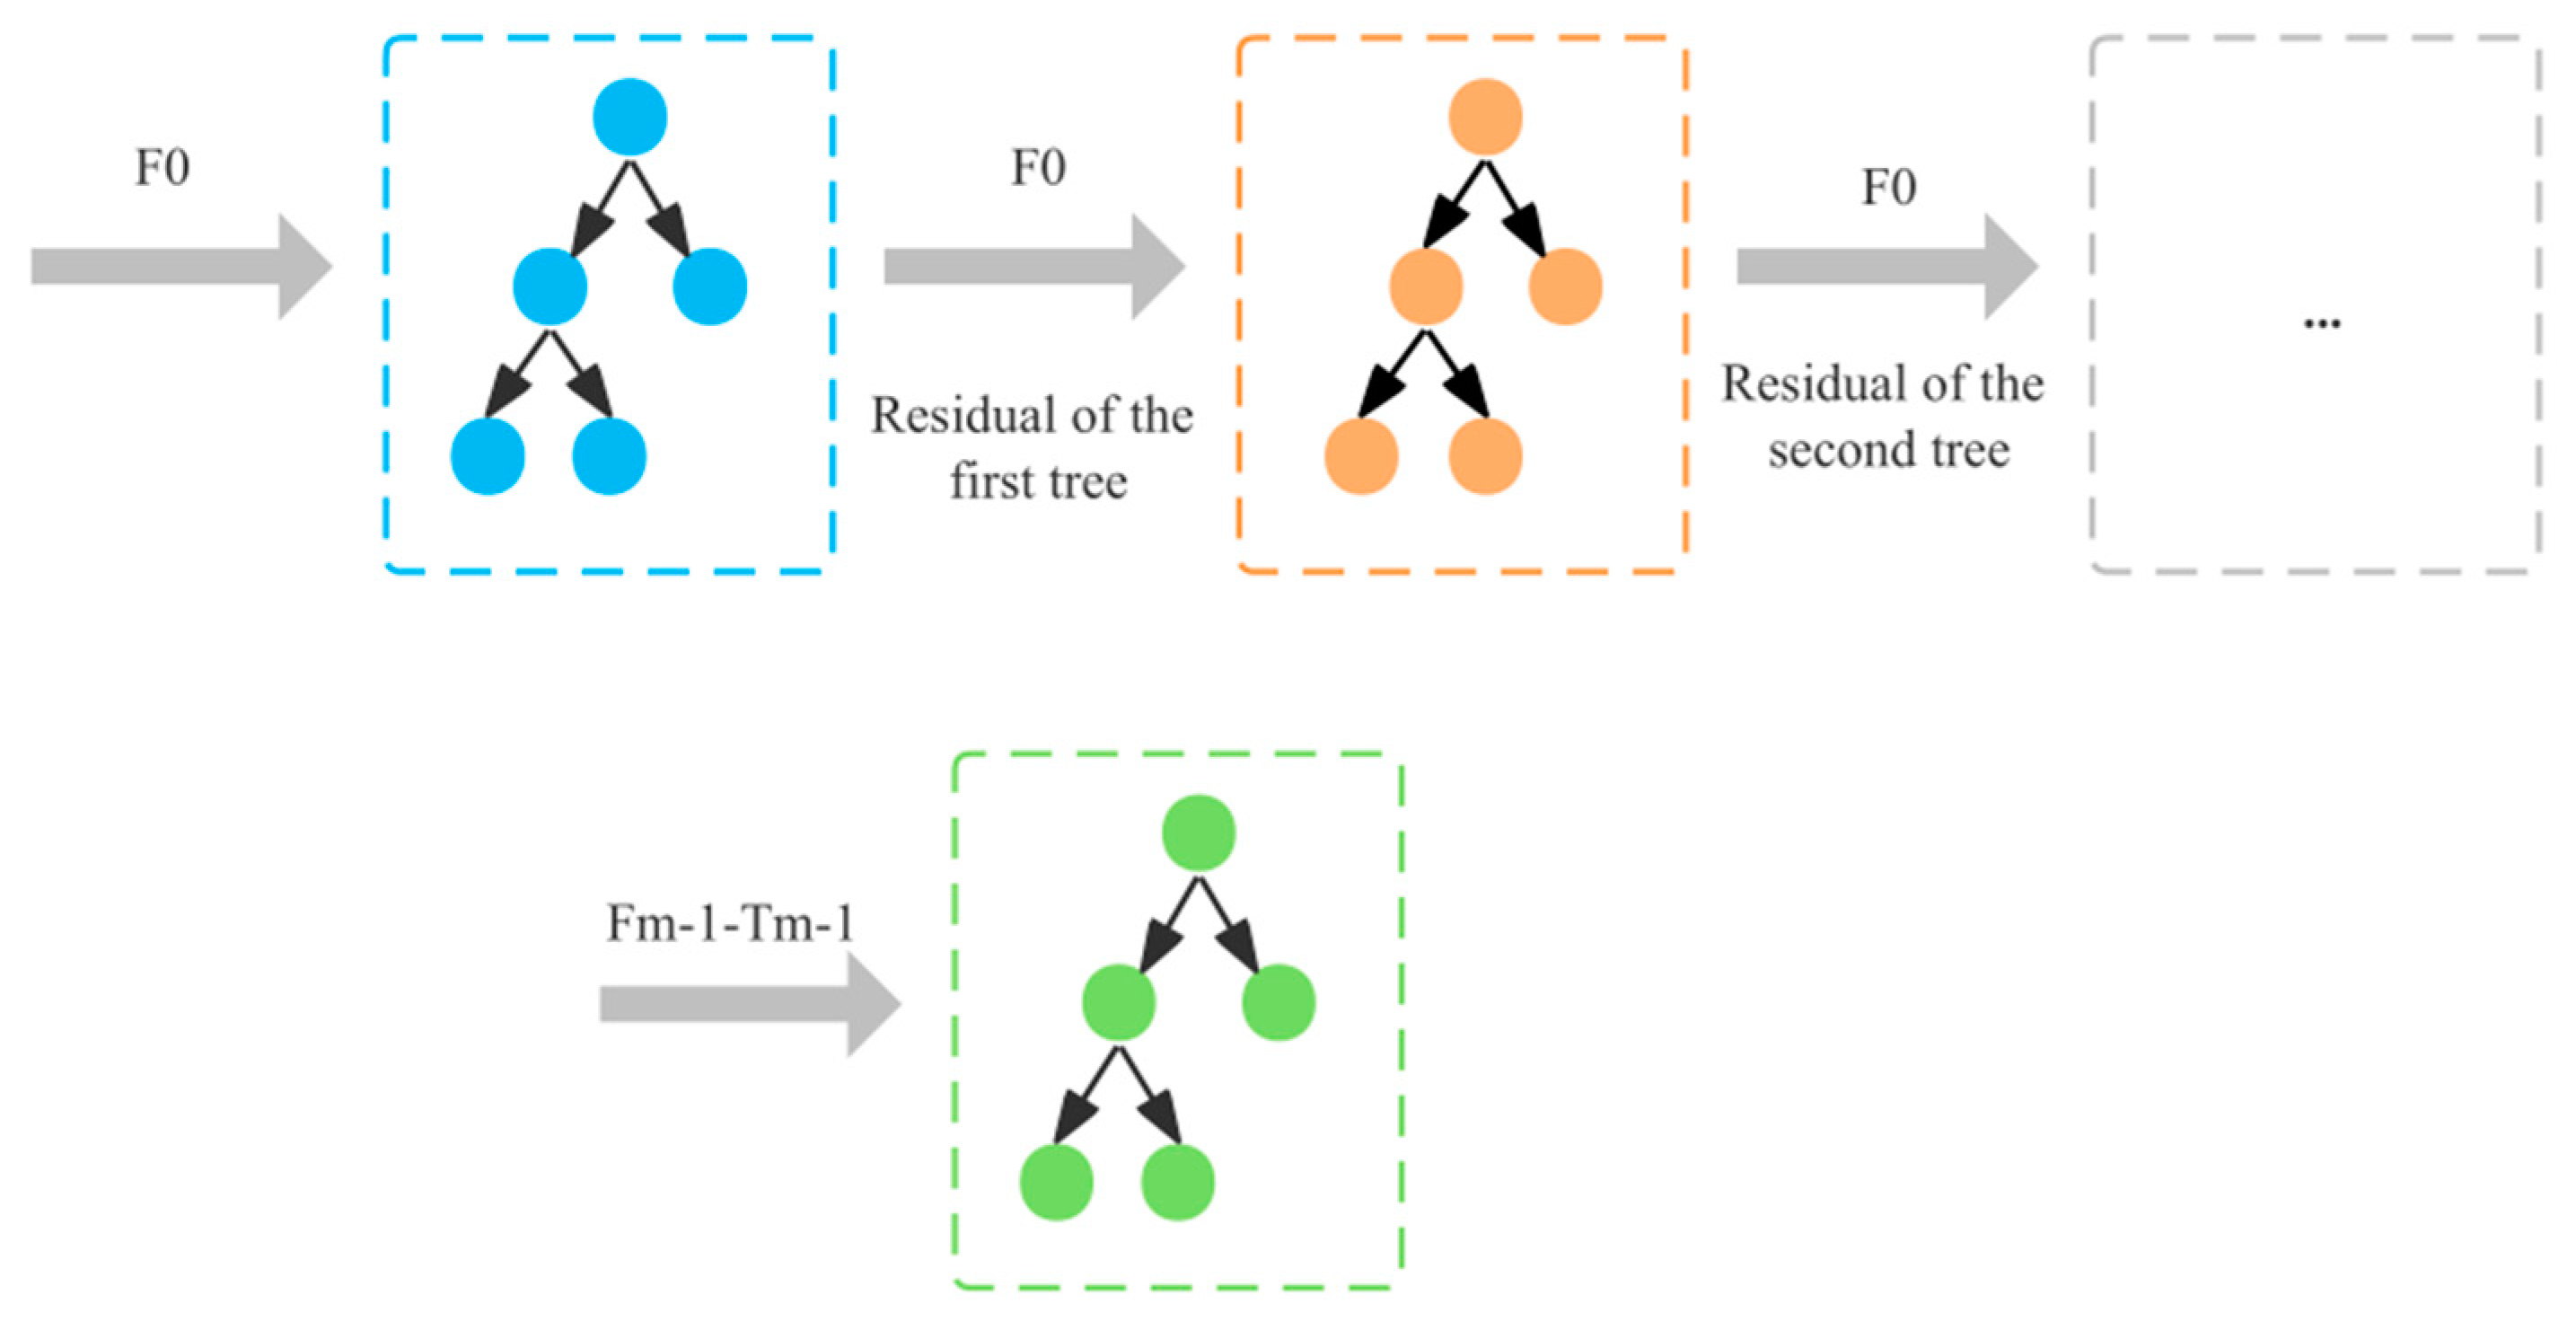
After systematic clustering, although it helps to reduce dimensionality, there may still be a large number of influencing factors, making further targeted improvements difficult. In such cases, dimensionality reduction is achieved using a secondary dimensionality reduction method, exploratory factor analysis [30]. It can help to further extract potential factors and to better understand the potential relationships between influencing factors, thus providing more targeted guidance for improving and optimizing products and services.
Factor analysis is a statistical method designed to simplify complex data structures, reduce the number of variables and preserve the intrinsic connections of the original data [31]. Specifically, it aggregates multiple variables into a few unique shared factors that reflect the main characteristics of the original variables and the intrinsic links between them. Exploratory factor analysis focuses on determining the number of factors affecting the observed variables and their correlation with the variables [30]:
Step 1: Standardize the data by using the Z-Score method, which uses the standard deviation as a yardstick to measure how far a raw score deviates from the mean in order to determine where it falls within the overall data.
Step 2: Carry out a KMO test and a Bartlett test.
Step 3: Calculate the eigenvalues of the sample correlation matrix and the total variance dilution and determine the principal factor by the cumulative variance dilution.
Step 4: Calculate the factor component matrix and weights and filter the core influence factors according to the weights.

2.3. GBDT Algorithm

After secondary dimensionality reduction, the choice of applying the gradient-boosted decision tree (GBDT) algorithm for prediction is due to several advantages. As a powerful machine learning algorithm [32], GBDT effectively improves the accuracy of prediction by iteratively training multiple decision tree models. Its feature importance evaluation capability identifies key influencing factors, and its robustness and generalization capabilities ensure the stability and generalization performance of the model in real data. In addition, GBDT is applicable to complex non-linear relationships, and its wide range of applications in different fields enhances its usefulness. Therefore, in the context of dealing with large-scale satisfaction data, prediction by GBDT can support analysis with high accuracy, an in-depth understanding of key influencing factors and guidance for decision making.
GBDT is a kind of tree-based boosting model [33] based on the idea of integrated learning. It employs a sequential technique, where each iteration selects a weak learner. In this process, a new decision tree is constructed in the direction of the gradient of the residuals of the reduced residuals. The joint decision making is then executed by a group of associated decision trees [34]. The principle is shown in Figure 2.
The GBDT model parameters mainly include the number of iterations (number of trees), learning rate and loss function [35]. Then, x i is defined as the sample value, K is the total number of trees, and f k is the kth tree, where y i is the prediction result of the x i and can be expressed as
y i ^ = k = 1 K f k ( x i )
The prediction model follows the forward-distributed addition method, which generates a new regression tree at each iteration, and the new tree will continuously fit the residuals of the previous tree, constantly repairing the previous experimental results, so as to construct a learning model with a higher accuracy rate. The strategy is as follows.
y i ^ ( t ) = k 1 t f t ( x i ) = y i ^ ( t 1 ) + f t ( x i )
where t is the combined t-tree, y i ^ ( t ) is the prediction of the combined t-tree model for the sample of x i , y i ^ ( t 1 ) is the prediction of the combined (t − 1)-tree model for the sample of x i , and f t ( x i ) is the estimate of the tth tree model for the current round of losses.
In each iteration of GBDT, the negative gradient of the loss function under the current model is used to fit the loss estimate (i.e., residual estimate) of the current round [36]. In this way, the loss function can be reduced as fast as possible in each round of training and converge to the local or global optimal solution as soon as possible [37]. And r t i is a negative gradient of the loss function for the ith sample in round t that can be determined by
r t i = | l ( y i , y i ^ ) y i ^ | f ( x ) = f i 1 ( x i )
The C i j is the best-fit value that minimizes the loss function at each leaf node, r t i is summed, and f t ( X i ) is the tth tree model’s estimate of the current round’s loss that can be expressed as
f t ( x i ) = j = 1 j c i j I ( x i R i j )

3. Establishment of Core Indicator System

3.1. Initial Indicator System

This research takes China Mobile voice service scoring data as an example to establish the initial index system. The data samples are shown in Table 1.

3.1.1. Data Cleaning

A number of indicators that could not be quantified and those with missing values greater than 5% were eliminated, resulting in an initial screening of 42 evaluation indicators.
1.
Quantitative processing of data
The qualitative data were quantified by finding relevant information on the internet and combining it with subjective judgment, as shown below.
Whether encountered network problems (yes → 1, not → −1)
4/5G User (2G → 2, 4G → 4, 5G → 5)
Phonetic method (VONR → 6, EPSFB → 5(5G))
(VOLTF → 4, CSFB → 3(4G), GSB → 2(2G))
Whether to care for the user (not → −1, yes → 1)
Whether or not the user is a real – name registered user (not → −1, yes → 1)
Client star rating logo (unrated → −1, semi – starred → 0)
(one–starred → 1, two–starred → 2, three–starred → 3)
(Sliver card → 4, Gold card → 5, Platinum card → 6, Diamond card → 7)
2.
Empty value processing
The null values of the indicators after the initial screening were removed because they accounted for less than 5% of the data.
3.
Outlier handling
The Outbound Traffic Percentage indicator contained two “#DIV/0” outliers, which were deleted.

3.1.2. Systematic Clustering

In this paper, the systematic clustering method was used to classify the 41 indicators initially screened to achieve the secondary screening of the initial indicators.
In this paper, the clustering of the preliminary screening indicators was realized by using IBM SPSS Statistics 26 software, and the indicators were classified into five categories, namely, very important, relatively important, generally important, not too important and unimportant.
Principle implementation: Forty-one samples were divided into five classes, each sample was a class of its own, and then each time the two classes with the smallest distance were merged and after the merger, the distance between classes was recalculated, and this process continued until all the samples were grouped into one class. This process was drawn into a cluster diagram, which can be easily classified with reference to the cluster diagram.
In this paper, SPSS was parameterized as follows: Since the indicators were grouped into five categories and the range of the clustering scheme was set to 5, the clustering method used intergroup linkage, which is capable of handling large-scale datasets and different types of data, i.e., the interclass distance is the average of the squared Euclidean distances between two data points in two classes and is normalized using the Z-Score. Icicle plots were obtained as shown in Figure 3.
The figure above shows the cluster analysis, with the horizontal coordinate being the name of the indicator and the vertical coordinate being the number of divisible categories. Each sample name corresponds to a blue long bar, and each sample long bar has the same length. There is also a blue long bar sandwiched between every two sample long bars, the length of which indicates the similarity of the two samples. The icicle diagram should be analyzed from the lowest end, with the classes separated from each other by a white gap. If there is no white gap between two indicators, it means that these two indicators are one class. The clustering results obtained are shown in Table 2.
Among them, the first category is very important, containing 25 indicators; the second category is relatively important, containing one indicator on whether or not network problems have been encountered; the third category is of general importance, containing one indicator on the number of times of disconnection from the network; the fourth category is of less importance, containing three indicators on complaints about tariffs, whether or not to care for the users and complaints about home broadband; and the fifth category is of little importance, containing 11 indicators.
After systematic clustering analysis, this paper carries out preliminary clustering for the initial screening of indicators for voice service user ratings and analyzes the clustering results obtained from Figure 3 and SPSS, retaining the indicators of the three classes of very important, relatively important and generally important, i.e., retaining the 28 core indicators, as shown in Table 3.

3.2. Core Indicator System

As the indicators identified above are still on the high side, it may lead to redundant information and an increase in the complexity of the analysis. Therefore, this paper uses exploratory factor analysis to recombine the original core indicators into a new set of mutually unrelated composite indicators to replace the original core indicators. The specific implementation is shown below:
1.
Standardizing the data. In this paper, the data are standardized using the Z-Score method, which uses the standard deviation as a ruler to measure the distance that a particular raw score deviates from the mean, which contains a few standard deviations and Z-Scores. Thus, the position of these data in the whole data is determined. Z is determined as
Z = X X S
where X is the raw data, X is the mean, and S is the standard deviation.
2.
The KMO test and Bartlett’s test are performed, and the standardized data are brought through the SPSSPRO platform to determine whether factor analysis could be performed. The results of the tests are represented in Table 4.
The results of the KMO test show that the value of KMO is 0.807. Meanwhile, the results of Bartlett’s spherical test show that the significance p-value is 0.0002 < 0.05, which shows significance at the level, rejecting the original hypothesis that there is a correlation between the variables and that the factor analysis is valid to the extent of suitability.
3.
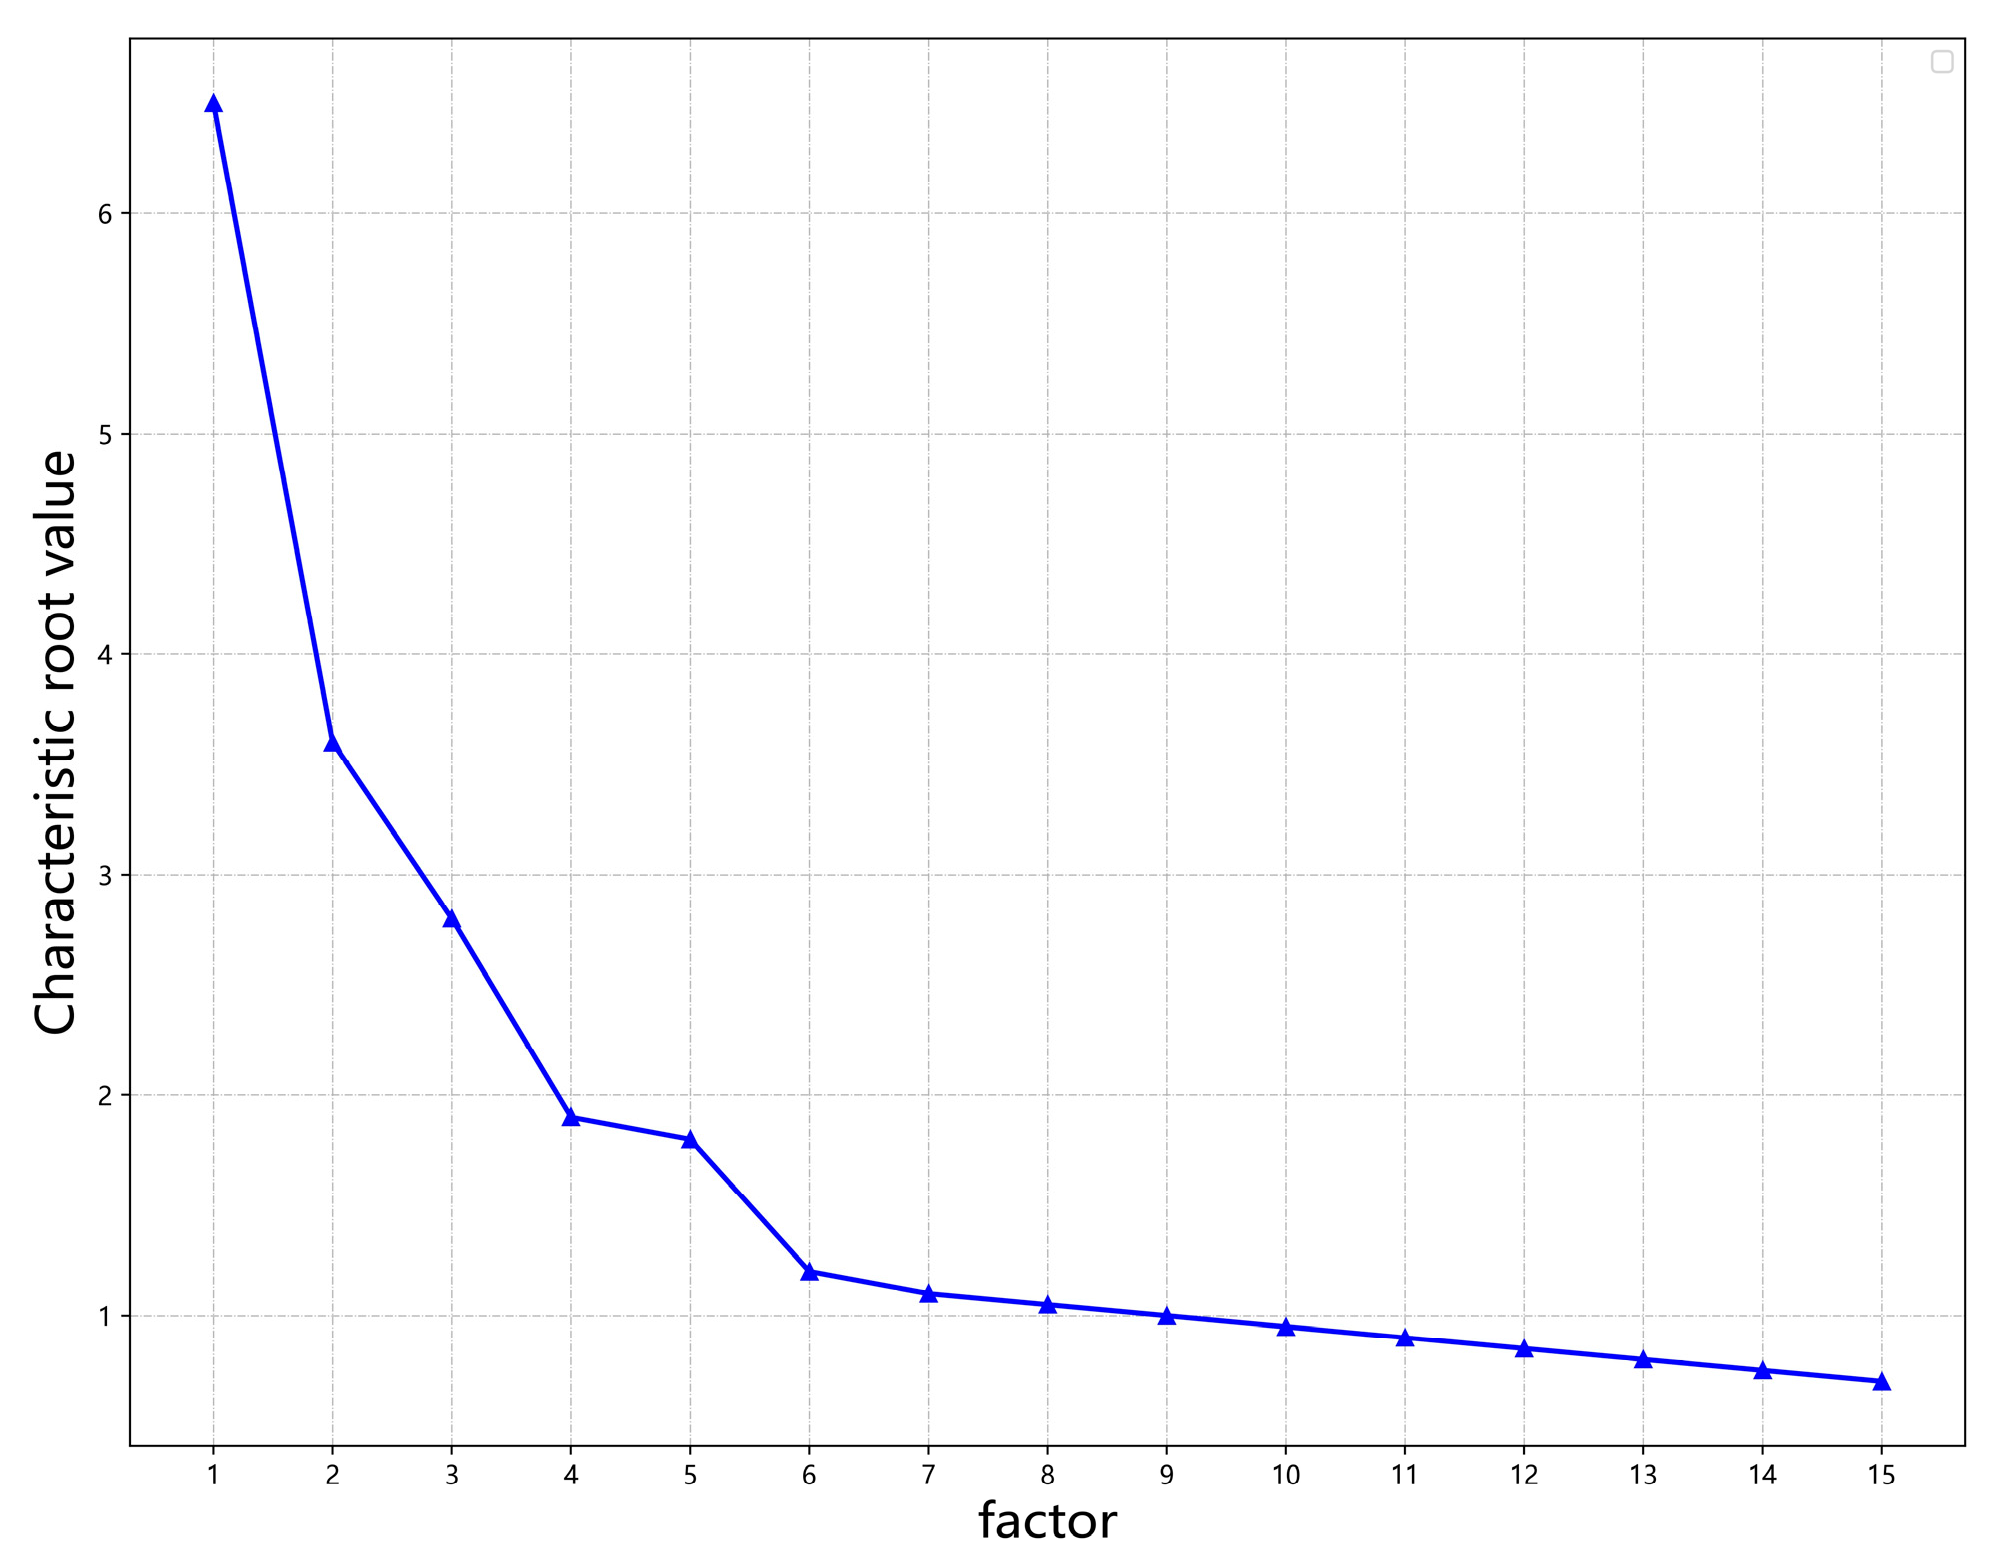
Determining the number of principal factors.
Firstly, the sample covariance matrix with some elements is calculated. Then, n is defined as sample size, z i k is zero centralization of z i , z i k is zero centralization of z j , and s i j is the value of the sample covariance matrix and can be expressed as
s i j = 1 n 1 k = 1 n z i k z j k
The eigenvalue decomposition of the sample covariance matrix S is performed to obtain p eigenvalues λ 1 λ 2 λ n . The corresponding eigenvalue vector is r 1 , r 2 r n , and the eigenvectors of the first m largest eigenvalues can be taken to estimate the factor loading matrix. Meanwhile, to ensure the variance of each component of the common factor vector 1, it needs to be divided by the corresponding standard deviation λ i . The corresponding eigenvector r j in the factor loading matrix is then multiplied by λ i . Thus, the factor loading matrix A ^ can be obtained as follows.
A ^ = λ 1 r 1 , λ 2 r 2 , · · · , λ m r m
where the parameter m is determined by the cumulative variance contribution of the common factor.
m = a r g m i n ( i = 1 m λ i i = 1 p λ i ) r
It is generally believed that, for the data obtained from the questionnaire survey, when the cumulative variance contribution ratio of the first m public factors exceeds 70% [38], it can be considered that the linear combination of the first m public factors can essentially restore the original variable information. The eigenvalues and total variance interpretations are obtained as shown in Table 5.
4.
The elbow rule corrects the model
The elbow rule [39] is a graphical approximation of the optimal number of clusters. The coefficients from the concentration plan in the SPSS output document are applied, and after the coefficients need to be sorted, Excel is used to generate a gravel-like image as shown in Figure 4.
In Table 5, at principal component 8, the characteristic root of total variance explained is just >1.0, and the contribution rate of variable explanation reaches 75.761%, because the cumulative variance dilution rate of the questionnaire is relatively low, and it is already better to reach more than 70%. Combined with Figure 4, when the fold line is suddenly becoming smooth from steep, the number of principal factors corresponding to the steepness and smoothness is the number of references extracted principal components. Therefore, the number of principal factors is taken as 8.
5.
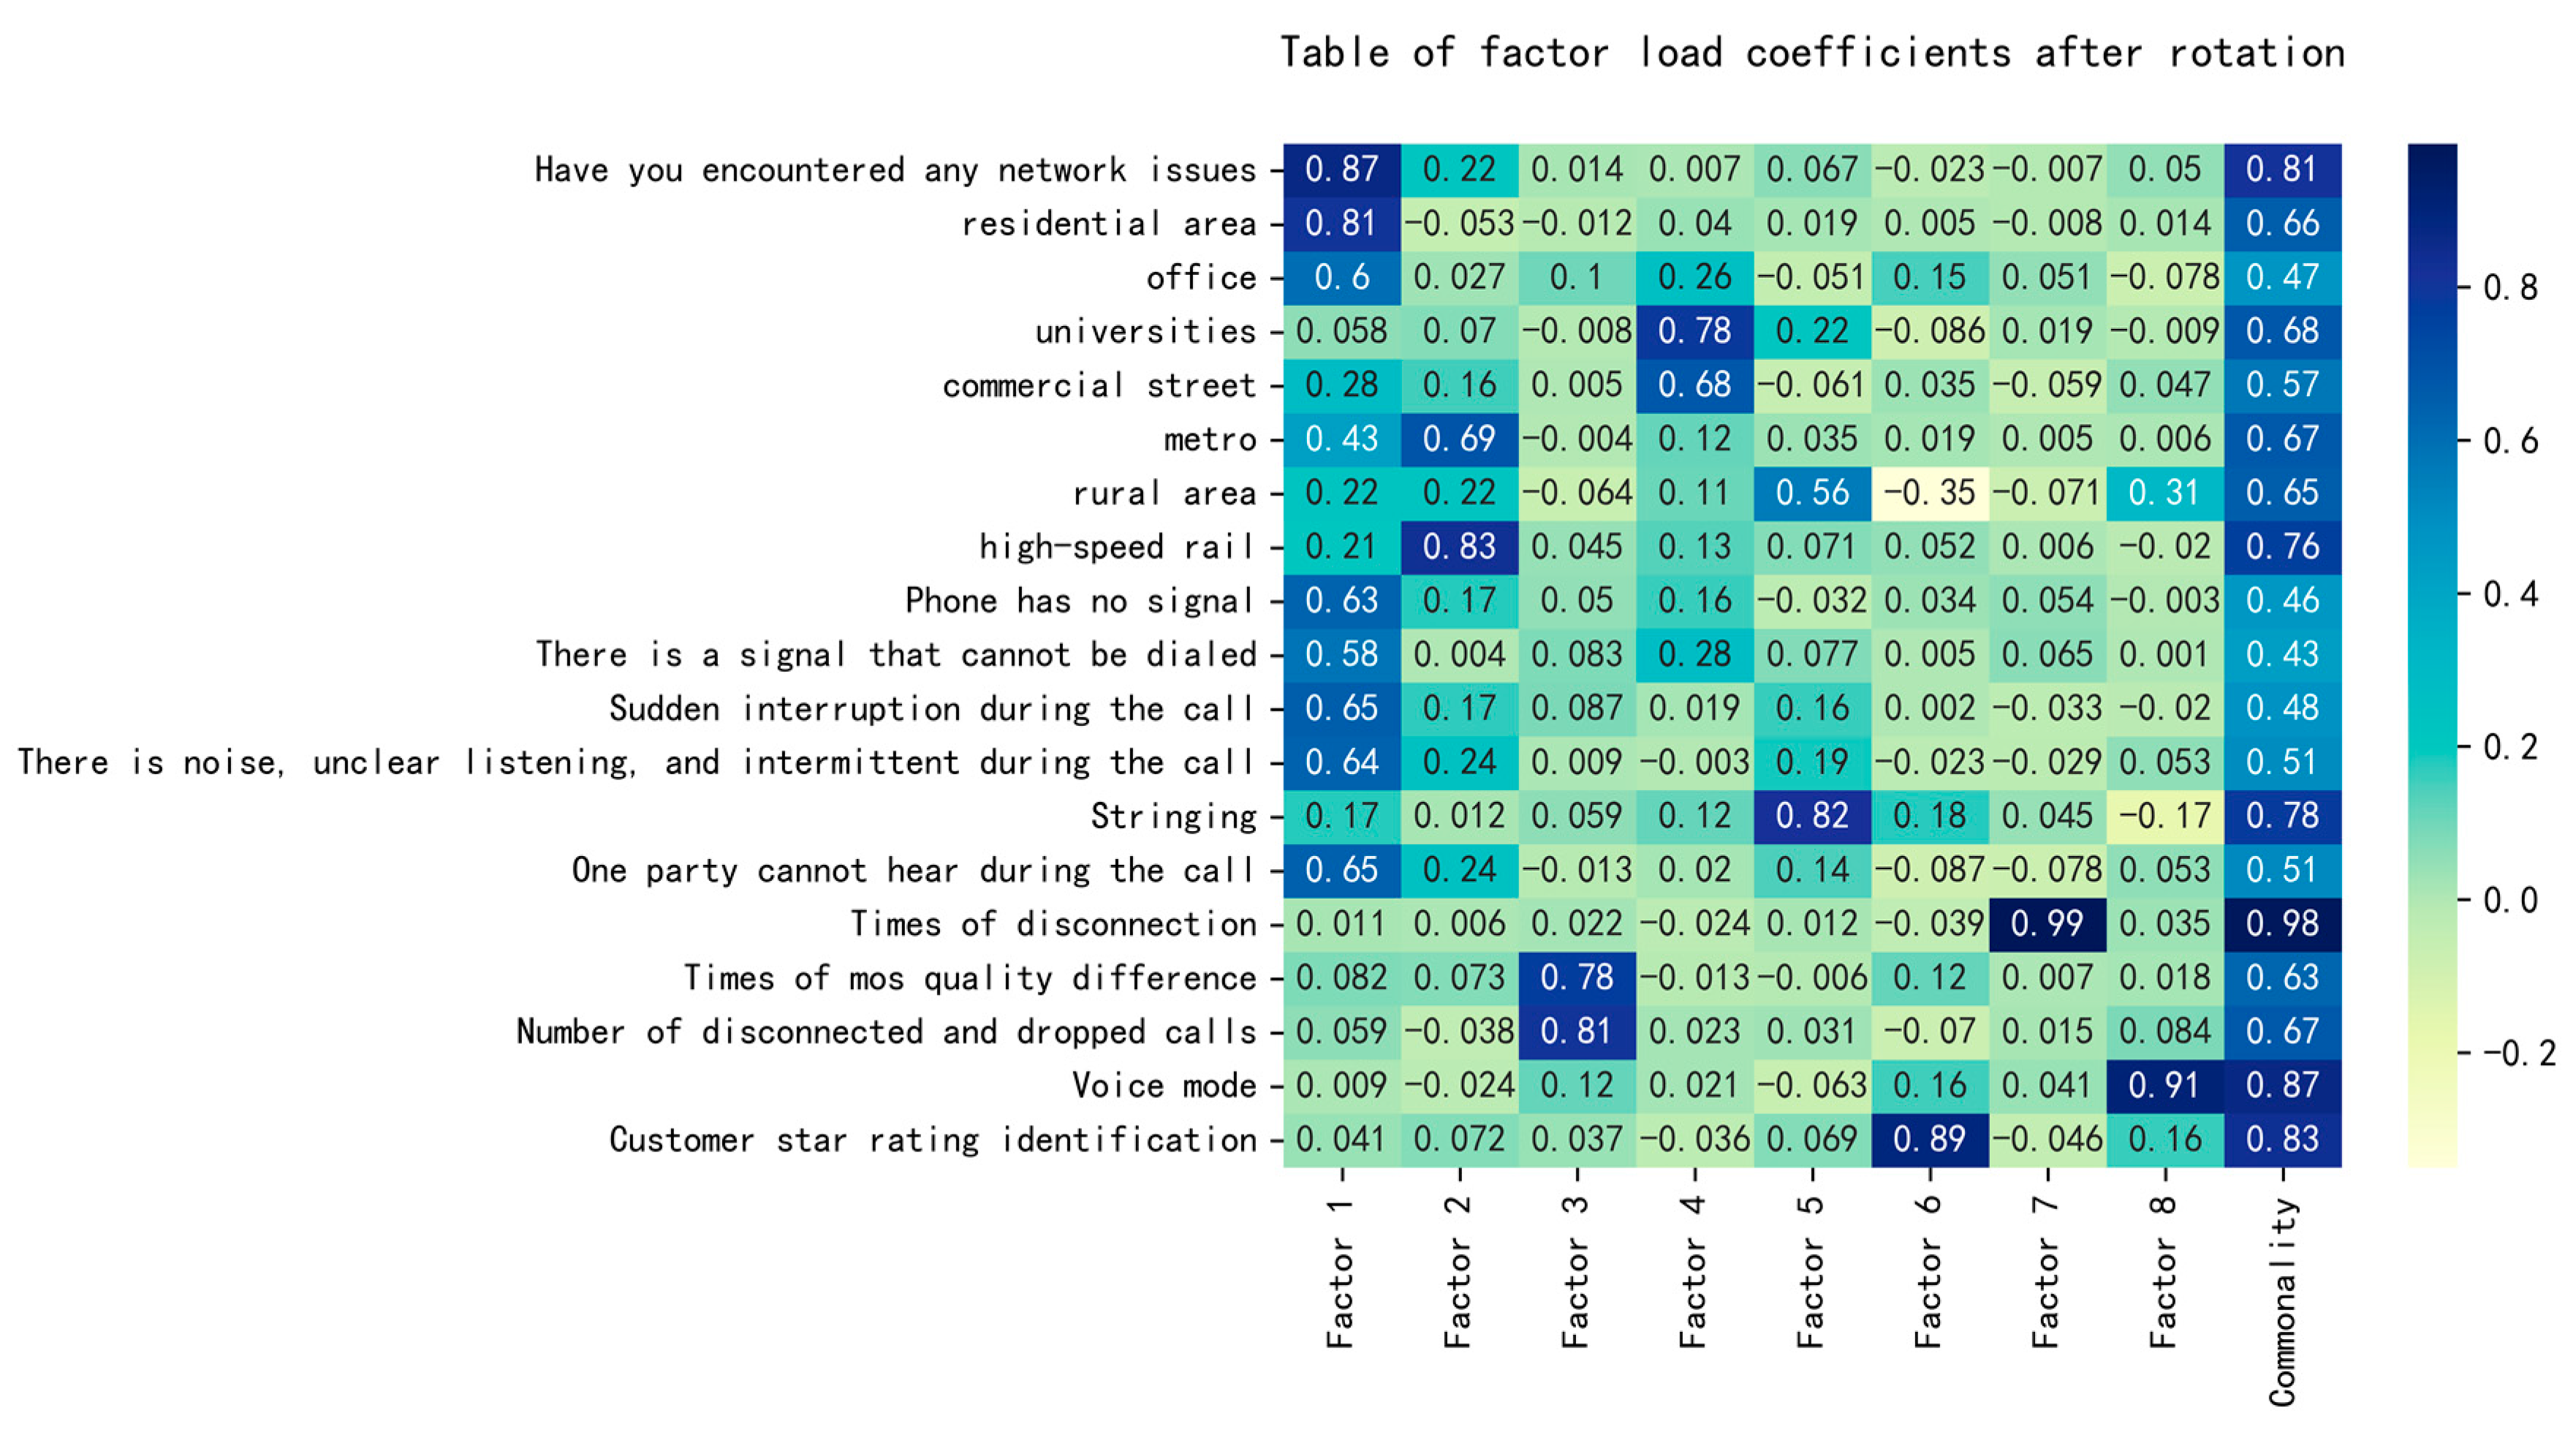
Naming factor loading coefficients
The factors are named by the factor loading coefficients, and the resulting heat map of the factor loading coefficients is shown in Figure 5.
Factor 1 is more relevant to whether or not they have encountered network problems and residential district, which can be summarized as the current status of indoor voice problems;
Factor 2 has a greater correlation with underground and high-speed rail, which can be summarized as the current status of traffic voice problems;
Factor 3 has a greater correlation with the number of poor mos quality and the number of dropped calls, which can be summarized as the current situation of voice stability problems;
Factor 4 has a greater correlation with colleges and universities and commercial streets, which can be summarized as the current situation of the problem in densely populated areas;
Factor 5 has a high correlation with the number of crosstalk in calls, which can be summarized as the current status of the voice route independence problem;
Factor 6 has a high correlation with customer volume level identification, which can be summarized as the current status of the voice service level problem;
Factor 7 has a high correlation with the number of times off-network, which can be summarized as the current status of the voice signal stability problem;
Factor 8 has a high correlation with voice mode and can be summarized as the current status of the voice mode problem.
Summarized in Table 6 below.
A pie chart of factor weights is plotted through the factor weights as shown in Figure 6.
The highest weight of factor 1 is obtained, which is 24.952%, i.e., the status quo of indoor speech problems has the greatest influence. The absolute value of the component is taken to be greater than 0.1% as the core influence factor, as shown in Table 7.
Among them, the core influences with an absolute value of factor 1 components greater than 0.1% can be improved to increase user satisfaction.

4. GBDT Algorithm Predicts User Satisfaction

4.1. Data Re-Cleaning

In the core influences of factor 1 in Table 7, this study found that users who scored high in voice services had the following characteristics: they did not experience network problems, they did not live in a residential district or near subways, they did not experience events such as a lack of signal on their mobile phones, sudden interruptions in the call process, noises during the call, and one party not being heard during the call, whereas users who scored low had the opposite characteristics.
Through the high and low scoring of customer characteristics to filter out the data with the characteristics of the opposite scoring as unreasonable data, the unreasonable data were eliminated to further improve the prediction accuracy.
In this study, the scoring was categorized into three intervals, where 1–3 was taken as a low score, 4–7 as a medium score and 8–10 as a high score.
Filtering was performed through Excel, and the ratings of users with high scores for these seven core influences were taken as unreasonable ratings. The data corresponding to unreasonable users were removed from the 28 core indicators established by the system clustering, and the remaining reasonableness data were used as data for subsequent prediction.

4.2. GBDT Algorithm Prediction

The sampling proportion takes the value of (0, 1], and subsampling is no put-back sampling. Choosing a proportion less than 1 reduces the variance, i.e., prevents overfitting, but increases the bias of the sample fit, so the value should not be too low and is recommended to be between [0.5, 0.8], where 0.8 was chosen as the sampling proportion in this study.
The solution was performed through SPSSPRO with the following parameter settings for the gradient-boosted tree model, as shown in Table 8.
Incorporating the y data into the prediction gives the model evaluation shown in Table 9.
The smaller the values of MSE, RMSE, MAE and MAPE, the higher the accuracy, and the closer R2 is to 1, the higher the accuracy.
Prediction through SPSSPRO found that the predicted value will be less than 1 with more than 10 cases. This paper used less than 1 for 1 and more than 10 for 10 for the assignment process, and the predicted value was not an integer, the predicted value of the rounding process to the whole.
The predicted value was obtained using SPSSPRO, its prediction accuracy was 99.96% as obtained using MATLAB, and combined with the results of the above table for analysis, it was concluded that the model prediction is reasonable, the prediction accuracy is high, and the data fitting is excellent.

5. Conclusions and Future Work

In this study, the evaluation index system of the customer satisfaction scoring of China Mobile was established through the combination of systematic clustering and exploratory factor analysis; after 28 core indicators were screened out by systematic clustering to avoid redundancy of information, 8 core factors were identified by exploratory factor analysis; on this basis, the GBDT algorithm was applied to predict the customer satisfaction scoring. The conclusions are as follows:
(1)
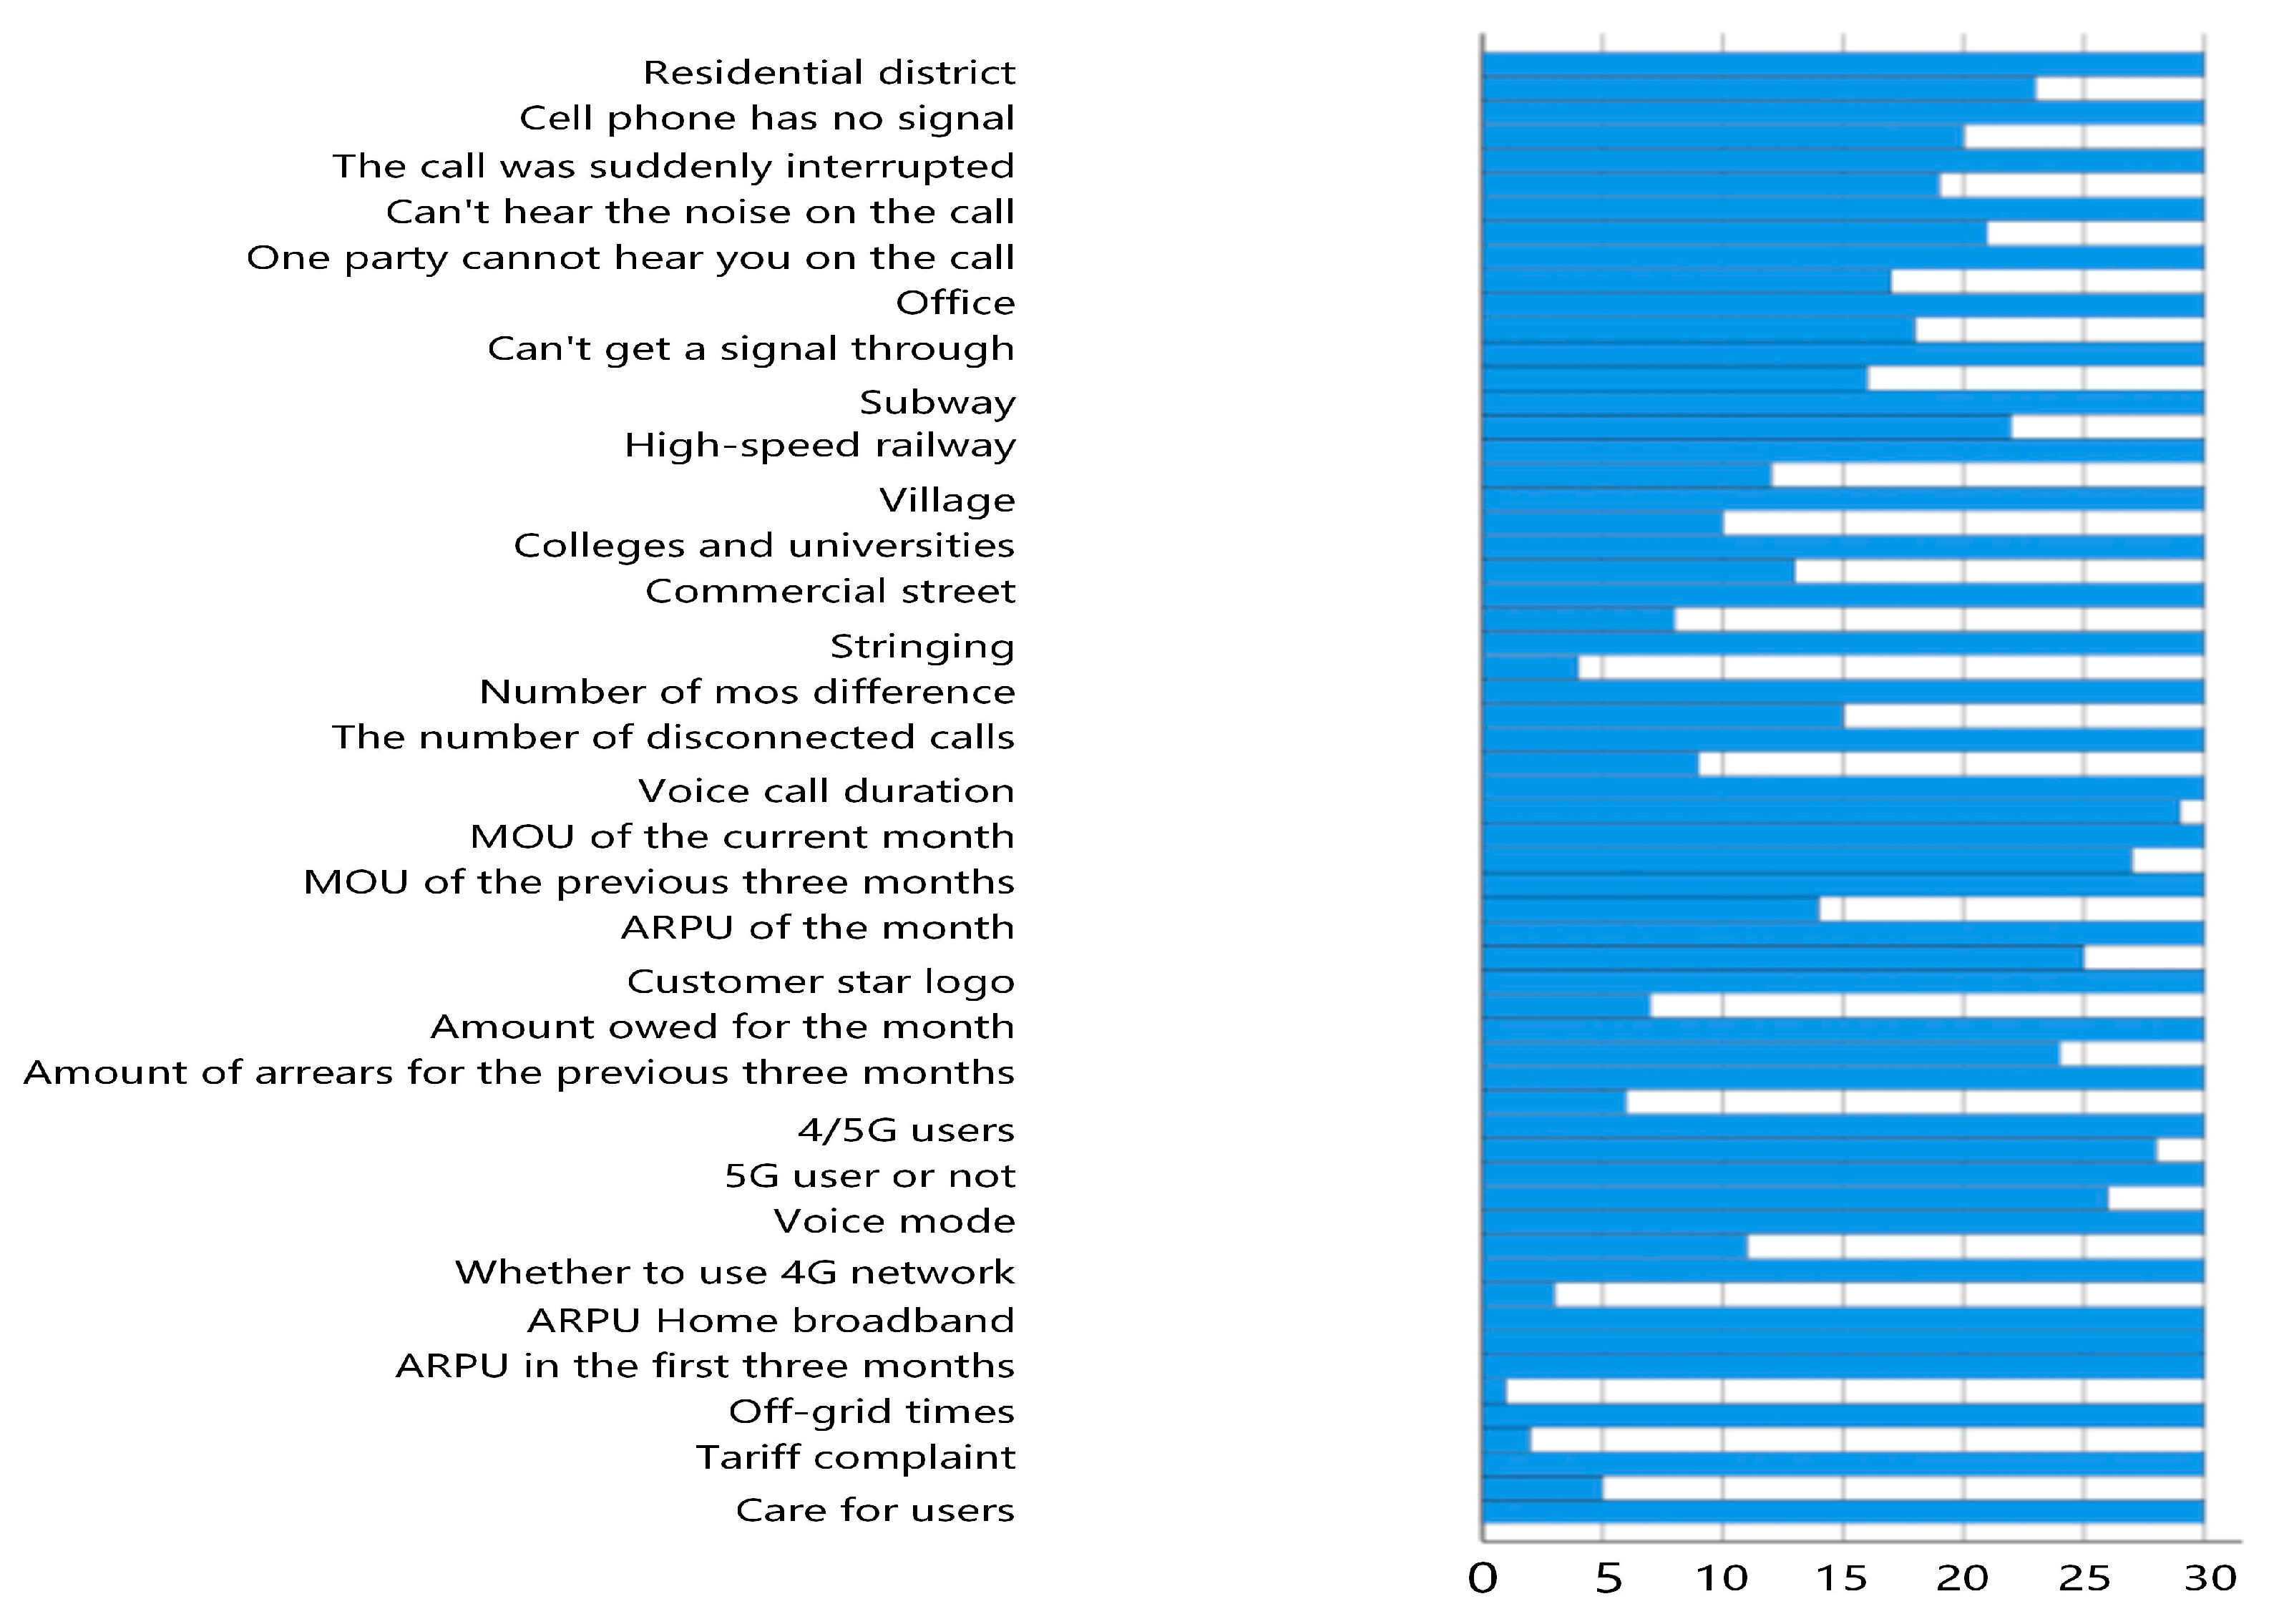
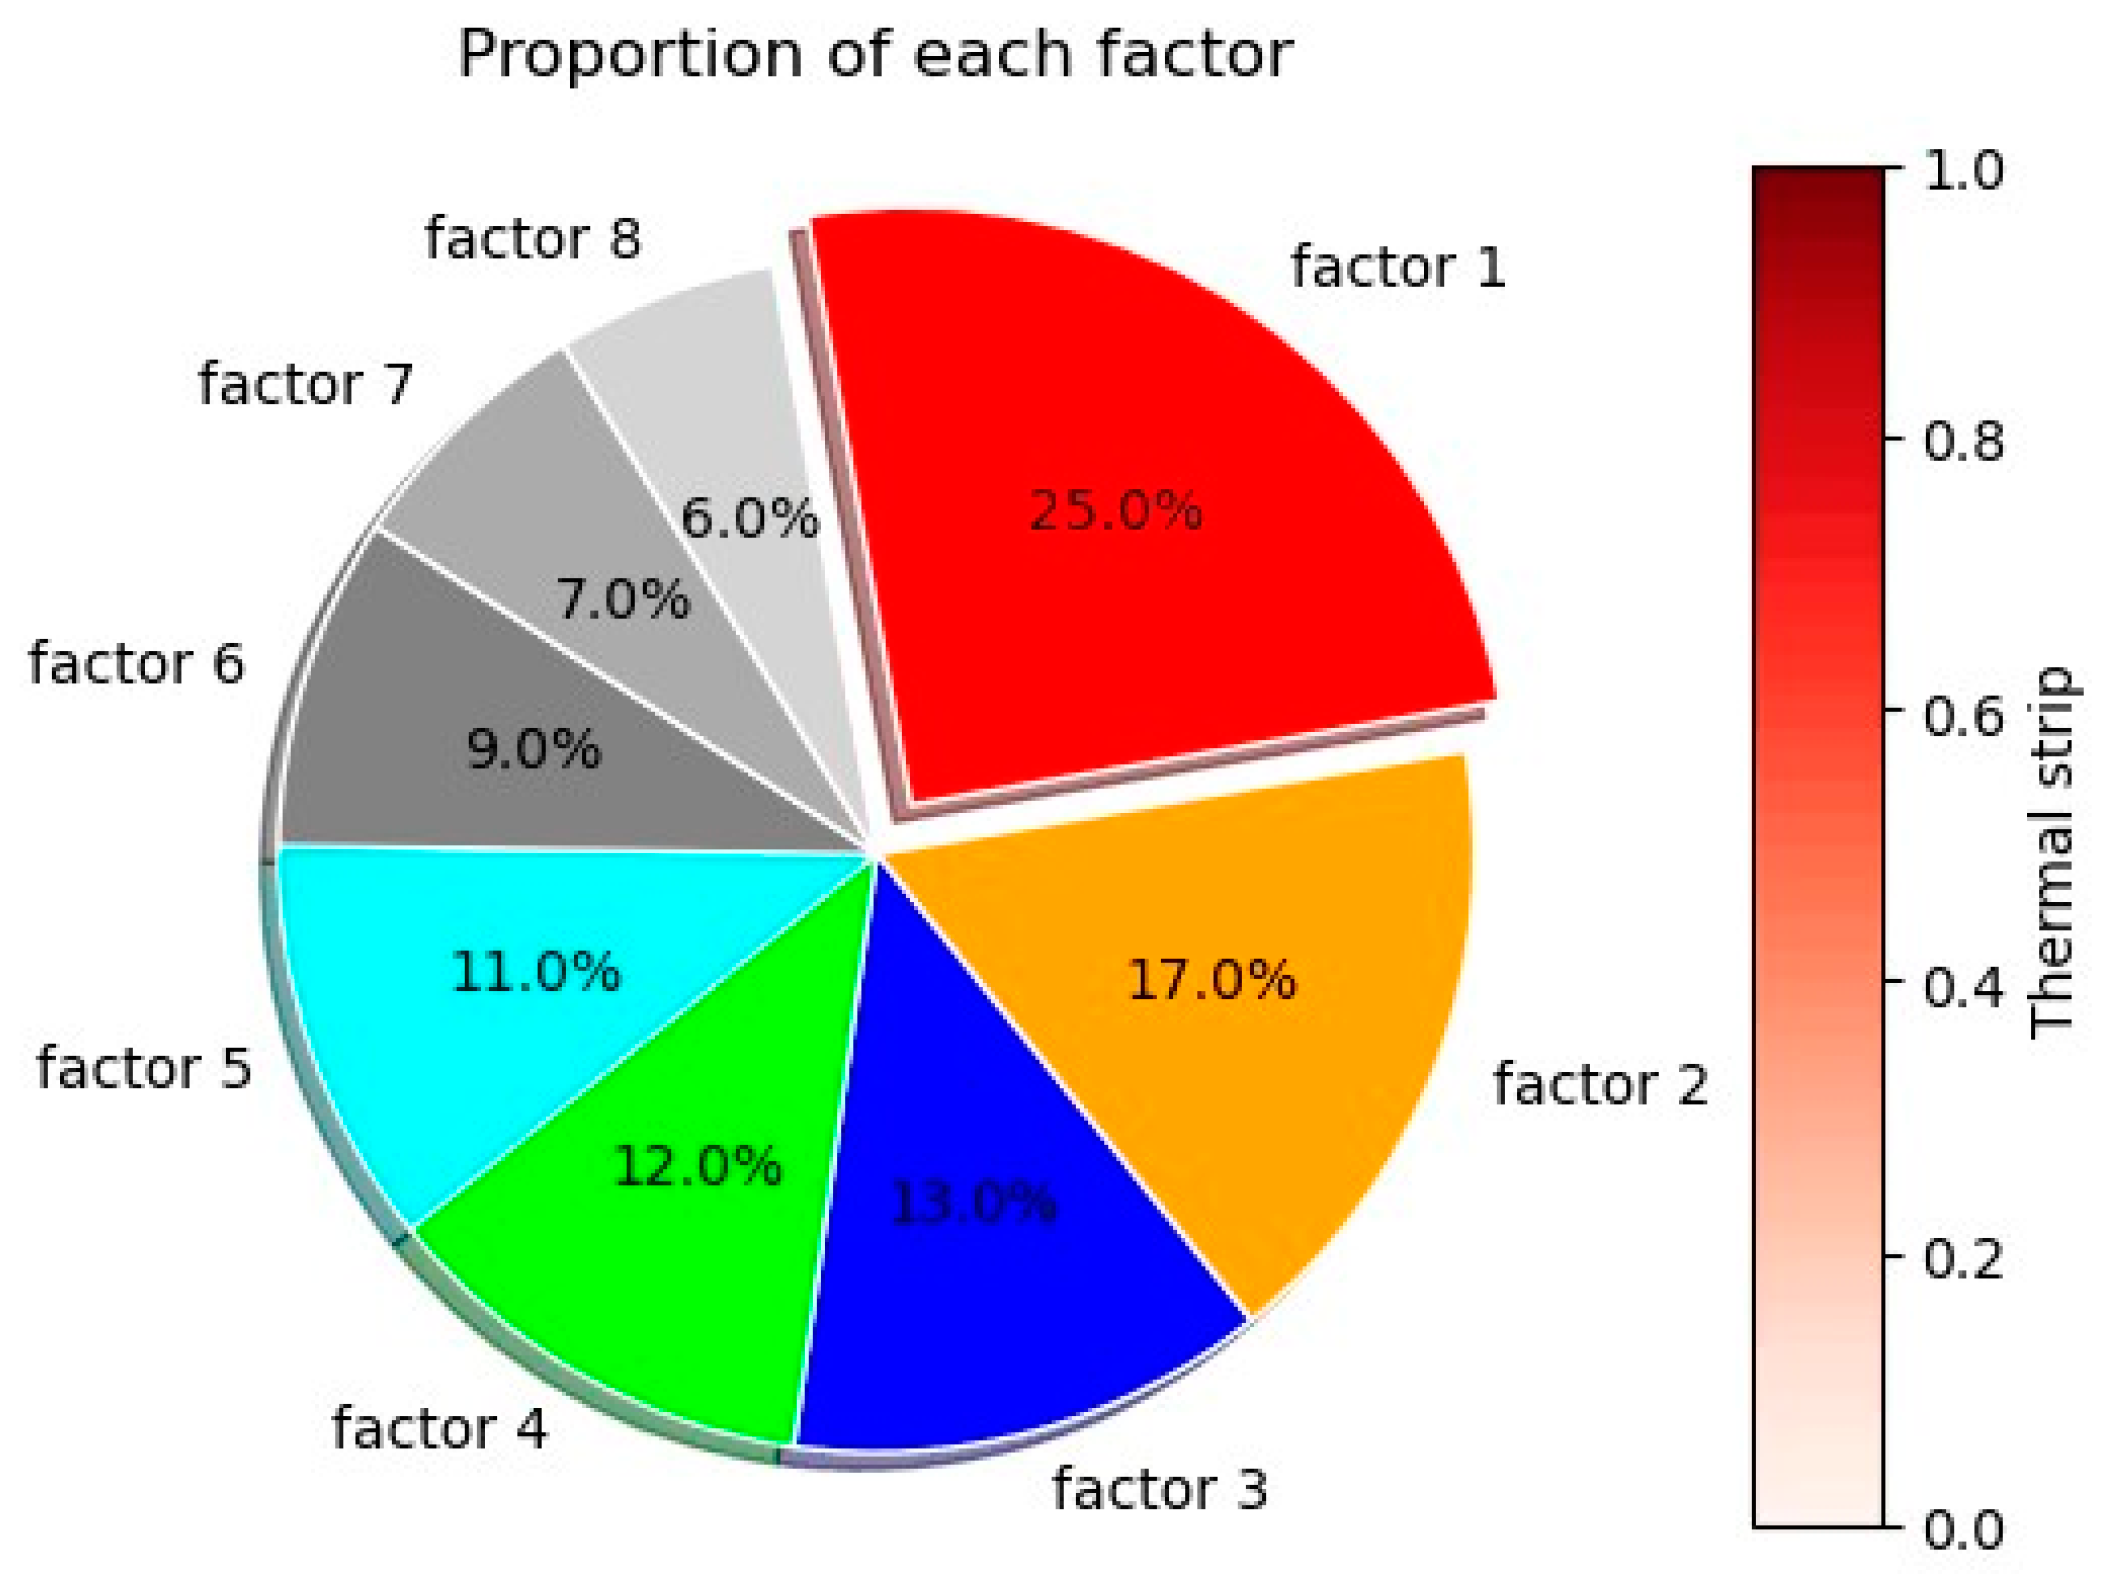
In this paper, we obtain eight core influence factors through the double dimensionality reduction combining systematic clustering and exploratory factor analysis, which is more reasonable and can obtain the most core influence factors compared with Zi Ye [22], who selects the core influence factors of mobile users of Wuhan communication through correlation. Core factor 1 has the highest weight of 24.952%, i.e., the status quo of indoor voice problems has the greatest influence. Factor 1 has seven core influencing factors. Therefore, if mobile operators want to improve user satisfaction, they need to improve these seven core impact factors, including whether they have encountered network problems, residential area, underground, no signal of mobile phone, sudden interruption during the call, inaudible intermittent and intermittent call with noise, and one party cannot be heard during the call.
(2)
General machine learning prediction algorithms have an accuracy of about 70% [23,40,41], and the prediction accuracy of this study can reach 99.96%, which is a very high accuracy when predicting. Highly accurate satisfaction prediction can help operators more accurately adjust their operational strategies, so as to improve their market competitiveness. In addition, improved user satisfaction can help promote the development of the communication industry and promote national informatization and economic growth.
(3)
Although this study is based on data from Chinese operators, it can be generalized to a certain extent to foreign operators or other related satisfaction rating studies. However, it should be noted that factors such as culture, social background, the level of economic development, laws and regulations in different countries and regions will have an impact on the user satisfaction evaluation system. Therefore, it is necessary to make corresponding adjustments when applying the research results to other countries or regions. If one would like to apply them for Amazon’s mobile marketplace in the UK, the following areas can be explored further:
Cultural factors are crucial to user satisfaction. The UK and China have different cultural backgrounds that influence values, socialization and communication habits. Amazon, as a multinational company, needs to adapt to the cultural expectations of UK users. UK users may value privacy more and have different attitudes toward data use and sharing. Therefore, it is important to understand the cultural characteristics of UK users to accurately reflect their needs and expectations when evaluating user satisfaction.
Economic factors are also important. The economic level, spending power and shopping habits in the UK are different from those in China, which will affect user demand for mobile services and satisfaction levels. Amazon’s pricing strategy and package selection in the UK market must take into account the purchasing power and preferences of UK users. Therefore, economic factors need to be thoroughly analyzed in the rating system to more accurately reflect user evaluation and satisfaction.
Regulatory differences also need to be taken into account. The UK and China have different privacy and user rights regulations. Amazon’s mobile services in the UK market must comply with local laws to ensure data processing and user privacy. This has implications for service design, data collection and user interface. Considering cultural, economic and regulatory factors together will help to better understand the scope and limitations of the findings. This in-depth research will provide guidance to multinational organizations worldwide to ensure high user satisfaction with services and products in diverse environments.
(4)
At the same time, thousands of data collected in the real communication environment contain hundreds of millions of users, corresponding to each user’s quality of experience influencing factors, and behavioral characteristics also present ultra-high-dimensional characteristics. In order to effectively cope with the task of analyzing hundreds of millions of data, distributed and parallel processing algorithms, as well as corresponding processing software frameworks, can be adopted to reduce the time complexity of data mining algorithms and improve the efficiency of the algorithms.

Author Contributions

Conceptualization, Y.H.; Investigation, C.Y.; Methodology, F.Z.; Project administration, X.H.; Software, C.Y. and X.H.; Validation, Y.Y.; Visualization, Y.Y.; Writing—original draft, Y.H.; Writing—review and editing, F.Z. and Y.H. All authors have read and agreed to the published version of the manuscript.

Funding

This research was funded by the National Natural Science Foundation of China under grant number 61703215, the Ministry of Transport and applied basic research project of China under grant number 2013329811340 and the National Defense Pre-Research Project of Wuhan University of Science and Technology under grant number GF201809.

Institutional Review Board Statement

Not applicable.

Informed Consent Statement

Not applicable.

Data Availability Statement

Due to the nature of this research, participants of this study did not agree for their data to be shared publicly, and the data are only available upon reasonable request.

Conflicts of Interest

The authors declare no conflict of interest.

References

  1. Hajar, M.A.; Alkahtani, A.A.; Ibrahim, D.N.; Al-Sharafi, M.A.; Alkawsi, G.; Iahad, N.A.; Darun, M.R.; Tiong, S.K. The effect of value innovation in the superior performance and sustainable growth of telecommunications sector: Mediation effect of customer satisfaction and loyalty. Sustainability 2022, 14, 6342. [Google Scholar] [CrossRef]
  2. Ramachandran, A.; Chidambaram, V. A review of customer satisfaction towards service quality of banking sector. Period. Polytech. Soc. Manag. Sci. 2012, 20, 71–79. [Google Scholar] [CrossRef]
  3. Devriendt, F.; Berrevoets, J.; Verbeke, W. Why you should stop predicting customer churn and start using uplift models. Inf. Sci. 2021, 548, 497–515. [Google Scholar] [CrossRef]
  4. England, R.; Owadally, I.; Wright, D. An Agent-Based Model of Motor Insurance Customer Behaviour in the UK with Word of Mouth. J. Artif. Soc. Soc. Simul. 2022, 25, 2. [Google Scholar] [CrossRef]
  5. Sweeney, J.; Payne, A.; Frow, P.; Liu, D. Customer advocacy: A distinctive form of word of mouth. J. Serv. Res. 2020, 23, 139–155. [Google Scholar] [CrossRef]
  6. Mukhsin, M.; Suryanto, T. The effect of sustainable supply chain management on company performance mediated by competitive advantage. Sustainability 2022, 14, 818. [Google Scholar] [CrossRef]
  7. Firestone, D.; Putnam, A.; Mundkur, S.; Chiou, D.; Dabagh, A.; Andrewartha, M.; Angepat, H.; Bhanu, V.; Caulfield, A.; Chung, E.; et al. Azure Accelerated Networking:{SmartNICs} in the Public Cloud. In Proceedings of the 15th USENIX Symposium on Networked Systems Design and Implementation, Renton, WA, USA, 9–11 April 2018; pp. 51–66. [Google Scholar]
  8. Kothandaraman, P.; Wilson, D.T. The future of competition: Value-creating networks. Ind. Mark. Manag. 2001, 30, 379–389. [Google Scholar] [CrossRef]
  9. Sharma, G.; Lijuan, W. The effects of online service quality of e-commerce Websites on user satisfaction. Electron. Libr. 2015, 33, 468–485. [Google Scholar] [CrossRef]
  10. China Mobile Mobile Business Customers Decreased by 242,000 in April! A Number of Customers Reported that the Fee Was Deducted. Available online: https://baijiahao.baidu.com/s?id=1733339562685510245&wfr=spider&for=pc (accessed on 22 August 2023).
  11. National Network Speed and Quality Report 2022. Available online: http://5g.speedtest.cn/article/51OpWlBZqWly4RL4AdJ6 (accessed on 22 August 2023).
  12. Consumer Data Released by Mobile Analytics and Business Intelligence Firm GWS Shows that Amazon’s Market Position is under Threat. Available online: https://xueqiu.com/7949779229/255858474 (accessed on 22 August 2023).
  13. Mobile Business Drags Japan’s Rakuten Deeper into the Loss Quagmire.2023 Becomes the Key Year! Available online: https://baijiahao.baidu.com/s?id=1757887714493188586&wfr=spider&for=pc (accessed on 22 August 2023).
  14. Asia Pacific to See Tenfold Rise in 5G Mobile Connections by 2030 as Digital Transformation Gathers Pace, Gsma Report Reveals. Available online: https://www.gsma.com/newsroom/press-release/the-mobile-economy-asia-pacific-report/ (accessed on 22 August 2023).
  15. Mahmoud, M.A.; Hinson, R.E.; Anim, P.A. Service innovation and customer satisfaction: The role of customer value creation. Eur. J. Innov. Manag. 2018, 21, 402–422. [Google Scholar] [CrossRef]
  16. Wang, W.T.; Ou, W.M.; Chen, W.Y. The impact of inertia and user satisfaction on the continuance intentions to use mobile communication applications: A mobile service quality perspective. Int. J. Inf. Manag. 2019, 44, 178–193. [Google Scholar] [CrossRef]
  17. Hulland, J.; Baumgartner, H.; Smith, K.M. Marketing survey research best practices: Evidence and recommendations from a review of JAMS articles. J. Acad. Mark. Sci. 2018, 46, 92–108. [Google Scholar] [CrossRef]
  18. Chen, T.; Peng, L.; Yin, X.; Rong, J.; Yang, J.; Cong, G. Analysis of user satisfaction with online education platforms in China during the COVID-19 pandemic. Healthcare 2020, 8, 20. [Google Scholar] [CrossRef]
  19. Jiang, H.; Zhang, Y. An investigation of service quality, customer satisfaction and loyalty in China’s airline market. J. Air Transp. Manag. 2016, 57, 80–88. [Google Scholar] [CrossRef]
  20. Kurdi, B.; Alshurideh, M.; Alnaser, A. The impact of employee satisfaction on customer satisfaction: Theoretical and empirical underpinning. Manag. Sci. Lett. 2020, 10, 3561–3570. [Google Scholar] [CrossRef]
  21. Lin, H.; Zhang, M.; Gursoy, D. Impact of nonverbal customer-to-customer interactions on customer satisfaction and loyalty intentions. Int. J. Contemp. Hosp. Manag. 2020, 32, 1967–1985. [Google Scholar] [CrossRef]
  22. Ye, Z. Campus Mobile Communication Service Satisfaction Survey and Influencing Factors Analysis—Taking Seven Schools in Wuhan as an Example; Zhongnan University of Economics and Law: Wuhan, China, 2019. [Google Scholar]
  23. Li, J. Research on Mobile Internet Satisfaction Evaluation Based on Decision Tree; Southwest Jiaotong University: Chengdu, China, 2018. [Google Scholar]
  24. Ferreira, D.C.; Marques, R.C.; Nunes, A.M.; Figueira, J.R. Customers satisfaction in pediatric inpatient services: A multiple criteria satisfaction analysis. Socio-Econ. Plan. Sci. 2021, 78, 101036. [Google Scholar] [CrossRef]
  25. Lucini, F.R.; Tonetto, L.M.; Fogliatto, F.S.; Anzanello, M.J. Text mining approach to explore dimensions of airline customer satisfaction using online customer reviews. J. Air Transp. Manag. 2020, 83, 101760. [Google Scholar] [CrossRef]
  26. Khan, M.M.; Fasih, M. Impact of service quality on customer satisfaction and customer loyalty: Evidence from banking sector. Pak. J. Commer. Soc. Sci. (PJCSS) 2014, 8, 331–354. [Google Scholar]
  27. Lee, M.; Cai, Y.M.; DeFranco, A.; Lee, J. Exploring influential factors affecting guest satisfaction: Big data and business analytics in consumer-generated reviews. J. Hosp. Tour. Technol. 2020, 11, 137–153. [Google Scholar] [CrossRef]
  28. Ezugwu, A.E.; Ikotun, A.M.; Oyelade, O.O.; Abualigah, L.; Agushaka, J.O.; Eke, C.I.; Akinyelu, A.A. A comprehensive survey of clustering algorithms: State-of-the-art machine learning applications, taxonomy, challenges, and future research prospects. Eng. Appl. Artif. Intell. 2022, 110, 104743. [Google Scholar] [CrossRef]
  29. Kabir, M.E.; Wang, H.; Bertino, E. Efficient systematic clustering method for k-anonymization. Acta Inf. 2011, 48, 51–66. [Google Scholar] [CrossRef]
  30. Schreiber, J.B. Issues and recommendations for exploratory factor analysis and principal component analysis. Res. Soc. Adm. Pharm. 2021, 17, 1004–1011. [Google Scholar] [CrossRef] [PubMed]
  31. Huang, D.; Jiang, F.; Li, K.; Tong, G.; Zhou, G. Scaled PCA: A new approach to dimension reduction. Manag. Sci. 2022, 68, 1678–1695. [Google Scholar] [CrossRef]
  32. Ma, L.; Xiao, H.; Tao, J.; Su, Z. Intelligent lithology classification method based on GBDT algorithm. Editor. Dep. Pet. Geol. Recovery Effic. 2022, 29, 21–29. [Google Scholar]
  33. Xia, Y.; Zhao, J.; He, L.; Li, Y.; Niu, M. A novel tree-based dynamic heterogeneous ensemble method for credit scoring. Expert. Syst. Appl. 2020, 159, 113615. [Google Scholar] [CrossRef]
  34. Guelman, L. Gradient boosting trees for auto insurance loss cost modeling and prediction. Expert. Syst. Appl. 2012, 39, 3659–3667. [Google Scholar] [CrossRef]
  35. Wu, W.; Jiang, S.; Liu, R.; Jin, W.; Ma, C. Economic development, demographic characteristics, road network and traffic accidents in Zhongshan, China: Gradient boosting decision tree model. Transp. A Transp. Sci. 2020, 16, 359–387. [Google Scholar] [CrossRef]
  36. Xu, H. GBDT-LR: A Willingness Data Analysis and Prediction Model Based on Machine Learning. In Proceedings of the 2022 IEEE International Conference on Advances in Electrical Engineering and Computer Applications (AEECA), Dalian, China, 18–19 August 2023; pp. 396–401. [Google Scholar]
  37. Wang, R.; Pei, X.; Zhu, J.; Zhang, Z.; Huang, X.; Zhai, J.; Zhang, F. Multivariable time series forecasting using model fusion. Inf. Sci. 2022, 585, 262–274. [Google Scholar] [CrossRef]
  38. Wu, M.L. Questionnaire Statistical Analysis Practice—SPSS Operation and Application; Chongqing University Press: Chongqing, China, 2010. [Google Scholar]
  39. Cui, M. Introduction to the k-means clustering algorithm based on the elbow method. Account. Audit. Financ. 2020, 1, 5–8. [Google Scholar]
  40. Yao, L.; Wang, Z.; Gu, H.; Zhao, X.; Chen, Y.; Liu, L. Prediction of Chinese clients’ satisfaction with psychotherapy by machine learning. Front. Psychiatry 2023, 14, 947081. [Google Scholar] [CrossRef] [PubMed]
  41. Wang, P.; Yang, H.; Hou, J.; Li, Q. A machine learning approach to primacy-peak-recency effect-based satisfaction prediction. Inf. Process. Manag. 2023, 60, 103196. [Google Scholar] [CrossRef]
Figure 1. Flow diagram of hierarchical clustering.
Applsci 13 09681 g001
Figure 2. Schematic diagram of GBDT.
Applsci 13 09681 g002
Figure 3. Icicle diagram based on clustering analysis of voice services.
Applsci 13 09681 g003
Figure 4. Diagram of voice service fragmentation.
Applsci 13 09681 g004
Figure 5. Heat figure of factor load coefficient.
Applsci 13 09681 g005
Figure 6. Weight pie chart of factors.
Applsci 13 09681 g006
Table 1. The samples of data.
User IDOverall Satisfaction with Voice CallsWhether Encountered Network ProblemsResidential DistrictOfficesCollegesCommercial Streets, SubwaysSubwaysRural AreasHigh-Speed Railways
1101−12−1−1−1−1−1
22112−14−1−1−1
3101−1−1−1−1−16−1
46112−1−1−1−1−1
551−12−1−15−17
6711−1−1−156−1
781−1−1−14−167
810−1−1−1−1−1−1−1−1
910−1−1−1−1−1−1−1−1
Table 2. Results of clustering analysis.
CategoryIndicators
1Residential district; offices; colleges and universities; commercial streets; metro; rural areas; high-speed rail; mobile phone no signal; have a signal can not be dialed; call suddenly interrupted during the call; call in the murmur, inaudible, intermittent; crosstalk; call during the call of one party can not hear; mos poor quality number of times; failed to connect to the number of dropped calls; 4/5G subscribers; voice mode; whether the 4G network customers (local) Excluding IoT); voice call-length (minutes); ARPU in the current month; MOU in the current month; MOU in the previous 3 months; whether or not a 5G network customer; customer star identification; amount of arrears in the current month; amount of arrears in the previous 3 months
2Whether encountered network problems
3Number of off-grid trips
4Complaints about tariffs, caring for users or not, complaints about home broadband
5ARPU in the first three months, ARPU (home broadband), whether or not you have been to a business office, extra traffic (MB), extra traffic fee (yuan), percentage of voice from abroad, inter-provincial roaming-hours (minutes), percentage of traffic from abroad, total GPRS-traffic (KB), GPRS-domestic roaming-traffic (KB), whether or not you are a real-name-registered subscriber
Table 3. Initial scoring and evaluation system of voice service user.
Level 1 IndicatorsLevel 2 IndicatorsLevel 3 Indicators
User IssuesUser scenariosResidential district
Office
High School
Commercial Street
Subway
Rural
High Speed Rail
User Calls Network problems during user callsNo mobile phone signal
Can’t get through with signal
Sudden interruption during the call
Noise, inaudible, intermittent calls
Crosstalk
One party cannot be heard during the call
Networks, costs and remaining issuesNumber of problemsWhether encountered network problems
Off-network
Poor mos quality
Number of missed calls
Remaining issuesVoice mode
Client Star Rating
4/5G users
Whether 4G network customer (local excluding IoT)
Whether 5G network customer
Voice Call—Duration (minutes)
Cost issuesAmount in arrears for the current month
Amount in arrears for the previous 3 months
ARPU for the current month
Current Month MOU
Previous 3 Months MOU
Table 4. Values of KMO test and Bartlett’s test.
KMO Value0.807
Bartlett sphericity testapproximate chi-square285933.639
df465
P0.0002
Table 5. Eigenvalues and total variance explanatory rate of factors.
FactorExplanatory Rate of Variance before RotationFactorPost-Rotation Variance Explained
Characteristic RootExplanation of Variance (%)Cumulative Variance Explained (%)Characteristic RootExplanation of Variance (%)Cumulative Variance Explained (%)
16.45720.82830.8281485.44615.6625.66
23.58611.56742.3952293.7679.47635.136
32.6048.450.7963286.5419.24344.379
41.745.61356.4094264.028.51752.896
51.6915.45461.86351685.41958.315
61.1853.82365.6866162.3725.23863.553
71.1133.59169.2777157.6755.08668.639
81.083.48475.7618127.7044.11974.759
90.9763.14778.908
100.9593.09480.002
Table 6. New nomenclature of factors.
FactorNomenclatureFactorNomenclature
Factor 1State of the indoor voice problemFactor 5Status of the voice signal stability problem
Factor 2State of the art of voice problems in trafficFactor 6Status of voice route independence issues
Factor 3Speech stability issuesFactor 7Current status of voice service level issues
Factor 4Densely populated areasFactor 8Current status of voice mode issues
Table 7. Core influences on factor 1 components.
Core Impact FactorFactor 1 Components (%)
Whether encountered network problems−0.136
Residential district0.111
Subway0.102
No mobile phone signal0.095
Sudden interruption during a call0.101
I can’t hear any noise during the call0.105
One party cannot be heard during the call0.106
Table 8. Parameter settings of gradient lifting tree model.
Parameter NameParameter Value
Data Slicing1
Data Shufflingnot
Cross Validationnot
Loss Functionfriedman_mse
Node splitting evaluation criteriafriedman_mse
Number of base learners600
Learning rate0.3
Proportion of no-playback sampling0.8
Maximum proportion of features considered for splittingNone
Minimum number of samples for internal node splitting2
Minimum number of samples in leaf nodes1
Minimum weight of samples in leaf nodes0
Maximum depth of the tree10
Maximum number of leaf nodes50
Threshold for impurity of node division0
Table 9. Results of model prediction assessment.
MSERMSEMAEMAPE
reasonable dataset0.0140.1180.0821.2530.997
Disclaimer/Publisher’s Note: The statements, opinions and data contained in all publications are solely those of the individual author(s) and contributor(s) and not of MDPI and/or the editor(s). MDPI and/or the editor(s) disclaim responsibility for any injury to people or property resulting from any ideas, methods, instructions or products referred to in the content.

