
Geosystemic Impacts of the Extreme Rainfall Linked to the El Niño 2015/2016 Event in Northern Paraná, Brazil

 , ,
, , 
Abstract
:1. Introduction
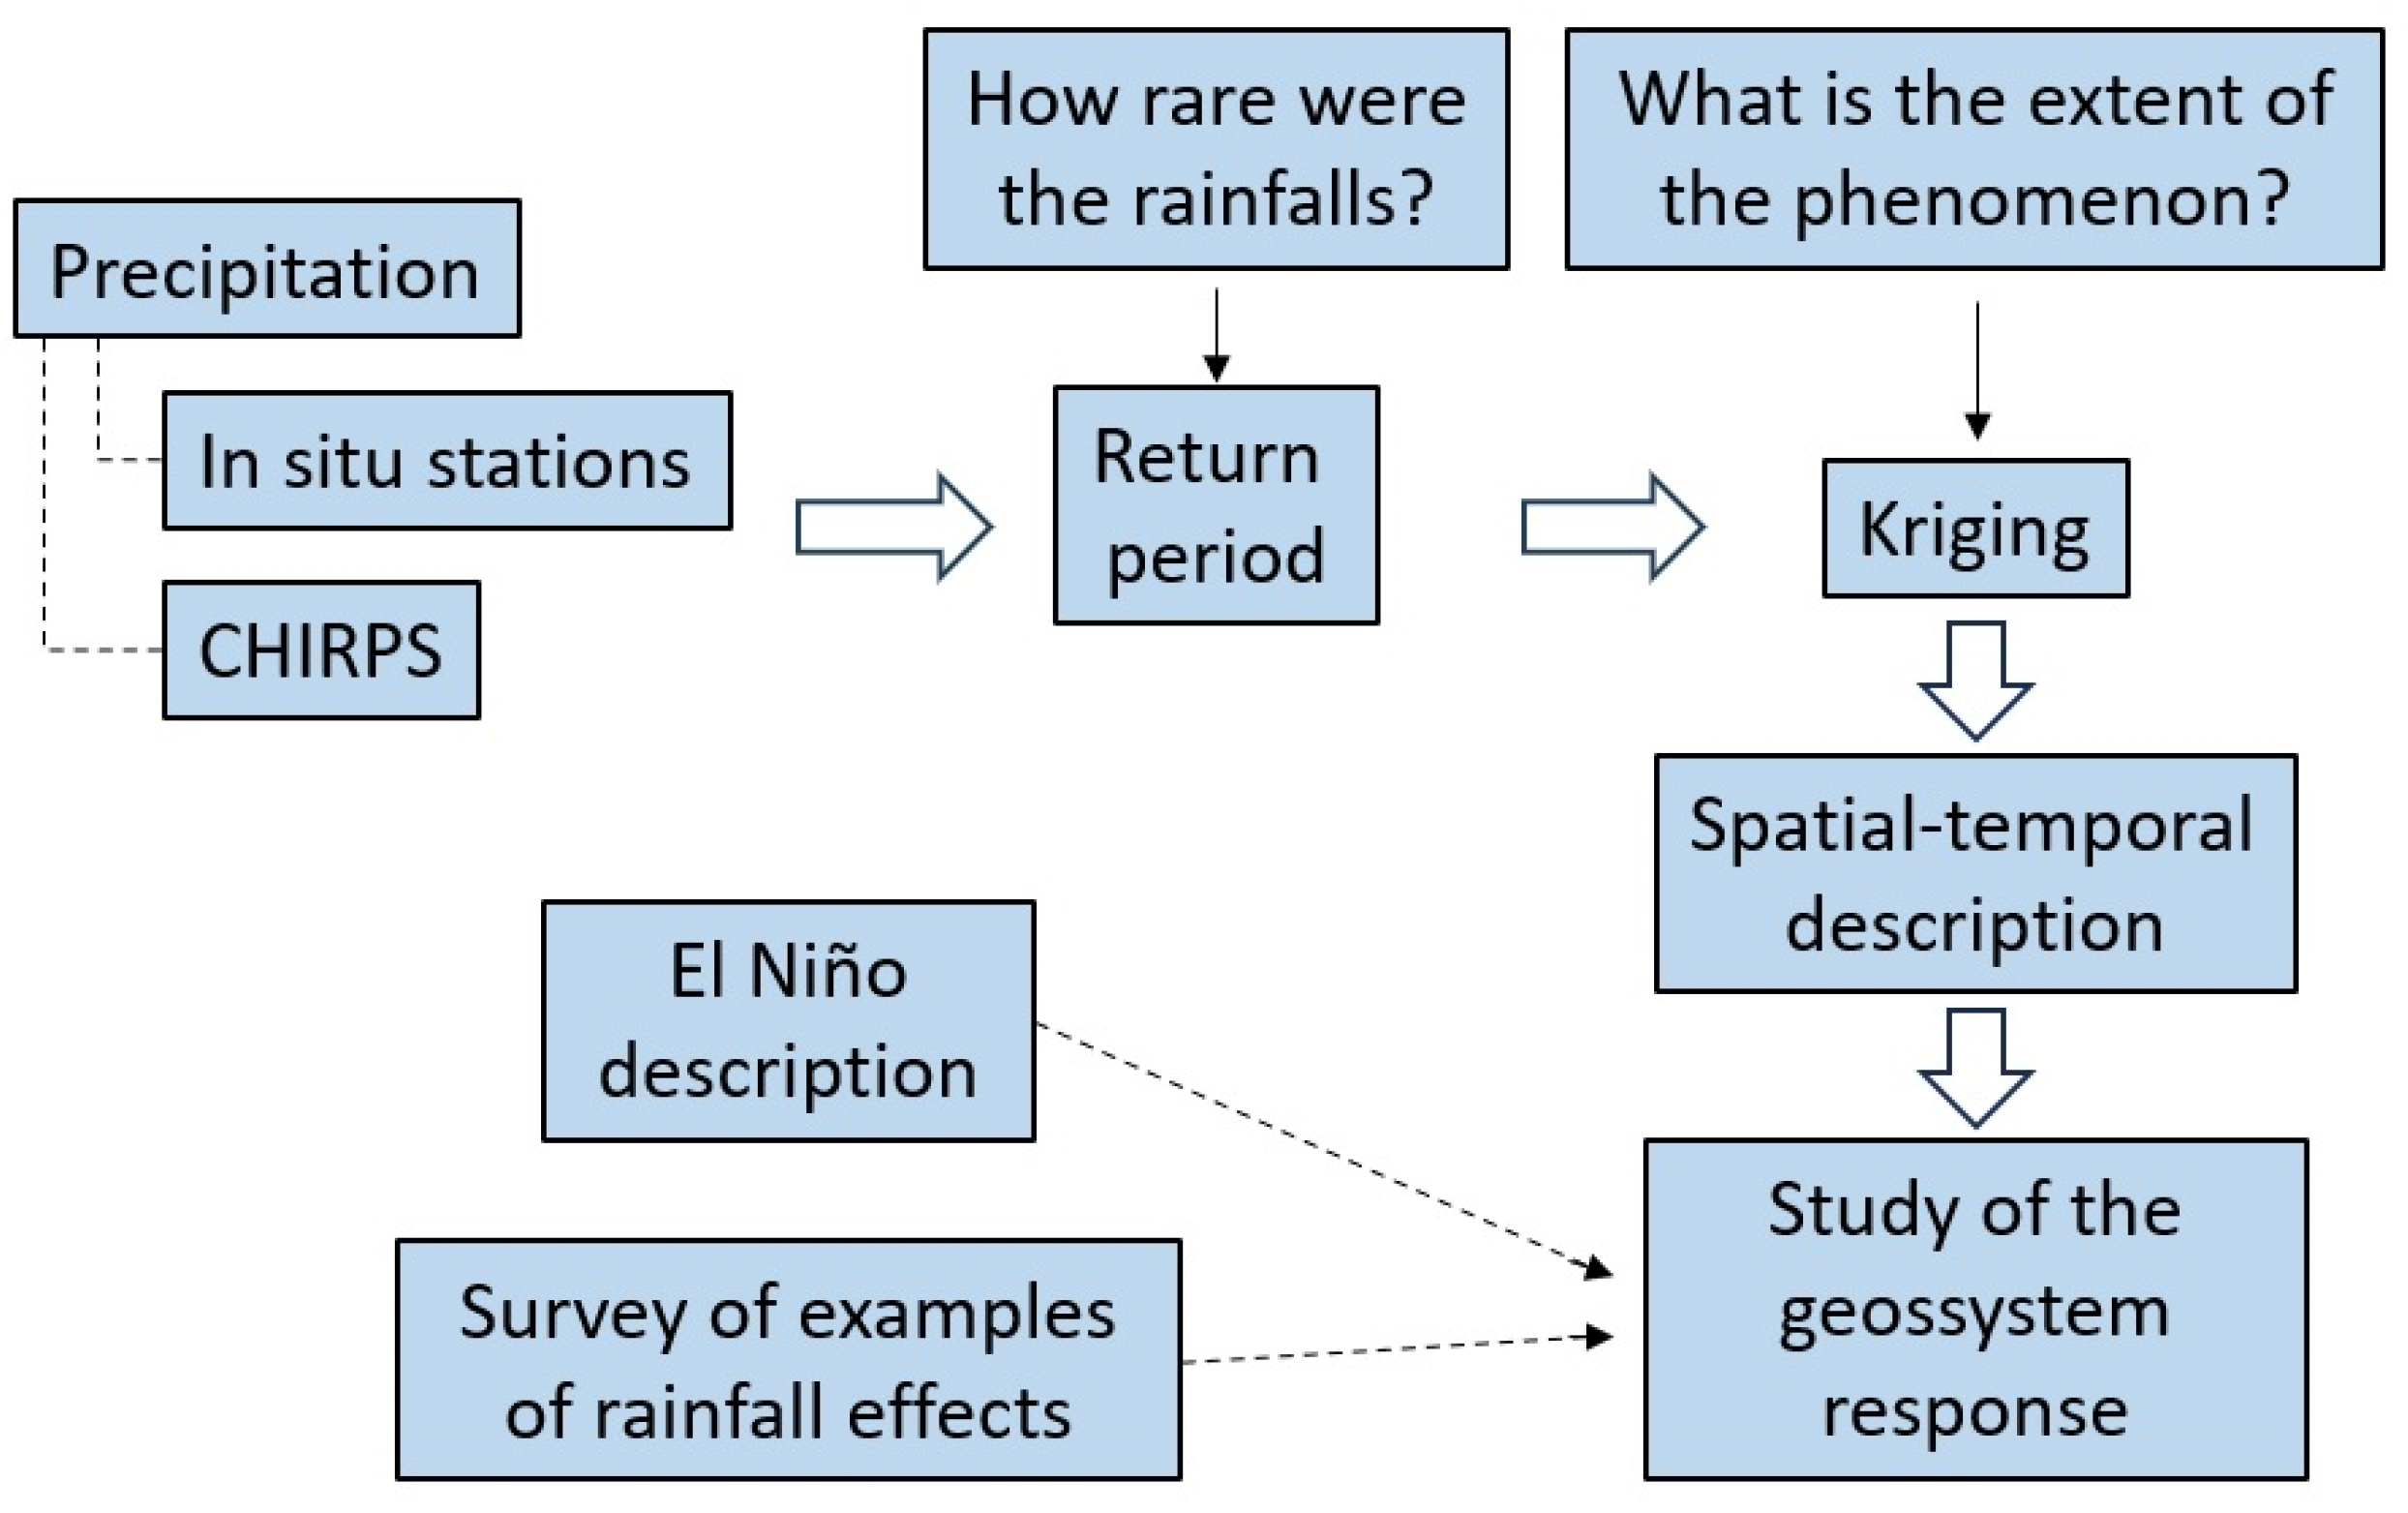
2. Methodology
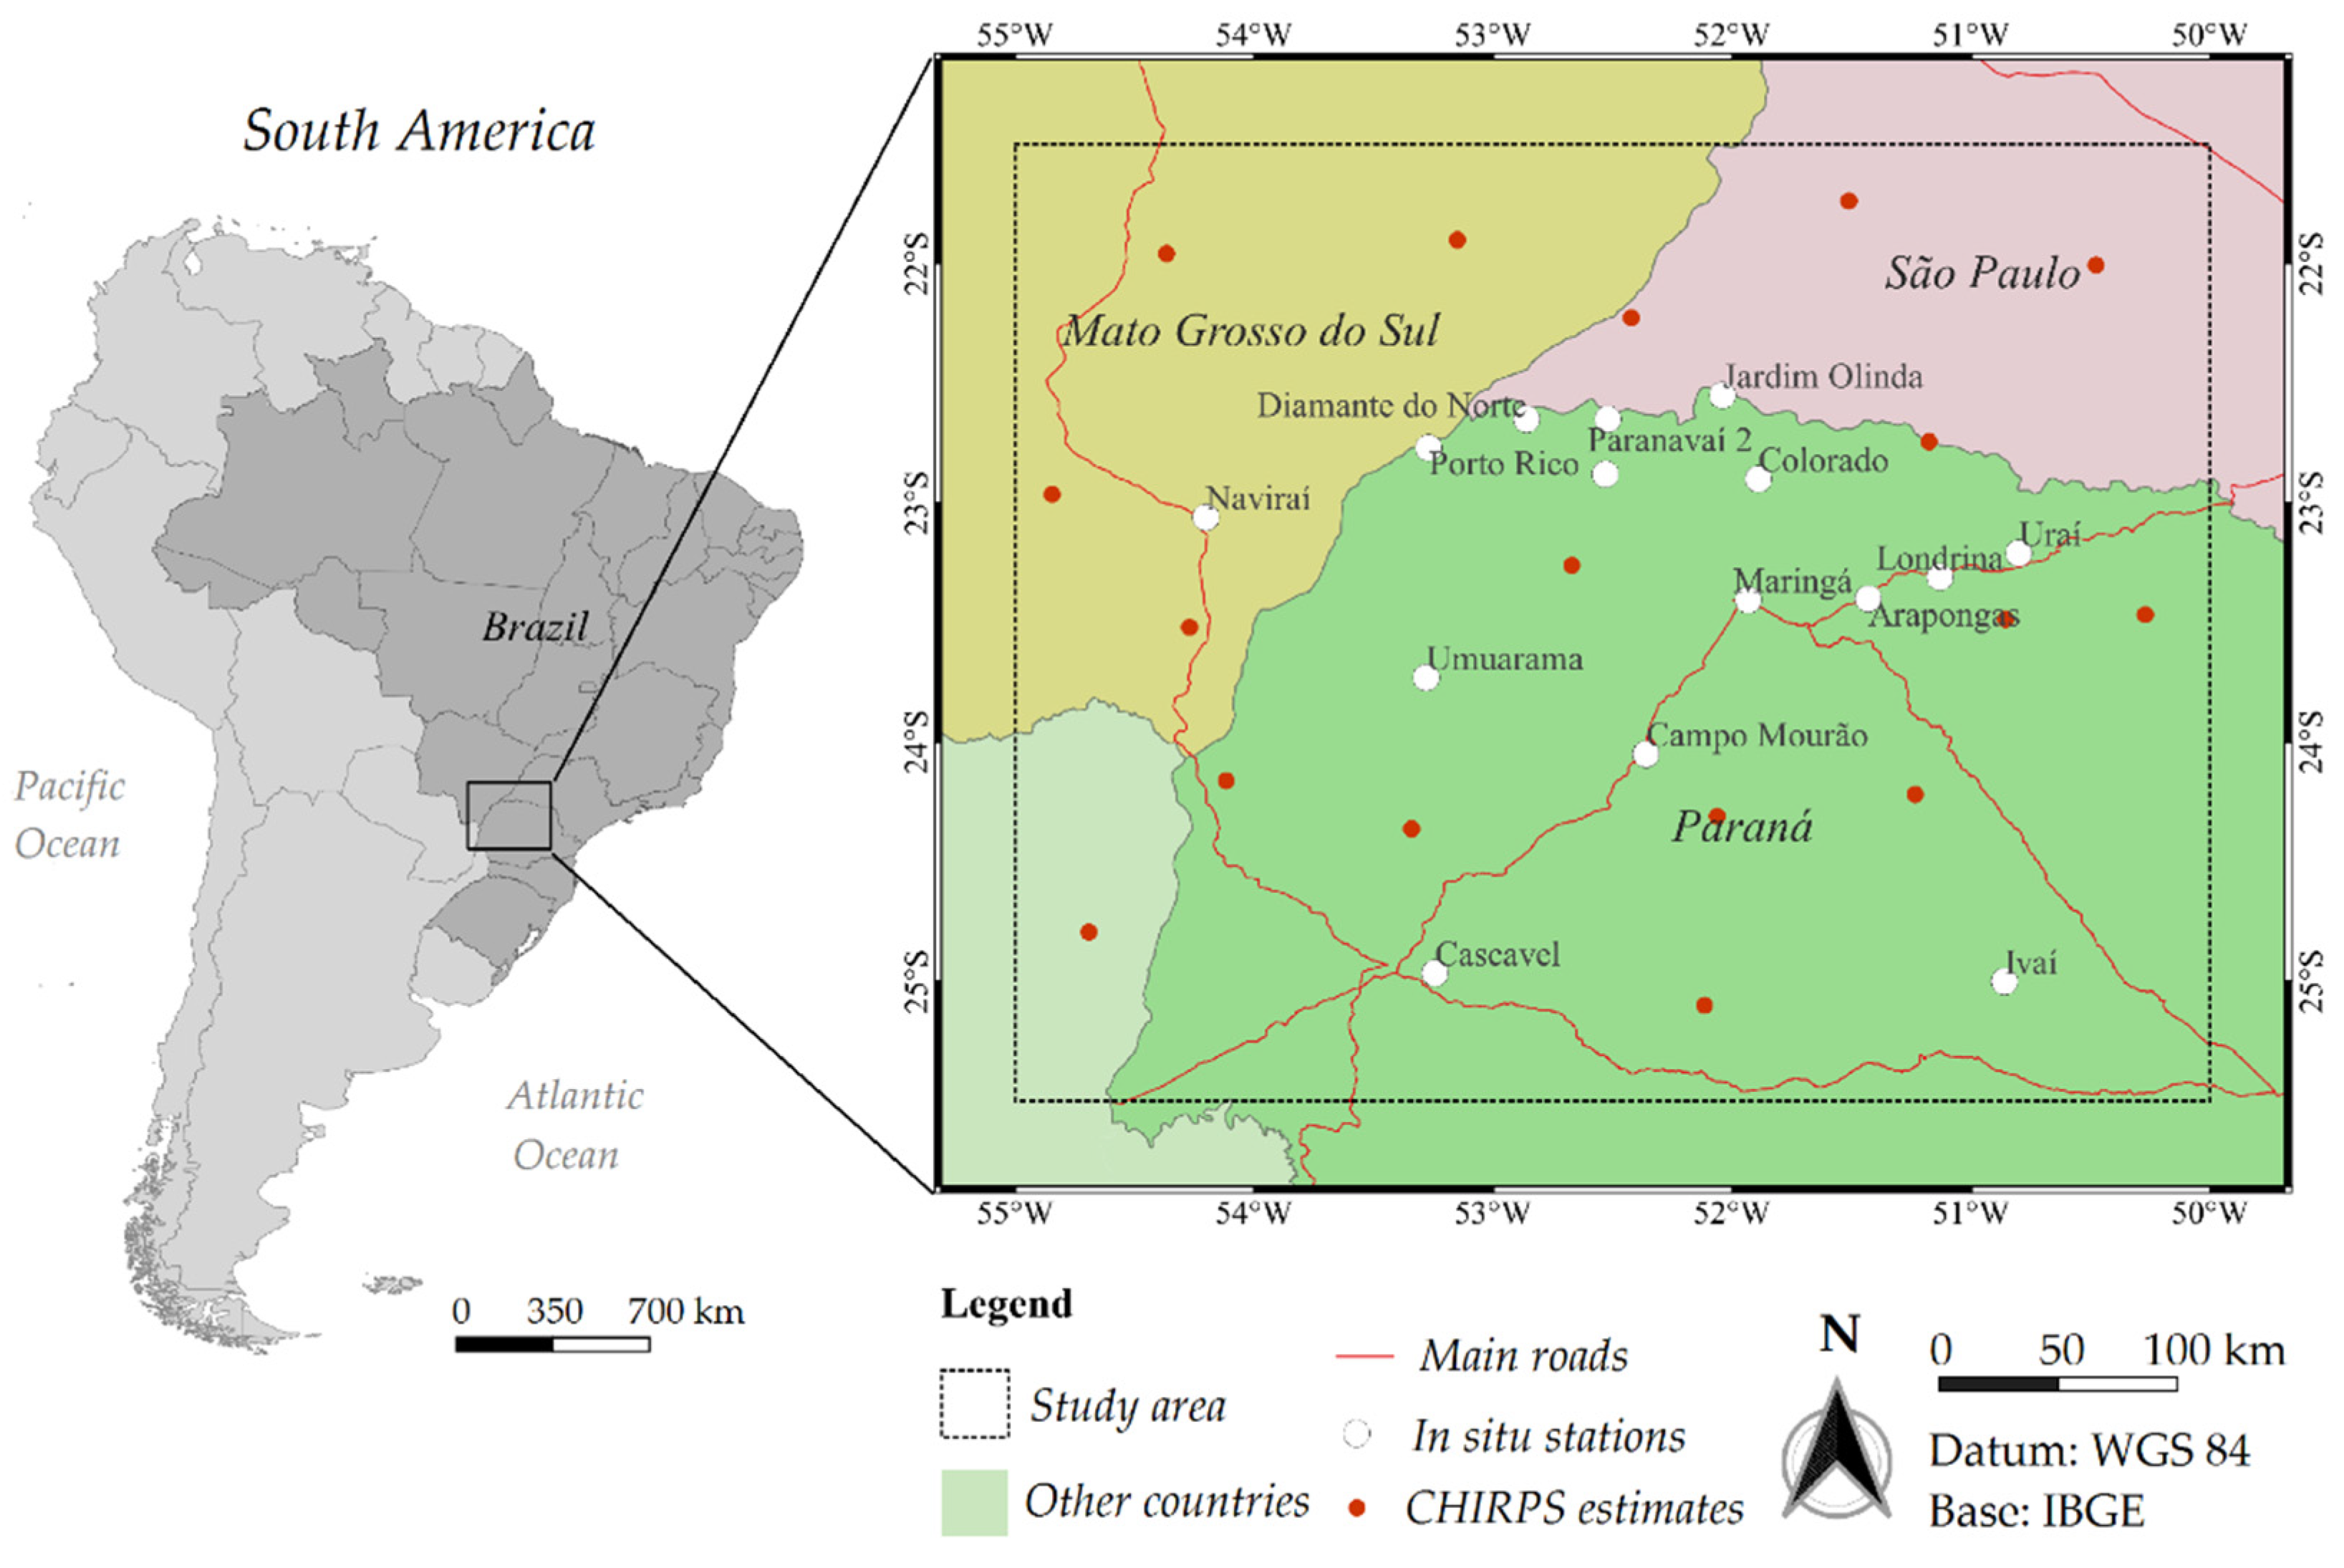
2.1. Study Area

2.2. Rainfall Analysis
2.3. Phenomenon Spatialization
2.4. Sample Survey
3. Results and Discussion
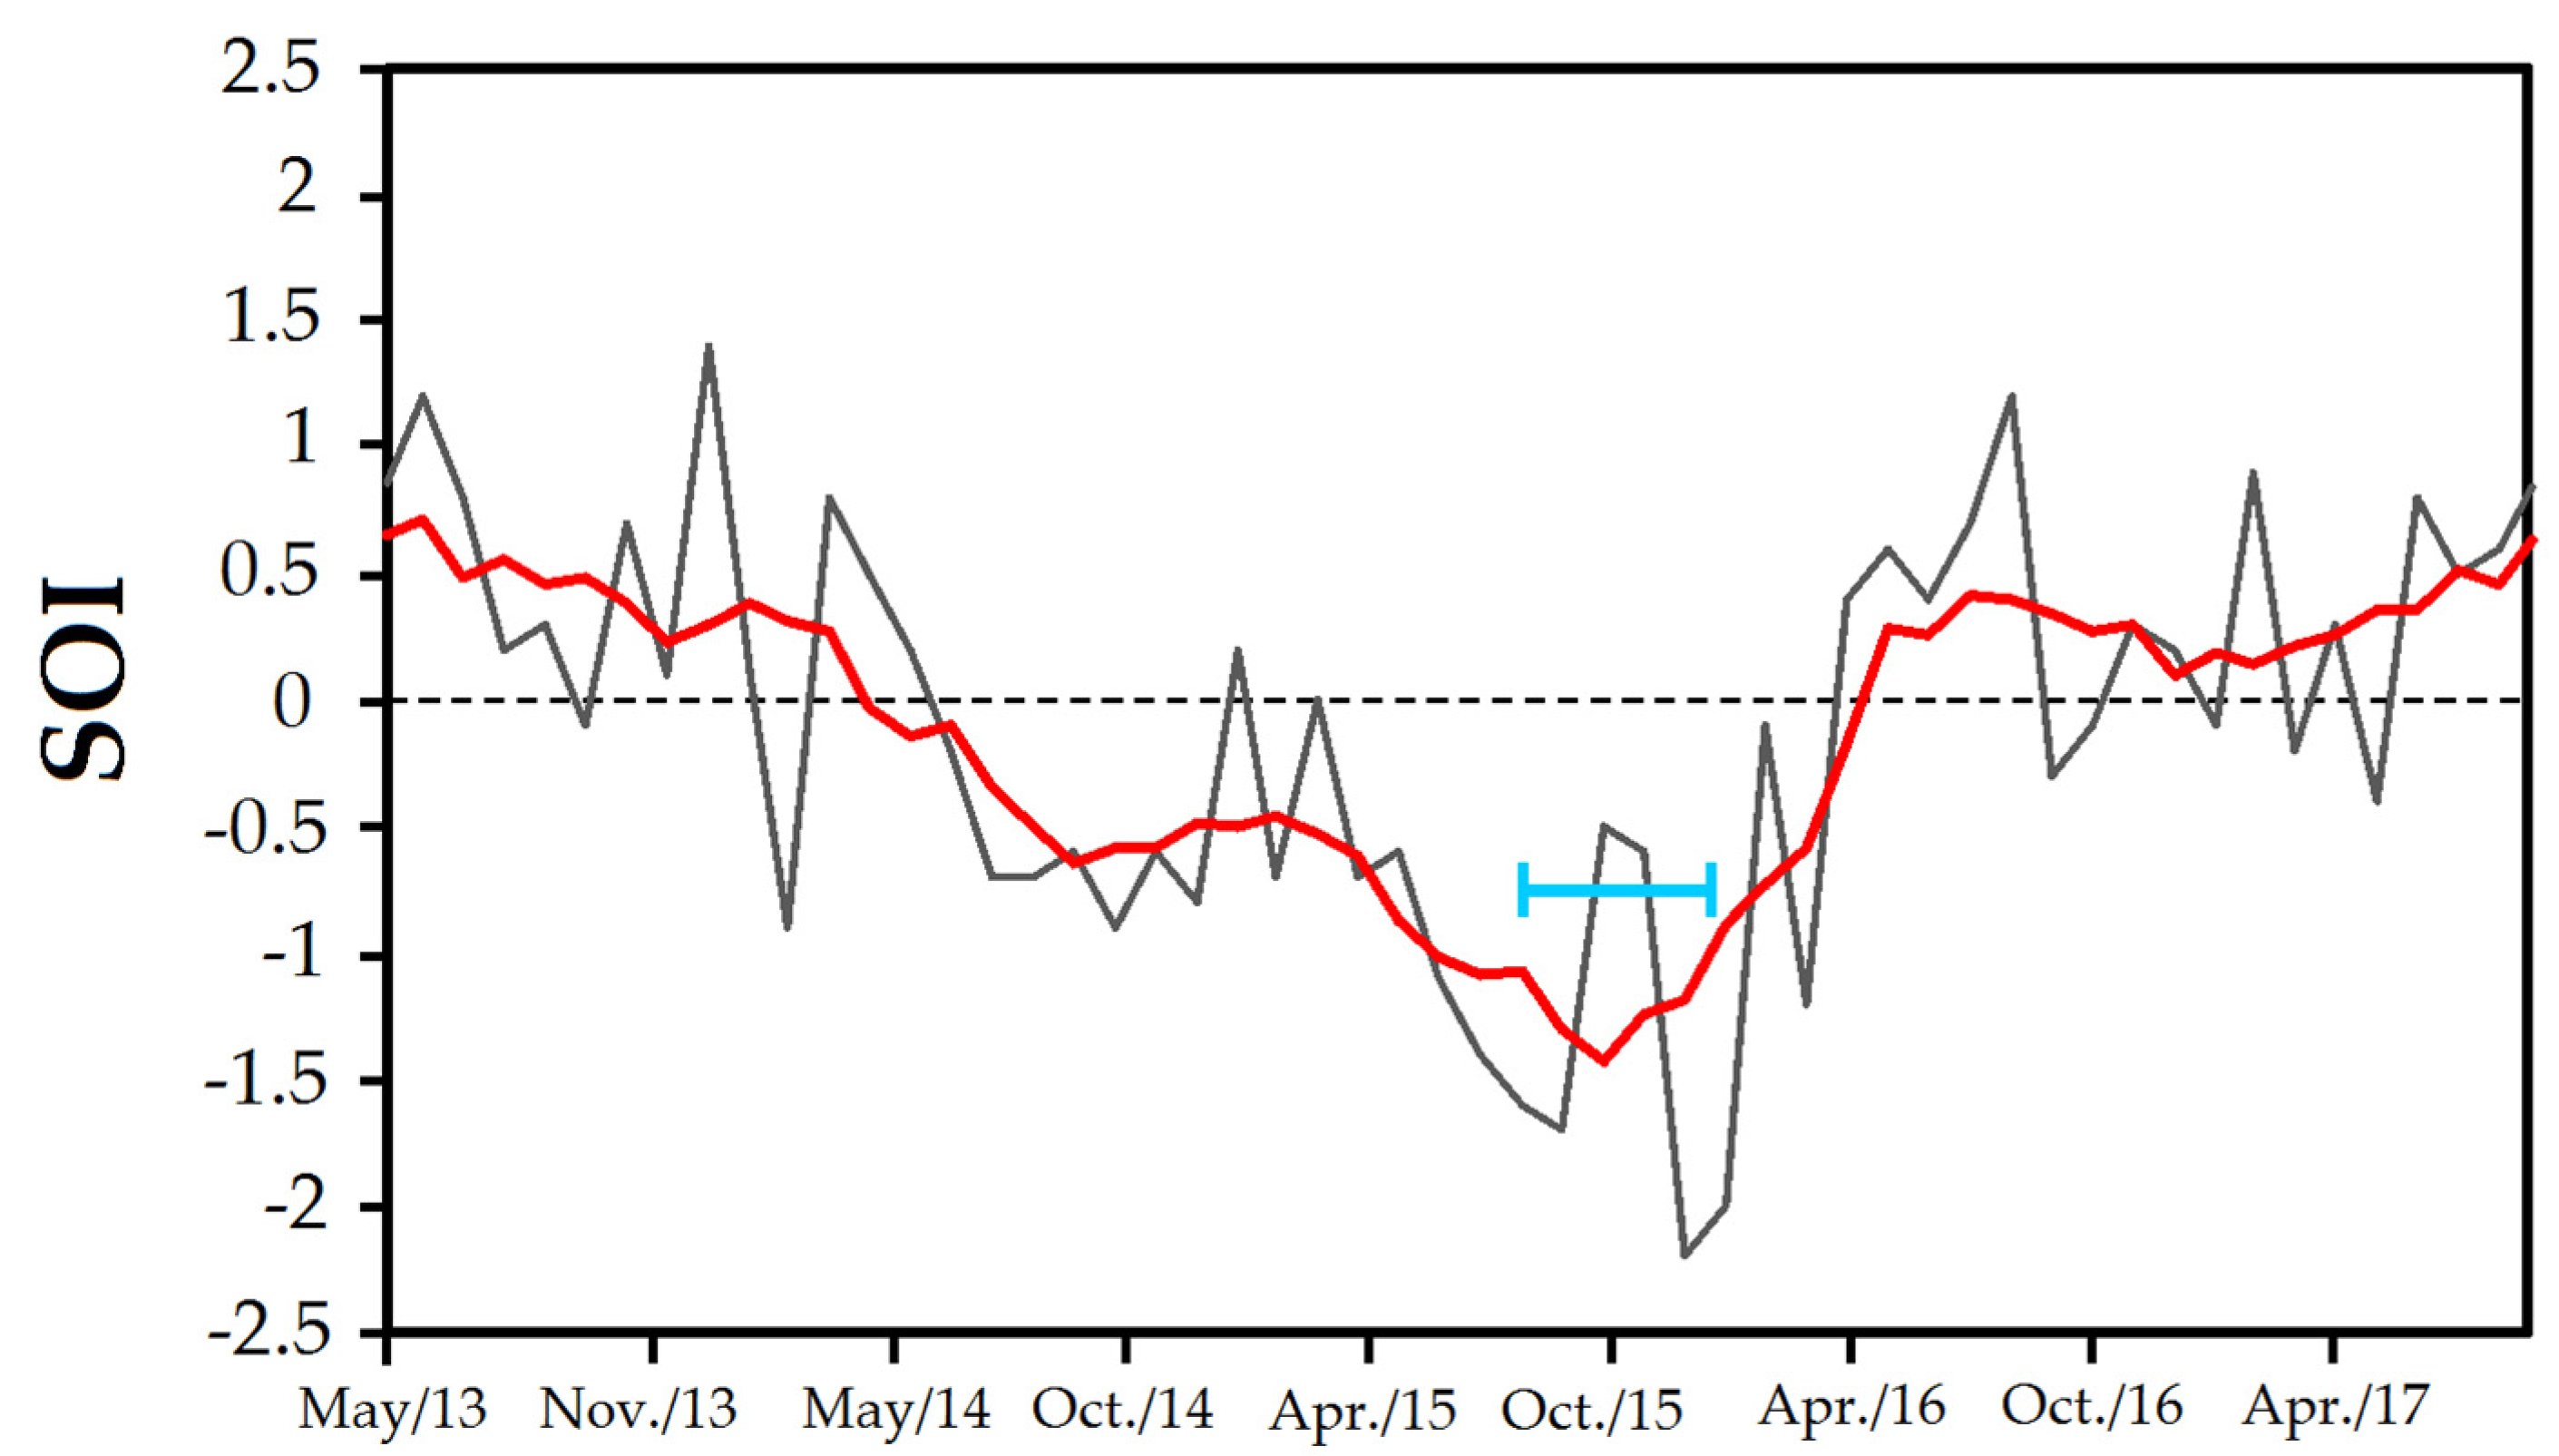
3.1. The 2015–2016 El-Niño
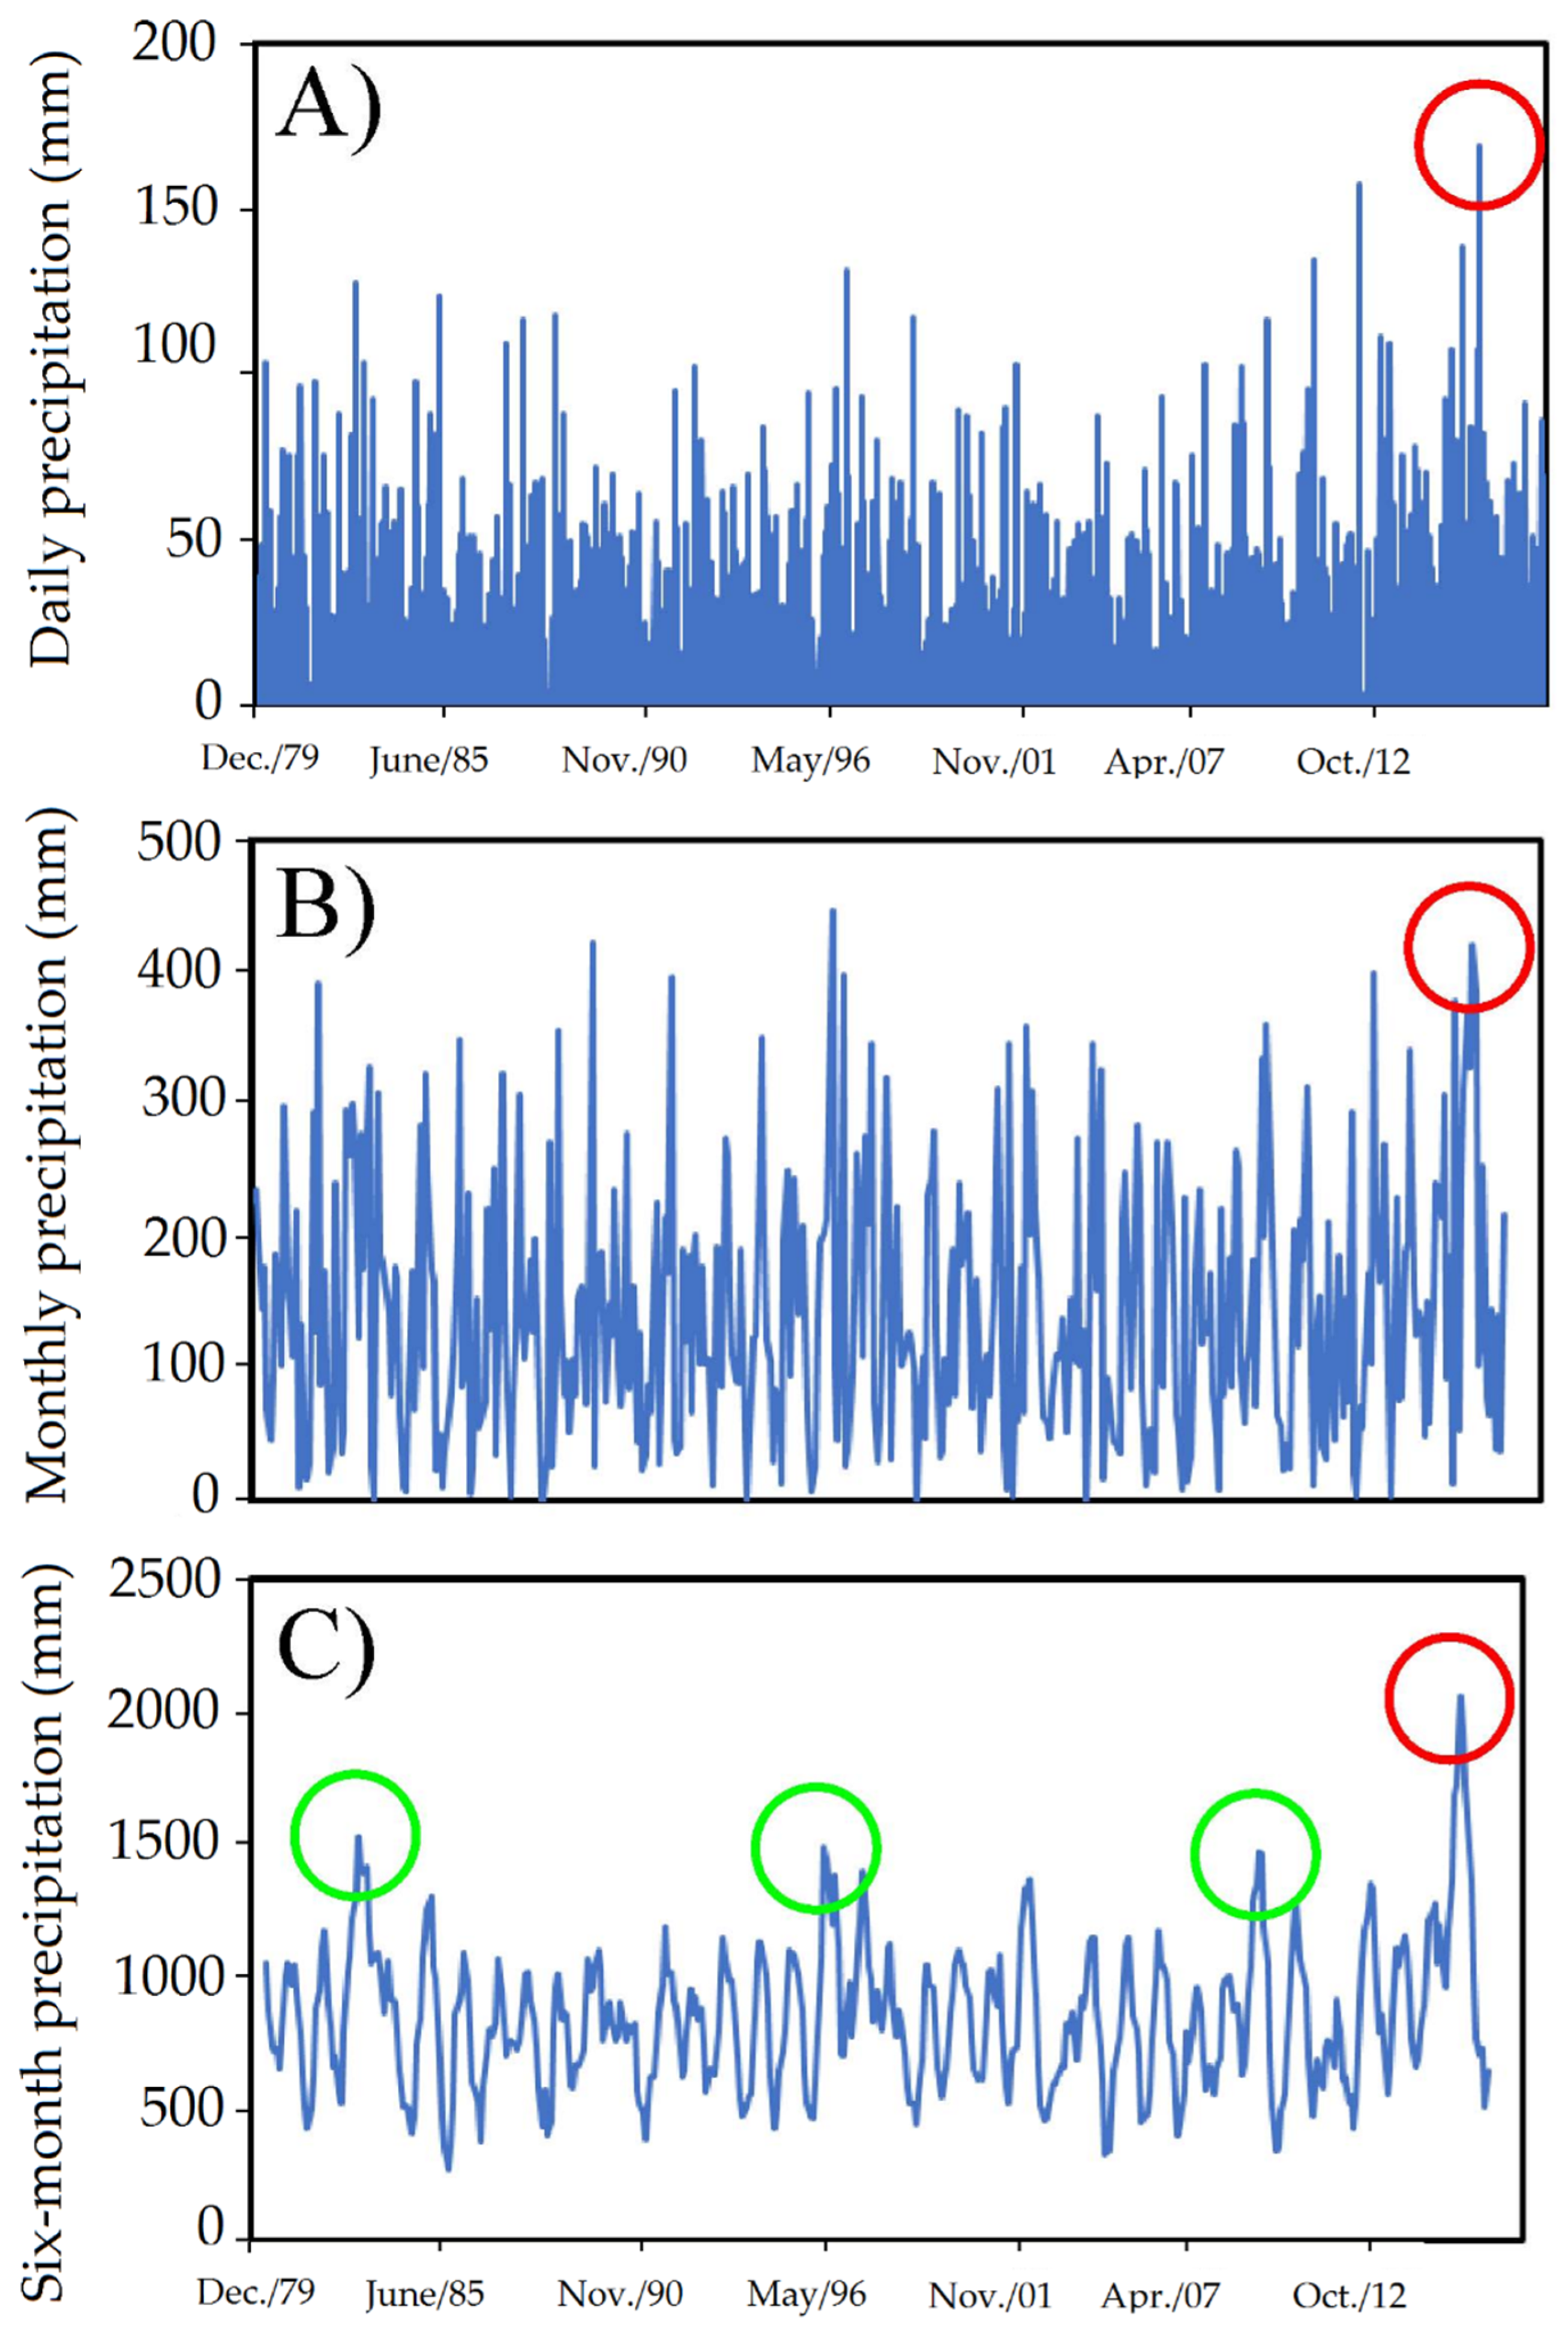
3.2. Analysis of the Rainfall Series
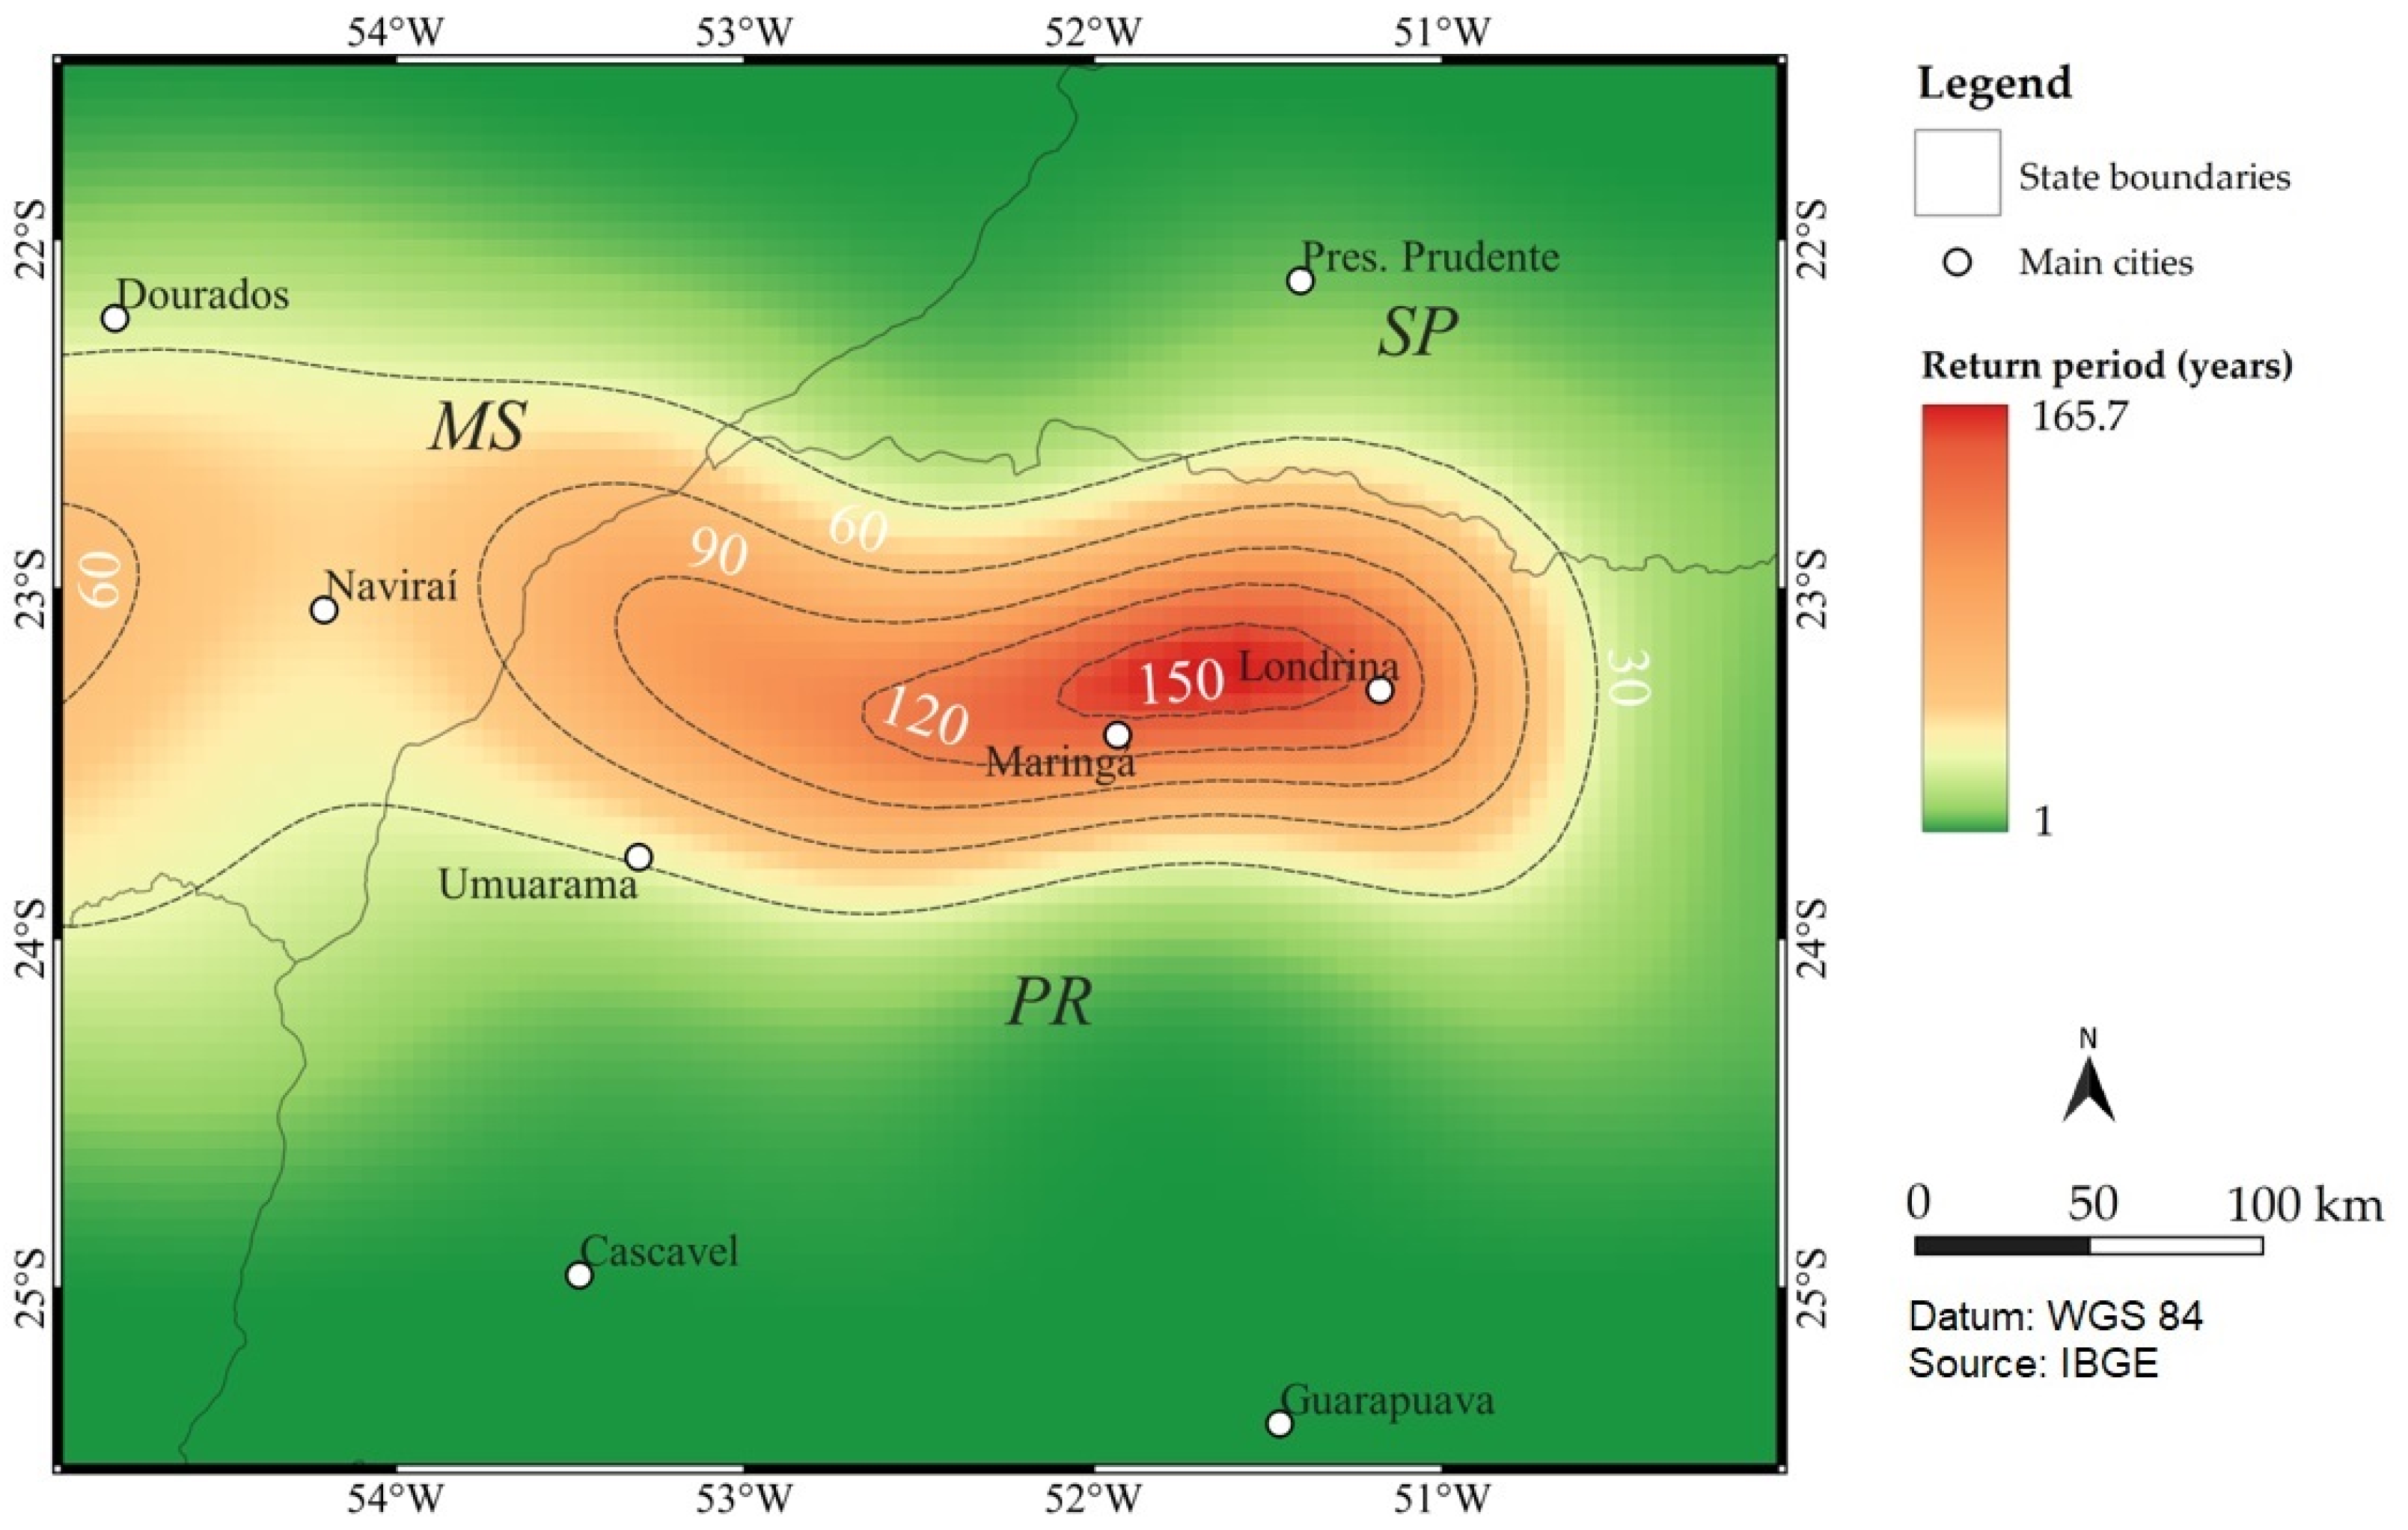
3.3. Spatial-Temporal Description of Rainfall
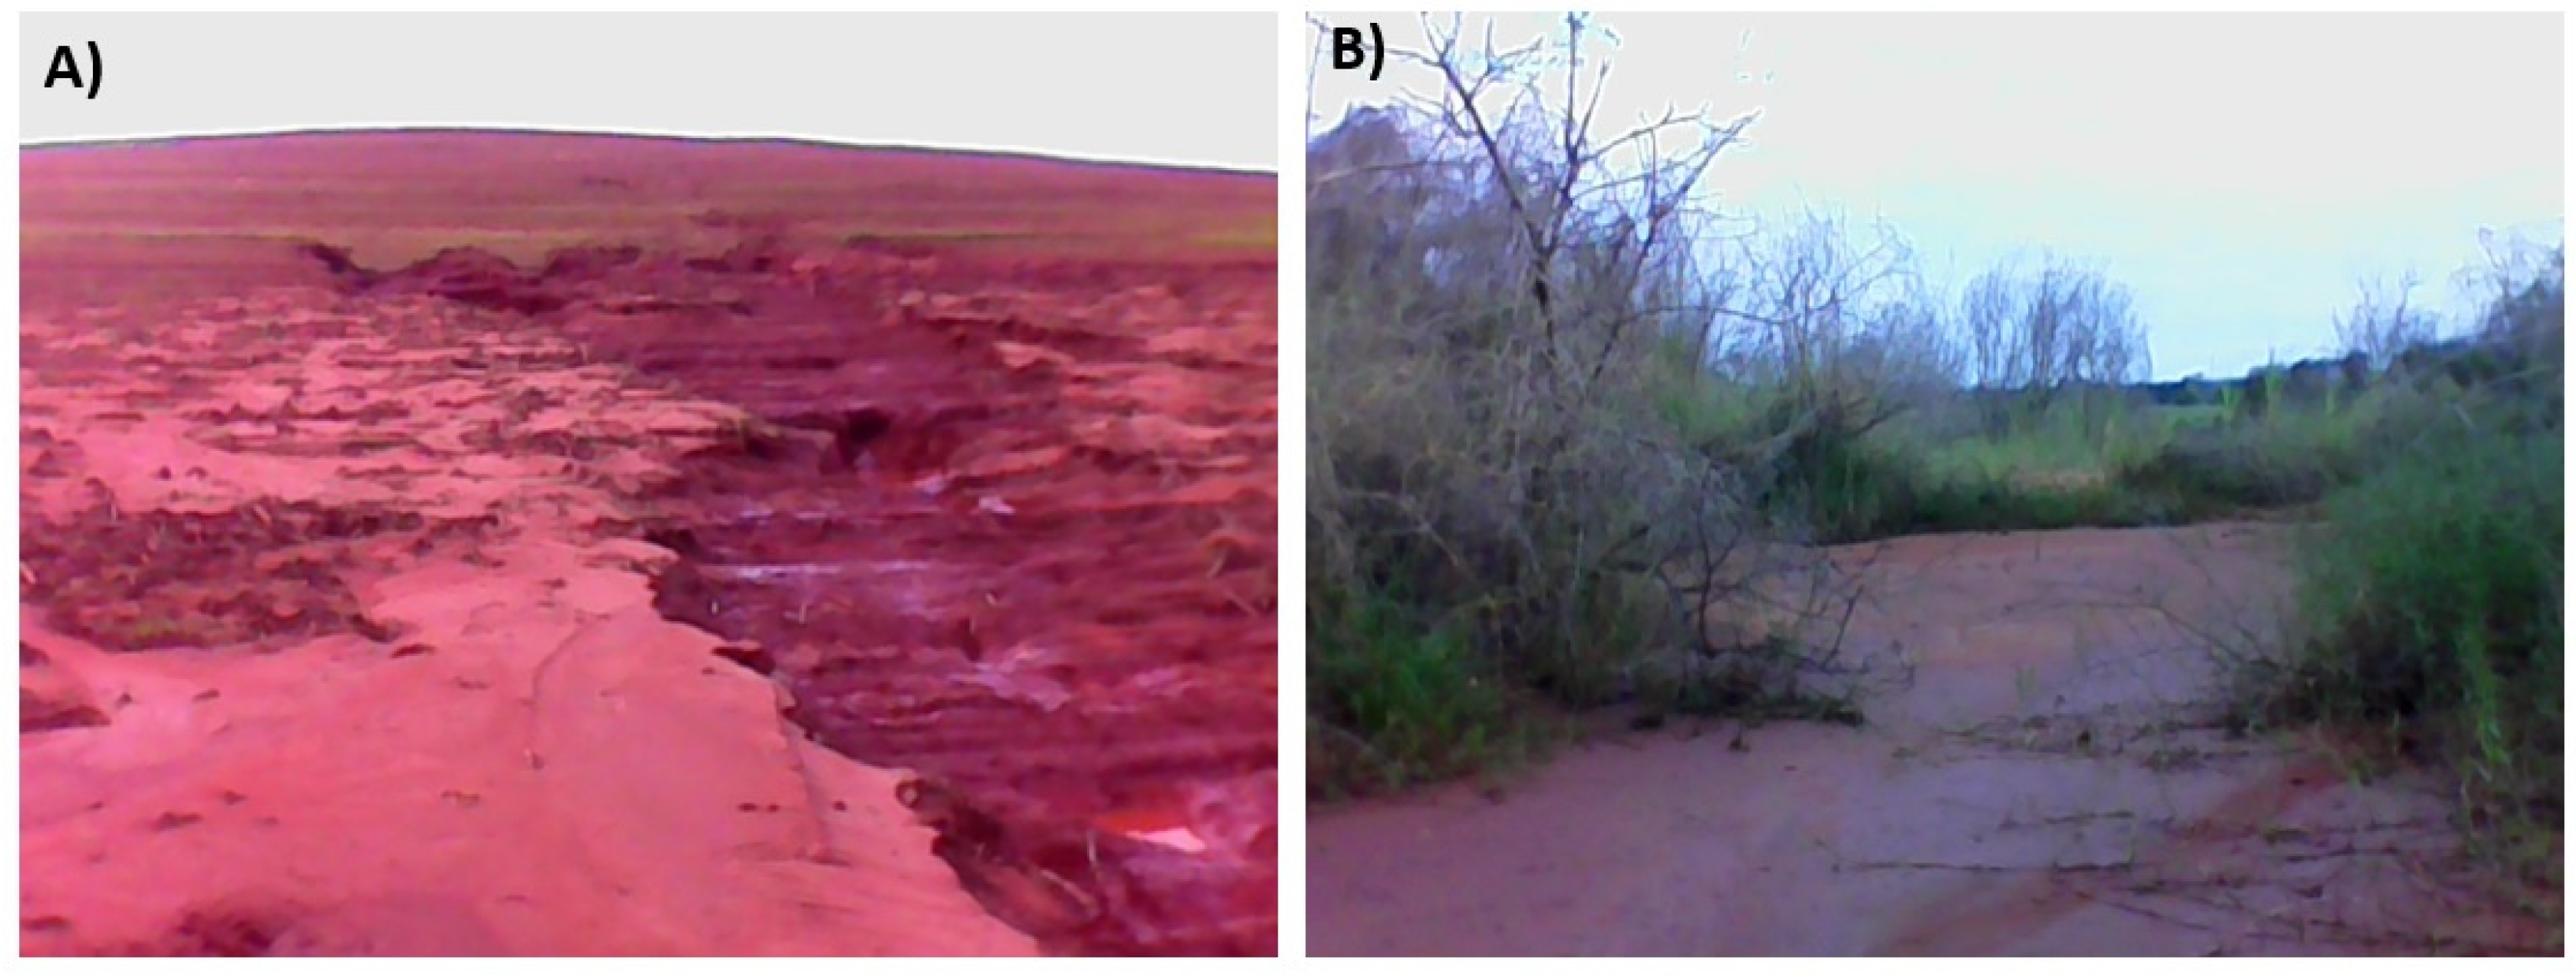
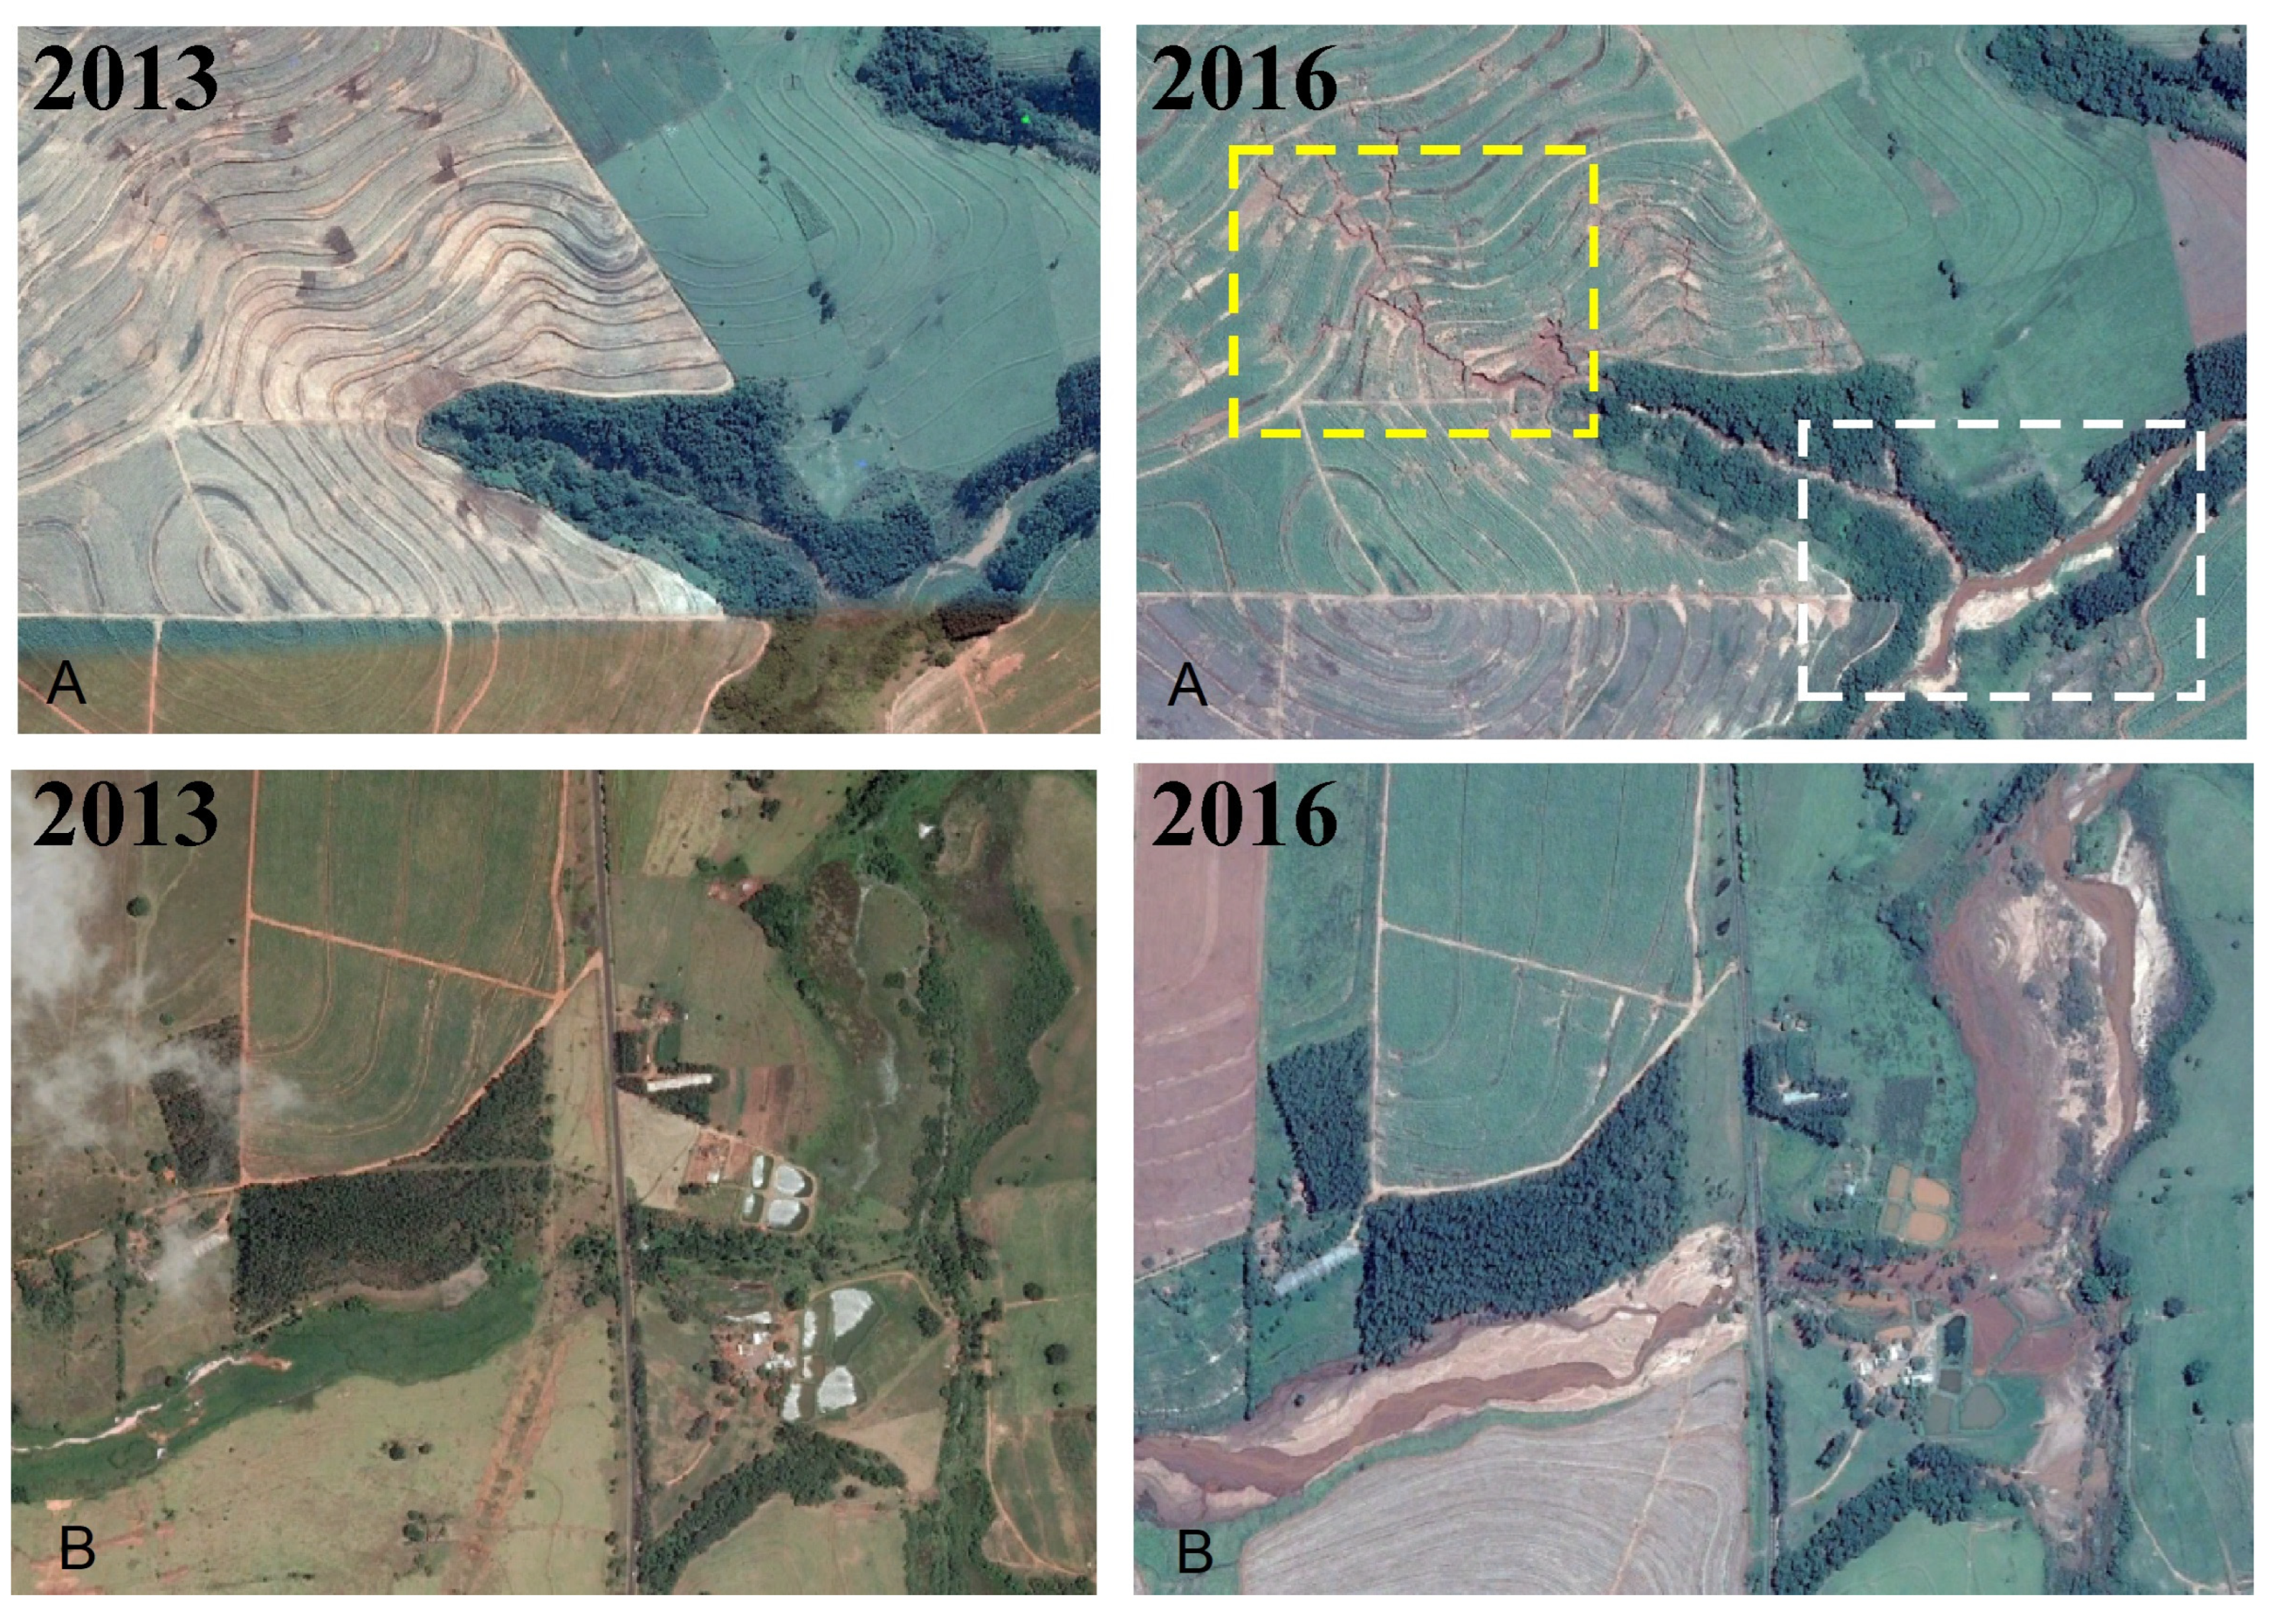
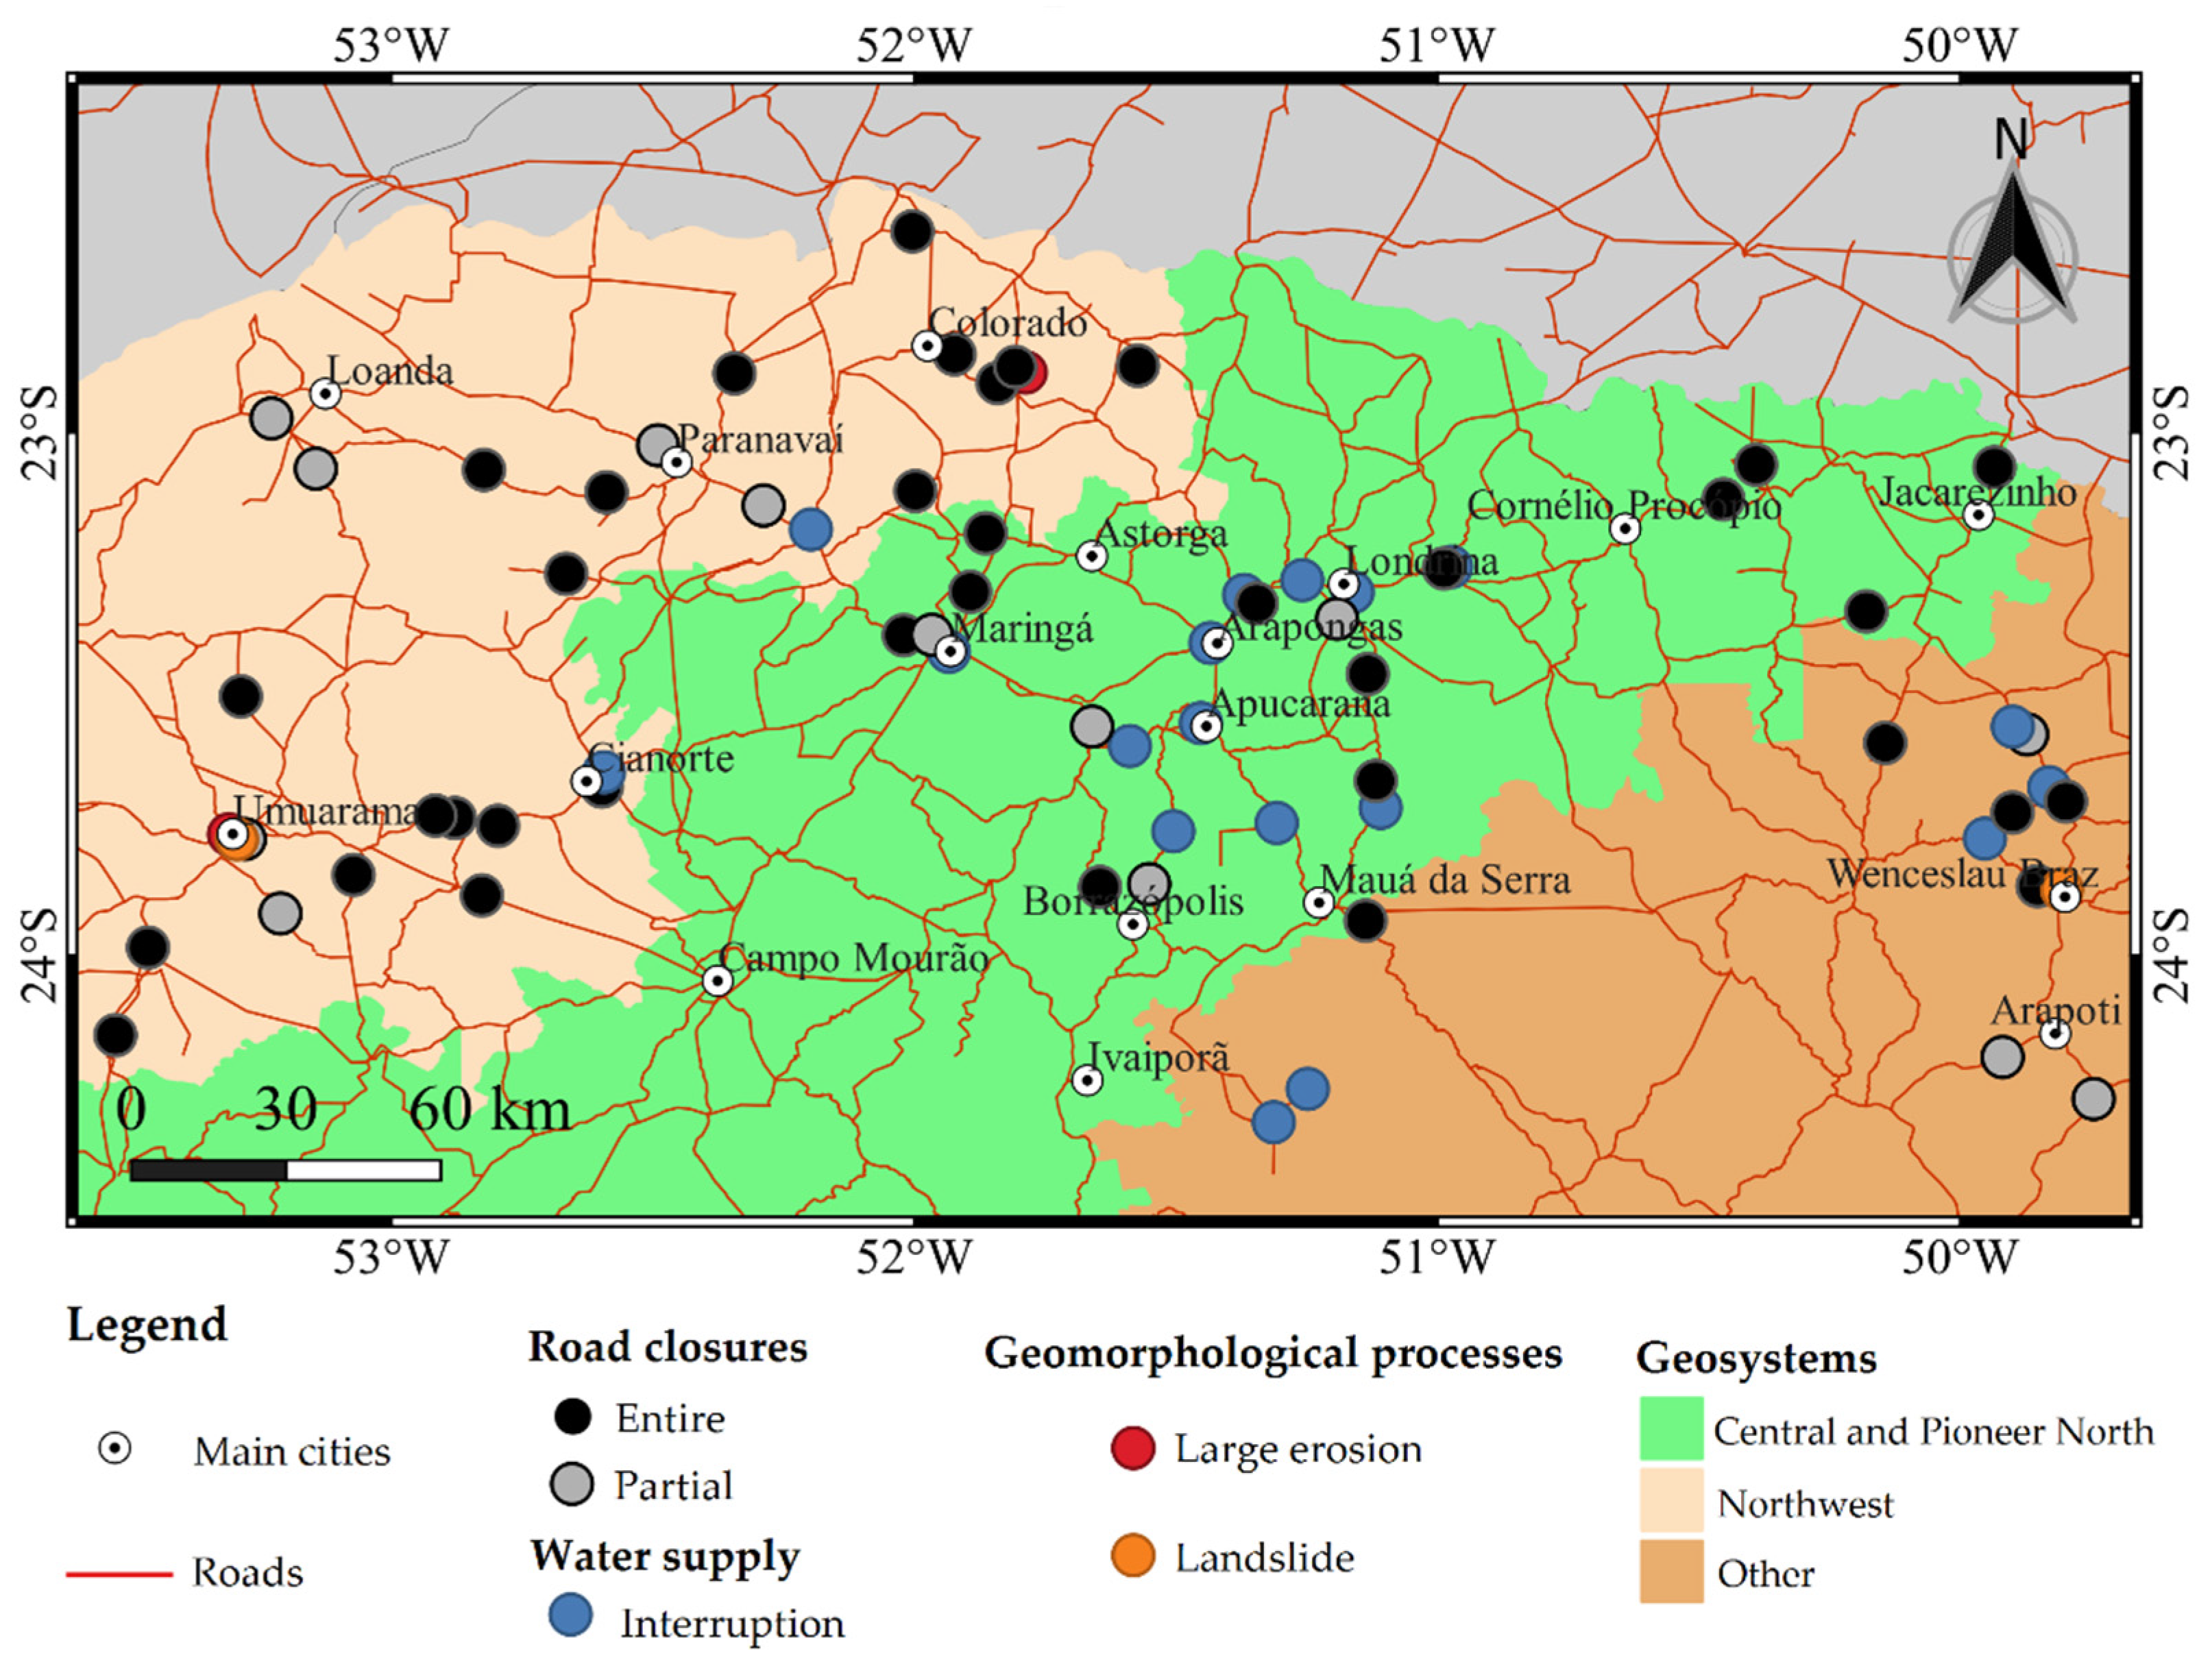
3.4. Landscape Disturbance
4. Conclusions
Author Contributions
Funding
Institutional Review Board Statement
Informed Consent Statement
Data Availability Statement
Conflicts of Interest
References
- L’Heureux, M.L.; Takahashi, K.; Watkins, A.B.; Barnston, A.G.; Becker, E.J.; Di Liberto, T.E.; Gamble, F.; Gottschalck, J.; Halpert, M.S.; Huang, B.; et al. Observing and predicting the 2015/16 El Niño. Bull. Am. Meteorol. Soc. 2017, 98, 1367–1381. [Google Scholar] [CrossRef]
- L’Heureux, M.L.; Tippett, M.K.; Takahashi, K.; Barnston, A.G.; Becker, E.J.; Bell, G.D.; Di Liberto, T.E.; Gottschalck, J.; Halpert, M.S.; Hu, Z.Z.; et al. Strength outlooks for the El Niño-Southern Oscillation. Weather Forecast. 2019, 34, 165–175. [Google Scholar] [CrossRef]
- Martínez, R.; Zambrano, E.; José Nieto, J.; Hernández, J.; Costa, F. Evolución, vulnerabilidade e impactos econômicos y sociales de El Niño 2015–2016 en América Latina. Investig. Geográficas 2017, 68, 65–78. [Google Scholar] [CrossRef]
- Pereira, H.R.; Reboita, M.S.; Ambrizzi, T. Características da Atmosfera na Primavera Austral durante o El Niño de 2015/2016. Rev. Bras. Meteorol. 2017, 32, 293–310. [Google Scholar] [CrossRef]
- Von Bertalanffy, L. General System Theory: Foundations, Development, Applications; George Braziller: New York, NY, USA, 1968. [Google Scholar]
- Christopherson, R.W. Geosystems: An Introduction to Physical Geography, 7th ed.; Prentice Hall: Hoboken, NJ, USA, 2008. [Google Scholar]
- Naylor, L.A.; Spencer, T.; Lane, S.N.; Darby, S.E.; Magilligan, F.J.; Macklin, M.G.; Möller, I. Stormy geomorphology: Geomorphic contributions in an age of climate extremes. Earth Surf. Process. Landf. 2016, 42, 166–190. [Google Scholar] [CrossRef]
- Instituto Brasileiro de Geografia e Estatística. Divisão do Brasil em Mesorregiões e Microrregiões Geográficas; IBGE: Rio de Janeiro, Brazil, 1990.
- Troppmair, H.; Galina, M.H. Geossistemas (Geosystems). Mercator 2006, 5, 79–90. [Google Scholar] [CrossRef]
- Southern Oscillation Index (SOI). Available online: https://www.ncei.noaa.gov/access/monitoring/enso/soi (accessed on 4 August 2022).
- Hidroweb v3.2.6. Available online: https://www.snirh.gov.br/hidroweb/apresentacao (accessed on 5 August 2022).
- CHIRPS: Rainfall Estimates from Rain Gauge and Satellite Observations. Available online: https://www.chc.ucsb.edu/data/chirps (accessed on 5 August 2022).
- Gstat User’s Manual. Available online: http://www.gstat.org/manual/ (accessed on 15 January 2019).
- A Language and Environment for Statistical Computing. Available online: https://www.r-project.org/ (accessed on 9 January 2019).
- Conrad, O.; Bechtel, B.; Bock, M.; Dietrich, H.; Fischer, E.; Gerlitz, L.; Wehberg, J.; Wichmann, V.; Böhner, J. System for Automated. Geoscientific Analyses (SAGA) v. 2.1.4. Geosci. Model Dev. 2015, 8, 1991–2007. [Google Scholar] [CrossRef]
- Grimm, A.M. Variabilidade climática interanual. In Clima das Regiões Brasileiras e Variabilidade Climática; Cavalcanti, I.F.A., Ferreira, N.J., Eds.; Oficina de Textos: São Paulo, Brazil, 2021; pp. 96–113. [Google Scholar]
- Episódios de El Niño/Oscilação Sul Durante a Década de 1986 a 1996 e Suas Influências No Brasil. Available online: http://climanalise.cptec.inpe.br/~rclimanl/boletim/cliesp10a/nino.html (accessed on 14 August 2022).
- Santos, M.V.; Morais, E.S.; Montanher, O.C.; Fragal, E.H.; Gasparetto, N.L. Fatores desencadeadores e predição de processos erosivos em uma bacia hidrográfica de segunda ordem no noroeste do Paraná. In Proceedings of the 13° Simpósio Nacional de Geomorfologia, Juiz de Fora, Brazil, 15 November 2021. [Google Scholar]
- Cotecchia, F.; Pedone, G.; Bottiglieri, O.; Santaloia, F.; Vitone, C. Slope-atmosphere interaction in a tectonized clayey slope: A case study. Ital. Geotech. J. 2014, 1, 34–61. [Google Scholar]
- Cotecchia, F.; Tagarelli, V.; Pedone, G.; Ruggieri, G.; Guglieimi, S.; Santaloia, F. Analysis of climate-driven processes in clayey slopes for early warning system design. Geotech. Eng. 2019, 172, 465–480. [Google Scholar] [CrossRef]
- Tagarelli, V.; Cotecchia, F. Deep movements in clayey slopes relating to climate: Modeling for early warning system design. In Proceedings of the Geotechnical Research for Land Protection and Development, Lecco, Italy, 3–5 July 2019. [Google Scholar]
- Saunders, K.; Stephenson, A.; Taylor, P.G.; Karoly, D. The spatial distribution of rainfall extremes and the influence of El Niño Southern Oscillation. Weather Clim. Extrem. 2017, 18, 17–28. [Google Scholar] [CrossRef]
- Wainwright, J.; Turnbull, L.; Ibrahim, T.G.; Lexartza-Artza, I.; Thornton, S.F.; Brazier, R.E. Linking environmental regimes, space and time: Interpretations of structural and functional connectivity. Geomorphology 2011, 126, 387–404. [Google Scholar] [CrossRef]
- Heckmann, T.; Cavalli, M.; Cerdan, O.; Foerster, S.; Javaux, M.; Lode, E.; Smetanová, A.; Vericat, D.; Brardinoni, F. Indices of sediment connectivity: Opportunities, challenges and limitations. Earth Sci. Rev. 2018, 187, 77–108. [Google Scholar] [CrossRef]
- Zanandrea, F.; Paul, L.; Michel, G.; Kobiyama, M.; Zanini, A.; Abatti, B. Conectividade dos sedimentos: Conceitos, princípios e aplicações. Rev. Bras. Geomorfol. 2020, 21, 435–459. [Google Scholar] [CrossRef]
- Brierley, G.; Fryirs, K.; Jain, V. Landscape Connectivity: The Geographic Basis of Geomorphic Applications. Area 2006, 38, 165–174. Available online: https://www.jstor.org/stable/20004523 (accessed on 1 September 2022). [CrossRef]
- Abastecimento é Suspenso, e 85% da População de Maringá Fica Sem Água. Available online: https://g1.globo.com/pr/norte-noroeste/noticia/2016/01/abastecimento-e-suspenso-e-85-da-populacao-de-maringa-fica-sem-agua.html#:~:text=Cerca%20de%20350%20mil%20moradores,Rio%20Pirap%C3%B3%20subir%20oito%20metros (accessed on 8 August 2022).
- Histórico de Paradas. Available online: https://site.sanepar.com.br/historico-paradas-programadas?field__dt_dm_value%5Bvalue%5D%5Byear%5D=2016&field__dt_dm_value%5Bvalue%5D%5Bmonth%5D=1 (accessed on 8 August 2022).
- Prefeitura de Londrina Decreta Situação de Emergência Após Chuvas. Available online: https://g1.globo.com/pr/norte-noroeste/noticia/2016/01/prefeitura-de-londrina-decreta-situacao-de-emergencia-apos-chuvas.html (accessed on 8 August 2022).
- Sobe Para Seis Número de Bloqueios em Estradas no Paraná. Available online: https://www.gazetadopovo.com.br/vida-e-cidadania/sobe-para-seis-numero-de-bloqueios-em-estradas-no-parana4jq9ekyb1c6b1t3k1b5edtdfr/ (accessed on 9 August 2022).
- Adger, N.W. Social and ecological resilience: Are they related? Prog. Hum. Geogr. 2000, 24, 347–364. [Google Scholar] [CrossRef]
- Montanher, O.C. Ciclos de erosão e sedimentação em bacias hidrográficas urbanas do noroeste paranaense e suas implicações no ajuste de sistemas fluviais. Rev. Bras. Geomorfol. 2013, 14, 319–325. [Google Scholar] [CrossRef]
- Souza, C.A.; Reboita, M.S. Ferramenta para o monitoramento dos padrões de teleconexão na América do Sul. Terra Didat. 2021, 17, e021009. [Google Scholar] [CrossRef]
- French, A.; Mechler, R.; Arestegui, M.; MacClune, K.; Cisneros, A. Root causes of recurrent catastrophe: The political ecology of El Niño-related disasters in Peru. Int. J. Disaster Risk Reduct. 2020, 47, 101539. [Google Scholar] [CrossRef]
- Alcántara-Ayala, I. Geomorphology, natural hazards, vulnerability and prevention of natural disasters in developing countries. Geomorphology 2002, 47, 107–124. [Google Scholar] [CrossRef]
- Collins, J.M.; Klotzbach, P.J.; Maue, R.N.; Roache, D.R.; Blake, E.S.; Paxton, C.H.; Mehta, C.A. The record-breaking 2015 hurricane season in the eastern North Pacific: An analysis of environmental conditions. Geophys. Res. Lett. 2016, 43, 9217–9224. [Google Scholar] [CrossRef]
- Paek, H.; Yu, J.-Y.; Qian, C. Why were the 2015/2016 and 1997/1998 extreme El Niños different? Geophys. Res. Lett. 2017, 44, 1848–1856. [Google Scholar] [CrossRef]
- Kolusu, S.; Shamsudduha, M.; Todd, M.; Taylor, R.; Seddon, D.; Kashaigili, J.; Ebrahim, G.; Cuthbert, M.; Sorensen, J.; Villholth, K.; et al. The El Niño event of 2015–2016: Climate anomalies and their impact on groundwater resources in East and Southern Africa. Hydrol. Earth Syst. Sci. 2019, 23, 1751–1762. [Google Scholar] [CrossRef]
- Cai, W.; McPhaden, M.J.; Grimm, A.M.; Rodrigues, R.R.; Taschetto, A.S.; Garreaud, R.D.; Dewitte, B.; Poveda, G.; Ham, Y.-G.; Santoso, A.; et al. Climate impacts of the El Niño–Southern Oscillation on South America. Nat. Rev. Earth Environ. 2020, 1, 215–231. [Google Scholar] [CrossRef]


| Municipality/ Federative Unit | Institution Responsible | Code | Longitude | Latitude | Altitude (m) |
|---|---|---|---|---|---|
| Maringá/PR | INMET | 83767 | −51.932 | −23.405 | 549 |
| Colorado/PR | IAT | 2251033 | −51.89 | −22.9 | 490 |
| Umuarama/PR | IAPAR | 2353008 | −53.28 | −23.73 | 400 |
| Jardim Olinda/PR | IAT | 2252013 | −52.04 | −22.55 | 260 |
| Campo Mourão/PR | INMET | 83783 | −52.36 | −24.05 | 616.4 |
| Londrina/PR | INMET and IAPAR | 83766 and 2351003 | −51.13 | −23.31 | 566 |
| Ivaí/PR | INMET and IAT | 83811 and 2550006 | −50.86 | −25 | 808 |
| Arapongas/PR | IAT | 2351048 | −51.43 | −23.4 | 810 |
| Uraí/PR | IAT | 2350023 | −50.8 | −23.21 | 440 |
| Paranavaí/PR | IAT | 2252027 | −52.53 | −22.88 | 510 |
| Paranavaí/PR | IAT | 2252017 | −52.52 | −22.65 | 345 |
| Diamante do Norte/PR | IAT | 2252015 | −52.86 | −22.65 | 340 |
| Porto Rico/PR | IAT | 2253002 | −53.27 | −22.77 | 250 |
| Naviraí/MS | ANA | 2354000 | −54.19 | −23.06 | 345 |
| Cascavel/PR | IAT | 2453056 | −53.24 | −24.96 | 680 |
| Municipality/ Federative Unit | Code | Accumulated Rainfall (September 2015–February 2016) (mm) | RP (Years) |
|---|---|---|---|
| Maringá/PR | 83767 | 2049.4 | 178.38 |
| Londrina/PR | 83766 and 2351003 | 2092.1 | 148.31 |
| Colorado/PR | 2251033 | 1767.7 | 106.6 |
| Arapongas/PR | 2351048 | 1957 | 103.9 |
| Porto Rico/PR | 2253002 | 1445 | 70.8 |
| Paranavaí/PR | 2252027 | 1573.7 | 43.69 |
| Naviraí/MS | 2354000 | 1725.5 | 43.68 |
| Umuarama/PR | 2353008 | 1712.3 | 41.56 |
| Diamante do Norte/PR | 2252015 | 1527.5 | 39.33 |
Disclaimer/Publisher’s Note: The statements, opinions and data contained in all publications are solely those of the individual author(s) and contributor(s) and not of MDPI and/or the editor(s). MDPI and/or the editor(s) disclaim responsibility for any injury to people or property resulting from any ideas, methods, instructions or products referred to in the content. |
© 2023 by the authors. Licensee MDPI, Basel, Switzerland. This article is an open access article distributed under the terms and conditions of the Creative Commons Attribution (CC BY) license (https://creativecommons.org/licenses/by/4.0/).
Share and Cite
Montanher, O.C.; Minaki, C.; de Morais, E.S.; de Paula Silva, J.; Pereira, P. Geosystemic Impacts of the Extreme Rainfall Linked to the El Niño 2015/2016 Event in Northern Paraná, Brazil. Appl. Sci. 2023, 13, 9678. https://doi.org/10.3390/app13179678
Montanher OC, Minaki C, de Morais ES, de Paula Silva J, Pereira P. Geosystemic Impacts of the Extreme Rainfall Linked to the El Niño 2015/2016 Event in Northern Paraná, Brazil. Applied Sciences. 2023; 13(17):9678. https://doi.org/10.3390/app13179678
Chicago/Turabian StyleMontanher, Otávio Cristiano, Cíntia Minaki, Eduardo Souza de Morais, Juliana de Paula Silva, and Paulo Pereira. 2023. "Geosystemic Impacts of the Extreme Rainfall Linked to the El Niño 2015/2016 Event in Northern Paraná, Brazil" Applied Sciences 13, no. 17: 9678. https://doi.org/10.3390/app13179678
APA StyleMontanher, O. C., Minaki, C., de Morais, E. S., de Paula Silva, J., & Pereira, P. (2023). Geosystemic Impacts of the Extreme Rainfall Linked to the El Niño 2015/2016 Event in Northern Paraná, Brazil. Applied Sciences, 13(17), 9678. https://doi.org/10.3390/app13179678